Article

An Available-to-Implement Thermal Facility for Dynamic Bleed Air Test of Aircraft Environmental Control System

1
School of Aeronautic Science and Engineering, Beihang University, Xueyuan Road No. 37, Beijing 100191, China
2
The First Aircraft Institute, East Renmin Road No. 1, Xi’an 710089, China
*
Authors to whom correspondence should be addressed.
These authors contributed equally to this work.
Aerospace 2022, 9(10), 584; https://doi.org/10.3390/aerospace9100584
Submission received: 30 August 2022 / Revised: 25 September 2022 / Accepted: 27 September 2022 / Published: 8 October 2022

Abstract

:
As a critical system of onboard aircraft equipment, the environmental control system (ECS) has an essential impact on flight safety. The performance of the ECS is usually tested using the thermal test facility. The facility comprises temperature and pressure simulation units to simulate the engine bleed air. Currently, the ECS often fails due to the dynamic and rapid changes in the temperature and pressure of bleed air. To achieve the dynamic bleed air simulation, the most critical problem is to simulate the bleed air’s rapid heating and boost process during the actual engine working process. However, the temperature simulation unit has the characteristics of nonlinear and large inertia. Moreover, temperature and pressure control are strongly coupled. These characteristics usually lead to temperature and pressure dynamic control failure. This paper introduces a novel facility that adopted the hot and cold blending method to realize the rapid response of the temperature. Furthermore, it used a particular system structure to reduce pressure and temperature control coupling. In addition, it adopted the lookup-table-based PID (LPID) controller to acquire the rapid response and good steady-state performance of temperature and pressure control. Experimental control results are presented and discussed. The results showed that the facility could meet ECS’s dynamic and steady-state test requirements. The novel facility makes up for the insufficient dynamic test capacity of the previously developed ECS test facilities.

1. Introduction

Bleed air is compressed air taken from the compressor stage of a gas turbine engine, up-stream of its fuel burning sections. This airflow is supplied to the Environmental Control System (ECS) through the bleed air system. On jet aircraft, the primary functions of the ECS include cabin air conditioning [1], ice protection [2], and avionics equipment cooling [3]. Generally, the bleed air system is considered a part of the ECS [4]. As a critical system of onboard aircraft equipment, the ECS has an essential impact on flight safety. The failure of the ECS will often cause serious flight accidents and endanger the life and safety of the occupants. A significant proportion of aircraft downtime can be attributed to ECS issues [5], and the bleed air components may fail to function normally when operating in extreme conditions [6]. Moreover, aircraft icing is a fundamental cause of flight accidents [7,8]. Therefore, the performance testing of ECS and its parts is essential. Additionally, with the rapid development of aviation, the overall design requirements of large-scale delivery, long-range, and low fuel consumption have led to improved aircraft performance. As a result, high-quality requirements of the cabin environment and ever-increasing onboard electronics make the heating power on the machine ever-increasing, leading to the higher demand for bleed air, thereby reducing engine performance and increasing fuel consumption and aerodynamic drag [9]. To increase engine performance and efficiency, bleed air and ram air used must be optimized [10,11]. Due to the reasons mentioned above, we must continuously optimize and test the performance of ECS. Typically, the approaches for ECS research include software simulations [12,13,14] and experiments [15,16,17].
Software modeling simulations are well documented; those studies provide helpful guidance for the design and optimization of ECS but are not well validated due to the limitations of software simulation. Experimental tests should be conducted to demonstrate the safe and proper operation of the ECS and parts during steady-state and transient periods [18]. There are two standard experimental tests: one is to simulate engine bleed air with the ground test facilities; the other is the flight test. However, the flight test is an expensive and time-consuming process due to the requirements of aircraft recertification for onboard test equipment and difficulties associated with full-scale aircraft operation. Moreover, compared with flight tests, the ground test facilities can perform the ECS tests unconstrained by the engine and aircraft development to speed up the development process of the ECS. Therefore, the ground test facilities are mainly used to assess ECS’s performance and operational reliability. The facilities simulate the test condition of the engine bleed air, cabin air supply, and ram air on the ground by controlling compressed air flow, temperature, pressure, and humidity.
In practical situations, aircraft ECS often fail due to the dynamic and rapid changes in the temperature and pressure of the engine bleed air [19]. However, the ground test facilities are mainly used to check the principle and steady-state performance of the ECS, and its application for dynamic performance tests is rarely reported. Zheng Dai and Yi Cui [20] proposed a hot and cold blending method to achieve the rapid temperature adjustment of the thermal test facility, which was verified to be effective by Yi Cui [21] with Simulink simulation. However, the work only stays in theoretical simulation. Jian Wang et al. [22] proposed a comprehensive control method based on humanoid intelligence to solve the problems such as the slow heating rate in the current aircraft engine bleed air simulation test facility. However, the dynamic test results are lacking in his work. Peter Hodal et al. [23] developed three temperature control strategies to minimize the use of bleed air under the condition of rapid temperature response. However, the temperature control range in the research is small. No relevant data shows that the thermal test facility has realized the rapid and dynamic simulation of engine bleed air. It is still facing considerable challenges to simulate the bleed air’s rapid heating and boost process during the actual engine working process in the thermal test facility. Developing a thermal test facility for the dynamic test of ECS has remained a significant challenge.
This study aimed to fill the inadequacy of the thermal test facility’s dynamic capability for ECS. By analyzing the technical problems of dynamic bleed air simulation, the critical problems are: the requirements of rapid boost and heating, the coupling of pressure and temperature control, and taking into account fast response and good steady-state performance in the temperature and pressure control.
Generally, the temperature simulation unit has a wide temperature range, nonlinear and large inertia characteristics. Moreover, temperature and pressure control are strongly coupled. This paper adopted the hot and cold blending method to realize the rapid response of the temperature. This paper reduced the pressure and temperature control coupling through a unique system structure. Moreover, the facility adopts heat exchangers for indirect heating to prevent the heater from producing dry fir in the heating process. The indirect heating prevents the electric heater from working under high pressure, facilitating the engineering realization of electric heaters. In addition, this paper adopted the lookup-table-based PID (LPID) controller to acquire a fast response and good steady-state performance of temperature and pressure control. The LPID controller can ensure fast response and good steady-state performance and reduce the overshoot and oscillation in temperature and pressure control. In this work, a novel thermal test facility to make up for the insufficient dynamic test capacity of the previously developed ECS test facilities is available.

2. Methodology

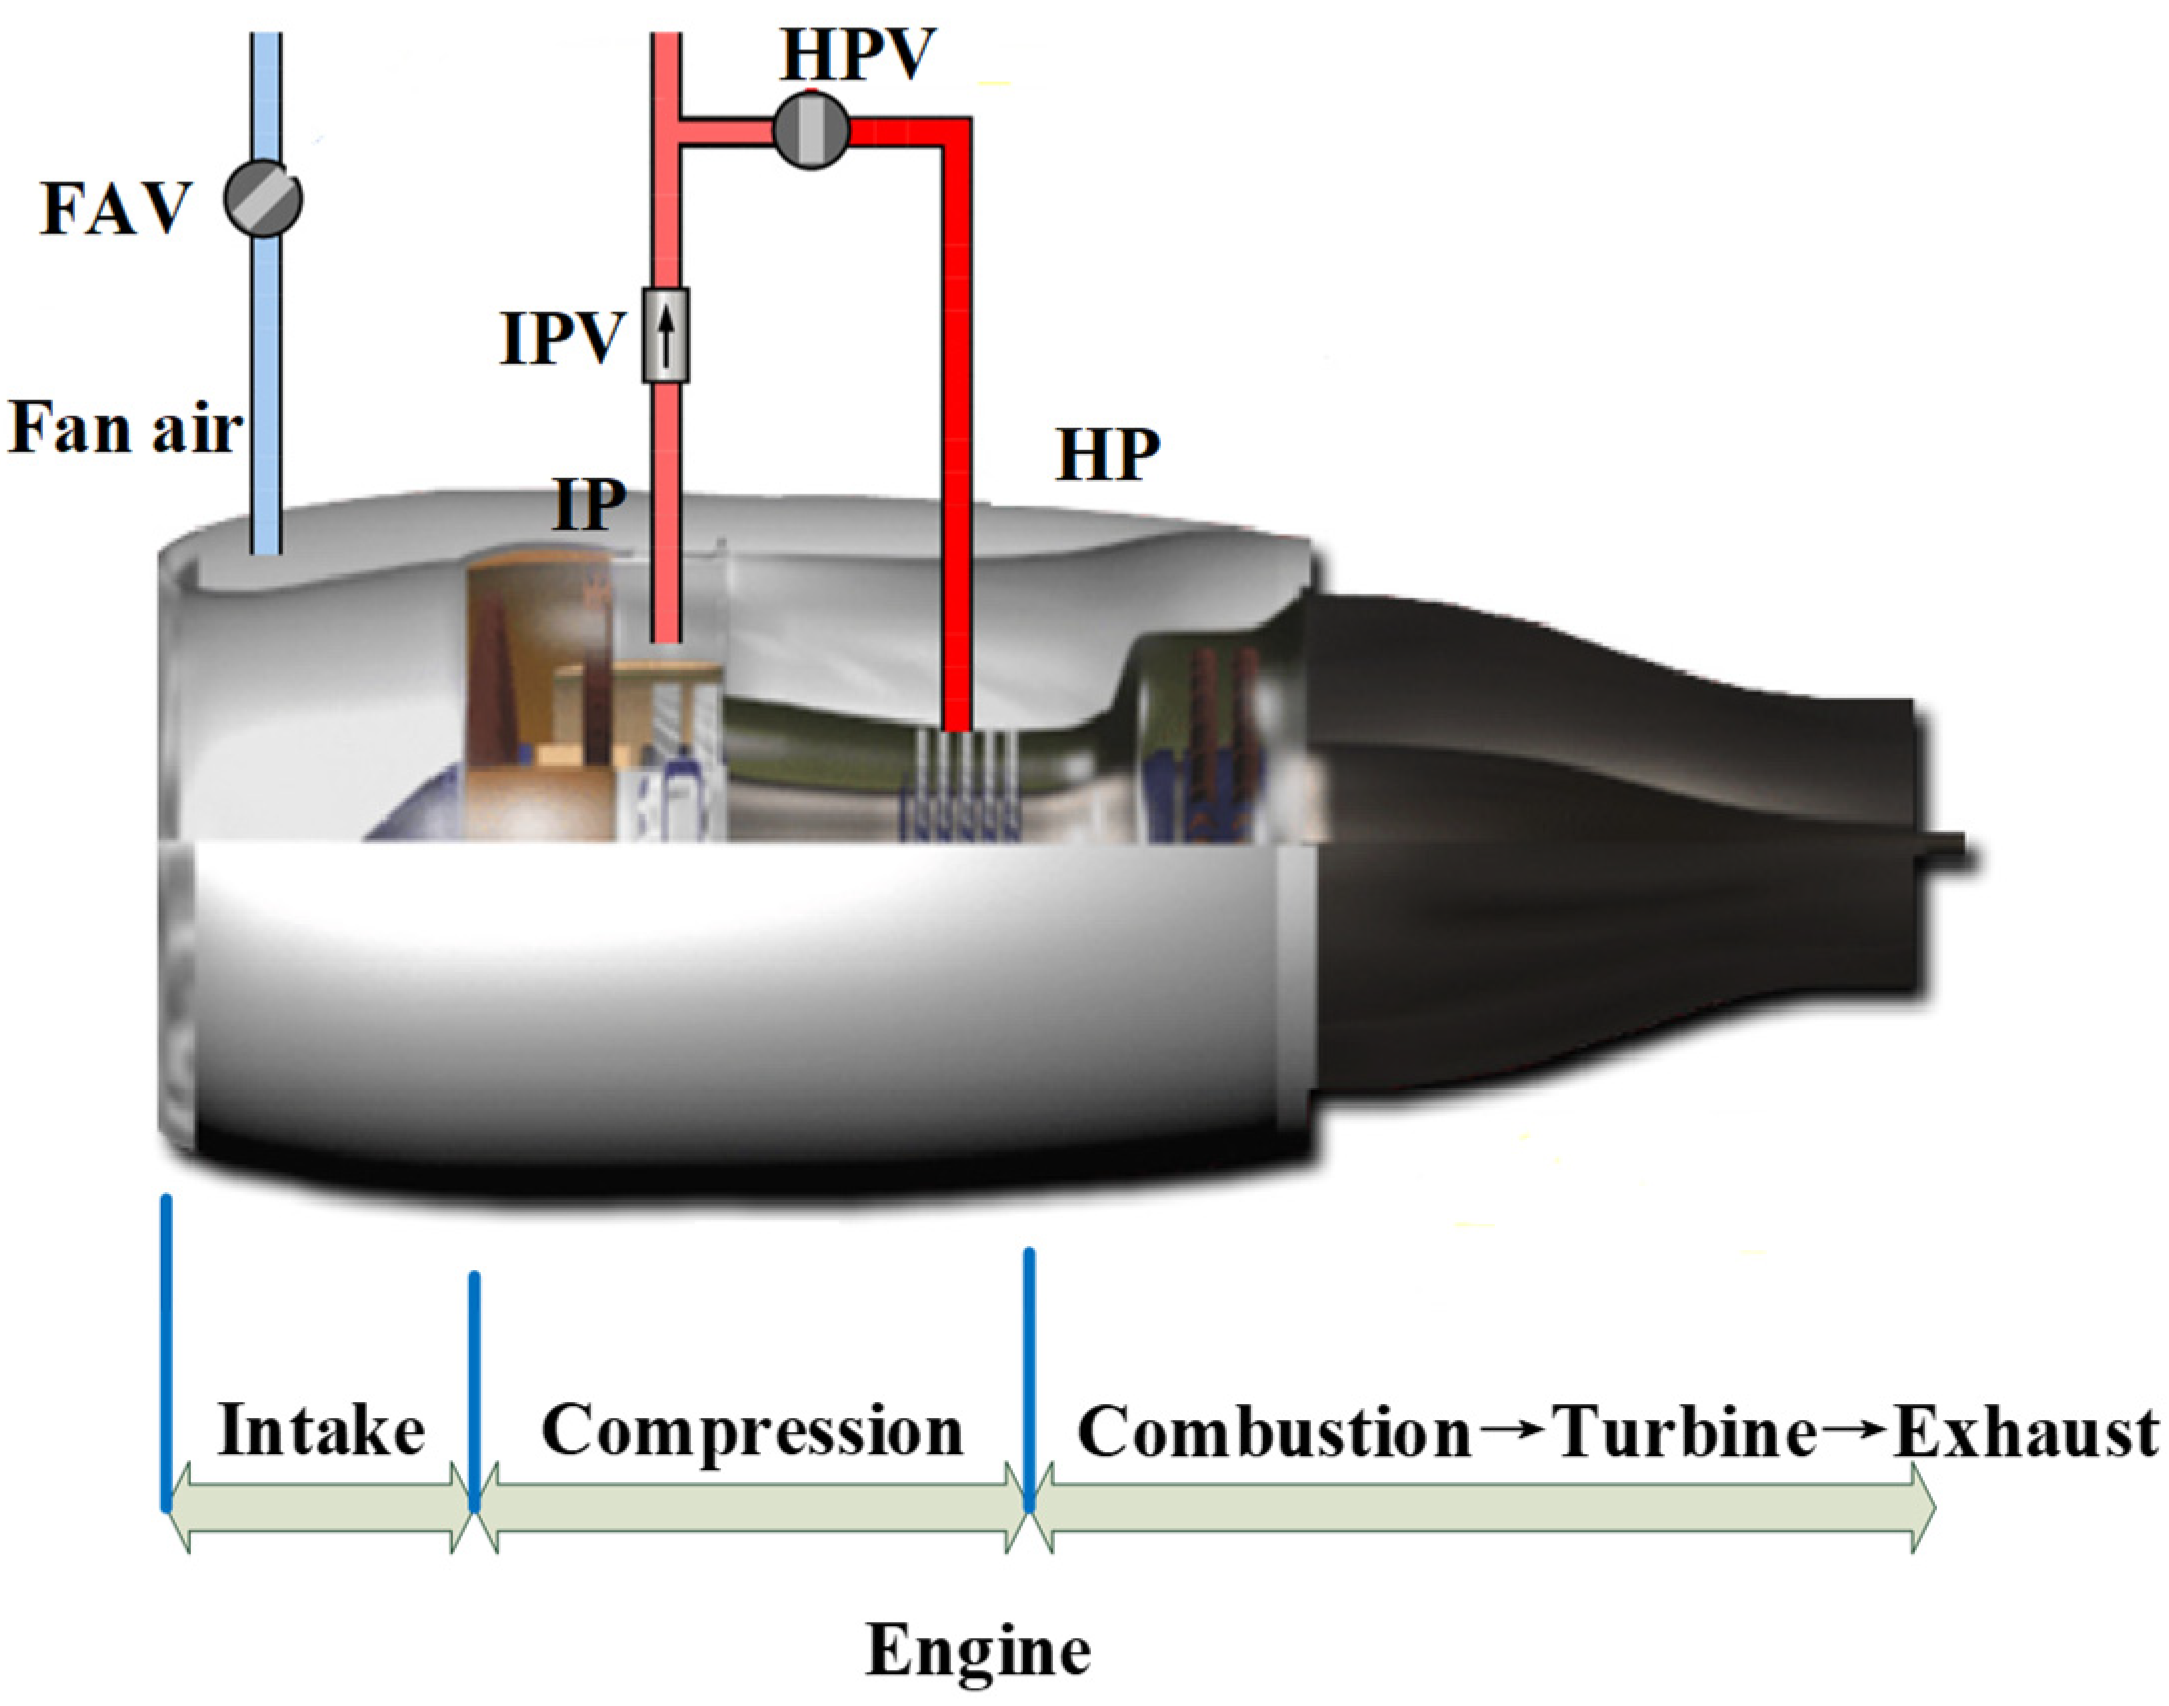
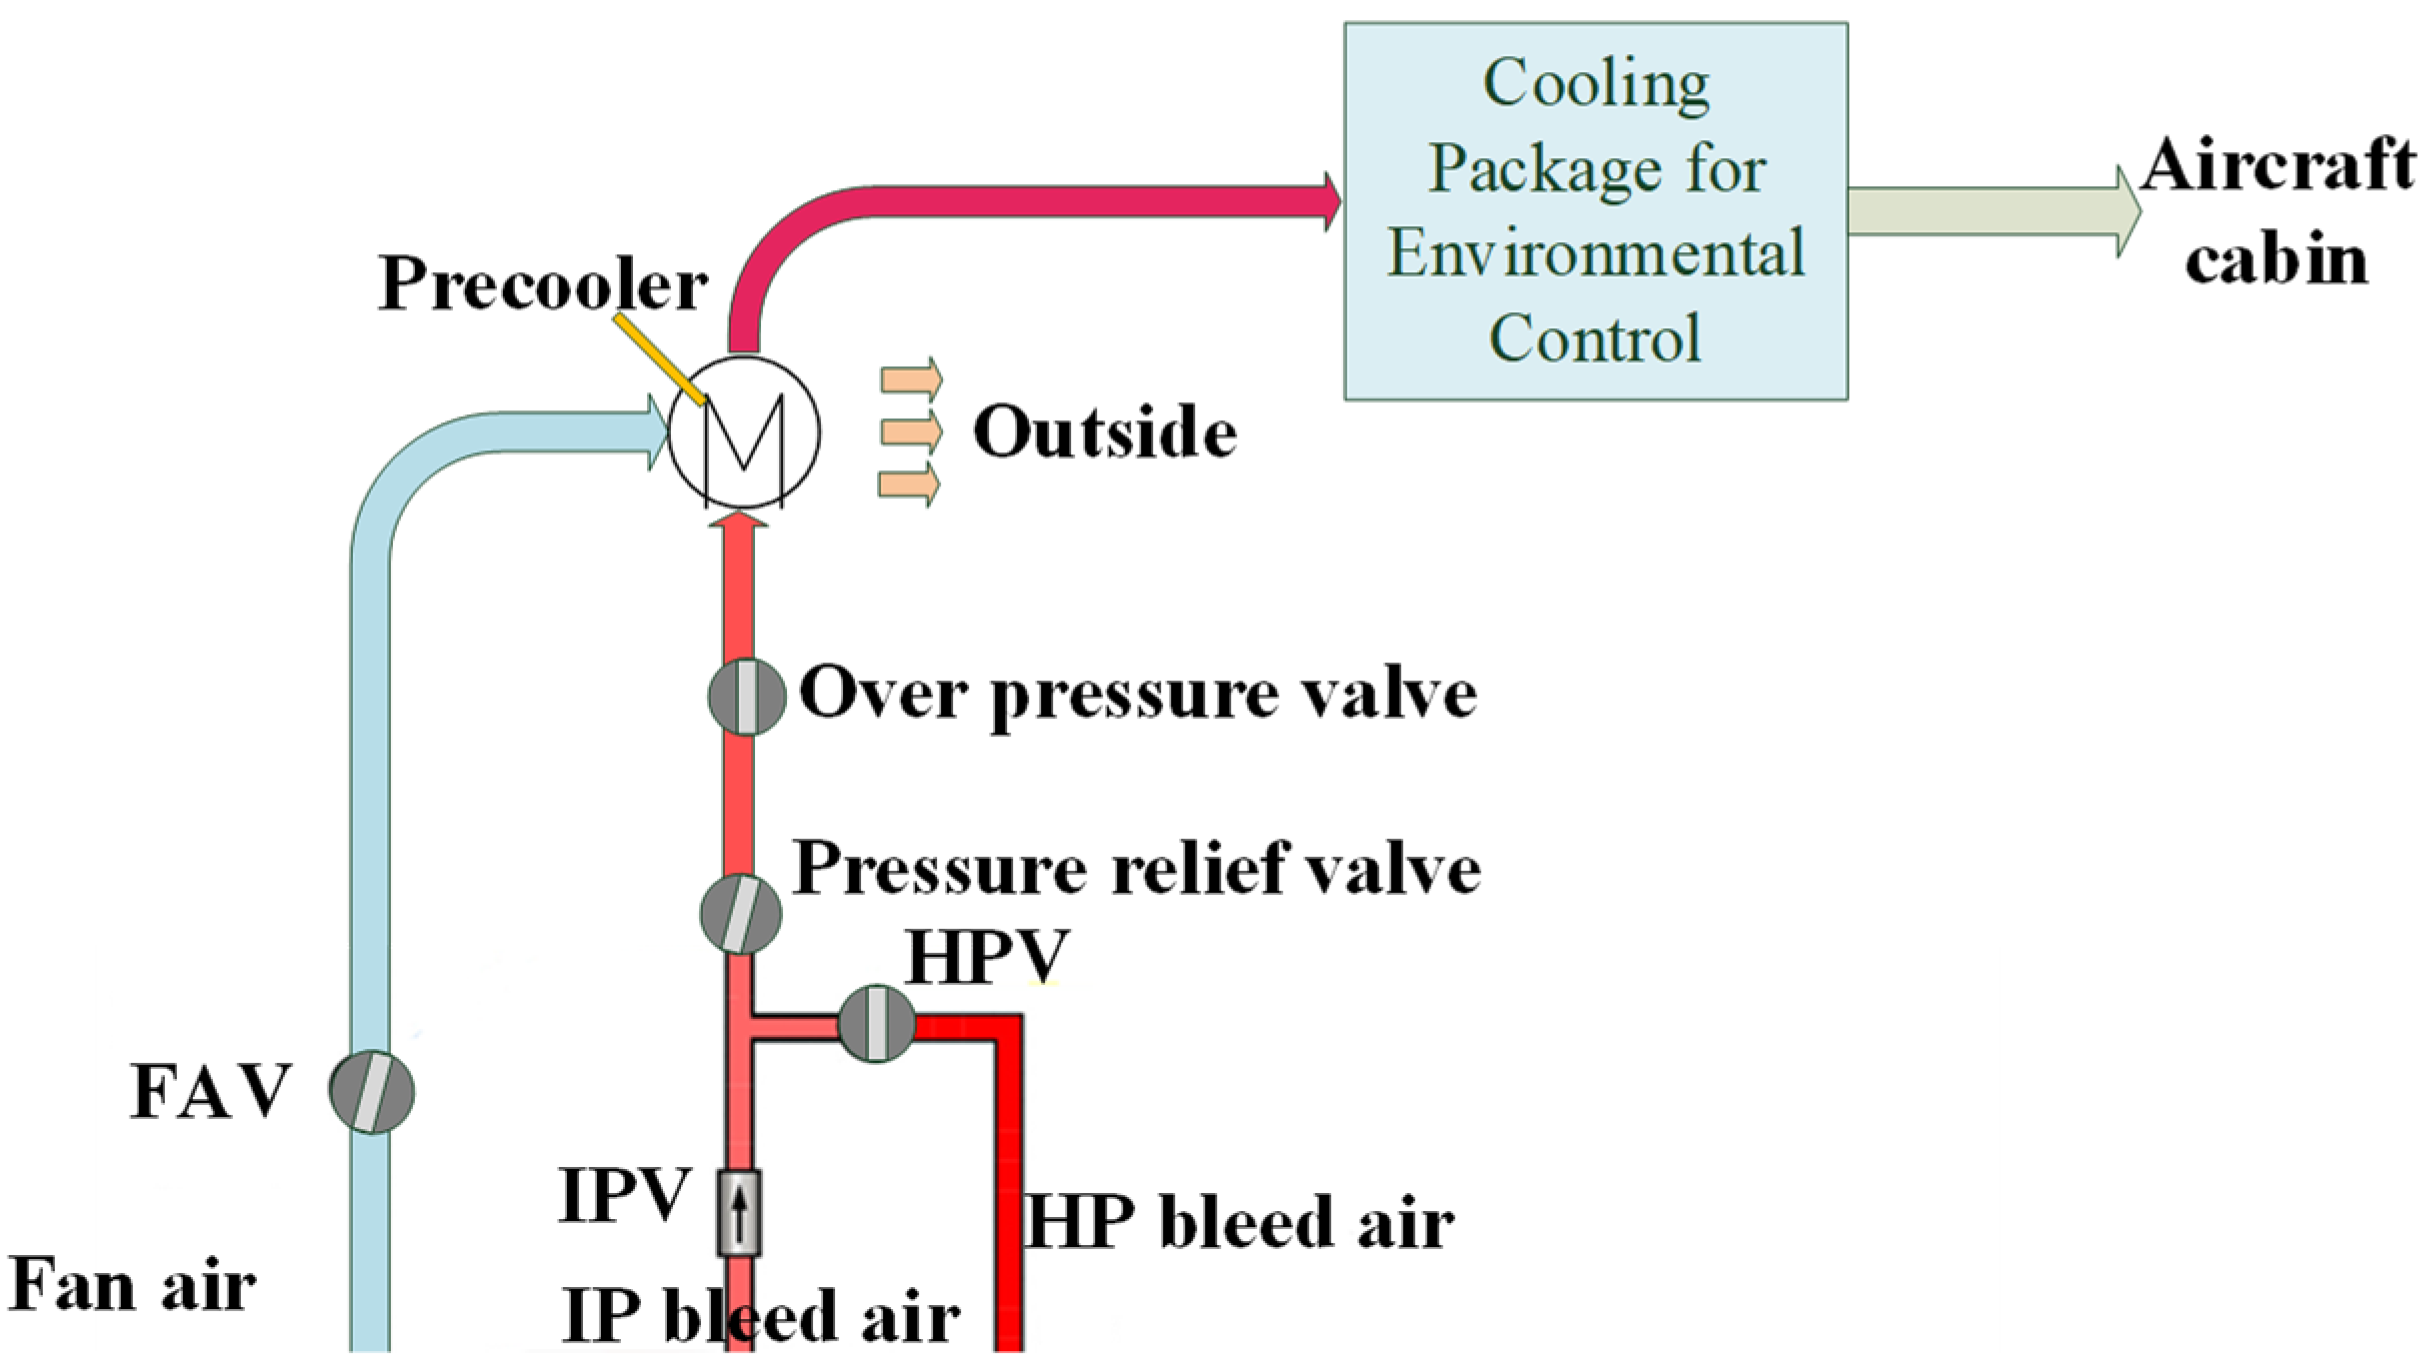
In common jet aircraft, engine bleed air is the primary air source for the ECS, as shown in Figure 1. Bleed air is compressed air taken from the 5th stage (intermediate pressure stage) or the 9th stage (high-pressure stage) of an engine’s compressor stage. The fan air is usually used to cool the compressor stage’s bleed air. The characteristics of a specific model engine’s rapid rise in the bleed air temperature are shown in Figure 2 [20]. In the gas turbines, the HP bleed air temperature is usually within 100~650 °C (212~120 °F), and IP bleed air temperature is usually within 100~50 °C (150~932 °F). Furthermore, based on the maximum heating rate and the most severe heating curve facing the aircraft’s control system, the HP and IP bleed air’s maximum inlet temperature rise rate is about 100 °C/s. HP bleed air pressure is typically within 150~3500 kPa (21.75~507.6 psi), and IP bleed air pressure is usually within 150~2500 kPa (21.75~362.6 psi). The maximum inlet pressure’s rise rate of the HP and IP bleed air is about 1000 kPa/s. The temperature of the fan air is typically 30~150 °C (85~300 °F), and the pressure is typically 100~700 kPa (14.5~102 psi).
Therefore, to truly simulate the working state of the engine, the primary problem is that the HP and IP bleed air simulation equipment must have a sufficiently high temperature and pressure. Moreover, it must meet the requirements of rapid response and good steady-state performance of temperature and pressure control. However, the heating equipment has the characteristics of a wide temperature range, nonlinear, and large inertia. Moreover, temperature and pressure control in the facility are strongly coupled. These characteristics usually lead to temperature and pressure dynamic control failure. By investigating the fast-heating method, we adopted the hot and cold blending method to realize the rapid response of the temperature. Then, this paper used a particular system structure to reduce pressure and temperature control coupling. In addition, this paper adopted the lookup-table-based PID (LPID) controller to acquire the rapid response and good steady-state performance of temperature and pressure control.

2.1. Fast Air Heating and Boost

To meet the test requirements of most ECS and its subsystem components, we built a facility capable of quickly adjusting the temperature and pressure of three air sources. We expected the facility to control bleed air at three states: the LP, the IP, and the HP. The three stage bleed air rigs’ system flow and control principle are all the same, except the pressure stage of the air source, equipment, and pipe diameter used. A 3.8 MPa air source supplies the HP bleed air simulation rig (HPR). A 2.5 MPa air source provides the IP bleed air simulation rig (IPR), and a 0.8 MPa air source provides the fan air simulation rig (FAR). As shown in Figure 3, compressed air is provided by a compressed air station composed of air compressors, air storage tanks, air treatment and purification systems, and refrigeration dryers. The inlet pressure of the ECS test piece is adjusted by Q F 1 and Q F 2 . The valves could be fully opened or fully closed within one second. The valve Q F 2 is installed on the drain branch with a smaller pipe diameter, which can fine-tune the pressure and improve the accuracy of pressure steady-state control.
At present, the standard methods of heating air are used: direct heating of an electric heater and indirect heat transfer of high-temperature gas. As the temperature control technology of gas combustion is immature, and the temperature control precision is low, this paper uses electric heating to obtain the high-temperature heat source. However, as the electric heaters’ dynamic performance is usually not the focus of designers and users, there is no credible data to support the dynamic performance design of the facility.
To achieve the rapid temperature adjustment of the facility, we draw on the system configuration method of aircraft cockpit temperature control. The hot and cold blending method can quickly respond to the aircraft cockpit’s temperature. The specific method is as follows: the facility adds a bypass in the front of the heater branch by adjusting the hot branch’s control valve and the bypass’s control valve. One part of the supply air flows through the heater, and another flows through the bypass. The two parts were mixed downstream of the heater. By changing the ratio of the hot and cold air mixture, we can achieve the purpose of rapid temperature control. However, the use of the hot and cold blending means that during a specific time of the test, a dry fir of electric heat may occur when the flow of the hot branch is too small. This paper used the counter-flow plate-fin heat exchanger for indirect heating. The heat exchanger is more conducive to realizing the actual engineering, and there is no danger of dry fir. Moreover, the heater is constantly working under atmospheric conditions, which helps reduce the R&D and production costs of the heater. Figure 4 shows the test facility’s structure to achieve rapid temperature and pressure adjustment. In order to achieve a rapid response to temperature, the fast pneumatic valves Q F H 3 and Q F H 4 were used to control the temperature. One of the two valves was opened, and the other was closed. The two valves could be fully opened or fully closed within one second.
In addition, to achieve the dynamic requirements, the key actors are the thermal inertia and volume inertia of the pipeline downstream of the heat exchanger. The inertia causes a significant delay in temperature change and makes the temperature control system produce some overshoot and fluctuation.
The temperature transmission delay τ from the heat exchanger’s outlet to the test piece’s inlet is the same as the airflow flowing through the pipe, which is determined using the pipe length l and the velocity airflow v .
Due to the difference between the airflow’s temperature and the pipe wall’s temperature, heat loss occurs during the airflow transmission. The heat loss can be expressed according to the Sukhov Formula [24]:
T e n d = T s t a r t T a e λ l q m C p + T a ,
where λ is the conductivity coefficient of the pipe, W / m · K . T a is the external environment temperature, K . C p is the specific heat ratio of air, J / kg · K .   q m is the mass flow rate of air, kg / h . T e n d is the inlet temperature of the test piece, K . T s t a r t is the supply air temperature at T H 2 . The subscript represents the moment when the system is in steady-state thermal equilibrium.
Φ = h π d i l T ¯ τ f T τ w i = C p q m T τ s t a r t T ¯ τ f T ¯ τ f = T τ s t a r t + T τ e n d 2 T τ e n d = T τ s t a r t 2 h π d i l T τ s t a r t T τ w i h π d i l + C p q m
where h is the convective heat transfer coefficient; d i is the inside diameter of the pipe; T τ w i is the temperature of the pipe’s inner wall; T ¯ τ f is the average temperature of the duct airflow. According to the above formula, to solve the problem of the thermal inertia of the pipeline connecting the heat exchanger’s outlet and the test piece’s inlet, the following measures were taken in the system.
Firstly, to ensure the facility’s safety, the distance between the outlet of the heater exchanger and the interface of the test piece was shortened as much as possible to reduce the inertia and retardation of the system.
Secondly, the T τ s t a r t should be increased to satisfy the test requirements. Specifically, during the test, ensure that the fan flow rate is sufficient, and control the heater outlet temperature T H 1 T m a x t e s t + 70   K , T m a x t e s t is the maximum temperature required for the ECS test. In this system, both the heat exchanger and the high-temperature pipeline are adequately insulated to reduce heat loss. The difference between the hot side inlet temperature and the cold side outlet temperature of the heat exchanger is generally less than 50 K , and the temperature difference between T H 2 and T H 3 is generally less than 20 K .
Thirdly, when considering the maximum flow demand of the system, the inside diameter d i of the test piece shall be reduced. This can reduce the heat loss of the pipeline and increase the airflow velocity to reduce the thermal delay.
Fourthly, before starting the test, the inlet pipe of the test piece shall be pre-heated to increase T τ w i and speed up the dynamic response of temperature. To reduce the preheating time, the wall thickness of the inlet pipe should be as small as possible while ensuring safety.
The above points can effectively ensure that based on reducing the power consumption, the test piece’s inlet temperature rapid response meets the experimental requirements during the ECS dynamic test.

2.2. Decoupling

As shown in Figure 4, the hot branch has an extra resistance device (the heat ex-changer) compared to the cold branch. The temperature control valve opening changes in the dynamic test will change the temperature simulation unit’s flow resistance and affect the pressure control. Similarly, the heat exchanger resistance will cause serious nonlinear flow distribution in the hot and cold branches, which may lead to the failure of temperature control.
For these reasons, this paper used a particular system structure to reduce pressure and temperature control coupling.
Firstly, valves F H 1 and F H 2 shall be set on the hot and cold branches, respectively. When valves F H 1 , Q F H 3 , and Q F H 4 are in the fully open position, the opening of valve F H 2 shall be adjusted to make the resistance of the cold and hot branches similar.
Secondly, considering that Q F H 3 and Q F H 4 pneumatic valves have the same size, once one of them is in the open position, the other one shall be closed. In this way, the temperature control valves’ action will not affect the flow resistance of the system.
Thirdly, the principle of selecting the pressure control valve Q F H 1 is to make the outlet flow and the opening of the valve have a linear relationship as much as possible to reduce the influence of pressure changes on temperature control. In engineering, due to the existence of equipment and pipeline resistance, the valve’s flow rate will be distorted. In this system, the resistance of the series pipeline behind the valve Q F H 1 is much greater than the resistance of the regulating valve, so Q F H 1 chooses an equal percentage valve.

2.3. The LPID Controller

To take into account the rapid response and good steady-state performance of the pressure and temperature control, this paper used the lookup-table-based PID (LPID) controller to control the temperature and pressure of the bleed air simulation test [25].

2.3.1. The LPID Control

The LPID controller takes the measurement value P H 2 as input and outputs a 4~20 mA.DC signal after comparing the measurement value with the set value every 5 ms. After the two pressure control valves receive the same control signal, one will open up, and the other will close down. When receiving a 4 mA signal, the pressure control valve on the main pipe is fully closed, and the control valve on the linked branch is fully open. The temperature controller takes the temperature measurement value T H 3 as input. After comparing the input value with the set temperature value, it outputs a 4~20 mA.DC signal and controls the temperature control valves on two temperature control branches simultaneously. Like the pressure control valves, the temperature control valve on the high-temperature branch is fully opened after receiving a 20 mA signal. The other control valve on the room temperature branch is fully closed.
The LPID control is developed from traditional PID. The distinguishing feature of the proposed controller is pre-calculated to make a PID parameter scheduling table. We established the relationship between three PID parameters K p , K i , K d , and the error e based on this specific system. According to different temperature and pressure errors, the PID gains can be self-adjusted online to make the controlled object have a good dynamic and static performance, meeting different control requirements. The specific gain scheduling rules are as follows:
When the e > M m a x , we use the strong PID to minimize error quickly;
When the M m i n < e M m i d , we adopt the weak PID;
When the e M m i n , which indicates the absolute error value, tends to be very small, we can use the PI to decrease the static error;
When the deviation is slight to a certain extent, e < ε , the concept of the dead zone can even be introduced, at this moment, the output of the controller remains invariable, namely, u k = u k 1 .
Where, M m a x , M m i d , and M m i n are limit values. The limit values and the different PID gain parameters need to be debugged in actual engineering.

2.3.2. Simulation Example

Consider a plant as:
G s = 0.9025 33750 s 3 + 34200 s 2 + 376 s + 1 ,
The sampling time is 5 ms, the ideal position signal is y d k = 1 . In the simulation program, due to the discretization, there are two delays in the control input.
The unit step response simulation results of a traditional PID controller and LPID controller are shown in Figure 5. The simulation results showed that the LPID controller has advantages, high control precision, a low overshoot amount, a fast response, and high stability compared to the traditional PID controller.

3. Facility Description

There are two rigs for each pressure stage in the facility to simultaneously perform the dual-engine bleed air simulation test. Figure 4 shows the main flow of the HPR. The HPR components mainly include pressure control, temperature control, and bleed air switching components. The following paper will introduce the HP-stage bleed air rig as an example.

3.1. Pressure Control Components

The air source pressure of the HPR is 3.8 MPa. We adjusted the opening of pressure-regulating valves according to the measured value P H 2 to control the inlet pressure of the ECS test piece. As shown in Figure 6, to improve the steady-state control accuracy of pressure, the drain branch with a smaller pipe diameter installed a pressure regulating valve Q F H 2 linking to the pressure regulating valve Q F H 1 on the main pipe. Both valves use the same 4~20 mA.DC signal. At 20 mA, the valve on the main pipe is fully opened, and the valve on the linked branch pipe is fully closed. The end of the linked branch pipe is directly drained after connecting the silencer.

3.2. Temperature Control Components

After the compressed air passes through the flow measurement components, it enters the temperature simulation unit (shown in Figure 7). The high-temperature branch arranges a globe valve, a control valve, and a heat exchanger sequence. There is a globe valve and a control valve on the room temperature branch. We adjusted the opening of the temperature regulating valves according to the measured value T H 3 to control the inlet temperature of the ECS test piece. Both the two valves use the same 4~20 mA.DC signal. At 20 mA, the valve Q F H 3 is fully opened, and the valve Q F H 4 is fully closed. The open angle of the globe valves is adjusted to balance the flow resistance of the two branches. The heat exchanger converts the room-temperature compressed air passing through the high-temperature branch into high-temperature and high-pressure air. When the heat exchanger was heating the compressed air, the thermal load on its warm end was fixed. The frequency of the centrifugal fan was corrected to accommodate the required thermal load. A temperature controller with PID automatically adjusted the temperature T H 1 , which controls the heating power by comparing the set value with the temperature sensor reading. The maximum working temperature of the electric heater in the HPR can reach 750 °C.

3.3. Bleed Air Switching Control Valve

The facility can achieve dynamic performance by switching different air supply lines, as shown in Figure 8. On the upstream of the inlet of the test piece, an exhaust branch is arranged. The exhaust branch arranges a control valve Q F H 5 for bleed air switching or safety dumping. The control valve enables the fast switching between HP and IP to bleed air according to test requirements. For example, in a dynamic test of switching from HP bleed air to IP bleed air, the exhaust valve Q F H 5 is fully closed while both the exhaust valve Q F M 5 and the HP bleed valve (HPV) are opened initially. The test piece uses HP bleed air at this time. When the IP bleed air is needed, the IP bleed valve (IPV) of the test piece and the exhaust valve Q F H 5 are opened, while the exhaust valve Q F M 5 is closed. This way, the IP bleed air is directed to the test piece, and the bleed air in the HPR is evacuated.

4. Experimental Method

The dynamic tests were performed to examine the performances of ECS test pieces. Figure 9 shows the installation diagram of the ECS test piece. In the take-off phase, the aircraft engine thrust rapidly increased within 10 s, and the high-pressure air outlet port was rapidly heating. The pressure and temperature of the HP bleed air are first maintained at the set minimum value, then increase at the set rate synchronously, and finally tend to be stable after reaching the set maximum value.
The facility mainly simulates the engine HP bleed air, IP bleed air, and fan air in the dynamic performance tests. This facility used the fast-response pressure sensor of the GEMS company, the response time was 0.5 ms, and the measurement error was better than ±0.25% FS. The MANMAC company’s fast-response thermocouple with a response time of 70–100 ms was adopted, and the measurement error was better than ±0.5% FS.
In this paper, for the convenience of presenting the results, the pressure unit was ‘psi’, and the temperature unit was ‘°F’.
For the cooling-package-one, the temperature of HP bleed air can be increased from 446 to 1076 °F (230~580 °C) in 6 s and the pressure from 43.5 to 449 psi (300~3100 kPa) in 3 s, then the temperature and pressure remain stable. The temperature of IP bleed air should increase from 302 to 896 °F (150~480 °C) in 6 s, the pressure from 32 to 217.6 psi (220~1500 kPa) in 3 s, and then keep them steady. To save the installation time of the cooling package, an HPR is directly used to simulate the HP bleed air and the IP bleed air.
For the cooling-package-two, the temperature of HP bleed air can be increased from 446 to 1076 °F (230~580 °C) in 6 s and the pressure from 43.5 to 449 psi (300~3100 kPa) in 3 s, then the temperature and pressure remain stable. This result can verify the repeatability of the test rig.
For the precooler’s cold end, the temperature of fan air should increase from 105 to 230 °F (40~110 °C) in 6 s, and the pressure from 16 to 30 psi (110~205 kPa) in 3 s.

5. Testing Results

The HP and IP bleed air temperature and pressure rapid rise characteristics of the cooling-package-one on HPR are shown in Figure 10. It can be seen from Figure 10a that the temperature increased from 463 to 1032 °F (239~555 °C) in 6 s and stabilized within 10 s. The pressure increased from 47.8 to 405.2 psi (329~2792 kPa) in 3 s and stabilized within 10 s. Both the temperature and pressure dynamic control error do not exceed 10%. The temperature and pressure of the IP bleed air are shown in Figure 10b. It can be observed from Figure 10b that the temperature increased from 301 to 859 °F (150~460 °C) in 6 s and stabilized within 10 s. The pressure increased from 32 to 212 psi (220~1461 kPa) in 3 s and stabilized within 10 s. The HP bleed air temperature and pressure rapid rise characteristics of the cooling-package-two on HPR are shown in Figure 11, the temperature increased from 455.6 to 1050.3 °F (235.5~567 °C) in 6 s and stabilized within 10 s. The pressure increased from 45.9 to 407.8 psi (316.6~2811.7 kPa) in 3 s and stabilized within 10 s. Both the temperature and pressure control errors did not exceed 10%. It also can be seen from Figure 10 that the steady-state temperature error can be controlled within 5% and the steady-state pressure error can be controlled within 2%. Figure 12 shows the fan air’s temperature and pressure rapid rise characteristics.
These test results show that the facility can accurately simulate the engine bleed air temperature and pressure rapid rise characteristics. The results also demonstrate that the rig can control the temperature and pressure of bleed air at a steady state with high precision. Furthermore, the results show that the coupling effect of temperature and pressure is eliminated in the facility, which aligns with the expectations of the structural design. Comparing the results of Figure 10a and Figure 11, the test results of the two cooling package pieces show that the changing trend of temperature and pressure was the same, and both the dynamic and steady-state errors were within the acceptable range. The results show that the repeatability of the test was satisfactory.

6. Conclusions

This paper presents a thermal test facility capable of dynamically simulating engine bleed air. The proposed facility is pioneering in the dynamic test for ECS compared to conventional facilities. The facility consists of the HP bleed air simulation rigs (HPRs), the IP bleed air simulation rigs (IPRs), the fan air simulation rigs (FARs), and a measurement and control system.
In this system, the hot and cold blending method is used to realize the rapid response of the temperature. Remarkably, this facility adopts a heat exchanger for indirect heating, which is more straightforward to implement than the heater for direct heating and can avoid the possible electric heater dry fire indirect heating. The pressure regulating valves and temperature regulating valves operate at room temperature, and the electric heater works under atmospheric pressure. These designs reduce the technical requirements and capital investment of critical components, improve the system’s reliability, and benefit engineering realization. In addition, this paper adopted a particular system structure to eliminate the coupling effect of temperature and pressure. Additionally, this paper adopted the lookup-table-based PID (LPID) controller to acquire a fast response and good steady-state performance of temperature and pressure control.
The test results show that the facility can accurately simulate the engine bleed air temperature and pressure rapid rise characteristics and obtain an exact control at a steady state. Both the temperature and pressure dynamic control errors did not exceed 10%, the steady-state temperature error can be controlled within 5%, and the steady-state pressure error can be controlled within 2%. The facility can provide conditions for dynamic ECS testing and strong support for developing the new ECS. In future work, the dynamic performance of ECS can be studied in combination with the experimental capability of the facility.

Author Contributions

Conceptualization, J.W. and S.J.; system design, H.W.; data curation, Y.Z.; formal analysis, Y.Z.; methodology, Y.Z.; resources, M.L.; software, P.X.; supervision, M.L.; validation, Y.Z.; experiment, Y.Z. All authors have read and agreed to the published version of the manuscript.

Funding

This research received no external funding.

Data Availability Statement

The data presented in this study are available on request from the corresponding author. All data are calculated by the author and have been included in this paper.

Conflicts of Interest

No conflict of interest exists in the submission of this manuscript, and the manuscript is approved by all authors for publication. I would like to declare on behalf of my co-authors that the work described was original research that has not been published previously, and not under consideration for publication elsewhere, in whole or in part. All the authors listed have approved the manuscript that is enclosed.

References

  1. Merzvinskas, M.; Bringhenti, C.; Tomita, J.T.; Andrade, C.R. Air conditioning systems for aeronautical applications: A review. Aeronaut. J. 2020, 124, 499–532. [Google Scholar]
  2. Tfaily, A.; Kokkolaras, M. Integrating Air Systems in Aircraft Multidisciplinary Design Optimization. In Proceedings of the 2018 Multidisciplinary Analysis and Optimization Conference, Atlanta, GA, USA, 24 June 2018; p. 3742. [Google Scholar]
  3. Sanchez, F.; Liscouet-Hanke, S. Thermal risk prediction methodology for conceptual design of aircraft equipment bays. Aerosp. Sci. Technol. 2020, 104, 105946. [Google Scholar]
  4. Hunt, E.H.; Reid, D.H.; Space, D.R.; Tilton, F. Commercial Airliner Environmental Control System. In Proceedings of the Engineering Aspects of Cabin Air Quality Aerospace Medical Association Annual Meeting, Anaheim, CA, USA, 7 May 1995. [Google Scholar]
  5. Dieckmann, R.R. Improved Reliability and Maintainability for Fighter Aircraft Environmental Control Systems (No. 880999); SAE Technical Paper; SAE: Warrendale, PA, USA, 1988. [Google Scholar]
  6. SKYbrary Aviation Safety. A333, En-Route, South of Moscow Russia. 2010. Available online: https://skybrary.aero/accidents-and-incidents/a333-en-route-south-moscow-russia-2010 (accessed on 28 March 2022).
  7. Cao, Y.; Tan, W.; Wu, Z. Aircraft icing: An ongoing threat to aviation safety. Aerosp. Sci. Technol. 2018, 75, 353–385. [Google Scholar]
  8. Transportation Safety Board of Canada. Air Transportation Safety Investigation Report A17C0146; Transportation Safety Board of Canada: Gatineau, QC, Canada, 2021. [Google Scholar]
  9. Moir, I.; Seabridge, A. Aircraft Systems: Mechanical, Electrical, and Avionics Subsystems Integration; John Wiley & Sons: New York, NY, USA, 2011; Volume 52. [Google Scholar]
  10. Buckingham, R.D. Helicopter Cooling, Air Cycle/Vapor Cycle Trade-Offs; SAE Transactions: Warrendale, PA, USA, 1984; pp. 571–581. [Google Scholar]
  11. Rosenbush, F.M. ECS Schemes for All Electric Airliners (No. 820870); SAE Technical Paper; SAE: Warrendale, PA, USA, 1982. [Google Scholar]
  12. Eichler, J. Simulation Study of an Aircraft’s Environmental Control System Dynamic Response. J. Aircr. 1975, 12, 757–758. [Google Scholar]
  13. Ashford, R. Verification and Validation of the F/A-22 Raptor Environmental Control System/Thermal Management System Software (No. 2004-01-2573); SAE Technical Paper; SAE: Warrendale, PA, USA, 2004. [Google Scholar]
  14. Jennions, I.; Ali, F.; Miguez, M.E.; Escobar, I.C. Simulation of an aircraft environmental control system. Appl. Ther. Eng. 2020, 172, 114925. [Google Scholar]
  15. Ryan, S.K. F-15 Environment Control System Improvements; SAE Transactions: Warrendale, PA, USA, 1990; pp. 537–544. [Google Scholar]
  16. Zhao, H.; Hou, Y.; Zhu, Y.; Chen, L.; Chen, S. Experimental study on the performance of an aircraft environmental control system. Appl. Ther. Eng. 2009, 29, 3284–3288. [Google Scholar]
  17. Childs, T.; Jones, A.B.; Chen, R. Development of a Full Scale Experimental and Simulation Tool for Environmental Control System Optimisation and Fault Detection. In Proceedings of the 53rd AIAA Aerospace Sciences Meeting, Kissimmee, FL, USA, 3 January 2015; p. 1196. [Google Scholar]
  18. Committee, AC-Aircraft Environmental Systems. Testing of Airplane Installed Environmental Control Systems (ECS); SAE International: Warrendale, PA, USA, 2021. [Google Scholar]
  19. Ranter, H. Report: A330 Emergency Descent Due to Bleed Air System Interruption (Taiwan). Aviation Safety Network. 2010. Available online: https://news.aviation-safety.net/2010/08/30/report-a330-emergency-descent-due-to-bleed-air-system-interruption-taiwan/ (accessed on 28 March 2022).
  20. Dai, Z.; Cui, Y. Study on the Fast Air Heating Method for the Rig of the Environmental Control System of the Aircraft. J. Phys. Conf. Ser. 2018, 1060, 012072. [Google Scholar]
  21. Cui, Y. Study on the Simulink Model for the Rig of the Environmental Control System of the Aircraft. J. Phys. Conf. Ser. 2018, 1060, 012073. [Google Scholar]
  22. Wang, J.; Xue, L.-X. Design of Engine Bleed Air Simulation Test Bench Temperature Control System Based on Humanoid Intelligence. In Proceedings of the CSAA/IET International Conference on Aircraft Utility Systems (AUS 2018), Guiyang, China, 19 June 2018; pp. 694–698. [Google Scholar]
  23. Hodal, P.; Liu, G. Bleed air temperature regulation system: Modeling, control, and simulation. In Proceedings of the 2005 IEEE Conference on Control Applications, Toronto, ON, Canada, 28–31 August 2005; pp. 1003–1008. [Google Scholar]
  24. Lei, Y.; Chen, X.; Jiang, K.; Li, H.; Zou, Z. A Novel Methodology for Electric-Thermal Mixed Power Flow Simulation and Transmission Loss Analysis in Multi-Energy Micro-Grids. Front. Energy Res. 2021, 8, 386. [Google Scholar]
  25. Zheng, Y.; Liu, M.; Wu, H.; Wang, J. Temperature and Pressure Dynamic Control for the Aircraft Engine Bleed Air Simulation Test Using the LPID Controller. Aerospace 2021, 8, 367. [Google Scholar]
Figure 1. Schematic diagram of engine bleed air.
Aerospace 09 00584 g001
Figure 2. Bleed air temperature rapid rise characteristics of a specific model engine.
Aerospace 09 00584 g002
Figure 3. Rapid temperature response flow diagram.
Aerospace 09 00584 g003
Figure 4. System flow chart of the HP-stage bleed air system.
Aerospace 09 00584 g004
Figure 5. The Unit Step Response curve of PID and LPID.
Aerospace 09 00584 g005
Figure 6. The facility structure.
Aerospace 09 00584 g006
Figure 7. The temperature simulation unit components.
Aerospace 09 00584 g007
Figure 8. Rapid bleed air switching response diagram.
Aerospace 09 00584 g008
Figure 9. The installation diagram of the ECS test piece.
Aerospace 09 00584 g009
Figure 10. The HP and IP bleed air temperature and pressure rapid rise characteristics of the cooling-package-one on HPR. (a) The HP bleed air temperature and pressure rapid rise characteristics; (b) the IP bleed air temperature and pressure rapid rise characteristics.
Aerospace 09 00584 g010
Figure 11. The HP bleed air temperature and pressure rapid rise characteristics of the cooling-package-two on HPR.
Aerospace 09 00584 g011
Figure 12. Fan air temperature and pressure rapid rise characteristics.
Aerospace 09 00584 g012
Publisher’s Note: MDPI stays neutral with regard to jurisdictional claims in published maps and institutional affiliations.

