1. Introduction
Helicopter employment in civil and military operations is widespread and often essential for critical tasks such as search and rescue missions, firefighting, or medical evacuations. Landing and take-off operations from rugged and harsh sites make these kinds of maneuvers extremely complex and affected by low margins of error. Lands characterized by dusty floor conditions or poorly aggregated soil (such as arid locations and deserts) are considered the worst scenarios for helicopter operations to be successfully carried out [
1]. In such locations, dust cloud raising events (named brownouts) are extremely likely and potentially harmful for the helicopter’s operability. In the worst case of hard brownouts, pilots can incur diminished (or even zeroed) visibility conditions, which can pose an immediate threat to the safety of the aircraft [
2].
Nevertheless, the occurrence of brownout events may expose the engine to a severe dust particle ingestion, leading to the deterioration of the internal components and the consequent reduction of the engine performance [
3]. The compressor deterioration caused by the material removal (erosion) was documented for the first time during the U.S. Army’s rotorcraft operations in Southeast Asia (during the 1960s) [
4] and has been mitigated through the implementation of cyclone separator systems (i.e., Donaldson strata-tube
TM) capable of avoiding the entering of coarser particle into the engine flow path [
5]. Despite this, the finest dust particles (below 5 μm) are allowed to enter the engine, due to the absence of separators, and deposit onto the compressor airfoils (fouling) [
6]. The macroscopic effects of micro-sized solid particle adhesion are the decrease in the engine shaft power at constant turbine inlet temperature, the increase in the specific fuel consumption at constant power, the decrease in the engine surge margin, and the reduced transient stability of the engine [
7].
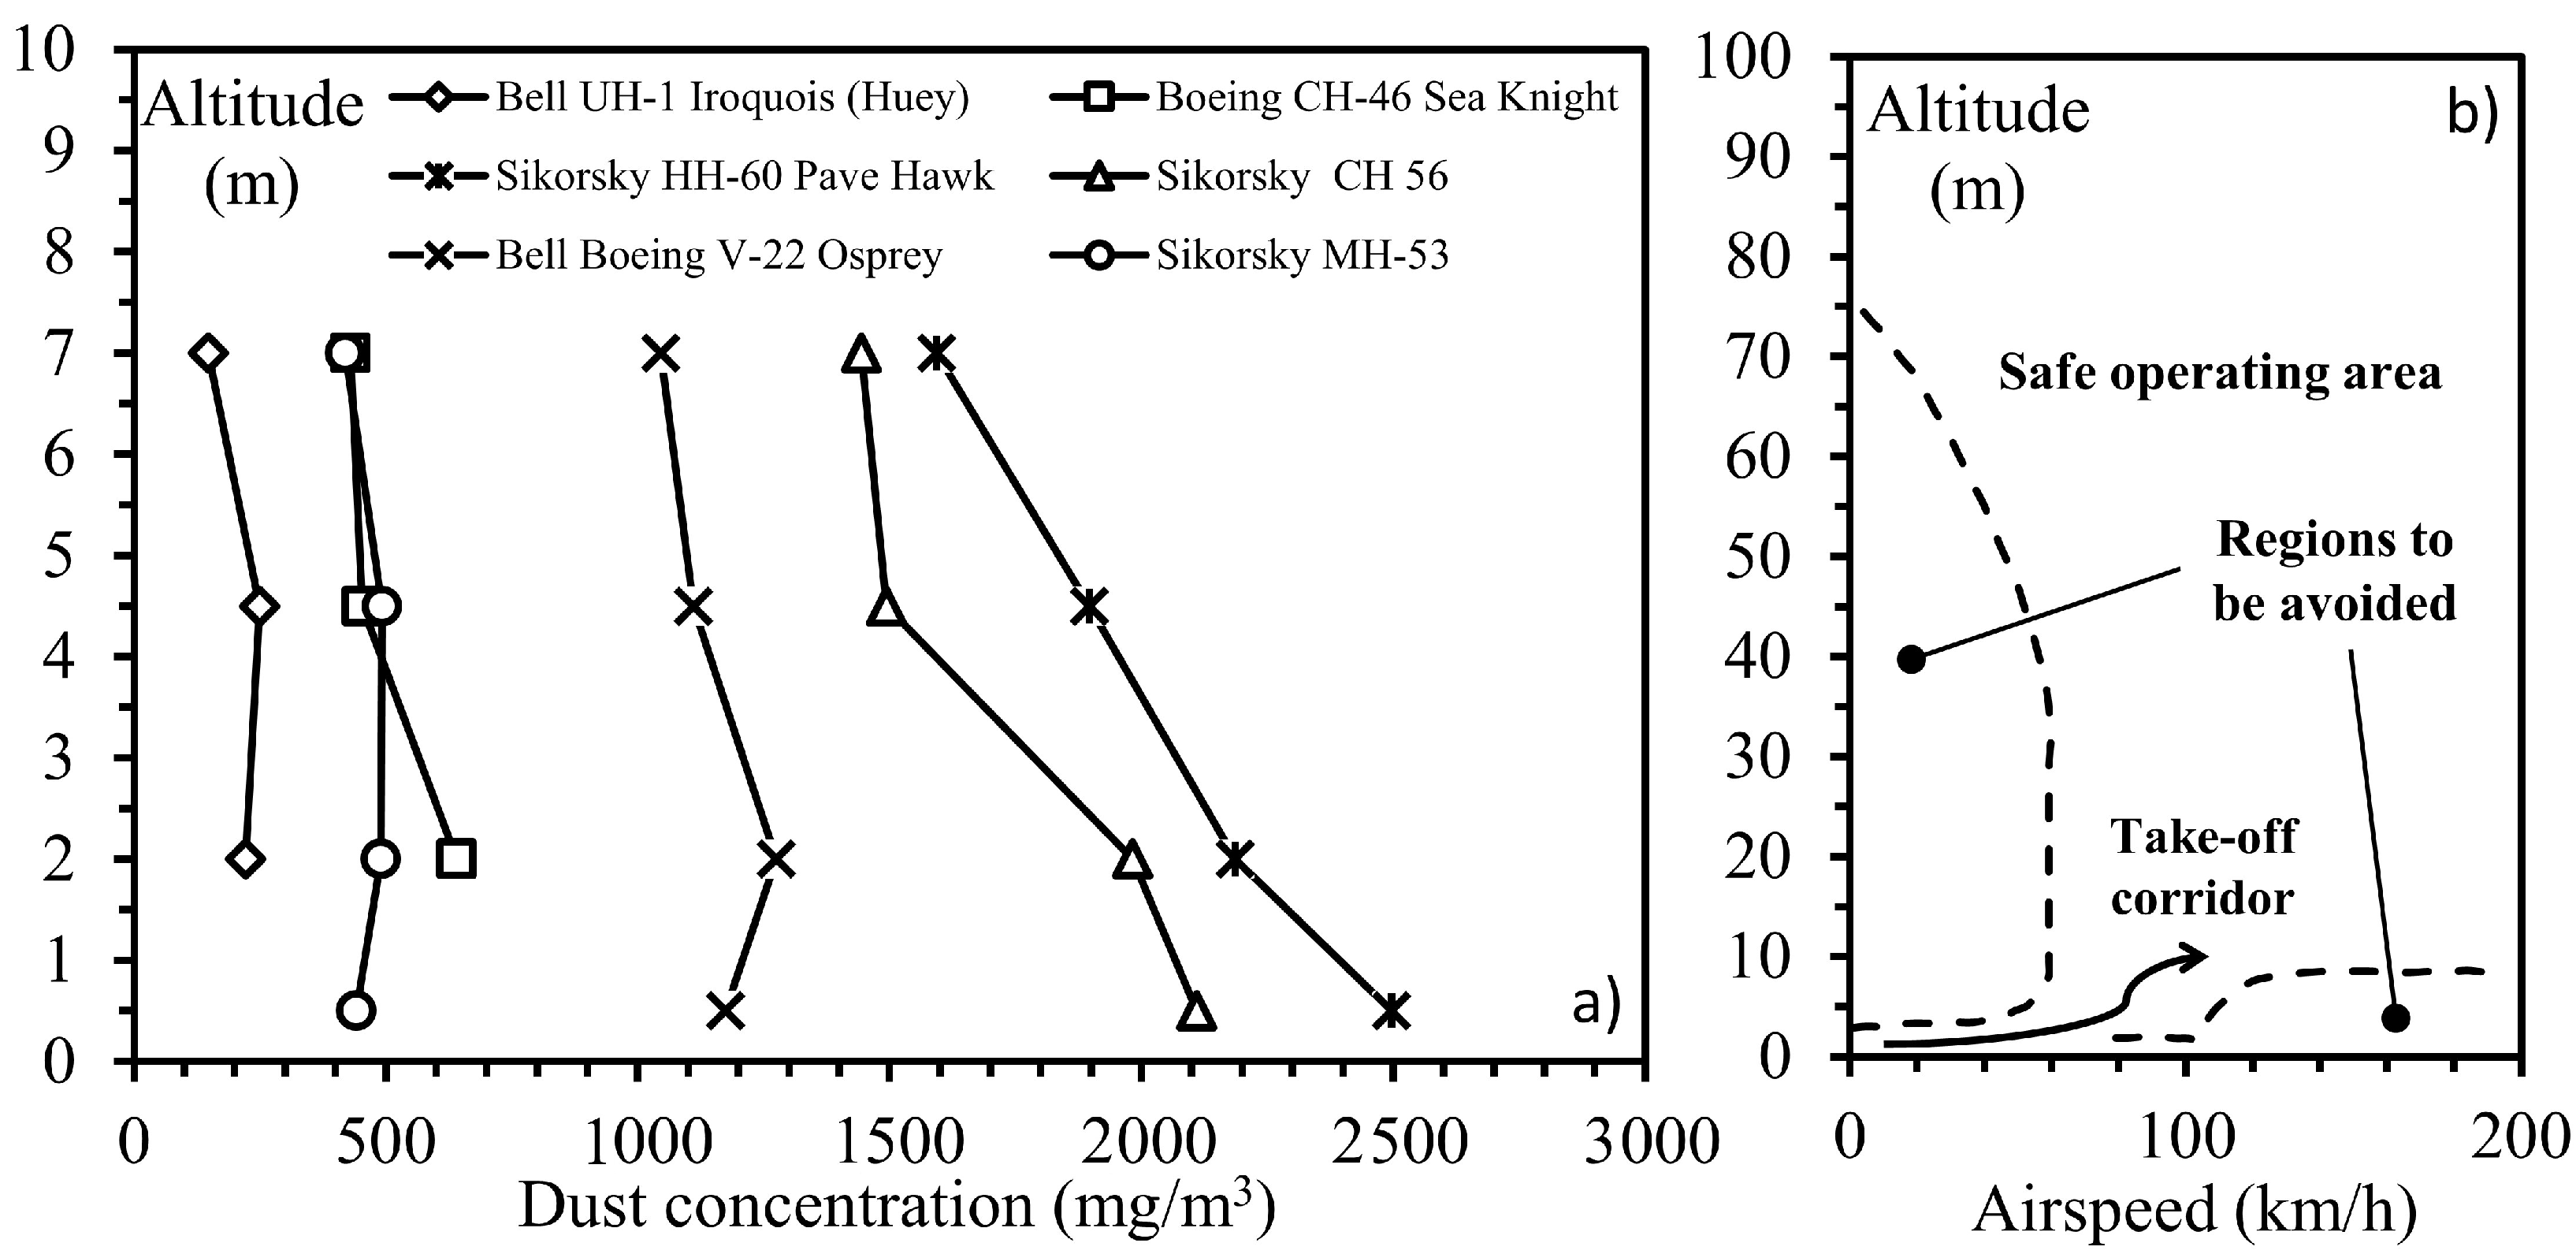
During take-off, landing, and hover-taxi operations, the engine may ingest huge amounts of dust, and a portion of that adheres to the compressor airfoils. For example, the downwash of the rotor wings increases dust concentration up to 10 m in altitude during operations in dusty areas.
Figure 1a reports a series of dust concentration measurements over altitude on six rotorcraft frames performing hover maneuvers in the Yuma Proving Ground (Arizona) [
8]. The measurements show that the dust concentration can increase up to 2500 mg/m
at ground level, depending on the rotorcraft frame weight, and spread up to seven meters in altitude.
During take-off operations, the aircraft can be exposed to dust ingestion for an extended time, even after the ground has been left. This fact is connected to the profile (take-off corridor) that a helicopter has to follow starting from the ground at zero airspeed (speed of the aircraft relative to the air). The height-velocity diagram indicates the combinations of altitude and velocity that should be avoided to ensure a safe emergency landing in case of power or transmission failure. This chart has been often referred to by the quaint name of the dead man’s curve. A qualitative reproduction of the Sikorsky S-76 height-velocity chart is reported in
Figure 1b. The chart reports the recommended profile that a pilot should follow before starting the cruise, and as can be noted, the helicopter should keep a low altitude until an optimal airspeed is reached, making the occurrence of dust ingestion more likely.
In order to give further information about the dangerousness of aircraft engine exposure to dusty environments, Clarkson et al. [
10] introduced the concept of the dose of dust ingestion, which is the product of the particle concentration into the environment (
C) and the exposure time (
t) of the engine to that environment. This parameter allows completing the framework of the potential damage related to dust ingestion, which was, before 2010 (when the airspace over Europe was closed due to the volcanic ash emergency), based only on dust concentration limits, generally from 2 mg/m
to 6 mg/m
[
11]. The scientific community has accepted the concept of dose and employed it in modeling deposition phenomena in aircraft engines [
12,
13]. In [
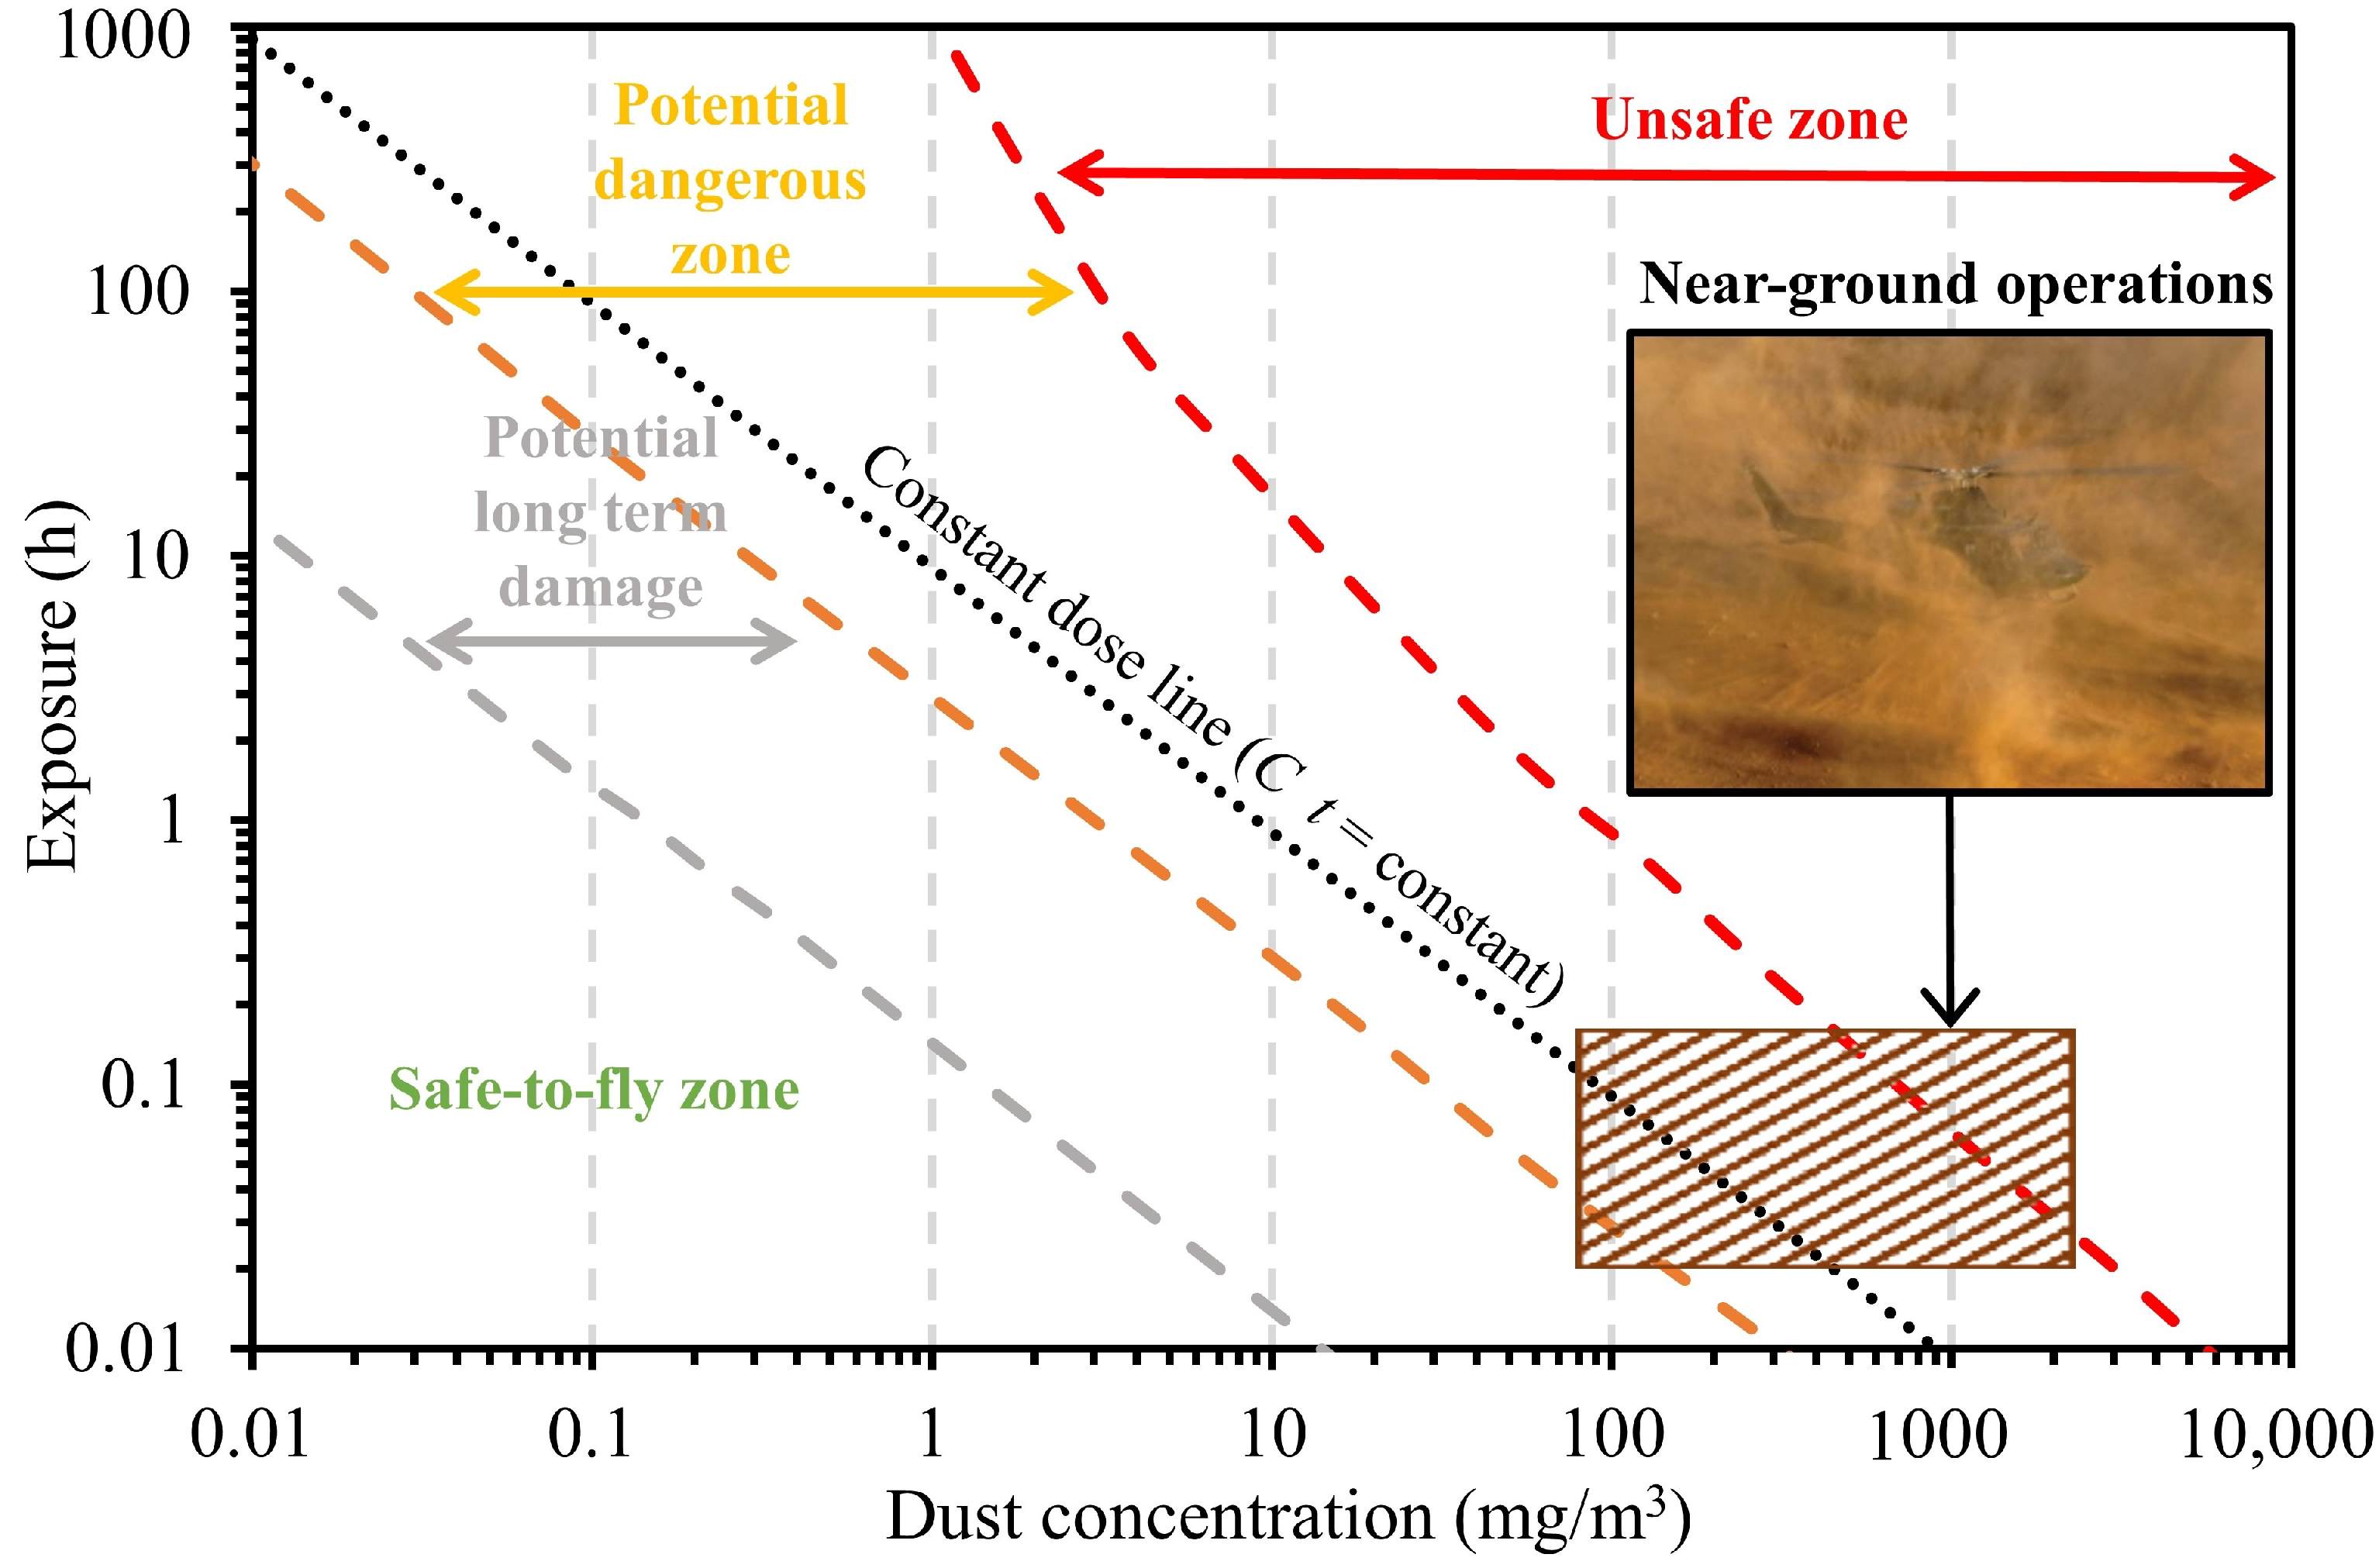
10], the authors related the intensity of the aircraft damages (based on a historical survey) to the dust concentration encountered by the engine, and they proposed a safe-to-fly chart, which resumes the engine potential safety implications. A qualitative reproduction of the safe-to-fly chart is depicted in
Figure 2, showing regions of safe operation, potential long-term damage operation, dangerous operation, and unsafe operation. Despite this chart is explicitly obtained for crashes caused by ash plume ingestion, it can be used to explore the operative ranges where rotorcraft ground operations are located. Due to the high concentration encountered potentially in near-ground operations [
8] and the relatively short time required for these maneuvers to be completed, it seems reasonable to locate the working conditions in the bottom right zone of the chart. A dashed rectangle is superimposed on the region of interest in
Figure 2. As can be noted, these operative conditions overpass the safe-to-fly dose limit (generally assumed equal to 14.4 gs/m
). Repeated cycles in such conditions may bring a progressive accumulation of dust particles and a reduction of the engine performance over time [
14].
The interest in compressor fouling study is twofold: (i) from the maintenance point of view, the prediction of the amount of deposited mass over the gas turbine’s operative life can help to schedule and optimize overhaul and washing operations [
15], leading to a significant reduction of costs; while (ii) from the component design standpoint, a more robust approach may be introduced to minimize the losses derived from fouling [
16]. Experimental and numerical techniques have been employed to reproduce and understand the complex phenomena underlying the particle adhesion on compressor blades and vanes. Experimental works employed mainly cascades [
17] or simplified profiles [
18,
19], while numerical approaches employed Lagrangian tracking techniques in CFD codes to reproduce the particle motion. The multi-phase scheme is coupled with sticking models to reproduce the adhesion phenomena [
20,
21].
In the present work, both experimental and numerical methods were used to gain insight into understanding compressor fouling. The present work scopes are devoted (i) to giving a reliable assessment, through experimental methods, of the mass deposited on the rotating and stationary airfoils of a compressor engine operating in a dust-laden flow and (ii) testing literature based deposition models, by employing numerical methods, for the prediction of the fouling rate on a real machine. The experimental investigation aims to reproduce the operative conditions of near-ground operations (in terms of ingested dose) and measure the mass deposited on the airfoils. The numerical approach, employing different sticking models available in the literature, is proposed as a benchmark for estimating the prediction capability in terms of deposited dust.
2. Materials and Methods
The present section is composed of two parts: the first one aims to describe the test facility and the experimental procedure of the fouling test and deposit collection, while in the second part, the numerical methods and the sticking models are explained in detail.
2.1. Experimental Investigation
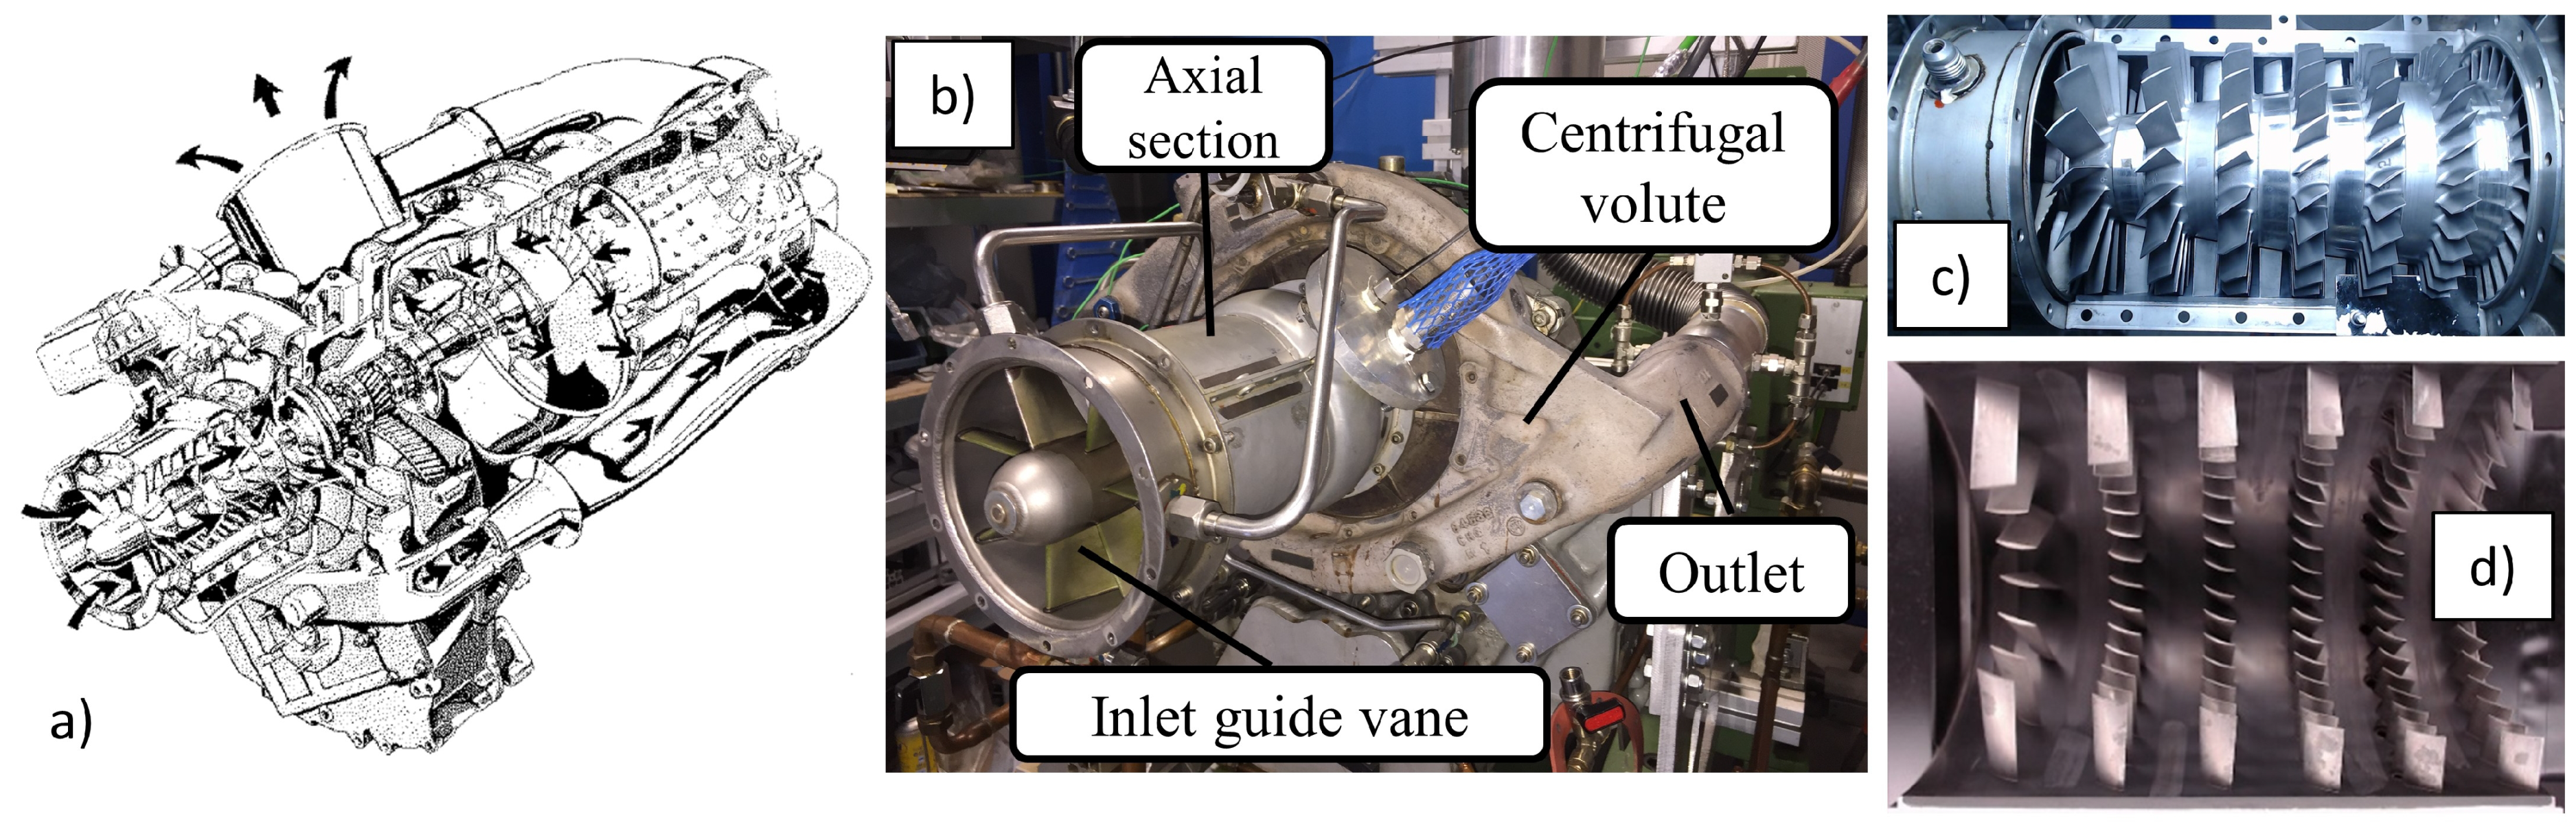
The experimental investigation on particle deposition was carried out on the rotating test bench located in the Fluid Machinery Laboratory of the University of Ferrara, Italy. The test bench mounts the multistage compressor of the Allison 250 C18 engine [
22]. A schematic view of the whole engine is reported in
Figure 3a, while the picture of the compressor test unit is shown in
Figure 3b. The axial part of the compressor unit, thanks to its small size, can be easily dismounted by removing the stator case and allowing direct access to the stator vanes and rotor blades. The pictures of the rotor wheel and stator vanes are reported in
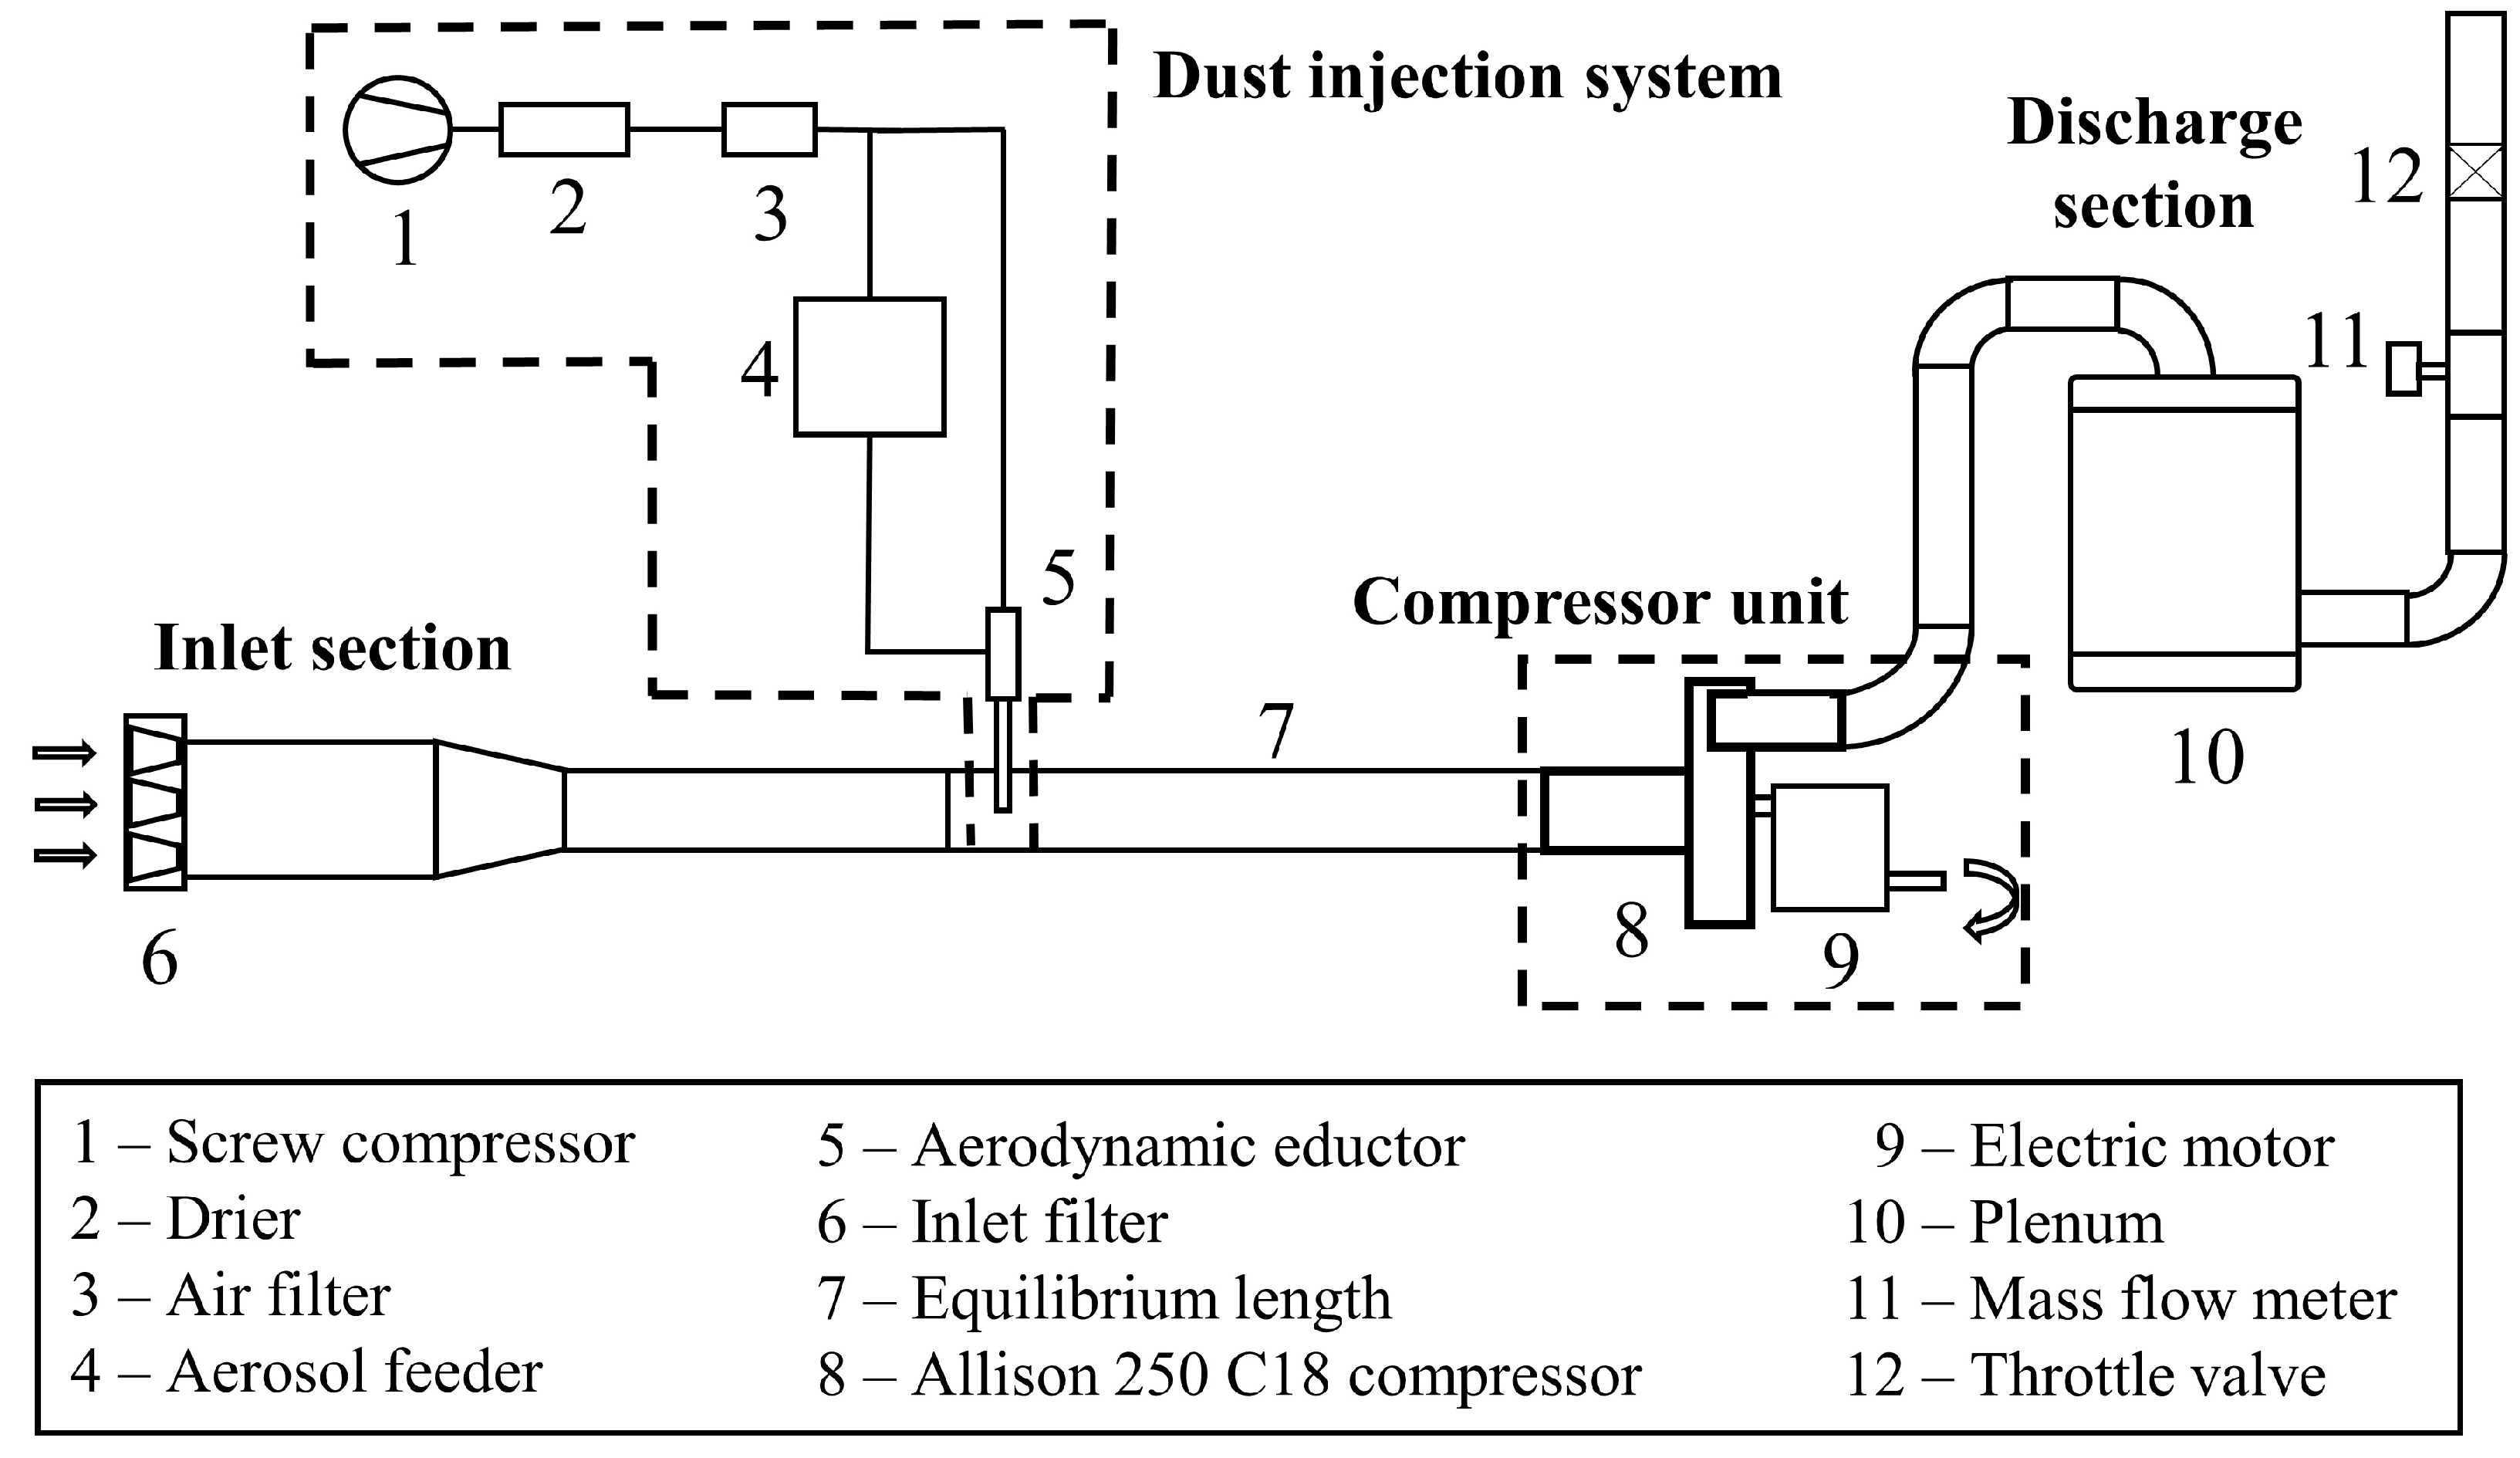
Figure 3c,d. A schematic layout of the test facility is reported in
Figure 4. The same test bench was used for previous investigations about compressor fouling [
14,
23] and washing [
24,
25]. More details are reported there, and the most relevant features are reported here for the sake of completeness.
The compressor unit has an inlet diameter of 0.104 m, and it is equipped with a fixed inlet guide vane (IGV). The compressor has six axial stages and one centrifugal stage. In correspondence with the 5th axial stage, a bleed valve is located, which is closed in the present application. The centrifugal stage has two semivolutes, each with a circular exit duct with a diameter of 0.056 m, and two flexible tubes link the outlet ducts to an exhaust outlet with a diameter of 0.100 m. An electric motor drives the compressor. The pressure ratio achieved at nominal operative conditions is 6.2, with a rotational speed of 51,600 rpm and a mass flow rate of 1.36 kg/s. The discharge section is composed of a plenum, a mass flow meter, and a throttle valve.
The test bench is equipped with a dust injection system, which provides a constant and controlled amount of contaminants toward the compressor’s inlet. The system is driven by shop air provided by a screw compressor, which is equipped with a dryer and a set of filters to provide dry and clean air. The aerosol feeder, the SAG 410 Ultra-low Flow model, made by TOPAS GMBH, provides a continuous and precise dosage of the powder mass. An eductor is employed to disperse the dust, previously dosed by the feeder, into the compressor pipeline. Before entering the compressor unit, a 2 m length equilibrium tube was used to ensure the kinetic equilibrium between particles and air. This section ensures the proper mixing process to reach a uniform particle concentration at the compressor inlet. At the test bench inlet section, a compact filter EPA F9 class is placed to remove any possible contamination from the outside.
2.1.1. Test Conditions
To reproduce the operative conditions encountered during ground and near-ground operations of rotorcraft engines in dusty environments, the concept of the dose of ingested contaminants (discussed in
Section 1) was adopted. According to the operative range reported in
Figure 2 for such operations, a representative dose value of 9.5 mg s/m
was selected. This value corresponds to the constant dose line reported in
Figure 2.
The contaminant selected for this experimental test was the Arizona Road Dust (ARD) Nominal 0–3 μm (with a mean diameter of 1.1 μm and with 90% of the particles below 1.9 μm) provided by Powder Technology Inc. and obtained in agreement with ISO 12103-1:2016 [
26]. The present contaminant is well-suited for compressor fouling tests due to its fine diameter distribution. More information about the ARD’s physical and chemical properties, employed in the present campaign, can be found in [
23].
The compressor unit was kept at 20,000 rpm, corresponding to a mass flow rate swallowed of 0.33 kg/s. This value of the corrected rotational speed corresponds to a sub-idle condition for the engine, which is a typical operative point in ground operations. The test facility is located in a closed room where the air was maintained at constant conditions of 22 ± and 50% RH ± 3% RH during the test. The compressor was operated for 30 min with a constant dust mass flow rate ingested of 5.13 mg/s, leading to a concentration of 19 mg/m. Hence, the total mass ingested by the compressor was 9 g. After the particle ingestion operation, the case of the axial section of the compressor was disassembled, and the deposit collection process was carried out.
2.1.2. Deposit Collection Technique
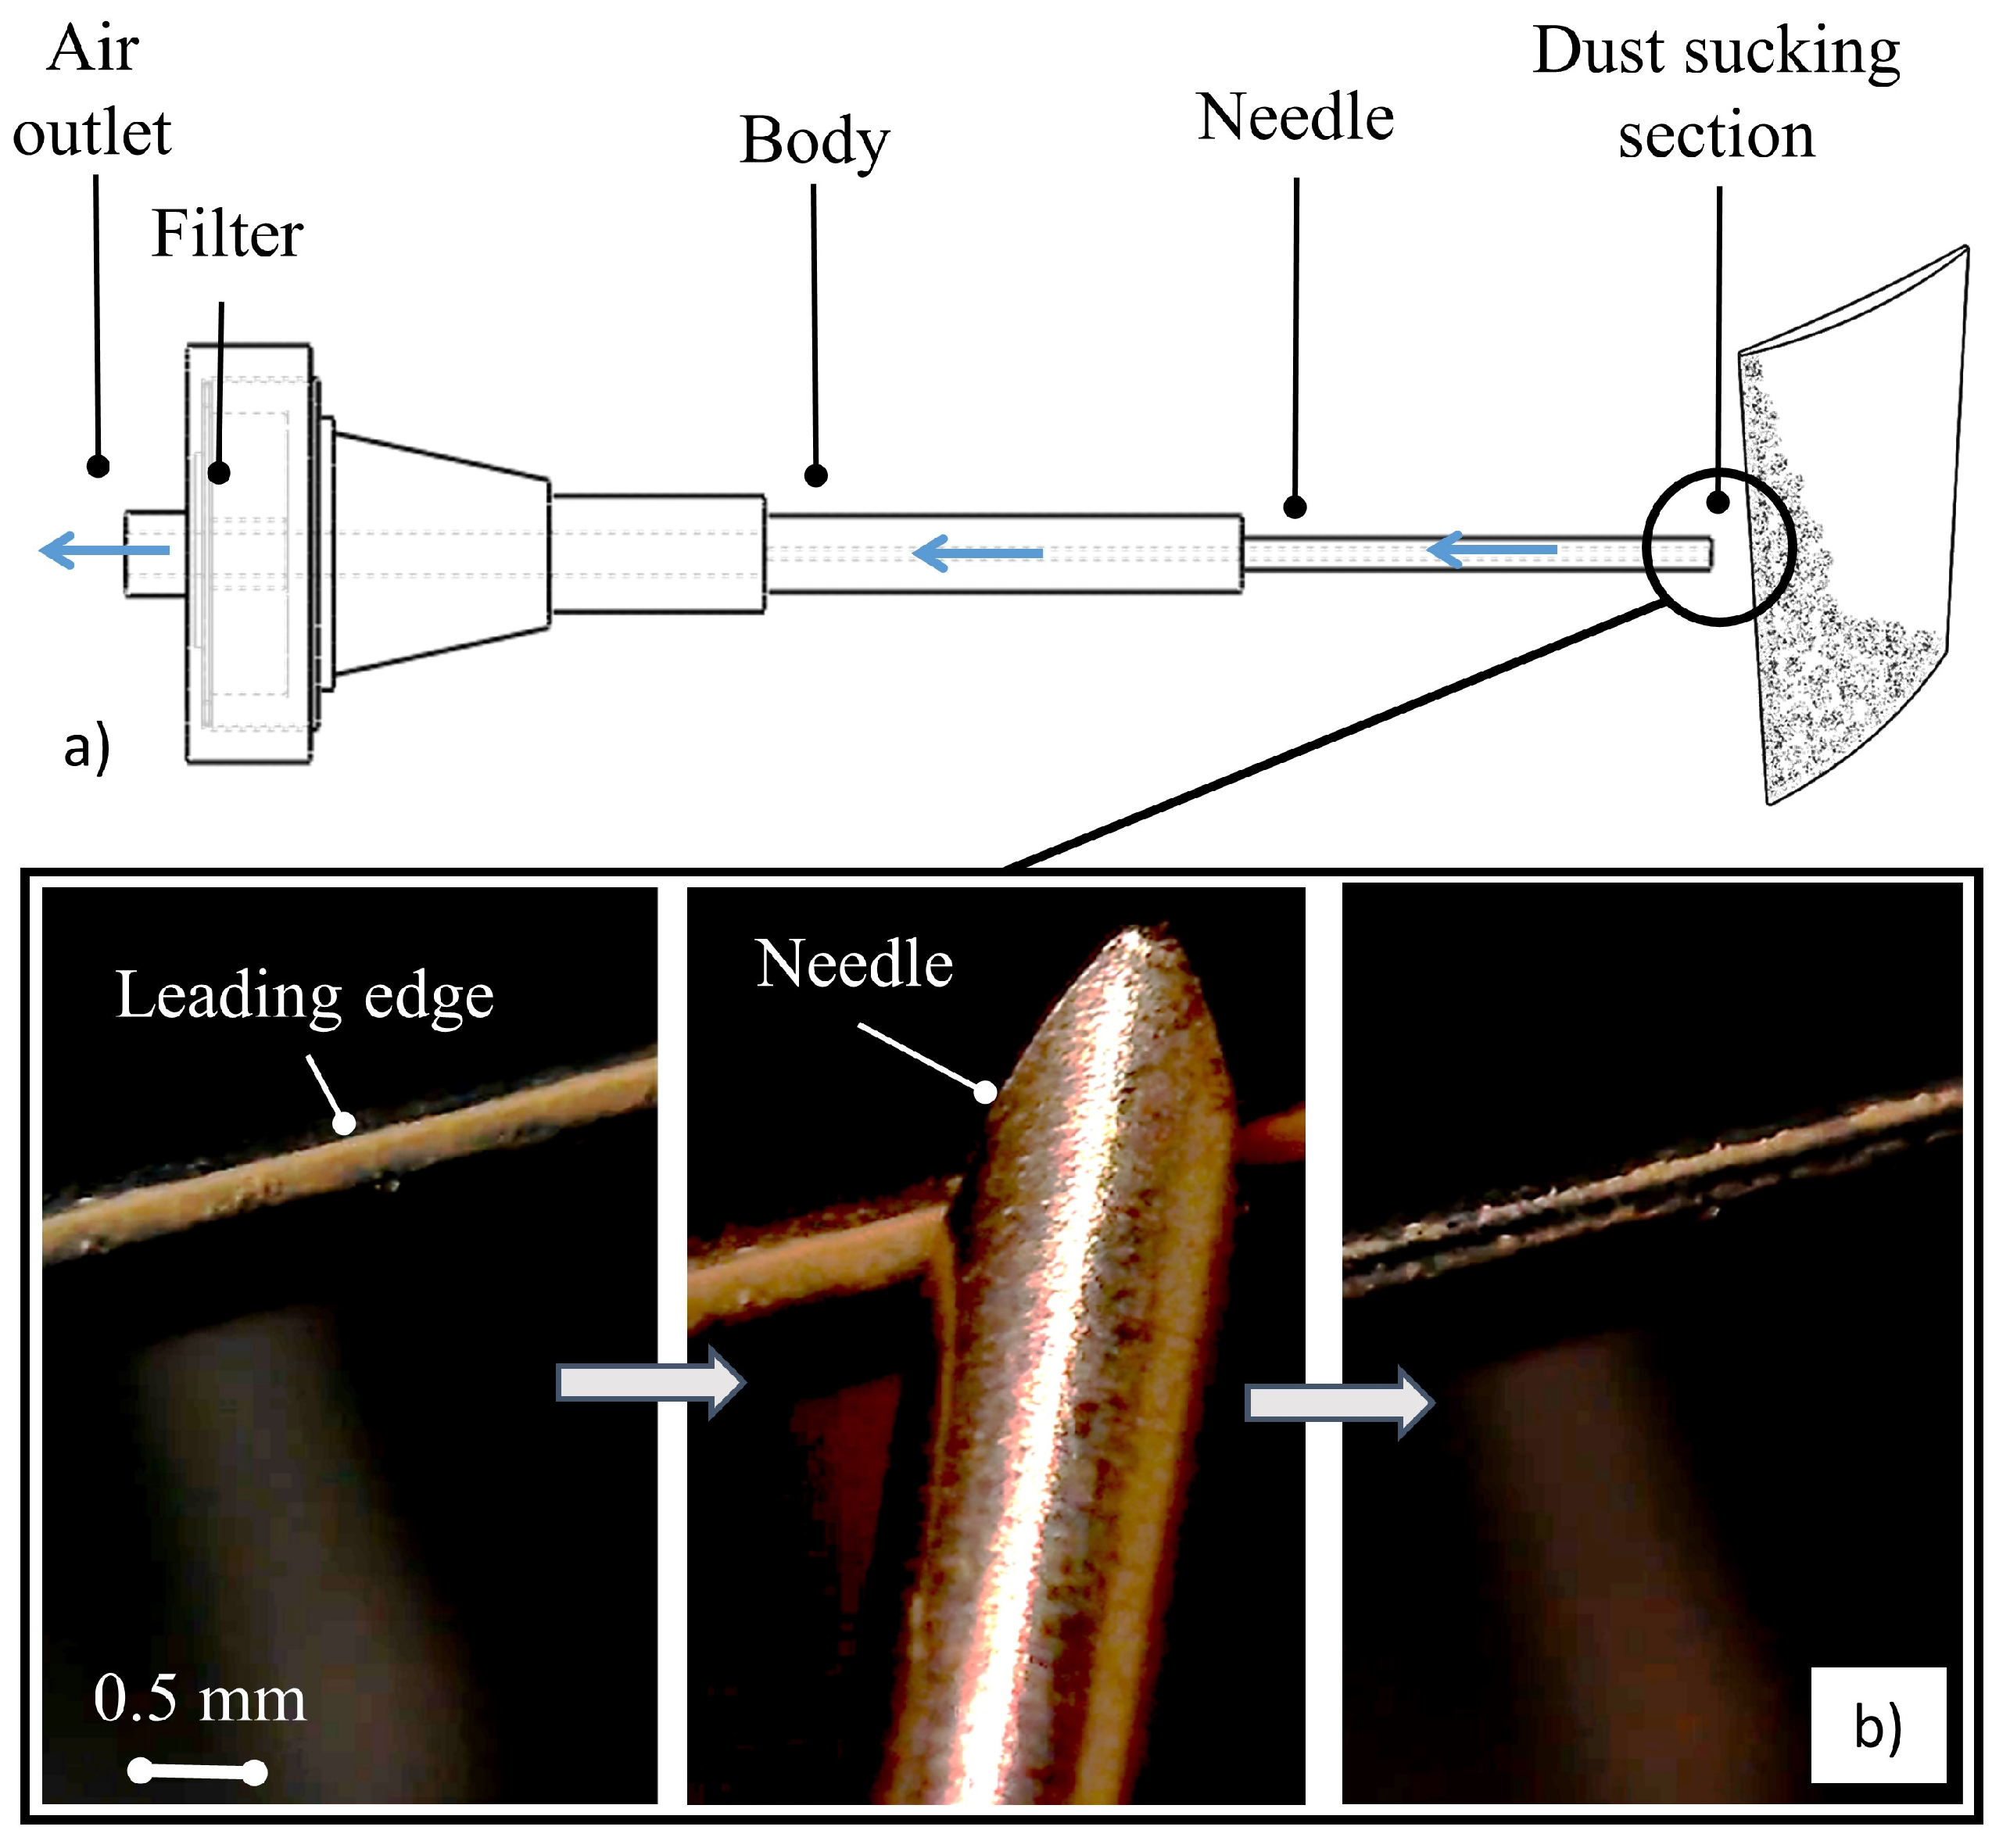
The dust adhered on the compressor vanes and blades after the fouling process was measured employing an purposely designed device, the localized aspirator for particle observation (LAPO). The schematic view of the LAPO is depicted in
Figure 5. This device is employed for particle sucking and collection from surfaces. It is driven by a vacuum pump (not shown in
Figure 5). Thanks to its characteristics of compactness (100 mm total length) and lightness, the LAPO can be quickly oriented by the operator towards the compressor region to be analyzed. One of the LAPO’s main components is the stainless steel needle, with an outer diameter of 1 mm, which ensures a direct particle sucking from the surface of interest. As shown in
Figure 5, the needle, thanks to its thinness, can collect the powder in a very accurate manner from the surfaces. In
Figure 5, the deposit collection operation from a leading edge is shown.
The LAPO is equipped with a filter that allows particle trapping, collection, and offline weighing. The filter type is a Grade 589/3 paper filter with a thickness of 0.15 mm, provided by Whatman plc. The filter remained locked and sealed during the sucking operation thanks to the coupling of the body’s two parts through a screwed profile. At the end of the particle collection, the device was unscrewed, and the filter was removed and weighed. The weighing process was done employing the analytical balance Kern ABT 100-5NM model, with a resolution of 0.01 mg. The LAPO’s particle collection capability was tested by sucking a dosed amount of ARD previously deposited on a test surface. An excellent capability to collect and trap the deposited particles was observed: the difference between the filter collected mass and the deposited mass was lower than 2%. Employing this collection technique, three zones of airfoils were analyzed: the leading edge (LE), the pressure side (PS), and the suction side (SS). The deposit collection operation was repeated for all the compressor airfoils of the stages (the IGV, the six stator vanes, and the six rotor blades). To improve the consistency of the present method, the deposit mass values, reported in the following section, result from the averaging process carried out by collecting the deposits on the surfaces belonging to the same row. This operation simplifies the weighing process and reduces the uncertainty of the entire deposit measurement.
2.2. Numerical Approach and Sticking Models
The starting point of the numerical investigation is the result obtained by Aldi et al. [
27]. The Allison 250 C18 axial compressor section’s numerical simulations were carried out employing the commercial CFD code ANSYS CFX 13.0 [
28], and all the details related to the CFD model were reported in [
27]. For the scope of the present work, a multi-phase simulation was carried out. The solution approach for the particle trajectory calculation was based on a mathematical model with Eulerian conservation equations for the continuous phase and a Lagrangian frame to simulate a discrete second phase. After the simulation of the gas flow field, the trajectories of individual particles were tracked by integrating a force balance equation on the particle. All the details related to the multi-phase numerical approach can be found in [
29]. A total of 500,000 representative particles were injected at the compressor inlet section in the present work, employing the proper particle size distribution. The particle tracking allows predicting the coordinates, velocity, and angle of the particle impacts on surfaces of interest. Once the particles’ impact properties are established, the implementation of a sticking model is essential for predicting whether the particle sticks to the surface or not. In the present work, two different models were implemented: Poppe et al.’s model [
30] (including an addition related to the detachment effect), named in the present work as the silica carbide adhesion (SCA) model, and the Ohio State University (OSU) model [
31]. The equations and the assumption based on these models are explained in detail in the following sections.
2.2.1. SCA Model
The experimental investigation carried out by Poppe et al. [
30] and performed using micrometric silicon carbide particles impacting on a silica target provided an empirical relation for the calculation of the probability (sticking probability) of a particle adhering to a surface, based on its normal impact velocity value. The successful implementation of such a model to estimate the fouling rate on the NASA Rotor 37 can be found in [
21]. The sticking probability (
) is calculated as follows:
where
is the normal component of the particle impact velocity. As can be noted from Equation (
1), the sticking probability values go from 0 to 1. According to the approach reported in [
32], after the calculation of the sticking probability value, the result was compared to a chosen random number in the range [0,1] with a Gaussian distribution. If the random number is greater than the calculated value of the sticking probability, the particle does not stick, and vice versa. Through the application of this approach, the stochastic nature of the deposition process was taken into account.
The SCA model can be extended to include the contribution of the detachment effect. Following a similar approach reported in [
33], the relation derived by Konstandopoulos [
34] was implemented to account for a critical impact angle (
) based on an energy balance between the tangential kinetic energy of the particle and the minimum energy required to break its contact area with the surface. The expression for the critical angle is:
where
is the tangential component of the particle impact velocity,
f is the friction coefficient between the particle and the surface,
is the Poisson’s ratio of the particle-surface pair, and
is a numerical constant (a suggested value is 0.63). The addition of the critical angle formulation to the sticking model acts as a filter for the particle deposition: if the impact angle exceeds the critical value, the particle is not supposed to stick on the wall (leading to a null value of the sticking probability). Depending on the presence or not of a third substance at the interface between particle and substrate, the values of
f and
shall be modified. In dry conditions (absence of a third substance at the particle-substrate interface), the values of 0.5 and 0.3 are assigned to
f and
, respectively. If a liquid layer is located between the particle and substrate, the value of
becomes 0.4, while the friction coefficient is calculated according to the relation:
where
is the particle Reynolds number, defined as:
where
is the particle material density,
is the particle diameter, and
is the liquid viscosity.
2.2.2. OSU Model
Bons et al. [
31] proposed a theoretical model for the prediction of rebound and deposition in gas turbine engines. The model accounts for the particle elastic-plastic deformation, adhesion, and shear removal. Thanks to its explicit and parametric formulation and the particle material properties’ dependence, the model is general and well-suited for the implementation in CFD codes. Unlike the SCA model, which foresees the sticking probability’s computation, the OSU model is based on the calculation of the normal component of the coefficient of restitution (
).
is defined as the ratio between the kinetic energy of the rebounding particle (
) and the kinetic energy of the impacting particle (
). In the OSU model, the particle is modeled as a cylinder, which is deformed when it impacts the surface. The particle impact can be defined as elastic, if the deformation (
w) remains below its critical value (
), or plastic, if the deformation exceeds it. The critical value of the deformation depends only on the particle material properties, and it is defined as:
where
is the particle yield stress,
is the composite Young modulus, and
l is equal to
. The composite Young modulus is calculated according to the following relation:
where
and
are the Poisson’s ratio and Young’s modulus of the particle and
and
are the Poisson’s ratio and Young’s modulus of the wall material.
The normal component of the rebounding particle kinetic energy (
) can be computed as:
where
is the normal component of the impacting particle kinetic energy,
is the work of adhesion,
is the maximum elastic energy storage, and
is the drag moment of the shear stress acting on the particles. The formulation of the maximum elastic energy storage is:
where
V is the volume of the particle. The expression of the work of adhesion is the following:
where
is the surface free energy and
is the contact radius, which can be derived from the expression of the contact area through the relation
. The contact area is derived employing a semi-empirical relation:
where
is the maximum plastic deformation of the particle and
is the particle contact area at the end of the elastic deformation (
). The constants
a,
b, and
c have the values of
,
, and
, respectively. The maximum plastic deformation of the particle can be calculated employing the following relation:
Finally, the drag moment in Equation (
7) is computed as:
where
is the air density,
is the wall shear velocity, and
is the air viscosity. The knowledge of the normal component of the kinetic energy values at the impact (
) and rebound (
) stages allows calculating the normal component of the coefficient of restitution (
) for the particle, according to the relation:
If the calculation returns zero, the particle sticks to the surface, and vice versa, a rebound occurs.
The OSU model is based on the particle and wall material constants. The use of widespread engineering materials (such as steel, aluminum alloy, titanium alloy, etc.) in the machining of the compressor components makes the mechanical properties of the wall easy to obtain. In contrast, the values of the particle material properties are characterized by a certain degree of uncertainty, which may affect the reliability of the sticking model results. The mechanical properties of the particles, employed in the present study, were taken from [
31], while the wall material properties refer to those of a stainless steel. The numerical values of the material properties are reported in
Table 1.
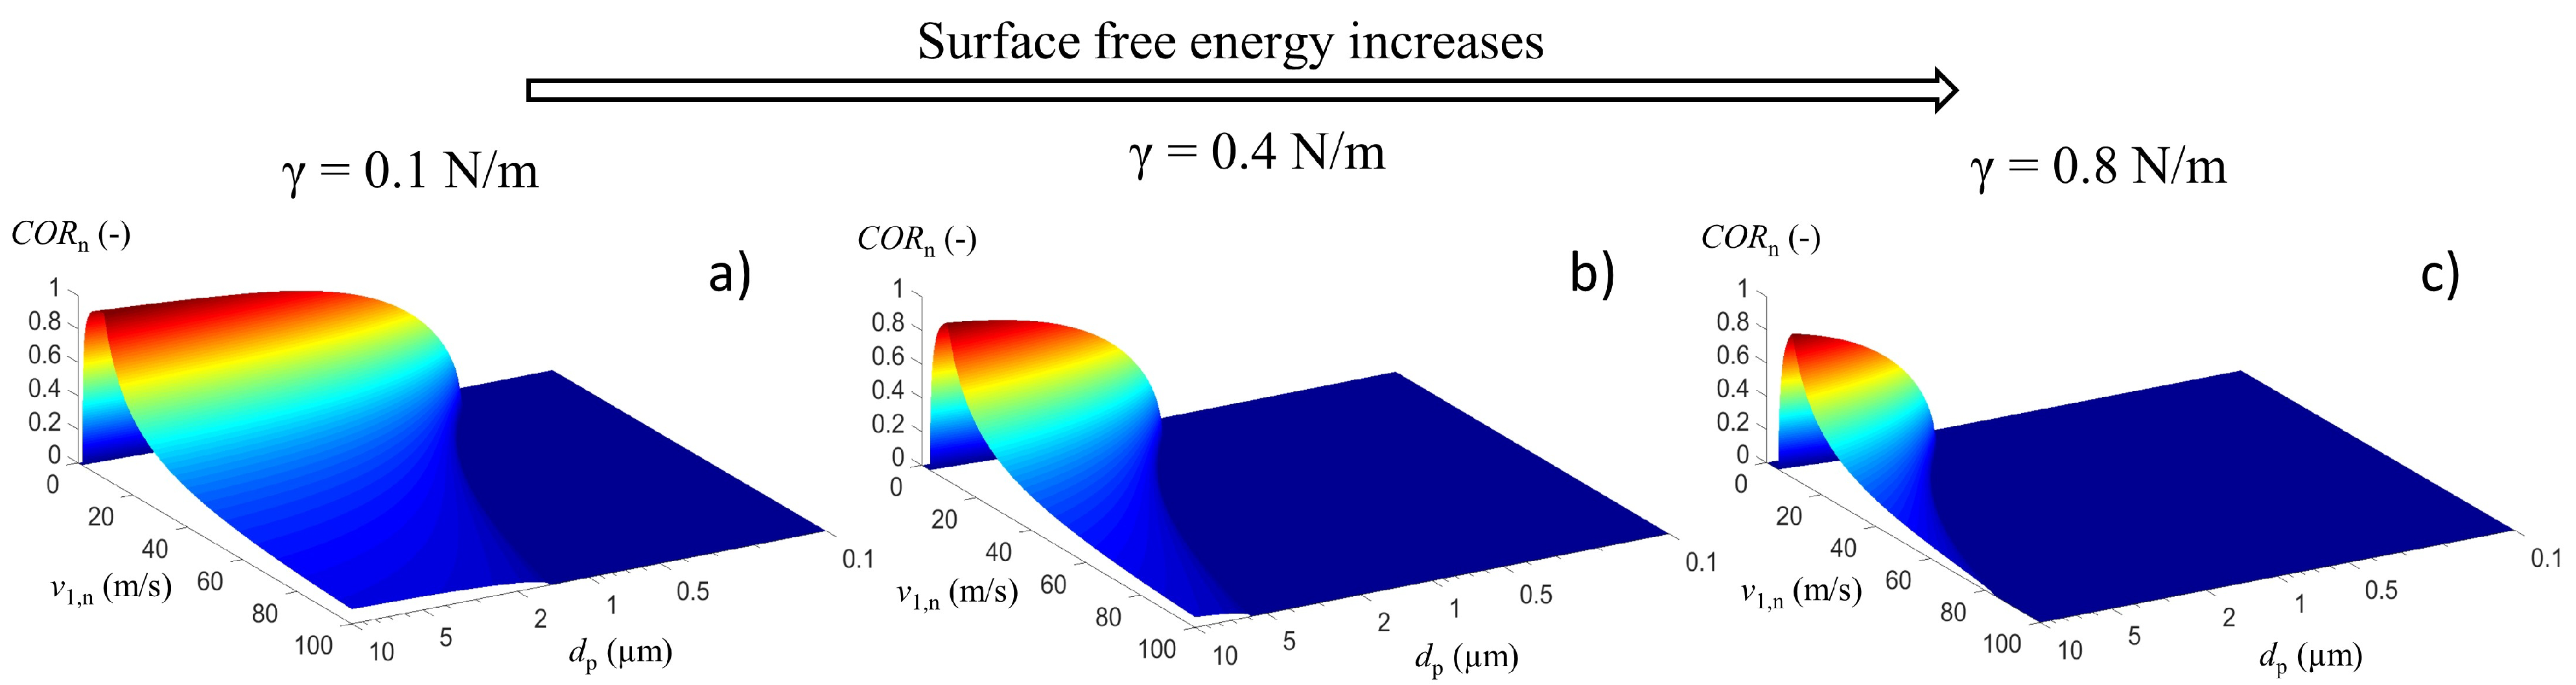
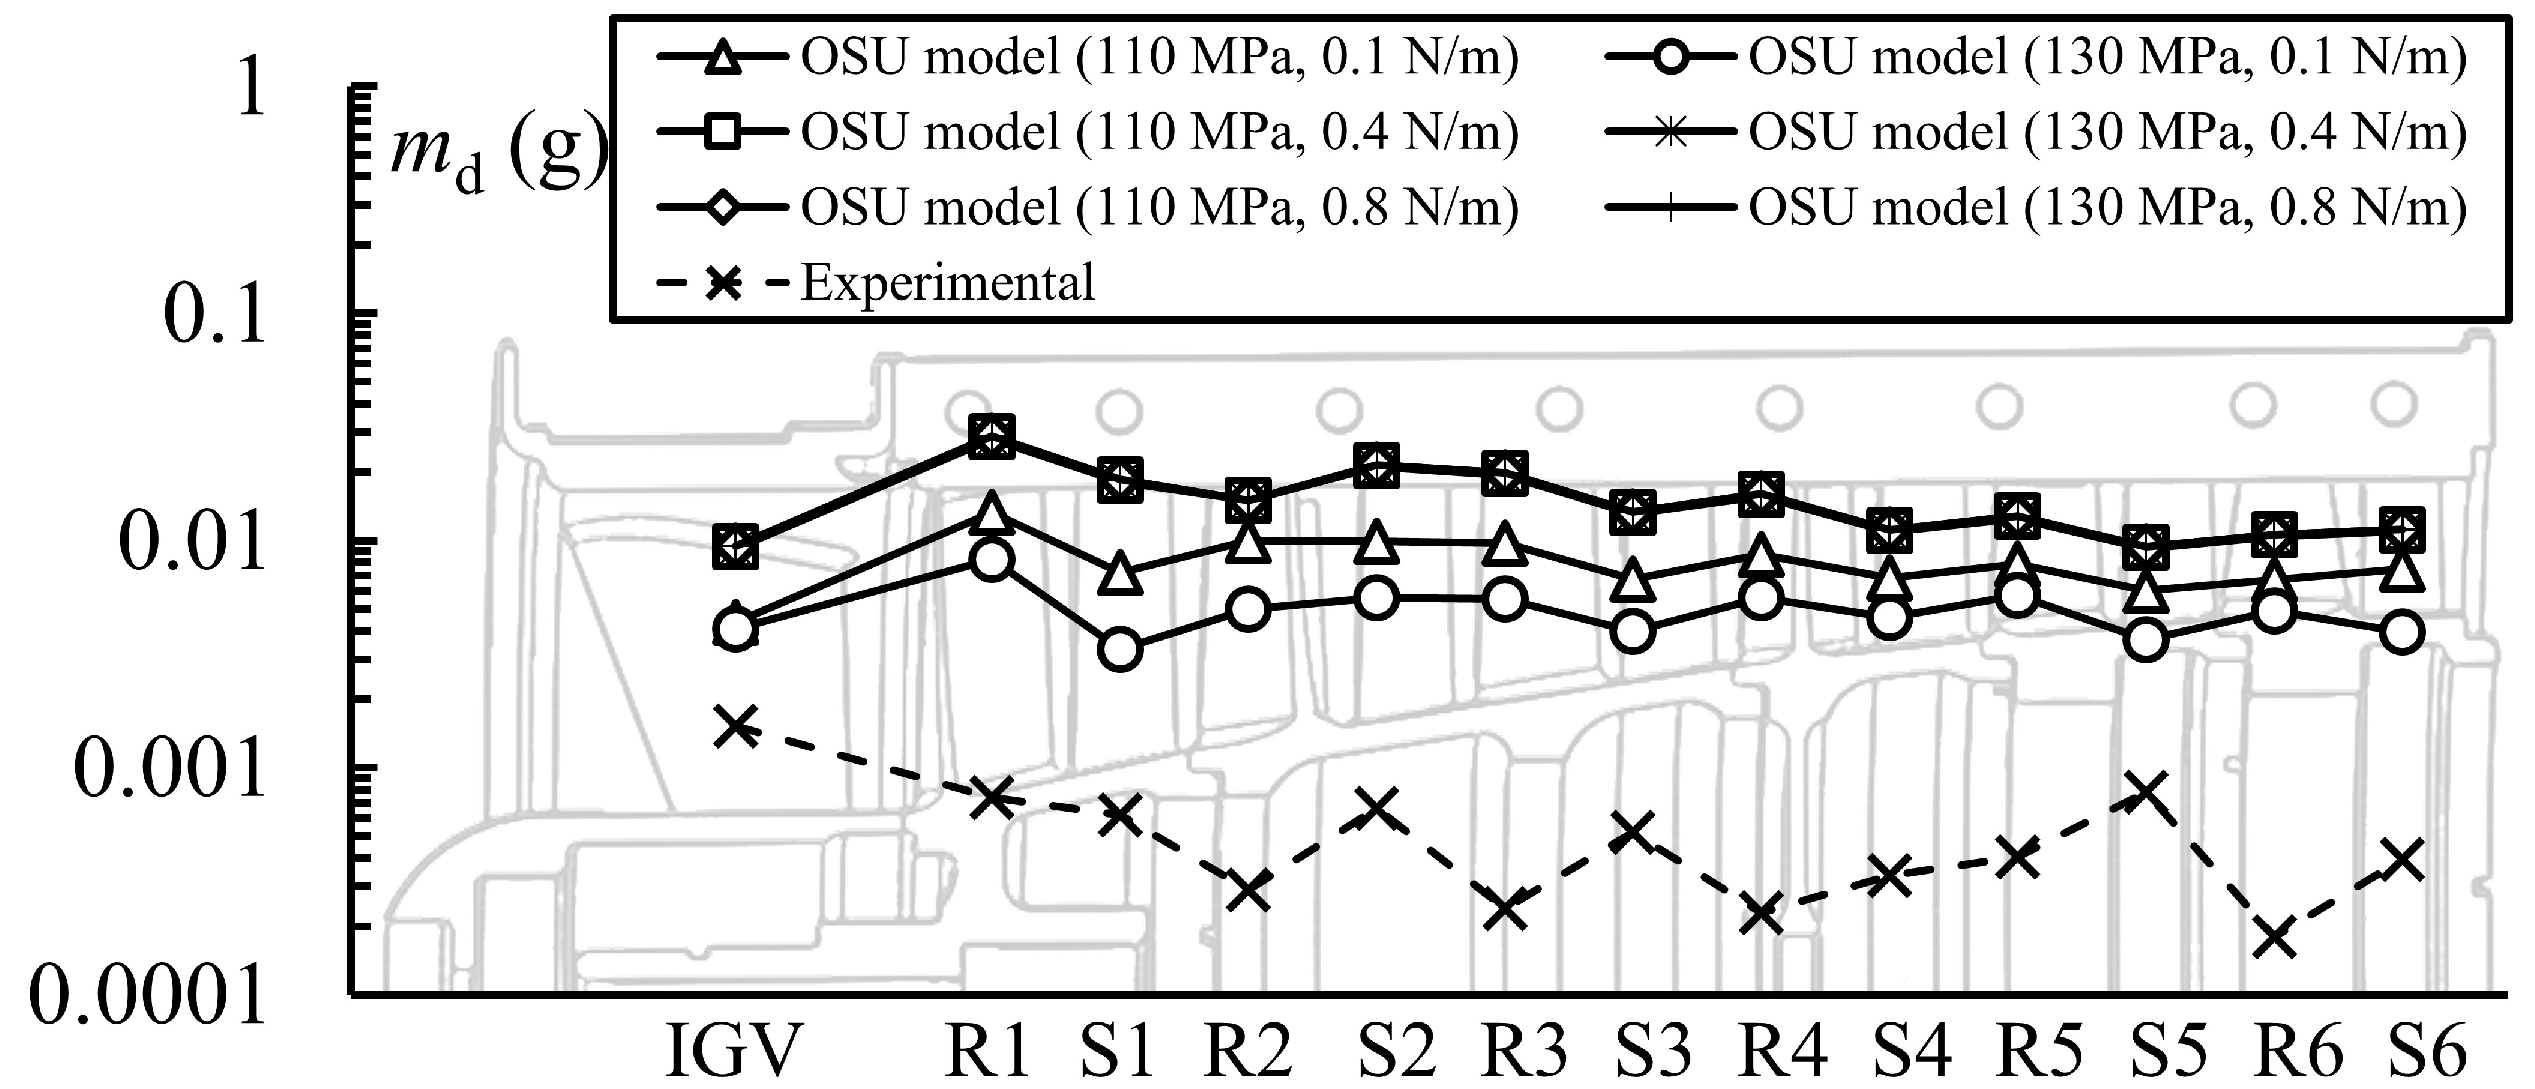
Bons et al. [
31] suggested a fixed value of the surface free energy (
) equal to 0.8 N/m. Such a parameter is difficult to evaluate, and in the present study, three values of
were considered: 0.8 N/m, which is the value suggested in [
31]; 0.4 N/m, which is a value obtained according to the low of mixtures for ARD in [
35]; and 0.1 N/m, which is an arbitrary value, chosen to extend the sensitivity analysis.
In
Figure 6, the surface plot of
as a function of the particle diameter and normal impact velocity is proposed. The charts refer to three values of
equal to 0.1 N/m (
Figure 6a), 0.4 N/m (
Figure 6b), and 0.8 N/m (
Figure 6c).
has been reported for a fixed value of
equal to 15 m/s, which is an intermediate value between those reported in [
31]. The increase of the surface free energy value leads to an overall decrease of
towards null values for the finest particles. This behavior is strictly related to the high value of the work of adhesion obtained for the finest diameter range, which overrides the kinetic energy available for the rebound in Equation (
7).
4. Conclusions
In this work, a comprehensive study of micrometric particle adhesion on the airfoils of a rotorcraft engine compressor is carried out. The research aims to assess the fouling rate of the compressor rotor blades and stator vanes employing experimental and numerical methods.
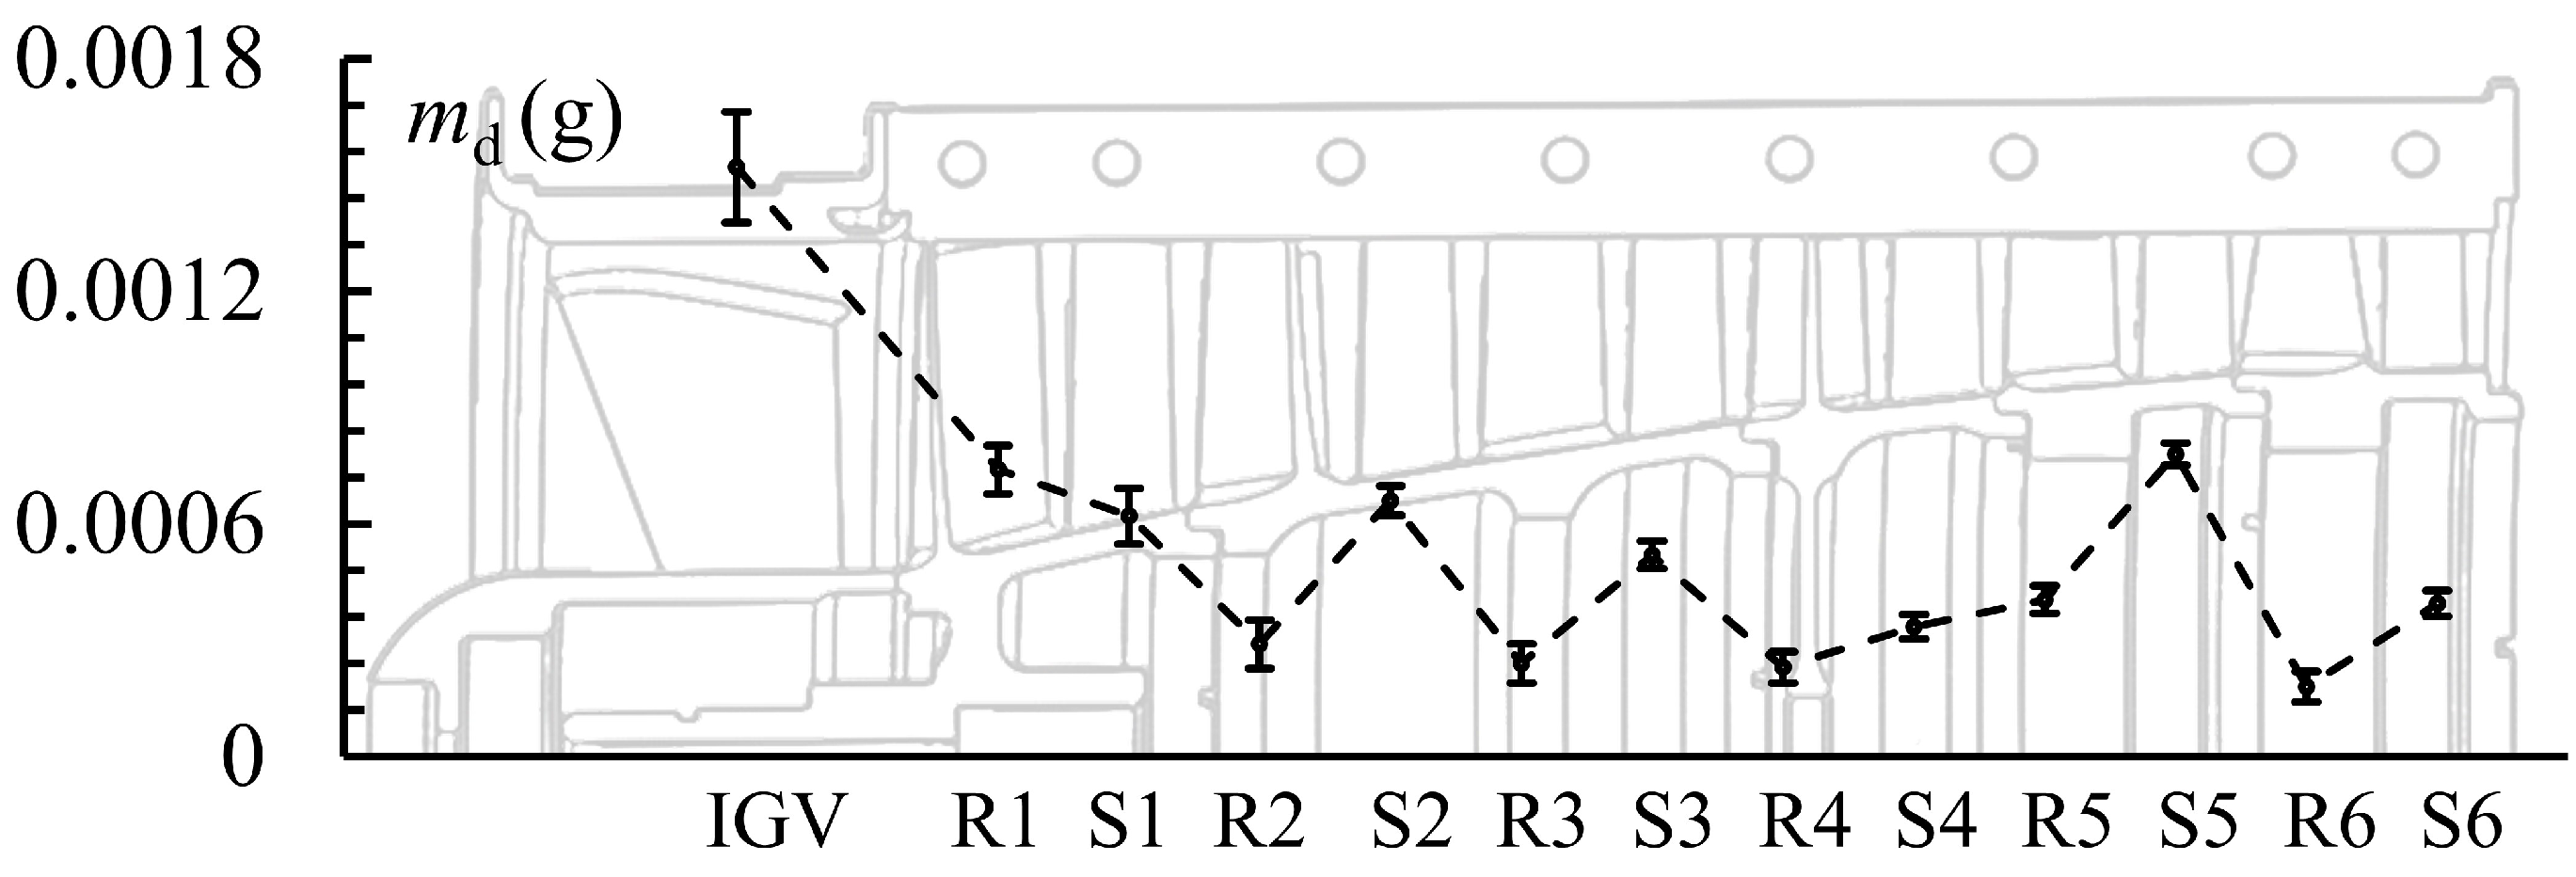
The experimental test is carried out on a rotating test facility, which mounts the Allison 250 C18 engine compressor, by injecting micrometric test powder to simulate a ground-idle operation. At the end of the test, the collection of the deposits from the airfoils is provided. The particle collection and measurement operations show that the deposited mass on the airfoils decreases towards the compressor’s last stages, where the high velocity promotes rebound instead of deposition. By comparing the total mass collected from the airfoils to the mass swallowed by the compressor, it can be assessed that almost 1.6% of the total ingested mass sticks to the vanes and blades.
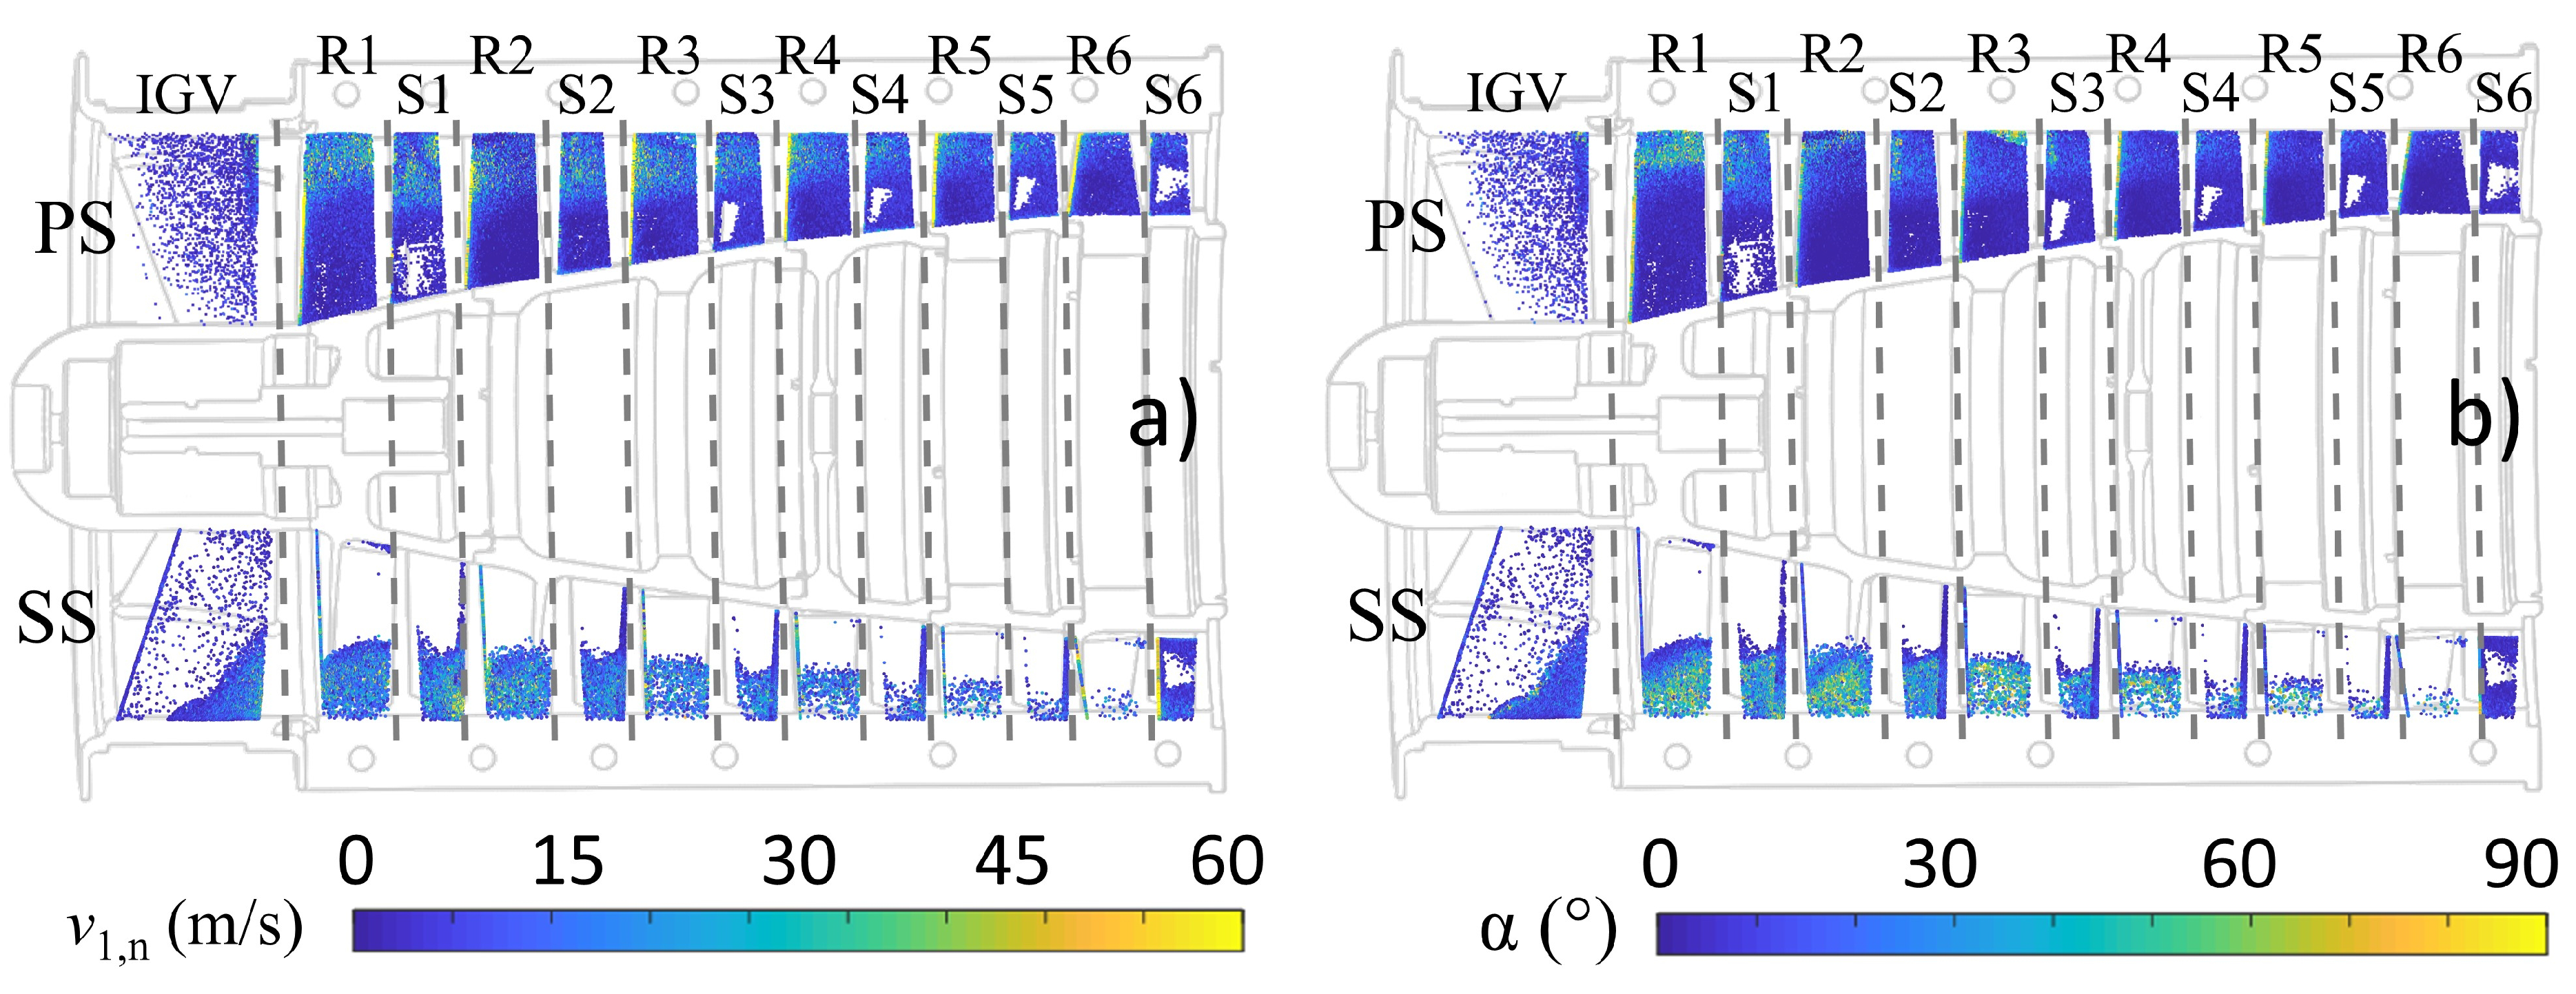
Two sticking models available in the literature are implemented, employing numerical methods, with the aim to test their capability to predict the fouling rate on the airfoil surfaces. From the comparison between the numerical flow field, numerical impact zones, and the observed patterns, it seems that the presence of separation zones is responsible for the increase of the particle adhesion in a portion of the airfoils. The results of the sticking model implementation lead to the systematic overestimation of the mass deposited on the compressor airfoils. Regardless, the numerical results seem to be in line and give a good agreement in terms of relative results.
The spread between the experimental measurements and the numerical findings may be related to the complexity of fine particle tracking and the selection of reliable numerical constants for the sticking/rebound models. Even if the spread between numerical and experimental findings may be significant, the results could still be acceptable for industrial purposes in order to assess the fouling rate on a real machine.
Further research should be addressed to the investigation of the effects that promote detachment and rebound of particles and their reliable implementation in the CFD environment.


