1. Introduction
Advancements in space technologies have opened new perspectives for exploration and resource utilization in outer space. Among these technologies, electric propulsion is expected to be widely used in the near future [
1,
2]. Indeed, the Hall thruster technology [
3] is already in use for satellite maneuvers, station-keeping, and large constellations [
4]. Additionally, the developments of spacecraft power generation and management systems in recent years have augmented the available on-board power, which can be used to supply high-power Hall thrusters [
5]
Over the last four decades, several high-power Hall thruster prototypes with nominal discharge powers higher than 10 kW have been developed and tested [
6,
7,
8,
9,
10,
11,
12,
13,
14,
15]. However, the complete development of such devices relies on the possibility of their testing in adequate on-ground vacuum facilities with proper pumping speed and dimensions. Examples of state-of-the-art vacuum chambers suited for high-power Hall thruster testing are NASA’s Vacuum Facility 5 (VF5) and VF6 at Glenn Research Center (GRC) with a 700 m
3/s pumping speed on xenon [
16,
17], the Large Vacuum Test Facility (LVTF) at the University of Michigan [
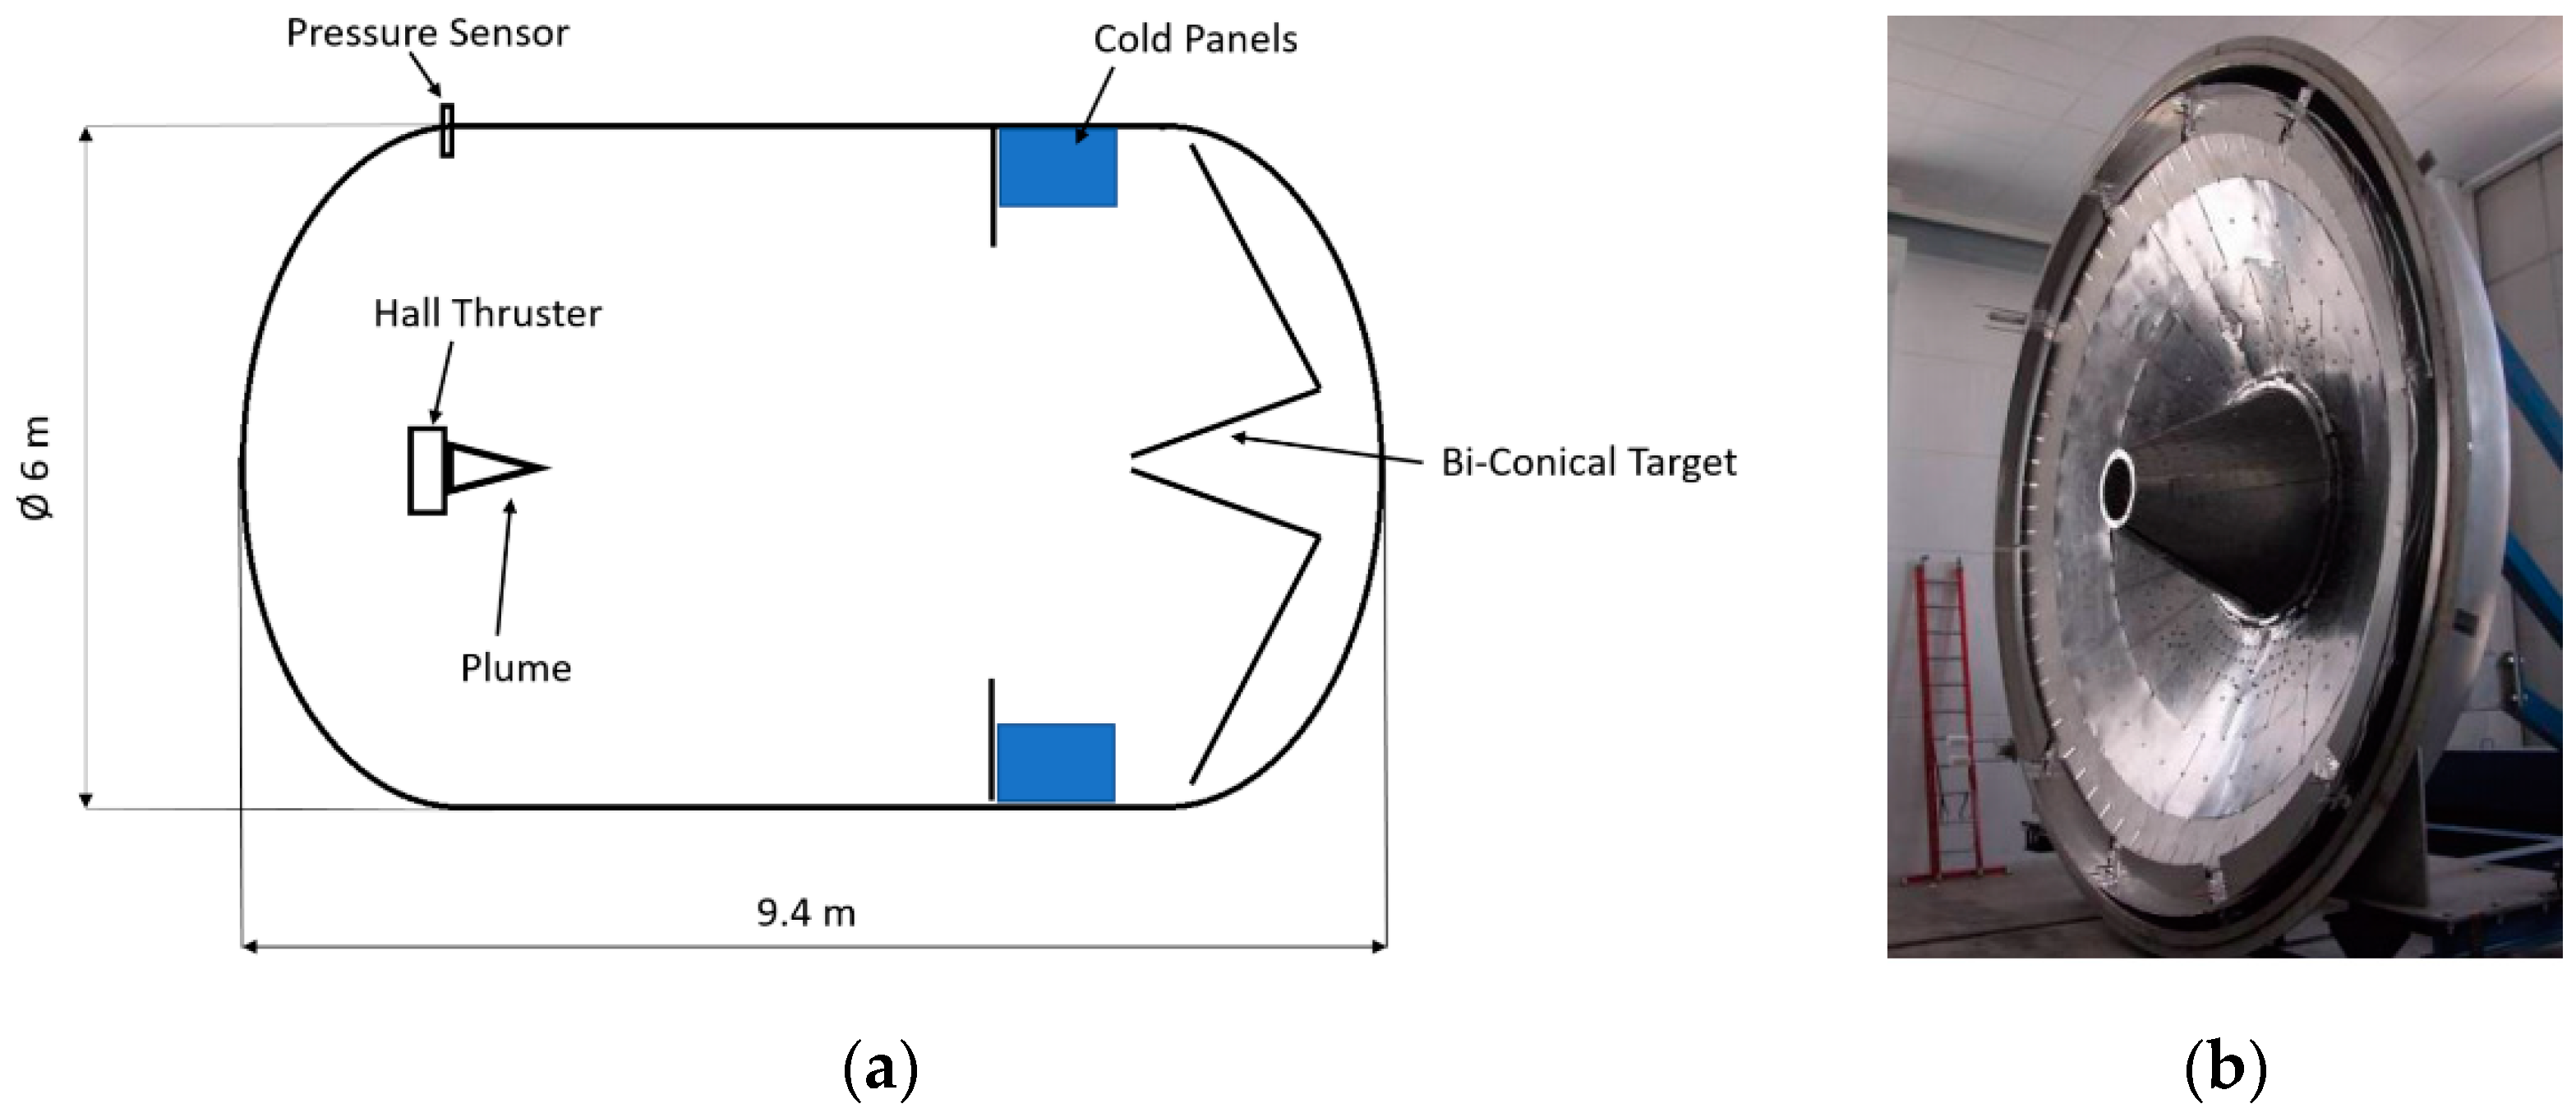
18], and the SITAEL’s IV10 vacuum facility, the largest chamber for electric propulsion testing in Europe with a 6-m diameter and nearly 10-m length envelope [
19].
Though these state-of-the-art chambers allow for vacuum pressures as low as 10
−4 Pa when operating a high-power Hall thruster, these vacuum levels are still several orders of magnitude higher than that of outer space. This relatively high residual pressure affects the performance characterization results in several ways. In the past, the Randolph’s criterion [
20] considered 6 × 10
−3 Pa as a maximum limit in the background pressure for Hall thruster testing. Beyond this value, the ingested mass flow rate coming from the chamber would be larger than the accuracy of the standard laboratory mass flow controllers. However, this consideration was derived from a simple modeling of the random thermal flux of the neutrals inside the chamber.
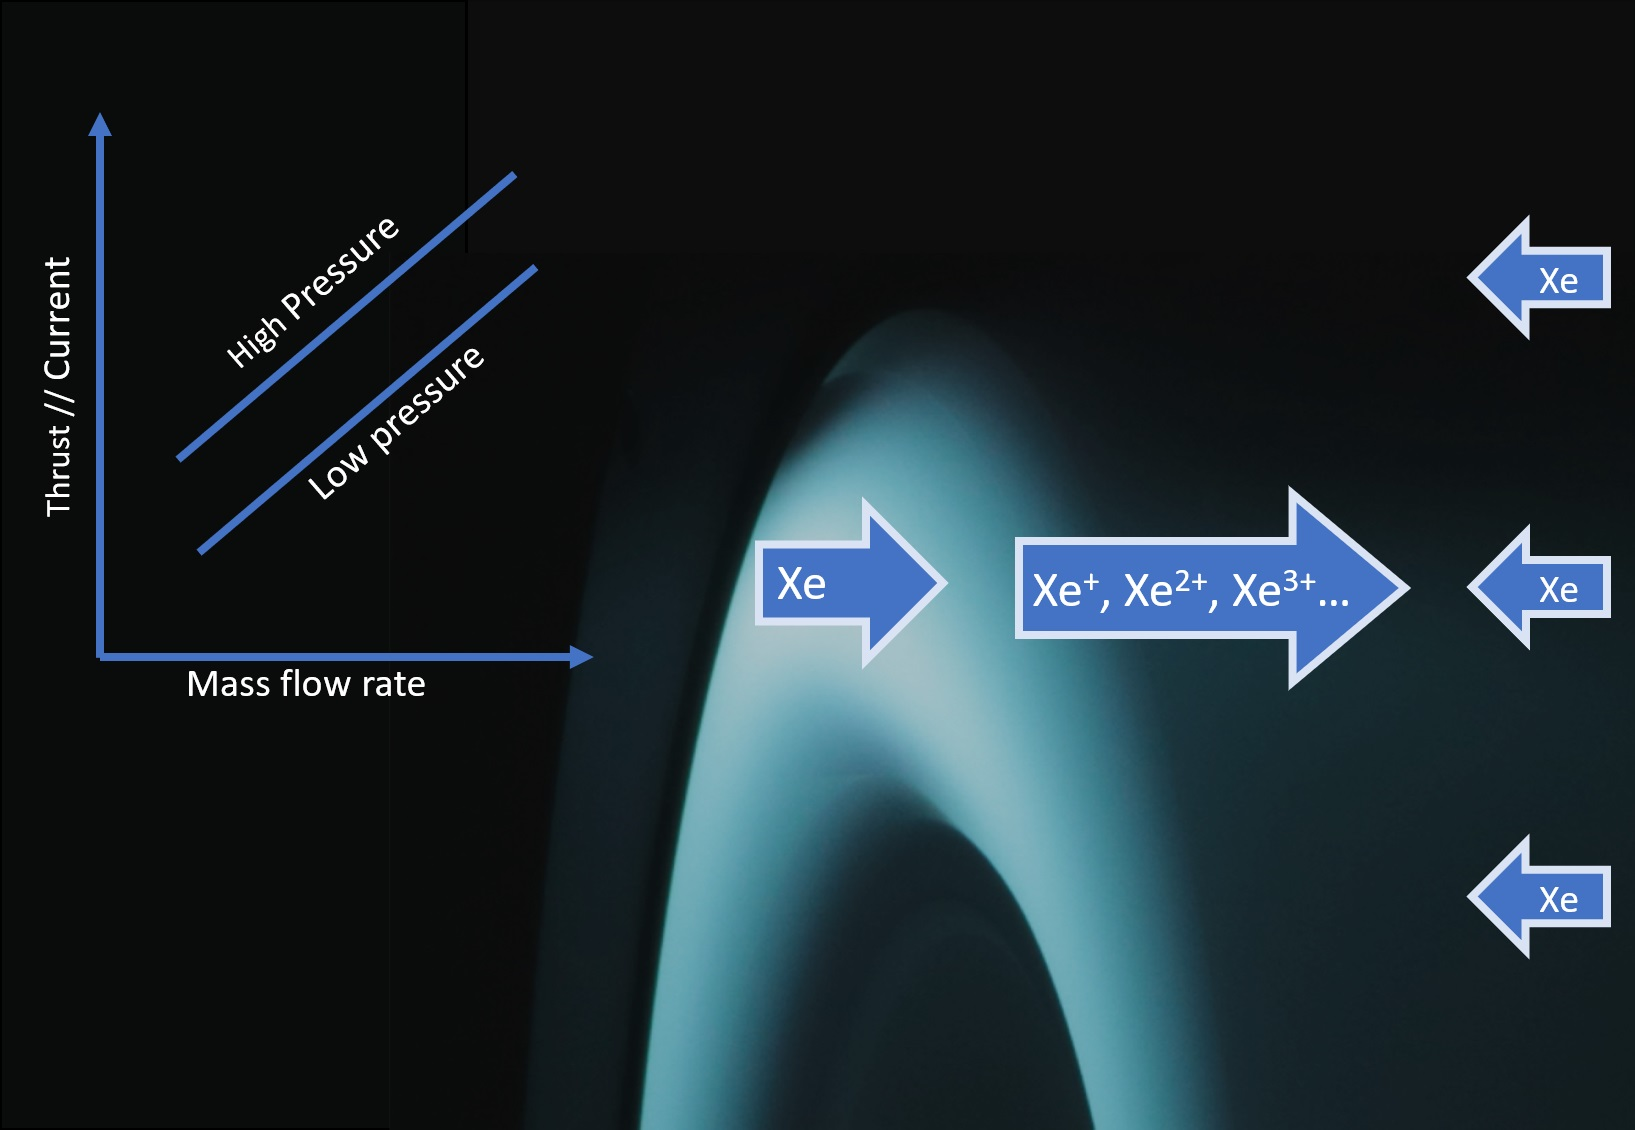
More recent studies have highlighted that, even when operating at pressure levels below Randolph’s criterion, thruster performance is still affected by pressure [
21,
22]. The operation of the thruster can be affected by a linear increase of thrust and discharge current with pressure when operating at constant mass flow rates or a decrease of the needed anode mass flow rate to get the same current when characterizing at constant power [
23,
24,
25,
26]. This behavior has been explained by the ingestion of the residual neutrals in the facility artificially augmenting the thruster performance [
20,
21,
22,
23,
24,
25,
26,
27]. A direct assessment of the ingested neutral flow is difficult to perform, but an estimate can be done analyzing the performance change or having a better insight of the neutrals inside the chamber when the thruster is firing [
28,
29]. Recent studies have focused on various aspects such as the change of plasma proprieties in the acceleration region [
30,
31,
32] or cathode coupling [
33,
34].
The recent developments of high-power Hall thrusters have posed new research questions. On the one hand, the increase of mass flow rates and thruster dimensions imposes the need for large vacuum facilities and high pumping speeds, which has a direct impact on the costs of thruster development and qualification. Besides the investment needed to setup a suitable test facility and the costs associated with its operation, state-of-the-art pumping technology imposes a lower boundary on the obtainable background pressure level. On the other hand, high-power thrusters target challenging performance metrics in terms of thrust efficiency and lifetime, so the impact of a high background pressure during the characterization and endurance testing may have a severe impact on thruster qualification. Regarding performance in space, an extrapolation of the performance to vacuum condition can be done, but it currently relies on performance fitting from data gathered over an ample range of pressure levels [
35].
For a magnetically shielded 20 kW-class Hall thruster, the effects of the background pressure have never been assessed in detail, with the notable exception of the 12.5 kW HERMeS Hall thruster [
36]. The characterization presented here for the 20 kW Hall thruster was tailored to study the effect over a broader range of anode mass flow rates (up to 35 mg/s) and featured three configurations with different channel frontal areas and lower pumping speeds of the vacuum chamber.
The aim of this work was to present the characterization results of a 20 kW magnetically shielded Hall thruster operating at two different chamber pumping speeds and to assess the possible mechanisms behind the observed change in performance due to the only change in background pressure. In order to do so, the characterization was conceived to be at constant anode and cathode mass flow rate levels, and the only parameter that changed for each operating point was the background pressure as a result of the 40% increase of the cryogenic pump surfaces.
In parallel, simple relations to model the thruster response in terms of thrust and discharge current were derived. Due to the relatively large frontal area of the thruster, the ingestion of the propellant could be important. The gathered performance data were later analyzed, and the ingested mass flow rate was assessed using a recently developed background flow model.
Accordingly, in this work, we summarize the results of the characterizations carried out on the second development model (DM) of the HT20k, the HT20kDM2. In
Section 2, we present a brief description of the test setup and the theoretical models used in this work. In
Section 3, we present the characterization campaign and the test results.
Section 4 then discusses the test results, focusing on the chamber pressure and the effect of the two-pumping surface configurations on thruster performance. Last, in
Section 5 the conclusions are summarized.
3. Results
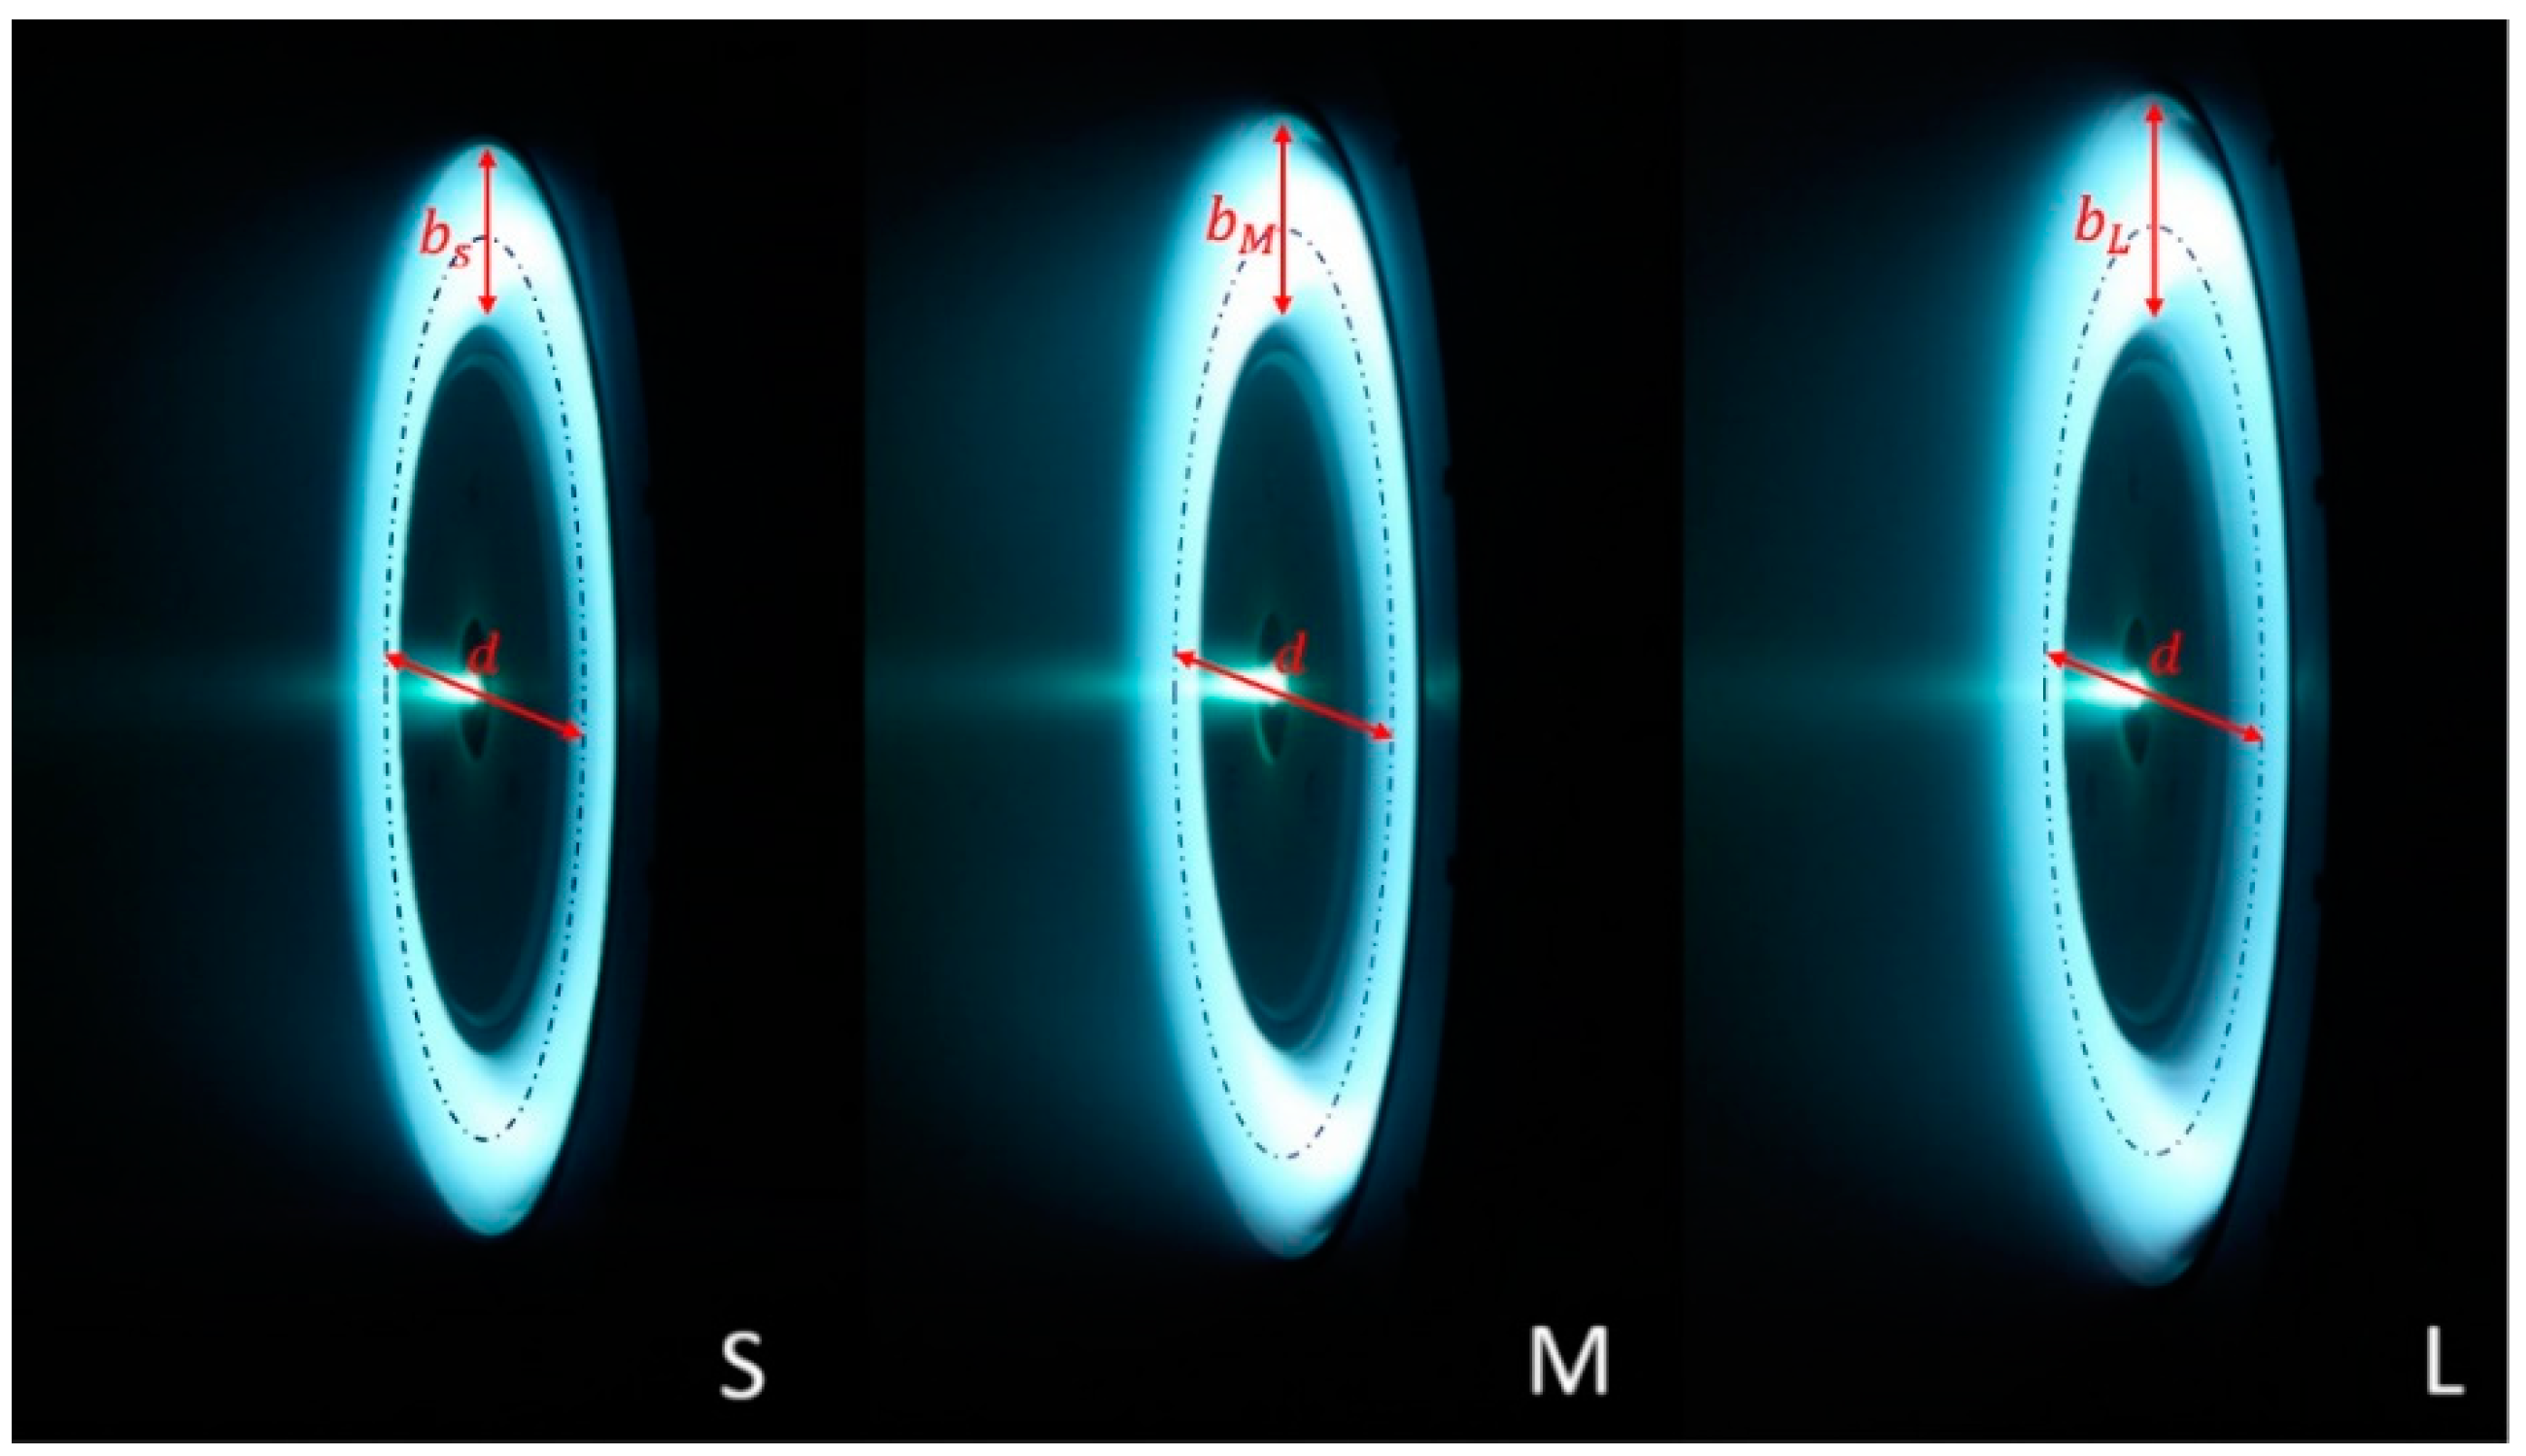
The HT20k DM2 was characterized at fixed values of anode mass flow rates
for all the three configurations (e.g., S, M, and L), as summarized in
Table 2. The cathode mass flow rate
was always kept at 8% of the
, so
.
In the frame facility upgrade in February 2019 [
52,
53], we first characterized the points of
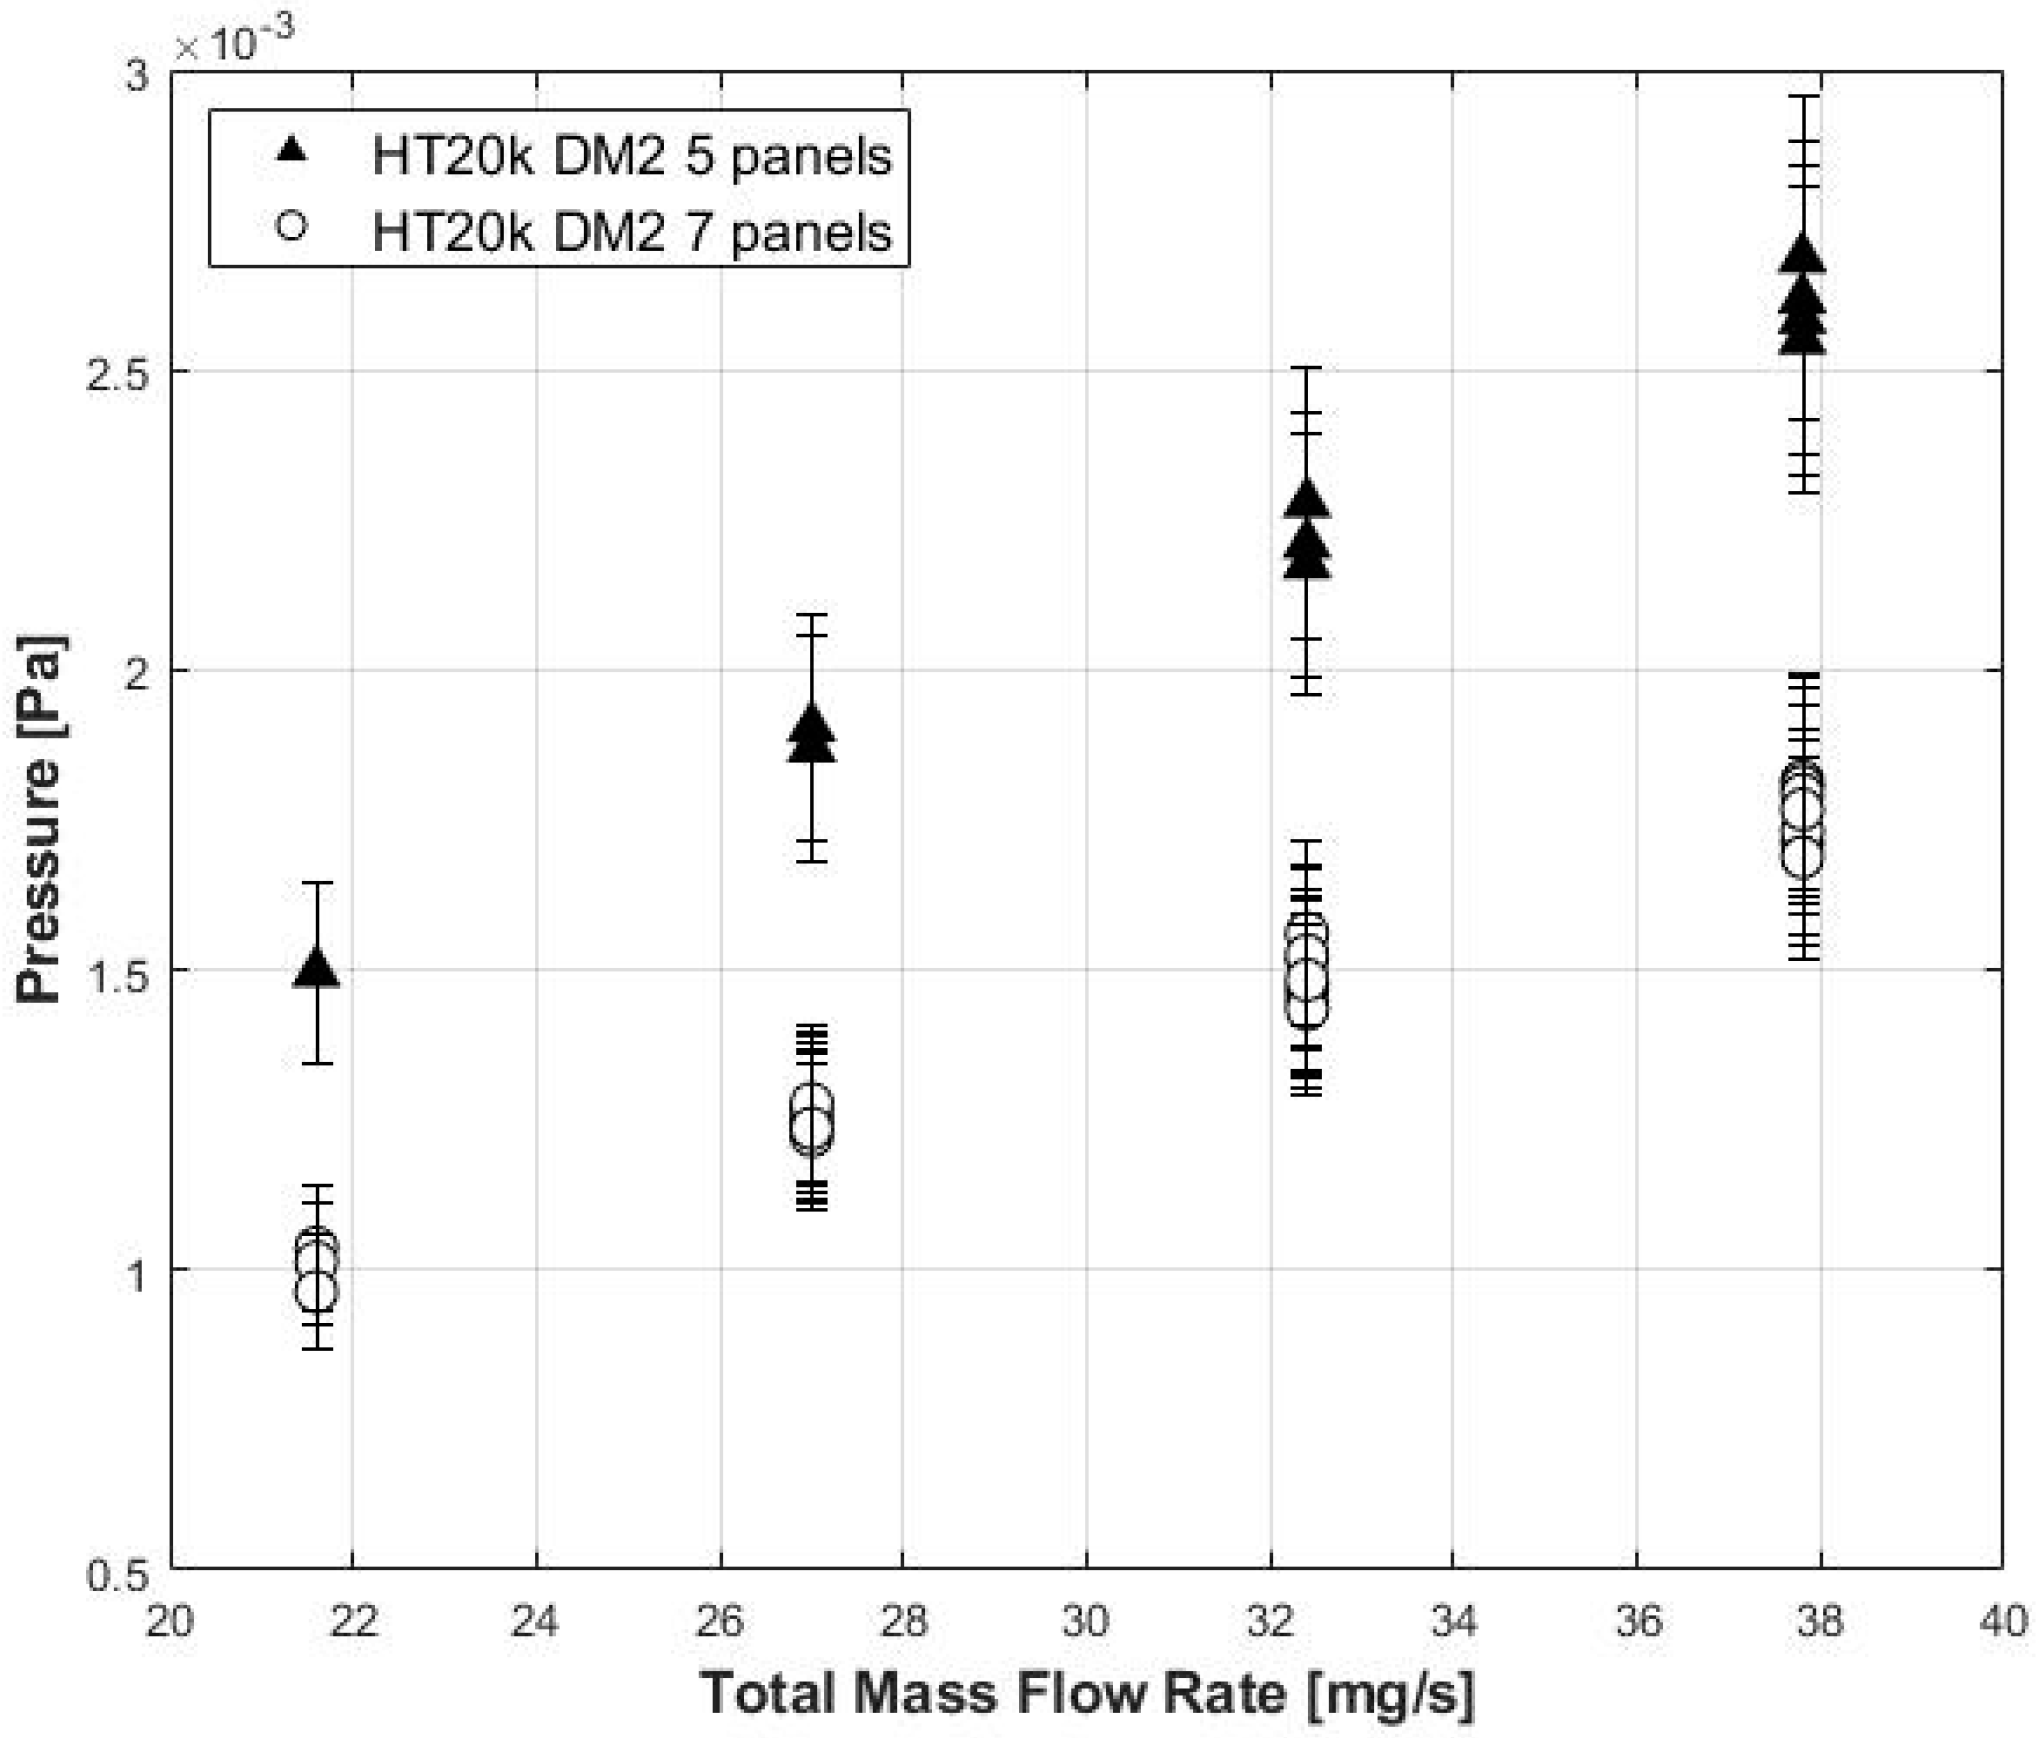
Table 2 in IV10 pumping with five cold panels and then with IV10 pumping with seven cold panels. We noticed a reduction of the measured pressure at the same total mass flow rate
(as depicted in
Figure 7). During the characterization with five panels, the maximum background pressure was in the order of 2.8 × 10
−3 Pa at
= 37.8 mg/s. The lowest recorded pressure levels were in the order of 9 × 10
−4 Pa at
= 21.6 mg/s with seven panels.
The background pressure
versus total mass flow rate could be approximated as a linear trend, with different slopes when using five or seven cold panels. We can thus have an estimate of the sticking coefficient
by using the relation described in [
50,
54]:
where the
is the gas constant for the specific gas (e.g., Xe) and
is the chamber walls temperature. The measurements taken with five panels and seven panels led to an average
.
The effective pumping speed of the chamber
was calculated considering the method described in [
55]:
The is the pressure when the thruster is not operating and no mass flow rate is injected into the chamber, and it was found to equal 3 × 10⁻⁵ Pa, approximately two order of magnitude less than the measured pressures . Consequently, the difference between the was nearly equal to and well within the error of the measurement of the pressure sensor.
The pumping speed was calculated for all the operating points. The results led to an average value of 250 m3/s with five panels and of 370 m3/s with seven panels.
4. Discussion
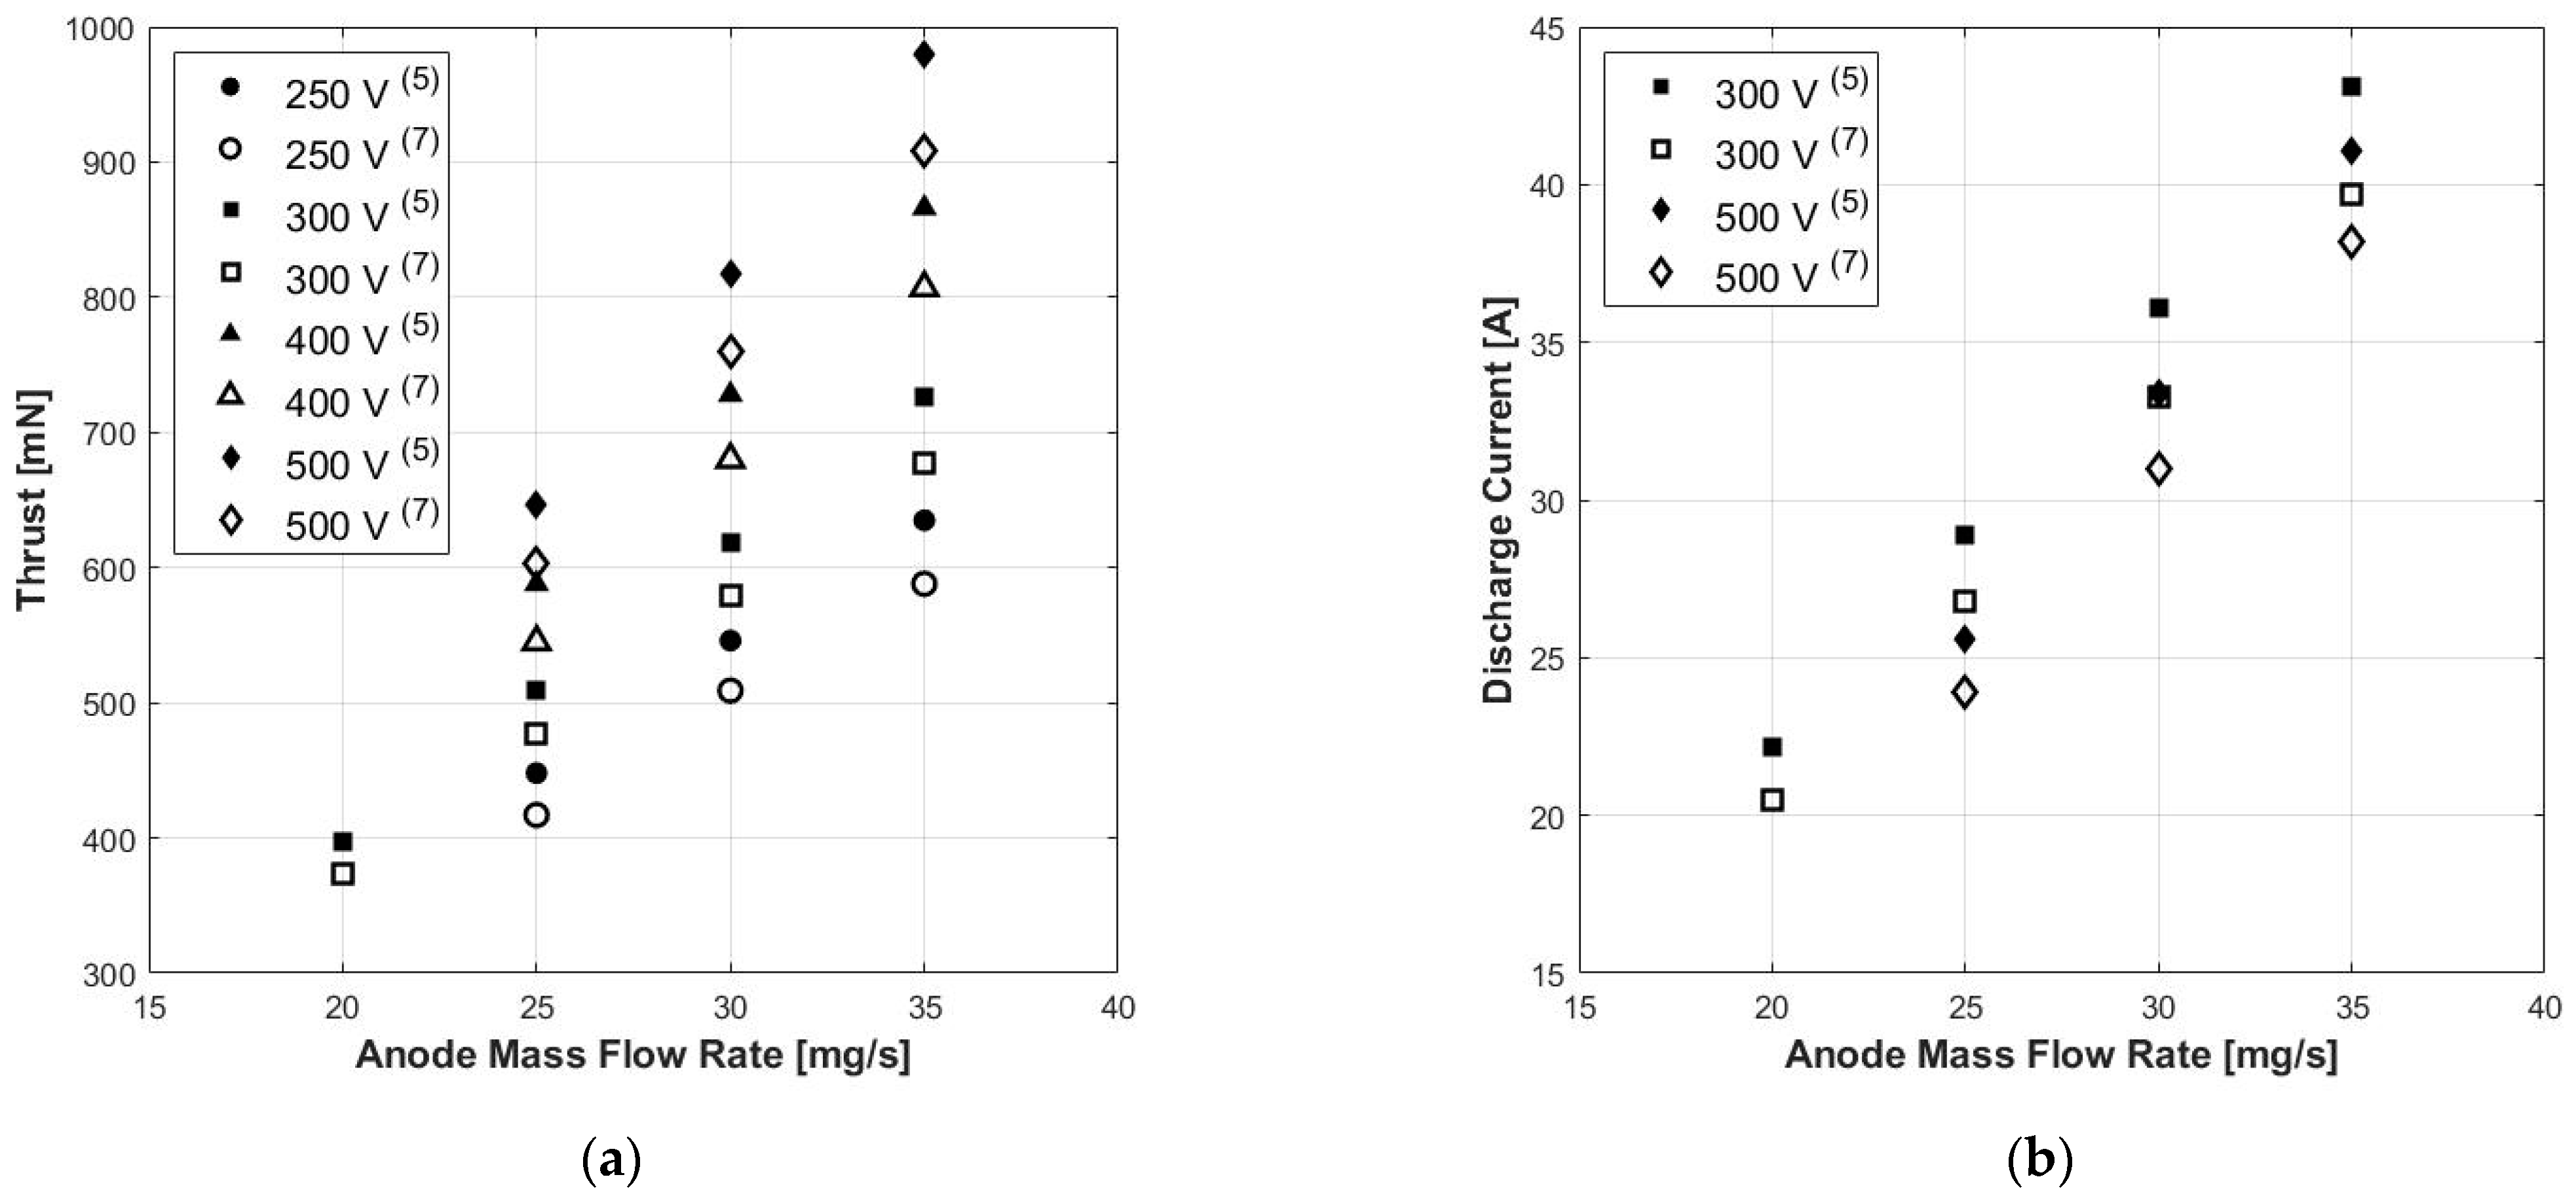
For a Hall thruster, a generic response to an input (defined in terms of a change of anode mass flow rate, discharge voltage, magnetic field, or change in the background pressure) is a change in the thruster output performance, i.e., discharge current
and thrust
. The functional relations between inputs and outputs are generally non-linear and depend on the physical processes that occur in the thruster discharge. By considering a variation of an input, however, it is possible to evaluate the response of the system output through a linearization of these functional relations. Therefore, we can construct a series of differential relations that model the thruster response by using an approach similar to the one used so far in other type of electric propulsion devices [
56].
In the case of the characterization presented in this work, we did not change the anode mass flow rate
, discharge voltage
, and magnetic field peak
for each operative point. Since we only changed the pumping surfaces (increasing them by 40%), we could write a system as a function only of the change in the background pressure
, thus obtaining:
Considering the discharge current and thrust modeled according to Equations (14) and 15, for a characterization at constant mass flow rates levels, we get:
where the terms
and
are, respectively, the variations of the
and
imposed by the change of pressure. The latter is not to be confused with the change of
and
due to the change in anode mass flow rate
and
.
In addition, it has to be highlighted that the and may be different if the background pressure is modulated with different strategies, such as changing the number of pumping surfaces (the case of this work) or by artificially increasing the pressure by injecting xenon in one or multiple selected locations inside the chamber. In principle, the derivatives and can be also negative. Thus, we could have a loss of discharge current and/or thrust while increasing the pressure. This feature was not observed in this test campaign.
Additionally, the term is indeed the actual change in the ingested mass flow rate due to the change in background pressure. Even in this case, the can change if the background pressure is modulated with different strategies, as described before. The is expected to be always positive.
By integrating from lower to higher pressure (from seven to five panel conditions) and assuming linear changes between the two pumping configurations of the chamber, we get:
By dividing the first part of Equation (21) by
and the second part by
, we obtain the following system:
In principle, if the and are known, the and can be calculated by solving the system of equations above. However, it is difficult to assess the exact values of and , even with a complete set of plasma and thruster diagnostics.
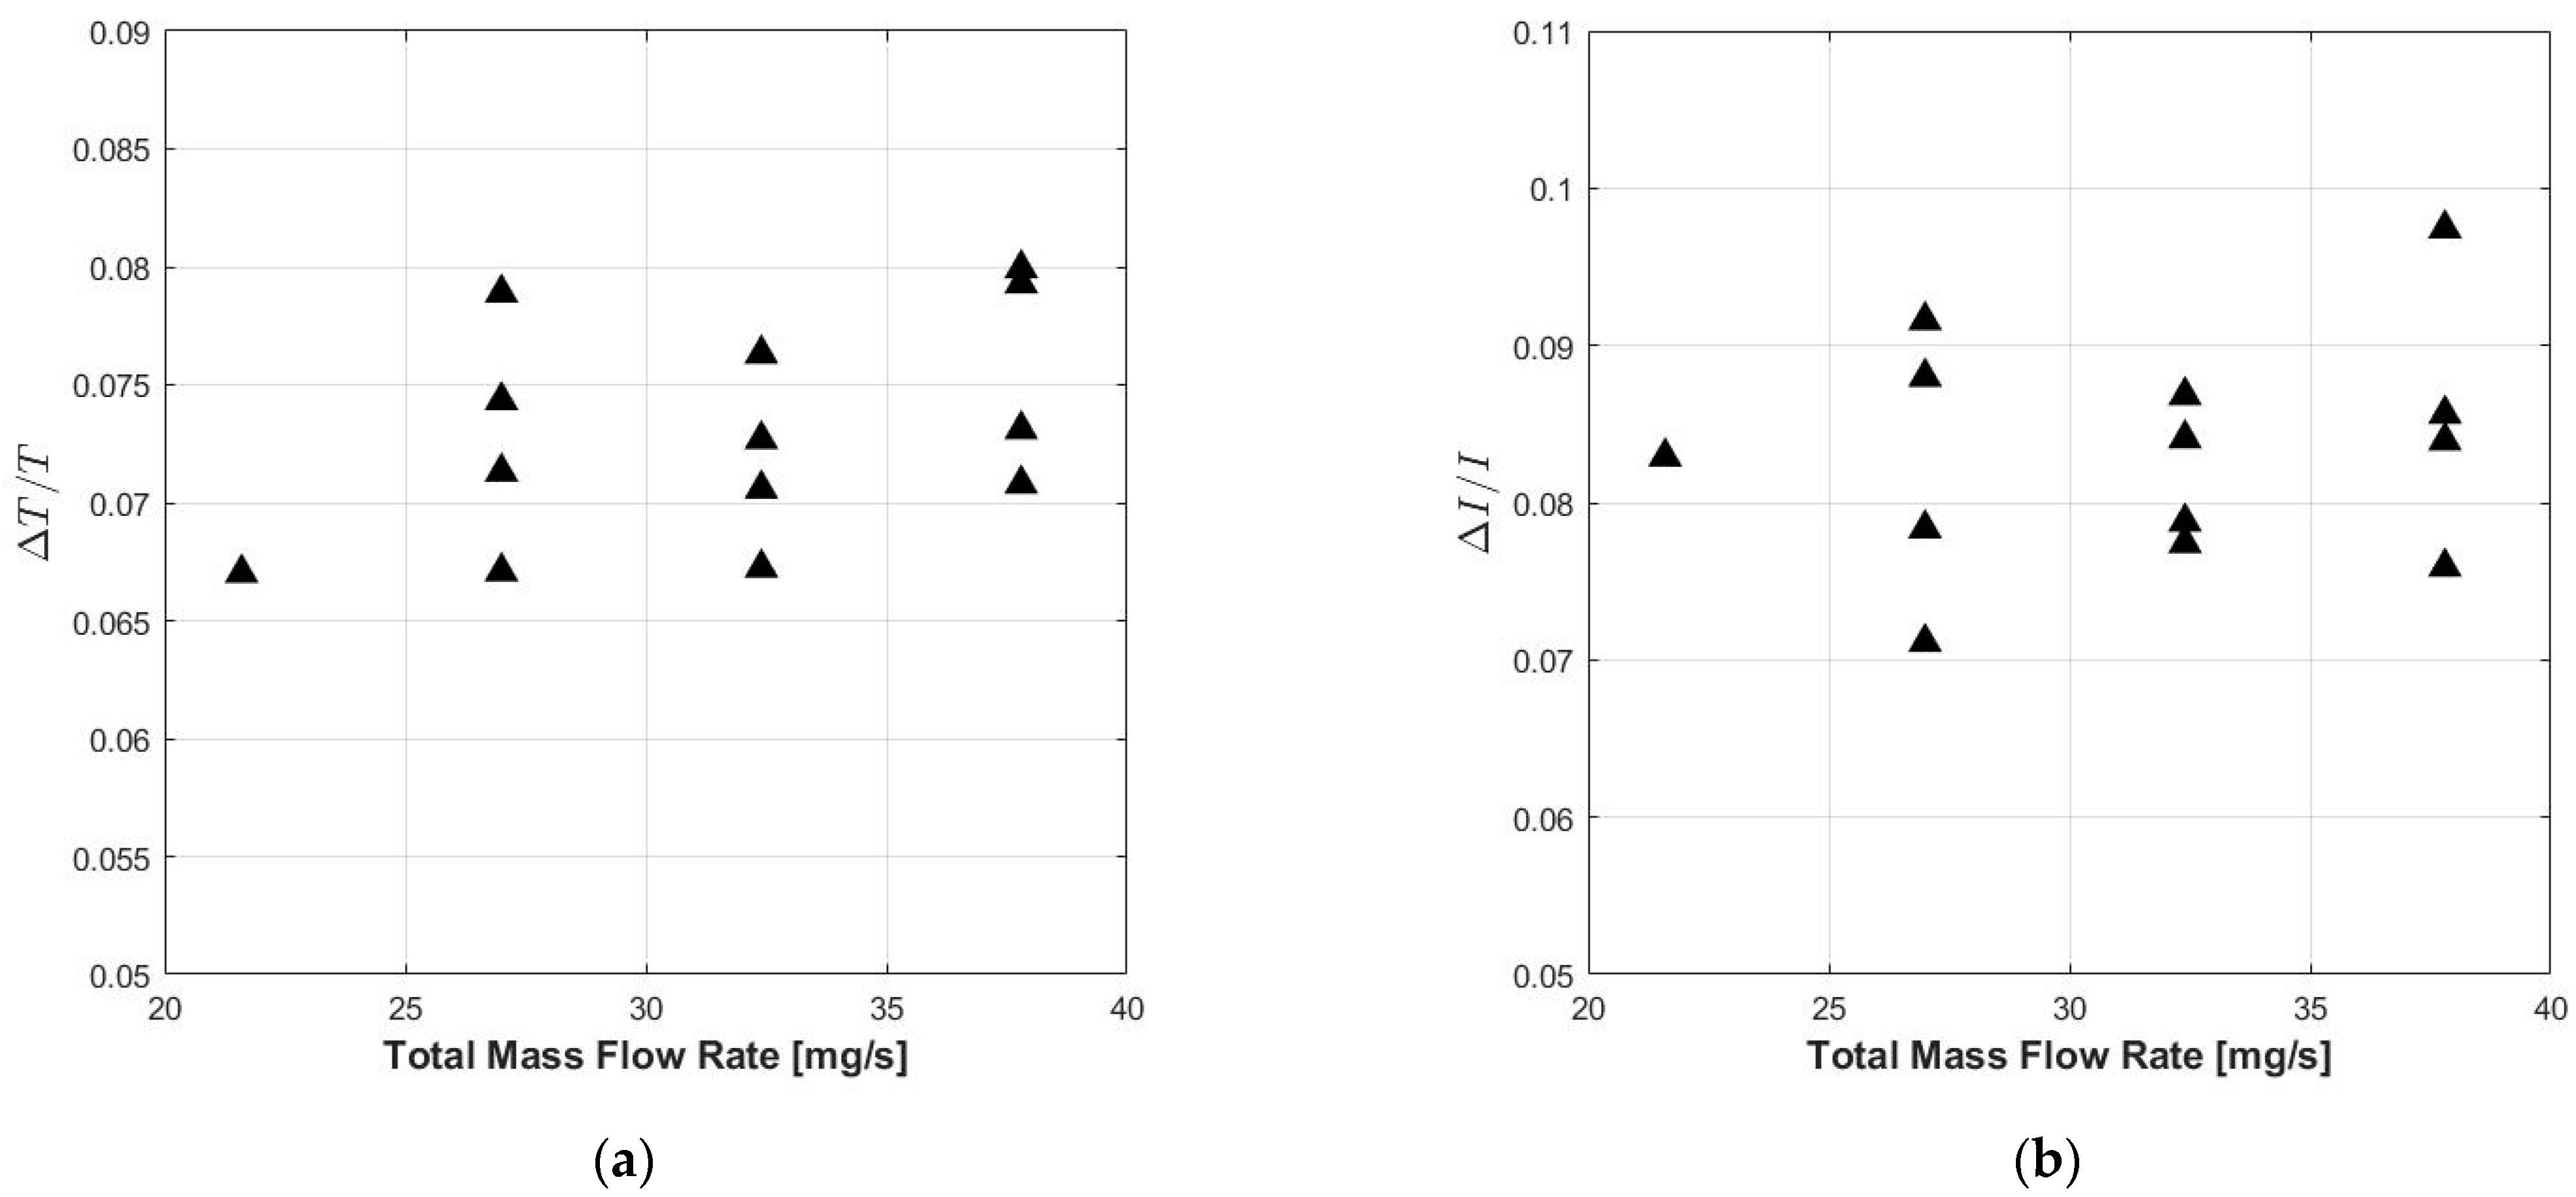
A preliminary estimate of the can be done by focusing on the discharge current or thrust, assuming constant or and, in first approximation, neglecting in comparison to .
However, the calculated with the assumptions of contant or with pressure and neglecting is not representative of the actual variation of the ingested mass flow rate; rather, it is an operative parameter used to justify the change in performace.
In this work, the
calculated with the assumption descrived above is called the apparent delta ingested mass flow rate, and it is indicated as
. The
can be calculated from variations of the discharge current or from the variations of the thrust, and it leads to two differents
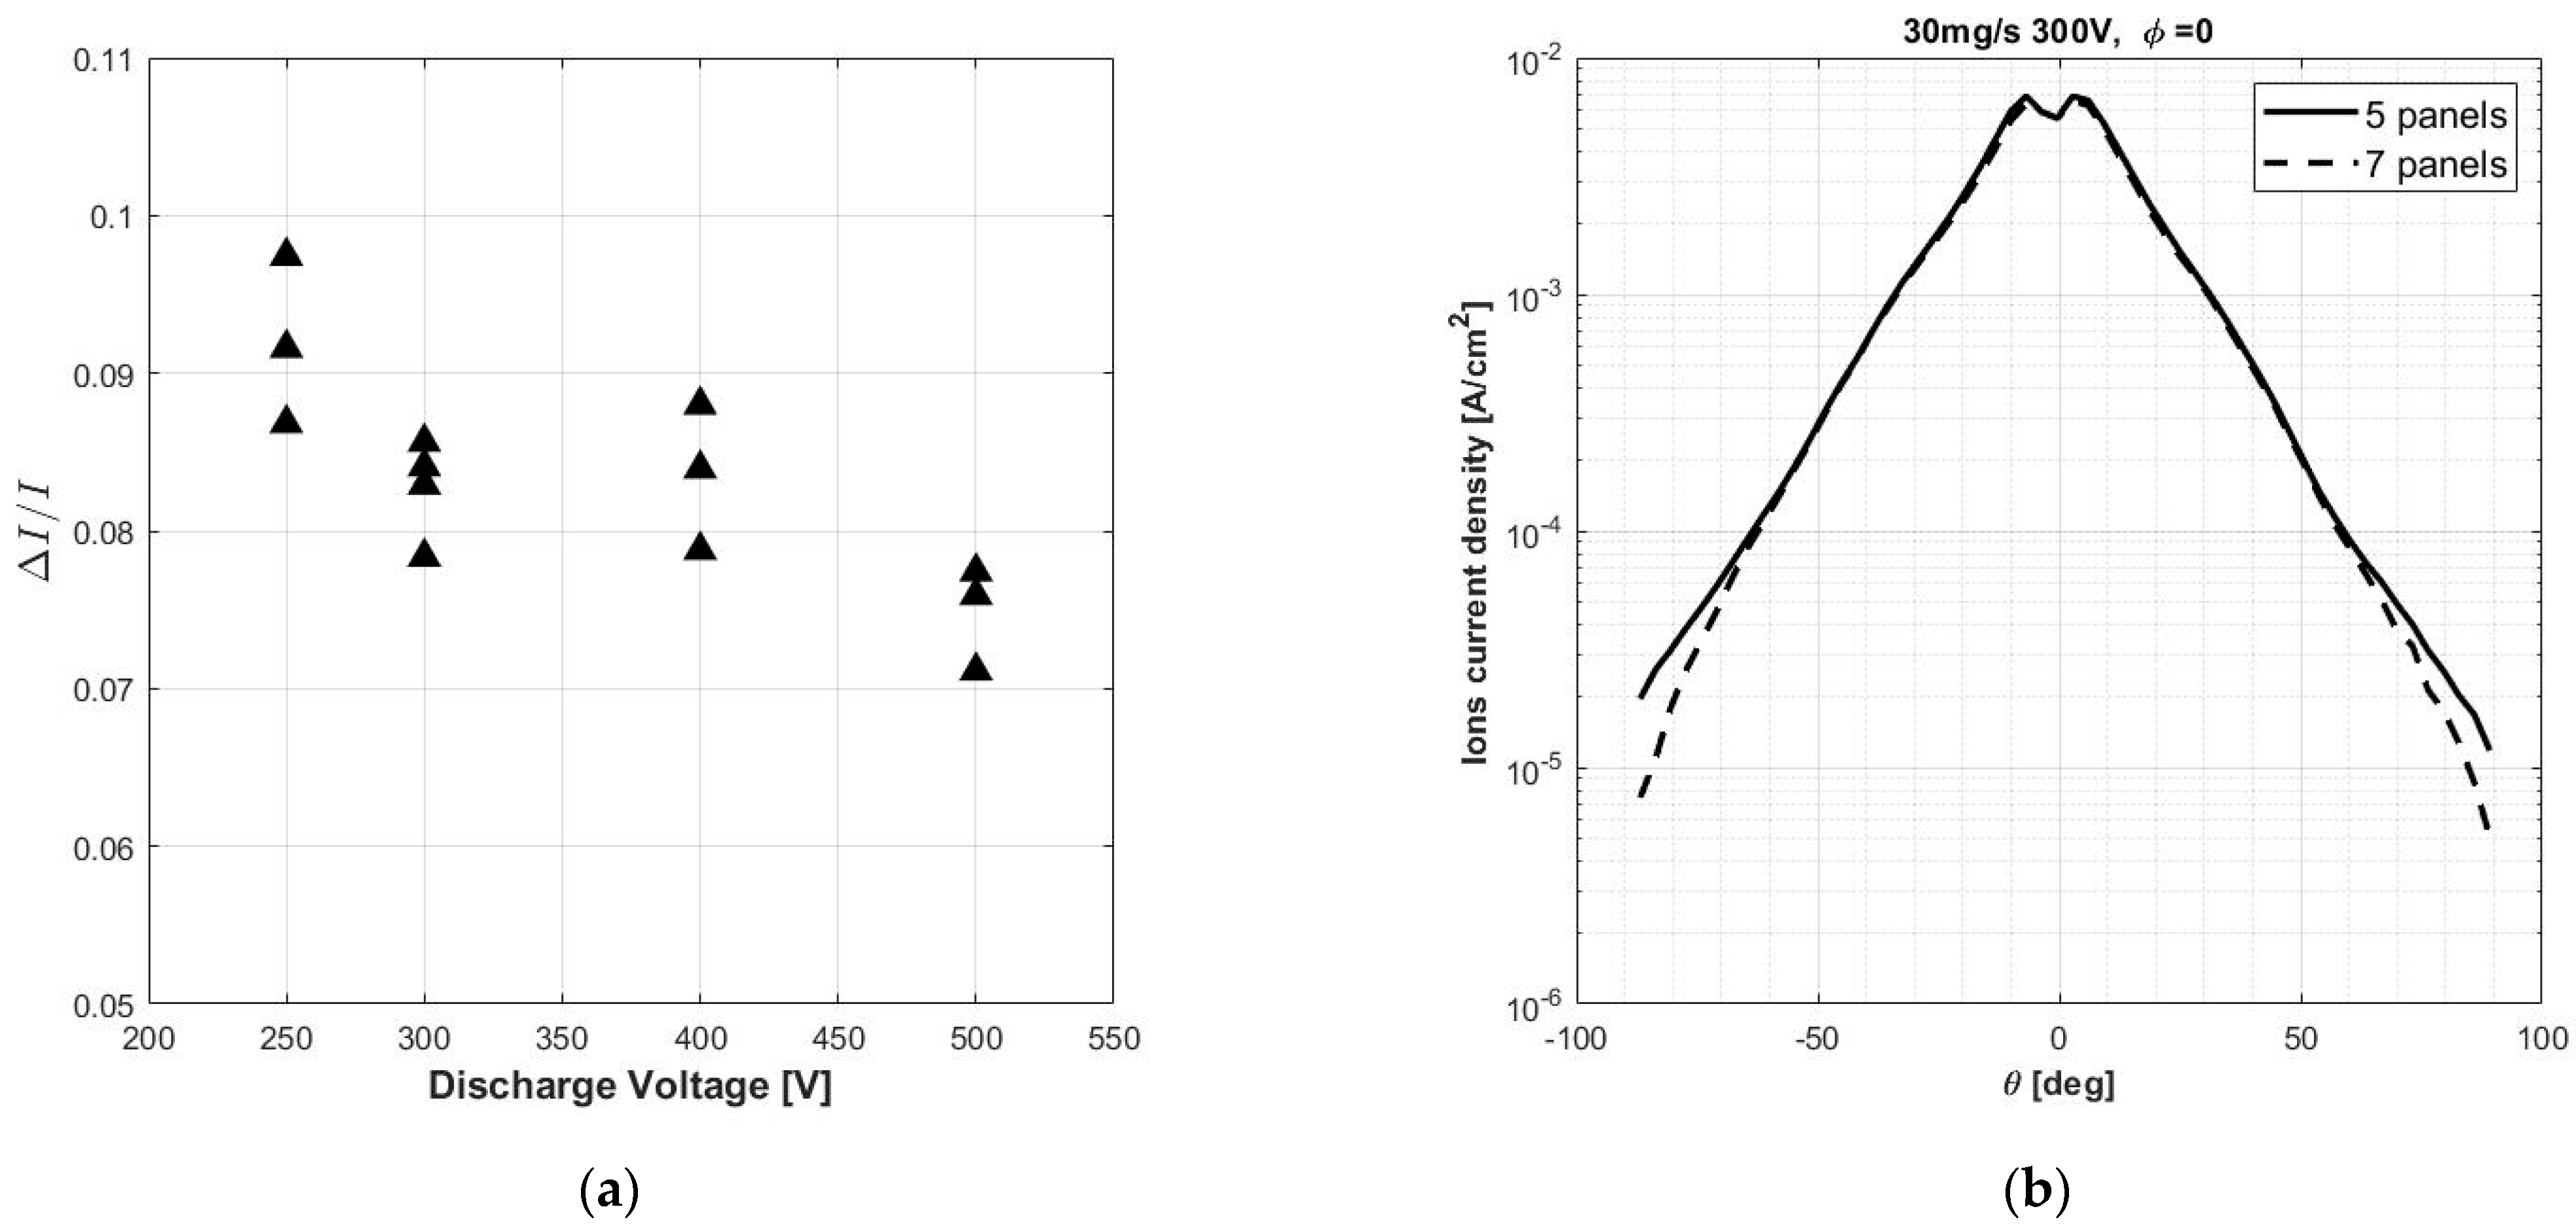
values for the same operative point. In particular, the
calculated from the
showed a linear trend with the mass flow rate with a different gradient for each discharge voltage level, as can be seen from the nearly constant values of
for each voltage level in
Figure 11a. Additionally, since the recorded data of pressure are not dependant on the voltage (as also evidenced by the background flow model), the
should be only proportional to the total mass flow rate.
On the other hand, the
calculated from the
only showed a clear linear trend with the
. For simplicity, the estimation of the
was thus performed and presented from the thrust varations using the following relation:
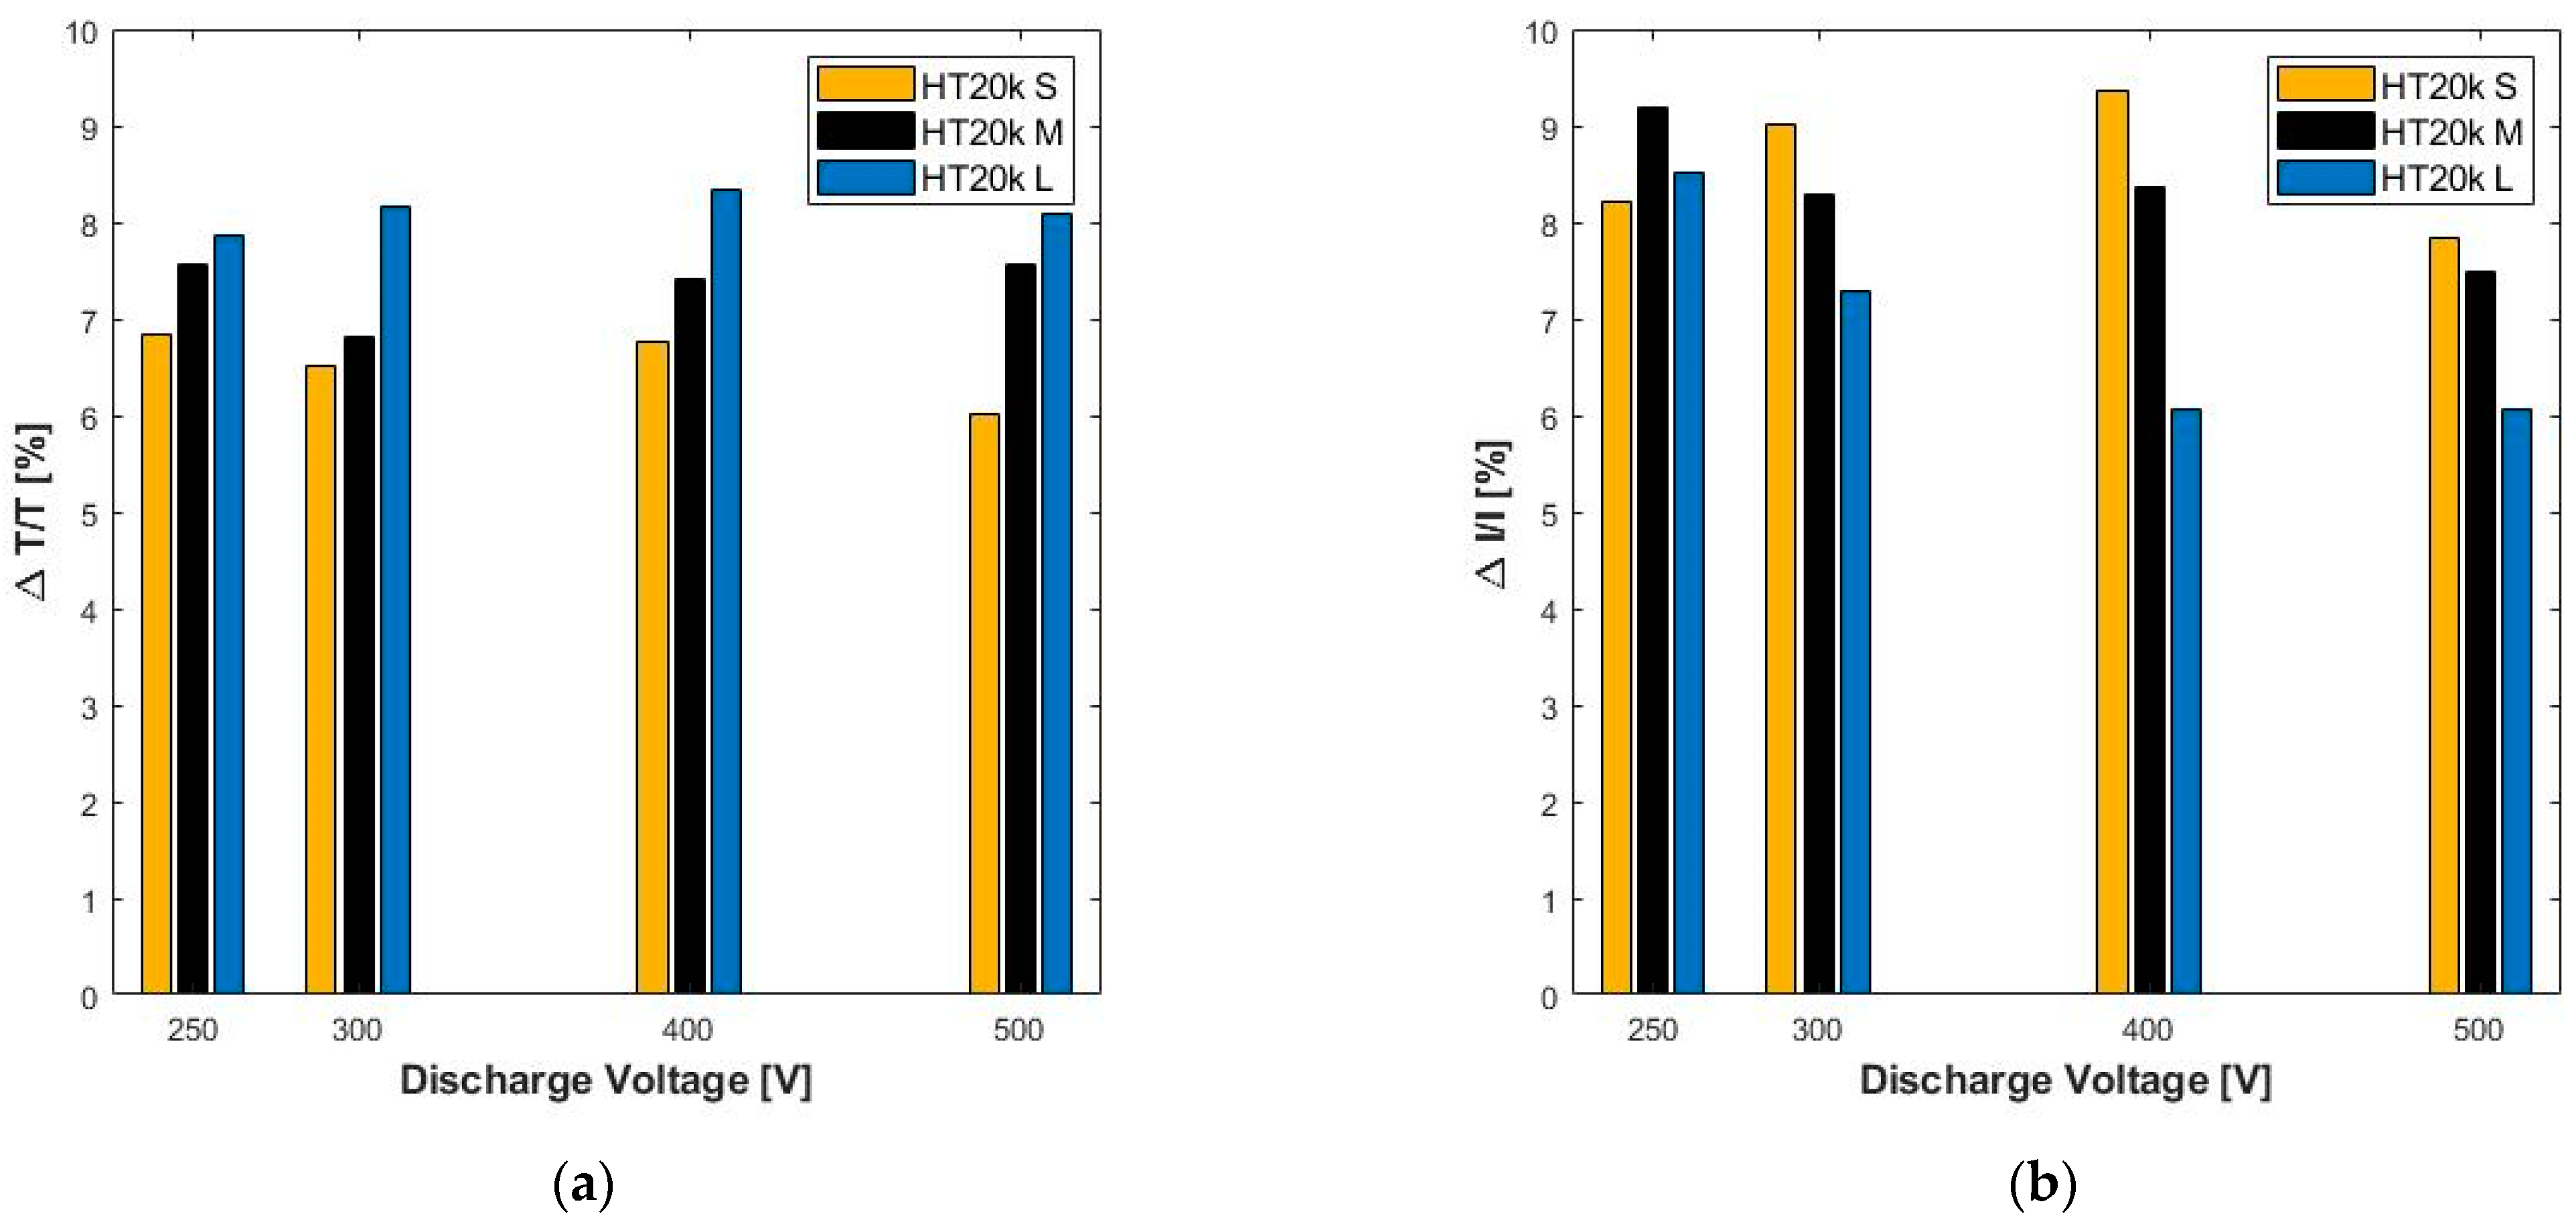
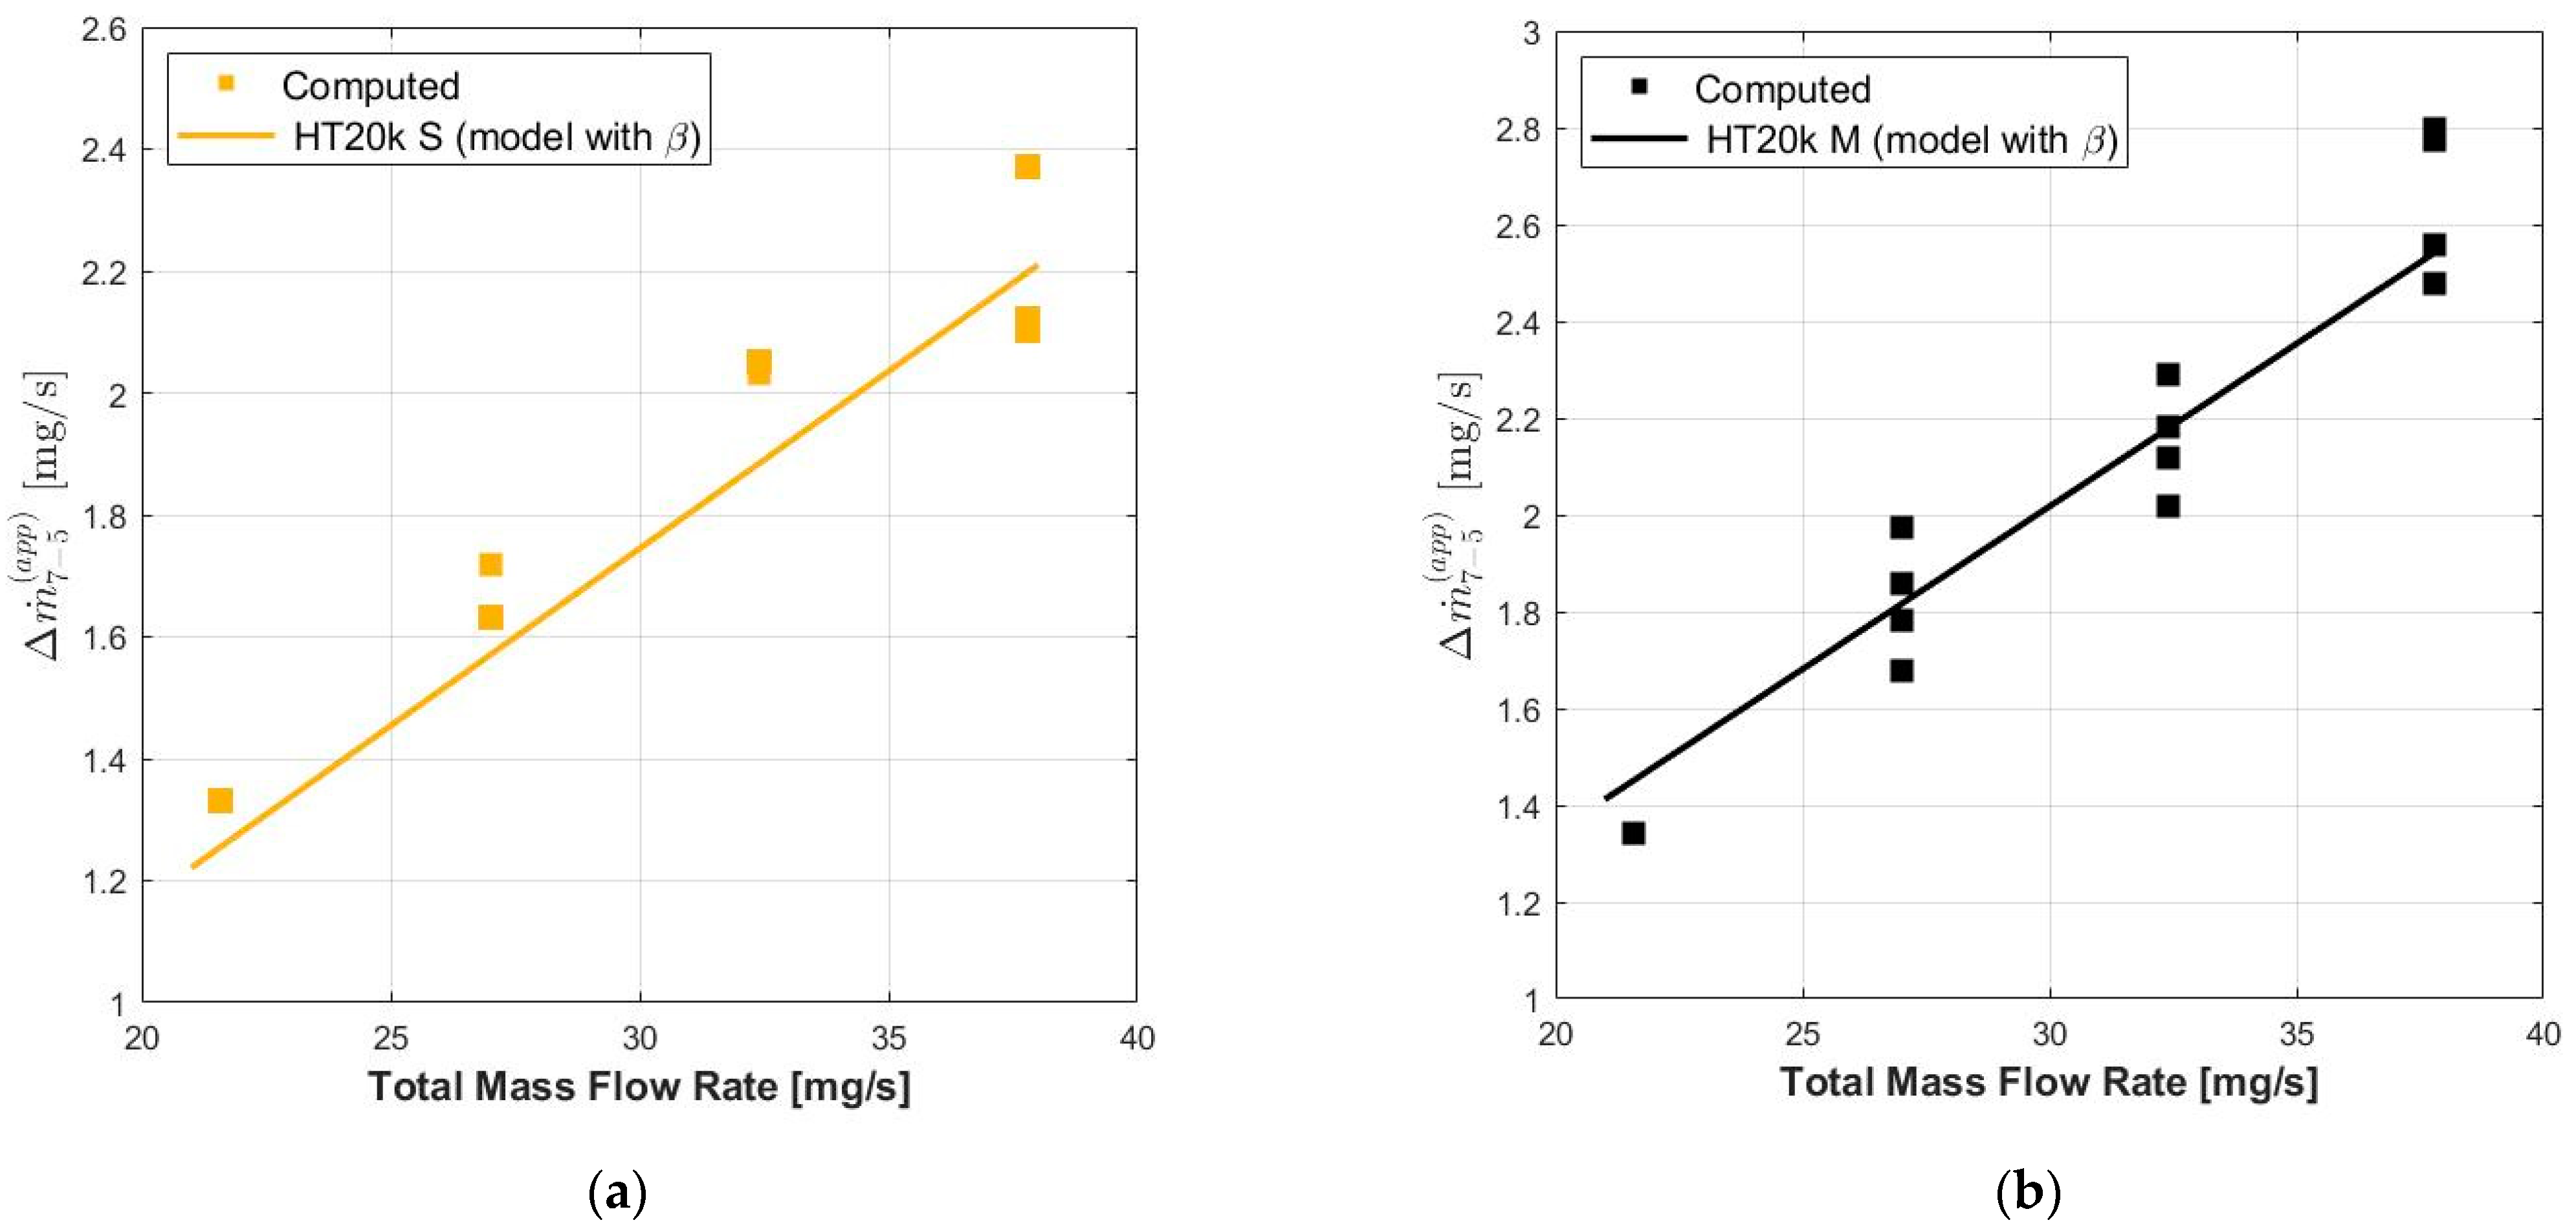
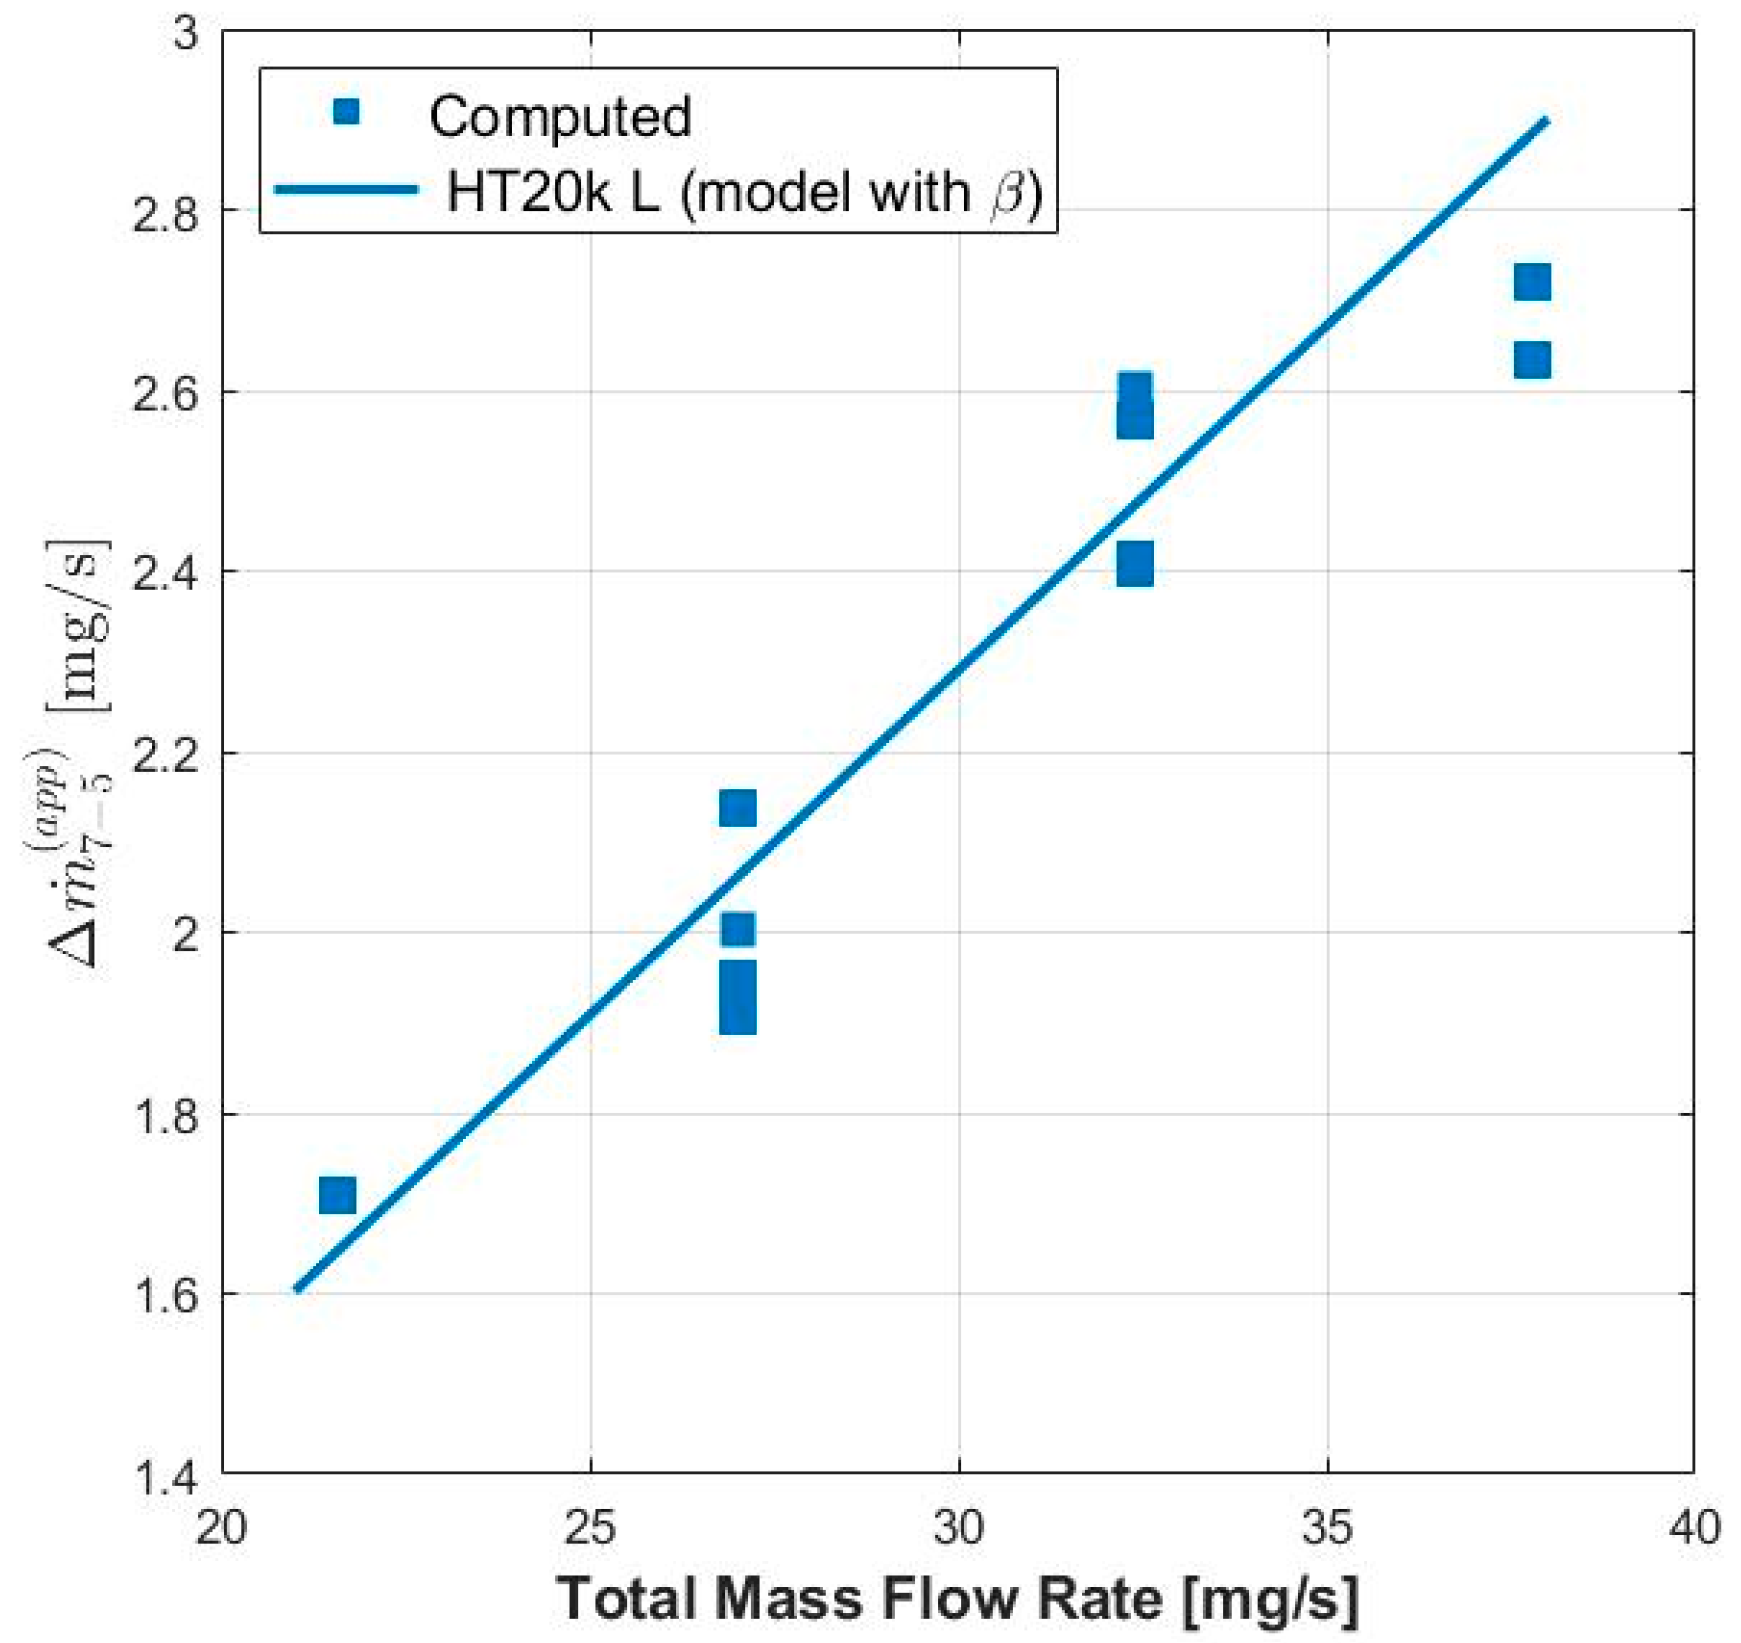
The results of the
(calculated from the
data) are shown in
Figure 12 and
Figure 13 for all the three configurations of the HT20k DM2. In the figures, we also report the results of the background flow model multiplied by an amplification factor
that took an effective ingestion area
into account in orders to explain the computed values of
. The
is the actual annular surface at the channel exit. The modeled variation of ingested mass flow rate was calculated as follows:
where we used the parameters summarized in
Table 3 to model the IV10 vacuum chamber. The parameter
was kept same for all thruster configurations and was calibrated in order to minimize the standard deviation for the difference between
and
for all the tested points. For each configuration, we used the corresponding
.
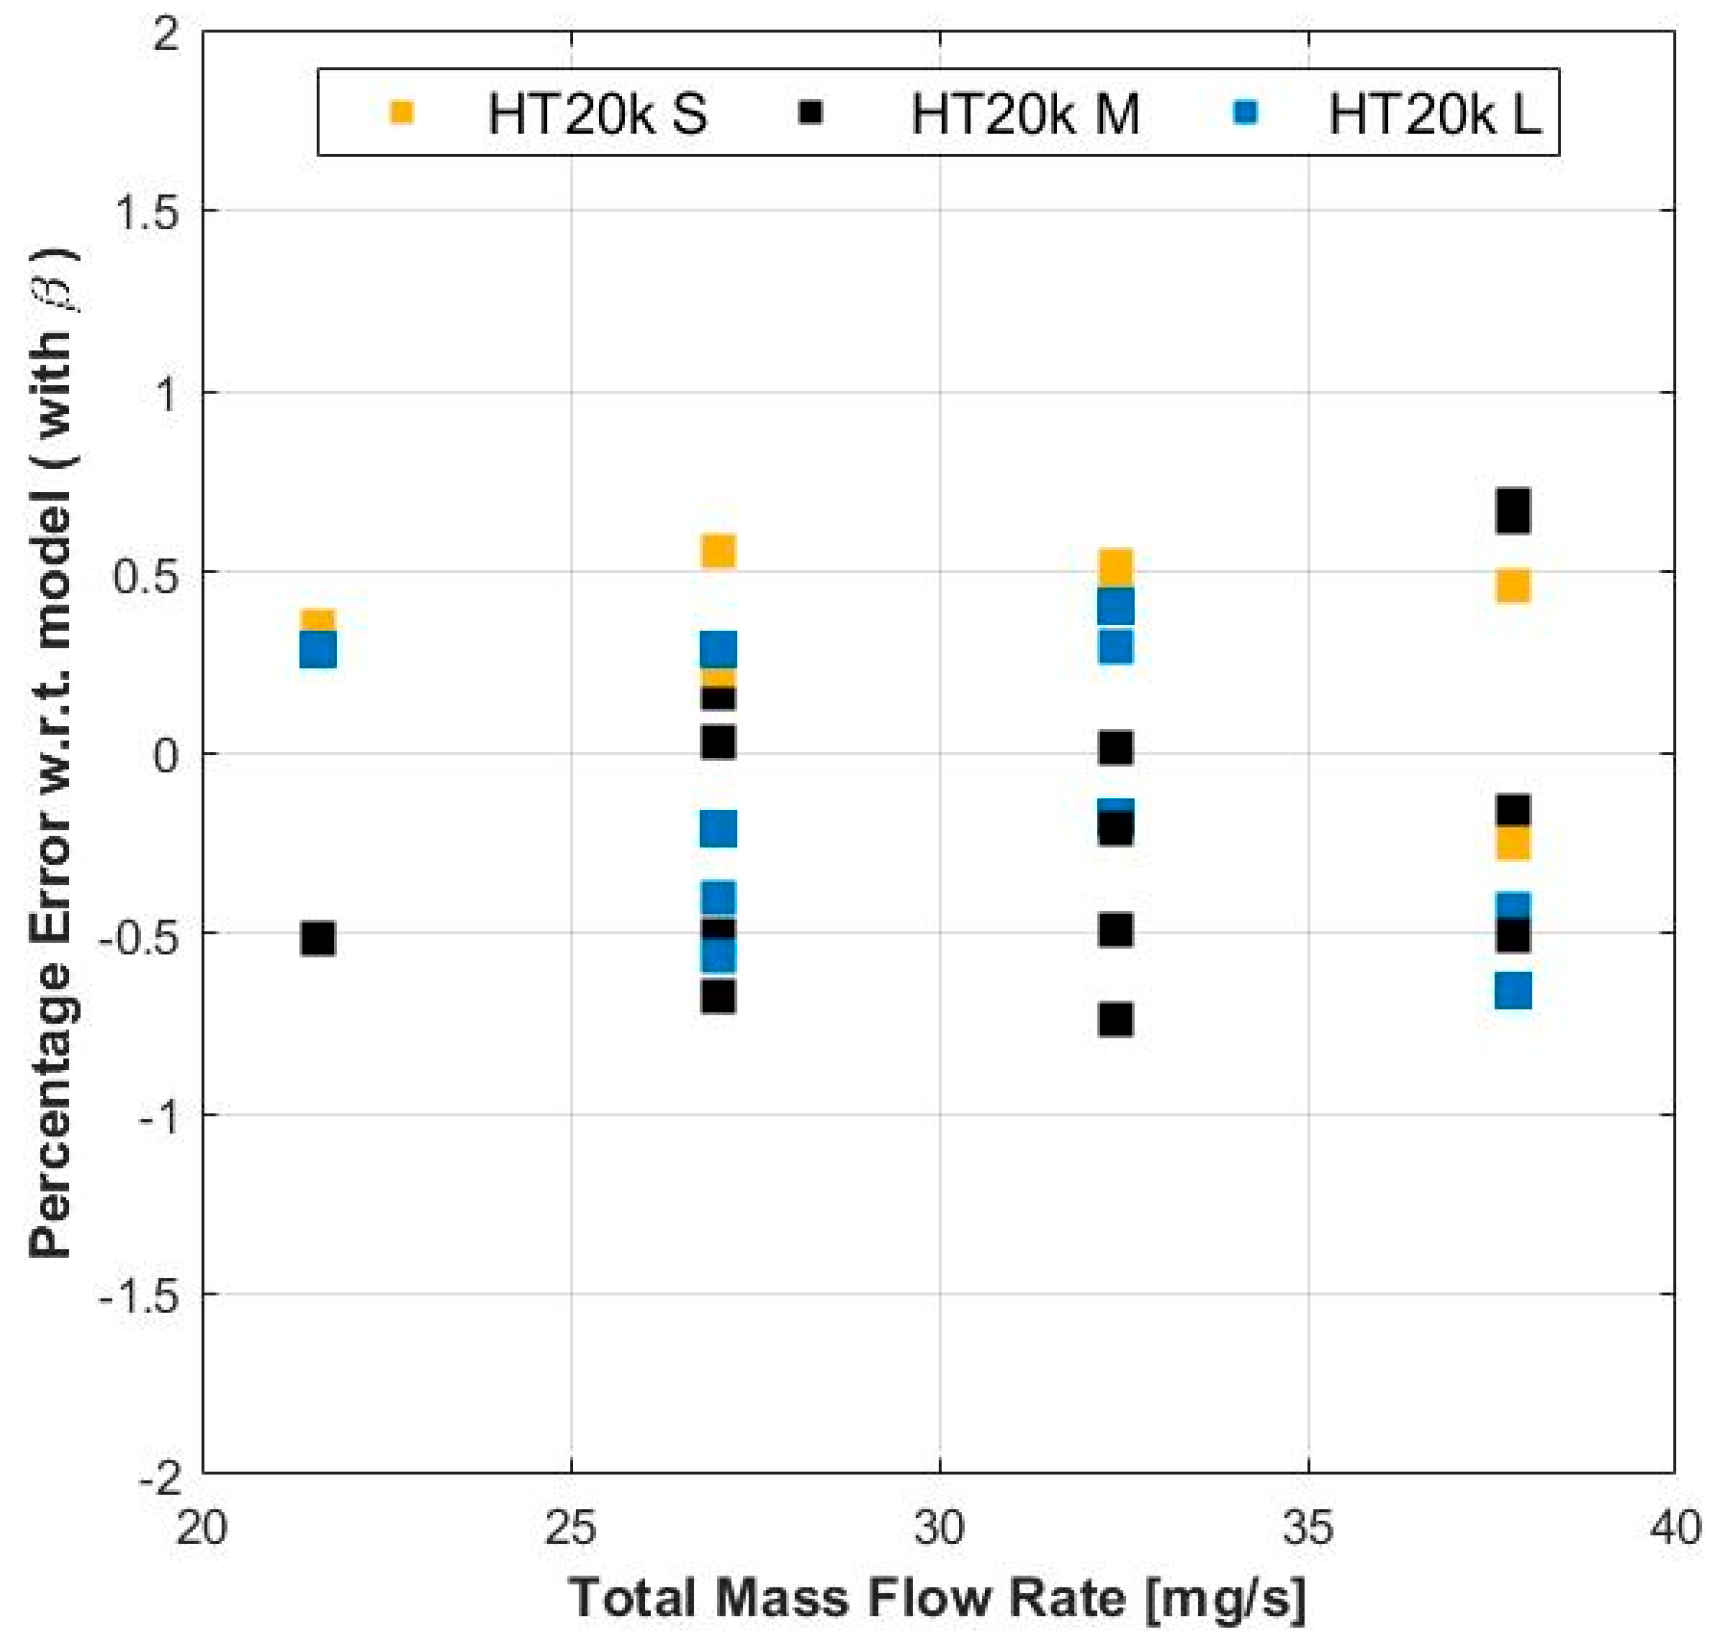
Using the approach with apparent levels of ingestions, the amplification factor
may change from thruster to thruster, pressure levels, and the method with which the
(e.g., from the discharge current variations) is calculated. In our case, with the same parameter
for all the three configurations, the error stayed within ±1%, as shown in
Figure 14. However, it must be said that the
can be calibrated for each configuration to obtain a better fit.
The calibrated with the data of all the three configuration turned out to be 49.6. This means that, in order to explain the change in performance due to only ingested mass flow rate, the effective ingestion area of the channel would be almost fifty times larger than the actual annular surface
Since the value of was much greater than 1, it was clear that the ingestion, ionization, and acceleration of background neutrals were not sufficient to justify the change of thruster performance. The apparent levels of ingestion used to explain the change in performace would thus be far from what would be the actual and real ingested mass flow rate. This implies that there are other phenomena that come into play when the physics of a vacuum chamber are coupled with the physics of the Hall thruster, leading to a change of the and with pressure.
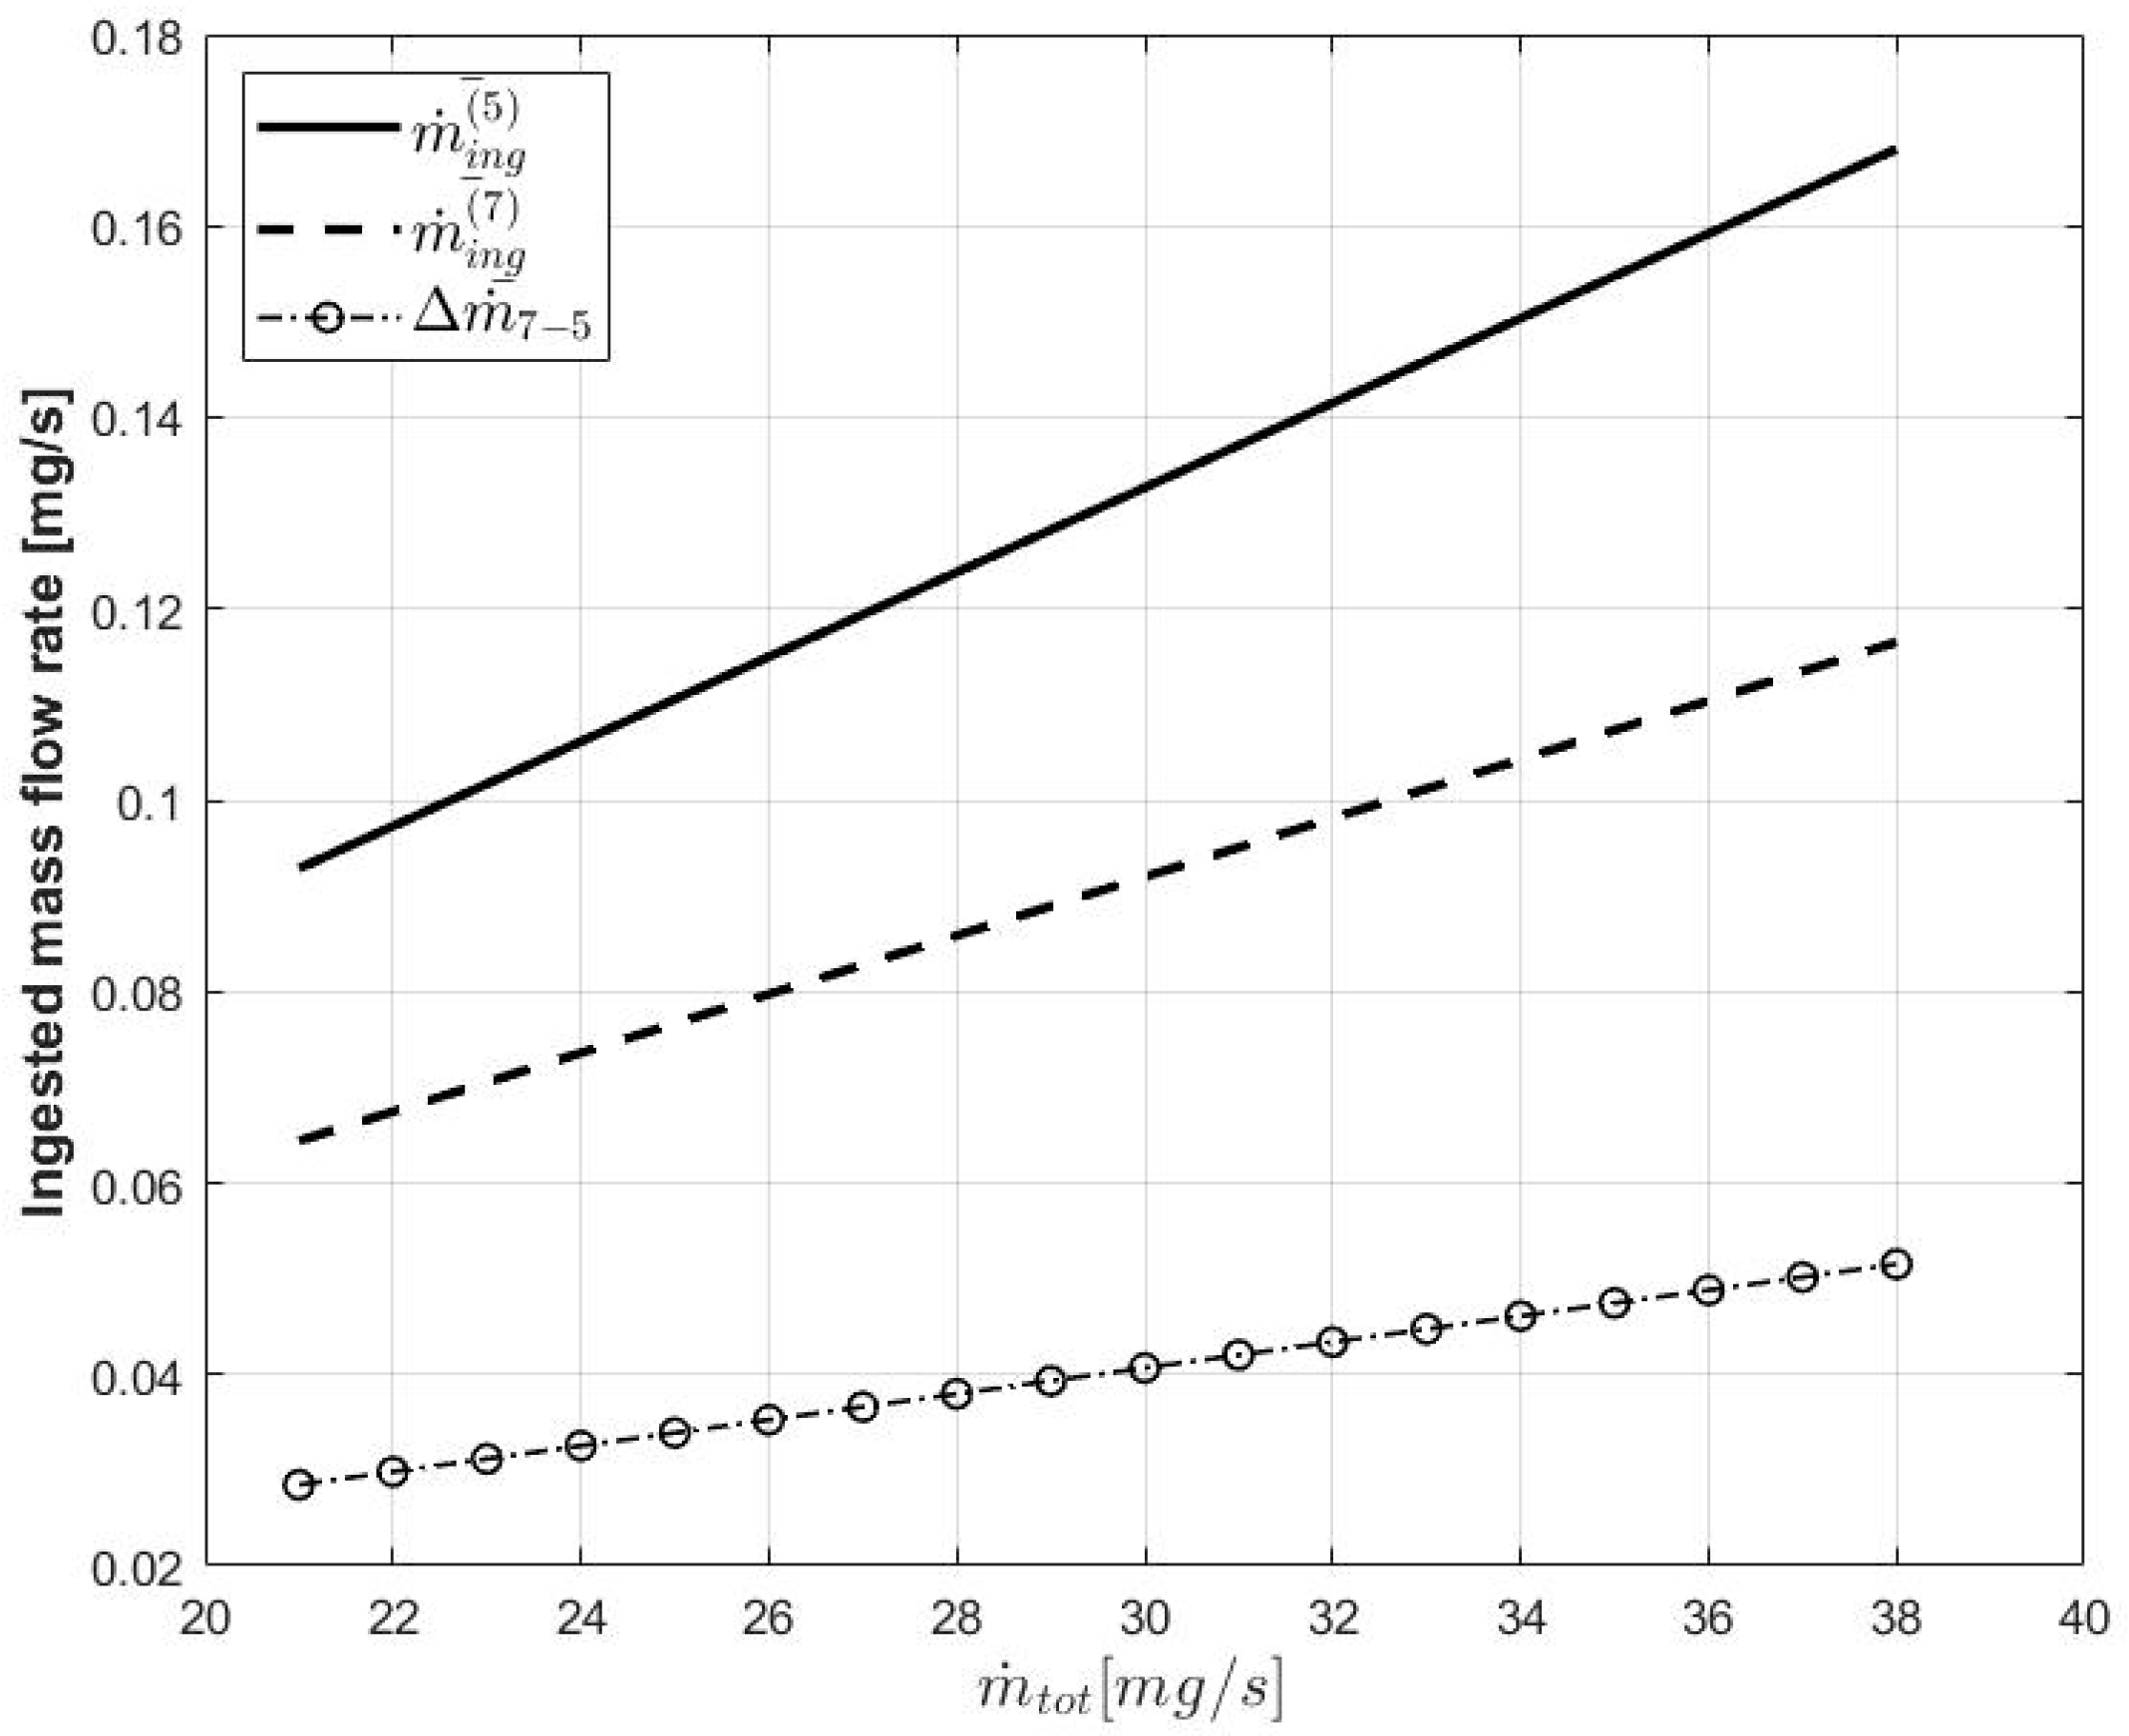
Considering
= 1, and thus the actual anular exit surface, the ingested mass flow rates values with five and seven cold panels are plotted in
Figure 15. Those values were within the error of the anode mass flow controller. Even if the ingested mass flow rates are small and can be neglected from Equation (22), their effect (as the effect of the low density particles coming in the upstream direction) cannot. As a consequence, Equation (22) becomes:
For
, we can say that:
Since the Faraday probe scans measured a negligible change in , the performance variation could be linked to a change in the product .
Since we did not find a significant difference in the divergence, the factor can be thought to be constant, and the change in the can be linked to the change in the product .
The variations of
and
could be related to the plasma response to the change of pressure. Recent studies have found that a shift of the ionization and acceleration region is a cause in this change of performance [
25,
30,
32,
57], in addition to cathode coupling [
33,
34,
58]. Furthermore, the particle density of the neutral particles in the proximity of the channel can be comparable to the particle density of the incoming flow. This, in turn, can lead to a change in the electron mobility in the ionization, acceleration, and near plume regions [
3,
59]. The latter can also explain the change of the plasma oscillations characteristics of the thruster [
60].
Future work will be dedicated to an in-depth study of the physics in the proximity of the channel exit to quantify these changes.
5. Conclusions
A 20 kW-class magnetically shielded Hall thruster was characterized in a SITAEL IV10 vacuum facility. The thruster can be assembled in three configurations with discharge channels of different widths (L > M > S) and a different set of magnetic screens and poles to have the same shielded topology.
The characterization was carried out at fixed anode mass flow rates and at fixed cathode-to-anode mass flow rate ratio (i.e., 8%). The same operative points were repeated with higher pumping speeds and lower pressure levels, and a reduction of the discharge current and thrust was noticed. After analyzing the pressure levels, an estimate of the effective pumping speed and sticking coefficient of the pumps was carried out. The Faraday scans and the discharge current oscillation amplitudes at the two pumping speed levels were also presented. The Faraday scans did not show a significant change in the plume divergence and current utilization efficiency when changing from five to seven panels for each operating point. The cathode to ground voltage values were also presented. Since the channel area of the HT20k DM2 is larger in respect to Hall thrusters of lower power levels, the impact of the ingested mass flow rate could be considerable, and an analysis of the collected data was carried out.
By analyzing the change in the discharge current and thrust, a preliminary estimate of the propellant ingested by the thruster was performed, assuming that the change in performance was only related to a variation of the processed mass flow. The computed apparent levels of ingestions were then compared to an existing state of the art 1D background flow model. The results showed that, in order to explain the change in performance with only a change in the propellant mass flow, the thruster would have to collect on an area that was significantly larger than the channel frontal area. The present results thus indicated that the mechanism of background neutral ingestion is not sufficient to justify the change of thruster performance and that, as previously found out with other Hall thrusters, different mechanisms should be considered. In particular, the increase of background neutral particles may have a significant impact on the plasma properties and electron cross-field mobility, inducing a shift of the thruster acceleration region.
Further work is needed to study and characterize the plasma discharge and the mechanisms that relate thruster performance and background pressure. In particular, there is a need to investigate the physics of the discharge and to obtain a better understanding of the neutral dynamics in the neighborhood of the thruster. From the point of view of technology development and qualification, the results of this wok highlight the need for testing at adequate pressure levels, in the order of 10−4 Pa.


 ,
, 


