Article

A Simplified FE Modeling Strategy for the Drop Process Simulation Analysis of Light and Small Drone

1
School of Civil Aviation, Northwestern Polytechnical University, Xi’an 710072, China
2
China Aircraft Strength Research Institute, Xi’an 710065, China
*
Authors to whom correspondence should be addressed.
Aerospace 2021, 8(12), 387; https://doi.org/10.3390/aerospace8120387
Submission received: 31 October 2021 / Revised: 5 December 2021 / Accepted: 6 December 2021 / Published: 9 December 2021
(This article belongs to the Collection Unmanned Aerial Systems)

Abstract

:
The numerical accuracy of drop process simulation and collision response for drones is primarily determined by the finite element modeling method and simplified method of drone airframe structure. For light and small drones exhibiting diverse shapes and configurations, mixed materials and structures, deformation and complex destruction behaviors, the way of developing a reasonable and easily achieved high-precision simplified modeling method by ensuring the calculation accuracy and saving the calculation cost has aroused increasing concern in impact dynamics simulation. In the present study, the full-size modeling and simplified modeling methods that are specific to different components of a relatively popular light and small drone were analyzed in an LS-DYNA software environment. First, a full-size high-precision model of the drone was built, and the model accuracy was verified by performing the drop tests at the component level as well as the whole machine level. Subsequently, based on the full-size high-precision model, the property characteristics of the main components of the light and small drone and their common simplification methods were classified, a series of simplified modeling methods for different components were developed, several single simplified models and combined simplified models were built, and a method to assess the calculation error of the peak impact load in the simplified models was proposed. Lastly, by comparing and analyzing the calculation accuracy of various simplified models, the high-precision simplified modeling strategy was formulated, and the suggestions were proposed for the impact dynamics simulation of the light and small drone falling. Given the analysis of the calculation scale and solution time of the simplified model, the high-precision simplified modeling method developed here is capable of noticeably reducing the modeling difficulty, the solution scale and the calculation time while ensuring the calculation accuracy. Moreover, it shows promising applications in several fields (e.g., structure design, strength analysis and impact process simulation of drone).

1. Introduction

Drones have a close connection with consumer and industrial needs, which are booming in various fields (e.g., consumer entertainment, cargo transportation, agriculture, forestry and plant protection). As suggested from the forecast of the International UAV Association, the total economy of the drone market will reach 82.1 billion US dollars by 2025 [1]. In addition, drones are constantly enriching people’s lives and leading to the modification of industry models. Though drone designers have introduced the high robust flight control system [2,3], intelligent cooperative scheme [4,5], collision avoidance algorithms [6,7] and collision avoidance systems [8,9] to drones, collision safety issues are inevitable for the restrictions on the reliability of the drone itself and the professionalism of the operators.
In the “Interim Regulations on the Flight Management of UAV (Unmanned Aerial Vehicles)”, China has employed weight standards as the major indicators and integrated other performance indicators of drones for the classification of micro, light, small, medium and large drones. To be specific, light and small drones mainly refer to drones with empty aircraft weight no more than 15 kg, and with the maximum take-off weight no more than 25 kg. As suggested from incomplete statistics, light and small drones take up over 85% of the market share of civilian drones. Moreover, light and small drones are also the most prone to safety accidents for their characteristics of light weight, fast speed and low operating threshold [10,11]. Based on the existing status of collision safety of light and small drones, relevant research on the collision safety of light and small drones have been extensively conducted. However, as limited by the high experiment cost, the combination of test and numerical simulation calculation is considered the most effective method [12]. In numerical simulation methods, high-precision modeling of drones takes up the critical part.
Since 2016, the FAA (Federal Aviation Administration), Virginia Polytechnic Institute and State University [13] and Nanyang Technological University [14] have successively launched the modeling work for small and light drones in the study on drone collision safety. The FAA selected the Phantom 3 UAV and Precision Hawk Lancaster UAV as the research objects, while building the finite element model of the small and light quadrotor drone [15] and the finite element model of the small and light fixed-wing UAV [16] by scanning reverse modeling. Meng et al. [17] built a finite element model of the Inspire I UAV through surveying, mapping and modeling, as well as analyzing the high-speed collision response of UAV and civil aircraft with the model verified experimentally. As revealed from the results, drone collisions with aircraft will cause more impact damage than a strike by a bird of equivalent weight. Lu et al. [18] built finite element models for five different types of civil light and small UAVs with different weights. In addition, they studied the impact damage of light and small drones to the windshield of the aircraft in terms of the flying attitude, material, type, weight and speed of the drones. Moreover, Liu et al. [19] simulated the dynamic response of UAV airborne collision with the manned aircraft engine based on the combination of FEM (Finite Element Method) and CFD (Computational Fluid Dynamics) and discussed the damage severity level of the engine under UAV airborne collision. Furthermore, Song et al. [20,21] compared the structural response of engines between unmanned aircraft system (UAS) and bird ingestion into high-bypass engines. On the basis of summarizing previous studies, Zhang et al. [22] built a high-precision finite element model of small rotor logistics UAVs and designed a full-scale crash test to verify the accuracy of the finite element model. This research scheme of high-precision modeling combined with full-scale test is used for reference in this paper.
Generally, the most critical issue are the calculation accuracy and calculation efficiency for the drone modeling. The calculation accuracy depends on the degree of reproduction of the established finite element model to the real drone, and the calculation efficiency depends on the solution scale and the element size of the finite element model. The higher the degree of reproduction of real drones, the greater the difficulty of modeling and the larger the scale of calculations, and the longer it takes. Thus, the purpose of this paper is to reduce the difficulty of modeling, the finite element model solution scale and the consumption of resources (e.g., computing time) as much as possible, under the premise of ensuring calculation accuracy.
In the present study, a small and light drone with the maximum market share was selected for full-size modeling and simplified modeling research based on LS-DYNA commercial finite element dynamic analysis software. In this modeling study, a full-size finite element model of the drone was built. Subsequently, the model underwent the component-level and complete-machine-level modeling analysis. Different experimental verifications were conducted on the component-level and complete-machine-level finite element models to ensure the full-size finite element model built as a full-size high-precision model. A specific full-size high-precision modeling and experimental verification method was formed. Because the full-scale high-precision modeling process is more complicated, the modeling process took a long time, and full-scale high-precision models were not required in several analyses. Thus, we have proposed some simplified modeling methods, given some general simplified modeling methods for different parts, and simplified modeling of the drone. Firstly, based on the full-scale high-precision drone finite element model built, a series of simplifications of the model were conducted to varying degrees from the perspective of the structural and material characteristics of different parts and components. Secondly, the simplified model’s impact load change trend, impact load peak error and drone deformation response were compared and then verified with the full-scale high-precision model and experiments. Lastly, a specific light-small drone simplified high-precision modeling method was obtained and relevant simplified modeling strategies and suggestions were presented.

2. Full-Size High-Precision Finite Element Modeling of Light and Small Drones

The research object selected here refers to an aerial drone with the maximum utilization rate on the market. The overall size of the drone was 252 mm × 298 mm × 88 mm, the total weight was 907 g, and the maximum flight speed was 20 m/s. It is a kind of light and small drone among UAVs, as shown in Figure 1a. The full-size high-precision modeling of drone consisted of two parts, that is, high-fidelity geometric modeling and full-size high-precision finite element model modeling. Moreover, high-fidelity geometric modeling is the premise of full-size high-precision finite element modeling.

2.1. High-Fidelity Geometric Modeling

In the process of geometric modeling, a reverse engineering method was adopted to build a high-fidelity geometric model of the drone. The scanning accuracy of the scanner could reach 0.01 mm, so the accuracy of modeling could be ensured. Reverse modeling fell to three steps: (1) scanning to obtain point cloud data, (2) building a triangular mesh model, as well as (3) entity modeling. The parts modeled in this reverse scan cover all curved parts and regular parts except circuit boards. Different from the traditional method of numerical modeling mainly based on the outer surface of the drones, the outer surface and internal structure of each part of the drone was scanned in detail by three-dimensional scanner, without omitting any geometric features of each part of the drone, and the numerical model of the drone performs detailed inverse modeling of the internal and outer surfaces, internal stiffeners, connectors, connection holes and other structures of all parts of the drone. The weight of each component of the drone in numerical modelling was exactly the same as in actual, and a high-fidelity geometric model of the drone was built.

2.2. Full-Size High-Precision FE (Finite Element) Model

The existing drone high-fidelity geometric model was used to build a full-size finite element model. Figure 1a illustrates the built full-scale finite element model of the whole drone; Figure 1b shows the internal structure of the fuselage finite element model (e.g., connecting structure, positioning structure and stiffeners). The thickness of each part of the drone component was the actual scanning measurement value, ensuring the accuracy of the full-size finite element model built. The thin-walled parts in the drone were modeled by shell elements, solid elements were used to represent batteries, motors and others, beam elements and spring elements were employed for the connection structure between the parts. To ensure the calculation accuracy, the finite element mesh size of drone was relatively small, with the average size of 2 mm, and the minimum time step was no less than 1 × 10⁻⁷ s. The full-size model of the drone consisted of 89,102 shell elements, 53,783 solid elements, 52 beam elements, 4 spring damping elements, as well as 14 rotating joint elements. The Element types and integration methods corresponding to the parts of the drone are shown in Table 1, and ELFORM is the abbreviation of the element formulations in LS-DYNA.
Full-size modeling comprised the detailed modeling of each part, as well as the detailed modeling of the connection relationship between different parts or components in accordance with their real structures. The connection relationship between the different parts or components of the drone here was relatively complicated, and the various connection relationships of the drone were refined in the full-size model. The following four connection methods in the drone were presented, and a different modeling method was adopted for each connection relationship. The built finite element model of the connection structure truly restored its corresponding real connection mode. Figure 2 presents modeling methods of different connection relationships.
(i) Bolt connection. Bolt connection refers to the most common connection method in drones. There were 52 bolts in this drone. All bolts were modeled by NRB + Beam, and the two bolt holes were modeled by Nodal Rigid Body and connected with Beam elements. Subsequently, the bolts at different positions were simulated by setting different cross-sectional dimensions to the beam elements. The section size of the beam element in each bolted connection structure defined its section properties according to the actual size of each bolt, and the length was the distance between the center points of the bolt holes of the two parts connected by the bolt. The bolt material in the drone is high-carbon steel, so the beam elements in the bolted connection structure were given the material properties of steel. The stiffness coefficient of the beam element is K = E A / L , where E   is the elastic modulus, A   is the bolt section area, and L   is the bolt length. Therefore, for each bolt in the drone, its elastic modulus, cross-sectional area, and length are all fixed values, and its stiffness coefficient K is a fixed value.
(ii) Spring damping connection. To stabilize the camera gimbal for vibration prevention, the camera gimbal was connected to the fuselage through NRB + Spring, and the appropriate stiffness coefficient of the spring was defined by complying with the practical test.
(iii) Revolute joint. To achieve a convenient carrying, the drone adopted a folding front and rear arms, capable of rotating around the axis of the joint with the fuselage. Moreover, the propeller of the drone could rotate freely on the propeller seat around its axis. The components of the camera gimbal were connected by a micro-motor, capable of rotating freely without the power applied, so the camera lens could rotate with multiple degrees of freedom. In the present study, a four-layer revolute joint modeling method [23] was adopted for the connection between the arm and the fuselage, the propeller and the base, as well as the components in the camera gimbal. The nodes around the revolute joint holes of each layer were used to build a rigid body of the node through the Nodal Rigid Body. Next, the central nodes of the four rigid bodies were connected in turn with the revolute joint element. Lastly, the central independent nodes of the rigid bodies of the two layers on each side were moved to a common position (the identical and independent coordinates) to build a revolute joint.
(iv) Buckle connection. The drone battery exhibited a detachable structure and was connected to the fuselage through a buckle. In the finite element model, the buckle was not modeled separately, whereas it was modeled by Tie-Break contact [23]. Independent contact segments were built for the elements on both sides of the buckle position and contact failure stress was set. By assigning different failure values to compare with the test, the failure stress is considered 50 MPa.
The main structural materials of the drone include: Polycarbonate, Magnesium alloy, Aluminum alloy 6061, and Nylon. Other materials include: Silica gel, Steel, Battery chip, Circuit board. The materials corresponding to each part of the drone are shown in Figure 1c, and the material parameters come from the previous research. The three main body structural materials are all modeled by Johnson-Cook material model, and the material parameters are shown in Table 2. The mechanical properties of Polycarbonate come from the research of Dwivedi, A. et al. [24] E. Giraud et al. [25] studied the properties of Magnesium alloy materials, and Fan et al. [26] gave the constitutive parameters of Aluminum alloy 6061 materials. The propeller of the drone is made of nylon material, and the *MAT_PLASTIC_KINEMATIC constitutive model is used to model it. The material parameters [27,28] are shown in Table 3. According to the research of Sahraei, Meier and Wierzbicki et al. [29,30], the complete lithium-ion battery parameters are obtained, as shown in Table 4. For the laminated steel core stator with copper wire windings and steel outer wall in the drone motor, because the finite element model was simplified, it was assumed that the steel in the motor is 4030 steel, and the mechanical properties of the material came from MMPDS [31]. The circuit board of the drone is usually made of glass fiber-epoxy composite laminate covered with a copper layer, which is a typical anisotropic composite material. The typical composite laminate used for this application is G-10. Ravi-Chandar and Satapathy [32] tested the mechanical properties of G-10. Table 5 shows the basic material parameters of G-10. This paper used the *MAT_054 (MAT_ENHANCED_COMPOSITE_DAMAGE) constitutive model to model the circuit board.
Due to the possibility of contact between the various parts of the drone and between the parts themselves during the large deformation process of the drop collision, and the location of the contact cannot be judged in advance. Therefore, nodes-to-surface contact and surface-to-surface contact are not suitable here, so single-surface contact (*CONTACT_AUTOMATIC_SINGLE_SURFACE) is the most suitable for contact modeling [33,34] for possible contact detection of all components. Though this contact algorithm consumes considerable computing resources, it remains very suitable for such multi-component and large-deformation calculations. The program automatically detects all external surface nodes in the model at each time step to detect whether penetration has occurred, as well as exploiting the correct contact force to avoid penetration. The material properties of each part of the drone were quite different, so the segment-based soft constraint method (SOFT = 2) contact algorithm was enabled.

3. Component-Level and Complete-Machine-Level Verification Tests for Civilian Light and Small Drones

To verify whether the built full-size model and simplified model are high-precision models and the rationality of the simplified method applied for building the simplified model, the component-level and complete machine-level verification tests were conducted. The component-level verification test included a component drop test and a component drop-weight compression test. The model in which the concentrated mass block was removed from the complete machine model is termed as the component model, where the concentrated mass block included the battery, motor and camera gimbal. The complete machine-level verification test covered the complete machine positive posture drop test and the complete machine vertical posture drop test. In this chapter, the test methods and test results of the component test and the whole machine test were elucidated, and the built full-size finite element model of the drone were compared and verified by four sets of tests. The verification method falls to three aspects, that is, impact load change trend, impact load peak error and drone deformation response. The four sets of experiments were also adopted to verify the accuracy of the simplified model built below and the rationality of the simplified method proposed.

3.1. Component-Level Experiment

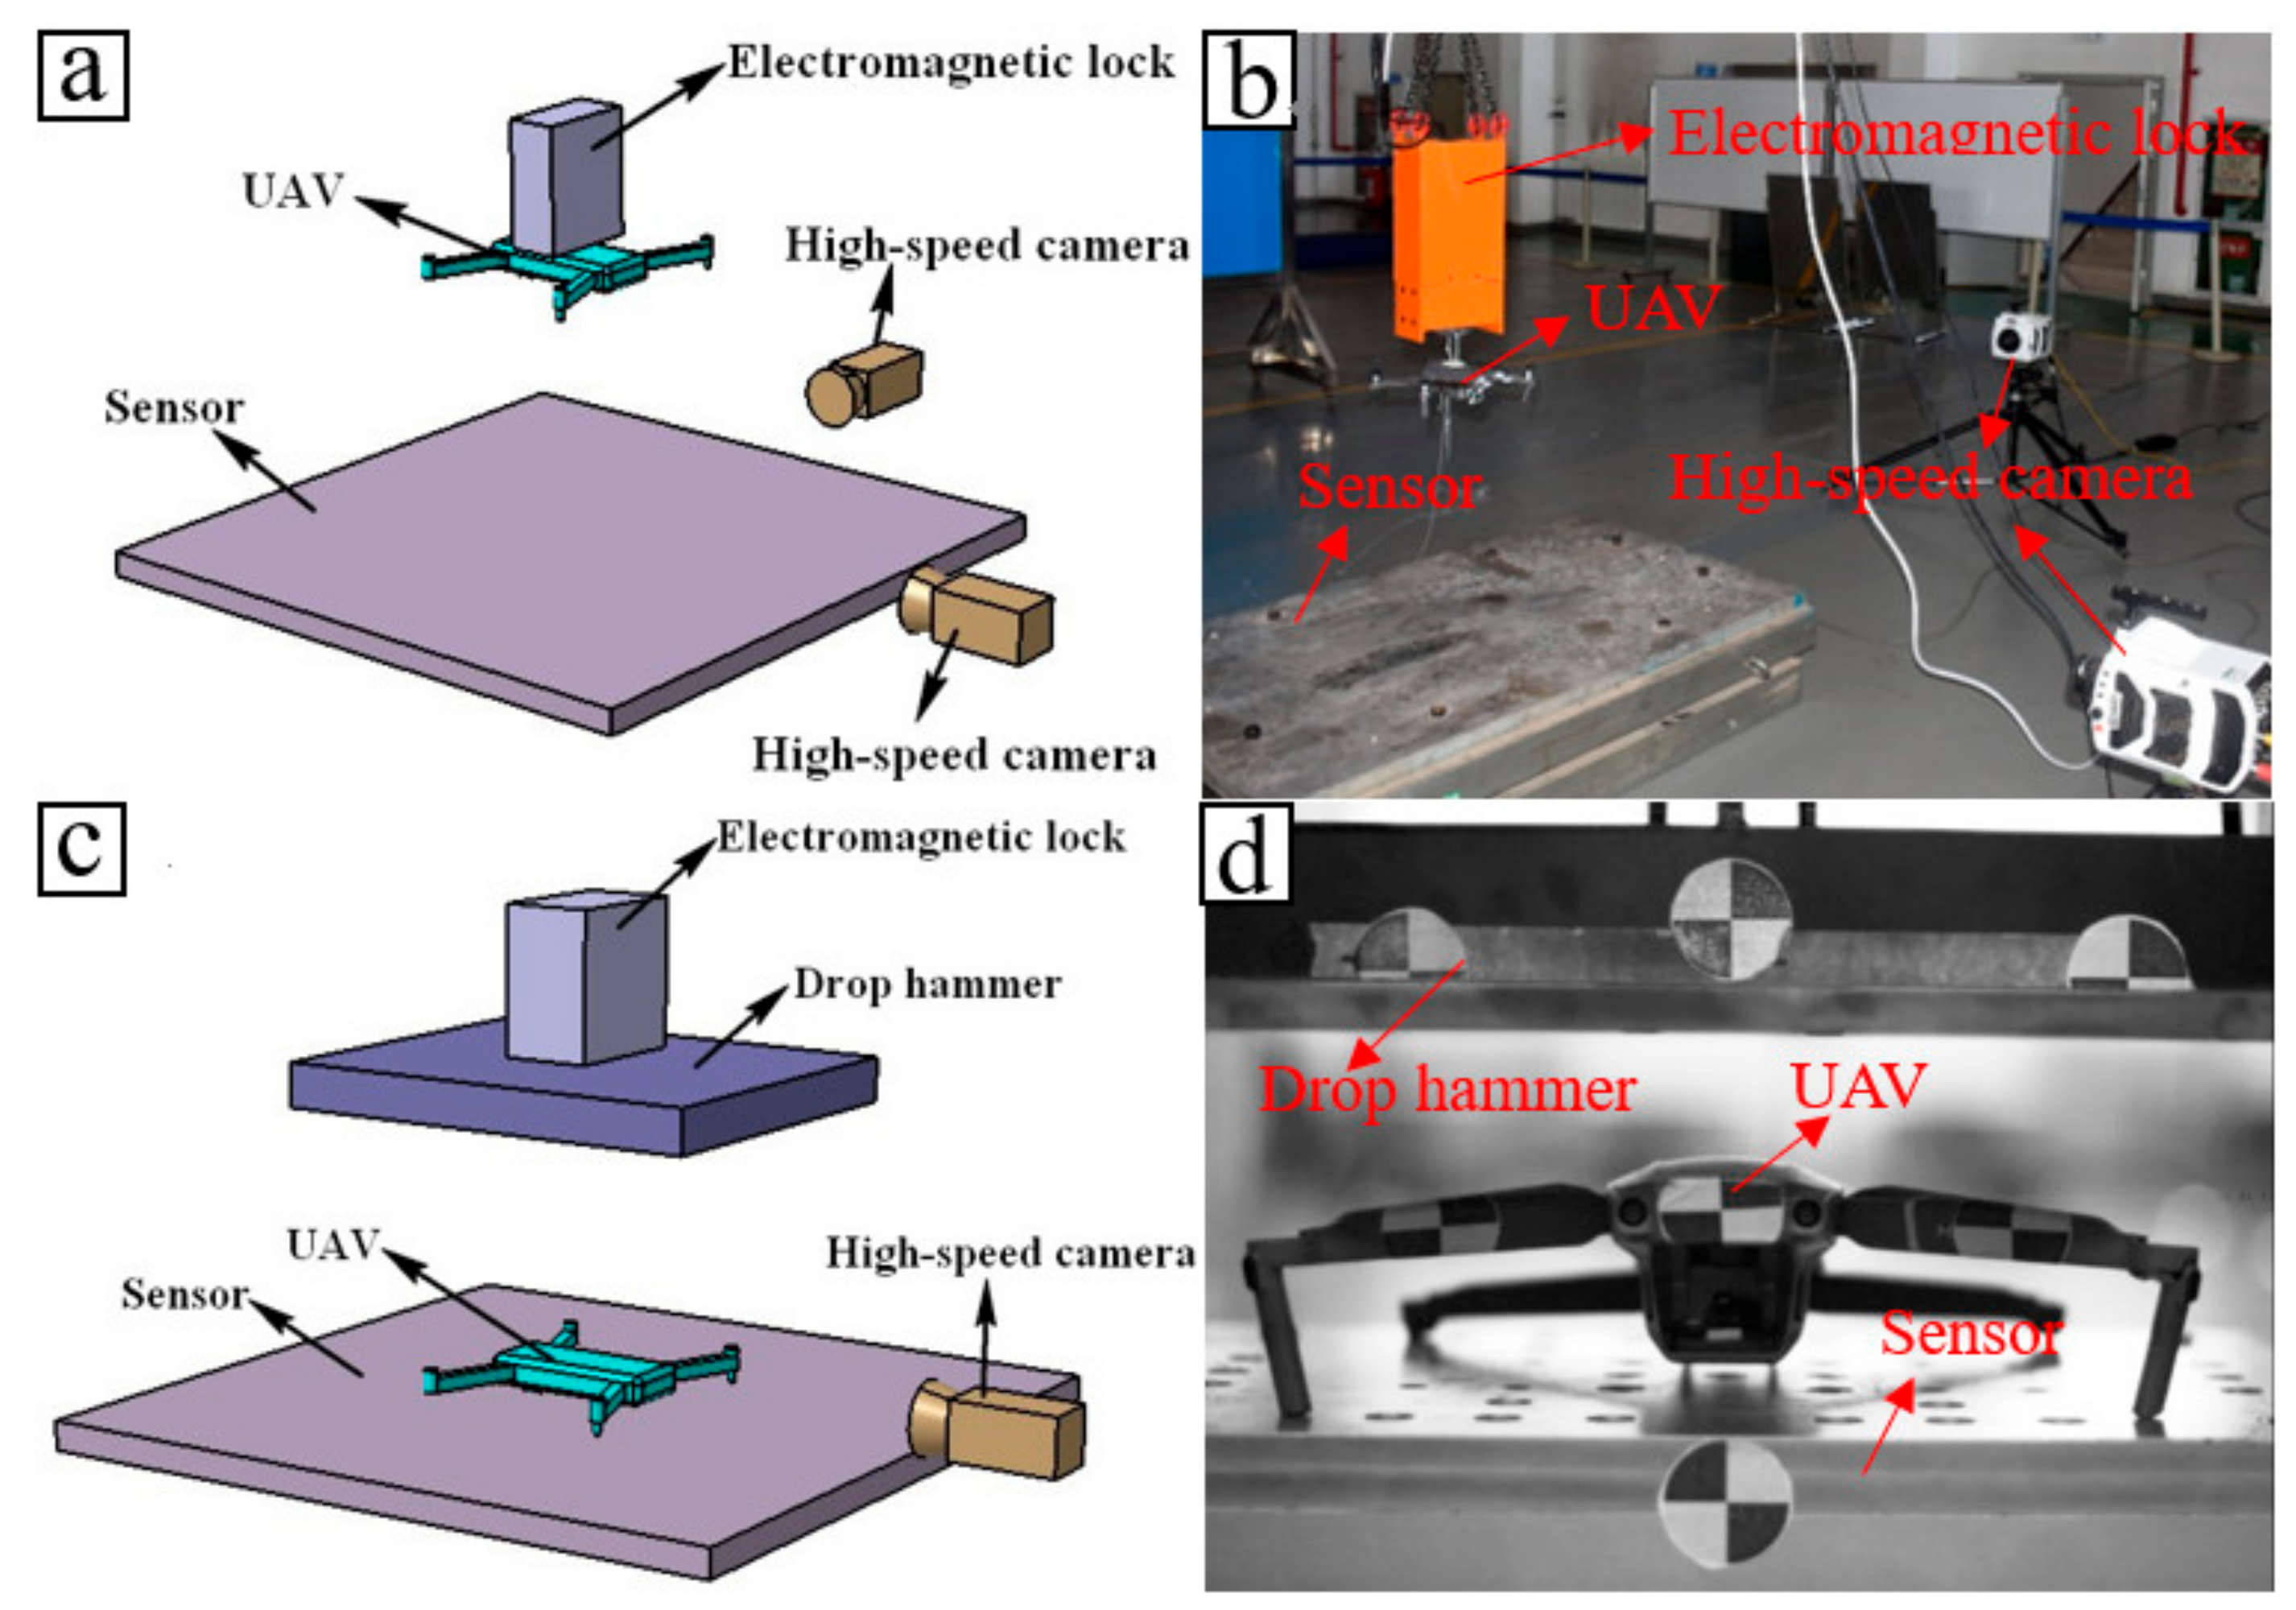
The component-level verification test covered a component drop test and a component drop-weight compression test. The two sets of experiments were performed with the identical experimental device. The main equipment applied in the test comprised a drone, a test lift release system, a force measurement platform (load sensor), a high-speed camera, and a piece of data acquisition equipment.
The component drop test was performed based on the free fall method of the drone component. The schematic diagram of the experimental device is shown in Figure 3a, and the experimental layout is presented in Figure 3b. The drone component drop test items were largely comprised of drop impact load, drop attitude, drop speed, and drone component deformation response. The impact load was measured with the load sensor of the force measurement platform with a sensor sampling rate of 10 kHz; the drop posture, falling speed, and deformation response of the drone components were measured and recorded with two high-speed camera systems arranged on the front and side of the force measurement platform, respectively. During the test, the drone components were installed and suspended on the electromagnetic lock. In addition, the electromagnetic lock and the drone components were lifted to the target height by the lifting device, and their posture was appropriately tuned to align with the center area of the force measurement platform. After each system was ready for the test, the electromagnetic lock released the drone components, the free fall fell and hit the load sensor, and the test subsystems were triggered synchronously. Then, the test ended under the completely stationary test piece. Combined with the average flight speed of the drone, the target falling speed of the test drone was 9~10 m/s, and the target lifting height of the drone was 5 m. 
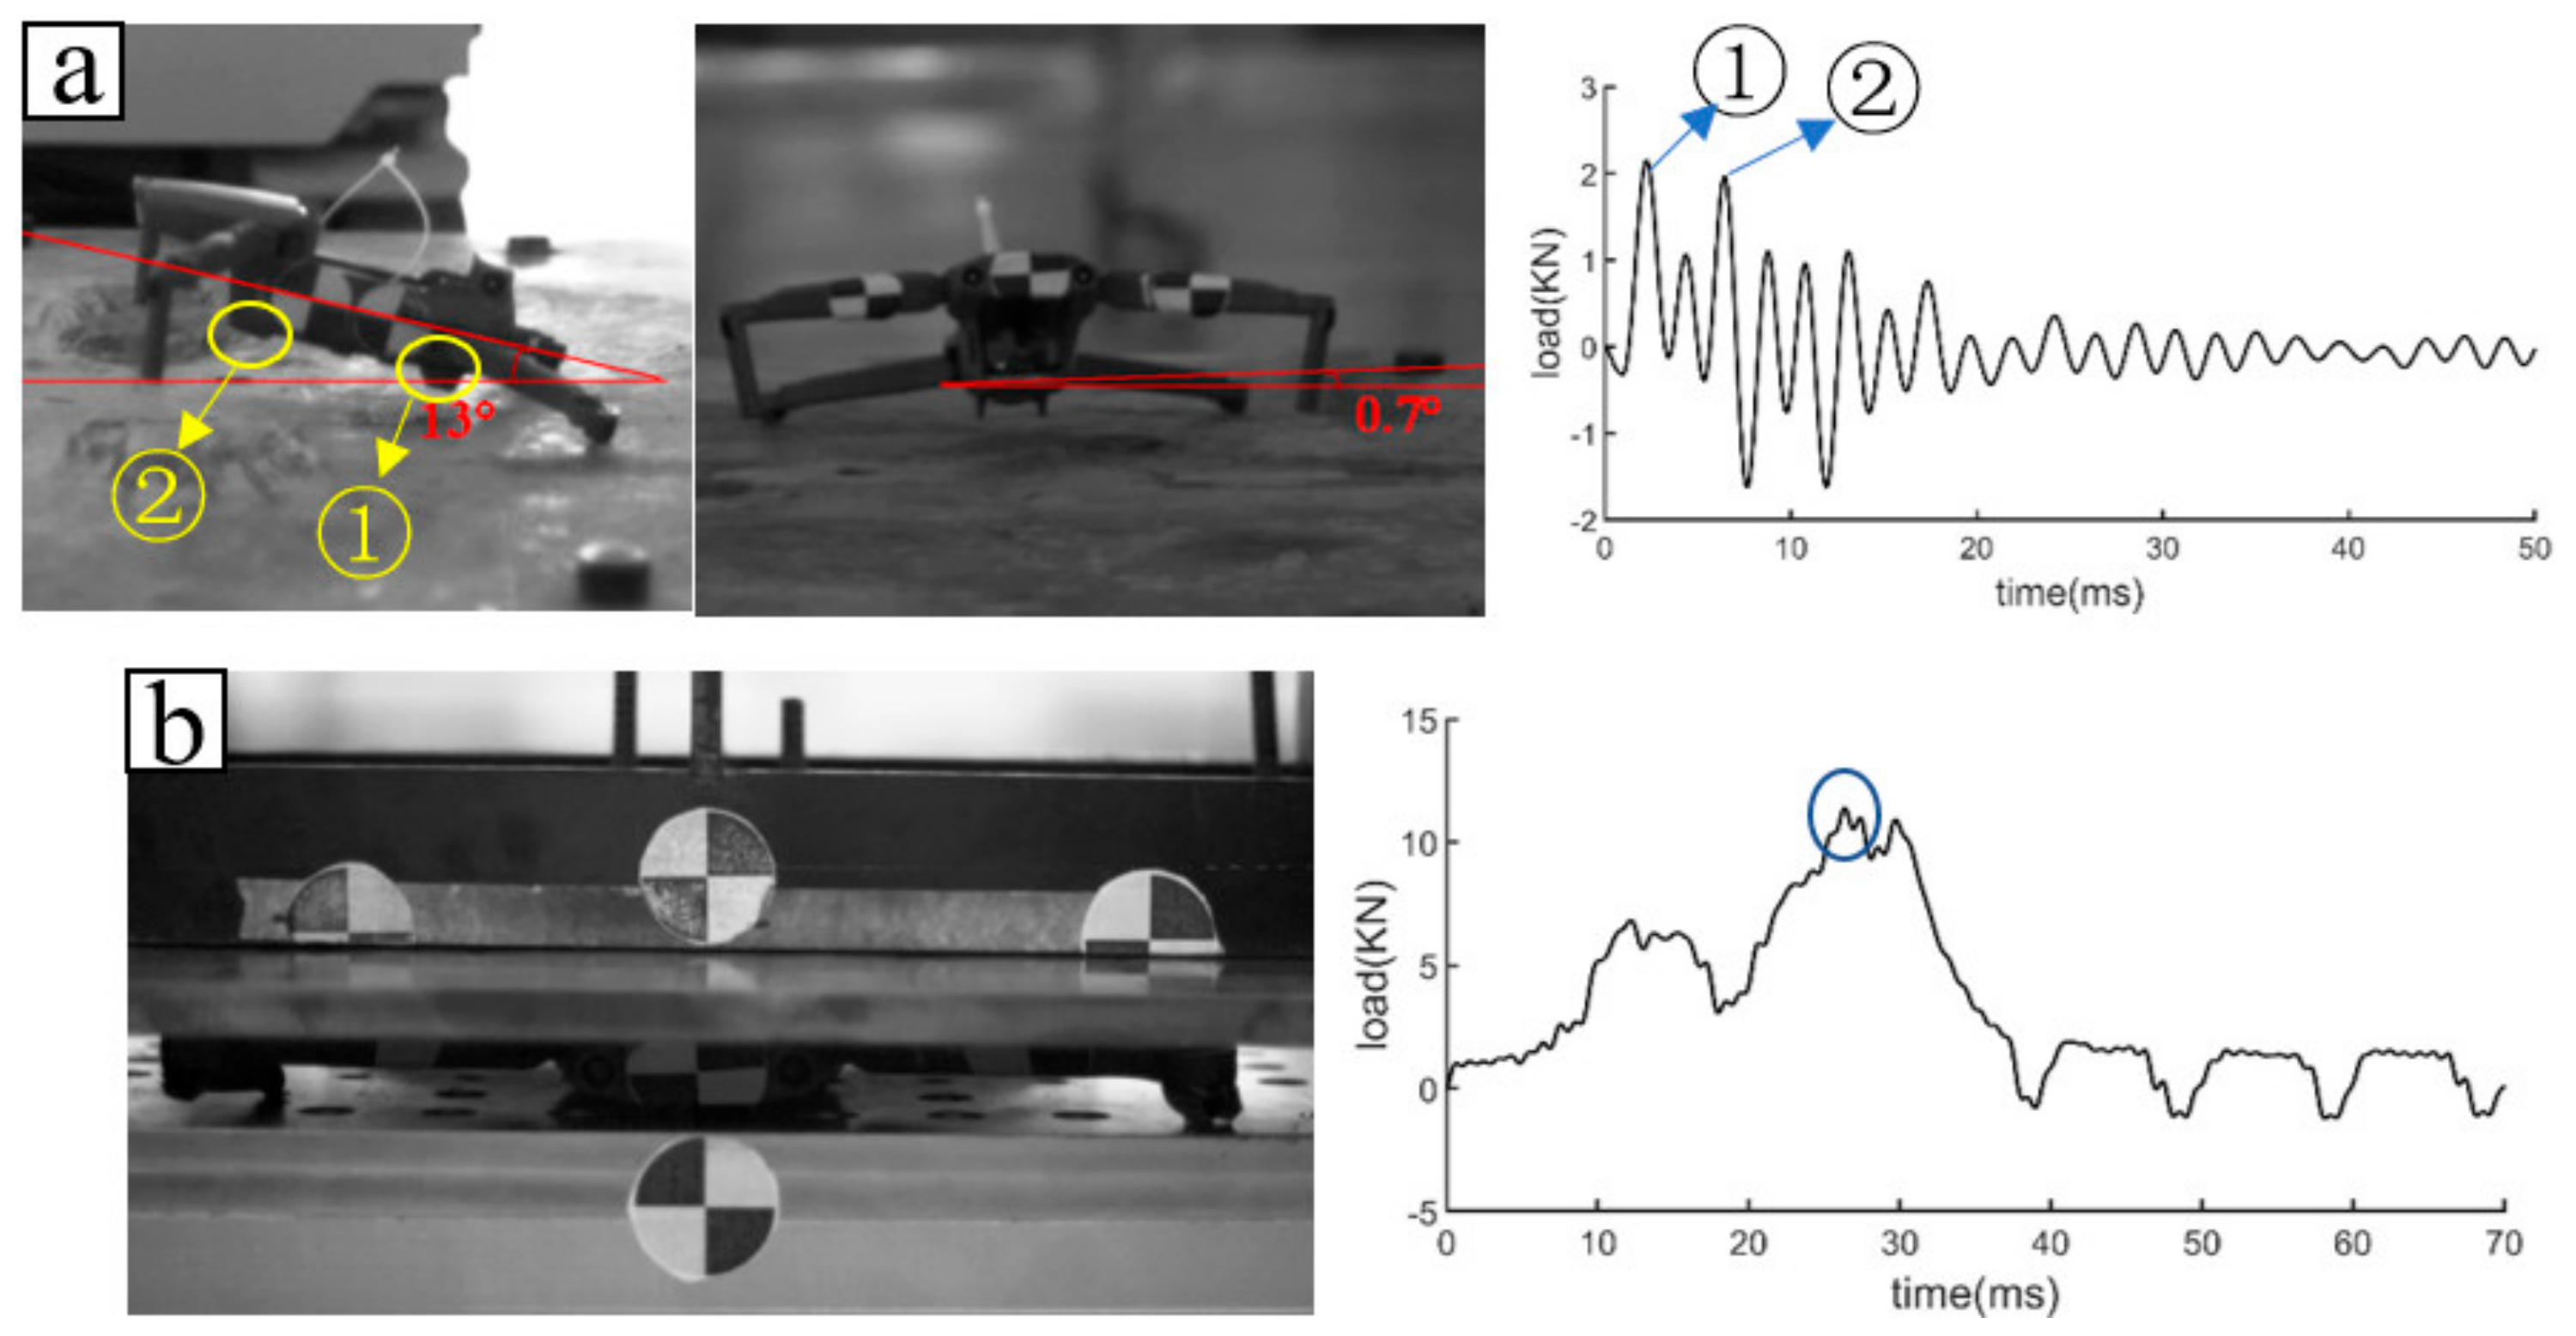
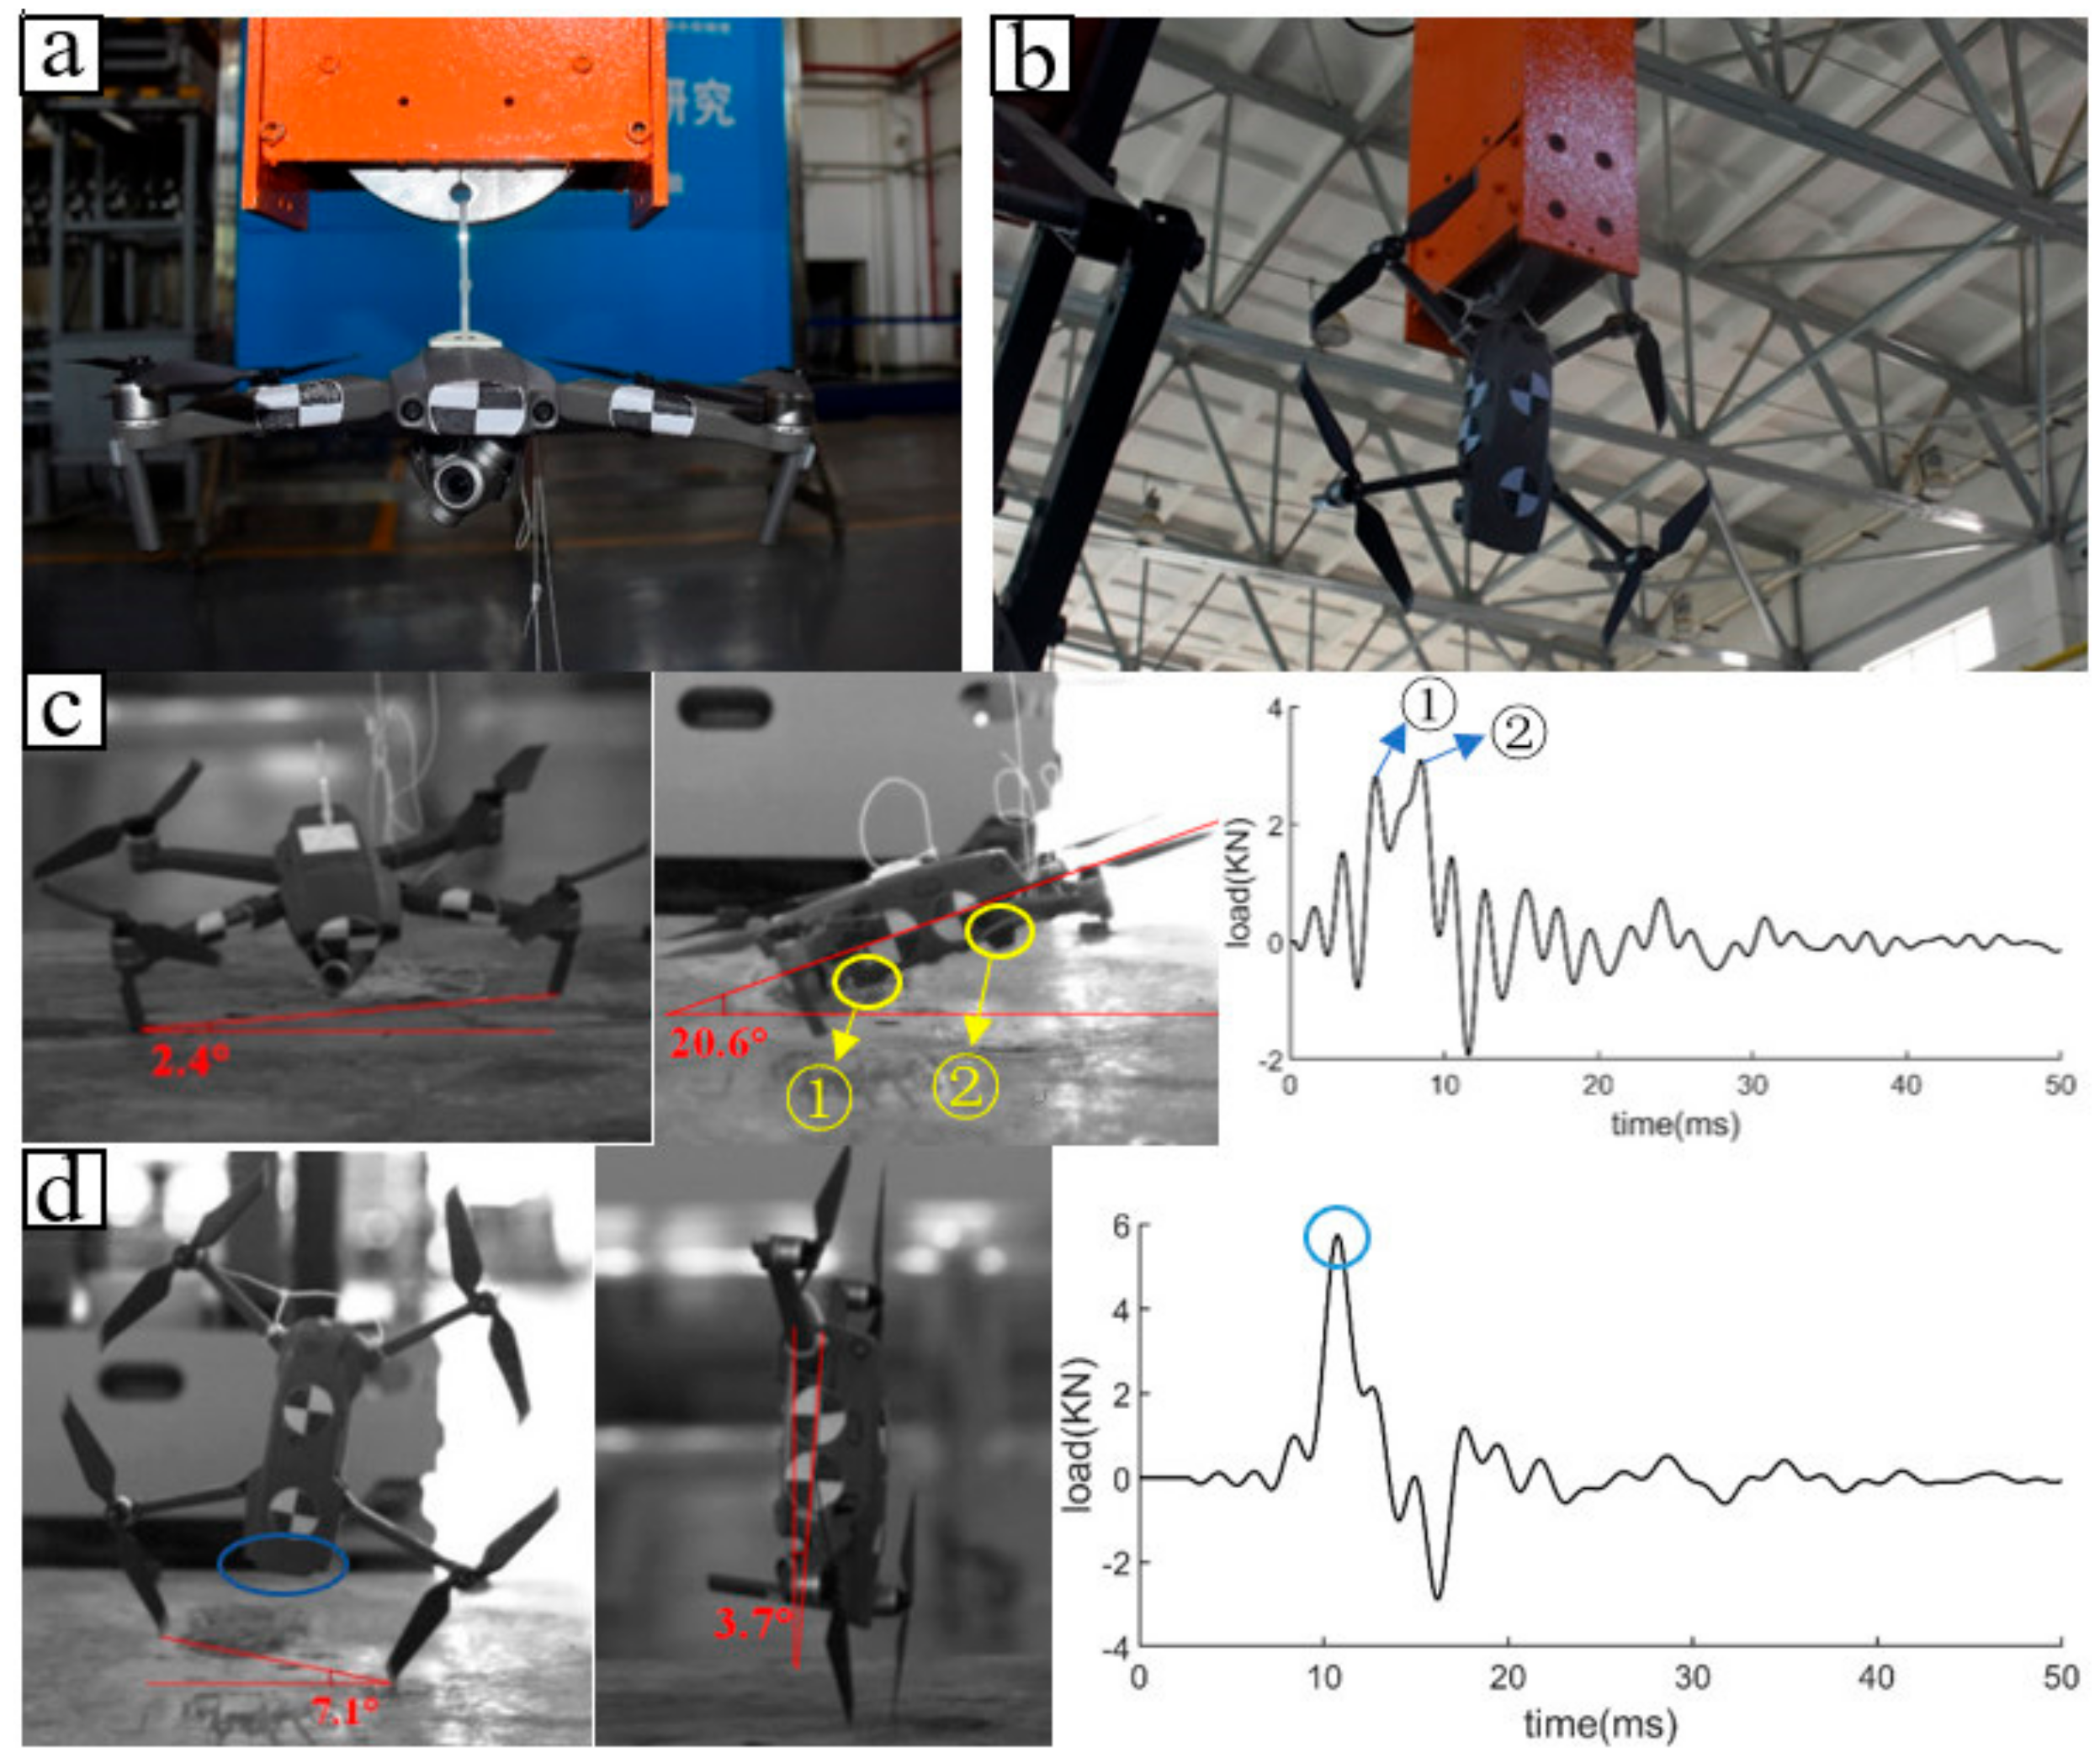
Figure 4a gives the drop posture of the drone components at the moment of landing and the impact load of the drone on the sensor. The speed of the drone at the moment of landing captured with the high-speed camera was 9.05 m/s, the deflection angle was 0.7°, and the pitch angle reached 13°, that is, a typical single-point crash. The impact load of drone components covered two wave crests. The first wave crest represents the time when the bottom silicone pedestal of the drone component (marked as ① in Figure 4a) completely landed, and the second wave crest corresponds to the time when the protective plate at the front end of the bottom plate of the drone component (marked as ② in Figure 4a) completely landed.
The component drop-weight compression test was performed based on the free fall of the drop hammer. The schematic diagram of the experimental device is given in Figure 3c, and the experimental layout is shown in Figure 3d. The test items of the drone component drop-weight test primarily included the compression impact load, the initial velocity of the drop hammer, as well as the deformation response of the drone component. The compressive load was measured with the load sensor of the force measurement platform; the initial velocity of the drop hammer and the deformation response of the drone components were measured and recorded by the high-speed camera system arranged on the front of the force measurement platform. In the test, the drop hammer was installed and hung on the electromagnetic lock, and the electromagnetic lock and the drop hammer were elevated to the target height by the lifting device, and their position and posture were tuned to maintain a horizontal posture. The drone component was placed horizontally on the load sensor, and the geometric center of the drone component was aligned with the geometric center of the drop hammer to ensure the drop hammer to completely fall on the drone component. After each system was ready for the test, the electromagnetic lock released the drop hammer, which hit the drone components vertically, triggered each test subsystem simultaneously and ended the test after the drop hammer turned completely stationary. Given the significantly high probability of a collision between a drone and a driving car, the impact speed of the drop hammer in this test was determined according to the speed of the collision between a normal driving car and a drone. This study assumed that the speed of a normal car in the urban area is 50 km/h, and the speed of a drone flying at full speed was 20 m/s. When the drone collided with a normal driving car from opposite directions, the relative speed of the collision was about 33.35 m/s. The weight of the component-level drone reached 345 g, and the weight of the drop hammer was 47.75 kg. In this scenario, assuming that the car is stationary, the drone hit at a speed of 33.35 m/s, and the corresponding kinetic energy was 191.8595 J. In the practical test, the drone was at a standstill, and the falling hammer moved. Next, the kinetic energy of the drop hammer at the moment of contact with the drone was 191.8595 J, and the corresponding speed of the drop hammer was 2.835 m/s. Thus, the lifting height of the drop hammer in this test reached 0.41 m.
Figure 4b plots the compression load curve measured with the load sensor and the maximum value of the compression load (marked in Figure 4b) corresponding to the deformation and destruction of the drone component when the drone component was being compressed with the drop hammer. Then, the fuselage was severely deformed, and the connections between the two front arms were disconnected. The actual speed at the moment when the drop hammer touched the drone component captured with the high-speed camera was 2.82 m/s.

3.2. Complete Machine-Level Experiment

After the component test, two sets of drop tests were performed with different postures on the complete machine. Due to the high risk of explosion and fire for drone lithium batteries under compression conditions, the complete machine-level drop-weight compression test was not performed without protection. The complete machine-level test consisted of the complete machine positive posture drop test and the complete machine vertical posture drop test. The complete machine-level drop test device, test process and test items of the drone were completely consistent with the drop test of the drone components. The test device is illustrated in Figure 3a,b. The only difference was that the drone component was replaced with the drone complete machine. The installation posture of the drone for the positive posture drop test and the vertical posture drop test are shown in Figure 5a,b, respectively. Furthermore, according to the normal flight speed of the drone, the drone target falling speed was 9~10 m/s, and the drone target lifting height was 5 m.
Figure 5c illustrates the drop posture of the drone at the moment of landing in the positive posture and the impact load of the drone during the fall. Photographed by the high-speed camera: the drone landing speed was 9.38 m/s, the deflection angle was 2.4°, and the pitch angle reached −20.6°. The left front arm landed first, that is, a typical single-point crash. The drone impact load covered two wave crests. The first wave crests correspond to the time when the protective plate at the front end of the bottom plate of the drone (marked as ① in Figure 5c) fully landed, and the second wave peak represent the time when the bottom silicone pedestal (marked as ② in Figure 5c) fully landed.
Figure 5d shows the drop posture of the drone at the moment of landing in the vertical posture and the impact load of the drone during the fall. As photographed by the high-speed camera, the drone landing speed was 9.42 m/s, the deflection angle was 7.1°, and the pitch angle reached −3.7°. The right propeller landed first, but because the propeller can rotate freely around its axis, the landing of the propeller does not cause significant impact load on the force measurement platform. The maximum load value marked in Figure 5d represents the moment when the front shroud of the drone fuselage completely landed.

3.3. Comparative Verification of Full-Size Model

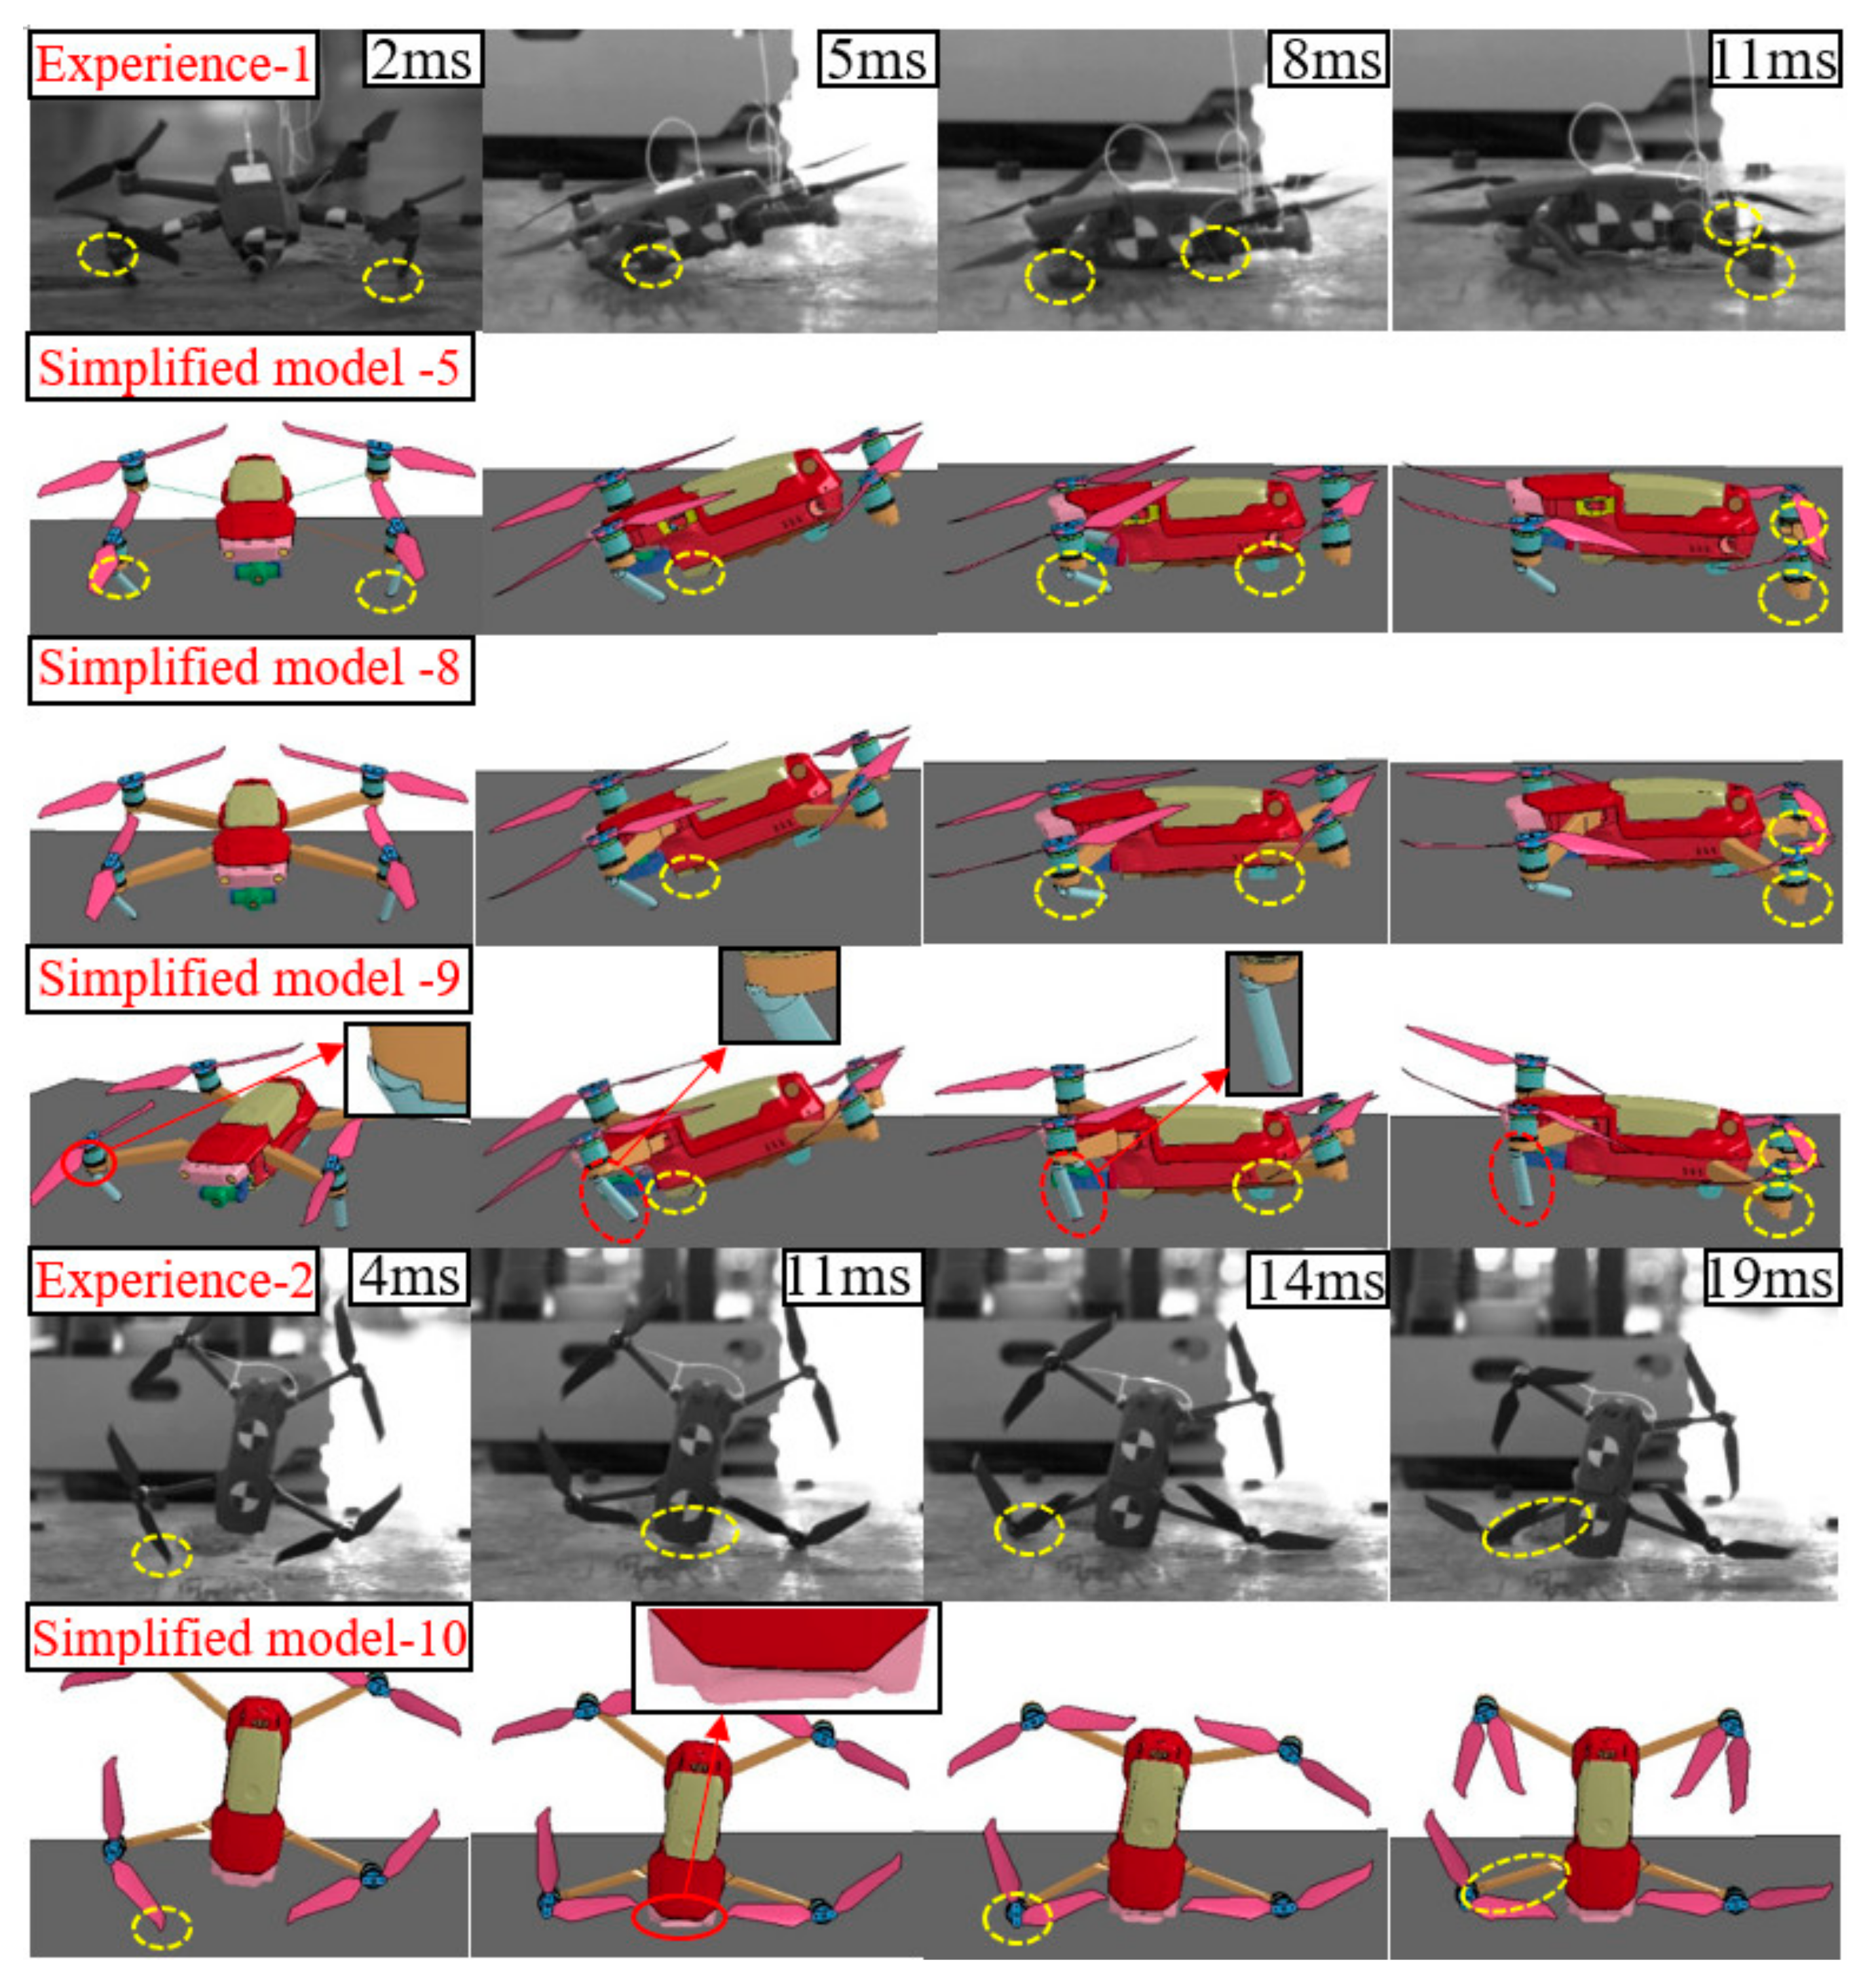
In the present section, the full-size model built was verified at the component-level and the complete machine-level by the above four tests. It was mainly verified from the three aspects of drone deformation response, impact load peak error and impact load change trend. With the high-speed camera, the complete deformation response process of the drone could be clearly suggested, and the deformation response was extracted at several typical moments for comparison with the simulation calculated results.
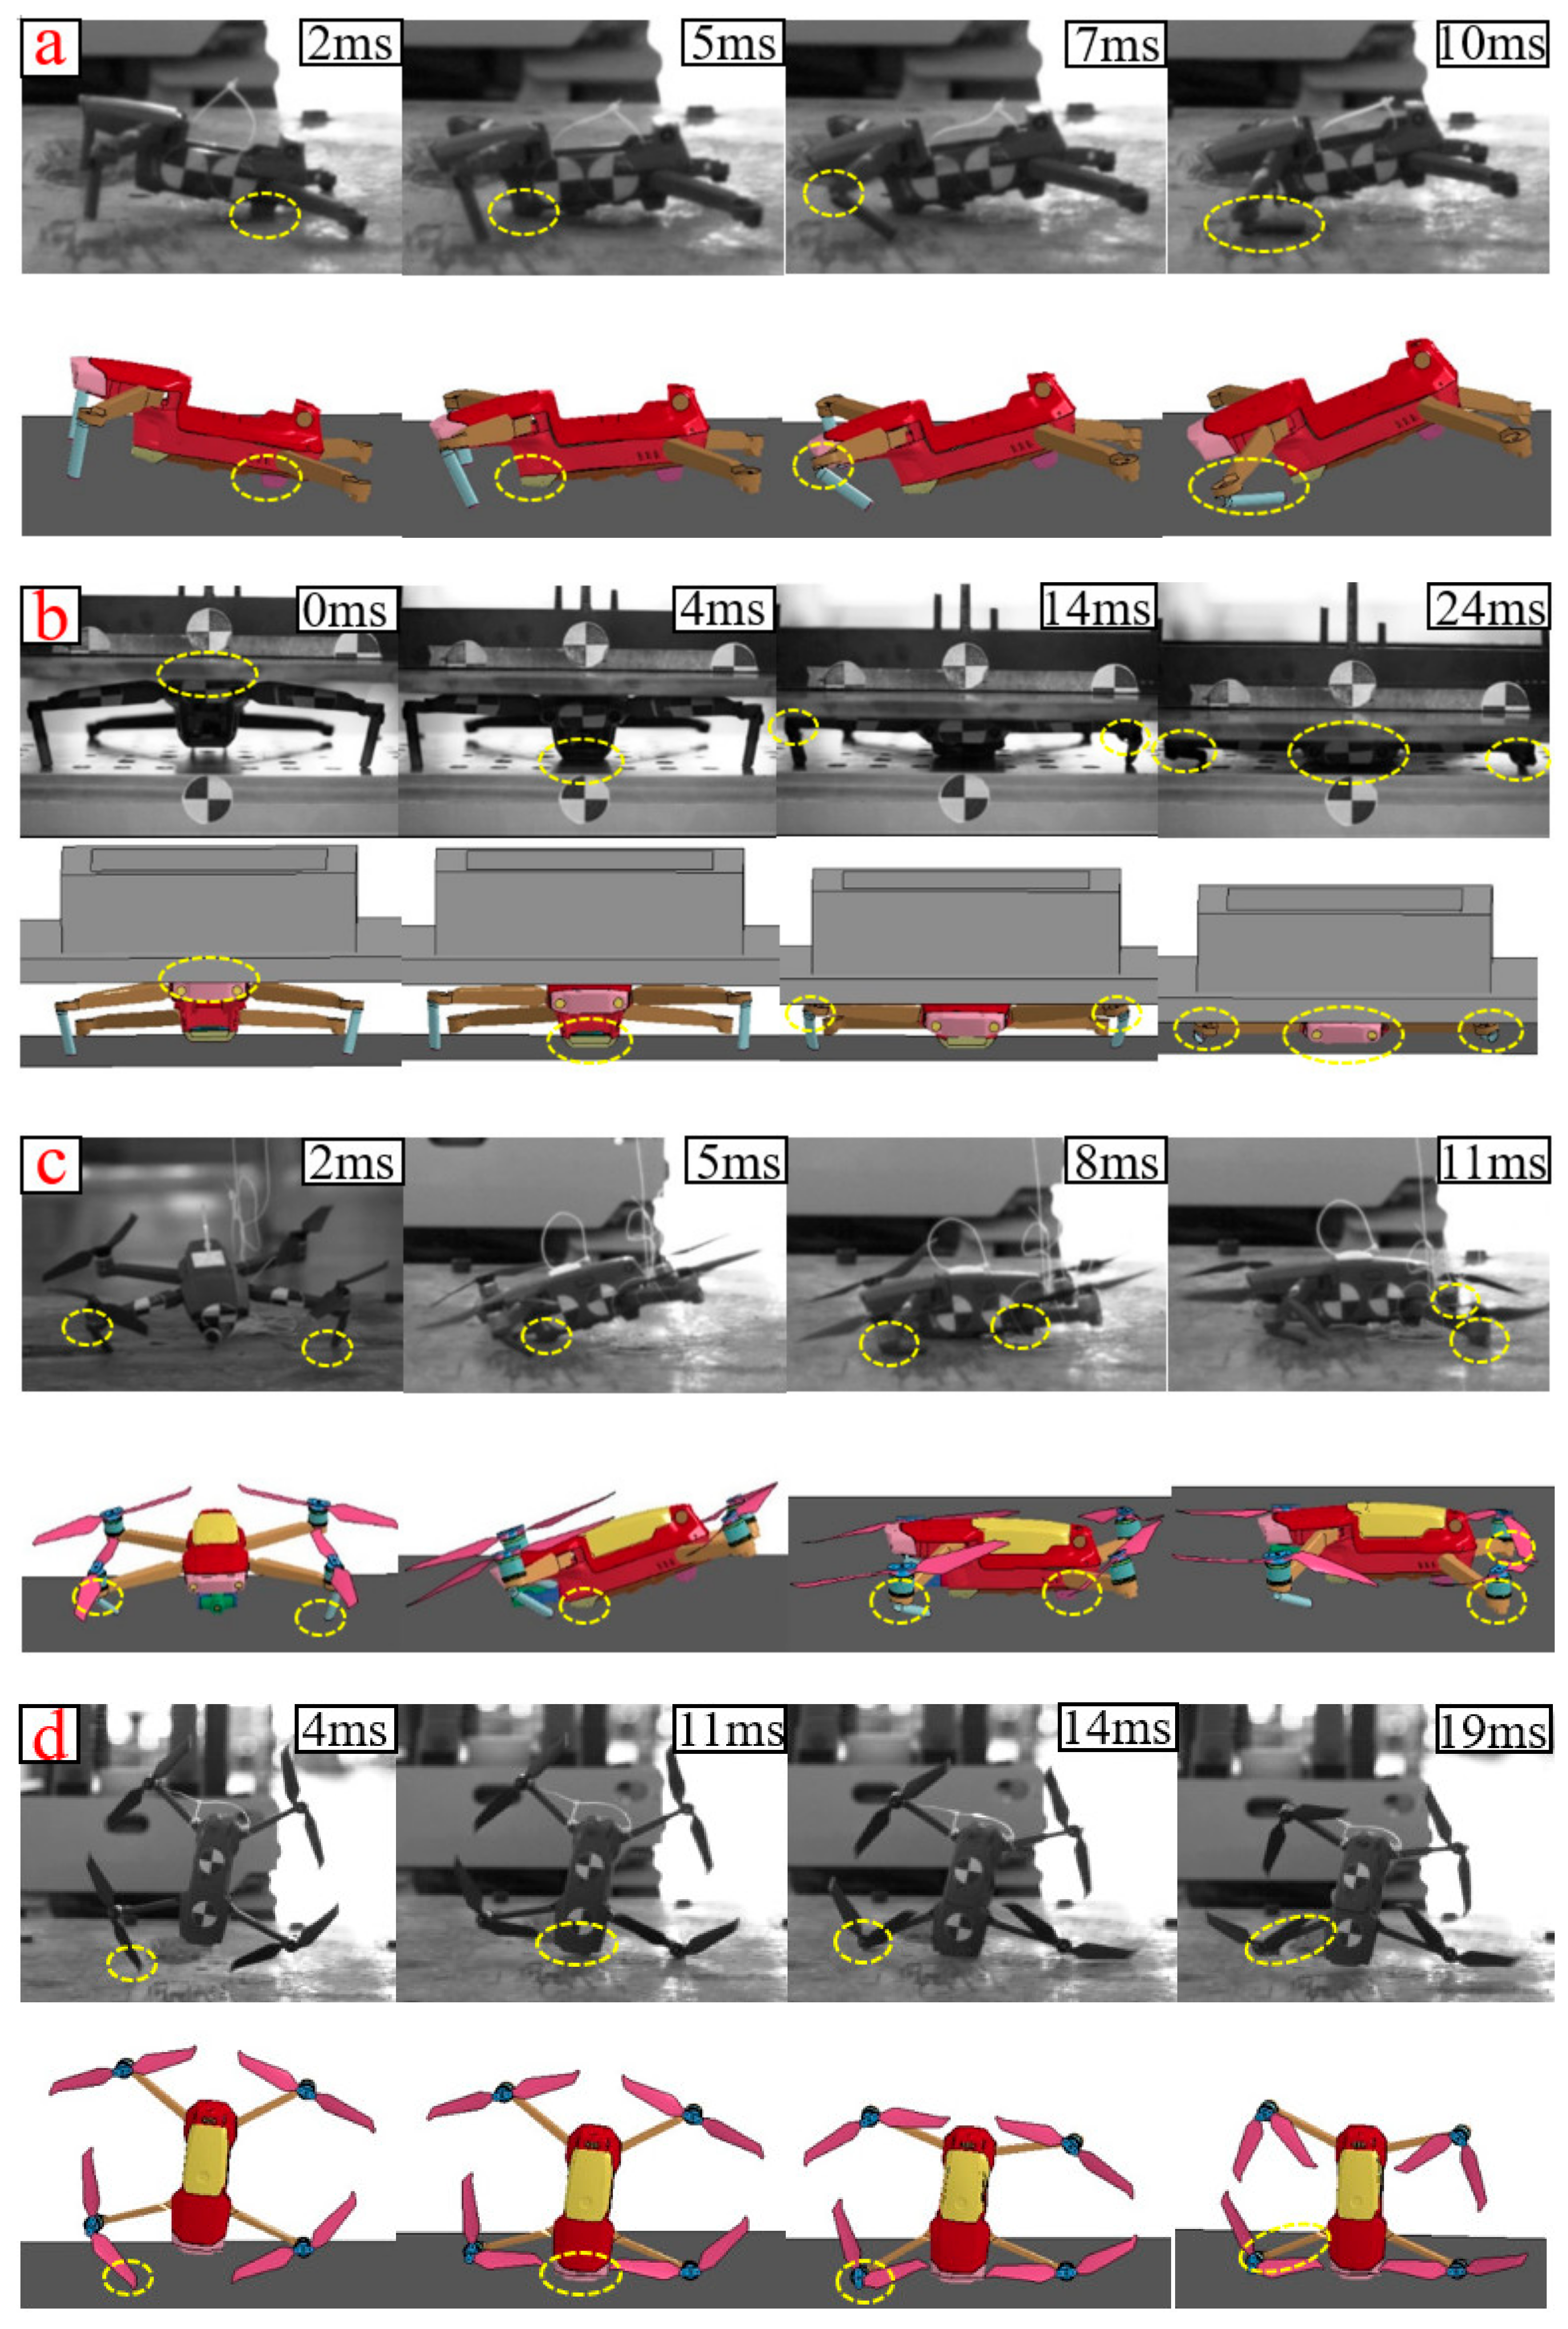
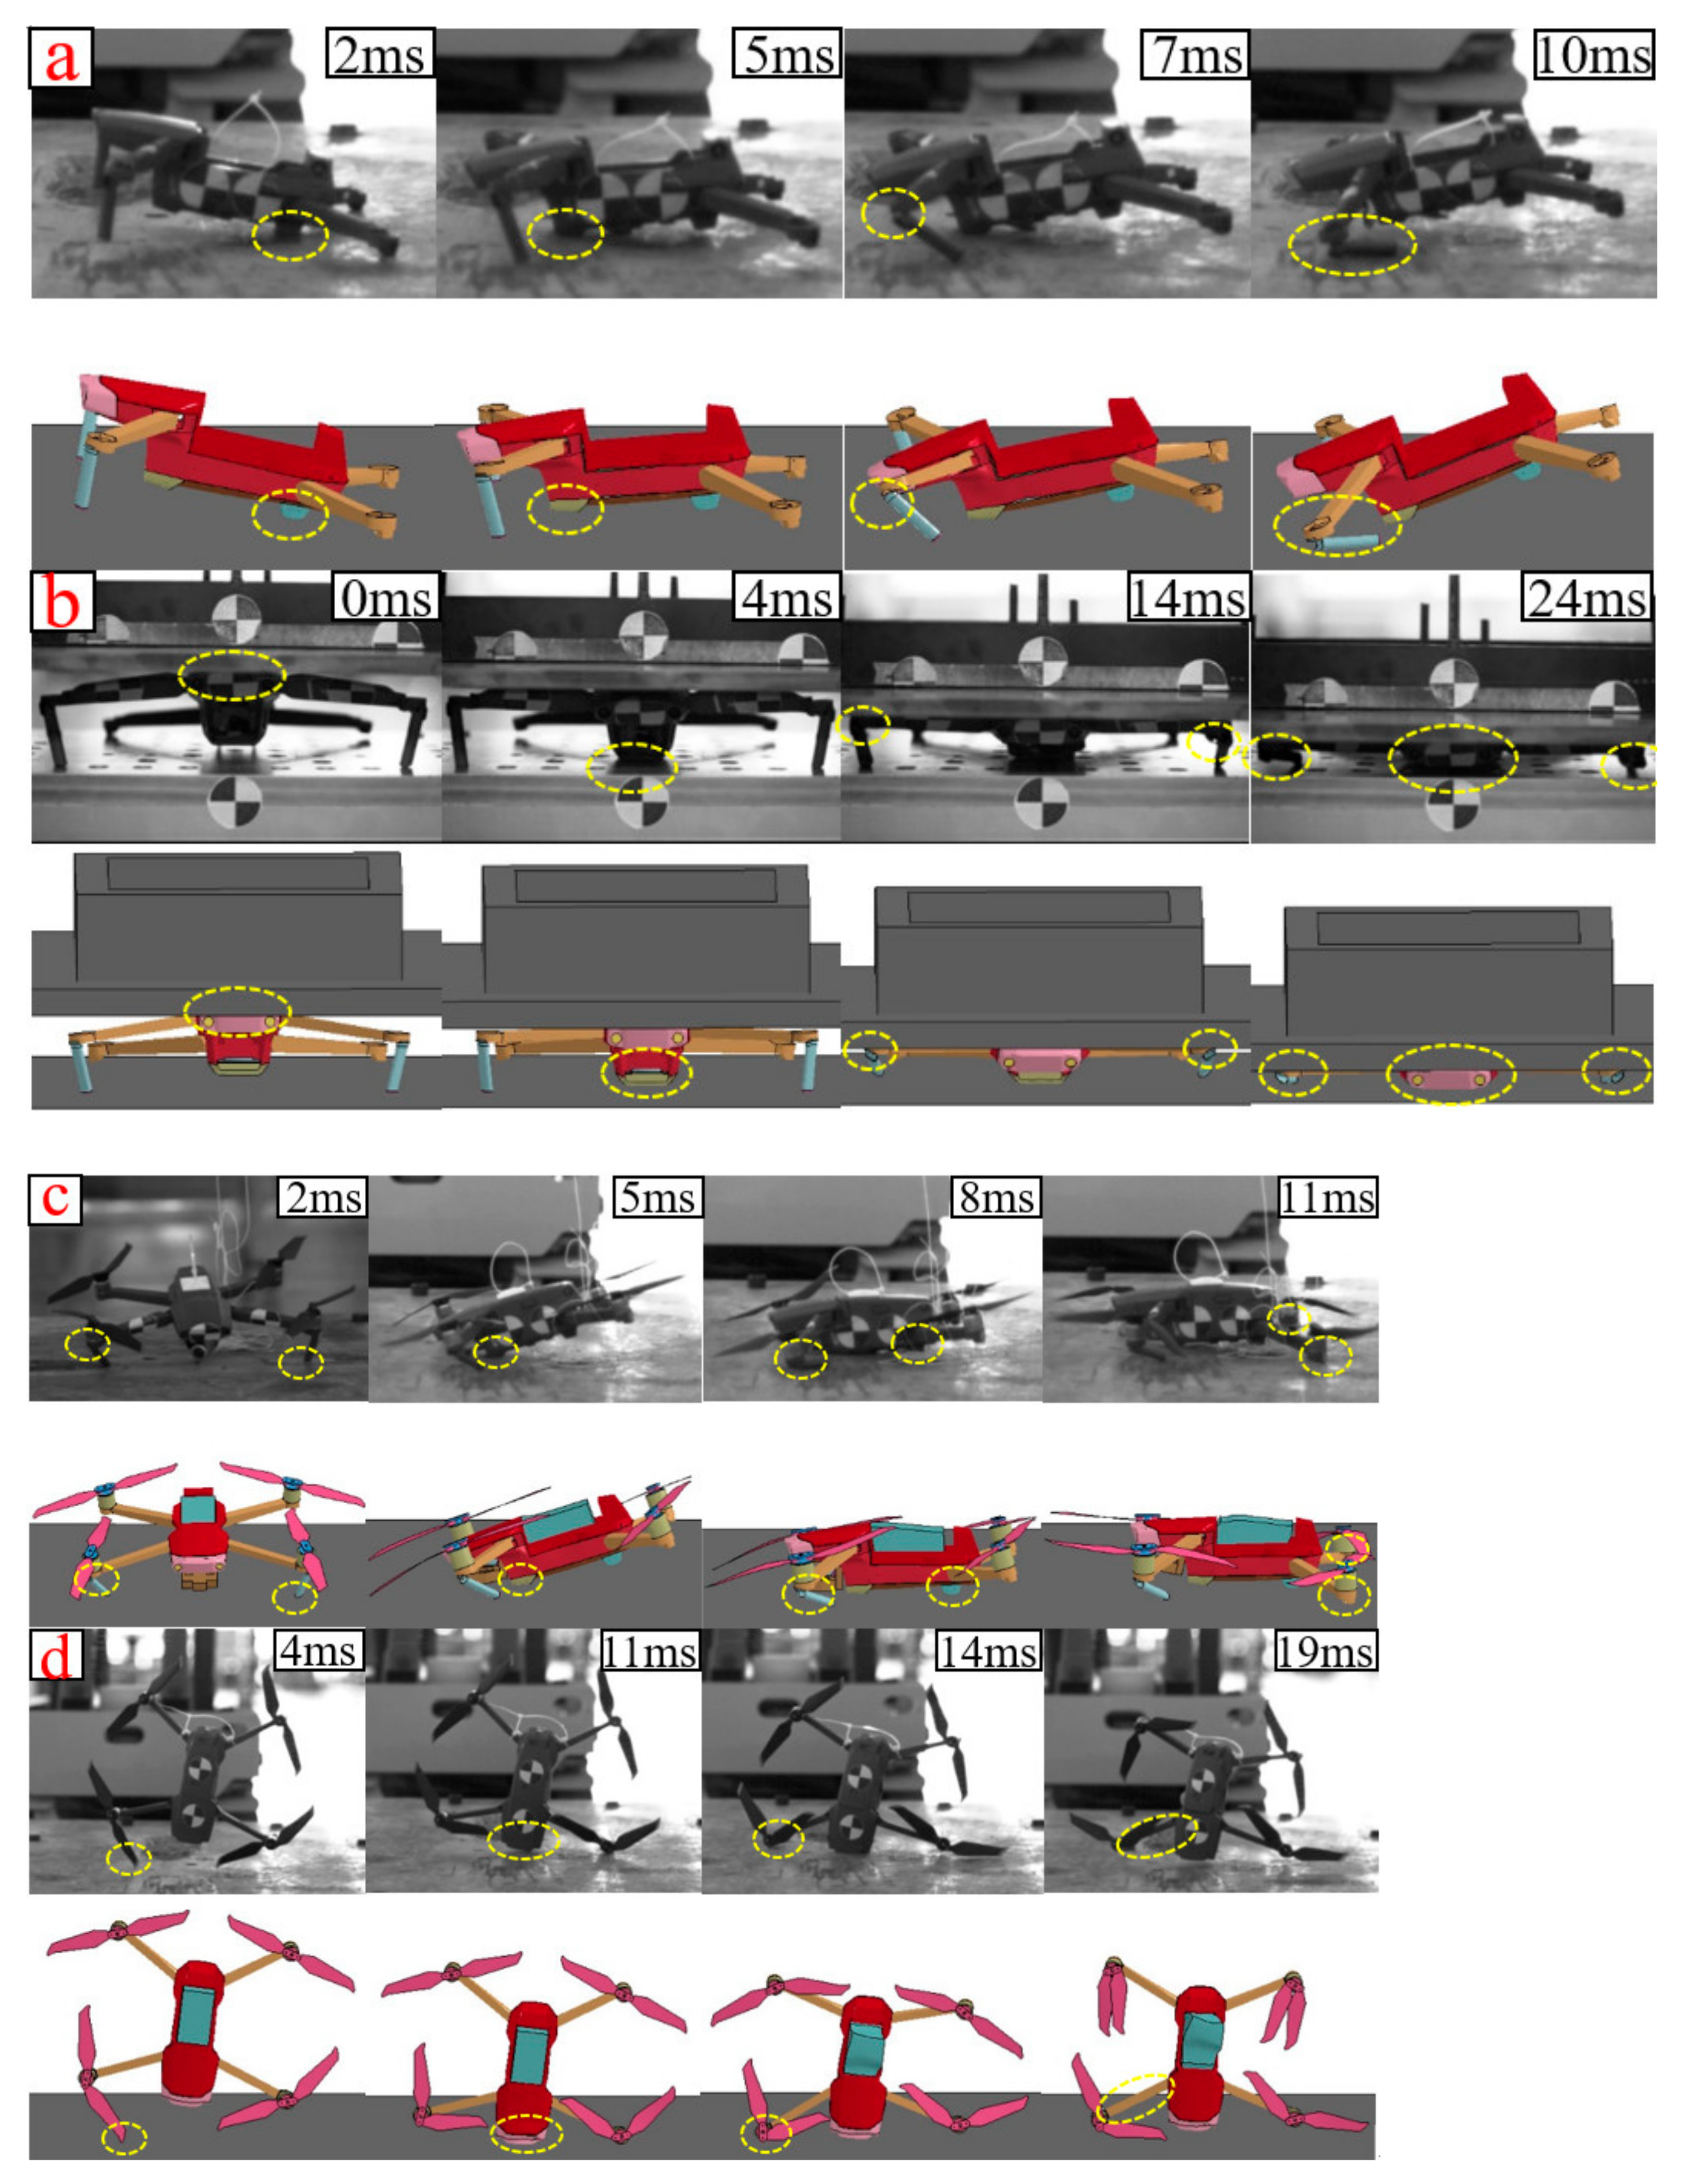
Figure 6 respectively shows the comparison results of the deformation response and simulation calculation of drone at several typical moments selected in the four tests, and the main deformation characteristics of each typical moment are marked in the figure. Figure 6a presents the compared result of the component drop test. At 2 × 10⁻³ s, the bottom silicone pedestal of the drone completely landed, corresponding to the maximum impact load; at 5 × 10⁻³ s, the protective plate at the front of the bottom plate completely grounded; at 7 × 10⁻³ s, the connection between the left front straight arm and the support arm began to fracture; at 10 × 10−3 s, the connection was completely disconnected, while the fuselage rebounded from the ground. Figure 6b presents the compared result of the component drop-weight compression test. At 0 × 10−3 s, the drop hammer first pressed on the upper part of the front fuselage; at 4 × 10⁻³ s, the protective plate at the front of the bottom plate touched the ground; at 13 × 10−3 s, the two connections between the front straight arms and the support arm began to break; at 23 × 10−3 s, the front shroud of the fuselage fell to the ground, the two connections were overall broken, while the load was close to the peak. Figure 6c gives the comparison result of the complete machine positive posture drop test. At 2 × 10⁻³ s, the connection between the left front straight arm and the support arm began to break and the right forearm touched the ground; at 5 × 10⁻³ s, the protective plate at the front of the bottom plate landed; at 8 × 10⁻³ s, the bottom silicone pedestal of the drone completely landed, while the load reached its peak; at 11 × 10−3 s, the arm landed. Figure 6d illustrates the compared result of the complete machine vertical posture drop test. At 4 × 10⁻³ s, the left front propeller landed, while the right front propeller landed and rebounded; at 11 × 10−3 s, the front shroud of the fuselage landed completely, and the impact load reached its peak; at 14 × 10−3 s, the motor of the left front arm touched the ground; at 19 × 10−3 s, the drone had completely bounced from the ground, while the left front arm began to turn back. After the comparison, the simulation results of deformation response at typical moments extracted in each verification comparison were well consistent with the test results.
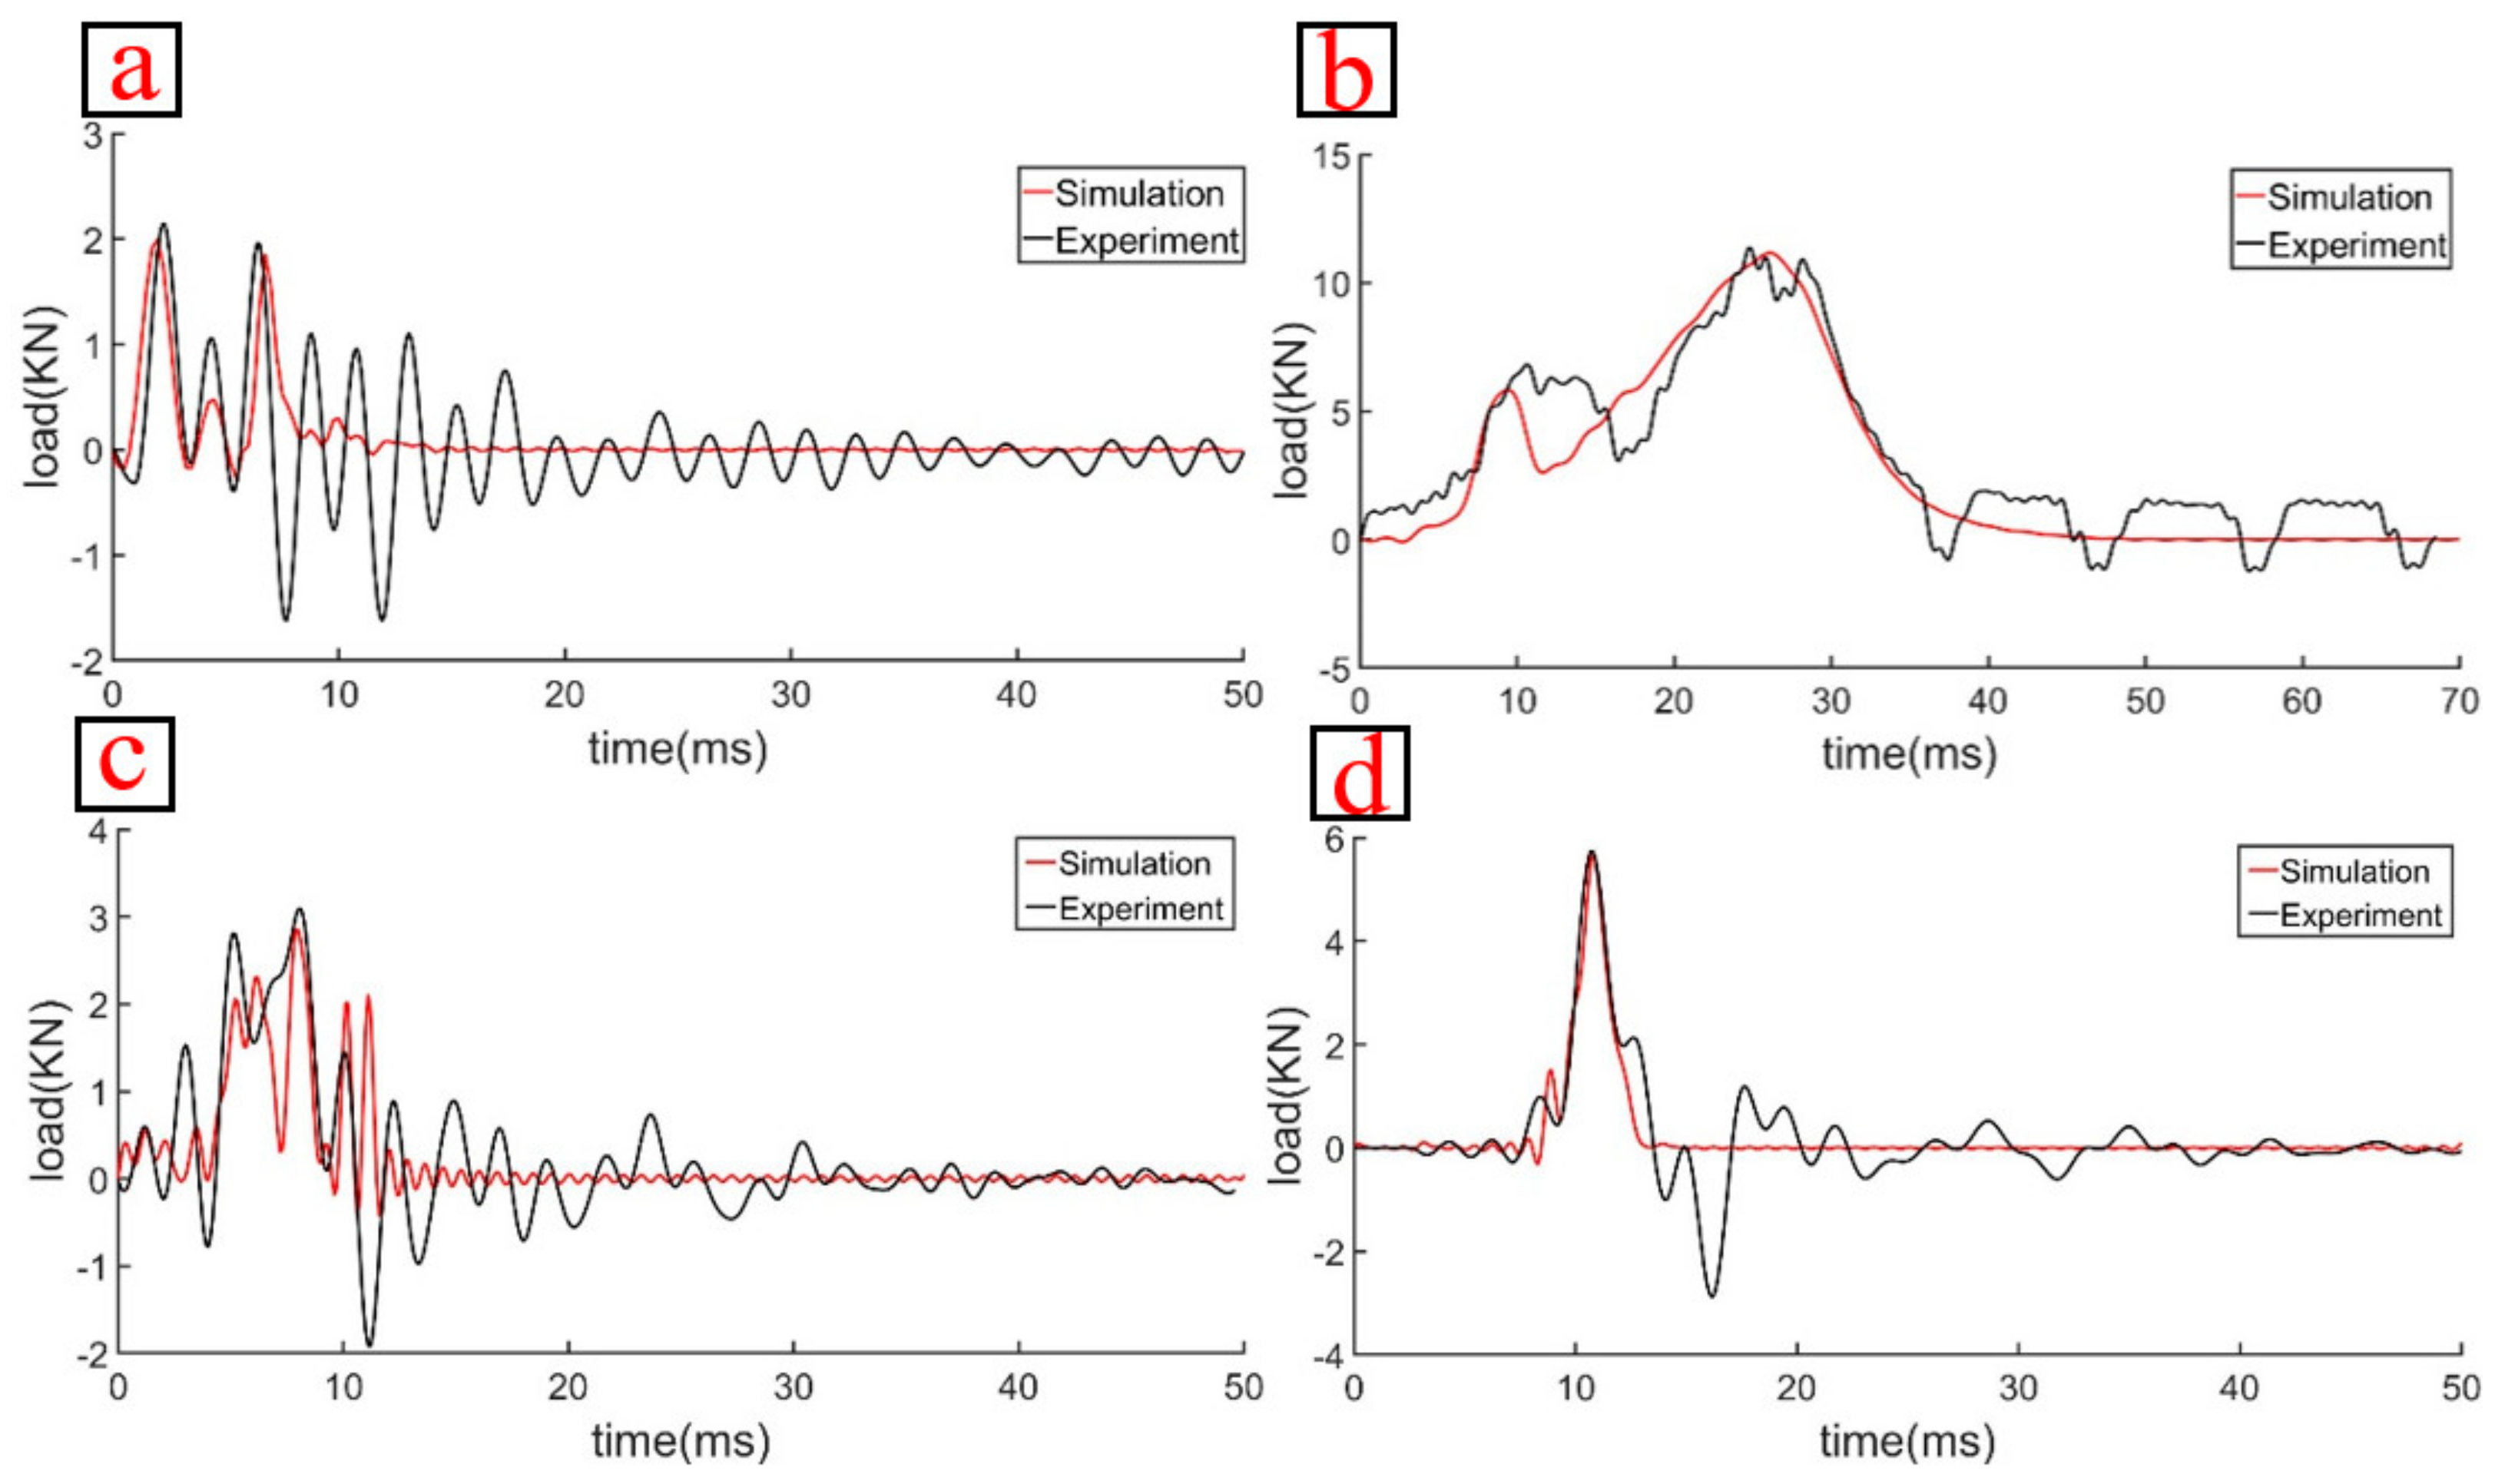
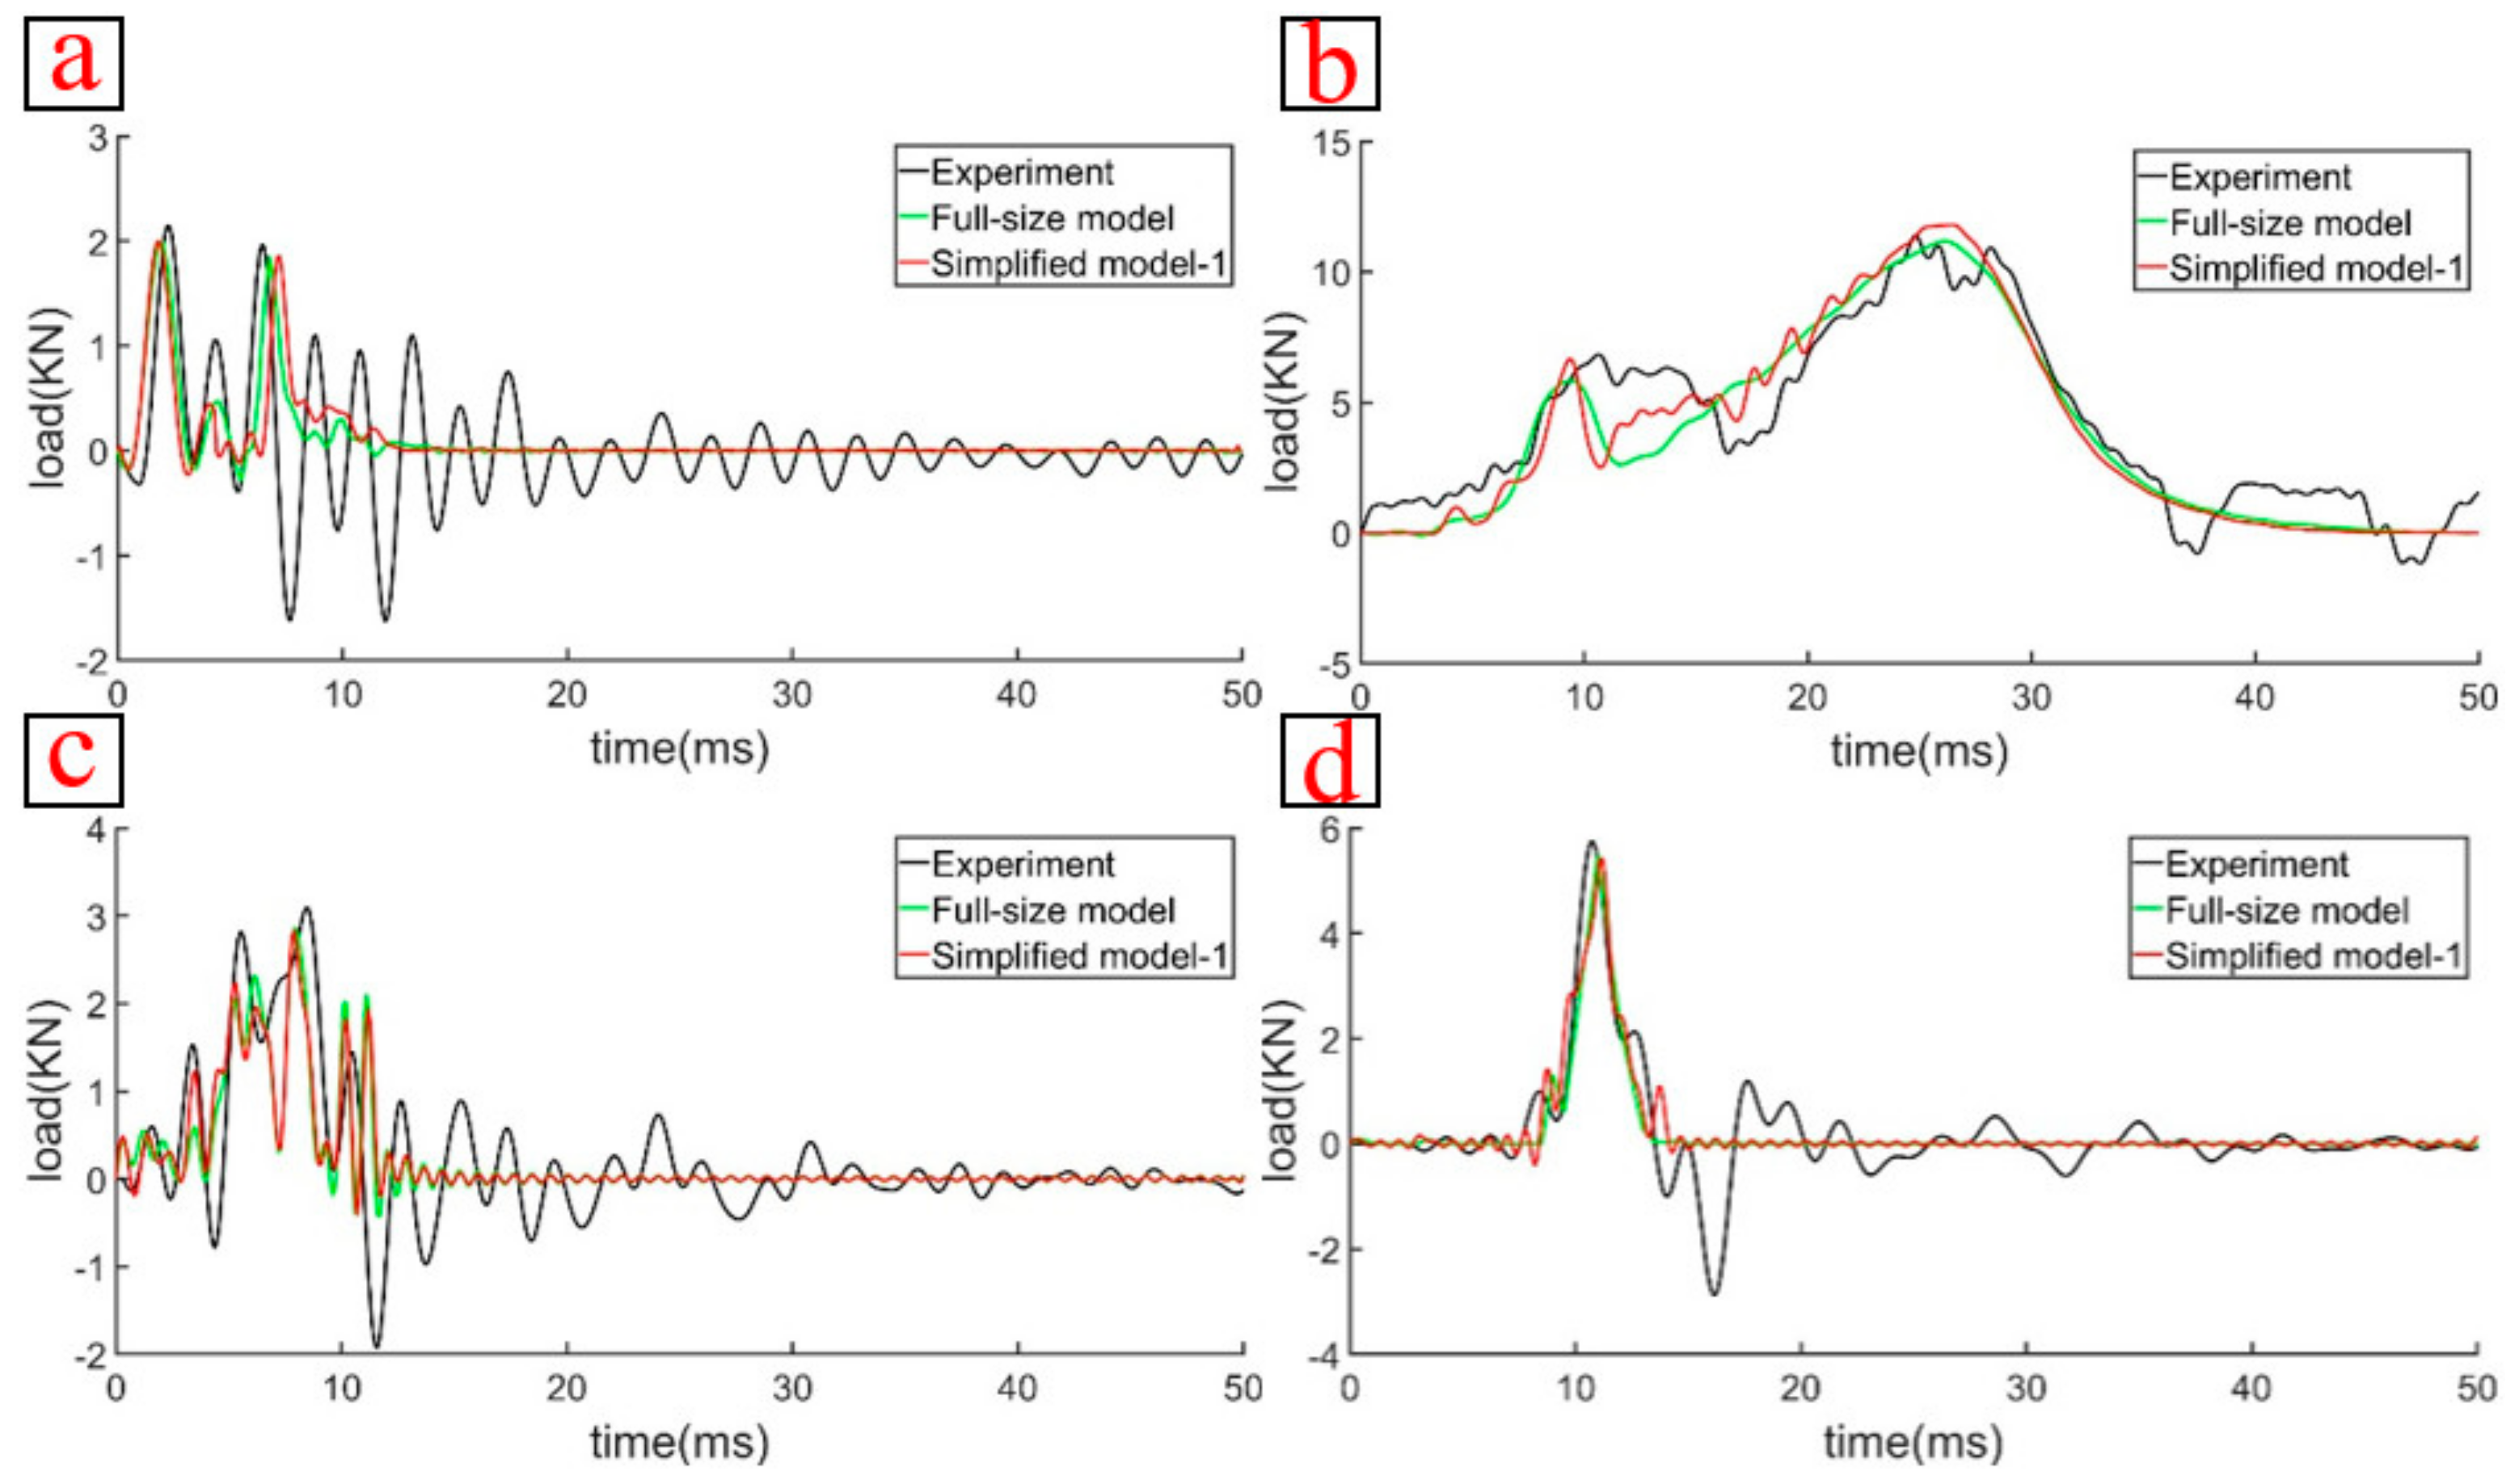
Figure 7 shows the comparison results of the impact load curve of the four tests and the impact load curve obtained by simulation calculation. As indicated from the figure, the load change trend of each simulation calculated result has a high consistency with the test in the impact phase, and it shows that the stress condition of each part of the full-scale finite element model built during the collision is basically consistent with the stress condition of each part of the real physical model of the drone. At the same time, it can be seen from the figure that there is a certain difference between the simulation calculation result and the test in the second half of the whole response process, such as the load curve after 8 × 10⁻³ s in Figure 7a. The reason is that the drone has completely rebounded from the force measurement platform in the second half of the response process. For example, the drone has completely separated from the force measurement platform at 10 × 10−3 s in Figure 6a. At this time, the rigid board in the simulation calculation has no contact with the drone, so the contact force is 0; while the force measurement platform in the experiment is still in a state of vibration, and the amplitude is gradually reduced to 0. Therefore, there is a certain difference between the simulation calculation result and the experiment in the second half of the response process.
The peak load and peak load error results of each experiment and simulation calculation analysis are listed in Table 6. As revealed from the results, compared with the experiment, the error of each group of simulation calculated results was less than 10%, satisfying the general permitted range (≤15%).
In brief, a comprehensive comparison between the simulation calculated results and the experiment was drawn from the deformation response at the typical time, impact load change trend and impact load peak error of the drone. As suggested from the results, the simulation results were tightly correlated with the experimental results. Accordingly, the built drone full-size finite element model can be considered to be accurate, the model refers to a full-size high-precision model, and the drone full-scale high-precision modeling method adopted is reasonable.

3.4. Simplified High-Precision Modeling Method for Light and Small Drone

To reduce the difficulty of modeling, the finite element model solution scale and the consumption of resources (e.g., computing time), this chapter presented some specific simplified modeling modes and simplified modeling methods. By ensuring certain or equivalent calculation accuracy, the light and small drone studied here was modeled in a simplified method. Lastly, a simplified high-precision finite element model of the drone was built, and the simplified conditions and the simplified methods for modeling similar light and small drones were formed.
According to the structural characteristics of the drone, this study proposed the following five simplification modes:
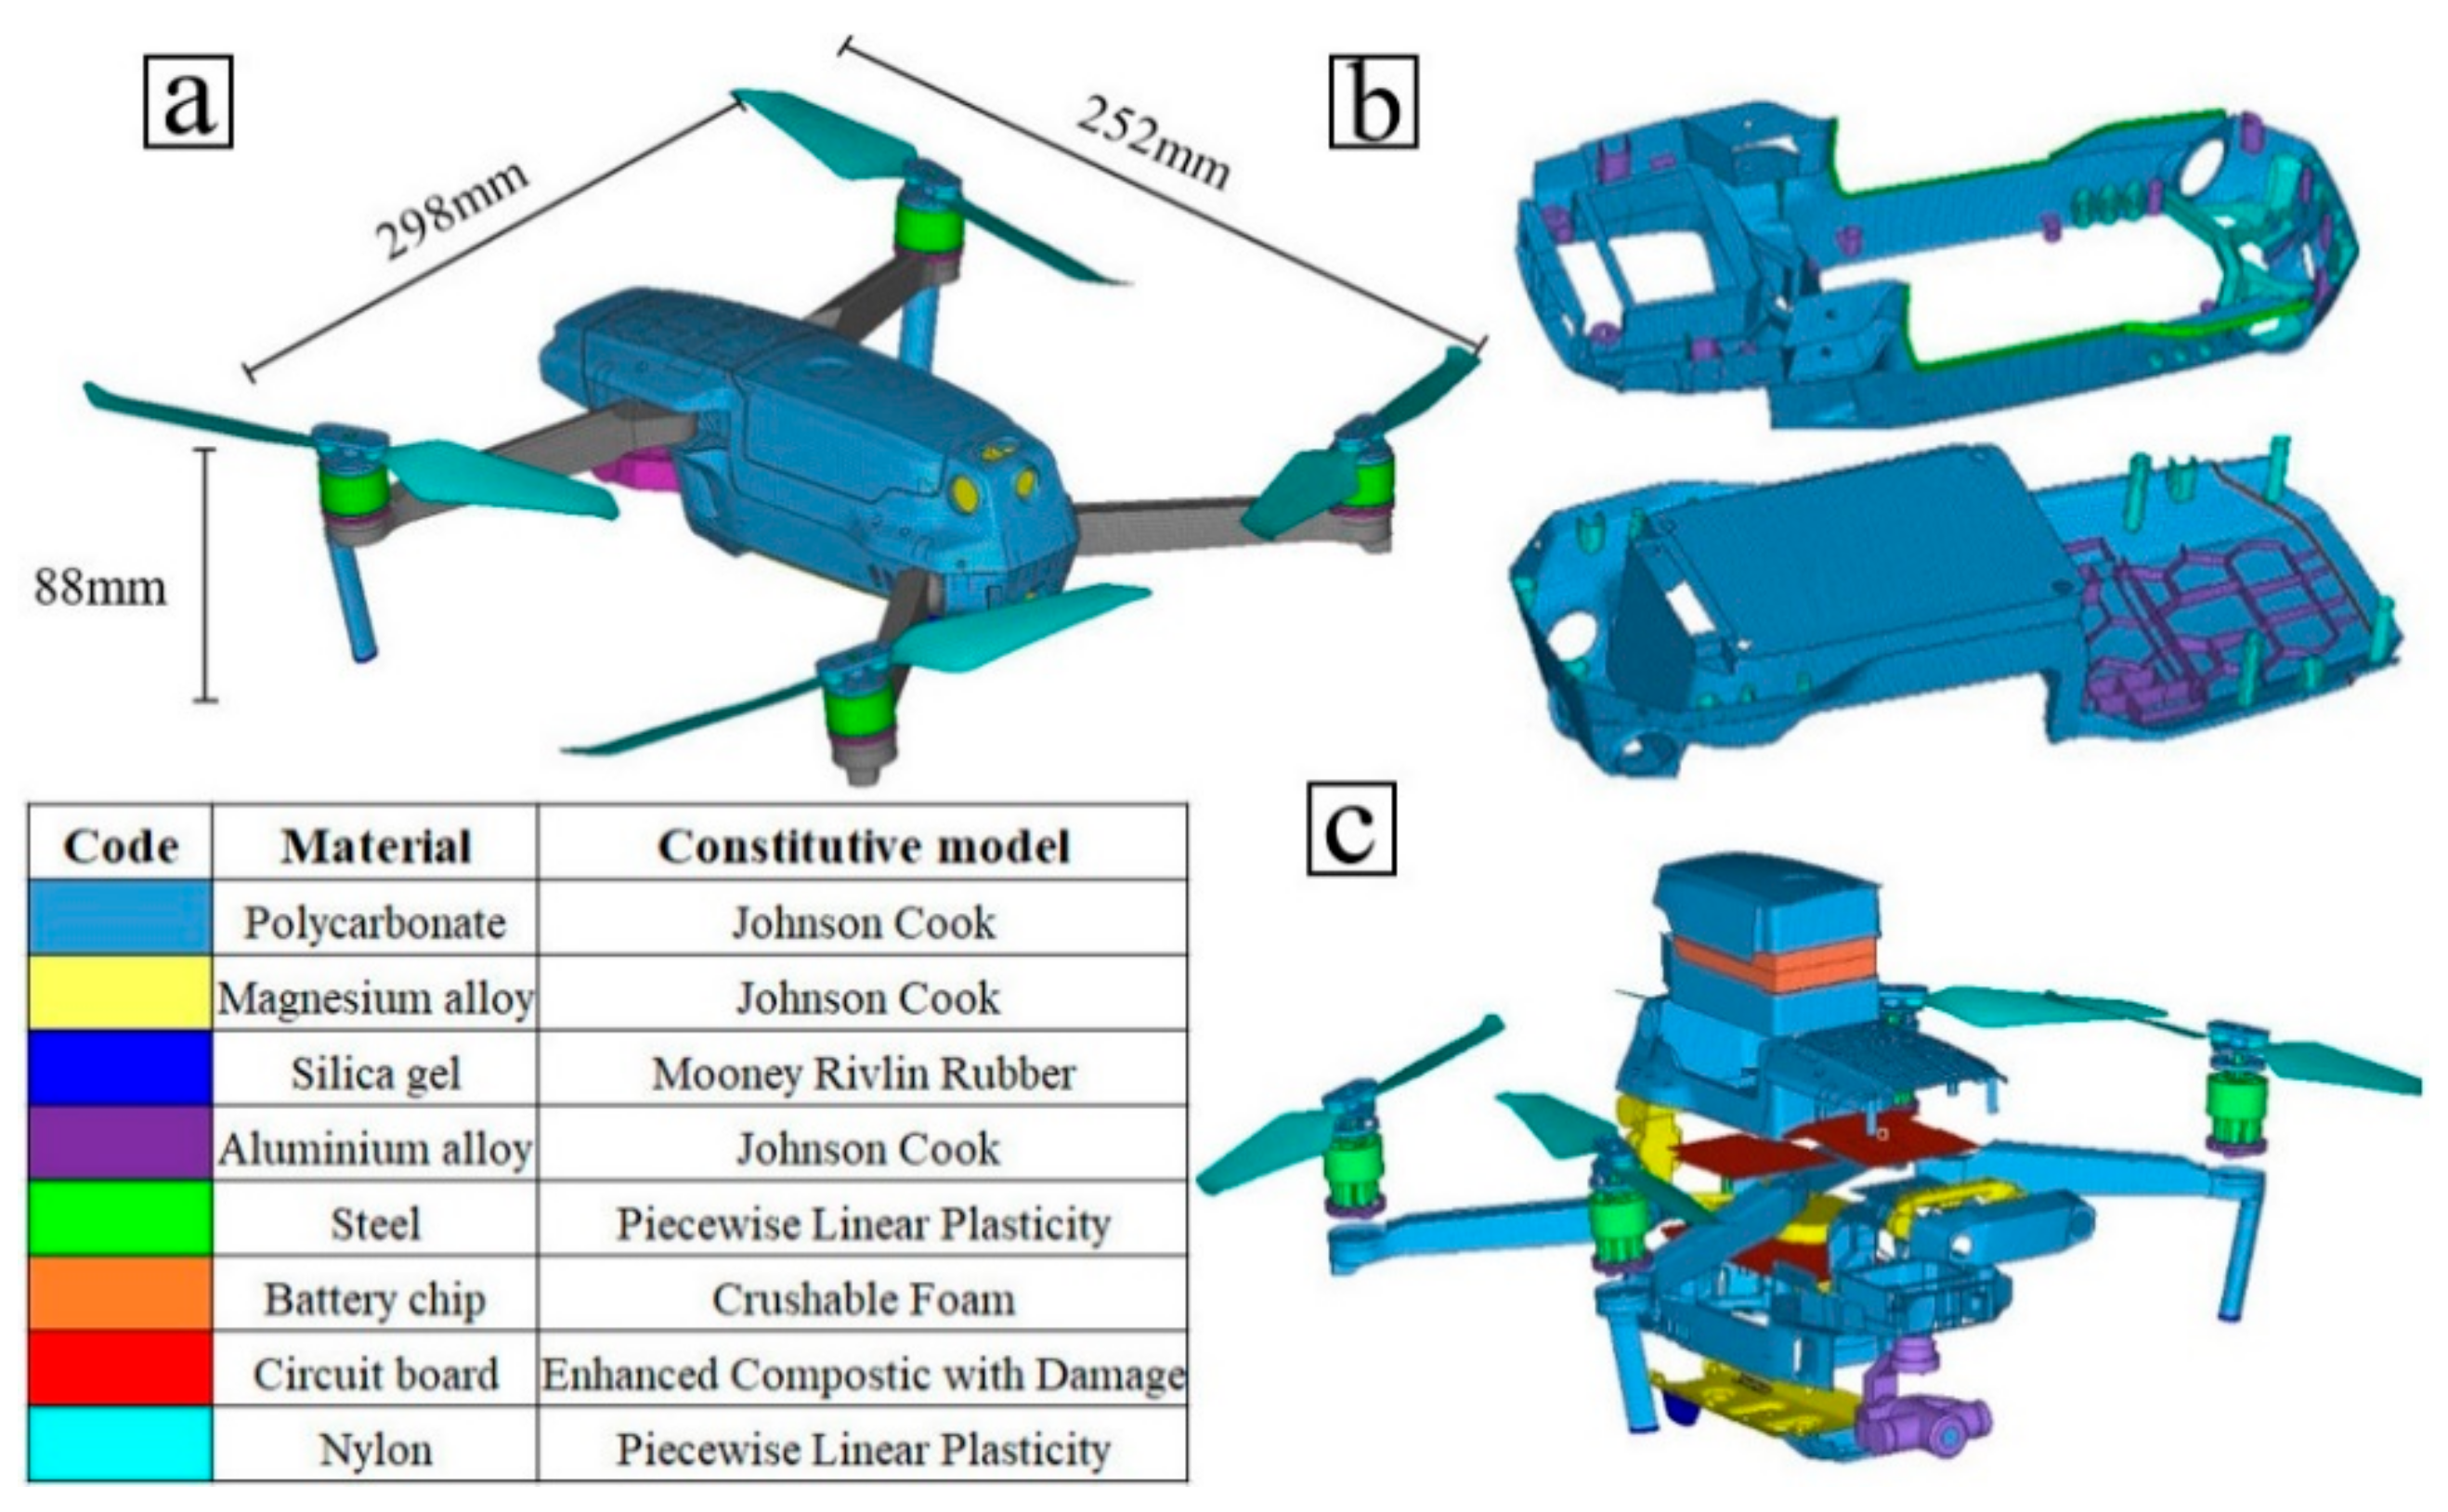
(i) Material model. It covered simplified modeling of anisotropic materials and material replacement. The material model of anisotropic materials was simplified and modeled with the isotropic constitutive model of equal density. Material replacement was conducted for the simplified parts during the modeling, and the material model was no longer defined separately for some mesh elements corresponding to the simplified parts.
(ii) Normal thickness. As impacted by the complex structure or structural requirements, the normal thickness of thin-walled parts in the drone was not uniform, significantly increasing the difficulty of regional modeling. In the present study, the finite element model of thin-walled parts with uneven normal thickness was simplified to a finite element model with uniform thickness as a whole to reduce the difficulty of modeling, whereas it aims to ensure the weight of each part to equal to the full-size model.
(iii) Appearance characteristic. For parts with curved surfaces, holes on the surface and ribbed structures inside, the detailed internal and surface structures were ignored, and the geometric model was simplified to a straight and similar geometry. Accordingly, the difficulty of modeling was reduced from the process of building the geometric model, and the difficulty of meshing decreased.
(iv) Element type. In the full-scale model, the geometric structure features of each part were overall restored by complying with the real structure. To reduce the difficulty of modeling, in the simplified model, the modeling element type of some parts or components of the drone was replaced (e.g., to simplify modeling of parts similar to straight rods in the structure through beam elements (full-scale models use shell elements), as well as to simplify the thin-walled parts modeled by shell elements to other parts with solid elements for overall modeling). Accordingly, the difficulty of meshing decreased, the solution scale of the finite element model was reduced, and the calculation time was saved.
(v) Combined modeling. The components in the drone were composed of multiple parts, and each part was modeled separately in the full-scale model. During the simplified modeling, multiple parts in the identical component were simplified into a whole, and the component was simplified modeled as an integrated combined model according to its geometric shape to reduce the number of parts and the difficulty of modeling.
During the fall of the drone, the factor most significantly impacting the impact load was the kinetic energy of drone. When the impact speed was constant, the weight remained unchanged and the overall kinetic energy of the drone remained unchanged. Thus, in all the mentioned simplification methods, equivalent density modeling was adopted for the simplified model to ensure that the weight of each simplified part or component is equal to the full-size model. Moreover, it is required that the geometric position of the parts or components of the simplified model remained unchanged from the original model to ensure that the overall center of gravity and the momentum of inertia of the drone changed slightly. The comparison of the total weights between the real, and the modeled drones is shown in Table 7.
In the present study, according to the different properties of each part or component of the drone, the corresponding simplified modeling modes were selected, and the specific simplified modeling method for parts or components with different properties was formed, and the single simplified model was built with different simplified methods. The respective part or component of the drone exhibited multiple properties simultaneously, and a certain crossover was identified between different simplification modes. Thus, each simplification method might include multiple simplification modes. Combining the mentioned simplified modeling ideas, the simplified conditions and simplified modes table was built (Table 8), in which the properties and simplified modes of the main parts or components of the drone were selected, respectively. Simplification modes fell to main simplification modes and secondary simplification modes. The main simplification mode was the simplification mode largely used in the simplification method of different parts or components; the secondary simplification mode was the simplification mode involved in the application of the main simplification modeling mode to simplify the modeling.
For the connection structure between different parts or components in the drone, the connection structure contained in the simplified component has been simplified during the simplified modeling of each component, and the connection structure that has not been simplified is still constructed by complying with the real structure. In this research, we will not conduct a separate detailed simplified modeling study on the connection structure. The specific simplified modeling method and the built single simplified model for different parts or components in the drone are as follows:

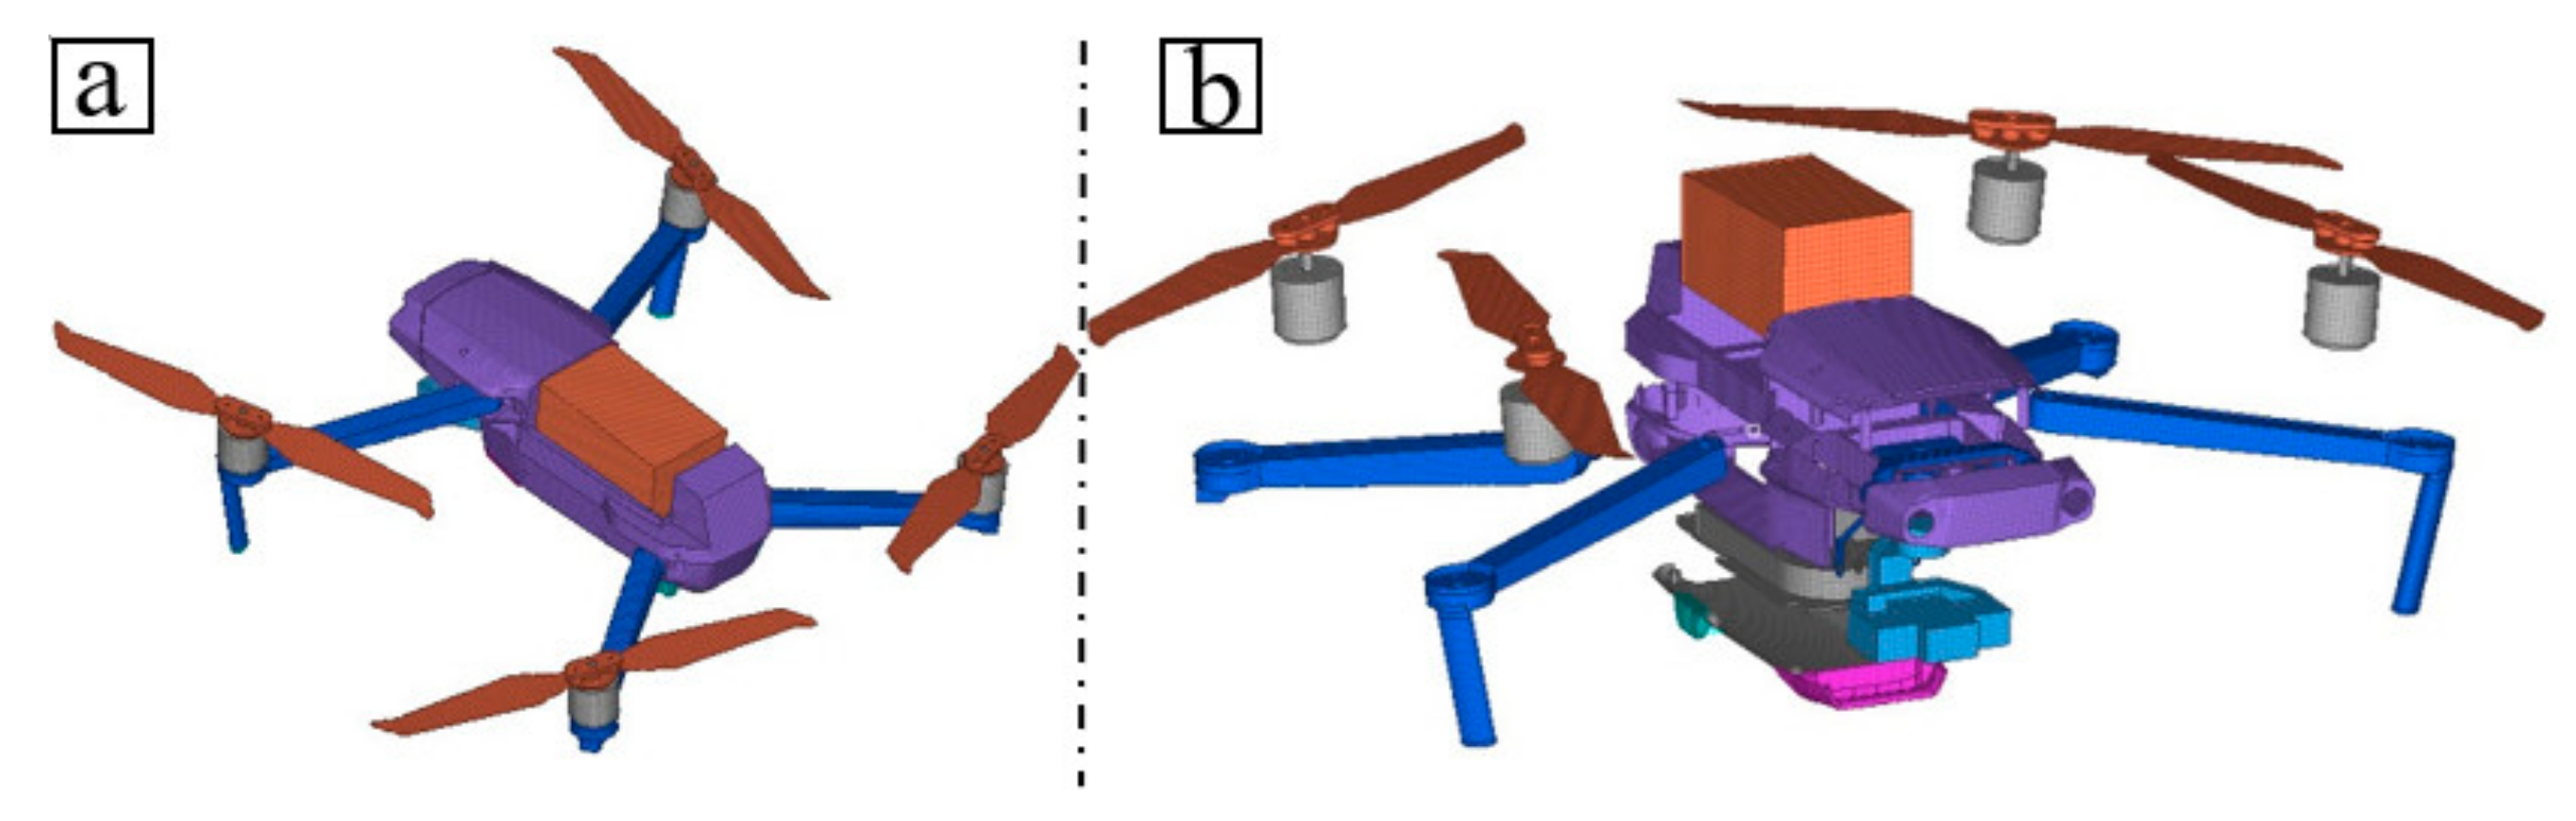
3.4.1. Method 1: Simplified Modeling of Battery

The primary battery of drone consisted of two parts, that is, a battery box and a battery cell. The battery box is an isotropic polycarbonate material; while the battery cell is a lithium-ion polymer battery, that is, a non-single material equivalent to anisotropic materials. Accordingly, the two materials in the battery are soft in texture, the battery as a whole is an elastomer, and the total weight of the battery is 293 g, that is, a centralized mass in the drone.
In the full-size high-precision model, the battery box and the battery cell were separately modeled by the shell element and the solid element, and the external geometric features and internal structural features of the battery box were modeled specifically. As shown in Figure 8a. In the simplified model, the appearance characteristics of the battery box were simplified, the battery box and the battery cell were combined into an overall model, and the model was modeled by solid elements, as shown in Figure 8b. Ensure that the simplified battery model is installed in the original location and establish the simplified model-1, as shown in Figure 8c. The material of the simplified model was simplified to isotropic compressible soft material, and the equivalent density is calculated based on the volume, and other parameters are taken from literature [29,30]. In summary, in the simplified battery modeling, combined modeling and material model simplified modeling modes are mainly used, and the simplified modeling modes of appearance characteristic and element type are also included.

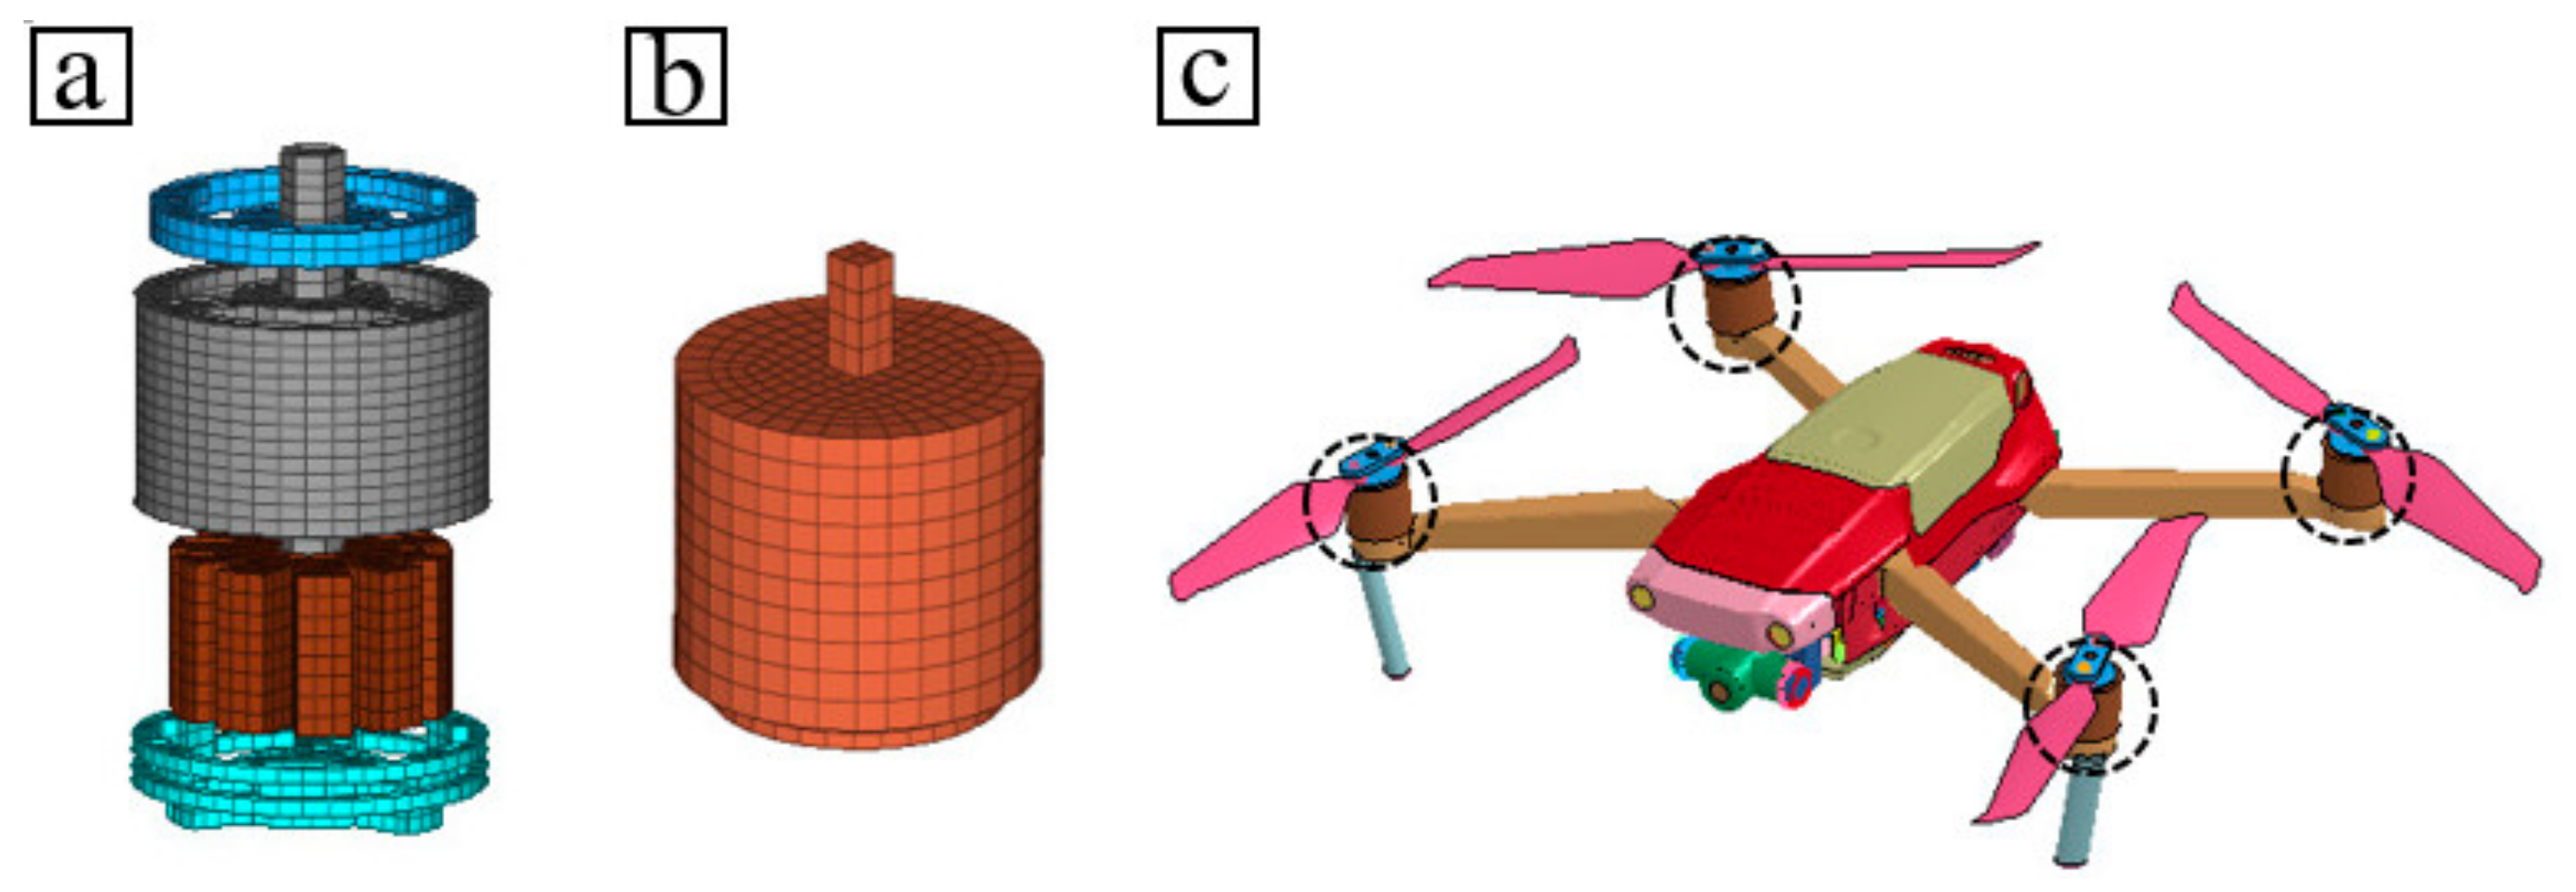
3.4.2. Method 2: Simplified Modeling of Motor

The drone motor consists of four parts, that is, a motor base, a rotor, a stator and an upper cover; the motor base and the upper cover are made of aluminum alloy, and the rotor and stator materials are equivalent to high-strength structural steel, both of which are isotropic materials. Thus, the motor as a whole acted as a rigid body, that is, a centralized mass in the drone. In the full-size high-precision model, the four parts of the motor were separately modeled, and the geometric structure characteristics of each part were retained, as shown in Figure 9a. In the simplified model, the four parts of the motor were combined into a solid overall model by complying with the overall geometric shape of the motor, and the solid element was used to model it (Figure 9b). It was ensured that the simplified motor model was installed in the original location, and the simplified model-2 was built (Figure 9c). Since the rotor and stator in the motor took up a relatively large proportion, the simplified overall model material employed high-strength structural steel. In the simplified modeling of the motor, the simplified method of combined modeling was largely applied.

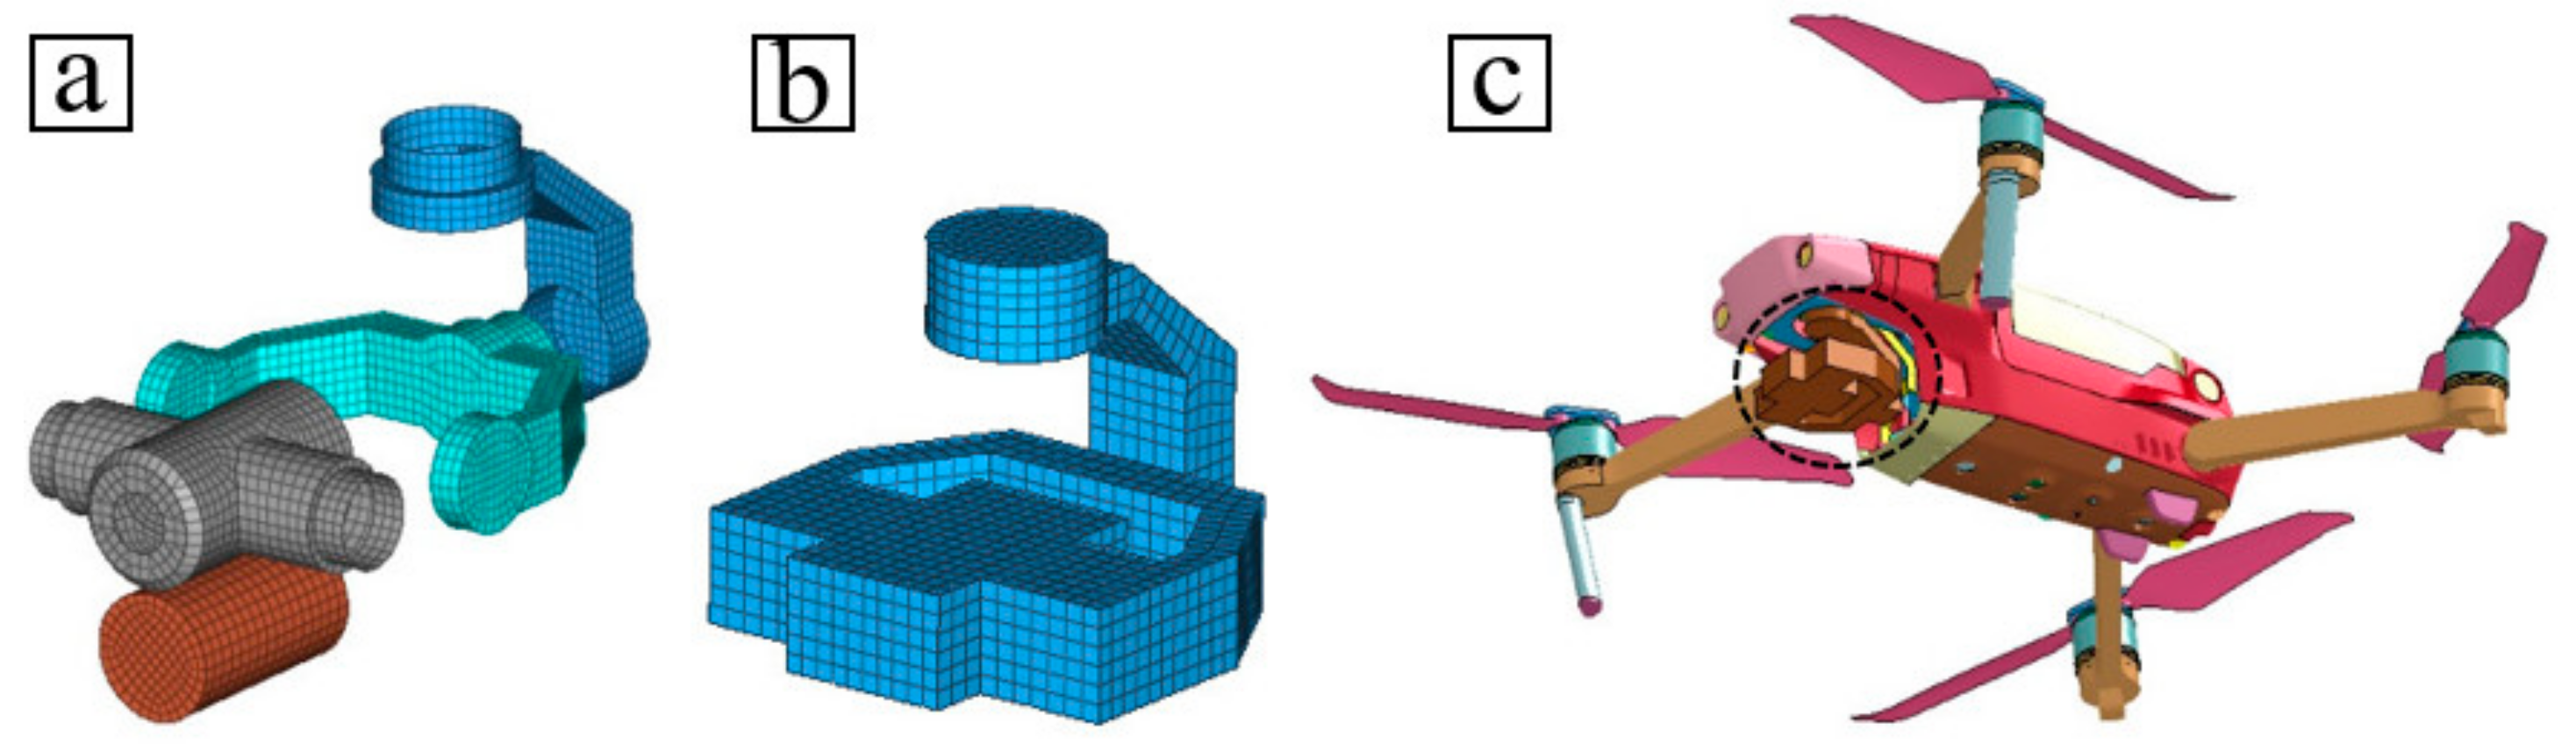
3.4.3. Method 3: Simplified Modeling of Camera Gimbal

From bottom to top, the drone camera gimbal consisted of four parts, that is, a camera lens, a camera case, a horizontal frame and a vertical frame. The full-size model is illustrated in 
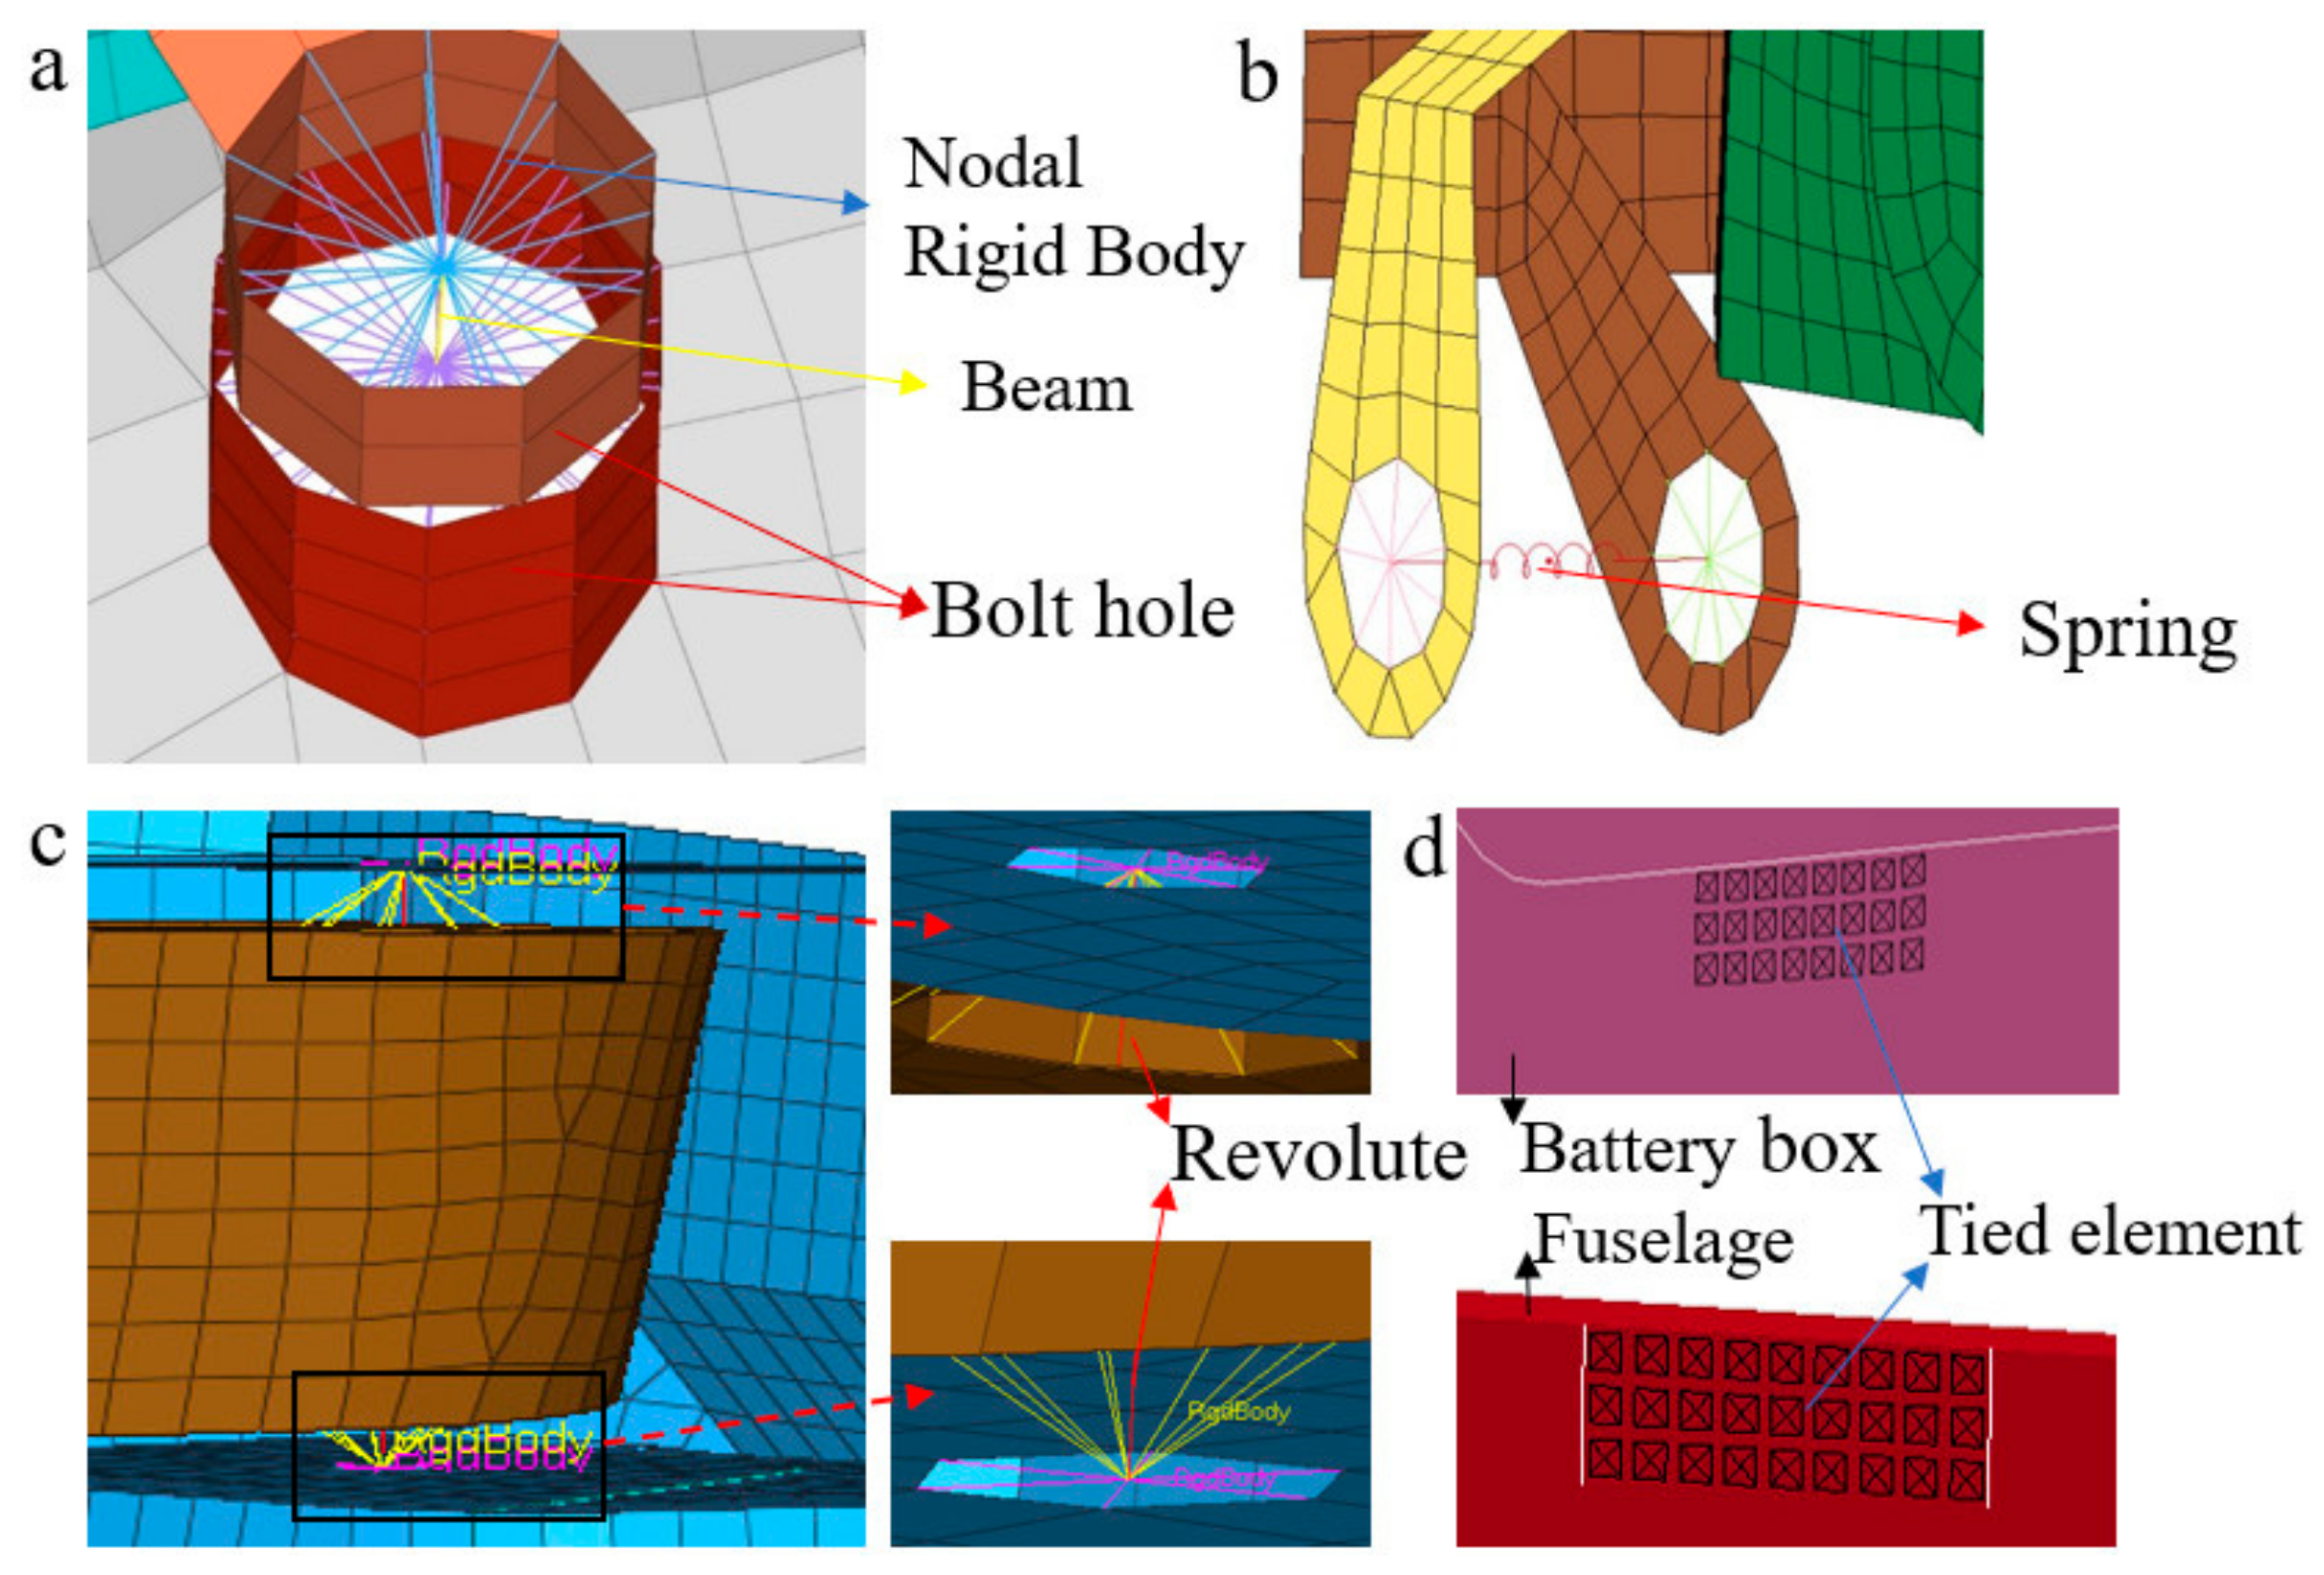
Figure 10a. The camera lens was composed of anisotropic circuit materials and a plastic shell, tightly connected as a whole, which was modeled as a whole in a full-size model. In the full-size high-precision model, the camera case, horizontal frame and vertical frame were all hollow parts of high-strength aluminum alloy. Accordingly, the camera gimbal pertains to a rigid centralized mass. The connections of the camera gimbal were all connected with a micro-motor and could be rotated freely without power on. In the full-size model, the connection between the parts was modeled by revolute joint.
In the simplified model, the camera gimbal was modeled by solid elements by following its overall basic outline, simplifying the shape features of each part, while only retaining the positional relationship. The simplified model is presented in Figure 10b. During the simplified modeling, the connection relationship of the revolute joint was simplified simultaneously, and the built simplified model-3 is presented in Figure 10c.

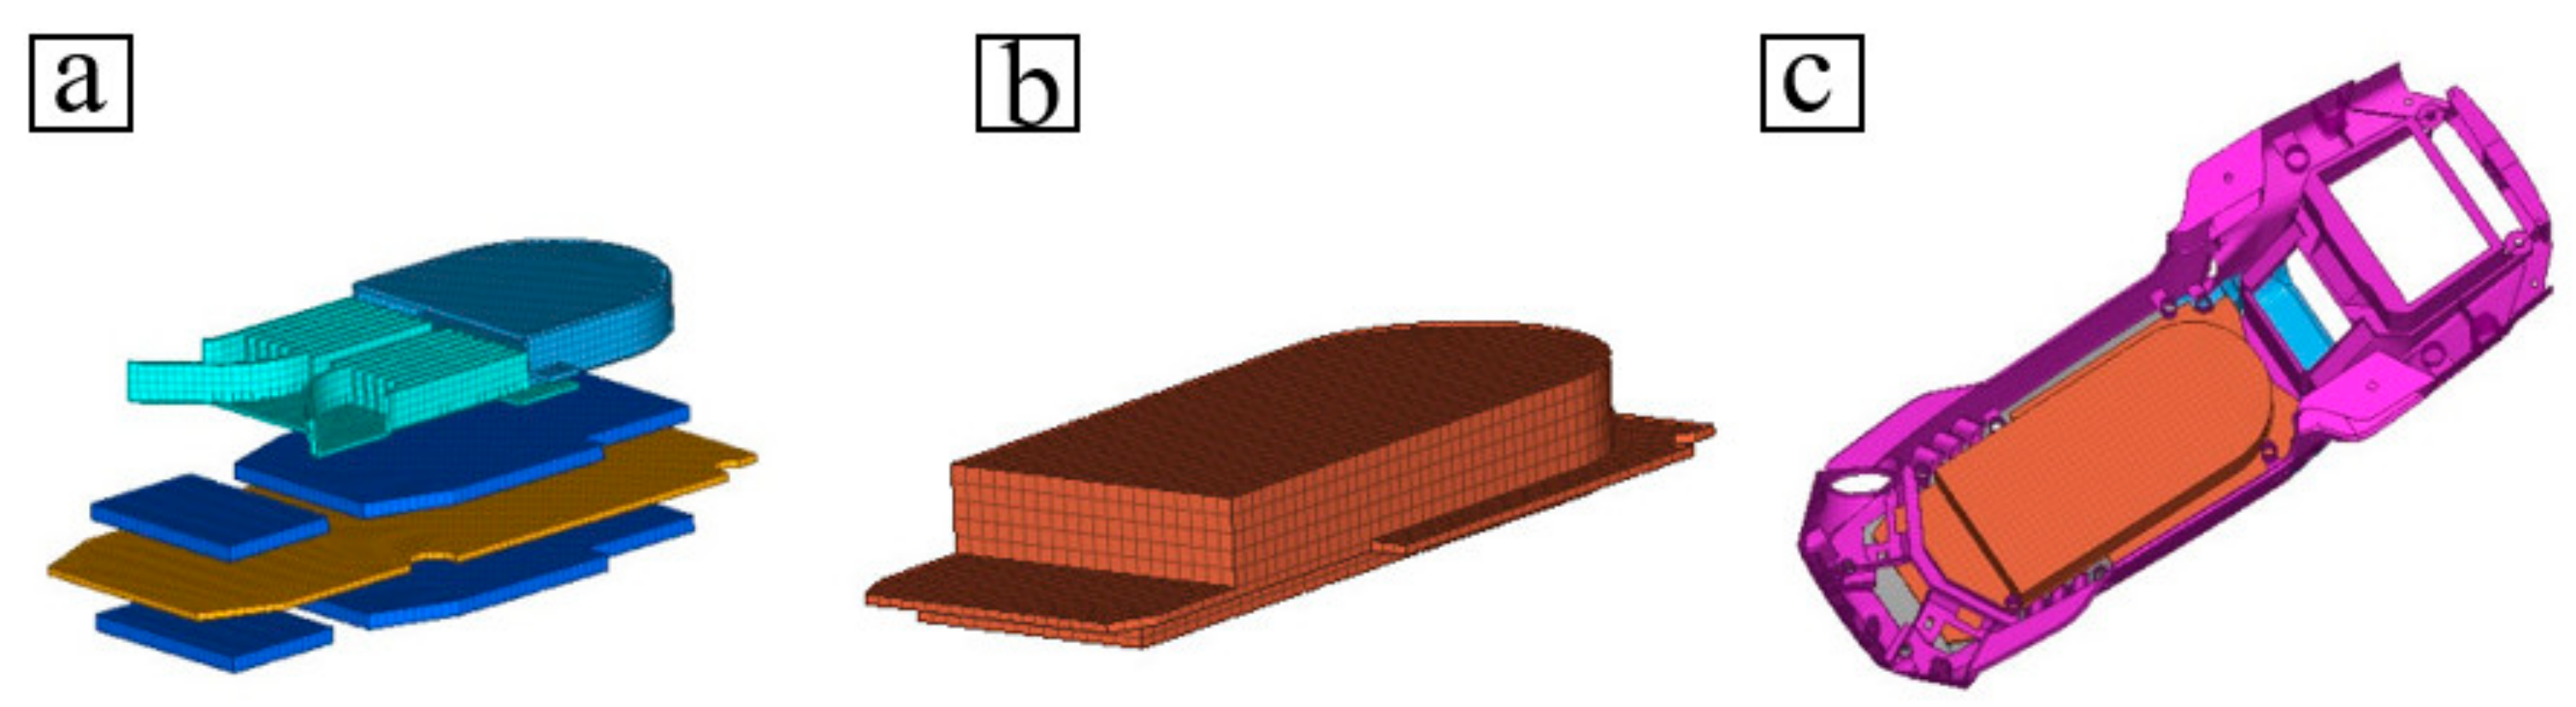
3.4.4. Method 4: Simplified Modeling of the Circuit Board

The drone circuit board consisted of the Printed Circuit board (PCB), electronic components, fans and heat sinks; each part acted as a thin-walled part. The full-size model is shown in Figure 11a. On the whole, PCBs in the consumer industry are made of glass fiber-epoxy composite laminate covered with a copper layer, that is, a typical anisotropic composite material, and other parts are made of alloy. In the full-size high-precision model, each part was simplified to a certain extent, whereas each part remained modeled separately, and the geometric structure characteristics of each part were maintained. For capacitors and wires on the circuit, they were added to the circuit board as a non-structural weight. In the simplified model, the circuit board was modeled as a whole with the solid element by following its overall outline, and the peripheral dimensions and installation position dimensions remained unchanged to ensure that the simplified model could be correctly installed in the original position. The simplified model of the circuit board is presented in Figure 11b, and the installation in the fuselage is shown in Figure 11c, and the simplified model-4 of the drone was built. In this drone, only the circuit board is an anisotropic material structure, but because the weight of the circuit board is very small (only 3% of the total weight of the drone), and it is an internal non-load-bearing structure. Therefore, we simplified its materials by isotropic simplification, and combined with electronic components, fans and heat sinks and other metal material structures to establish an overall isotropic combination model. The density in the material constant is the equivalent density of the combined model, and the other material constants are taken as the stronger magnesium alloy material constants in the combined model, and the failure model is also given with reference to the failure mode of the metal material.

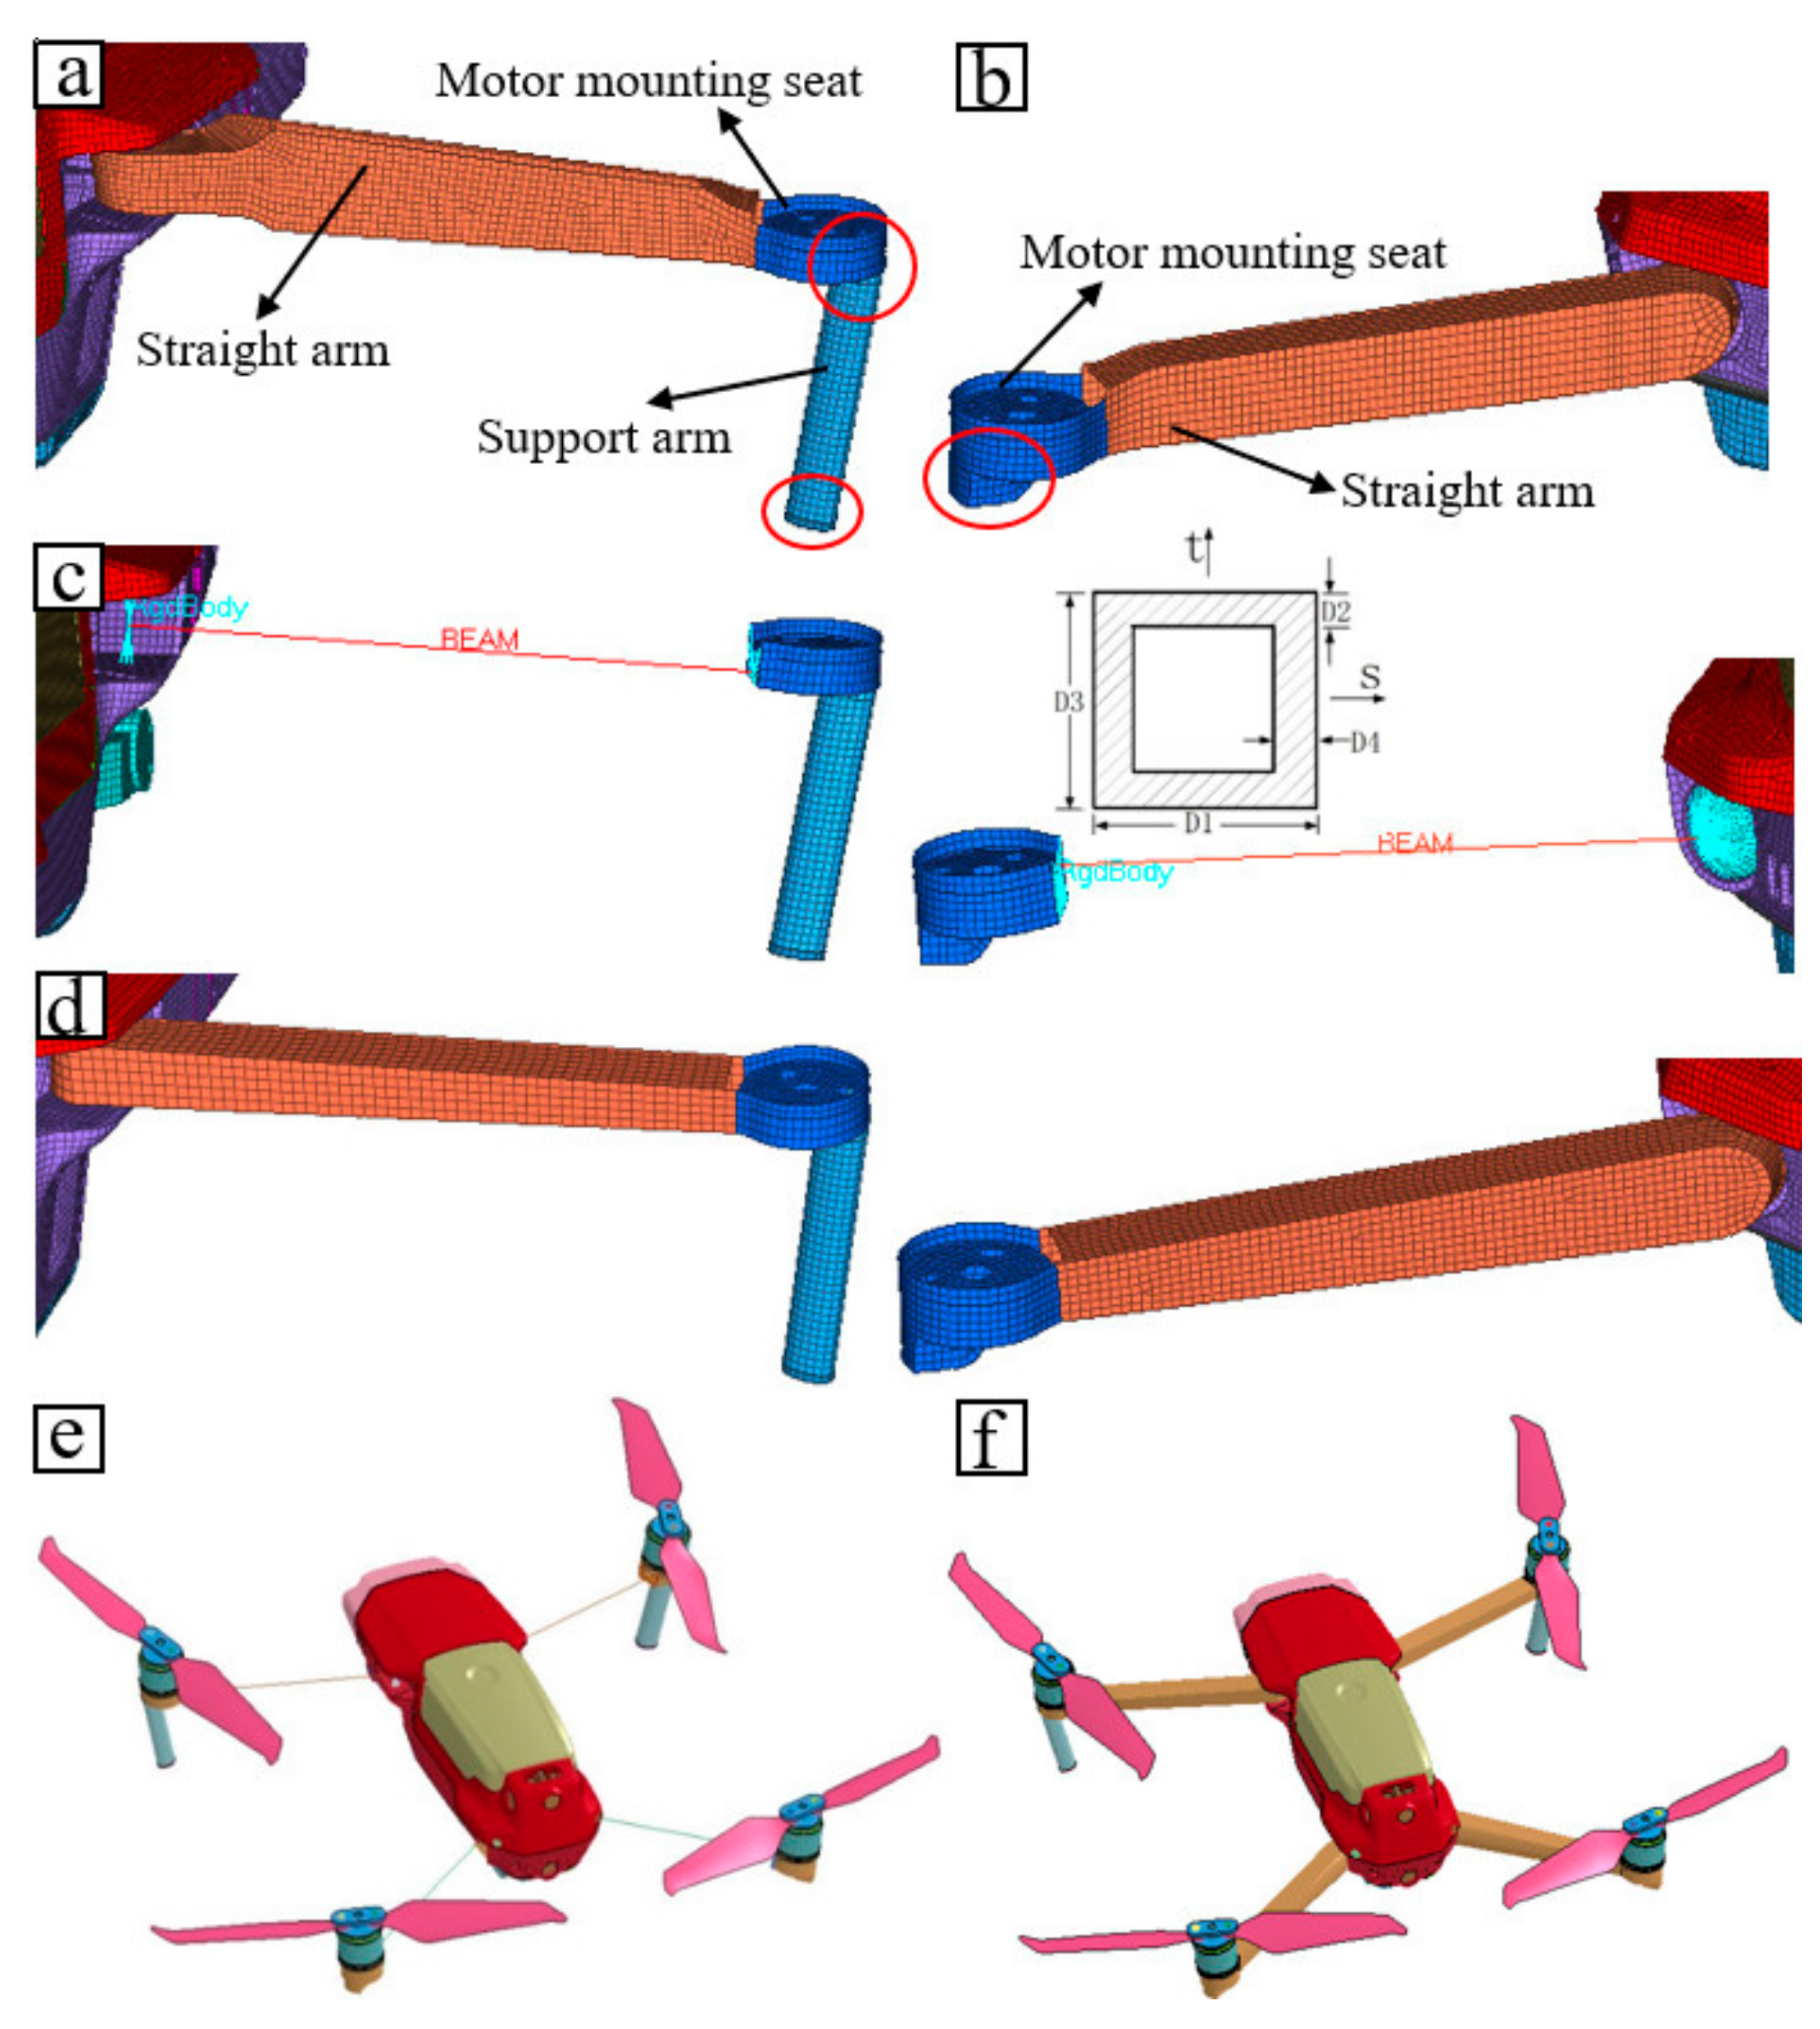
3.4.5. Method 5 and Method 6: Simplified Modeling of the Arm

The drone arm fell to a front arm and a rear arm. The structures of the two were similar but not identical. The front arm consisted of three parts, that is, a straight arm, a motor mounting seat and a support arm; the rear arm consisted of two parts, that is, a straight arm and a motor mounting seat. All parts of the arm were hollow thin-walled parts, so the full-size model was modeled by shell elements. The full-size models of the front arm and rear arm are shown in Figure 12a,b, respectively. The arm was a peripheral part of the overall fuselage structure, in which the straight arm acted as a connection, the motor mounting seat was used to install the motor, and the support arm was employed as a support for the fuselage. During the fall, the drone arm was vulnerable to impact. The motor mounting seat and support arm included the main impact damage positions in the mentioned drop test, which were the vulnerable parts.
The relatively complicated part of drone arm modeling was the geometric modeling and meshing of the straight arm, and the normal thickness of each part of the straight arm was not uniform. According to the structural characteristics of the arm, only the straight arm was simplified during the modeling. The structure of the straight arm was consistent with the hollow rod. This study developed two simplification methods for the simplification of the straight arm, that is, Method 5 and Method 6.
Method 5: The straight arm was modelled by beam elements of uniform thickness. The specific method: The nodes of the fuselage connected with the straight arm and the motor mounting seat were linked to the geometric center node via the Nodal Rigid Body, and then the center nodes of the two parts were connected via the beam element. The cross-sectional shape of the beam element used was a hollow square tube. The built arm model and beam element cross-sectional schematic diagram are shown in Figure 12c, where the front arm dimensions reached D1 = 12 mm, D2 = 1.8 mm, D3 = 12 mm, D4 = 1.5 mm, and the rear arm dimensions were D1 = 8 mm, D2 = 1.5 mm, D3 = 15 mm, D4 = 1.5 mm. In such a simplified modeling method, the element type simplification mode was largely applied, and the normal thickness and appearance characteristic simplification mode was employed as well. The built simplified model of drone Simplified model-5 is illustrated in Figure 12e.
Method 6: The modeling of the structural features of the straight arm part was simplified. The specific method: the irregular geometrical part of the straight arm was removed, and the equal straight surface modeling was used, whereas the connecting sections of the straight arm, the fuselage and the motor mounting seat were ensured to be complete; uniform normal thickness modeling was used in the simplified model. In this simplified modeling method, the simplified method of appearance characteristic was largely applied, and the normal thickness was employed as well. The simplified model of the arm is shown in Figure 12d. The connection between the simplified arm and the fuselage remained unchanged, and the simplified model-6 of the drone was shown in Figure 12f.

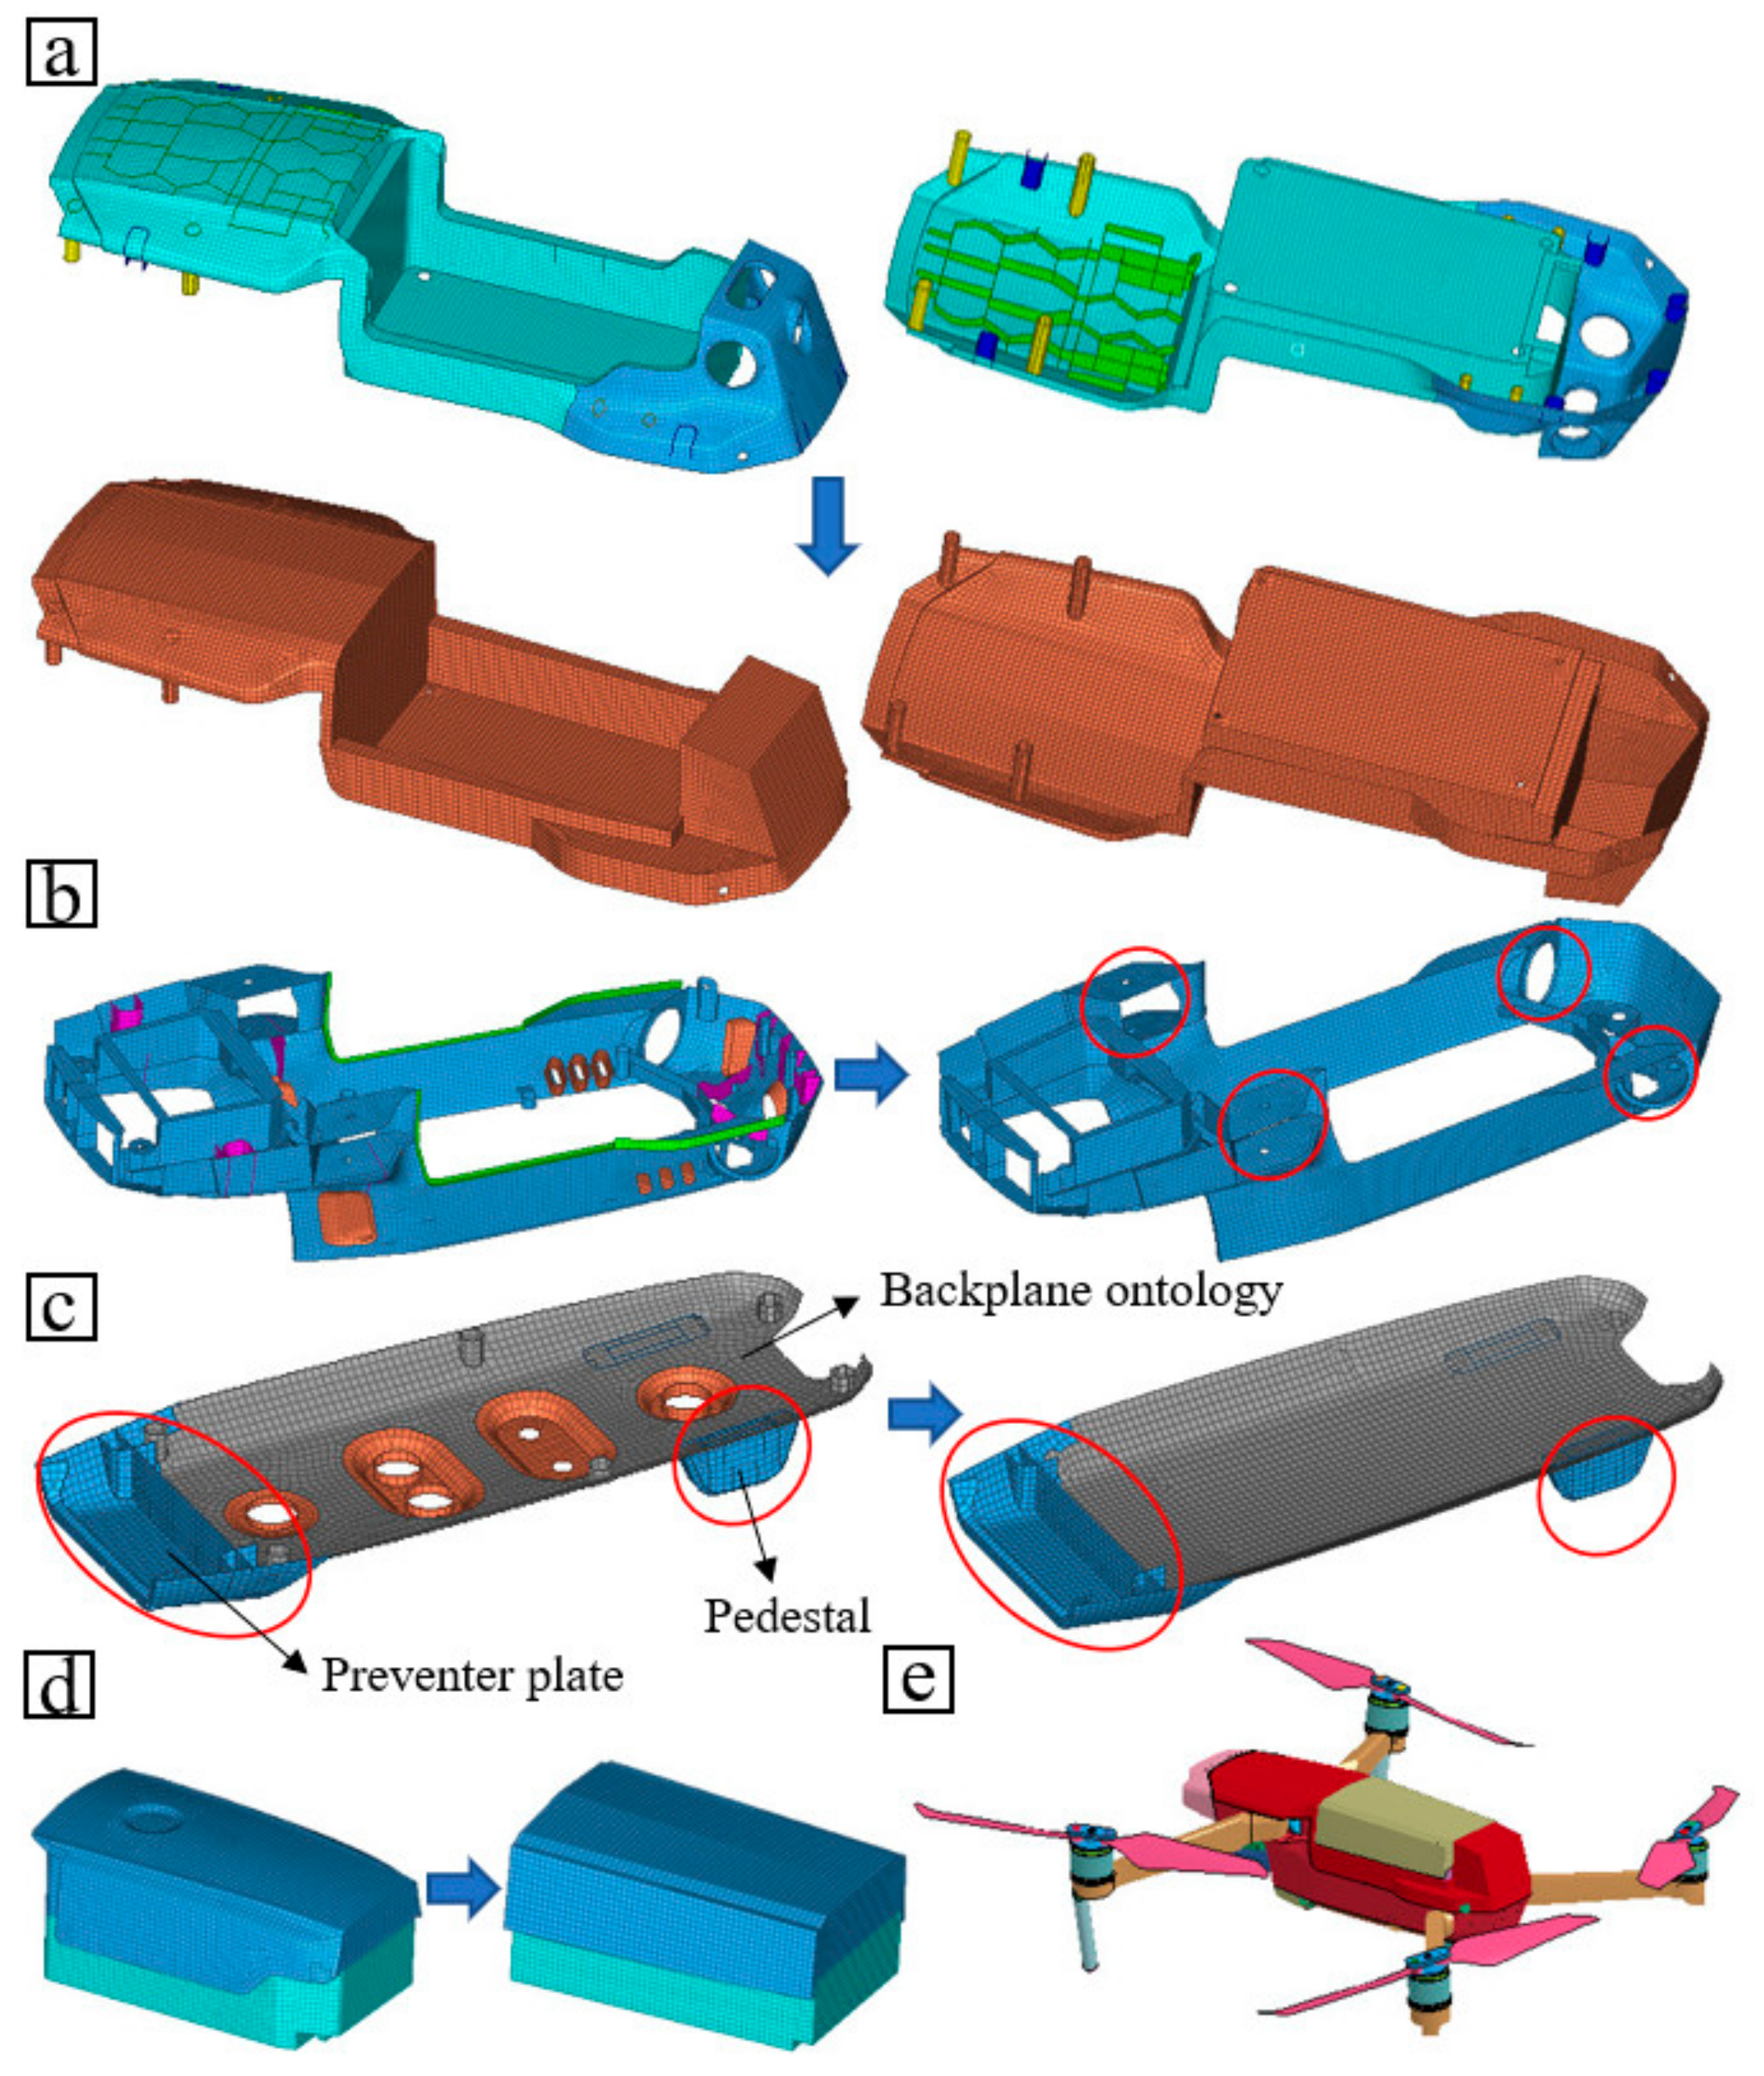
3.4.6. Method 7: Fuselage Case

The fuselage case consisted of an upper fuselage, a lower fuselage, a bottom plate and a battery box. All these components were thin-walled parts with uneven normal thickness. The surface of the fuselage case was mostly curved. To meet the functional requirements of the drone, there were different irregular grooves and holes on the surface of the drone fuselage. To satisfy the structural strength requirements of the drone fuselage and the precise installation requirements between different parts, the inner surface of the fuselage was installed with stiffeners, positioning grooves and bolt connection hole structures at multiple places. All parts of the fuselage case acted as the isotropic bodies, the backplane ontology was made of magnesium alloy, and the rest was made of polycarbonate. In the full-size model, the fuselage surface and internal detailed structure were modeled specifically by complying with the real structure of each part, and the mesh elements fell to regions and the section properties were defined by complying with the real thickness of different positions. A full-size model was difficult to model. Each curved surface and internal details should be accurately reverse modeled during 3D reverse modeling and fall to mesh elements satisfying the quality requirements during meshing.
To reduce the modeling difficulty and save the modeling time, the modeling for each part of the fuselage case was simplified. In the simplified model, two simplified modeling modes of normal thickness and appearance characteristic were adopted for each part to simplify modeling. Next, the specific simplification method of each part was elucidated separately:
The upper fuselage: For the curved case, the straight-face modeling was conducted according to its outer contour; the front-end stiffener ribs, the front and rear positioning grooves and the sensor hole at the rear of the fuselage were simplified and then removed. Figure 13a draws the comparison between the full-size model of the upper fuselage and the simplified model.
The lower fuselage: The connection structure of the fuselage was mainly concentrated in the lower fuselage, so the internal structure of the lower fuselage was mainly simplified. In terms of the connection structure of the lower fuselage, only the connection structure of the front arm and the rear arm were retained, as marked in the figure, and other structures were simplified. In the full-size model of the lower fuselage, the cooling holes, air intake holes and sensor holes on the side and rear surfaces were modeled specifically. In the simplified model, the mentioned detailed structures were simplified, and the outer surface of the lower fuselage was modeled through a straight plane. The full-size model and simplified model of the lower fuselage are presented in Figure 13b.
The bottom plate: The bottom plate consisted of a pedestal, a front protective plate and a backplane ontology. To be specific, the pedestal and the front protective plate acted as the main impact parts in the mentioned drop test. They were not simplified during the simplified modeling in the present section and were discussed in the next section. For the backplane ontology, the sensor mounting holes on the surface of the bottom plate and the bottom plate connection holes were all simplified, and the backplane ontology was simplified and then modeled as a straight plane. The full-size model of the bottom plate and the simplified model are illustrated in Figure 13c.
The battery box: The battery box simplified the curved surface into straight surface by complying with its basic contour line, whereas the battery cell was ensured to be correctly installed in the battery box. The full-scale model and simplified model of the battery box are shown in Figure 13c.
After simplifying the modeling of each part with the mentioned specific simplification method, the simplified model of each part was assembled together to build simplified model-7, as shown in Figure 13d.

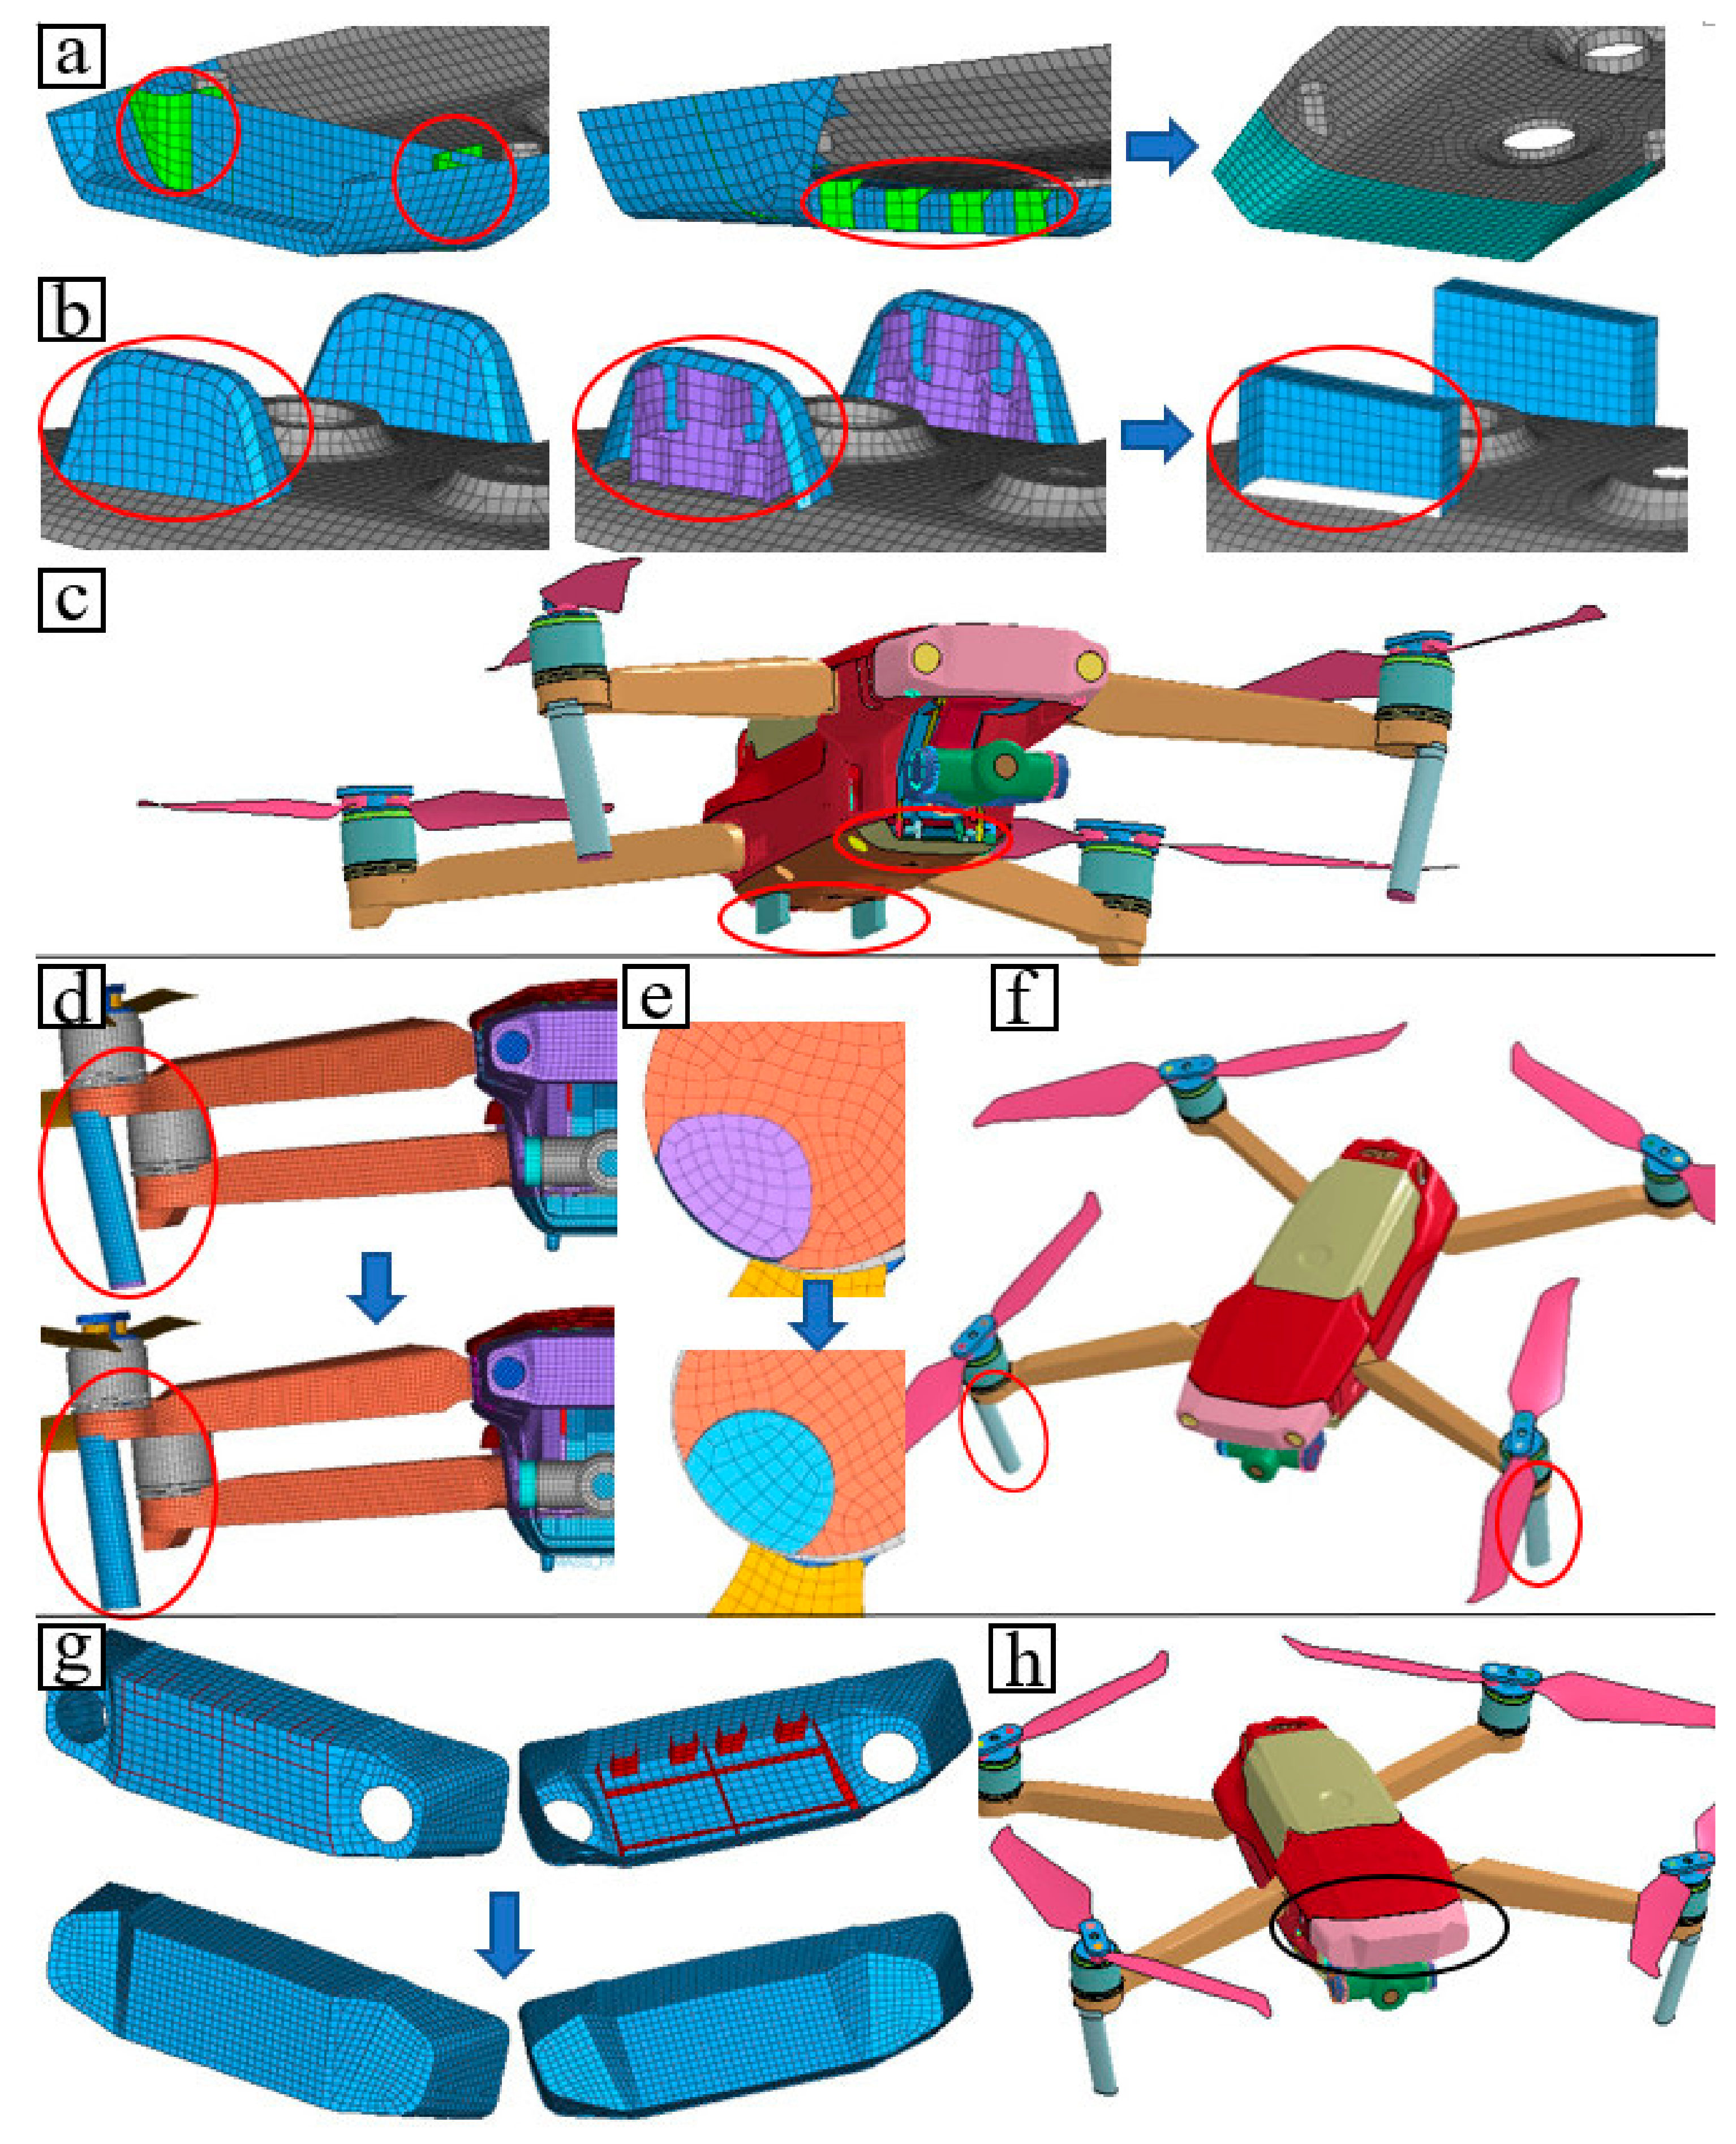
3.4.7. Method 8: Simplified Modeling of Impact and Damage Parts

Combining the mentioned component-level and complete-machine-level drop tests, the three main impact positions of the drone during the fall were classified, that is, the protective plate at the front end of the bottom plate, the pedestal, and the front shroud of the drone fuselage; the support arm in the front arm of the drone was the main damage location of the fall impact. In the present section, simplified modeling for impact parts and damaged parts was specifically investigated, and different simplified models were built based on their locations and corresponding drop tests. The mentioned impact and damage parts were irregular thin-walled vulnerable parts exhibiting non-uniform thickness, so the simplified modeling was primarily conducted through two simplified modeling modes of normal thickness and appearance characteristic.
Simplified modeling of the protective plate and the pedestal: In the positive posture drop test, the protective plate and the pedestal represent the two peaks of the impact load at the moment they land, that is, the protective plate and the pedestal acted as the two main impact positions. In the full-size model, the inner and outer sides of the protective plate were presented with stiffener structures, the front edge displayed a crimping structure toward the inside, and the two sides of the protective plate were arcs. The pedestal was an integral structure with a curved surface containing internal complex supporting and stiffening ribs. From the structural perspective, the mentioned two parts were identified to be easy to impact positions at the design stage of the drone, so multiple reinforcement plates were installed inside. As impacted by the complexity of the structure, considerable time and energy were spent on 3D reverse modeling and meshing when a full-scale model was being built. In the simplified model, the complex internal reinforcement structure and the curved surface were not modeled specifically detail, whereas the straight surfaces were used to build a similar geometric appearance. Simplified modeling according to this method significantly reduces the difficulty of geometric modeling and meshing. The simplified process of the protective plate and the pedestal are illustrated in Figure 14a,b, respectively. The built simplified model-8 is shown in Figure 14c.
Simplified modeling of support arm: In the component-level and the complete machine-level positive posture drop tests, the support arm was the only position where damage occurred, and it was another impact position. In the full-size model, the support arm was modeled by 3D scanning. The support arm and the lower surface of the front arm had a certain angle (<90°), and its cross-sectional shape was approximately elliptical, and the mentioned dimensional data could not be acquired by measurement. In the simplified model, the support arm was modeled by stretching directly on the lower surface of the front arm. Its cross-section was a similar shape built by two arcs, and the support arm displayed a vertical relationship with the lower surface of the front arm. Figure 14d presents the comparison result of the full-size model and the simplified model of the support arm position feature, and the comparison result of the cross-sectional shape of the support arm is shown in Figure 14e. The built drone simplified model-9 is presented in Figure 14f.
Simplified modeling of the front shroud: In the vertical posture drop test, the front shroud of the fuselage acted as the main impact position, representing the peak impact load. The front shroud had a curved shape as a whole, with sensor holes on both sides of the front end, and the stiffening rib structure on the inside. In the full-size model, the mentioned structures were modeled in detail. Each surface of the simplified model was modeled through the equal straight surface according to the original outer contour, and the sensor hole and rib structure were simplified. The full-size model and simplified model of the front cover are illustrated in Figure 14g, and the built drone simplified model-10 is shown in Figure 14h.
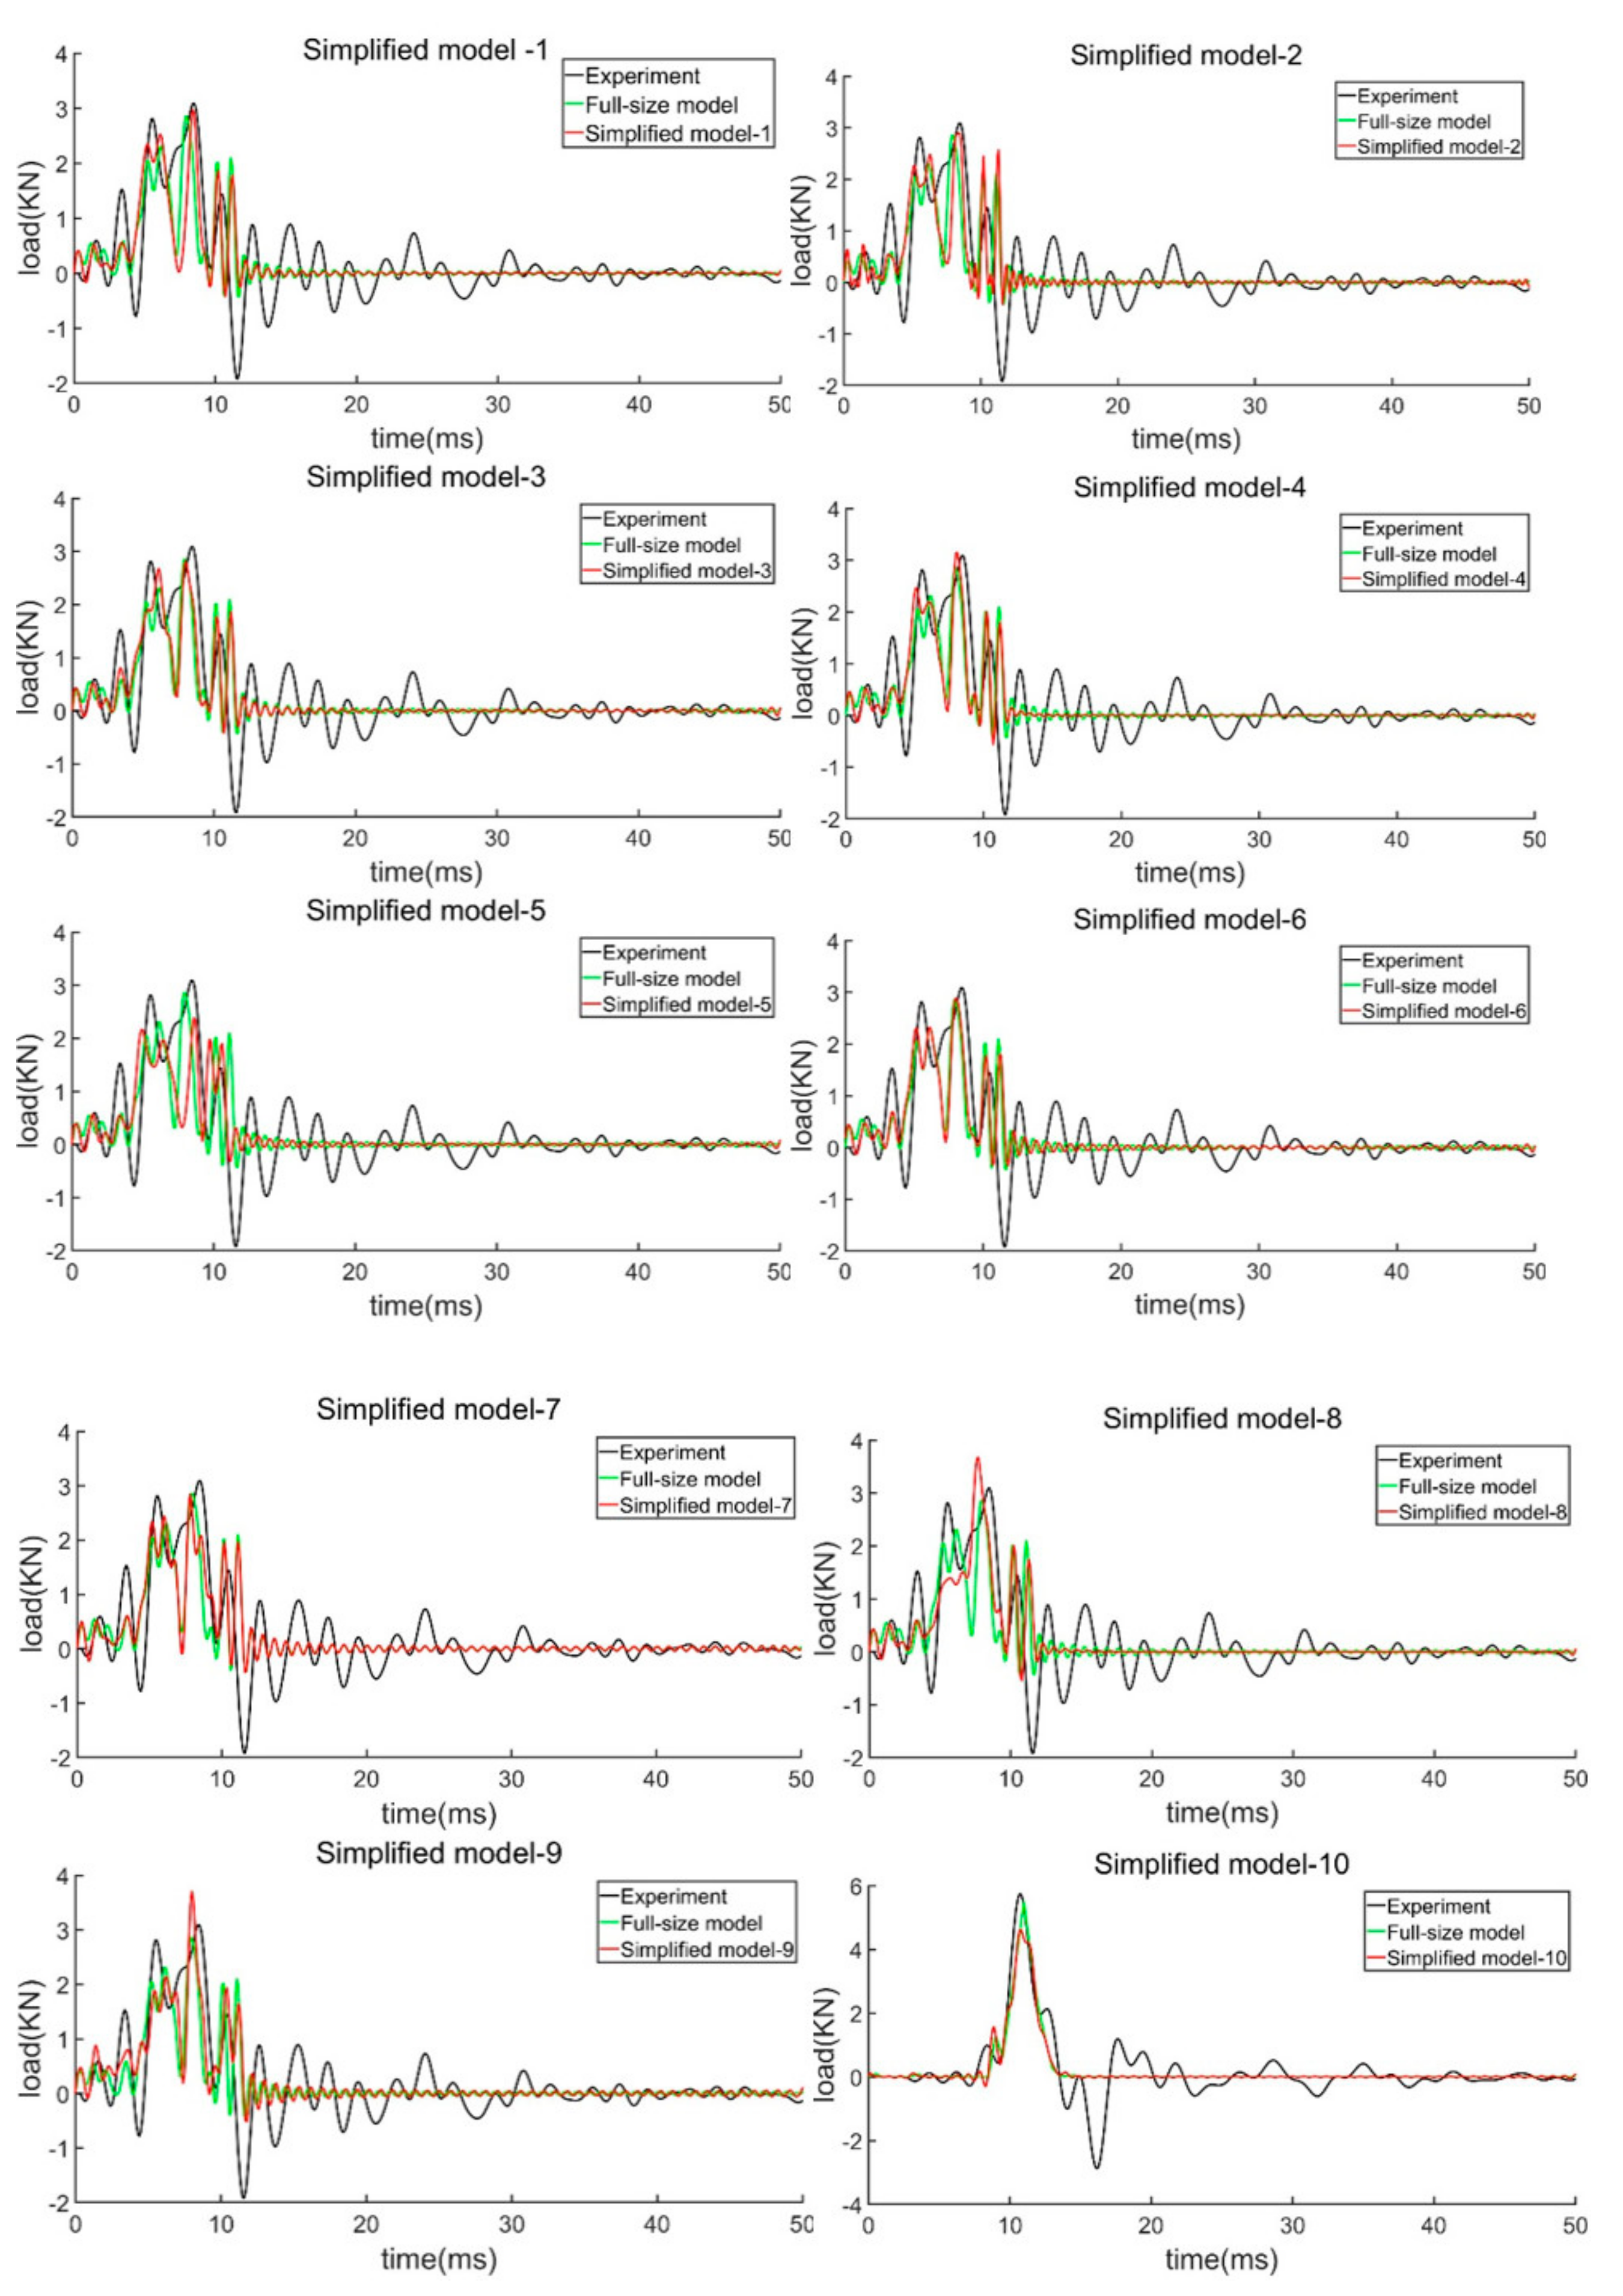
Simplified modeling has a premise of ensuring the calculation accuracy. Thus, the calculation accuracy of the built simplified model should be verified as well to illustrate the rationality of the proposed simplification mode and simplification method. The verification of the simplified model was also verified from three aspects, that is, the deformation response of the drone, the peak error of the impact load, as well as the change trend of the impact load. Since the simplified model was used here, the calculation accuracy of the model would inevitably be affected. Accordingly, a novel verification method was proposed for the simplified model, that is, the deformation response and impact load change trend of the simplified model could be consistent with the test results; especially for the impact load peak error, a new method was proposed here to determine the peak load error of impact load with the common method of identifying the peak load error in crash simulation analysis.
According to the method to determine the impact load peak error used by Li et al. [35] in their study on bird impact and nonlinear dynamic response, it was considered that the general permitted range of the impact load peak error was ≤15%. The maximum value of peak load error between the built full-size high-precision model and the above four tests was 7.7% and the minimum was 2.2%, displaying a significant gap. If the general permitted range (≤15%) acted as the peak load error judgment method of the simplified model, the peak load error of the simplified model might increase exponentially as opposed to the full-size high-precision model, thereby causing the calculation accuracy of the simplified model to reduce significantly. Obviously, it is not applicable to use the general permitted range as a method to determine the peak load error of the simplified model.
To ensure the calculation accuracy, a more rigorous and accurate peak load error judgment method was proposed here by meeting the general permitted error range (≤15%). The allowable range of the peak load error of the simplified model and the above four tests increased in proportion to the peak load error of the corresponding full-scale high-precision model and the experiment. As a result, the allowable range of the peak load error of the simplified model and the above four tests increased in proportion to the peak load error of the corresponding full-size high-precision model and experiment. Specific strategy: the peak load error between the full-scale high-precision model and the test results was recorded as A, and the peak load error between the simplified model and the test results was recorded as Δ A ( Δ   > 0 and Δ A ≤ 15%). Combining the general permitted error range in the nonlinear dynamic response simulation analysis and the peak load error results of the above full-size high-precision model and test, Δ   = 1.5 was set.
The strategy to determine whether the simplified model is a high-precision model was elucidated as: the deformation response and impact load change trend of the simplified model could comply with the test results; based on the impact load change trend and the deformation response at the typical time consistent with the experiment, if the peak load error of the simplified model was not more than 1.5A, the simplified model was considered a simplified high-precision model, and the simplified modes and simplified method adopted were proven to be reasonable; under the peak load error of the simplified model over 1.5A, the simplified modes and simplified method adopted were not suitable for the simplified modeling of the drone during the drop test.
Combining the above four verification tests and the peak load error of the full-size high-precision model, the peak load error standard of the simplified high-precision model was determined (Table 9).

4. Prediction Accuracy Analysis of Simplified High-Precision Model for Light and Small Drone

In this chapter, the calculation accuracy of the single simplified model built by the mentioned simplified modeling methods was first verified and analyzed. On that basis, a combined simplified model of the drone was built. Lastly, the calculation scale and solution time of all drone finite element models in the present study were statistically compared and analyzed.

4.1. Analysis of Calculation Accuracy of Different Simplified Methods

In the present section, the corresponding verification test for the single simplified model built by each simplified modeling method was selected from the above four verification tests, the calculated results of the single simplified model were compared and verified, and the degree of influence of each single simplified modeling method on the calculated results was determined. The degree of influence was determined by the peak load error Δ A ( Δ   > 0) between the simplified model and the test results, and the degree of influence of each simplified method was ranked to underpin the subsequent establishment of a combined simplified model. The calculated results of the single simplified model were compared from three aspects, that is, the peak error of the impact load, the change trend of the load and the deformation response at typical time. The corresponding verification test was selected according to the structural characteristics of the drone itself and the impact position in the drop test. The first nine single simplified models were verified by the complete machine positive posture drop test; since the simplified part of Simplified model-10 was the front shroud, and the front shroud was the impact position of the vertical posture drop test, it was verified by the complete machine vertical posture drop test.
Figure 15 illustrates the results of the impact loads of ten single simplified models as compared with their corresponding verification test results and the full-size models calculated results. As indicated from the figure, the impact load change trend of each single simplified model complied with those of the test results and the calculated results of the full-size model. Table 10 summarizes the peak load of the respective single simplified model, the accurate error value compared with the test result, as well as the error Δ A ( Δ   > 0) between the peak load of the simplified model and the test result. As revealed from the calculated results, the errors of simplified models −1, 2, 3, 4, 6 and 7 were all less than 1.5A, and the calculated results of the simplified model were slightly inconsistent with the calculated results of the full-size model; the errors of simplified models-5, 8, 9 and 10 all reached over 1.5A, and the errors were relatively large. The deformation response of the simplified model meeting the error accuracy requirements at each typical moment complied with the experimental and the calculated results of the full-size model. In brief, the verified results demonstrate the simplified modes and simplified methods adopted by the simplified model that satisfied the error accuracy requirements to be reasonable.
For the simplified model not satisfying the calculation accuracy, the comparison results of the drone deformation response and the simulation calculation at the respective typical moment are presented in Figure 16. Simplified model-5 corresponds to simplified method 5. The beam element was used to replace the straight arm to simplify the modeling, so the load of the arm and motor part could not be overall transmitted to the fuselage, thereby causing a serious drop in the impact load of the drone on the ground. The deformation response of the simplified model at the respective typical time was basically consistent with the experiment. Simplified model-8, simplified model-9 and simplified model-10 correspond to simplified method 8 simplifying different impact and damage parts respectively. Simplified model-8 refers to the simplification of the protective plate. As indicated from the calculated results, the impact load of the protective plate landing on the ground at 5 × 10⁻³ s decreased severely, and the energy loss of the drone was reduced, thereby causing the kinetic energy of drone to be larger than the full-size model at 8 × 10⁻³ s. Thus, the impact load of the pedestal on the ground at 8 × 10⁻³ s was relatively large. The deformation response of the drone at the respective typical time of the simplified model was nearly consistent with the experiment. Simplified model-9 refers to the simplification of the support arm. As revealed from the calculated results, under the impact of the simplified model-9 with the ground, the support arm did not completely fracture, while only elastic deformation occurred. The part where the outer edge of the support arm was disconnected from the motor mounting seat in the figure represents the original structure of the drone. Since the support arm did not completely fracture, it absorbed less energy under the impact, thereby causing a relatively large impact load of the drone on the ground when the pedestal landed. Simplified model-10 expresses the simplification of the front shroud. At 11 × 10−3 s, the front shroud completely landed, and the load reached its peak. As opposed to the test and full-size model, the front shroud of the simplified model underwent greater elastoplastic deformation, and the energy absorption was greater during the significant deformation, so the impact load of the drone on the ground decreased significantly. As proven by the above analysis of the impact load peak error and deformation response, the simplified method five and the simplified method eight more noticeably impacted the calculated results, that is, the simplified modeling of beam element instead of straight arm and the simplified modeling of impact-damaged parts caused larger calculation errors. Other simplification methods slightly impacted the calculated results.
Based on the above calculated results, the calculated results of Simplified models-1, 2, 3, 4, 6 and 7 were well consistent with the experimental and full-size models in terms of deformation response at typical moments, change trend of impact load and peak error of impact load, while meeting the set error conditions. Therefore, simplified models-1, 2, 3, 4, 6 and 7 are demonstrated to be single simplified high-precision models, and the corresponding simplified methods are reasonable and suitable for simplified modeling of the drone drop process. Furthermore, simplified models-5, 8, 9 and 10 do not satisfy the set error conditions, and the corresponding simplified method 5 and simplified method 8 are not suitable for simplified modeling of the drone drop process.
In the present study, the single simplified high-precision model and its corresponding simplified methods were sorted in accordance with the size of the calculation error:
Single simplified high-precision model: Simplified model-4 > Simplified model-1 > Simplified model-6 > Simplified model-2 > Simplified model-7 > Simplified model-3.
Corresponding simplification method accuracy ranking: Method 4 > Method 1 > Method 6 > Method 2 > Method 7 > Method 3.
The calculation accuracy of the simplified high-precision model established above still has small differences, mainly due to: (1) Different simplified models have different simplified parts. Although the weights of the simplified models of different simplified parts remain the same, there are certain differences in the simplified models themselves. If the simplified part is a drop-collision contact part, it will have a greater impact on the calculation accuracy; if the simplified part is a non-drop-collision contact part or a non-important detailed structure, it will have a smaller impact on the calculation accuracy. (2) Different simplified models use different simplification methods and simplification methods. Attribute information such as concentrated mass, structural rigidity, and geometric dimensions determines the simplification method used, and also affects the accuracy of drone impact dynamics simulation analysis.

4.2. Combination Simplified Model Establishment and Verification

In the present section, a combined simplified model was built by referencing the above simplified accuracy analysis results. By ensuring the calculation accuracy, more simplified methods were used as much as possible to simplify the modeling of the drone model to achieve the most significant reduction in modeling complexity and the calculation scale of the finite element model. All the simplification methods corresponding to the above single simplified high-precision model were employed to build a combined simplified model simultaneously, and the built combined simplified model is illustrated in Figure 17.
According to the method of verifying the full-scale model, the combined simplified model was verified from three aspects, that is, drone deformation response, impact load change trend and impact load peak error. Figure 18 presents the compared and verified results of the deformation response of the combined simplified model at the respective typical time by four tests. The main deformation characteristics of each typical moment are marked in the figure, and the results suggest that the deformation response results of the combined simplified model were basically consistent with the experiment. Figure 19 presents the compared and verified impact load calculated results of the combined simplified model with those of the test and the full-scale model. As indicated from the figure, the load change trend of each simulation calculated result highly complied with the test and the full-size model, while displaying a high degree of coincidence with the full-size model calculated results at each time point. Table 11 lists the peak load of the combined simplified model, the accurate error value compared with the test result, as well as the error Δ A between the peak load of the combined simplified model and the test result in each verification calculation. According to the results, the errors of each verification calculated result of the combined simplified model were overall less than 1.5A, meeting the model error assessing method of the simplified model built above. However, the calculation errors of the combined simplified model were both larger than the full-scale high-precision model and the single simplified high-precision model, demonstrating that, with the increase in the number of simplified parts, the calculation error of the simplified model increase.
Given the above three aspects of verification and analysis results, the simulation-calculated results of the combined simplified model were highly consistent with the experimental results and the calculated results of the full-size model, while meeting the set error conditions. Accordingly, the combined simplified model built is considered a simplified high-precision model. Furthermore, the simplified mode and the simplified method adopted to simplify the high-precision model are proved to be reasonable and suitable for the simplified modeling of the falling of the light and small drone.
This paper also compared the stress and stress distribution of the combined simplified model and the full-size high-precision model at typical moments. Figure 20 shows the comparison of stress and stress distribution between the simplified model and the full-scale high-precision model at typical moments in the complete machine positive posture drop test. At 2 × 10⁻³ s, the left front support arm joint began to break, the right front support arm touched the ground, and the load was transferred to the fuselage along the straight arm. Since the support arm is an impact-damaged part, it has not been simplified, so there is little difference in the maximum stress transmitted to the fuselage at this time. In the simplified model, the propeller is simplified to a plane structure according to its outline, which results in a certain difference in the stress distribution on the propeller at this time. At 5 × 10⁻³ s, the front camera gimbal of the drone touched the ground. In the simplified model, the camera gimbal was simplified through combined modeling, which results in the difference between the simplified model camera gimbal’s load transfer process and the full-scale high precision at the moment of landing. Therefore, the maximum difference in stress at this time is relatively large. At 8 × 10⁻³ s, the rear base of the drone landed and the load reached its maximum value. The rear base of the drone is the main point of impact and has not been simplified, so the maximum value of the stress transmitted to the fuselage is not much different at this time.
Figure 21 shows the comparison of stress and stress distribution between the simplified model and the full-scale high-precision model at typical moments in the complete machine vertical posture drop test. At 4 × 10⁻³ s, the left front propeller hit the ground, the right propeller touched the ground and rotated around its axis to rebound. In the simplified model, the curved structure of the propeller was simplified into a plane structure according to its contour and a uniform thickness was defined to the propeller. At this time, only the propeller in the drone touched the ground. Due to the different structures of the propellers, the maximum stress varies greatly, but the only loaded component was the propeller, so the load was mainly concentrated on the propeller. At 11 × 10−3 s, the front cover of the fuselage completely landed and the load reached its maximum value. The front cover of the drone fuselage is the main impact point, and it is not simplified in the simplified model. At this time, the front cover of the drone is deformed and the maximum stress appears at the large deformation. Therefore, there is little difference in the maximum stress at this time between the combined simplified model and the full-scale high-precision model. It can be seen that there is a large difference in the stress distribution of the upper fuselage at this time, which is due to the combined modeling of the battery component in the simplified model to simplify the battery box components. Compared with the full-size model, the simplified model battery acts as a whole on the upper fuselage during the complete machine vertical posture drop test, which results in a difference in the stress distribution of the upper fuselage.

4.3. Simplified Model Calculation Scale and Solution Time Analysis

To more intuitively reflect the effect of simplified modeling, the present section drew a statistical comparison and analysis of the calculation scale (number of elements) and solution time of the full-size high-precision model and the simplified high-precision model. The established finite element model of the drone uses eight cores with no GPU acceleration to perform single-precision calculations through the LS-DYNA finite element program. The simulation calculation time was 50 × 10−3 s, and the solution time step of each model was ensured as 1.04 × 10⁻⁷ s. All results were computed with a high-performance computer that had a 48-core CPU@2.90GHz and a 128GB RAM.
Table 12 lists the calculation scale and solution time of all calculation models, that is, full-scale high-precision model, single simplified high-precision model, as well as combined simplified high-precision model. As demonstrated by the results, in terms of calculation scale, the combined simplified high-precision model < single simplified high-precision model < full-size high-precision model; corresponding to the solution time, with the decrease in the calculation scale, the corresponding proportion of solution time decreased. The reduction in the calculation scale of each single simplified high-precision model was, relatively small, and the calculation scale was basically consistent, so the solution time of each single simplified high-precision model was significantly different. Compared with the full-size high-precision model, the calculation scale of the combined simplified high-precision model is significantly reduced, and the corresponding solution time was significantly reduced as well. Combined with the above analysis, the simplified model is suggested to effectively reduce the solution scale of the finite element model and the consumption of computing time and other resources.

5. Conclusions

In the present study, the full-size modeling method and simplified modeling method of different components were analyzed for a light and small drone with the maximum market share at present, and the full-size high-precision model, the single simplified high-precision model and the combined simplified high-precision model were built. Each calculation model was verified and analyzed at the component level and the complete machine level, and a range of simplified modeling modes and methods satisfying the accuracy requirements were given. The conclusions are drawn as follows:
(i)
This study formed a complete set of full-size high-precision modeling methods, component-level and complete machine-level verification methods and simulation analysis methods for light and small drones, which apply to the full-scale modeling and simulation calculation analysis of the identical type and other types of light and small drones. It is of certain significance for guiding the high-precision modeling of drone;
(ii)
As revealed by the verification and analysis of the respective single simplified model, there were small calculation errors attributed to simplified non-impact components (e.g., the fuselage case, the detailed structure of the internal circuit board, the arm and the centralized mass), while the simplified model containing the main impact positions and damaged components would be subject to larger calculation errors;
(iii)
As indicated by conducting the calculation error analysis of the single simplified model and the combined simplified model, with the increase in the types and number of simplified components, the calculation error of the simplified model will also increase;
(iv)
Combining the general permitted error range (≤15%) in the nonlinear dynamic response simulation analysis and the peak load error results of the full-size high-precision model and test, a simplified model peak load error assessing strategy was proposed: the peak load error between the full-scale high-precision model and the test results was recorded as A. If the error between the peak load of the simplified model and the test result was not greater than Δ A ( Δ   > 0 and Δ A ≤ 15%), the simplified model was considered a high-precision model. Δ could be determined according to the structural characteristics of different drones and the simulation requirements of the fall process (recommendation Δ   ≤ 1.5);
(v)
As suggested by comparing and analyzing the calculation accuracy of a single simplified model of different components, only by retaining as many attributes as possible to characterize the collision behavior of the drone could the simplified drone fuselage structure model exhibit high calculation accuracy. Thus, it is recommended to simplify the modeling of small and light drones for simulation calculation of the fall process. The following strategies and suggestions can be referred to: (a) for centralized mass components (e.g., battery, motor and camera gimbal), the simplified method of combined modeling was adopted for integrated modeling; (b) for the circuit board kits containing composite materials inside the fuselage, two simplified methods of material model and combined modeling were employed for simplified modeling; (c) for thin-walled and non-uniform thickness components (e.g., arm and fuselage case), two simplified methods of normal thickness and appearance characteristics were employed for simplified modeling; (d) for the components containing the main impact and damage positions, the simplified modeling should not be conducted, and a full-scale model should be built.

Author Contributions

Conceptualization, Y.Z. and Y.H.; methodology, Y.Z., Y.H., Z.L. and K.L.; Modeling and analysis, Y.H., Z.L. and K.L.; test and validation, K.C. and Y.G.; data curation, K.C. and Y.G.; writing—original draft preparation, Y.Z and Y.H.; writing—review and editing, K.L.; supervision, Y.Z.; project administration, Y.Z. and K.L.; funding acquisition, Y.Z. and K.L. All authors have read and agreed to the published version of the manuscript.

Funding

This research was funded by the National Natural Science Foundation of China (Grant Nos. 11972301, 11201375, 11972300), the Fundamental Research Funds for the Central Universities of China (Grant No. G2019KY05203), the Natural Science Foundation of Shaanxi Province (Grant No. 2018JQ1071).

Data Availability Statement

Not applicable.

Conflicts of Interest

The authors declare no conflict of interest.

References

  1. Jenkins, D.; Vasigh, B. The Economic Impact of Unmanned Aircraft Systems Integration in the United States; Association for Unmanned Vehicle Systems International (AUVSI): Arlington, VA, USA, 2013; pp. 1–40. [Google Scholar]
  2. Liu, K.; Wang, R.; Wang, X.; Wang, X. Anti-saturation adaptive finite-time neural network based fault-tolerant tracking control for a quadrotor UAV with external disturbances. Aerosp. Sci. Technol. 2021, 115, 106790. [Google Scholar] [CrossRef]
  3. Eliker, K.; Grouni, S.; Tadjine, M.; Zhang, W. Practical finite time adaptive robust flight control system for quad-copter UAVs. Aerosp. Sci. Technol. 2020, 98, 105708. [Google Scholar] [CrossRef]
  4. Zhen, Z.; Chen, Y.; Wen, L.; Han, B. An intelligent cooperative mission planning scheme of UAV swarm in uncertain dynamic environment. Aerosp. Sci. Technol. 2020, 100, 105826. [Google Scholar] [CrossRef]
  5. Liu, Y.; Liu, H.; Tian, Y.; Sun, C. Reinforcement learning based two-level control framework of UAV swarm for cooperative persistent surveillance in an unknown urban area. Aerosp. Sci. Technol. 2020, 98, 105671. [Google Scholar] [CrossRef]
  6. Wang, C.H.J.; Tan, S.K.; Low, K.H. Three-dimensional (3D) Monte-Carlo modeling for UAS collision risk man-agement in restricted airport airspace. Aerosp. Sci. Technol. 2020, 105, 105964. [Google Scholar] [CrossRef]
  7. Ruchti, J.; Senkbeil, R.; Carroll, J.; Dickinson, J.; Holt, J.; Biaz, S. Unmanned aerial system collision avoidance using artificial po-tential fields. J. Aerosp. Inf. Syst. 2014, 11, 140–144. [Google Scholar]
  8. Pierpaoli, P.; Rahmani, A. UAV collision avoidance exploitation for noncooperative trajectory modification. Aerosp. Sci. Technol. 2018, 73, 173–183. [Google Scholar] [CrossRef]
  9. Asmat, J.; Rhodes, B.; Umansky, J.; Villavicencio, C. Safety Uas. Unmanned aerial collision avoidance system (UCAS). In In Proceedings of the 2006 IEEE Systems & Information Engineering Design Symposium, Charlottesville, VA, USA, 28–28 April 2006; pp. 43–49. [Google Scholar]
  10. EASA. Final Report[R] 04-10-16; 2016. Drone Collision Task Force. Available online: https://www.easa.europa.eu/downloads/21443/en (accessed on 5 December 2021).
  11. Radi, A. Potential Damage Assessment of a Mid-Air Collision with a Small UAV[R]; Civil Aviation Safety Authority of Australian Report: Melbourne, Australia, 2013. [Google Scholar]
  12. Georgiadis, S.; Gunnion, A.J.; Thomson, R.S.; Cartwright, B.K. Bird-strike simulation for certification of the Boeing 787 composite moveable trailing edge. Compos. Struct. 2008, 86, 258–268. [Google Scholar] [CrossRef]
  13. Campolettano, E.T.; Bland, M.L.; Gellner, R.A.; Sproule, D.W.; Rowson, B.; Tyson, A.M.; Duma, S.M.; Rowson, S. Ranges of Injury Risk Associated with Impact from Unmanned Aircraft Systems. Ann. Biomed. Eng. 2017, 45, 2733–2741. [Google Scholar] [CrossRef] [PubMed]
  14. Hian, K.C.; Low, K.H.; Lei, L.; Zhao, Y.; Deng, C.; Tan, S.K.; Chen, Y.; Yeap, B.C.; Lia, X. Weight threshold estimation of falling UAVs (Unmanned Aerial Vehicles) based on impact energy. Transp. Res. Part C Emerg. Technol. 2018, 93, 228–255. [Google Scholar]
  15. Olivares, G.; Gomez, L.; Zinzuwadia, C.; de los Monteros, J.E.; Baldridge, R.J.; Aldag, T. UAS Airborne Collision Severity Evaluation—Volume II—Quadcopter; Report DOT/FAA/AR-XX/XX; Federal Aviation Administration: Washington, DC, USA, 2017. [Google Scholar]
  16. Olivares, G.; Lacy, T.; Gomez, L.; Zinzuwadia, C.; Espinosa de los Monteros, J.; Baldridge Aldag, T.R.; Kota, K.; Ricks, T.; Jaya-kody, N. UAS Airborne Collision Severity Evaluation—Volume III—Fixed Wing; Report DOT/FAA/AR-XX/XX; Federal Aviation Administration: Washington, DC, USA, 2017. [Google Scholar]
  17. Xianghao, M.; Yingjun, S.; Jingyu, Y.; Zhongbin, T.; Liu, J.; Tao, S.; Yulong, L. Dynamic response of the horizontal stabilizer during UAS airborne collision. Int. J. Impact Eng. 2019, 126, 50–61. [Google Scholar]
  18. Lu, X.; Liu, X.; Li, Y.; Zhang, Y.; Zuo, H. Simulations of airborne collisions between drones and an aircraft windshield. Aerosp. Sci. Technol. 2020, 98, 105713. [Google Scholar] [CrossRef]
  19. Liu, H.; Man, M.H.C.; Low, K.H. UAV airborne collision to manned aircraft engine: Damage of fan blades and resultant thrust loss. Aerosp. Sci. Technol. 2021, 113, 106645. [Google Scholar] [CrossRef]
  20. Song, Y.; Horton, B.; Bayandor, J. Investigation of UAS Ingestion into High-Bypass Engines, Part 1: Bird vs Drone. In Proceedings of the 58th AIAA/ASCE/AHS/ASC Structures, Structural Dynamics, and Materials Conference, Grapevine, TX, USA, 9–13 January 2017; pp. 9–13. [Google Scholar] [CrossRef]
  21. Schroeder, K.; Song, Y.; Horton, B.; Bayandor, J. Investigation of UAS ingestion into high-bypass engines, Part 2: Parametric drone study. In Proceedings of the 58th AIAA/ASCE/AHS/ASC Structures, Structural Dynamics, and Materials Conference, Grapevine, TX, USA, 9–13 January 2017; p. 0187. [Google Scholar]
  22. Zhang, Y.; Huang, Y.; Liang, K.; Cao, K.; Wang, Y.; Liu, X.; Guo, Y.; Wang, J. High-precision modeling and collision simulation of small rotor UAV. Aerosp. Sci. Technol. 2021, 118, 106977. [Google Scholar] [CrossRef]
  23. LS-DYNA Keyword User’s Manual Volume I; Livermore Software Technology Corporation: Livermore, CA, USA, 2015.
  24. Dwivedi, A.; Bradley, J.; Casem, D. Mechanical Response of Polycarbonate with Strength Model Fits; MD, USA. 2012. Available online: https://apps.dtic.mil/sti/citations/ADA566369 (accessed on 5 December 2021).
  25. Giraud, E.; Rossi, F.; Germain, G.; Outeiro, J. Constitutive Modelling of AZ31B-O Magnesium Alloy for Cryogenic Machining. Procedia CIRP 2013, 8, 522–527. [Google Scholar] [CrossRef] [Green Version]
  26. Fan, X.; Suo, T.; Sun, Q.; Wang, T. Dynamic mechanical behavior of 6061 al alloy at elevated temperatures and different strain rates. Acta Mech. Solida Sin. 2013, 26, 111–120. [Google Scholar] [CrossRef]
  27. MatWeb. BASF Capron® 8202 NL Nylon 6 (Dry). Available online: http://www.matweb.com/search/DataSheet.aspx?MatGUID=d233c57fac534034b79c9dd6ef622aa8 (accessed on 5 December 2021).
  28. MatWeb. BASF Ultramid® B35EG3 BK 00564 15% Glass Filled PA6 (Dry). Available online: http://www.matweb.com/search/DataSheet.aspx?MatGUID=74bb39d035484dfe9e8eca6cbbd509f3 (accessed on 5 December 2021).
  29. Sahraei, E.; Hill, R.; Wierzbicki, T. Calibration and finite element simulation of pouch lithium-ion batteries for mechanical integrity. J. Power Sources 2012, 201, 307–321. [Google Scholar] [CrossRef]
  30. Sahraei, E.; Meier, J.; Wierzbicki, T. Characterizing and modeling mechanical properties and onset of short circuit forthree types of lithium-ion pouch cells. J. Power Sources 2014, 247, 503–516. [Google Scholar] [CrossRef]
  31. MMPDS-09, Metallic Material Properties Development and Standardization (MMPDS), Chapter 9, 7th ed.; Battelle Memorial Institute: Columbus, OH, USA, 2014.
  32. Ravi-Chandar, K.; Satapathy, S. Mechanical Properties of G-10 Glass-Epoxy Composite; Technical Report IAT.R0466; Institute for Advanced Technology, The University of Texas Austin: Austin, TX, USA, 2007. [Google Scholar]
  33. Blankenhorn, G.; Wang, J.; Queitzsch, G.; Kan, C.-D.; Sengoz, K.; Vasko, T.J. LS-DYNA “HYBRID Studies Using the LS-DYNA” Aerospace Working Group Generic Fan Rig Model. In Proceedings of the 13th International LS-DYNA Users Conference, Dearborn, MI, USA, 8–10 June 2014; pp. 1–15. [Google Scholar]
  34. Livermore Software Technology Corporation: 2015. “LS-DYNA Theory Manual”, LS-DYNA User Manual. Available online: https://cupdf.com/document/ls-dyna-theory-manual.html (accessed on 5 December 2021).
  35. Yulong, L.; Yongkang, Z.; Pu, X. Study of Similarity Law for Bird Impact on Structure. Chin. J. Aeronaut. 2008, 21, 512–517. [Google Scholar] [CrossRef] [Green Version]
Figure 1. (a) Drone size. (b) Internal structure. (c) Drone materials.
Aerospace 08 00387 g001
Figure 2. (a) Bolted connection. (b) Spring connection. (c) Revolute. (d) Tie-Break.
Aerospace 08 00387 g002
Figure 3. (a) Schematic diagram of drop test. (b) Drop test layout. (c) Schematic diagram of drop-weight test. (d) Drop-weight test layout.
Aerospace 08 00387 g003
Figure 4. (a) Drop test results. (b) Drop-weight test results.
Aerospace 08 00387 g004
Figure 5. (a) Drone positive posture. (b) Drone vertical posture. (c) Drop test results of drone positive posture. (d) Drop test results of drone vertical posture.
Aerospace 08 00387 g005
Figure 6. Comparison of deformation response of full-size model. (a) Drop test of drone components. (b) Drop-weight test of drone components. (c) Drop test of drone positive posture. (d) Drop test of drone vertical posture.
Aerospace 08 00387 g006
Figure 7. Comparison of impact load between simulation and experiment. (a) Drop test of drone components. (b) Drop-weight test of drone components. (c) Drop test of drone positive posture. (d) Drop test of drone vertical posture.
Aerospace 08 00387 g007
Figure 8. (a) Battery full-size model. (b) Battery simplified model. (c) Simplified model-1.
Aerospace 08 00387 g008
Figure 9. (a) Motor full-size model. (b) Motor simplified model. (c) Simplified model-2.
Aerospace 08 00387 g009
Figure 10. (a) Camera full-size model. (b) Camera simplified model. (c) Simplified model-3.
Aerospace 08 00387 g010
Figure 11. (a) Circuit board full-size model. (b) Circuit board simplified model. (c) Simplified model-4.
Aerospace 08 00387 g011
Figure 12. (a) Full-size model of front arm. (b) Full-size model of rear arm. (c) Simplified model-5 arm model. (d) Simplified model-6 arm model. (e) Simplified model-5. (f) Simplified model-6.
Aerospace 08 00387 g012
Figure 13. (a) Comparison of full-size model and simplified model of upper fuselage. (b) Comparison of full-size model and simplified model of lower fuselage. (c) Comparison of full-size model and simplified model of baseplate (d) Comparison of full-size model and simplified model of battery case (e) Simplified model-7.
Aerospace 08 00387 g013
Figure 14. (a) Preventer plate. (b) Pedestal (c) Simplified model-8. (d) Elevation view of support arm. (e) Section view of support arm. (f) Simplified model-9. (g) Front shroud. (h) Simplified model-10.
Aerospace 08 00387 g014
Figure 15. Comparison of impact loads in single simplified model.
Aerospace 08 00387 g015
Figure 16. Comparison of deformation response of some simplified models.
Aerospace 08 00387 g016
Figure 17. Combined simplified model. (a) Model after assembly. (b) Model before assembly.
Aerospace 08 00387 g017
Figure 18. Comparison of deformation response of combined simplified model. (a) Drop test of drone components. (b) Drop-weight test of drone components. (c) Drop test of drone positive posture. (d) Drop test of drone vertical posture.
Aerospace 08 00387 g018
Figure 19. Peak load and error of combined simplified model. (a) Drop test of drone components. (b) Drop-weight test of drone components. (c) Drop test of drone positive posture. (d) Drop test of drone vertical posture.
Aerospace 08 00387 g019
Figure 20. Comparison of stress distribution between the simplified model and the full-scale model at the typical time of the complete machine positive posture drop test. (a) 2 × 10⁻³ s time. (b) 5 × 10⁻³ s time. (c) 8 × 10⁻³ s time.
Aerospace 08 00387 g020
Figure 21. Comparison of stress distribution between the simplified model and the full-scale model at the typical time of the complete machine vertical posture drop test. (a) 4 × 10⁻³ s time. (b) 11 × 10−3 s time.
Aerospace 08 00387 g021
Table 1. Corresponding element type of each component.
ComponentElement TypeIntegration Algorithm
BatteryHexahedron solidFully integrated S/R solid (ELFORM = 2)
MotorHexahedron solidFully integrated S/R solid (ELFORM = 2)
BoltBeamHughes-Liu (ELFORM = 1)
SpringDiscrete-
Thin-walled partShellBelytschko-Tsay (ELFORM = 2)
Rotating jointRevolute joint-
Table 2. Johnson-Cook constitutive model material parameters.
Material TypeDensity
(kg/m3)
Elastic Modulus (GPa)A
(MPa)
B
(MPa)
Cmn
Polycarbonate1197.82.5980750.0520.5482
Magnesium alloy17304.51003800.041.040.28
Aluminum alloy 60612700672402000.00520.2
Table 3. Material parameters of nylon.
Density (kg/m3)Elastic Modulus (MPa)Poisson’s RatioYield Stress (MPa)
1350620000.3700
Table 4. Mechanical properties of the battery.
Density
(kg/m3)
Elastic Modulus (MPa)Poisson’s Ratio
17505000.01
Table 5. G-10 glass fiber-epoxy composite laminate material parameters.
Density
(kg/m3)
Elastic Modulus (GPa)Compressive Strength (MPa)Tensile Strength (MPa)Shear Modulus (MPa)Shear Strength (MPa)Poisson’s Ratio
XYXYXYXYXZ/YZ
185018.8319.263653002333108.2751520.1360.118
Table 6. Statistics of Experiment and Simulation results.
Drop Test TypeExperiment Peak Load (KN)Simulation Peak Load (KN)D-Value (KN)Error
Drop test of drone components2.151.990.167.5%
Drop-weight test of drone components11.411.150.252.2%
Drop test of drone positive posture3.092.850.247.7%
Drop test of drone vertical posture5.745.480.264.5%
Table 7. The comparison of the total weights.
ModelWeightModelWeight
Real drone907 gSimplified model-6907 g
Full-size high-precision model907 gSimplified model-7907 g
Simplified model-1907 gSimplified model-8907 g
Simplified model-2907 gSimplified model-9907 g
Simplified model-3907 gSimplified model-10907 g
Simplified model-4907 gCombined simplified model907 g
Simplified model-5907 g
Table 8. Simplified conditions and simplified modes.
StructureBatteryMotorCamera GimbalCircuit BoardArmFuselage CaseImpact/Damaged Parts
Properties
and Modes
PropertiesCentralized mass
Vulnerable parts
Elasticity
Rigidity
Thin-walled parts
Solid parts
Anisotropy
Isotropic
Simplified modeMaterial model
Normal thickness
Appearance characteristic
Element type
Combined modeling
Note: ▲—Components Characteristics; ●—Main simplified method; ◎—Secondary simplified method.
Table 9. Simplified high-precision peak load model error standard.
Model ErrorDrop Test of Drone ComponentsDrop-Weight Test of Drone ComponentsDrop Test of Drone Positive PostureDrop Test of Drone Vertical Posture
Full-size high-precision model error (A)7.5%2.2%7.7%4.5%
Simplified high-precision model error (1.5A)11.25%3.3%11.55%6.75%
Table 10. Peak load and error of single simplified model.
ErrorS-1S-2S-3S-4S-5S-6S-7S-8S-9S-10
Peak load (KN)2.922.862.823.152.382.882.833.633.704.61
error6.0%7.4%8.7%1.95%22.9%6.8%7.7%17%19.7%19.7%
Δ A0.78A0.96A1.13A0.25A2.97A0.88A1.09A2.2A2.5A4.4A
Table 11. Peak load and error of combined simplified model.
Drop Test TypeExperiment Peak Load (KN)Full-Size Model Peak Load (KN)Simplified Model Peak Load (KN)D-Value (KN)Error Δ
Drop test of drone components2.151.991.970.188.4%1.12A
Drop-weight test of drone components11.411.1511.720.322.8%1.27A
Drop test of drone positive posture3.092.852.820.278.7%1.13A
Drop test of drone vertical posture5.745.485.400.345.9%1.3A
Table 12. Comparison of calculation scale and solution time of different models.
Calculation ScaleSolution Time
Full-size high-precision modelComponent modelDrop text of drone components68,221126 min
Drop-weight text of drone components68,221147 min
Complete modelDrop text of drone positive posture141,878290 min
Drop text of drone vertical posture141,878294 min
Single simplified high-precision modelSimplified model-1104,924236 min
Simplified model-2138,678263 min
Simplified model-3139,145255 min
Simplified model-4139,314246 min
Simplified model-6139,209256 min
Simplified model-7122,954219 min
Combined simplified high-precision modelComponent modelDrop text of drone components55,48591 min
Drop-weight text of drone components55,48585 min
Complete modelDrop text of drone positive posture87,688182 min
Drop text of drone vertical posture87,688175 min
Publisher’s Note: MDPI stays neutral with regard to jurisdictional claims in published maps and institutional affiliations.

