Article

Mutual Aerodynamic Interference Mechanism Analysis of an “X” Configuration Quadcopter

School of Aerospace Engineering, Beijing Institute of Technology, Beijing 100086, China
*
Author to whom correspondence should be addressed.
Aerospace 2021, 8(11), 349; https://doi.org/10.3390/aerospace8110349
Submission received: 6 October 2021 / Revised: 10 November 2021 / Accepted: 11 November 2021 / Published: 16 November 2021
(This article belongs to the Collection Unmanned Aerial Systems)

Abstract

:
This paper studies the quadcopter’s mutual interference phenomenon. The flow field of the quadcopter at different flight speeds is simulated by solving the three-dimensional unsteady Reynolds averaged Navier-Stokes equations with sliding mesh methods. “Virtual Modes” (VMs) are introduced to examine the mechanisms of aerodynamic interference among the quadcopter’s components (front rotors, rear rotors, and fuselage). By comparing the aerodynamic forces of different VMs, this work shows that mutual interference to the front rotors can be negligible, interference to the rear rotors is due to the wake of front rotors and fuselage, and mutual interference to fuselage is caused by front and rear rotors. Only the rear rotors’ thrust and pitch moment as well as the lift of the fuselage are significant. At the flight speed of 5–15 m/s, the mutual interference causes 11% loss of thrust and 35% loss of pitching moment to the rear rotors; In the cases of hovering and 25 m/s forward flight, the interference is negligible.

Graphical Abstract

1. Introduction

Quadcopters have been widely used in civil and military applications [1]. These share a need to fly at high speed in scenarios such as cargo transport, emergency rescue, etc., therefore, the aerodynamic performance of quadcopters needs to be carefully considered. Previous studies of quadcopters aimed to establish aerodynamic models for flight controller design, and the aerodynamics of rotors are usually simplified as a thrust force and a torque for hovering and low speed flight [2,3].
Brooks et al. [2] performed a literature review of quadcopter models, showing that none of these models take into account the variations of the rotors’ aerodynamics in response to flight speed changes. Waqas et al. [4] and Shastry [5] derived a rotor aerodynamic model based on blade element momentum theory. Theys et al. [6] pointed out that the aerodynamic forces acting on a rotor become more complicated as the flight speed increases. Yao et al. [7] analyzed the aerodynamic characteristics of a small quadcopter in horizontal airflow. The interference of horizontal airflow played an important role in the performance. Amir et al. [8] and Ye et al. [9] performed wind tunnel experiments to study the rotors at different flow angles and showed that the rotors’ thrust changes significantly in the forward flight, besides, additional pitch and roll moments are generated by the rotors. Jérémie et al. [10] proposed a simple aerodynamic model suitable for the design of the controller as supported by wind tunnel tests. Brooks et al. [11] took the quadcopter as a whole entity to establish a dynamic model suitable for low-speed flight, based on wind tunnel experiments. It is noted that the models described in previous studies could achieve a high level of accuracy, nevertheless, the aerodynamics of individual components are not included in these models. To obtain further insight into the aerodynamics model of quadcopters, it is necessary to consider the aerodynamics of individual parts and the interferences between these parts. The interactions among rotors and the fuselage cause a complex flow field. In addition, rotors are operated in tilted flow in forward flight, making the flow field even more complicated [12]. Je et al. [13] simulated the quadcopter in hovering and forward flight states. Their results showed that the disturbance of the rotors is insignificant in the hovering condition, but the downwash airflow of the front rotors has a prominent influence on the lift of the rear rotor in forward flight. Misiorowski [14] performed more detailed simulations to study the aerodynamic interference between the four rotors in the forward flight condition,. Devin et al. [15] used a flow method to study the aerodynamic interactions among the four rotors and their impact on the performance.
To obtain a more comprehensive understanding of the aerodynamic interference of quadcopters, “Virtual Mode” method with different virtual combination configurations like “front rotors and fuselage” are utilized to analyze the mechanisms of aerodynamic interference of the quadcopter. Moreover, mechanisms at different speeds are emphasized in this work.
The structure of this paper is organized as follows: Section 2 introduces the method used in the interference analysis of the quadcopter; Section 3 analyzes the mechanisms of aerodynamic interference of the quadcopter at different speeds; Section 4 discusses the impact of interference on the aerodynamic performance of the rotors and fuselage; Conclusions are given in Section 5.

2. Analysis Methods

2.1. Model Simplification

This paper focuses on analyzing the interference among the components of an “X” configuration quadcopter, and for this a simplified model is adopted, as shown in Figure 1. The study employs commercial rotors (T-motor MF2009 [16]), from which the geometry is obtained through a three-dimensional scanner, as shown in Figure 2. The shape of the fuselage is obtained from a in house developed quadcopter.

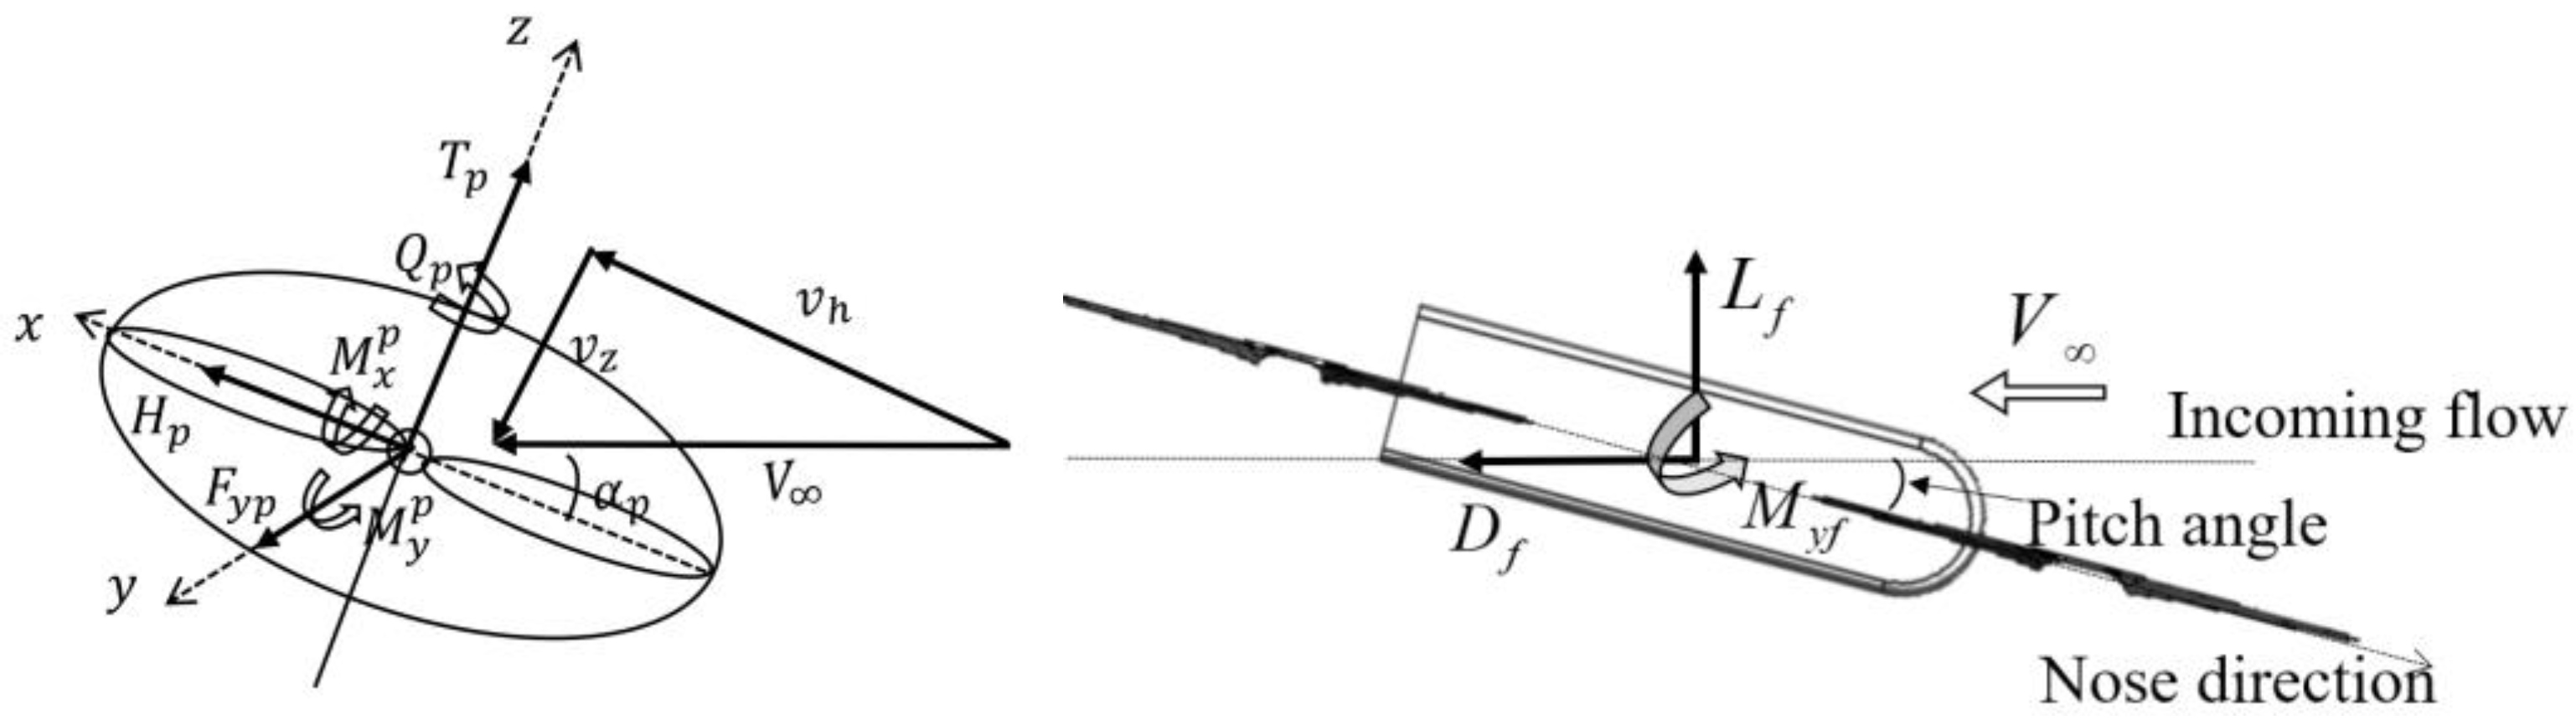
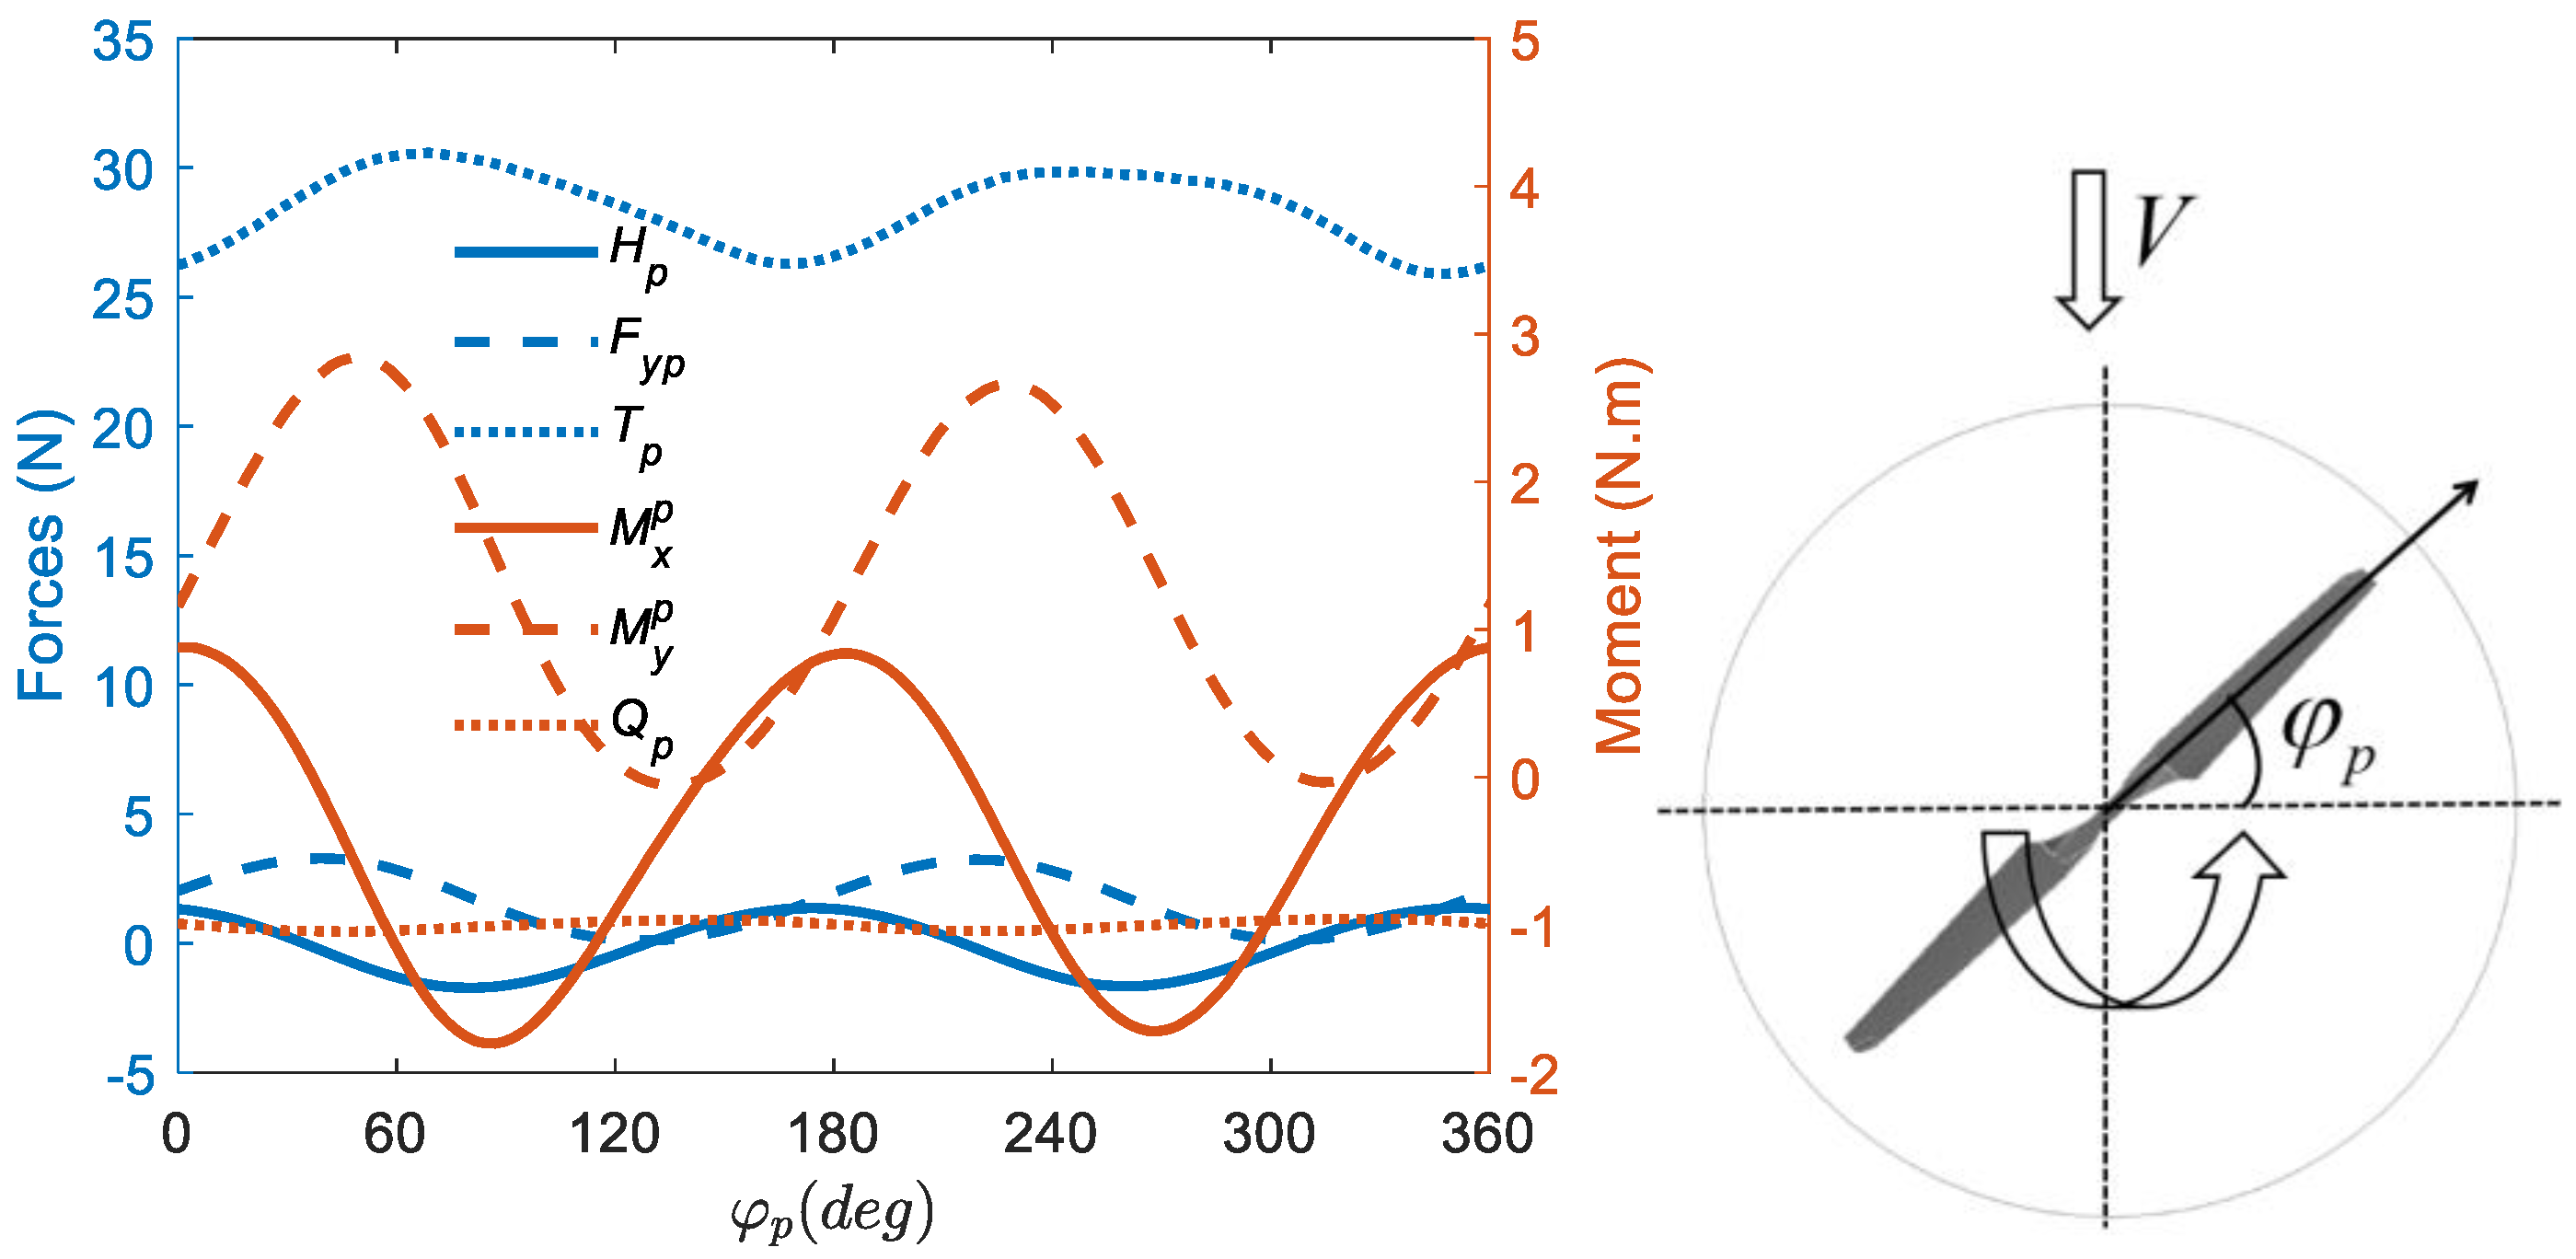
2.2. Definition of Nondimensionlized Aerodyamic Forces

The forces act on the rotor and fuselage is shown in Figure 3. The rotor produced thrust ( T p ), torque ( Q p ), hub force ( H p ), sidereal force ( F y p ), pitch moment ( M y p ), and roll moment ( M x p ). The fuselage produce lift ( L f ), drag ( D f ), and pitch moment ( M y f ), pitch angle is the angle between the direction of the nose and the direction of the incoming flow, the pitch angle is negative when the nose direction is downward.
The coefficients are defined as follows:
C T = T p ρ ω 2 R 4
C H = H p ρ ω 2 R 4
C Q = Q p ρ ω 2 R 5
m y = M y p ρ ω 2 R 5
m x = M x p ρ ω 2 R 5
c d = D f 1 2 ρ V 2 S r e f
c l = L f 1 2 ρ V 2 S r e f
c m = M y f 1 2 ρ V 2 S r e f
in which, the ρ is the air density, ω is the rotor’s rotation speed, R is the rotor’s radius, V is the incoming flow speed, S r e f is the reference area.

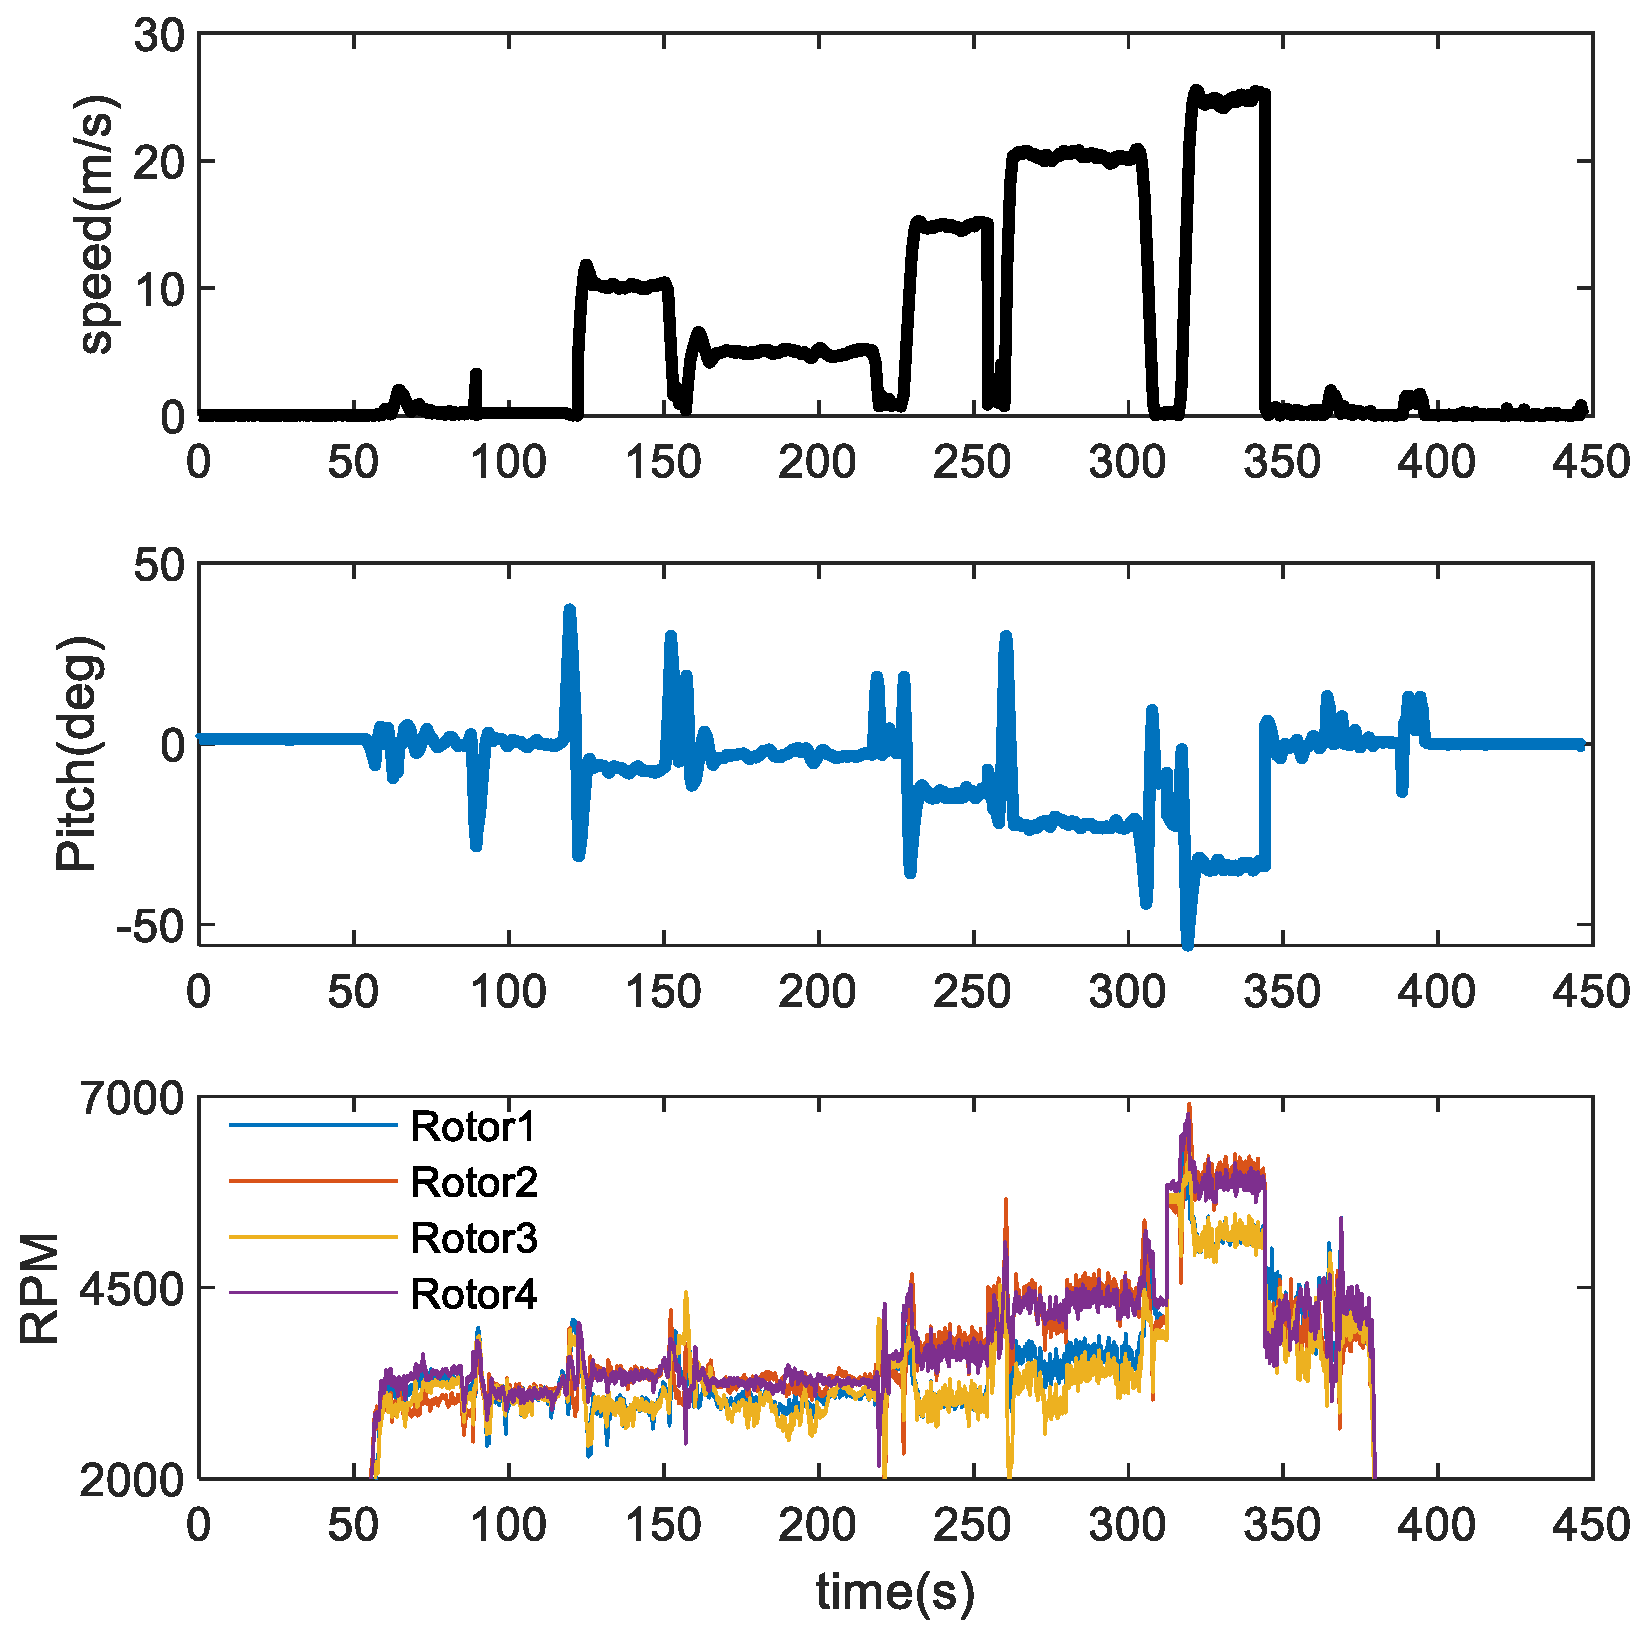
2.3. Simulation Conditions

The simulation conditions are shown in Table 1. These parameters are acquired from flying experiments at fixed speeds and altitudes as the average values obtained from flight data, as shown in Figure 4.

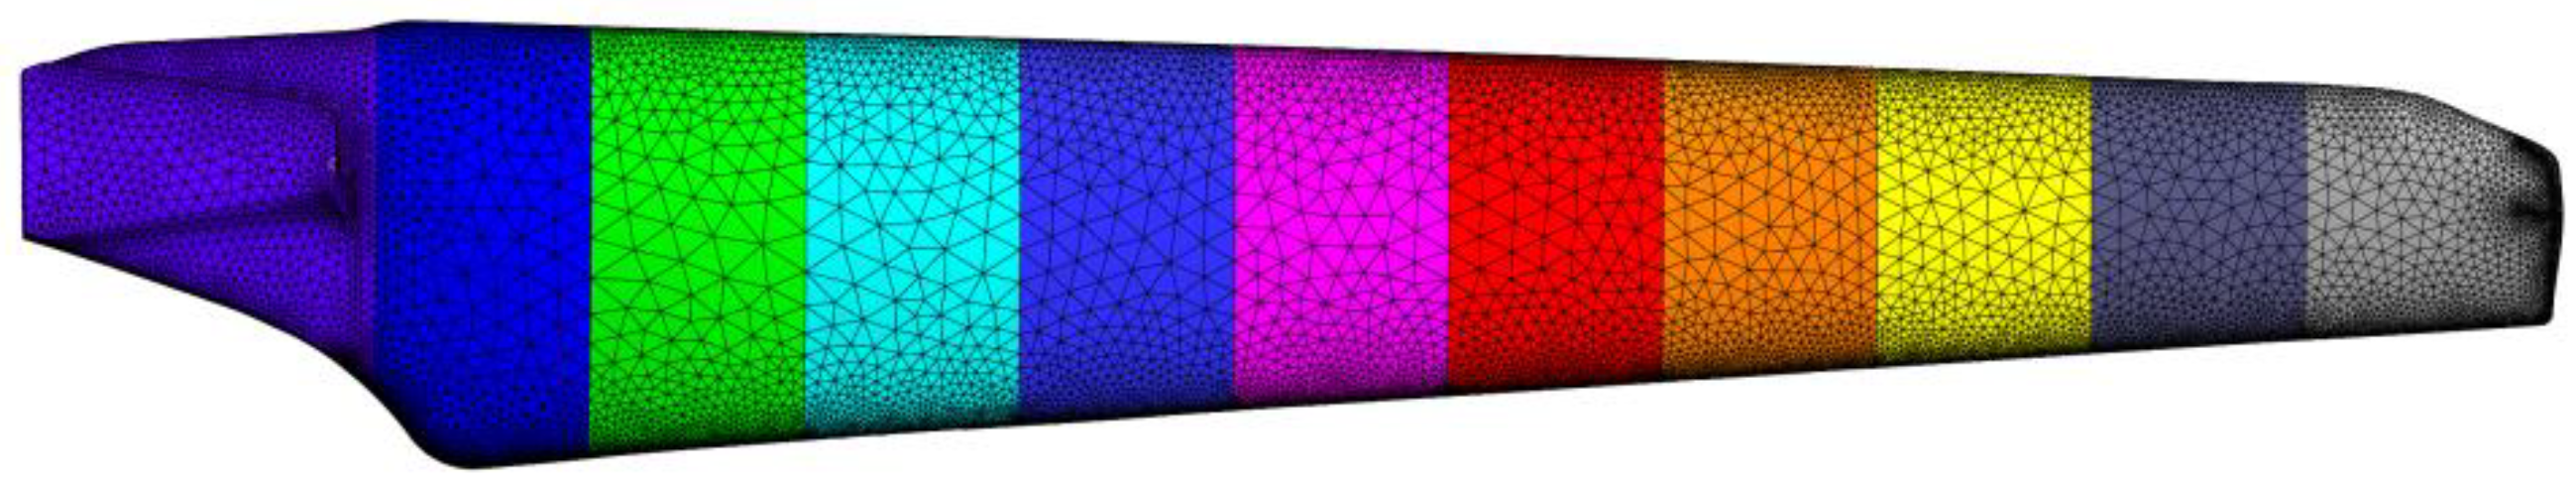
2.4. Computational Fluid Dynamics (CFD) Setup

This study performs transient incompressible RANS simulations to study the aerodynamic interference of the quadcopter with commercial software Fluent. The realizable k - ω SST turbulence model, pressure-based solver, second-order upwind method, and SIMPLE method for pressure-velocity coupling are employed to solve the RANS equations. The sliding mesh technique is utilized to deal with the rotation of the rotor.

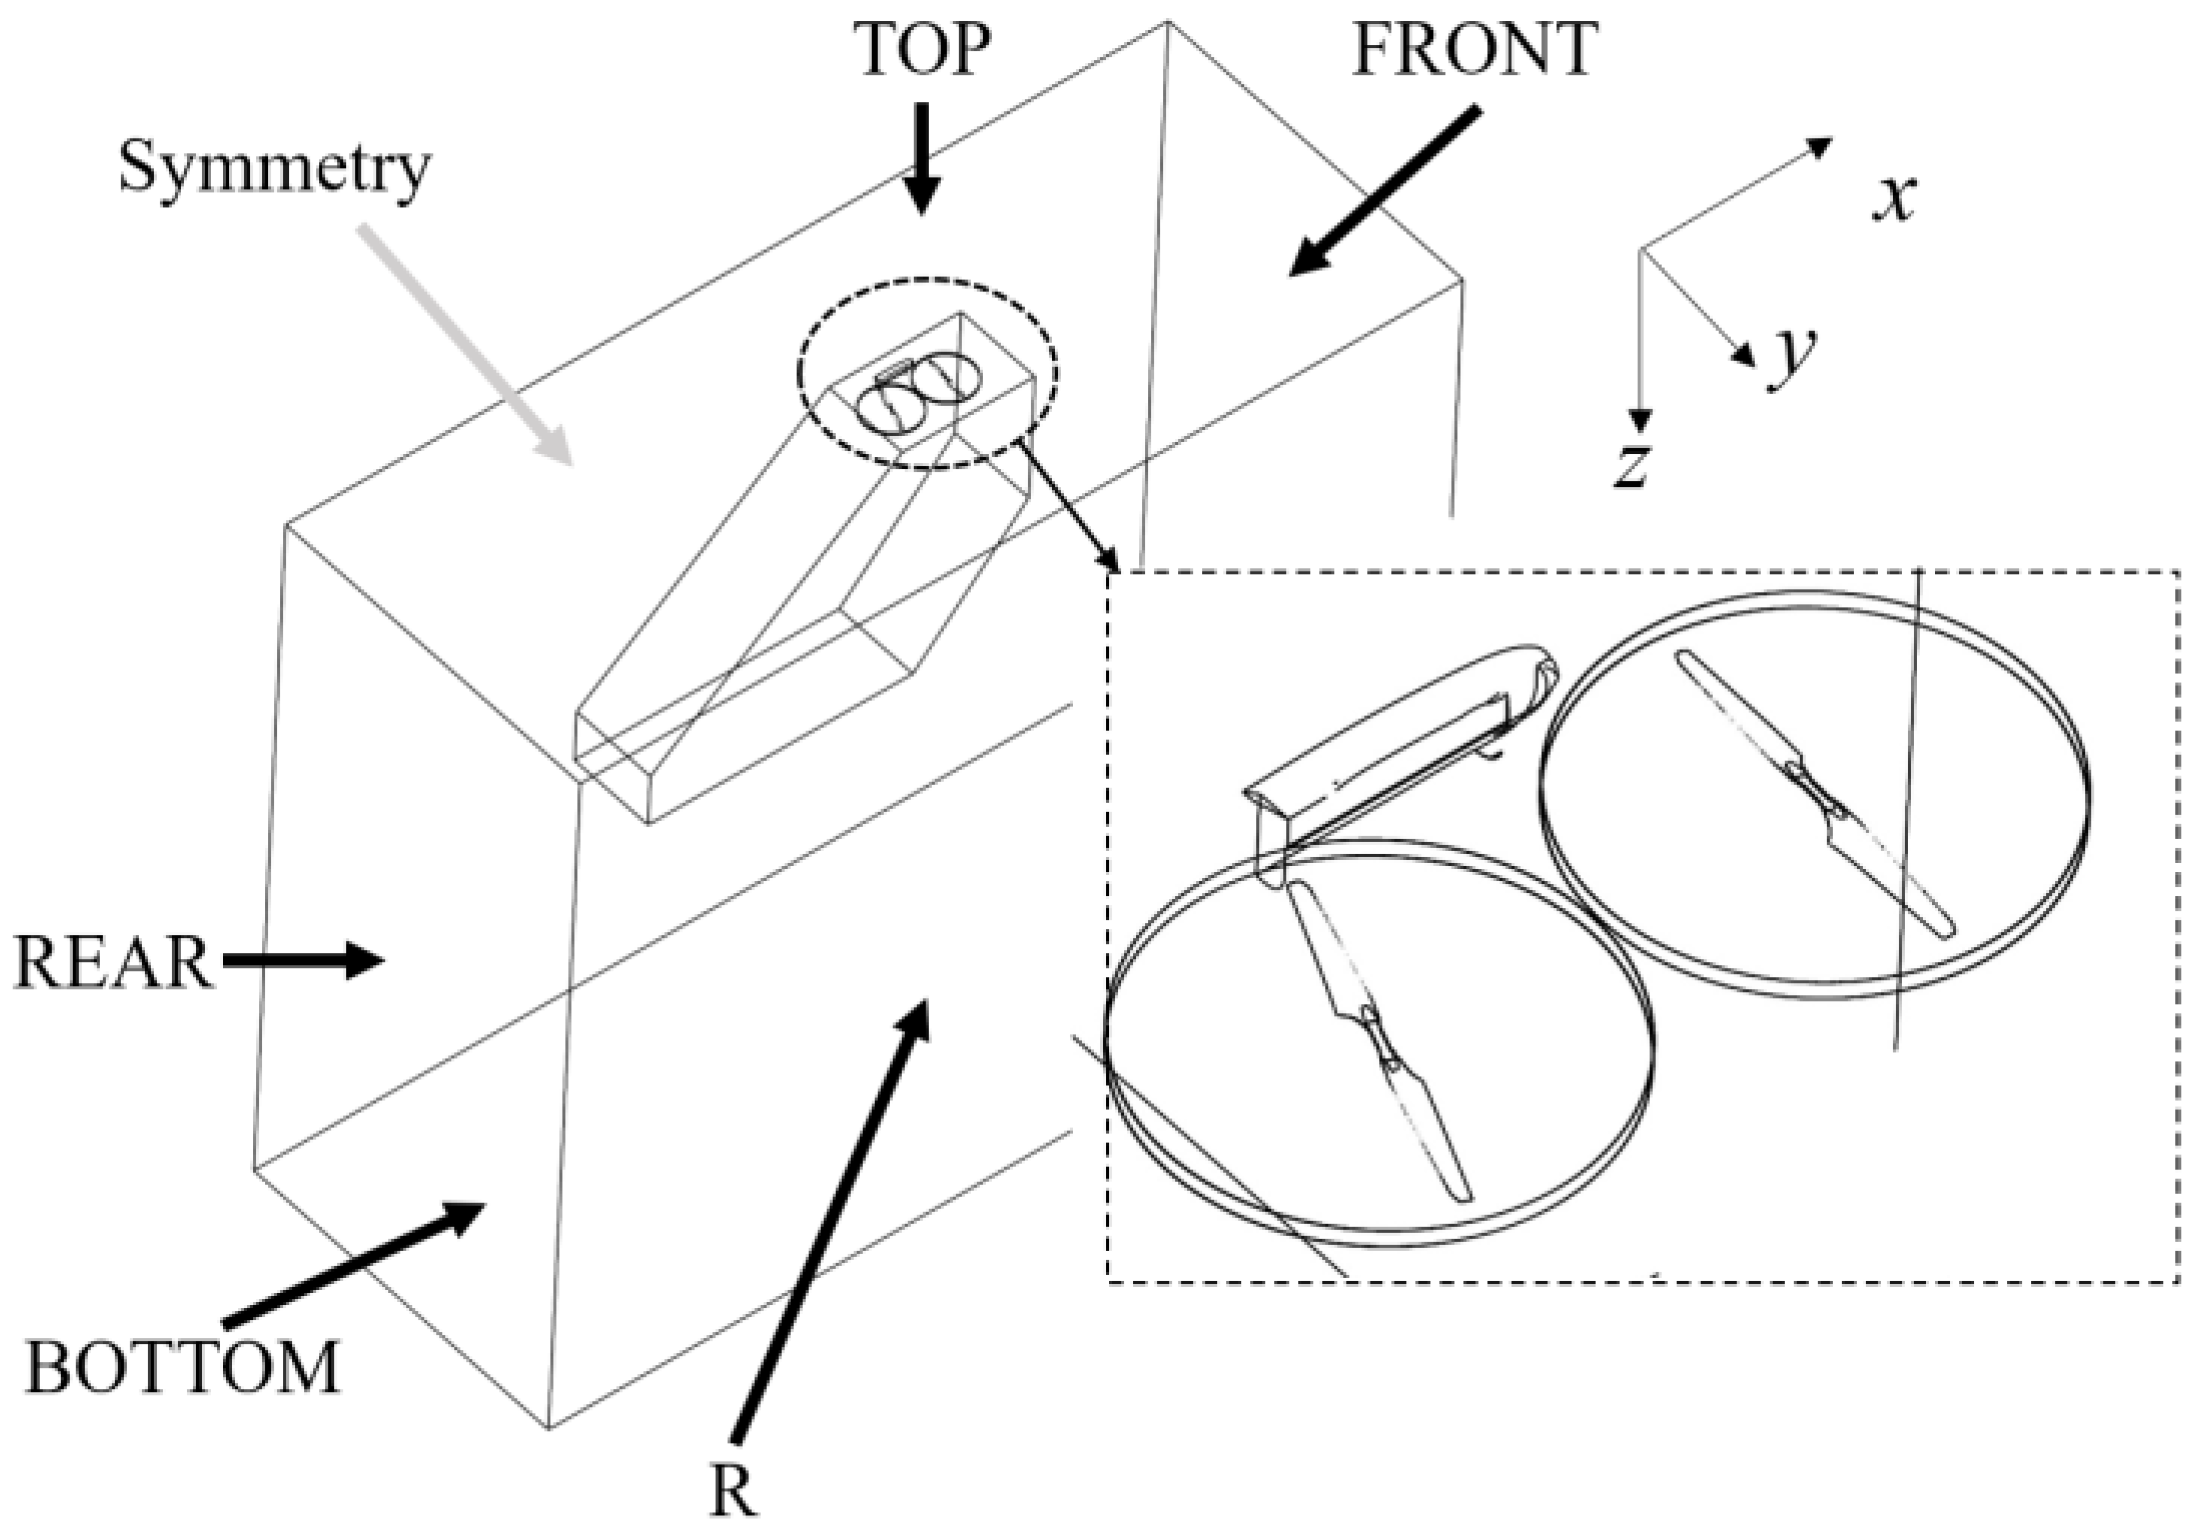
2.4.1. Computational Domain

The geometry of quadcopter is bilaterally symmetrical and the rotating speed of the left rotors is the same as that of the right rotors. Therefore, a half model simplification was made in this work. The computational domain consists of the far-field region, dense region, and two rotation domains, as shown in Figure 5 and Figure 6. The rotation domains encompass the rotor blades, and the dense region is encrypted at the wake of the blade and the fuselage. The interface between the rotating area and the dense area is set as interface boundary, and the mesh on the interface are kept with same size. The interface between the far field area and the dense area is set as the boundary of internal plane. In the far field area, FRONT, TOP, and R are set as the velocity inlets, and BOTTOM and REAR are set as the pressure outlets. The symmetry of the far-field area and the dense area is set to symmetry.

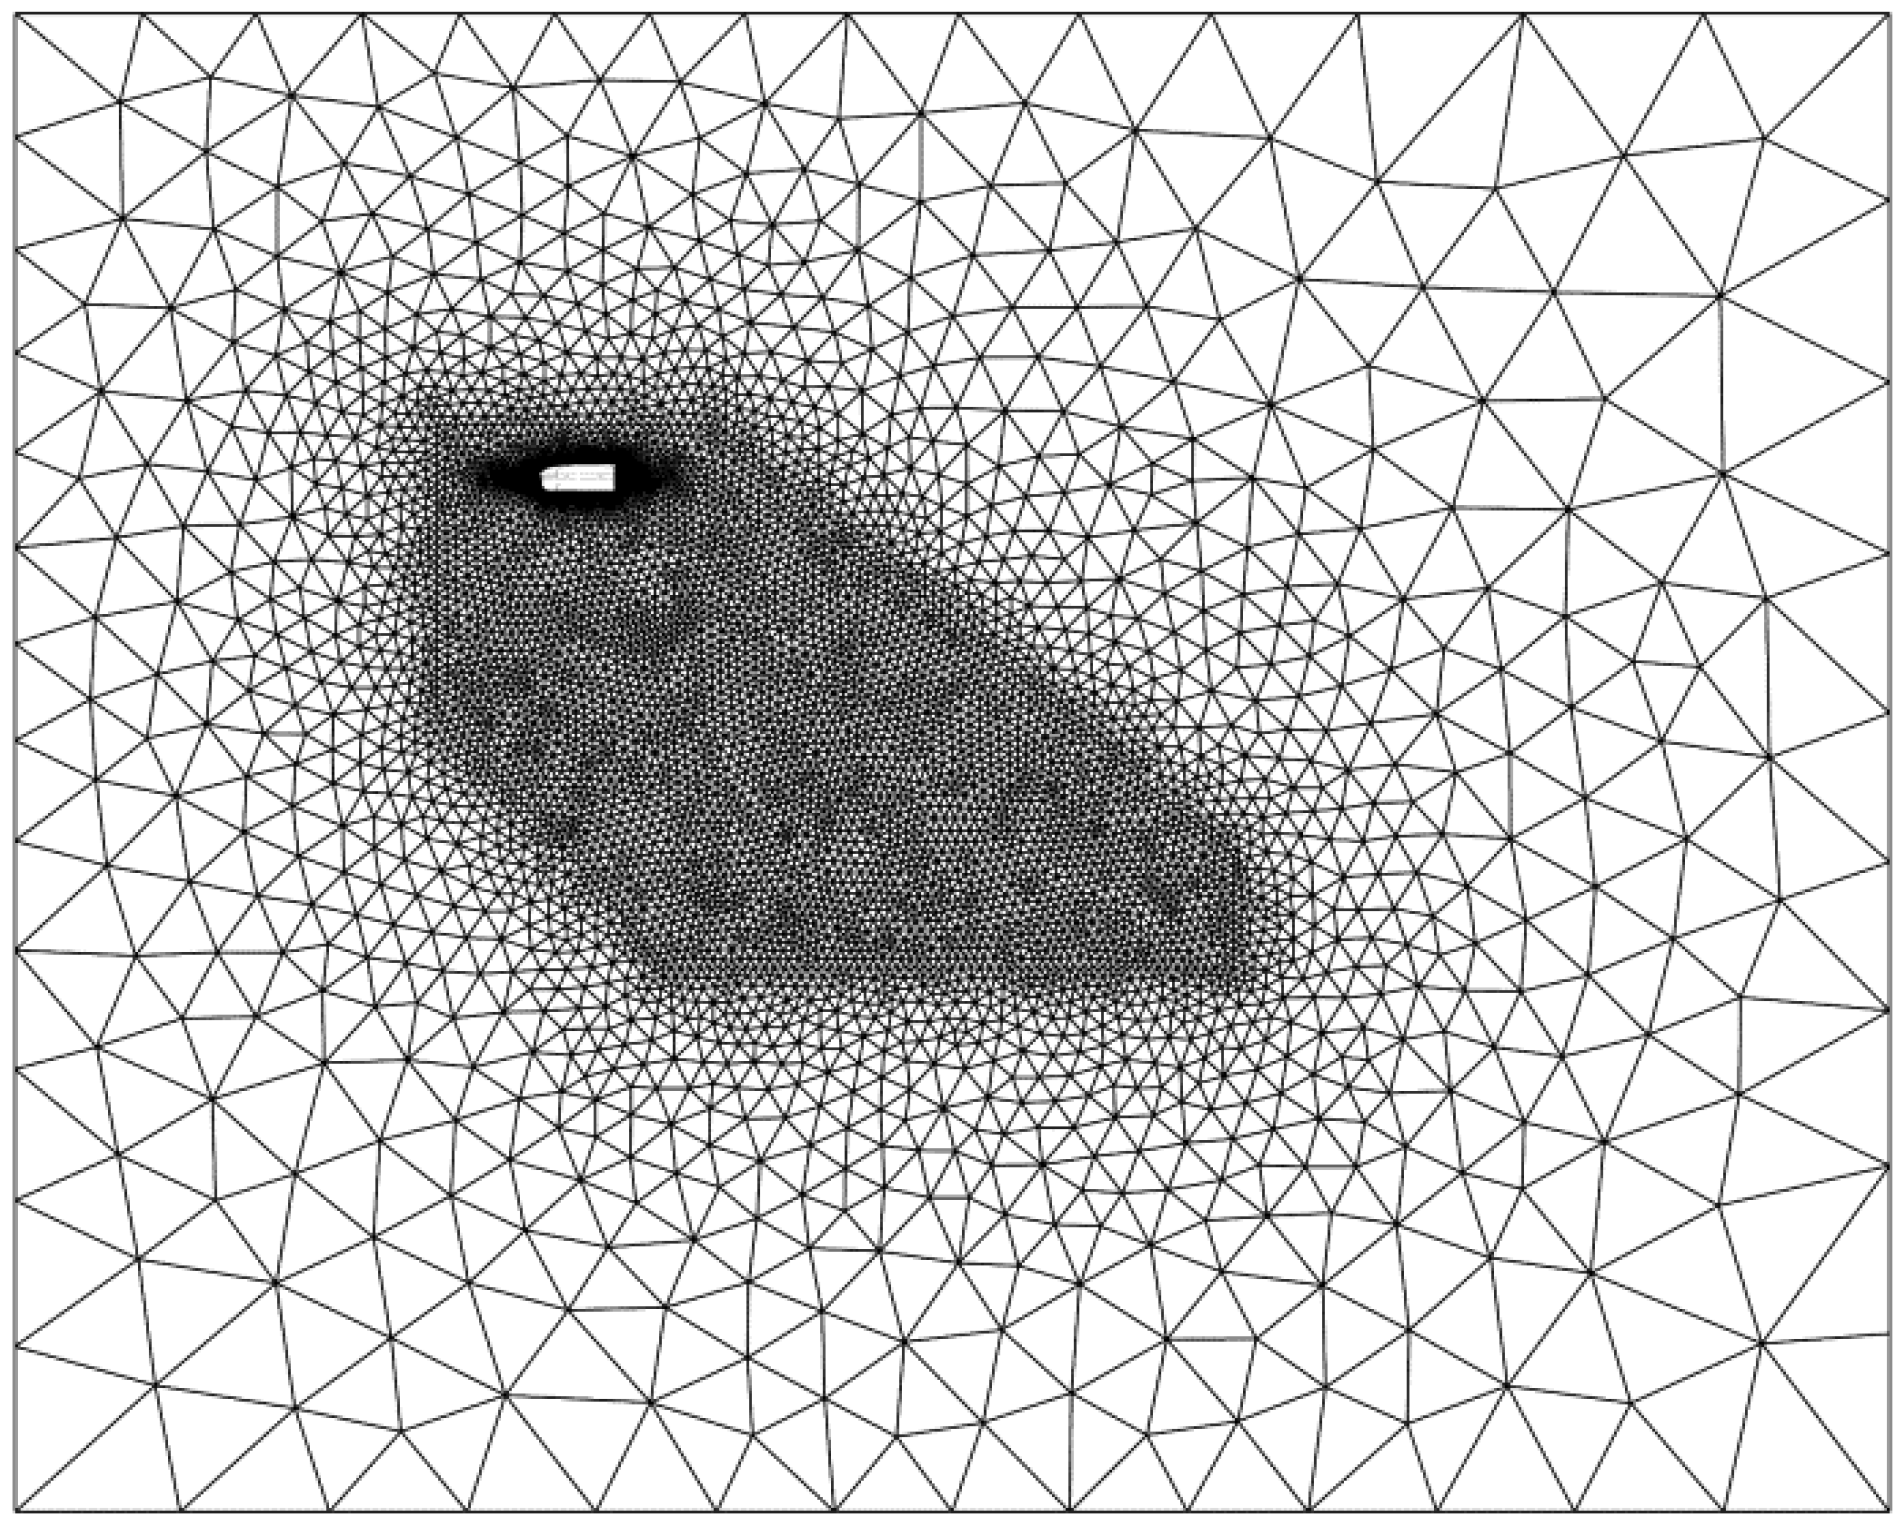
2.4.2. Grid Sensitivity Independence Verification and Time Step Verification

A grid independence study at flight speed of 10 m/s is performed to check the computational domain with different numbers of cells, and a 10 M cells mesh was selected for this study. Table 2 lists the results of the drag coefficient ( c d ) of the fuselage and the rotor’s thrust coefficient ( C T ).
The rotor rotates about 1° for each iteration step in the transient simulation using sliding grids. This simulation is performed for the hovering condition. The iteration steps of 0.5 ° / Δ t , 1 ° / Δ t , and 2 ° / Δ t are tested. The rotor’s thrust coefficient and torque coefficient calculation results are shown in Table 3. The errors of the 0.5 ° / Δ t and 1 ° / Δ t calculation results are within 5%. As a result, the time step of 1 ° / Δ t is selected for the simulations of the whole quadcopter to strike a compromise between accuracy and economy of computing.
As shown in Figure 7, the initial simulation results show that the aerodynamic forces on an individual rotor are periodically unsteady. Time-averaged values of aerodynamics forces are adopted in the following discussion.

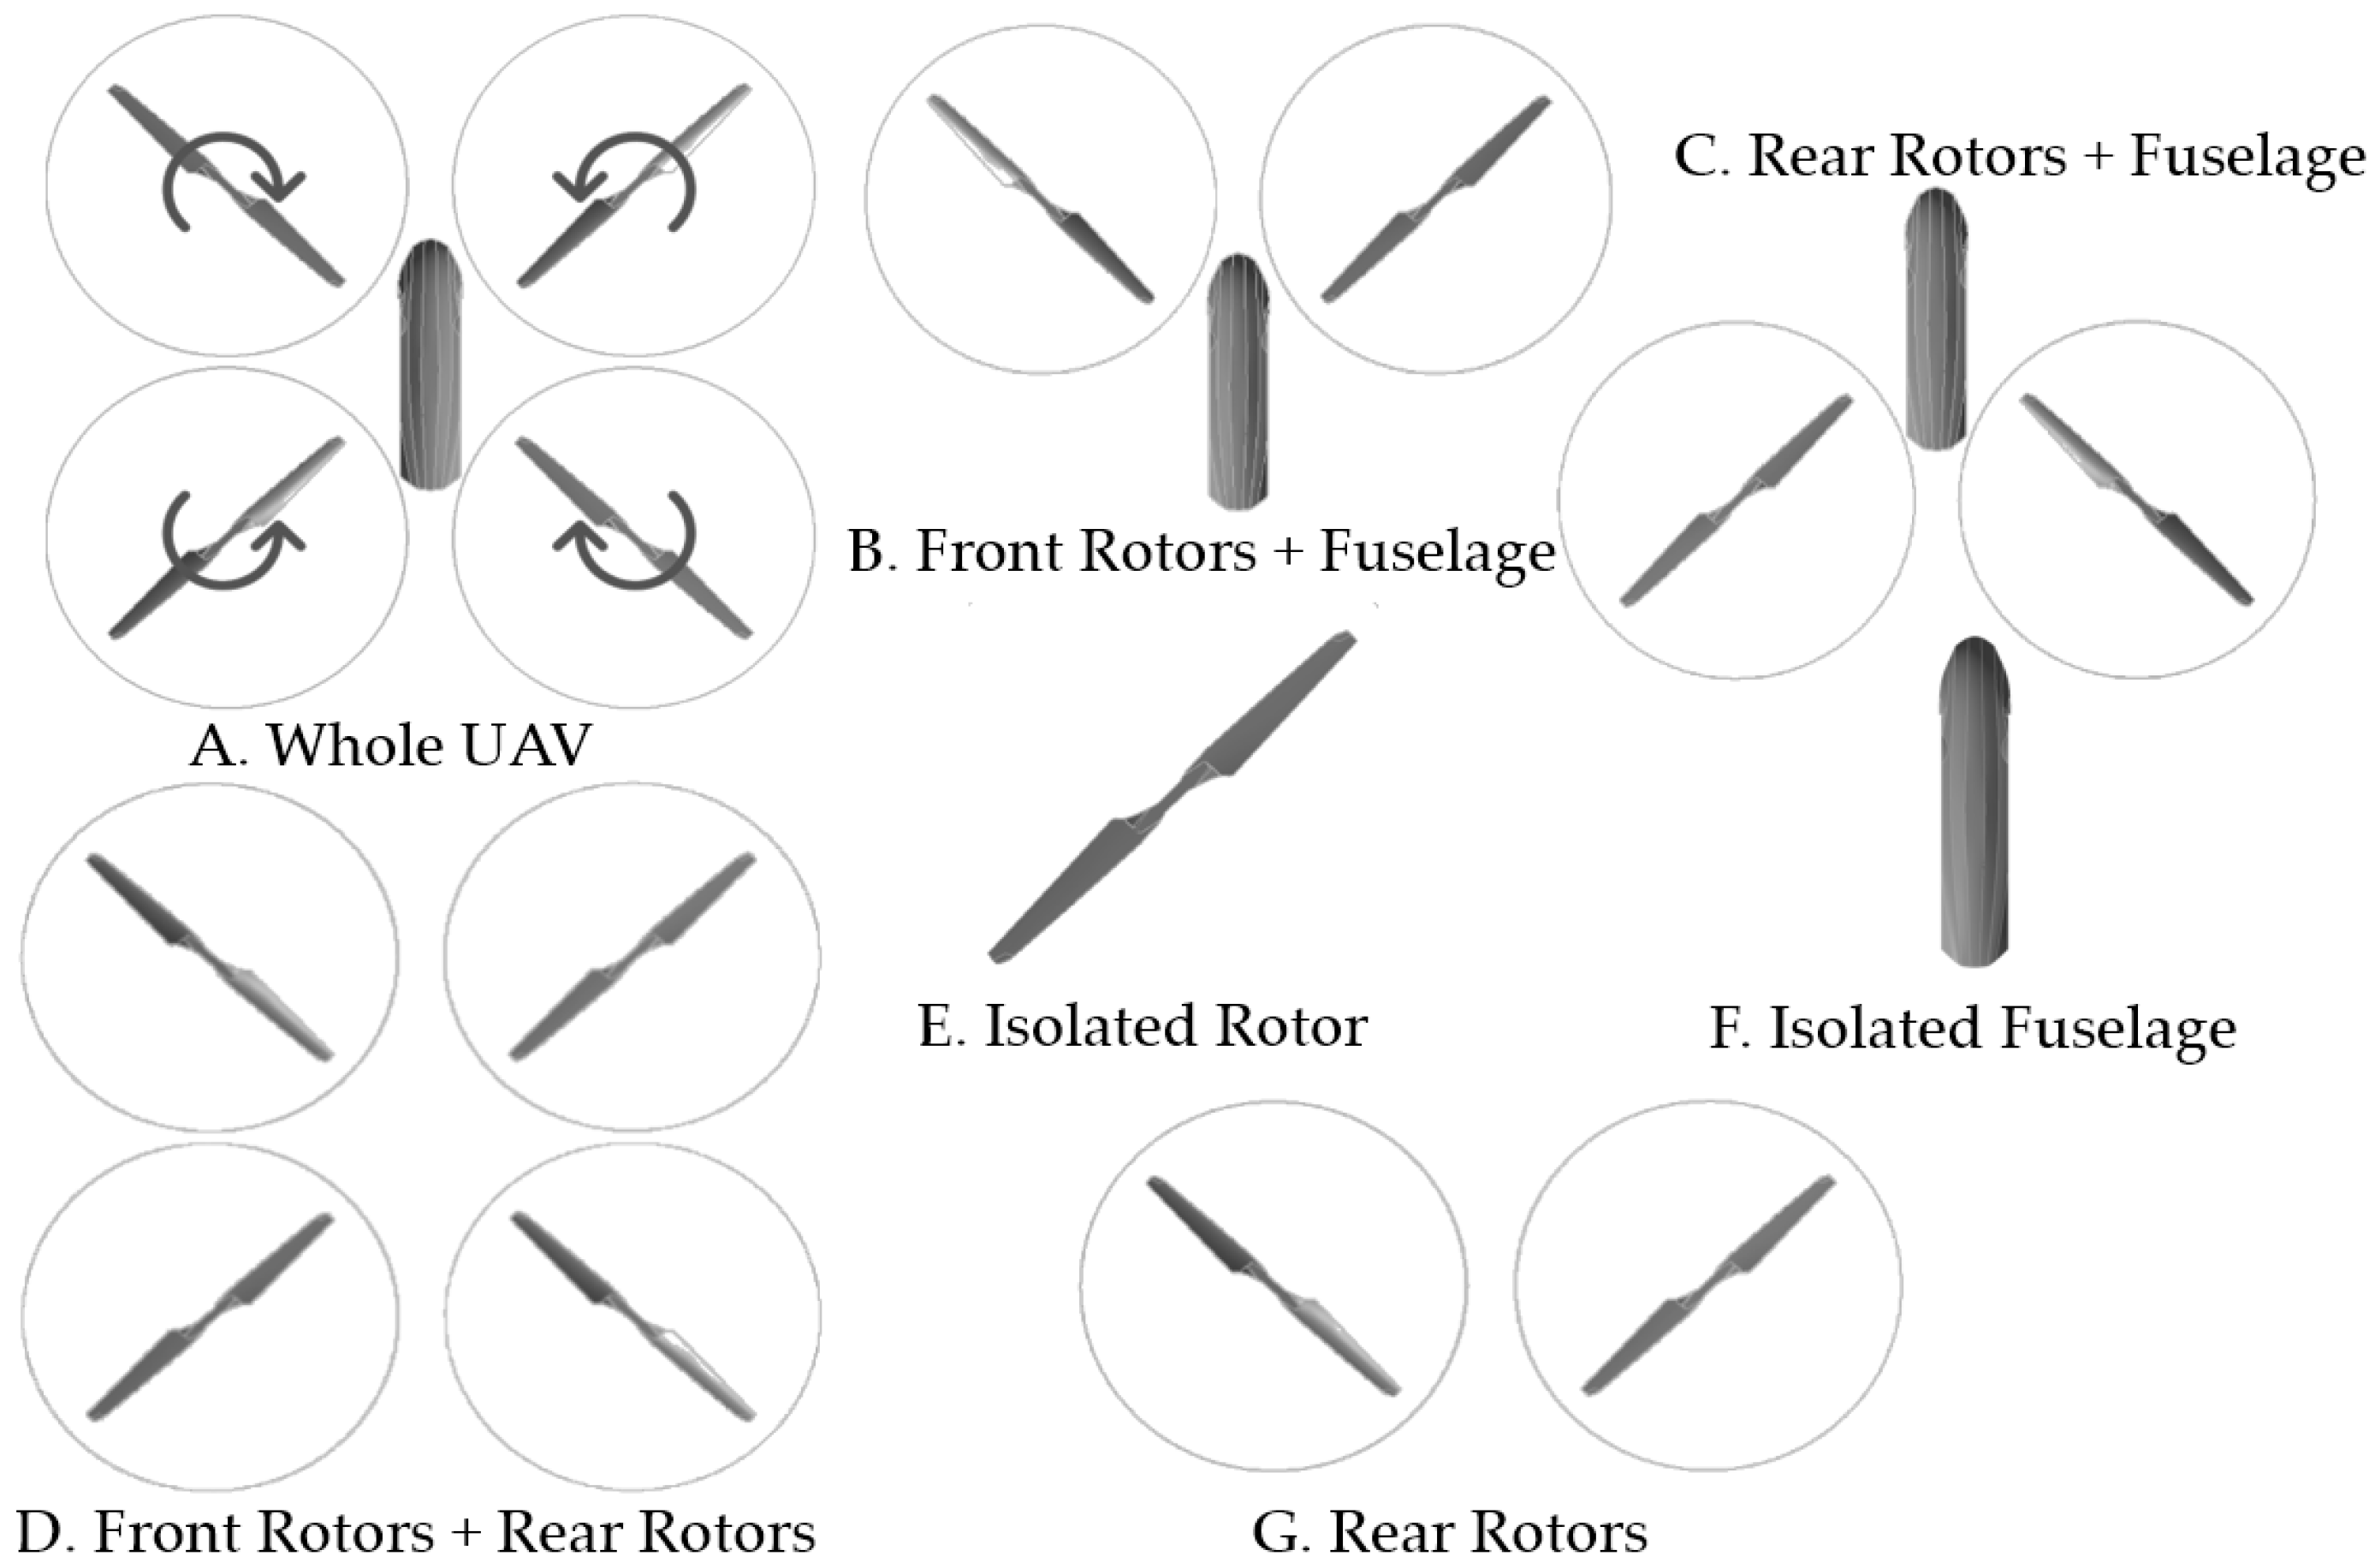
2.5. Virtual Modes Method

To study the aerodynamic interference mechanism of the quadcopter and the impact of interference on the aerodynamic characteristics, this paper applies the principle of superposition to analyze the interference effects and establishes eight cases with different “Virtual Modes” (VMs), as shown in Figure 8. The number of cells for different modes is shown in Table 4.
By comparing the results of different modes, it is possible to analyze the mechanism of aerodynamic interference of the quadcopter. For instance, the proposed “Virtual Modes” method is utilized to analyzes the aerodynamic interference of rear rotors by employing the results of VM-A, B, C, D, and G. This is elaborated with details as follows:
Γ RR FR + F indicates the interference acting on rear rotor due to front rotor and fuselage; Γ RR F indicates the interference to rear rotor caused by fuselage; Γ RR FR indicates the interference to rear rotor caused by front rotor, Γ RR RR indicates the interference to the rear rotor caused by another rear rotor, expressions can be written as:
Γ RR FR + F = VM - A VM - E ,
Γ RR F = VM - C VM - E ,  
Γ RR FR = VM - D VM - E ,  
Γ RR RR = VM - G VM - E .  
To study the interference mechanism of Γ RR FR + F , the flow field of VM-B is analyzed to figure out how to the wake of front rotor and fuselage affect the airflow in the region where the rear rotors are installed. The interference acting on the front rotor and fuselage can be investigated in the same way. This is not elaborated further.

3. Mutual Interaction Mechanism Analysis

To investigate which area of rotor disk are affected, the rotor blades are divided into 11 segments, as shown in Figure 9. The aerodynamic force and moment at each azimuth angle could be recorded. This segmentation of rotor blade enables the study of aerodynamics on a rotor disk plane where the rotor rotates.
The average coefficient of sectional thrust ( d C ¯ T ) and the average coefficient of sectional torque ( d C ¯ Q ) are defined as:
d C ¯ T = d C T d S ,
d C ¯ Q = d C Q d S ,  
where d C T is the thrust coefficient of each section, d C Q is the torque coefficient of each section, and d S is the vertical projected area of each section. Additionally:
Δ d C ¯ T = d C ¯ T W d C ¯ T i Δ d C ¯ Q = d C ¯ Q W d C ¯ Q i
where the superscript i indicates the isolated rotor, and the superscript W indicates the whole quadcopter.
This section discusses the interference mechanisms of the quadcopter in the three typical flight conditions, namely hovering, forward flight at 10 m/s, and forward flight at 25 m/s.

3.1. Hovering Condition

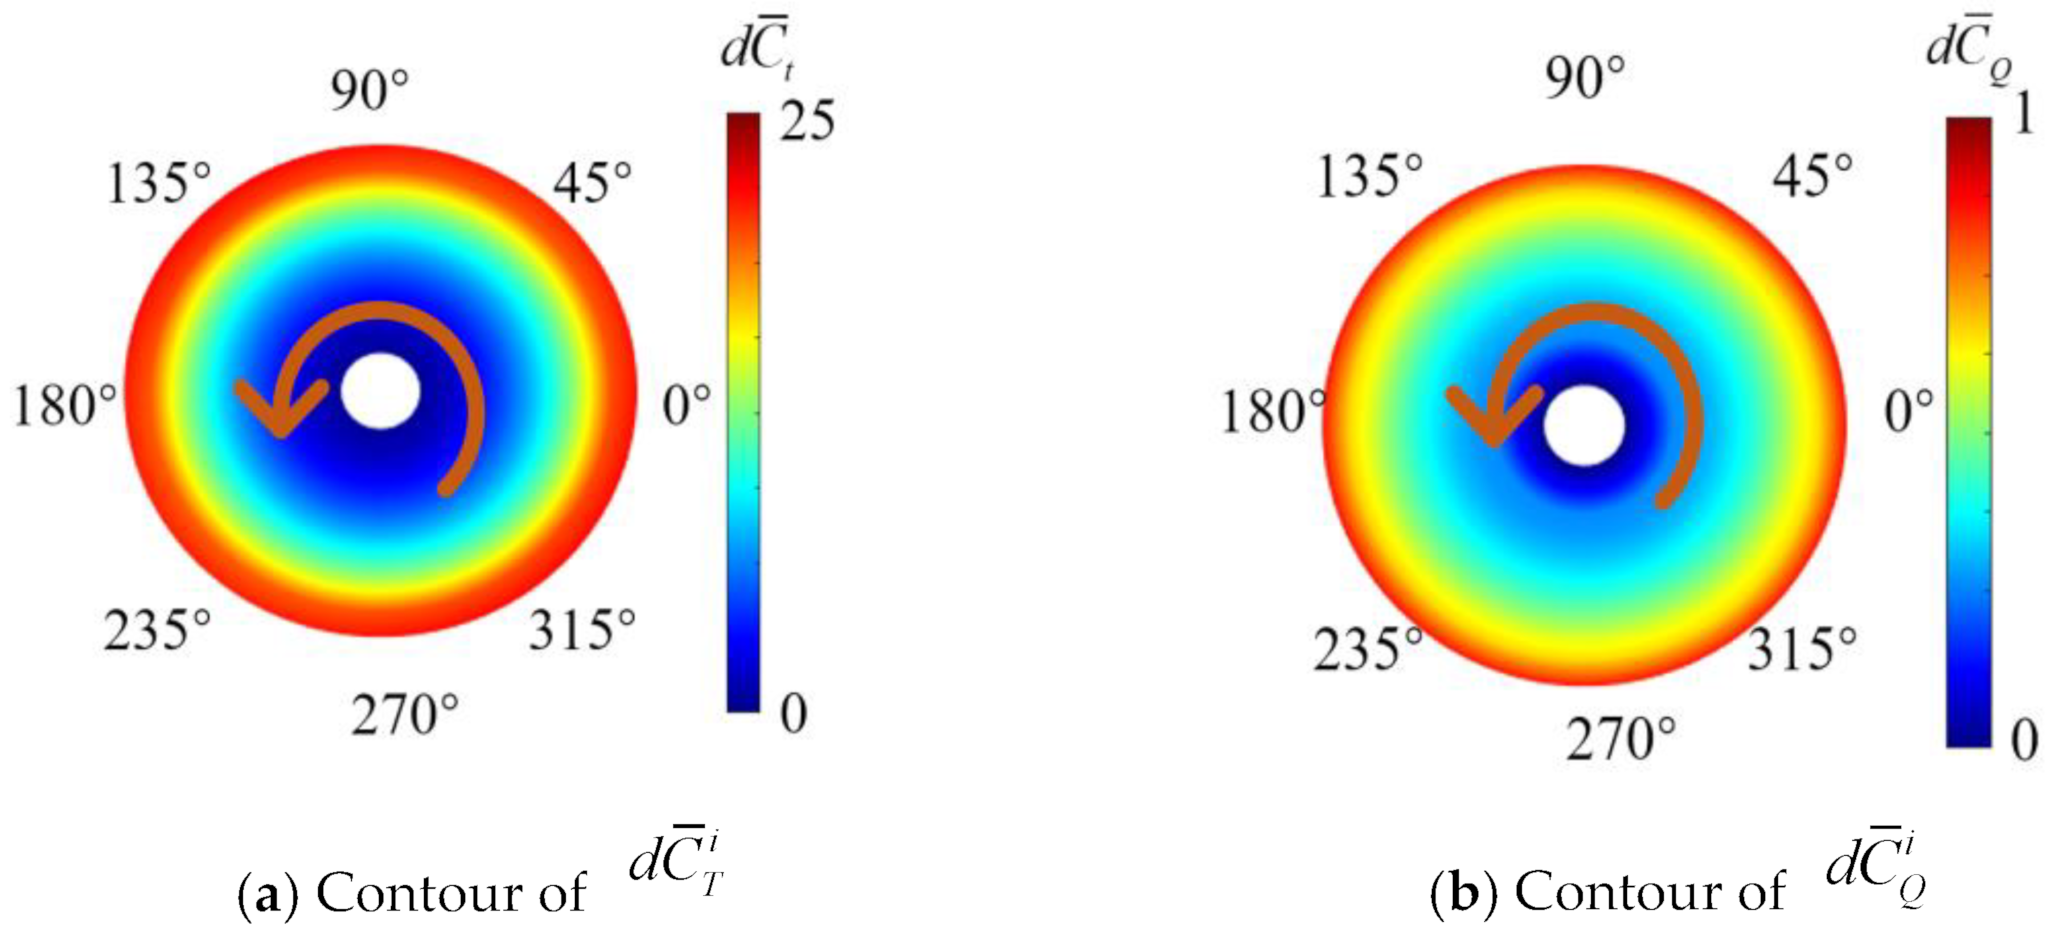
3.1.1. Aerodynamic Characteristics of Isolated Rotor

In the hovering condition, the flow field of the isolated rotor (corresponding to the VM-E) without interference is studied as a reference. Simulation results are presented by highlighting two tip wake vortices and a merged root vortex, as shown in Figure 10.
The contours of d C ¯ T i and d C ¯ Q i are shown in Figure 11. This figure shows that the sectional thrust of the rotor simply increases as its radius increases.

3.1.2. Mutual Interference Mechanism Analysis

In the hovering state, the contours of d C ¯ T W and d C ¯ Q W of the four rotors are shown in Figure 12 (the upper disks represent the front rotors, and the lower disks represent the rear rotors). And contours of Δ d C ¯ T and Δ d C ¯ Q are shown in Figure 13.
It can be seen from Figure 13 that interference mainly exists in the area where the tips of rotors are close to each other. When the rotor rotates, the adjacent blade tip vortex induces the airflow on the outside of the blade to move upward, thereby adding upwash speed at the tip of another blade and resulting in a thrust decrease and a torque increase.

3.2. 10 m/s forward Flight Conditionfigure

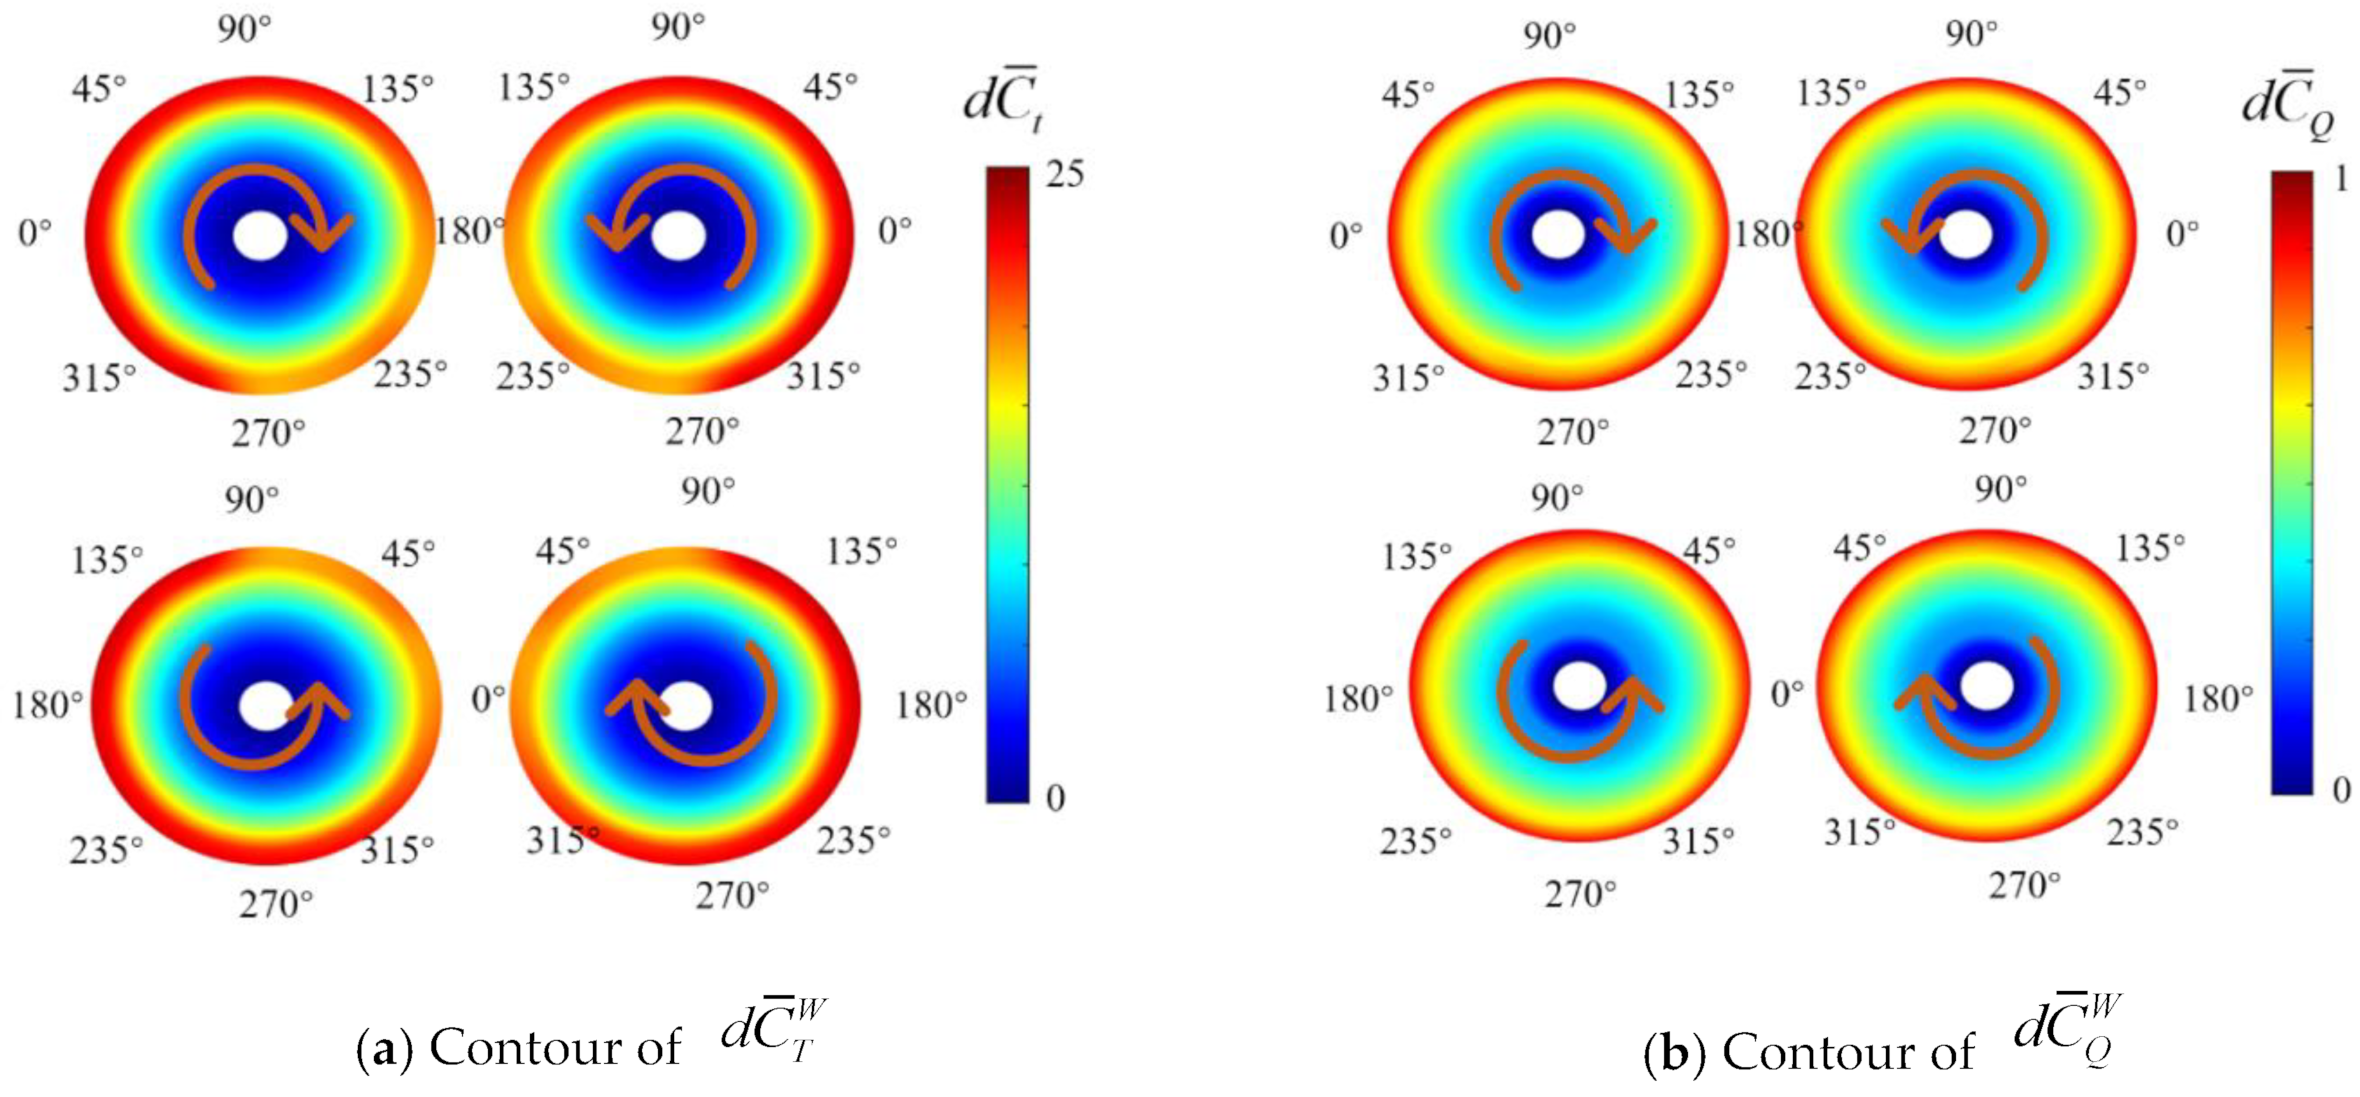
3.2.1. Aerodynamic Characteristics of Isolated Rotor

The flow field around an isolated rotor under the 10 m/s forward flight condition is shown in Figure 14. There are two strong vortices in the downstream of the advancing and the retreating blades. The vortex pertaining to the advancing blade is stronger than that of the retreating one. These two vortices are formed by the superposition of the blade tip vortex. In addition, the downwash speed on one side of the advancing blade is greater than that on the retreating side, and the vortex on the advancing blade side tends to wash down more than that of the retreating side. Between the two tip vortices, there is a root vortex which is generated by the airflow passing through the root of the rotor. In addition, there are blade tip vortex in the flow field, and these wake vortices tends to cause the airflow on the outside of the rotor to wash up.
The wake vortices of the rotor and the relative z-velocity contours (the z-velocity (w) minus the far-field z-velocity ( w ), where the upward direction is represented by positive values) are shown in Figure 15. It shows that the flow field around the rotor differs for different azimuths. The shapes of the two super vortices (i.e., the advancing tip vortex and retreating tip vortex marked in Figure 14) remain unchanged for different azimuth angles. The distance between the disks and the center of the rotor is the same as the distance between two rotors in the quadcopter. The wake of the rotor only causes a small interference on the rear area of disk 1, implying that the rear rotors of the quadcopter cause tiny interferences on the front rotors. Similarly, the interferences of the rotor imposed on disk 2 and disk 3 are small, which indicates that the interferences of the rotor on the left and right disk areas are negligible. This study shows that the wake of the rotor mainly interferes with disk 4, especially in the front area of disk 4. At different azimuth angles, the rotor blade wakes maintain the same interference to the front and left and right flow fields. The interference to most areas of the flow field behind remains unchanged, and only a part of the area close to the rotor blades has slight changes. The interference to most areas of the four disks remains unchanged at the different azimuth angles, and only a part of the area on disk 4 close to the rotor has slight changes. Therefore, an approximation can be made that the interference of the rotor to the surrounding flow field at different azimuth angles is the same, only the interference of disk 4 needs to be considered.
The contours of d C ¯ T i and d C ¯ Q i of the isolated rotor are shown in Figure 16 (the upper disks represent the front rotors, and the lower disks represent the rear rotors). The top figure shows that the sectional thrust is large on the advancing side of the rotor disk, which could be attributed to the high local speed of the blades. The azimuth corresponding to the maximum thrust is about 30° due to the longitudinal change of the induced velocity inflow distribution [17]. Therefore, the rotor tends to generate a sizeable asymmetric lift when the rotor rotates, thereby generating pitch and roll moments. As for the contours of torque in Figure 16b, the maximum value is observed at the azimuth angle of 0° due to the maximum dynamic pressure. On the contrary, the torque is minimal at the retreating side (when the azimuth angle is 180°).

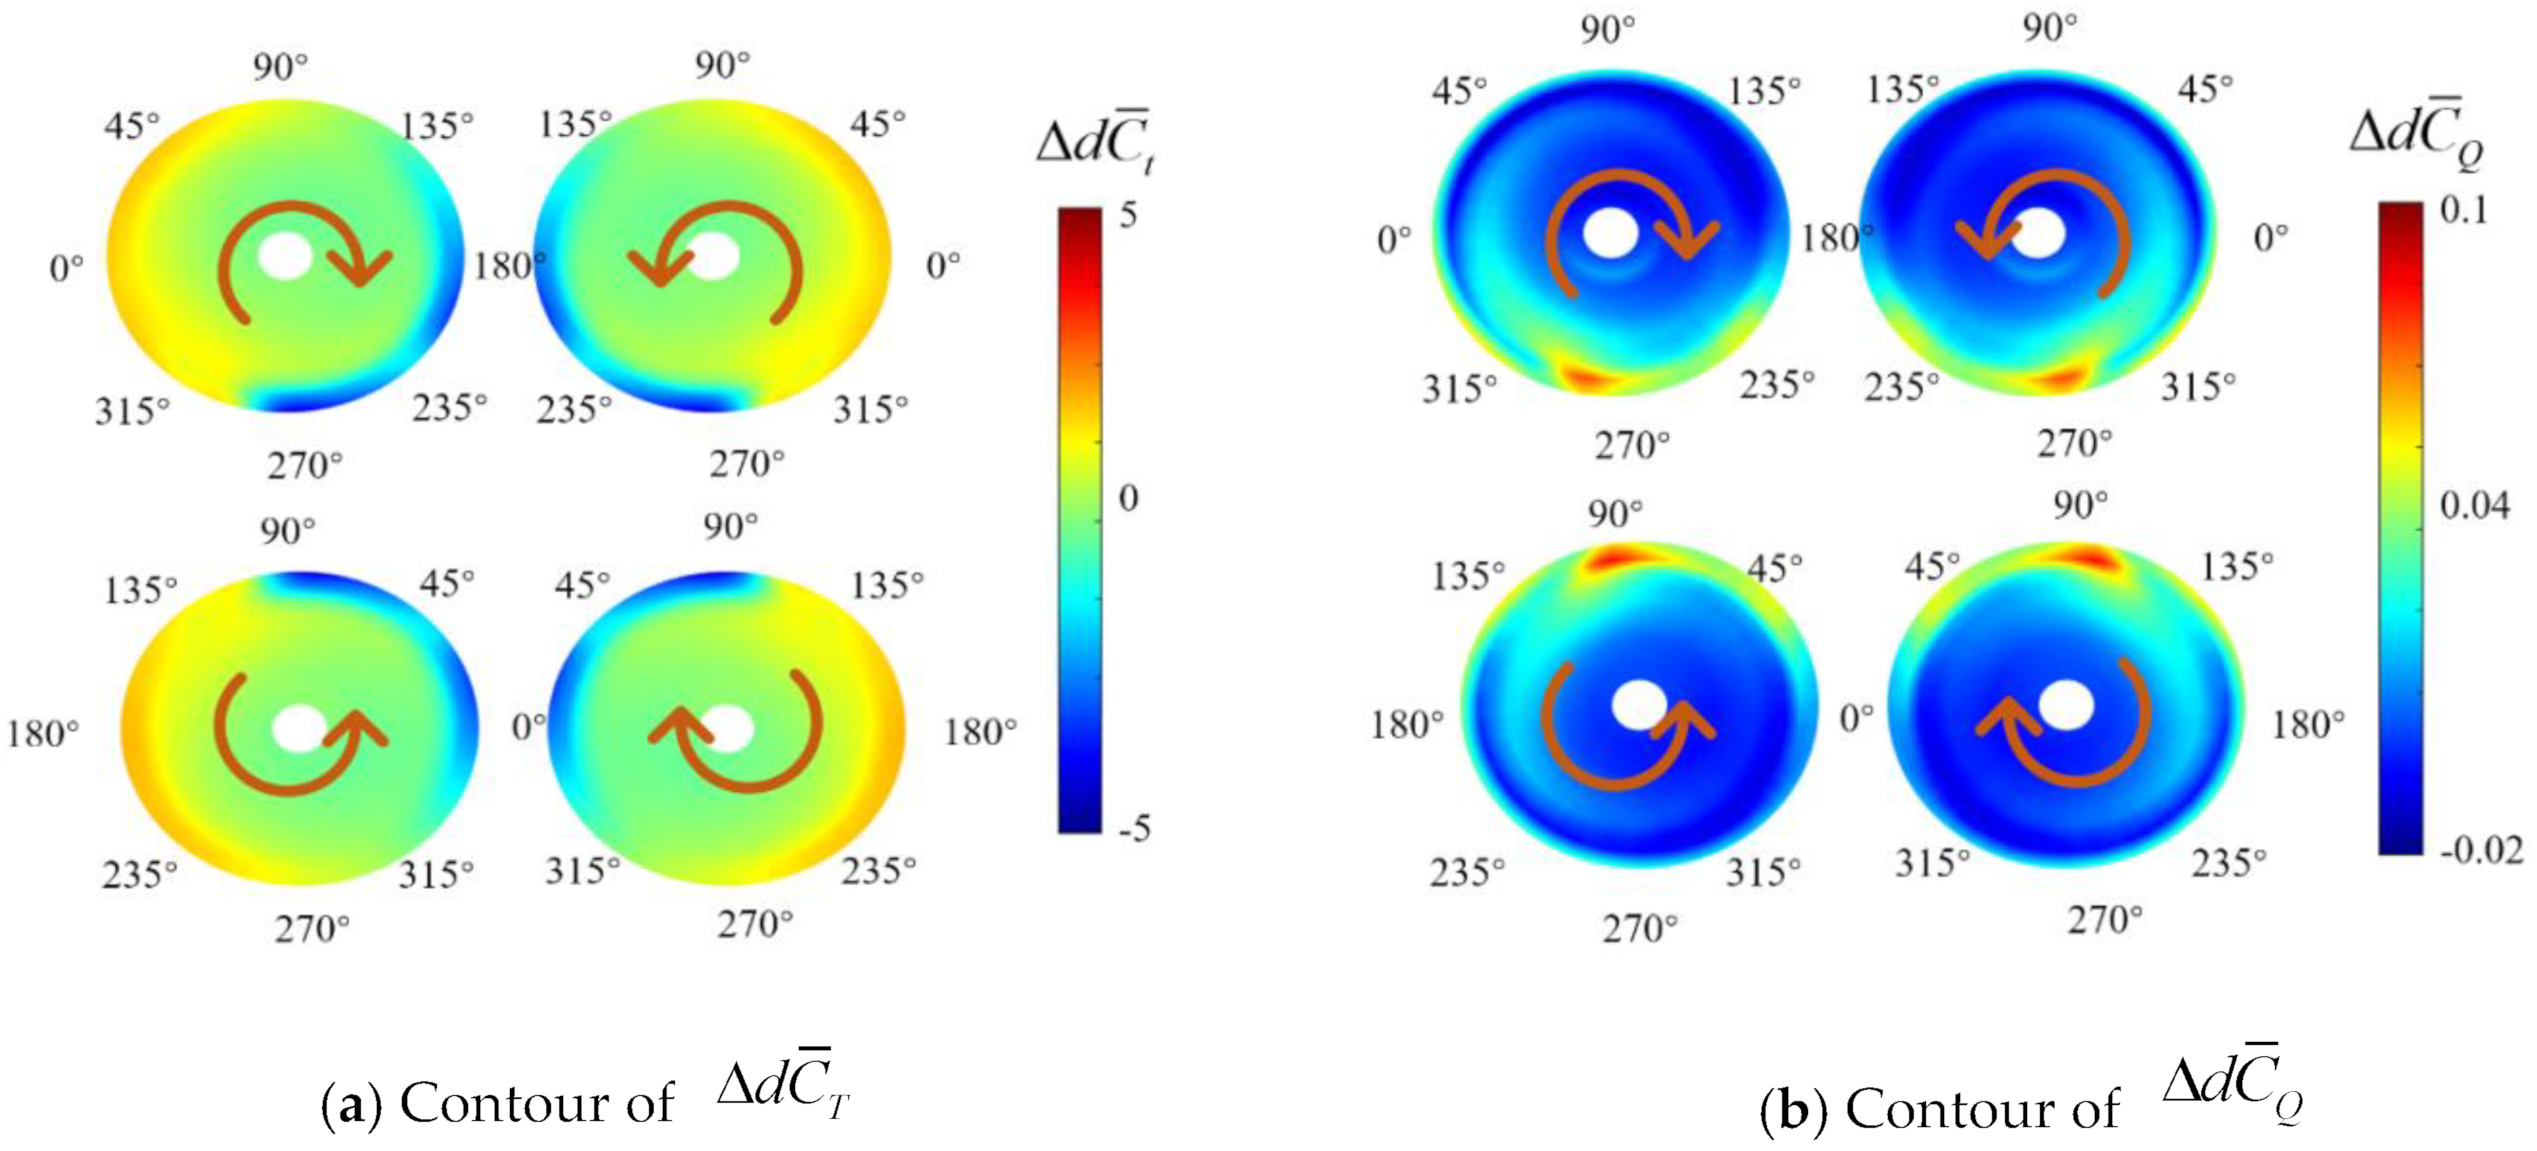
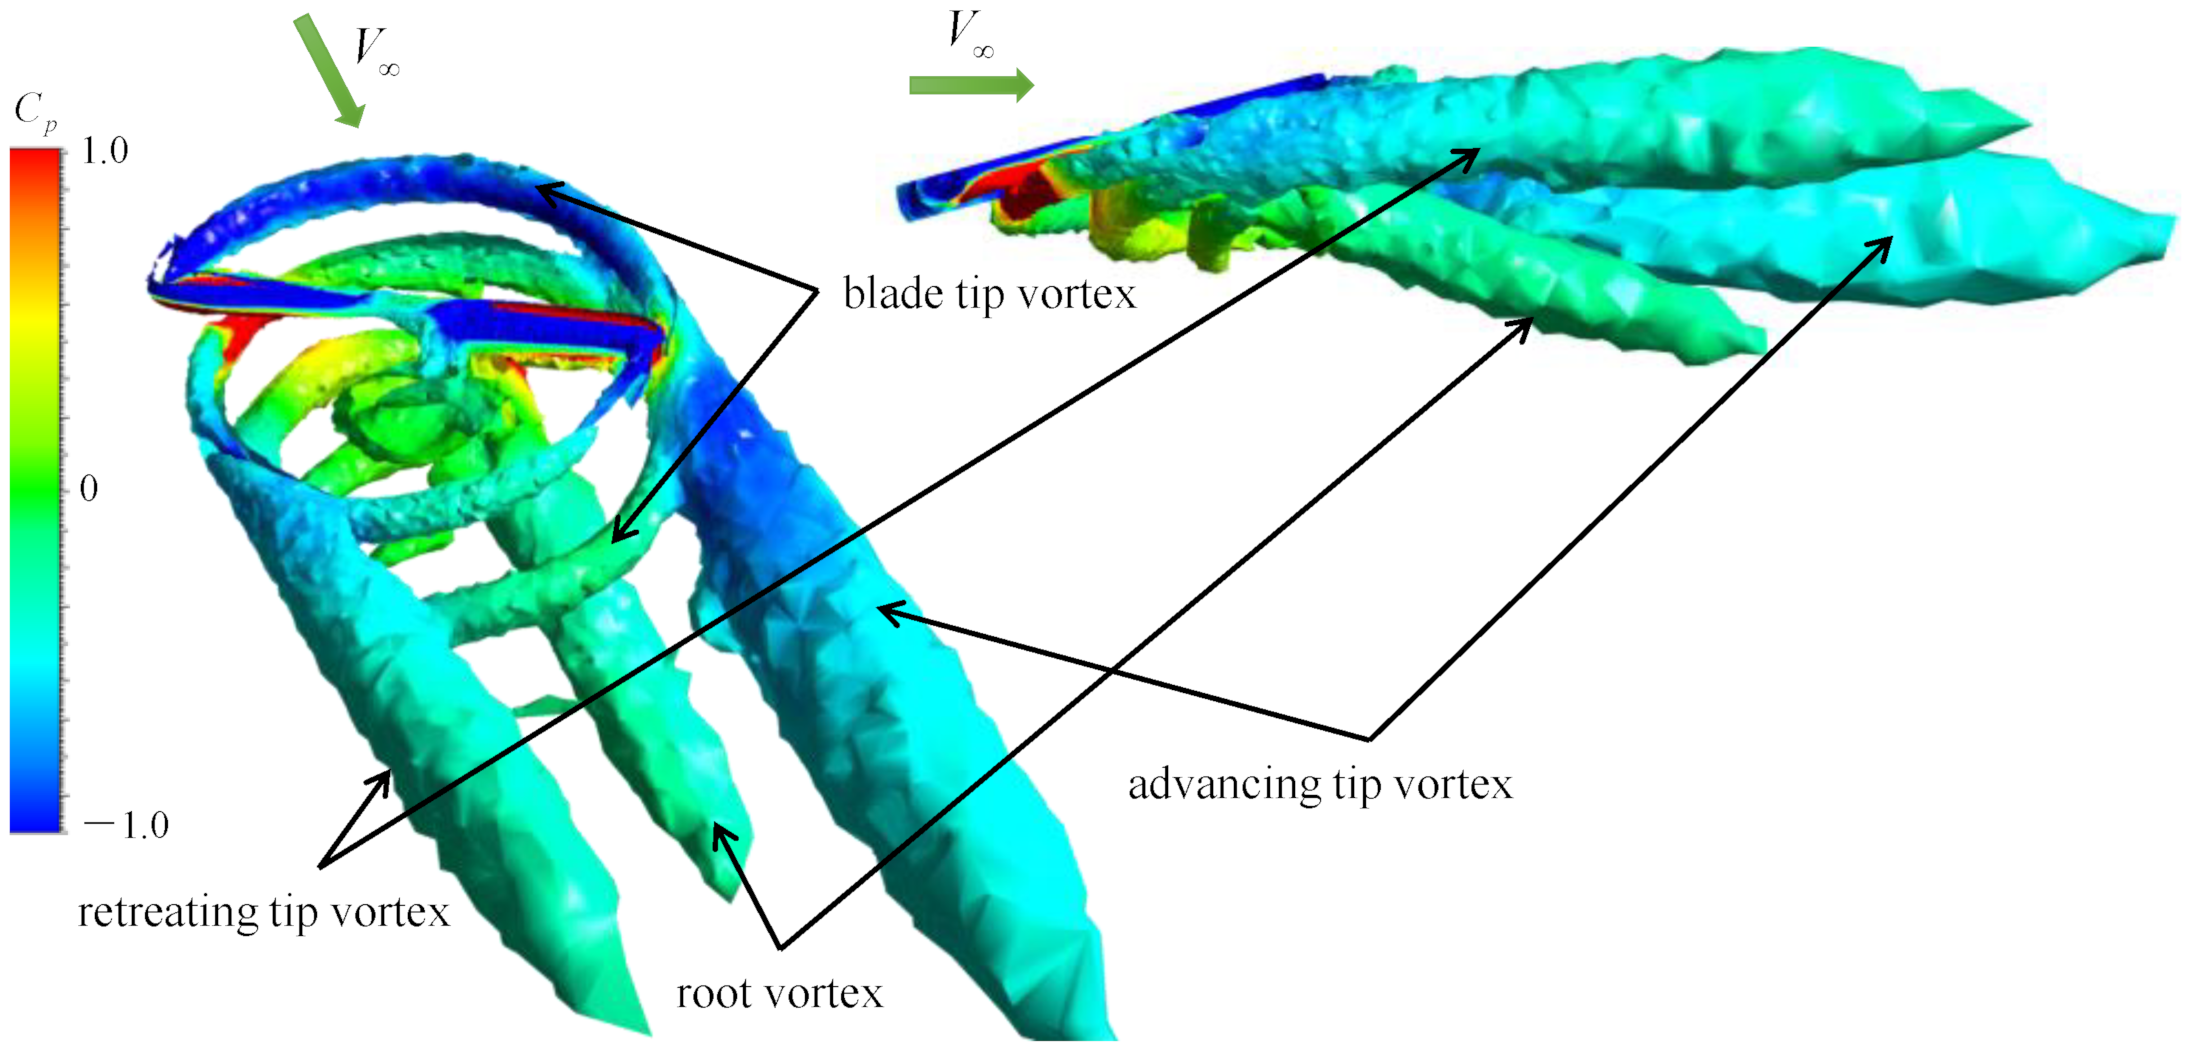
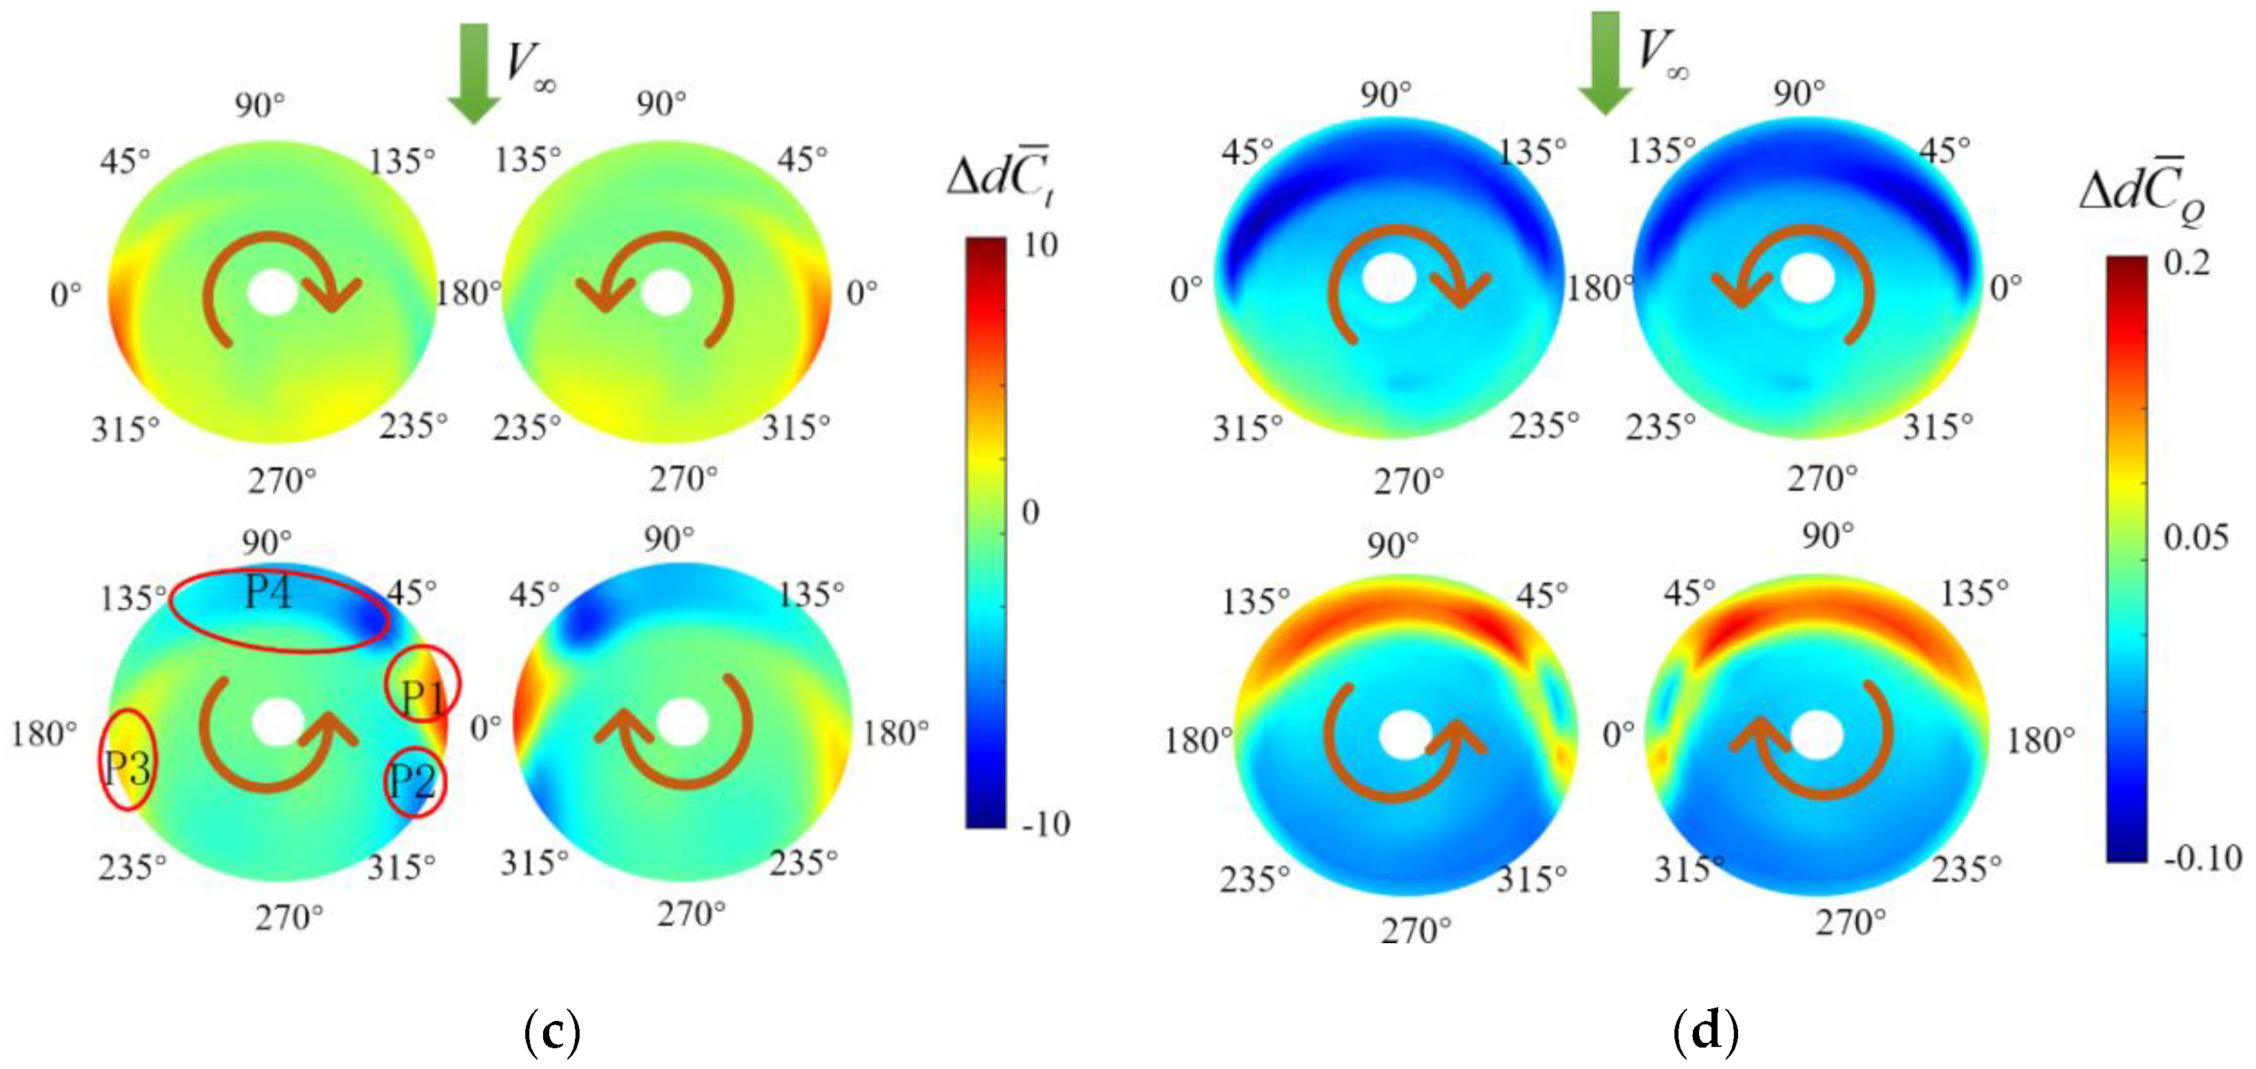
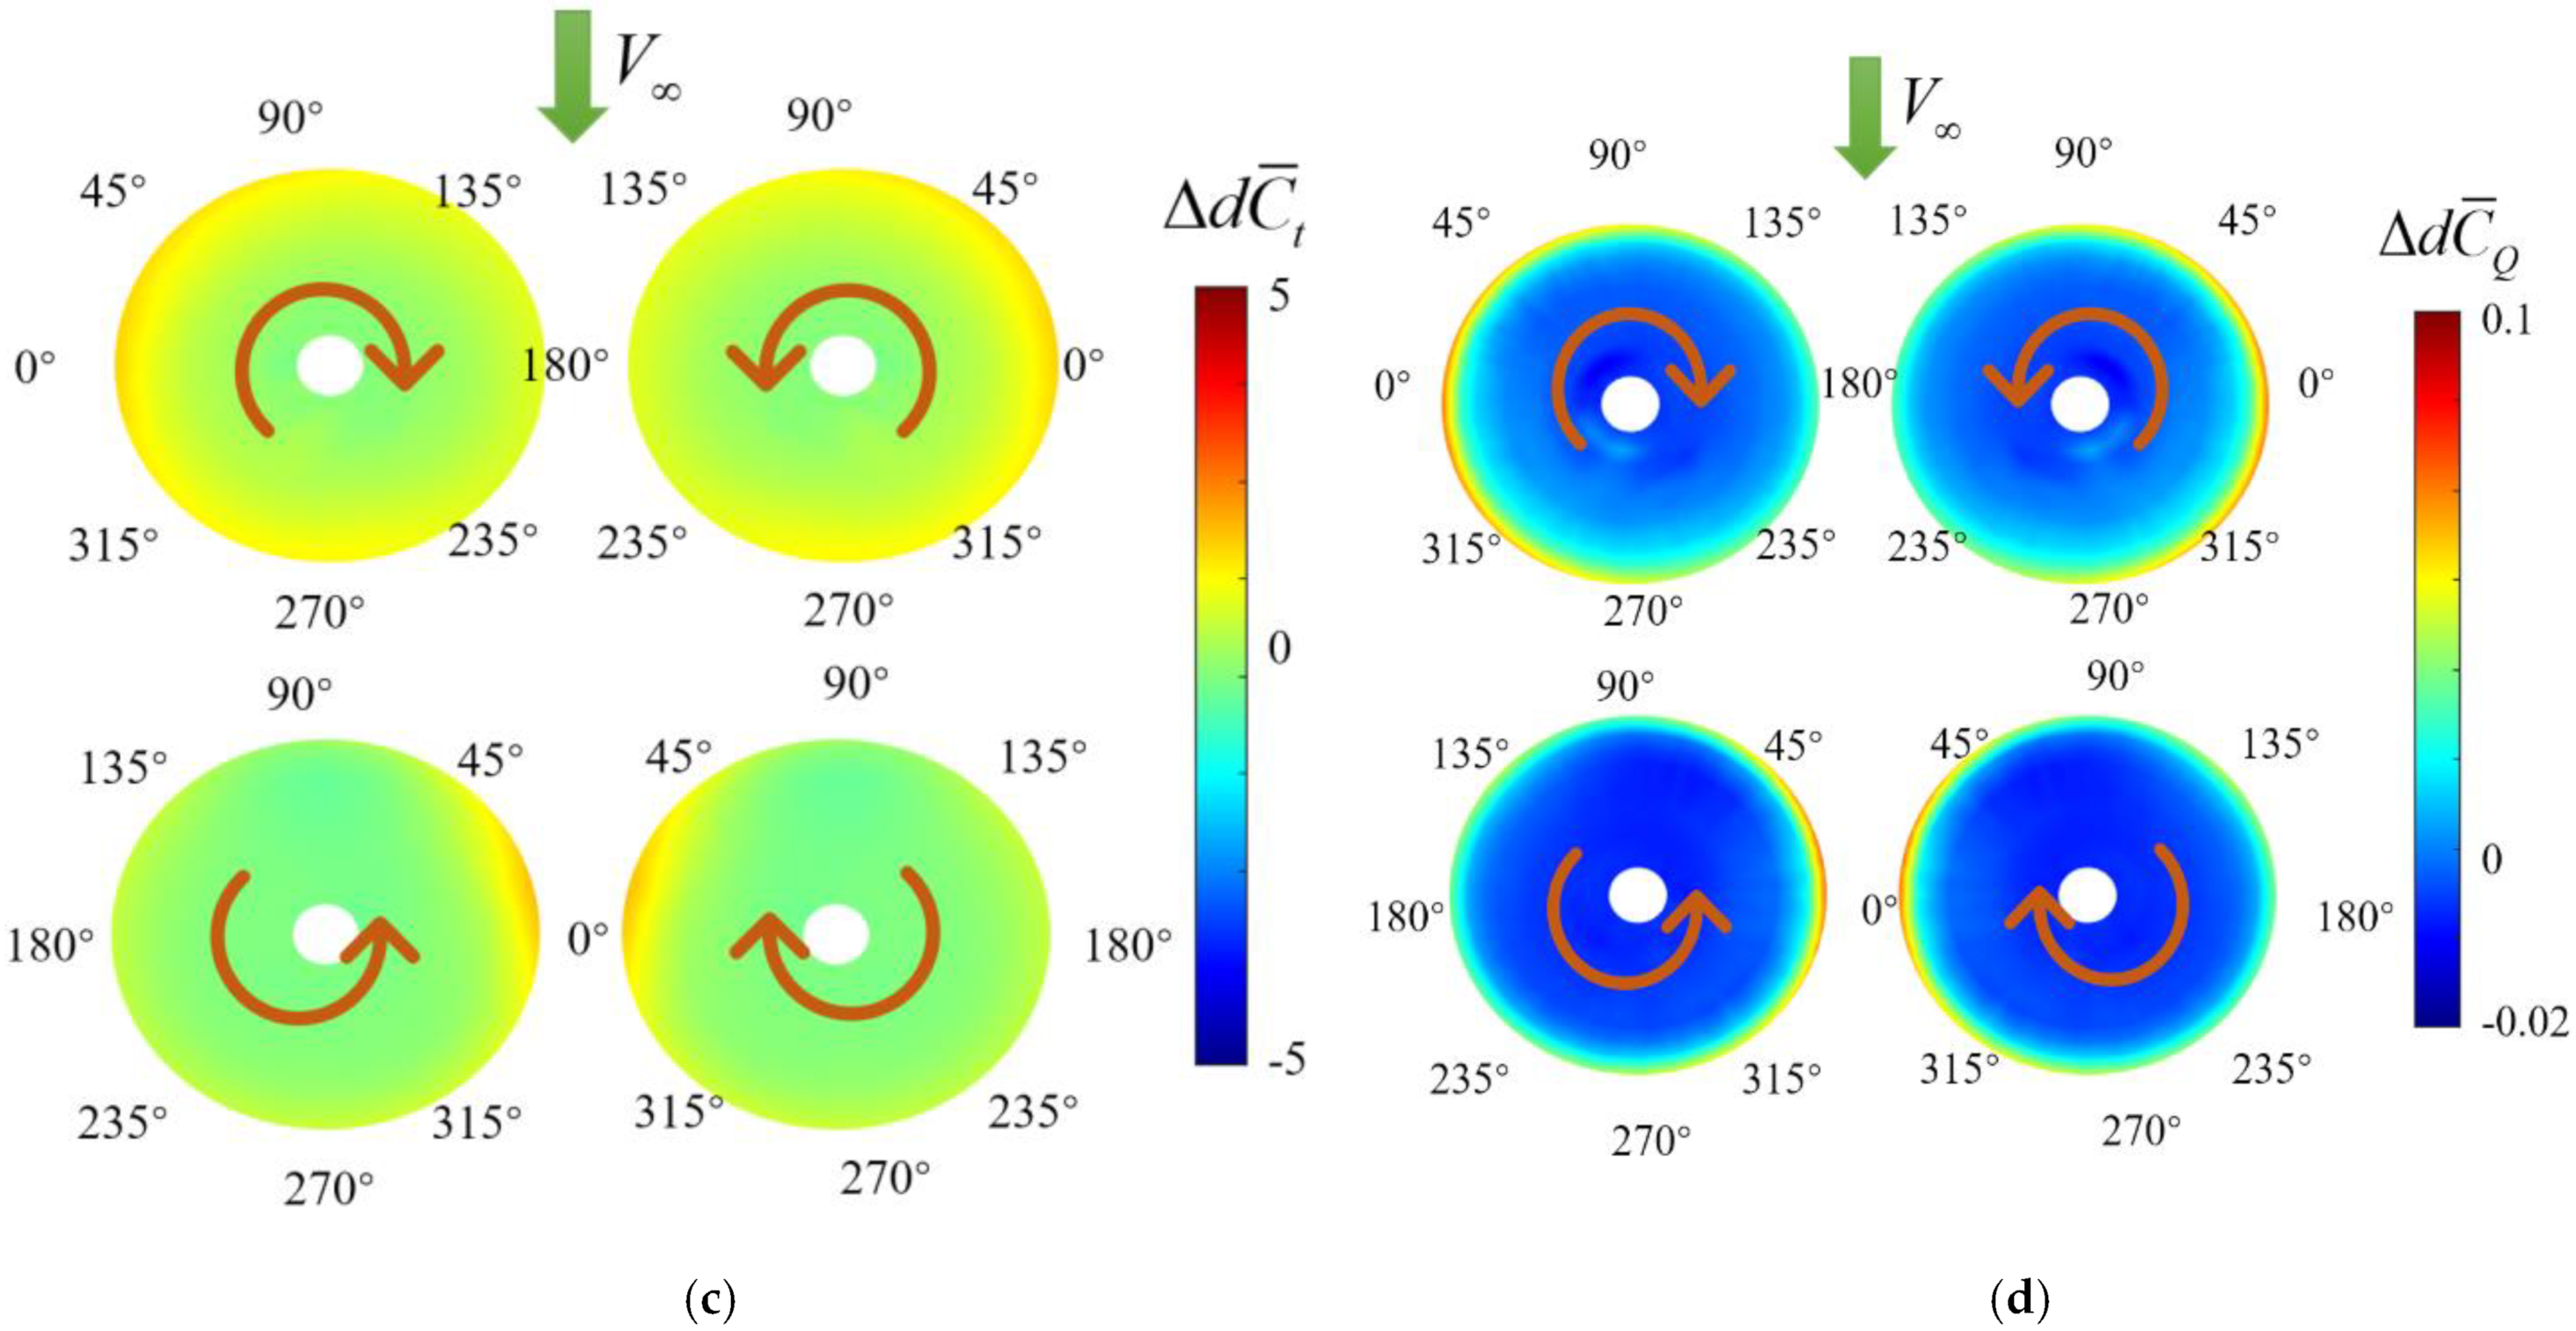
3.2.2. Interference Mechanism Analysis of Rotors

At a forward speed of 10 m/s, the d C ¯ T W and d C ¯ Q W of the four rotors in the quadcopter are shown in Figure 17, and the Δ d C ¯ T and Δ d C ¯ Q are shown in Figure 18. Figure 18 shows that the mutual interference on the front rotors is small, whereas the interference on the rear rotors is relatively complicated: In the front area (P4) of the rear rotor disk, the thrust decreases and the torque increases; in the front-inner area (P1), the thrust increases and the torque decreases; in the front-inner area (P2), the thrust decreases and the torque increases; and in the rear-outer area (P3), the thrust increases and the torque decreases.
The interference mechanism of rear rotors is analyzed through the simulation of VM-B (Front Rotors + Fuselage), as shown in Figure 19 and Figure 20. Figure 19 shows that the magnitude of w in the P4 area is increased because of the downwash of front rotors. This downwash leads to a decrease in thrust and an increase in torque of the rear rotor. Furthermore, the velocity streamline contours of cross profile 1 and profile 2 (marked in Figure 19) are shown in Figure 21. In the P1 area, the airflow moves inward due to the interference of the retreating tip vortex of the front rotor. This inward airflow inhibits the intensity of the rear rotor’s blade tip vortex. On the other side, velocity in the x-direction ( u ) in the P1 area is increased (as shown in Figure 20), which also tends to inhibit the intensity of the rear rotor’s blade tip vortex. As a result, the rear rotor’s thrust increases and the torque decreases in the P1 area. Figure 21 also shows that the airflow in the P2 area moves upward because of the interference of the retreating tip vortex of the front rotor. This upward airflow aggravates the intensity of the rear rotor’s blade tip vortex in P2 area, as illustrated in the bottom right of Figure 21. The enhance tip vortex of rear rotors leads to the reduction of the thrust and a slight increase of the torque in the P2 area. The airflow in the P3 area tends to move inward as affected by the front rotor’s advancing tip vortex. Consequently, the rear rotor’s blade tip vortex as a loss would be restrained. Therefore, thrust increases and the torque decreases in the P3 area.
To identify the primary sources of aerodynamic interference imposed on rear rotors, simulations are performed for the cases of VM-C (Fuselage + Rear Rotors), VM-D (Front Rotors + Rear Rotors), and VM-G (Two Rear Rotors). Aerodynamic interference is obtained by subtracting the reference value in the case of an isolated rotor, as shown in Figure 22.
As shown in Figure 22a,b, the contours of the upper disks show mutual interference between the two rear rotors. This interference mainly occurs in the upper area of the disk and exists in a small part of the outer area. In general, this interference is small enough to be considered negligible. The contours of the lower disks show the mutual interference between the fuselage and the rear rotors. Interference mainly exists in the inner area (P1 and P2) of the rear rotors; the wake of the fuselage causes the thrust to increase and the torque to decrease in the P1 area, and it causes the thrust to decrease and the torque to increase in the P2 area.
As shown in Figure 22c,d, the wake of the front rotors mainly affects four areas, P1–P4, of the rear rotors. In the P4 area, the thrust decreases and the torque increases. In the P1 area, the thrust increases, and the torque is significantly lower than that in the P4 area. In the P2 area, the thrust decreases and the torque increases. The P1 and P2 areas are both affected by the retreating tip vortex of the front rotor, but the final interference effect is opposite. This is mainly because the retreating tip vortex is moved down at P2 compared to P1. By comparing Figure 18 and Figure 22, the interference in the P1 and P2 areas is strengthened due to the existence of the fuselage.
In short, the interference in the P1 and P2 areas is affected by the combined action of the retreating tip vortex of the front rotor and the fuselage wake; the interference in the P4 area mainly comes from the root vortex of the front rotor; and the P3 area is affected by the advancing tip vortex of the front rotor.

3.2.3. Interference Mechanism Analysis of the Fuselage

According to CFD simulation results, the aerodynamic forces imposed on the fuselage changes periodically (including a short-period change and a long-period change), about 0.4 s including five long motion periods as sample data for the following frequency analysis, as shown in Figure 23.
The coefficients of aerodynamic forces imposed on the fuselage are transformed by fast Fourier transform (FFT), and the frequency response is shown in Figure 24. The dominant frequency points are two and several times the front and rear rotors’ rotation frequency (front rotor: 316.45 rad/s, rear rotor: 356.38 rad/s). In addition, there is a low frequency (35.619 rad/s), which is the least common multiple of the rotation frequencies of the front and rear rotors (about nine revolutions of the front rotor and 10 revolutions of the rear rotor).
The amplitudes of the frequencies corresponding to the front rotors are all smaller than the amplitudes of the frequencies corresponding to the rear rotors, indicating that the interference of the rear rotors to the fuselage varies significantly at different azimuths.
Trigonometric interpolation is employed to quantify the variations of aerodynamic forces of the fuselage. The aerodynamic coefficients can be approximately written as follows:
c d = c d 0 + i = 1 4 A i sin ( ω i x + C i )     ,
c l = c l 0 + i = 1 4 A i sin ( ω i x + C i )   ,  
c m = c m 0 + i = 1 4 A i sin ( ω i x + C i )   .  
The values of the aerodynamic coefficients in the above formulas are shown in Table 5. It is noted that ω i are two times and four times the rotor rotation frequency. * 0 corresponds to c d 0 , c l 0 , and c m 0 , which are the average values of c d , c l , and c m .
As shown in Figure 25, the fourth-order sine basis function can be used to describe the aerodynamic force experienced by the fuselage within 0.15 s (about 2 long period motion). According to Equations (4)–(6), the aerodynamics of the fuselage can be written as a constant term plus an interference term associated with the revolution of the front rotors plus an interference term associated with the revolution of the rear rotors.
The fuselage aerodynamic coefficients at different azimuth angles within the time interval of 0.31~0.326 s, corresponding to about two short periods (covering an entire revolution of the rotors), are shown in Figure 26. The aerodynamic coefficient of the fuselage changes little most of the time. Only in the periods of 0.316–0.318 s and 0.324–0.326 s, when the rear rotor is the relatively close to fuselage, the aerodynamic coefficients exhibit major changes.
Figure 27 shows two cross profile velocity contours in the S9 and S11 states marked in Figure 26. The up-washing to the front part of the fuselage does not change drastically, no matter whether the front rotors are close to the fuselage or far away from the fuselage. The up-washing to the rear part of fuselage becomes more intensive when the rear rotors are approaching the fuselage. The wash air flow on the rear rotors mainly acts on the rear half of the fuselage, as a result, the lift increases and the nose-down moment decreases when the tips of the rear rotors are close to the fuselage.

3.3. 25 m/s forward Flight Condition

3.3.1. Analysis of Aerodynamic Characteristics of Isolated Rotor

The flow field of the isolated rotor without interference at 25 m/s is similar to that at 10 m/s, as shown in Figure 28. Due to the increase of the incoming flow velocity and flow angle, the retreating tip vortex of the blade lags more than the advancing one, and the down-washing of the two tip vortices is more intensive as compared with the case of 10 m/s. This can be attributed to the increase in rotor speed and the incoming vertical velocity.
The contours of d C ¯ T i and d C ¯ Q i of the isolated rotor are shown in Figure 29. The maximum thrust occurs at 30°, while the torque reaches maximum at 0°.

3.3.2. Interference Mechanism Analysis of the Rotors

At a forward speed of 25 m/s, the d C ¯ T W and d C ¯ Q W of the four rotors in the quadcopter are shown in Figure 30, and Δ d C ¯ T and Δ d C ¯ Q are shown in Figure 31. At 25 m/s, the mutual interference of the front rotors is negligible, similar to that of 10 m/s. The interference of the rear rotors is less intensive as compared with the case of 10 m/s. In the P1 and P2 areas, the thrust and the torque are reduced at the same time. In the P3 and P4 areas, the interference can be neglected.
VM-B (Front Rotors + Fuselage) at 25 m/s is simulated to analyze the interference mechanism of the rear rotors, and the flow field of VM-B is as shown in Figure 32. The P1 and P2 areas are located in the wake of the fuselage, where the aerodynamic pressure decreases, resulting in a decrease in thrust and torque. The wake of the front rotor is far below the position of rear rotors as illustrated on the right side of Figure 32.
To find the primary sources of aerodynamic interference received by the rear rotors, simulations of VM-C (Fuselage + Rear Rotors), VM-D (Front Rotors + Rear Rotors), and VM-G (Two Rear Rotors) are performed. The results of the isolated rotor are taken as the reference to evaluate the interference for these VMs. Results of this analysis are expressed as the contours in Figure 33.
As shown in Figure 33a,b, the contours of the top disks show the mutual interference between the two rear rotors. This interference is small enough to be neglected. The contours of the bottom disks show the mutual interference between the fuselage and the rear rotors. The interference mainly exists in the inner area (P1 and P2) of the rear rotors; the wake of the fuselage corresponds to the low dynamic pressure (shown in the right plots of Figure 33), and therefore leads to the thrust and torque to decrease in the P1 and P2 areas. As shown in Figure 33c,d, the wake of the front rotors only affects the P1 areas slightly. In short, the interference between the fuselage and the rear rotors is more intensive than that between the front rotors and the rear rotors. This analysis shows that the wake of the fuselage is mainly responsible for the reduction of the thrust and torque of the rear rotors in the P1 and P2 areas.

3.3.3. Interference Mechanism Analysis of the Fuselage

The aerodynamic coefficient of the fuselage at 25 m/s changes periodically with the same interval in the case of 10 m/s (including a short-period change and a long-period variation), as shown in Figure 34. The recorded aerodynamic coefficients are transformed by FFT, and the frequency response is obtained as shown in Figure 35. The dominant frequency points in the frequency response are two times the front and rear rotors’ rotation frequency (front rotor: 556.154 rad/s, rear rotor: 620.24 rad/s) and their multiplier. According to the frequency response, the aerodynamics of the fuselage can also be approximated using Equations (16)–(18); the values of the parameters in the formulas are shown in Table 6. All of the ω i are two times and four times the frequency of the rotor rotation speed. The fitting results are shown in Figure 36.
The fuselage aerodynamic coefficients at different azimuth angles within 0.1 s (about two long period motions) are shown in Figure 37. It can be found that the aerodynamic coefficients change greatly as rear rotors approaching to the fuselage. This is characterized by a c m decrease and a c l increase. The mechanism for the variation is similar to the case of 10 m/s, as discussed in Section 3.2.3.

4. Performance Analysis

The previous section analyzed the flow mechanisms of aerodynamic interference among the components of a quadcopter. This section conducts a quantitative analysis of the aerodynamics interference. The components include the front rotor, rear rotor, and fuselage.

4.1. Performance Analysis of Front Rotor

The coefficients of aerodynamics forces of an individual front rotor in different VMs are accessed and presented in the plots in Figure 38. It is clear that performance is almost the same for different flight speed, complying with the results of the mechanism analysis.

4.2. Performance Analysis of Rear Rotor

Figure 39 shows the relationship between the aerodynamic coefficients of an individual rear rotor in different VMs. The drag coefficient ( C H ), torque coefficient ( C Q ), and roll moment coefficient ( m x ) of the rear rotor are almost the same in different VMs, and the interference of these aerodynamic coefficients is negligible.
In the speed region from 0 to 20 m/s, the pitch moment coefficient ( m y ) and thrust coefficient ( C T ) in VM-E (Isolated Rotor) are basically the same as in VM-C (Rear Rotors + Fuselage), and the m y and C T in VM-A (Whole UAV) are basically the same as in VM-D (Front Rotors + Rear Rotors). This indicates the interference received by the rear rotors mainly comes from the front rotors. At the speed of 25 m/s, m y and C T in VM-E are the same as in VM-D, and m y and C T in VM-A are the same as in VM-C. As a result, it is reasonable to consider that the interference received by the rear rotors mainly comes from the fuselage and the loss of thrust will reduce the aerodynamic efficiency of the rotor, resulting in an increase in the power of the whole UAV.

4.3. Performance Analysis of Fuselage

The aerodynamic forces of the fuselage in different VMs are plotted in Figure 40. As shown in top left of Figure 40, the wake of the front rotor decreases the drag of the fuselage, and the wake of the rear rotor increases the drag of the fuselage. Under the combined action of the front and rear rotors, the fuselage drag is the same with that of an isolated fuselage (the difference is less than 5% within the entire speed range). Therefore, a model of fuselage drag can be simplified as the sole drag without aerodynamic interference. It can be seen from top right of Figure 40 that the wake of the front and rear rotors increase fuselage lift at the same time, and the fuselage lift exhibits a significant change (of a 10% increase). As shown in bottom left of Figure 40, the wake of the front rotor decreases the pitch moment of the fuselage, whereas the wake of the rear rotor increases the pitch moment of the fuselage. In general, the fuselage’s aerodynamic pitch moment is less than 5% of the pitching moment (about 8 N·m) of the thrust about the center of the gravity produced by an individual rotor. Therefore, the pitching moment experienced by the fuselage could be neglected.

4.4. Summary of Performance Analysis

Through the analysis of the mutual interference performance of the front rotors, rear rotors, and fuselage, preliminary results are obtained: the interference received by the front rotors is negligible in the steady flight condition; for the rear rotors, thrust and pitching moment should be considered in the interference; and the fuselage needs to take into account the interference of lift. The rest aerodynamic forces can be neglected in the interference performance.

5. Conclusions

This paper studies the aerodynamic mutual interference between the components of an “X” configuration quadcopter at different flight speeds. The CFD simulations are performed to solve the flow field of the quadcopter, and the interference mechanism of rotors at different positions is analyzed by defining the d C ¯ Q and d C ¯ T . The following conclusions are obtained:
(1) In the hovering mode, a rotor generates two tip vortices and one root vortex. Mutual interference occurs in a small area where the rotors are close to each other and it has insignificant impact on the performance of the entire quadcopter. The aerodynamic interference among the quadcopter’s components is negligible.
(2) At the flight speed of 10 m/s, the rotor leaves two strong vortices in the downstream of the advancing and retreating sides. The wake of the front rotor causes the adjacent air to flow downward. This significantly affects the flow field of the rear rotor, changing the rear rotors’ aerodynamic forces of thrust and pitching moment.
(3) The flow field of the rotor at the flight speed of 25 m/s is similar to that of 10 m/s, while the wake of the front rotor barely changes the aerodynamics of rear rotors, because the impact of downwash of wake is eliminated by the high vertical flow velocity associated with the high rotor rotation speed. The rear rotors are mainly affected by the wake of fuselage.
(4) This paper analyzes the mutual interference to the fuselage at flight speeds of 10 m/s and 25 m/s. The fuselage aerodynamic forces are analyzed through FFT analysis and then represented as the summation of constant forces and periodically changing forces. By analyzing the results of VMs, the interference of the front rotors to the fuselage leads to an increase in lift and pitch moment; the interference of the rear rotors to the fuselage leads to an increase in lift and a decrease in pitch moment.
(5) The interference received by the rear rotors and the fuselage reaches the maximum extent at flight speeds of 5–10 m/s, and the extend of interference effect decreases as the speed increases.
(6) The performance analysis shows that an interference model of quadcopter can be simplified. The rear rotor’s thrust, rear rotor’s pitch moment, and fuselage’s lift are significant enough to be considered within the steady flight speed envelope. The rest of aerodynamic forces can be neglected.
(7) Aerodynamic efficiency of the rear rotor is decreased due to the mutual interference, resulting in the power increase of the quadcopter in the forward flight. The wake of front and rear rotors increases the lift of the fuselage, this effect tends to increase the aerodynamic efficiency.
This work studies the flow mechanism of aerodynamic interference in an X configuration quadcopter. Recommendations are given as follows: the interference acting on rear rotor due to the wake of front rotor should be eliminated; the effect of rotors’ wake imposed on fuselage can be exploited. To optimize the performance of quadcopter, it might be wise to investigate how the distance between the rotors and fuselage influences the performance. This is left for future work.

Author Contributions

Conceptualization, J.Y. and J.W.; methodology, J.Y.; software, J.Y.; validation, J.Y. and P.L.; formal analysis, J.Y.; investigation, J.W.; resources, P.L.; data curation, P.L.; writing—original draft preparation, J.Y.; writing—review and editing, P.L.; visualization, J.W.; supervision, P.L.; project administration, J.W.; funding acquisition, J.W. All authors have read and agreed to the published version of the manuscript.

Funding

This research received no external funding.

Institutional Review Board Statement

Not applicable.

Informed Consent Statement

Not applicable.

Data Availability Statement

The study did not report any data.

Conflicts of Interest

The authors declare no conflict of interest.

References

  1. Hassanalian, M.; Abdelkefi, A. Classifications, applications, and design challenges of drones: A review. Prog. Aerosp. Sci. 2017, 91, 99–131. [Google Scholar] [CrossRef]
  2. Amezquita-Brooks, L.; Liceaga-Castro, E.; Gonzalez-Sanchez, M.; Garcia-Salazar, O.; Martinez-Vazquez, D. Towards a standard design model for quad-rotors: A review of current models, their accuracy and a novel simplified model. Prog. Aerosp. Sci. 2017, 95, 1–23. [Google Scholar] [CrossRef]
  3. Nguyen, H.D.; Yu, L.; Mori, K. Aerodynamic characteristics of quadrotor helicopter. In Proceedings of the AIAA Flight Testing Conference, Denver, CO, USA, 5–9 June 2017. [Google Scholar]
  4. Khan, W.; Nahon, M. Toward an Accurate Physics-Based UAV Thruster Model. IEEE/ASME Trans. Mechatron. 2013, 18, 1269–1279. [Google Scholar] [CrossRef]
  5. Shastry, A.K.; Kothari, M.; Abhishek, A. Generalized Flight Dynamic Model of Quadrotor Using Hybrid Blade Element Momentum Theory. J. Aircr. 2018, 55, 2162–2168. [Google Scholar] [CrossRef]
  6. Theys, B.; Dimitriadis, G.; Hendrick, P.; De Schutter, J. Experimental and Numerical Study of Micro-Aerial-Vehicle Propeller Performance in Oblique Flow. J. Aircr. 2017, 54, 1076–1084. [Google Scholar] [CrossRef]
  7. Lei, Y.; Wang, H. Aerodynamic Performance of a Quadrotor MAV Considering the Horizontal Wind. IEEE Access 2020, 8, 109421–109428. [Google Scholar] [CrossRef]
  8. Kolaei, A.; Barcelos, D.; Bramesfeld, G. Experimental Analysis of a Small-Scale Rotor at Various Inflow Angles. Int. J. Aerosp. Eng. 2018, 2018, 2560370. [Google Scholar] [CrossRef] [Green Version]
  9. Ye, J.; Wang, J.; He, S.; Song, T. Rotor performance analysis and modeling of multirotor using wind-tunnel test. In Proceedings of the 2020 International Conference on Unmanned Aircraft Systems (ICUAS), Athens, Greece, 1–4 September 2020. [Google Scholar]
  10. Bannwarth, J.X.J.; Jeremy Chen, Z.; Stol, K.A.; MacDonald, B.A.; Richards, P.J. Aerodynamic Force Modeling of Multirotor Unmanned Aerial Vehicles. AIAA J. 2019, 57, 1250–1259. [Google Scholar] [CrossRef]
  11. Amezquita-Brooks, L.; Hernandez-Alcantara, D.; Santana-Delgado, C.; Covarrubias-Fabela, R.; Garcia-Salazar, O.; Ramirez-Mendoza, A.M.E. Improved model for micro-UAV propulsion systems: Characterization and applications. IEEE Trans. Aerosp. Electron. Syst. 2019, 56, 2174–2197. [Google Scholar] [CrossRef]
  12. Chen, R.; Yuan, Y.; Thomson, D. A review of mathematical modelling techniques for advanced rotorcraft configurations. Prog. Aerosp. Sci. 2021, 120, 100681. [Google Scholar] [CrossRef]
  13. Hwang, J.Y.; Jung, M.K.; Kwon, O.J. Numerical Study of Aerodynamic Performance of a Multirotor Unmanned-Aerial-Vehicle Configuration. J. Aircr. 2015, 52, 839–846. [Google Scholar] [CrossRef]
  14. Misiorowski, M.; Gandhi, F.; Oberai, A.A. Computational Study on Rotor Interactional Effects for a Quadcopter in Edgewise Flight. AIAA J. 2019, 57, 5309–5319. [Google Scholar] [CrossRef] [Green Version]
  15. Barcelos, D.; Kolaei, A.; Bramesfeld, G. Aerodynamic Interactions of Quadrotor Configurations. J. Aircr. 2020, 57, 1074–1090. [Google Scholar] [CrossRef]
  16. T-MOTOR-Polymer Folding/MF. Available online: https://store.tmotor.com/goods.php?id=741 (accessed on 6 October 2021).
  17. Niemiec, R.; Gandhi, F. Effects of inflow model on simulated aeromechanics of a quadrotor helicopter. In Proceedings of the 72nd Annual Forum of the American Helicopter Society, West Palm Beach, FL, USA, 17–19 May 2016. [Google Scholar]
Figure 1. Simplified model for numerical simulations.
Aerospace 08 00349 g001
Figure 2. Profile of the original rotor and scanning rotor.
Aerospace 08 00349 g002
Figure 3. The diagram of aerodynamic forces for rotor and fuselage.
Aerospace 08 00349 g003
Figure 4. Recorded flight data.
Aerospace 08 00349 g004
Figure 5. Computational field of the quadcopter.
Aerospace 08 00349 g005
Figure 6. Mesh grid of computational field.
Aerospace 08 00349 g006
Figure 7. Isolated rear rotor CFD results of condition e. and the definition of the azimuth angle.
Aerospace 08 00349 g007
Figure 8. Scheme of “Virtual Modes”.
Aerospace 08 00349 g008
Figure 9. Schematic diagram of blade segmentation.
Aerospace 08 00349 g009
Figure 10. The wake of the rotor in hovering state (iso-vortex surface based on criterion Q, colored according to pressure).
Aerospace 08 00349 g010
Figure 11. Contours of d C ¯ T i and d C ¯ Q i of isolated rotor.
Aerospace 08 00349 g011
Figure 12. Contours of d C ¯ T W and d C ¯ Q W (whole quadcopter).
Aerospace 08 00349 g012
Figure 13. Contours of Δ d C ¯ T and Δ d C ¯ Q .
Aerospace 08 00349 g013
Figure 14. Wake vortices of isolated rotor (colored with C p ).
Aerospace 08 00349 g014
Figure 15. Velocity contours (ww) of a rotor flow field at different azimuth angles, the disks represent four regions around the rotor (figure shows that the influence on the four disks remain unchanged for different azimuth angles).
Aerospace 08 00349 g015
Figure 16. Contours of d C ¯ T i and d C ¯ Q i for an isolated rotor.
Aerospace 08 00349 g016
Figure 17. Contours of d C ¯ T W and d C ¯ Q W .
Aerospace 08 00349 g017
Figure 18. Contours of Δ d C ¯ T and Δ d C ¯ Q (P1: thrust increase, torque decrease; P2: thrust decrease, torque increase; P3: thrust increase, torque decrease; P4: thrust decrease, torque increase).
Aerospace 08 00349 g018
Figure 19. z-velocity ( w ) contour (the upward direction is represented by positive values).
Aerospace 08 00349 g019
Figure 20. x-velocity ( u ) contour.
Aerospace 08 00349 g020
Figure 21. Cross profile velocity streamline and velocity contour in the downstream of the rear right rotor (watch from the back).
Aerospace 08 00349 g021
Figure 22. Contours of Δ d C ¯ T and Δ d C ¯ Q in VM-C, D, and G combinations. (a) Contours of Δ d C ¯ T of rear rotors in VM-C (Fuselage + Rear Rotors) and VM-G (Two Rear Rotors). (b) Contours of Δ d C ¯ Q of rear rotors in VM-C (Fuselage + Rear Rotors) and VM-G (Two Rear Rotors). (c) Contours of Δ d C ¯ T of rotors in VM-D (Front Rotors + Rear Rotors). (d) Contours of Δ d C ¯ Q of rotors in VM-D (Front Rotors + Rear Rotors).
Aerospace 08 00349 g022aAerospace 08 00349 g022b
Figure 23. Coefficients of aerodynamic forces imposed on the fuselage as a function of time.
Aerospace 08 00349 g023
Figure 24. Frequency response of fuselage aerodynamics.
Aerospace 08 00349 g024
Figure 25. Aerodynamic fitting results of the fuselage (red line: fitting results; black dots: CFD results).
Aerospace 08 00349 g025
Figure 26. The fuselage aerodynamic coefficients change with time at different azimuth angles.
Aerospace 08 00349 g026
Figure 27. Velocity streamline and z-direction velocity contour for the states of S9 and S11.
Aerospace 08 00349 g027
Figure 28. Vortices of isolated rotor (colored with C p ).
Aerospace 08 00349 g028
Figure 29. Contours of d C ¯ T i and d C ¯ Q i .
Aerospace 08 00349 g029
Figure 30. Contours of d C ¯ T W and d C ¯ Q W .
Aerospace 08 00349 g030
Figure 31. Contours of Δ d C ¯ T and Δ d C ¯ Q .
Aerospace 08 00349 g031
Figure 32. Cross profile velocity streamline and velocity contour of VM-B (Front Rotors + Fuselage) combination at 25 m/s (red shade regions correspond to the rear rotor discs).
Aerospace 08 00349 g032
Figure 33. Contours of Δ d C ¯ T and Δ d C ¯ Q in VM-C, D, and G. (a) Contours of Δ d C ¯ T of rear rotors in VM-C (Fuselage + Rear Rotors) and VM-G (Two Rear Rotors). (b) Contours of Δ d C ¯ Q of rear rotors in VM-C (Fuselage + Rear Rotors) and VM-G (Two Rear Rotors). (c) Contour of Δ d C ¯ T of rotors in VM-D (Front Rotors + Rear Rotors). (d) Contour of Δ d C ¯ Q of rotors in VM-D (Front Rotors + Rear Rotors).
Aerospace 08 00349 g033aAerospace 08 00349 g033b
Figure 34. Aerodynamic coefficient of the fuselage as a function of time.
Aerospace 08 00349 g034
Figure 35. Frequency response of fuselage aerodynamics.
Aerospace 08 00349 g035
Figure 36. Aerodynamic fitting results of the fuselage (red line: fitting results; black dots: CFD results).
Aerospace 08 00349 g036
Figure 37. The fuselage aerodynamic coefficients change with time at different azimuth angles.
Aerospace 08 00349 g037
Figure 38. Aerodynamic coefficients of the front rotor with different “Virtual Modes” as a function of speed.
Aerospace 08 00349 g038aAerospace 08 00349 g038b
Figure 39. Aerodynamic coefficients of the rear rotor with different “Virtual Modes” as a function of speed.
Aerospace 08 00349 g039aAerospace 08 00349 g039b
Figure 40. Aerodynamics of the fuselage with different “Virtual Modes” as a function of speed.
Aerospace 08 00349 g040aAerospace 08 00349 g040b
Table 1. Simulation conditions.
Condition No.Speed
(m/s)
Pitch Angle (°)RPM of Front Rotor (rad/s)RPM of Rear Rotor (rad/s)
a00.00331.60331.60
b5−2.76321.57341.81
c10−7.02316.45356.38
d15−13.07330.66386.86
e20−21.60395.63460.70
f25−33.37556.15620.24
Table 2. Grid independence verification.
Cells c d Difference C T Difference
5 M0.016024%0.03512.9%
10 M0.01354.6%0.0323.2%
15 M0.0129--0.031--
Table 3. Time step verification.
Iteration Step C T C Q
0.5 ° / Δ t 0.03290.0035
1 ° / Δ t 0.03240.0034
2 ° / Δ t 0.02830.0031
Table 4. Grid size and simulation modes.
VMsCombinationNumber of Grids
AWhole UAV10.37 M
BFront Rotor + Fuselage6.79 M
CRear Rotor + Fuselage6.78 M
DFront Rotor + Rear Rotor8.83 M
EIsolated Rotor4.57 M
FIsolated Fuselage1.36 M
GTwo Rear Rotors8.86 M
Table 5. Parameters of fuselage aerodynamic coefficients.
c d c l c m
A 1 0.0023080.020290.002308
ω 1 712.2712.2712.2
C 1 0.87052.2690.8705
A 2 0.0018860.0060240.001886
ω 2 633.1633.1633.1
C 2 −0.68463.088−0.6846
A 3 0.001060.0076350.00106
ω 3 142414241424
C 3 2.8013.0642.801
A 4 0.00073510.0029840.0007351
ω 4 1266.21266.21266.2
C 4 1.578−2.331.578
* 0 0.01180.0291−6.2602 × 10‒4
Table 6. Parameters of fuselage aerodynamic coefficients.
c d c l c m
A 1 0.0033860.0058540.0005346
ω 1 124112411241
C 1 −1.9970.5062−2.171
A 2 0.0006490.0020340.0001888
ω 2 248124812481
C 2 −2.572−0.39323.229
A 3 0.0013520.00098020.0001064
ω 3 111611161116
C 3 −2.5580.44081.01
A 4 0.00050380.00072086.744e-5
ω 4 223337223722
C 4 −2.787−1.1412.266
* 0 0.0322−0.0209−0.0025
Publisher’s Note: MDPI stays neutral with regard to jurisdictional claims in published maps and institutional affiliations.

