1. Introduction
The development of autonomous air vehicles with distributed engine control systems is one of the current trends in aviation. A review of system capabilities for future development with a focus on critical path planning and safety controls is presented in [
1]. An architecture that is open and easily adaptable for various types of vehicles must be provided, while the implementation of new technologies requires the validation of sensing techniques in harsh conditions such as those existing in an engine core, particularly in the combustor–turbine section. Sensing techniques are being widely and intensively developed, which additionally stimulates research on flow structure, affecting the evolution of pollutant emissions within the HPT stator [
2], and thermal loading in the engine’s hot sections.
The design of modern gas turbines is driven by the requirements of lower fuel consumption and efficiency improvement, which enforces operation at high speeds and temperatures. One of the critical aspects in engine cores is the combustor–turbine interface, where emissions are created, maximal thermal loads exists, and the highest efficiency is required while the flow structure is highly non-uniform. The high uncertainty in predicting combustor–turbine interactions leads to the application of increased safety margins in the design process. Therefore, a better understanding of this interaction is essential to maintaining service life while optimizing high-pressure turbines (HPT) together with lean-burn combustion chambers.
Today, the design of a system is still often divided into two steps. As the first step, the combustion chamber is designed, resulting in a flow parameter and temperature distribution at the outlet as shown by [
3,
4]. Then, the turbine is designed according to the boundary conditions defined at the combustor–turbine interface [
5,
6]. A disadvantage of this approach is a very weak interaction between the combustor and the turbine, which is recognized to have an important effect on the durability and performance of the first stage of the gas turbine. The influence of combustor exit flow on the turbine has been widely investigated by turbine designers [
7]. It was shown that non-uniform temperature and flow distributions may significantly reduce turbine durability [
8]. The presence of a localized hot streak upstream of the turbine increases the heat transfer on the vane suction and pressure side if compared with a uniform inlet temperature profile.
On the other hand, if the combustor chamber and turbine are considered separately, the potential effects induced by the vanes on the combustor exit flow field are taken into account. It has been shown by the numerical simulations in [
9] or [
10] that the blockage effect due to the existence of the NGV may affect flow quantity distribution upstream in the turbine. It was concluded that the velocity field is influenced by the NGV up to a distance of one axial chord length in front of the stator’s leading edge, while the temperature distribution is only slightly affected in the rear part of the combustor.
The analysis of a steady, low velocity coupled combustor–turbine configuration carried out by [
11] also shows the influence of the presence of the NGV blades on the combustor field upstream of the blade’s leading edge, inside the last part of the combustor. It was also concluded that the prediction of turbine performance was dependent on the methodology applied, whether that was a coupled simulation or a more standard uncoupled simulation that typically relies on one-dimensional inlet radial profiles. Moreover, the hot streaks are only partially mitigated by the stator blades, and they migrate toward the pressure side of the rotor blades. Although the results presented by these authors are related to the interaction between the combustor and the nozzle guide vane (NGV), no effect of hot spot circumferential location was investigated.
A great amount of experience has been developed over the years by aircraft engine companies, and different test facilities are available to investigate combustors and turbines separately, both in industry and academia. There was no test rig available for detailed investigations of interactions including the hot streak clocking effect. Such a gap in the knowledge drove our idea to build a test stand, providing us with an opportunity for experimental and numerical investigations, and the two test sections were developed within the framework of the European Project FACTOR (full aerothermal combustor–turbine interactions research) at the German Aerospace Center (Deutsches Zentrum für Luft—und Raumfahrt, DLR) in Goettingen and at the University of Florence. The DLR test rig is a large facility including a combustor simulator and turbine stage, while at the University of Florence a tri-sector rig (three swirlers and six nozzle guide vanes downstream) is available. In both cases, measurements were carried out in a combustor simulator representing the typical outlet profiles of modern low NOx combustion chambers, but operating without combustion to enable precise flow field measurements. In [
12] is presented the LES of the FACTOR configuration, highlighting significant effect of the hot streak relative position to the NGVs on the thermal field around the vanes. The hot streak location in front of a vane’s leading edge or upstream of the passage between two adjacent vanes considerably affects the heating up of the NGV walls and the temperature field at the stator exit. It was also found that the NGV potential effect does not alter temperature patterns, while a significant radial and azimuthal mass flow redistribution was observed up to about 25% of the axial chord length upstream of the vanes.
The investigations for this configuration reported by [
13] show the limitations of the standard method of designing a turbine by using a constant inlet profile rather than combined combustor–turbine models. This study concluded that the difference in mixing processes is quite considerable, as the combustors generate a pulsating flow with high frequency. On the other hand, it is known that LES (large-eddy simulations) predictions of swirling flows in combustors are more accurate than the RANS (Reynolds Averaged Navier–Stokes) method. Numerical investigations of the combustor simulator with LES have shown very good agreement with the measurements and have a proven ability to reproduce the flow field in such a configuration [
14]. An extensive study of the turbulence model on the Large-Scale Turbine Rig was presented by [
15]. It was shown that the use of scale-adaptative simulation (SAS) enables the improvement in the prediction of the complex, unsteady flow structures produced by the swirler. One has to bear in mind that both LES and SAS are computationally demanding. In the paper, the results of the RANS simulations for the combustor simulator and the NGV for the two azimuthal locations are presented. The prediction of the NGV potential effect on the combustor–turbine interface and the clocking effect on the hot stream location in the NGV cascade are discussed. In the first part, numerical simulations are compared with experimental data (University of Florence) for a combustor simulator without NGV.
2. Experimental Apparatus and Measurement Technique
The experimental characterization was carried out at the University of Florence on a non-reactive test rig including 3 swirlers. It reproduces 3 out of 20 sectors of the DLR full annular combustor simulator. The three-sector configuration was designed to make the central sector, the object of all measurements, insensitive to the presence of the rig lateral walls. As the goal at this stage was to experimentally evaluate the flow field evolution through the combustor simulator and the characteristics at its exit, the test rig was not provided with vanes and blade cascades. More details on the rig design and the numerical verification of this aspect can be found in [
16]. A picture of the test rig, as well of a sectional view, aimed at highlighting the different components, and a focus on the measurement area at the combustor exit, are shown in
Figure 1.
The test rig design was aimed at recreating the typical characteristics of modern lean-burn aero-engine combustors, in terms of flow field evolution inside the chamber and resulting aerothermal and turbulence field at the combustor exit. For this reason, the test rig is equipped with many typical features of this kind of combustor, such as effusion cooled liners and a main-to-coolant mass flow split of 65–35%; detailed information about BC is available in
Table 1. Moreover, the chamber presents a rather short axial length, with a strongly converging inner liner to match with the shape of the annulus in the NGV virtual position. In order to enable precise flow field measurements, there is no combustion, and it is called a combustion simulator. The main flow is heated up to the target temperature and enters the chamber through three axial swirlers of diameter 63 mm, featuring 30 flat vanes. The design objective was to create an engine-representative flow field evolution in the absence of the combustion process. In order to confine and preserve the required hot streak intensity at the chamber exit plane, ducts of 55 mm (approximately 1/3 of the whole chamber length) were installed downstream of the swirlers. Inner and outer annular liners are composed from the multi-perforated laser-drilled walls through which the coolant flow is supplied. Annular cavities outside liners act as plenum chambers.
The operating conditions were chosen to achieve representative conditions, in terms of relevant non-dimensional values, at the combustor simulator outlet; they are summarized in the following table:
The test rig is provided with instrumentation access on plane 40, the nominal combustor–turbine interface plane located 42.5% of the axial chord upstream of the virtual position of the vane’s leading edges. The virtual position of the vanes is defined according to DLR configuration. In order to characterize the flow characteristics in this plane, different kinds of probes can be used with an automatic traverse system mounted on the flange showed in
Figure 1 (right picture, grey component). In particular, a five-hole-probe campaign [
17] and a hot-wire-anemometry campaign [
18] were carried out in order to check that the rig was able to re-create lean combustor representative flow features at its exit. Both campaigns confirmed the pursued goals, as a significantly non-uniform temperature pattern, within a highly swirling flow, was found on plane 40. The hot-wire investigation also revealed the presence of a highly turbulent spot (Tu up to about 30%) in the centre of the swirling structure, as is typical for this kind of combustor. In the following paper, only the results from the five-hole-probe investigation are shown and compared with CFD findings.
The five-hole probe Aeroprobe 13049-1, equipped with a J-thermocouple, was adopted to characterize the aerothermal field at the combustor exit. The expected uncertainty stayed at 0.4° for flow angles and 0.8% for Mach number measurements. The temperature readings of the thermocouple were affected by an uncertainty of about 0.5 K. As stated above, the probe was driven by an automatic traverse system on a pre-defined measurement mesh with a resolution of about 2 mm in the radial direction and 1° in the azimuthal one. For each mesh point, data were acquired at 2 kHz and averaged over a sampling period of 2 s. In order to prevent the probe from interaction with the rig walls, it was not possible to investigate the areas in a close proximity of the inner and outer walls. Due to the convergent (conical) shape of the inner wall and the cobra configuration of the probe, about 6 mm had to be left unexplored (
Figure 1, focus on plane 40 area).
3. Numerical Model Description
Numerical simulations are carried out for the geometry (
Figure 2) defined according to the design simulations [
19] and the final test section configuration. In the paper, numerical simulation results are presented in two steps. The first one concerns model validation for the configuration without NGV (
Figure 2a), and the second, results for the combustor simulator and NGV (
Figure 2b). The numerical model is validated by a comparison with measurements [
20] carried out on a test section in the University of Florence (UNIFI). The effect of the nozzle guide vane relative position to the swirler on the flow structure is investigated by means of the geometry, as shown in
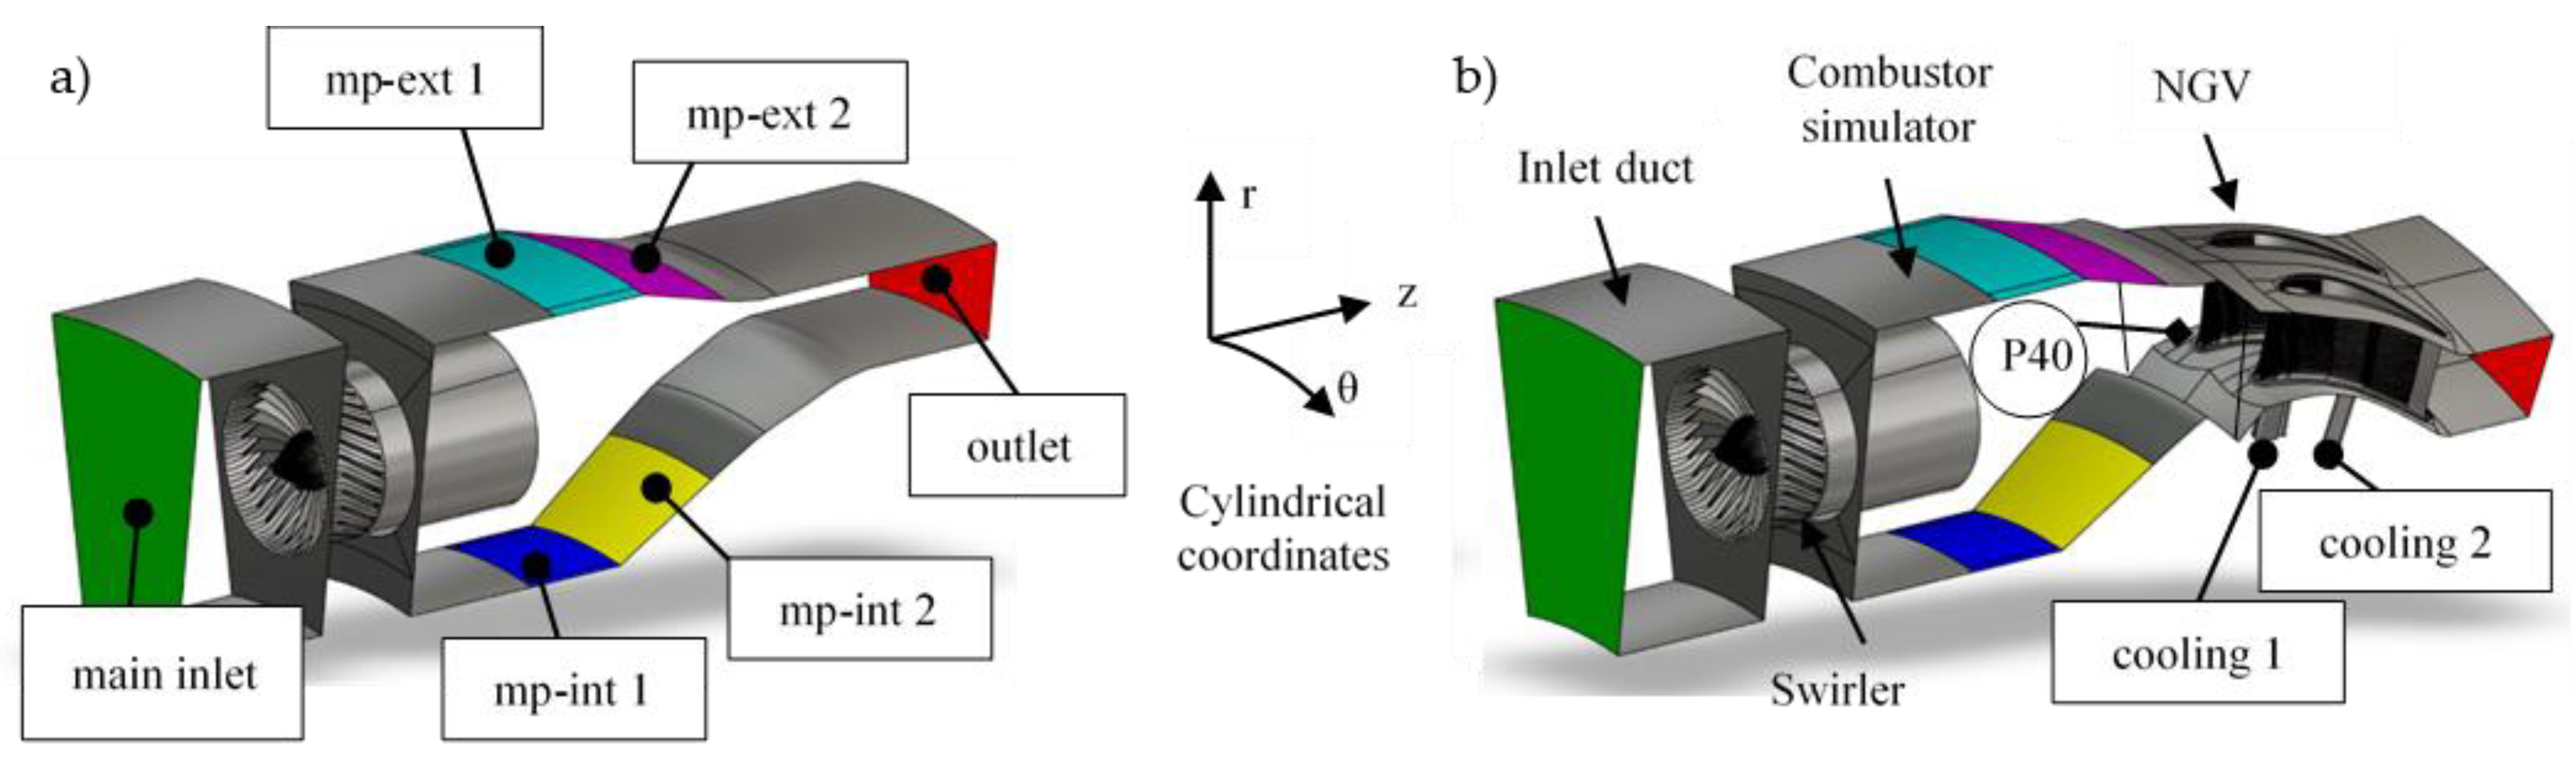
Figure 2b. The geometry of the combustor simulator includes a swirler with upstream (inlet) domain, a duct downstream of the swirler and multi-perforated walls on the external (ext) and internal (int) annulus. In
Figure 2, the main zones and surfaces of the computational domain are indicated. The flow within the combustor simulator is representative of a lean-burn chamber, with 65% of air mass flow in the mainstream and 35% used for effusion cooling. The hot air stream goes from the main inlet to the outlet through the swirlers and duct. The outlet location depends on the considered configuration, with or without NGV. The surfaces mp-ext and mp-int indicate the location of multi-perforated walls. Surfaces marked by “1” are cylindrical and conical by “2”. There are 2595 laser-drilled holes (diameter 0.5 mm) per sector on the outer liner and 1690 on the inner liner. They are inclined to the wall in plane zr only (coordinates in
Figure 2). The flow angle inclination to the wall is presented in
Table 2. Due to the huge number of holes, the uniform cooling flow distribution is assumed to simplify the numerical model.
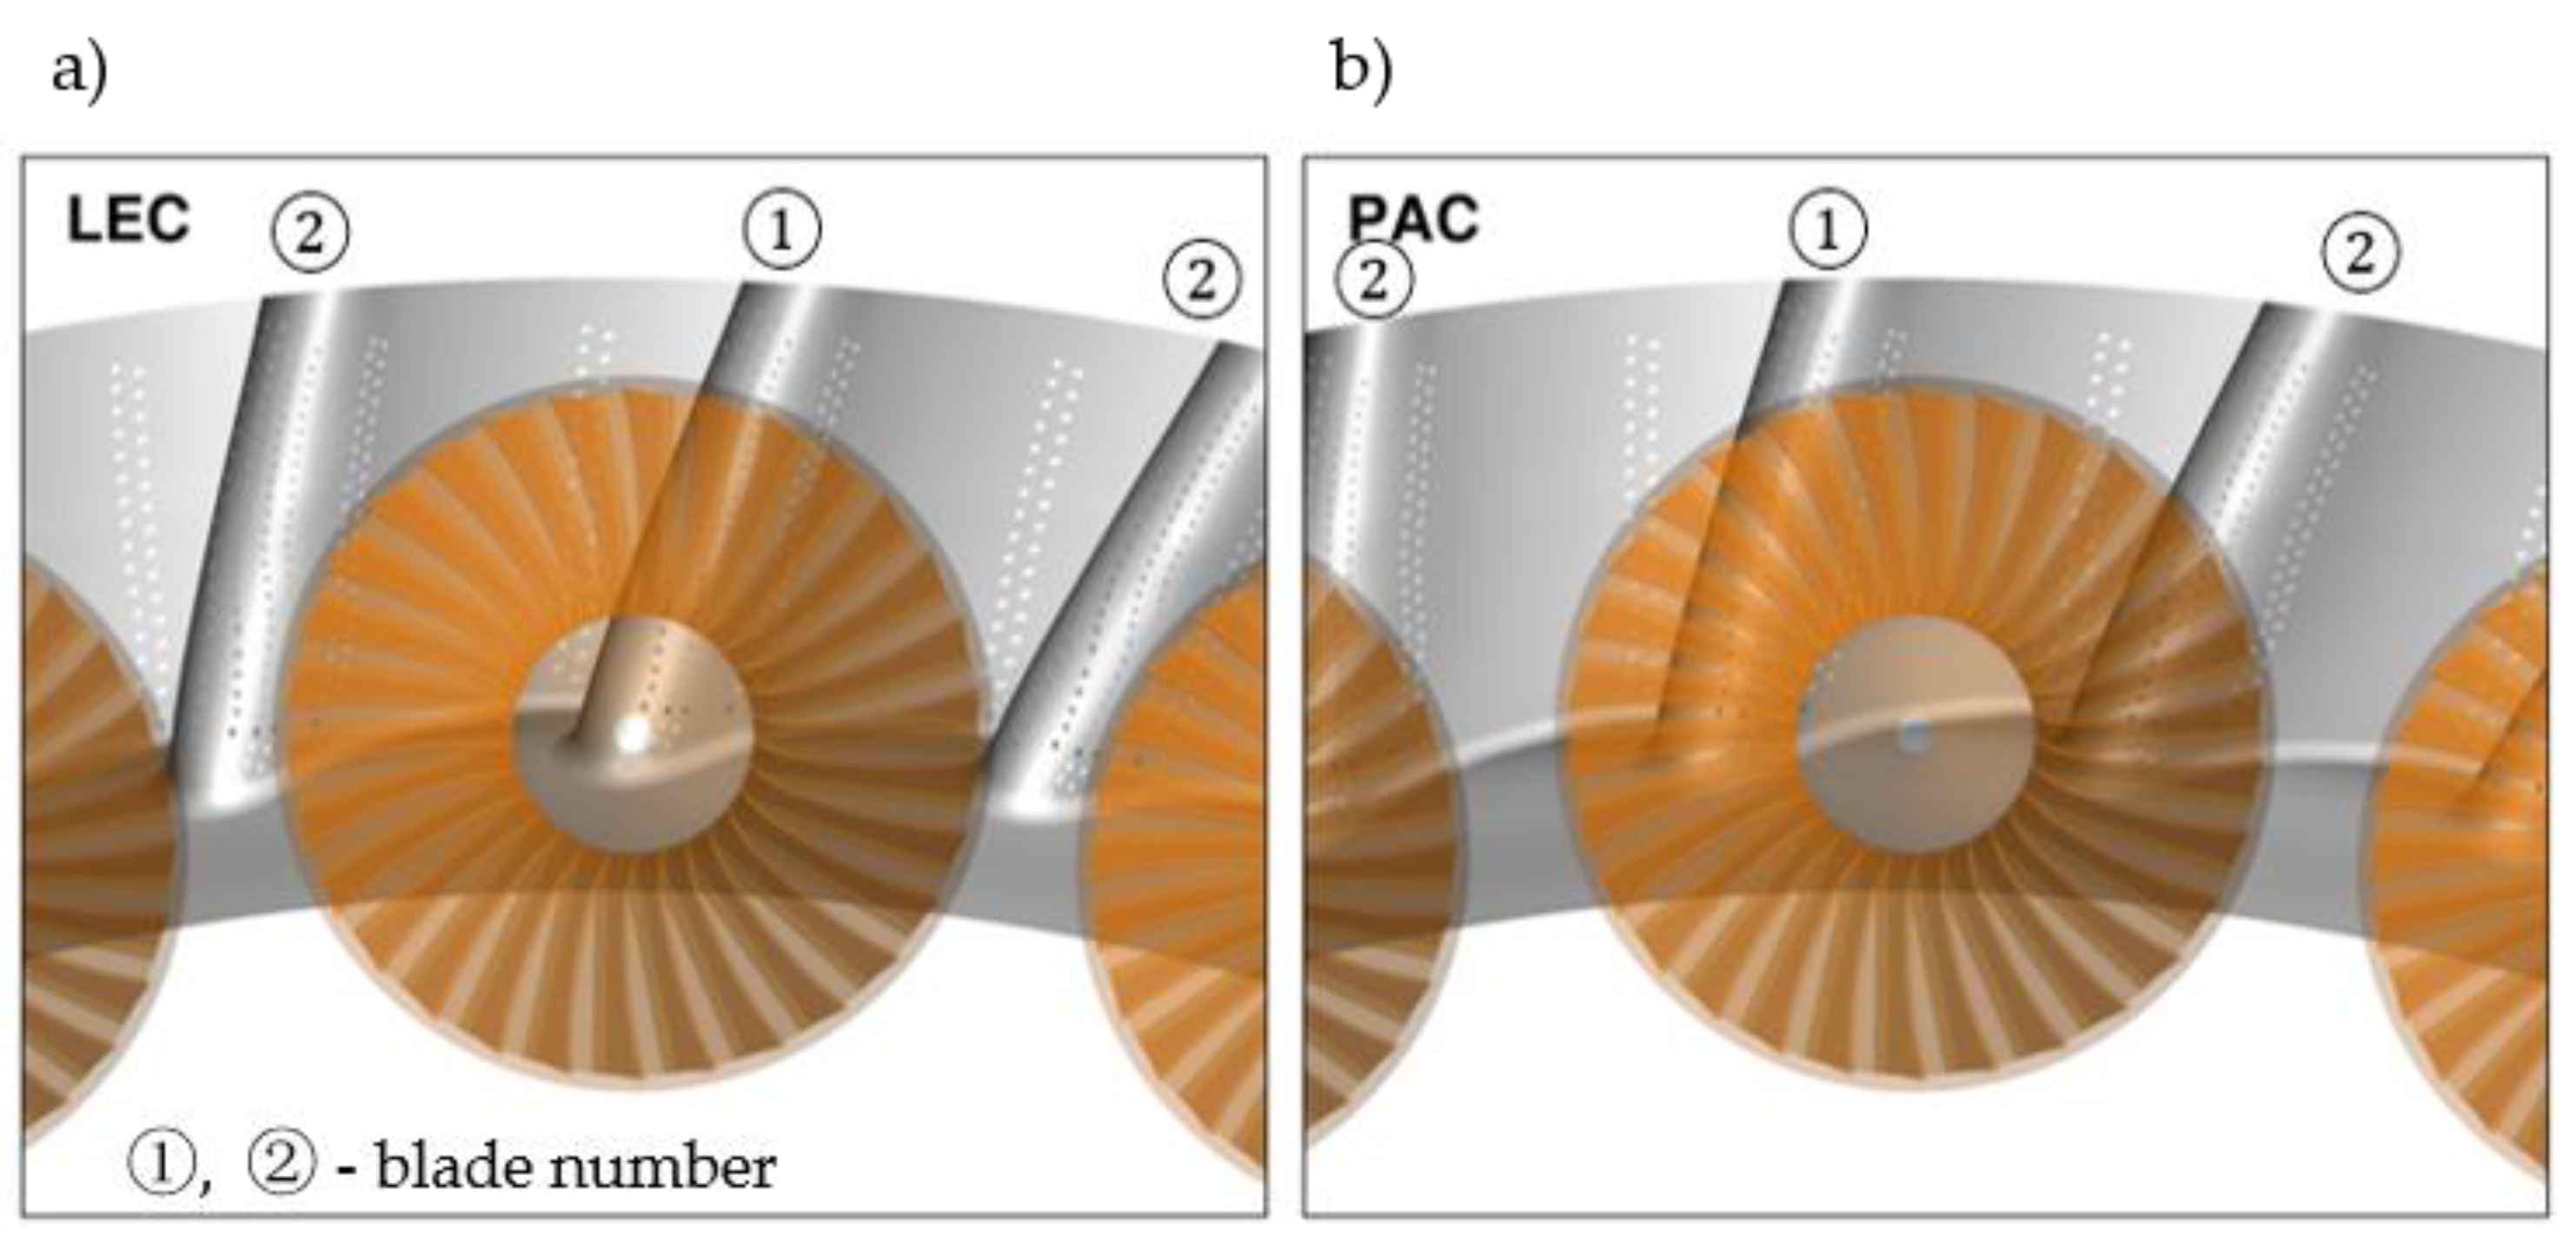
In the second step, the numerical simulations are carried out for the two limiting configurations, which differ to each other in the relative position of the NGV to the swirler (
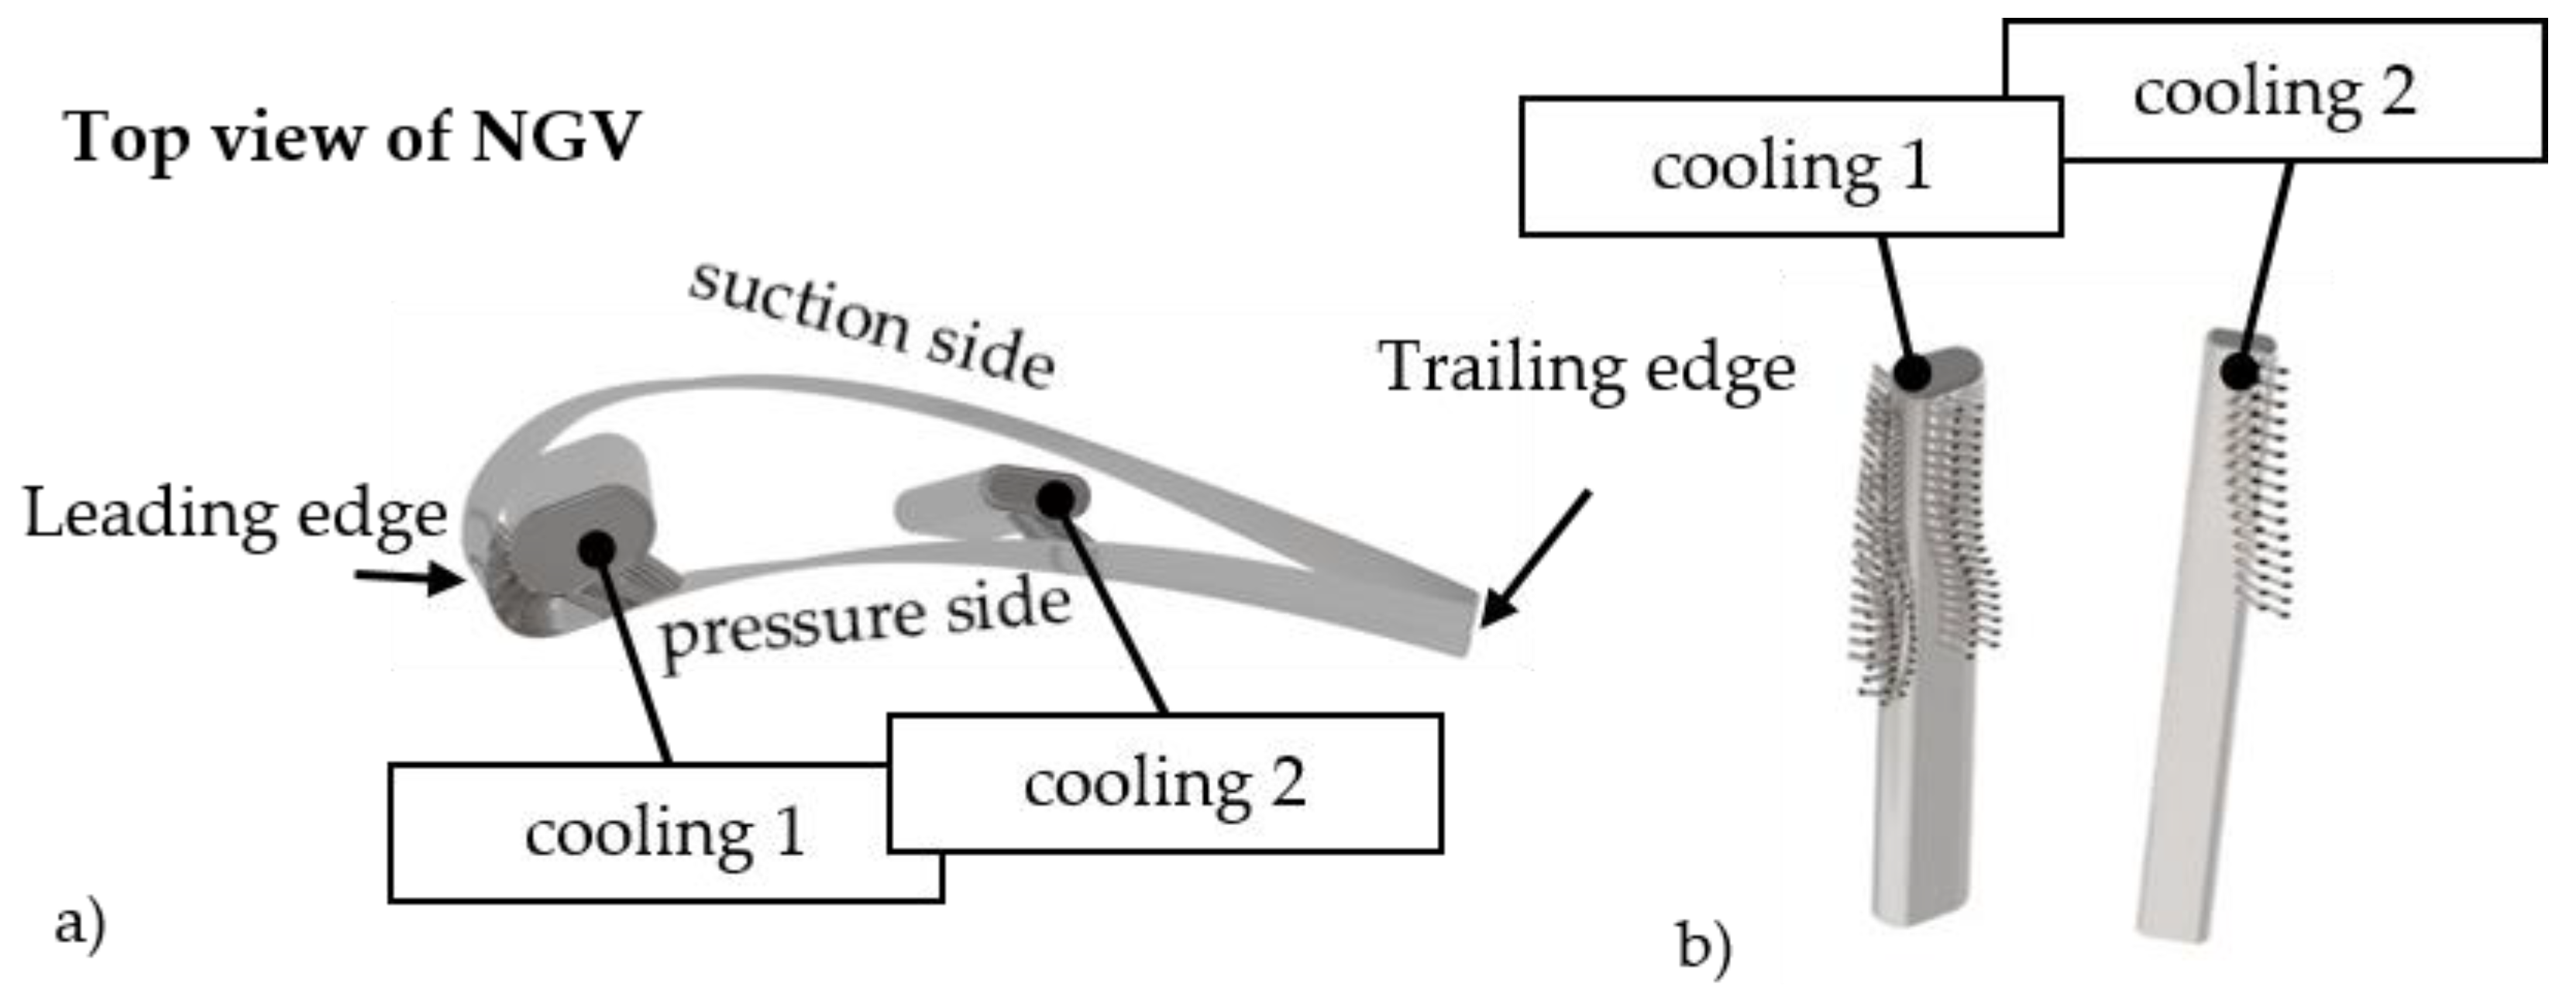
Figure 3): leading edge clocking (LEC) and passage clocking (PAC). In the first case (LEC), the leading edge of NGV 1 is located downstream of the swirler. In the second case (PAC), the swirler is located upstream of the NGV passage. At the FACTOR (DLR) test section, the number of guide vanes is twice the number of swirlers, and according to this configuration the computational model was created. The nozzle guide vane includes cooling holes (
Figure 4). The coolant is supplied by the plenum to cooling holes close to the leading edge and the pressure side closer to the trailing edge. At the leading edge (46 mm height), there are six rows, including in total 138 holes, while the two rows with 32 holes are on the pressure side.
Numerical simulations were carried out by means of Fine
TM/Turbo NUMECA, a block-structured, density-based, Reynolds Averaged Navier–Stokes code based on a finite volume method. In the case of the presented investigations, a central difference spatial discretization with Jameson-type artificial dissipation [
21] was applied, while for the temporal discretization, a four-stage explicit Runge-Kutta scheme was employed. In order to increase the convergence rate, the local time-stepping, implicit residual averaging and full multi-grid techniques were used in the solver.
The mesh was generated with IGGTM and AutoGrid5TM. The mesh size varied from 7.75∙10
6 grid cells for the combustor simulator only, up to 33.7∙10
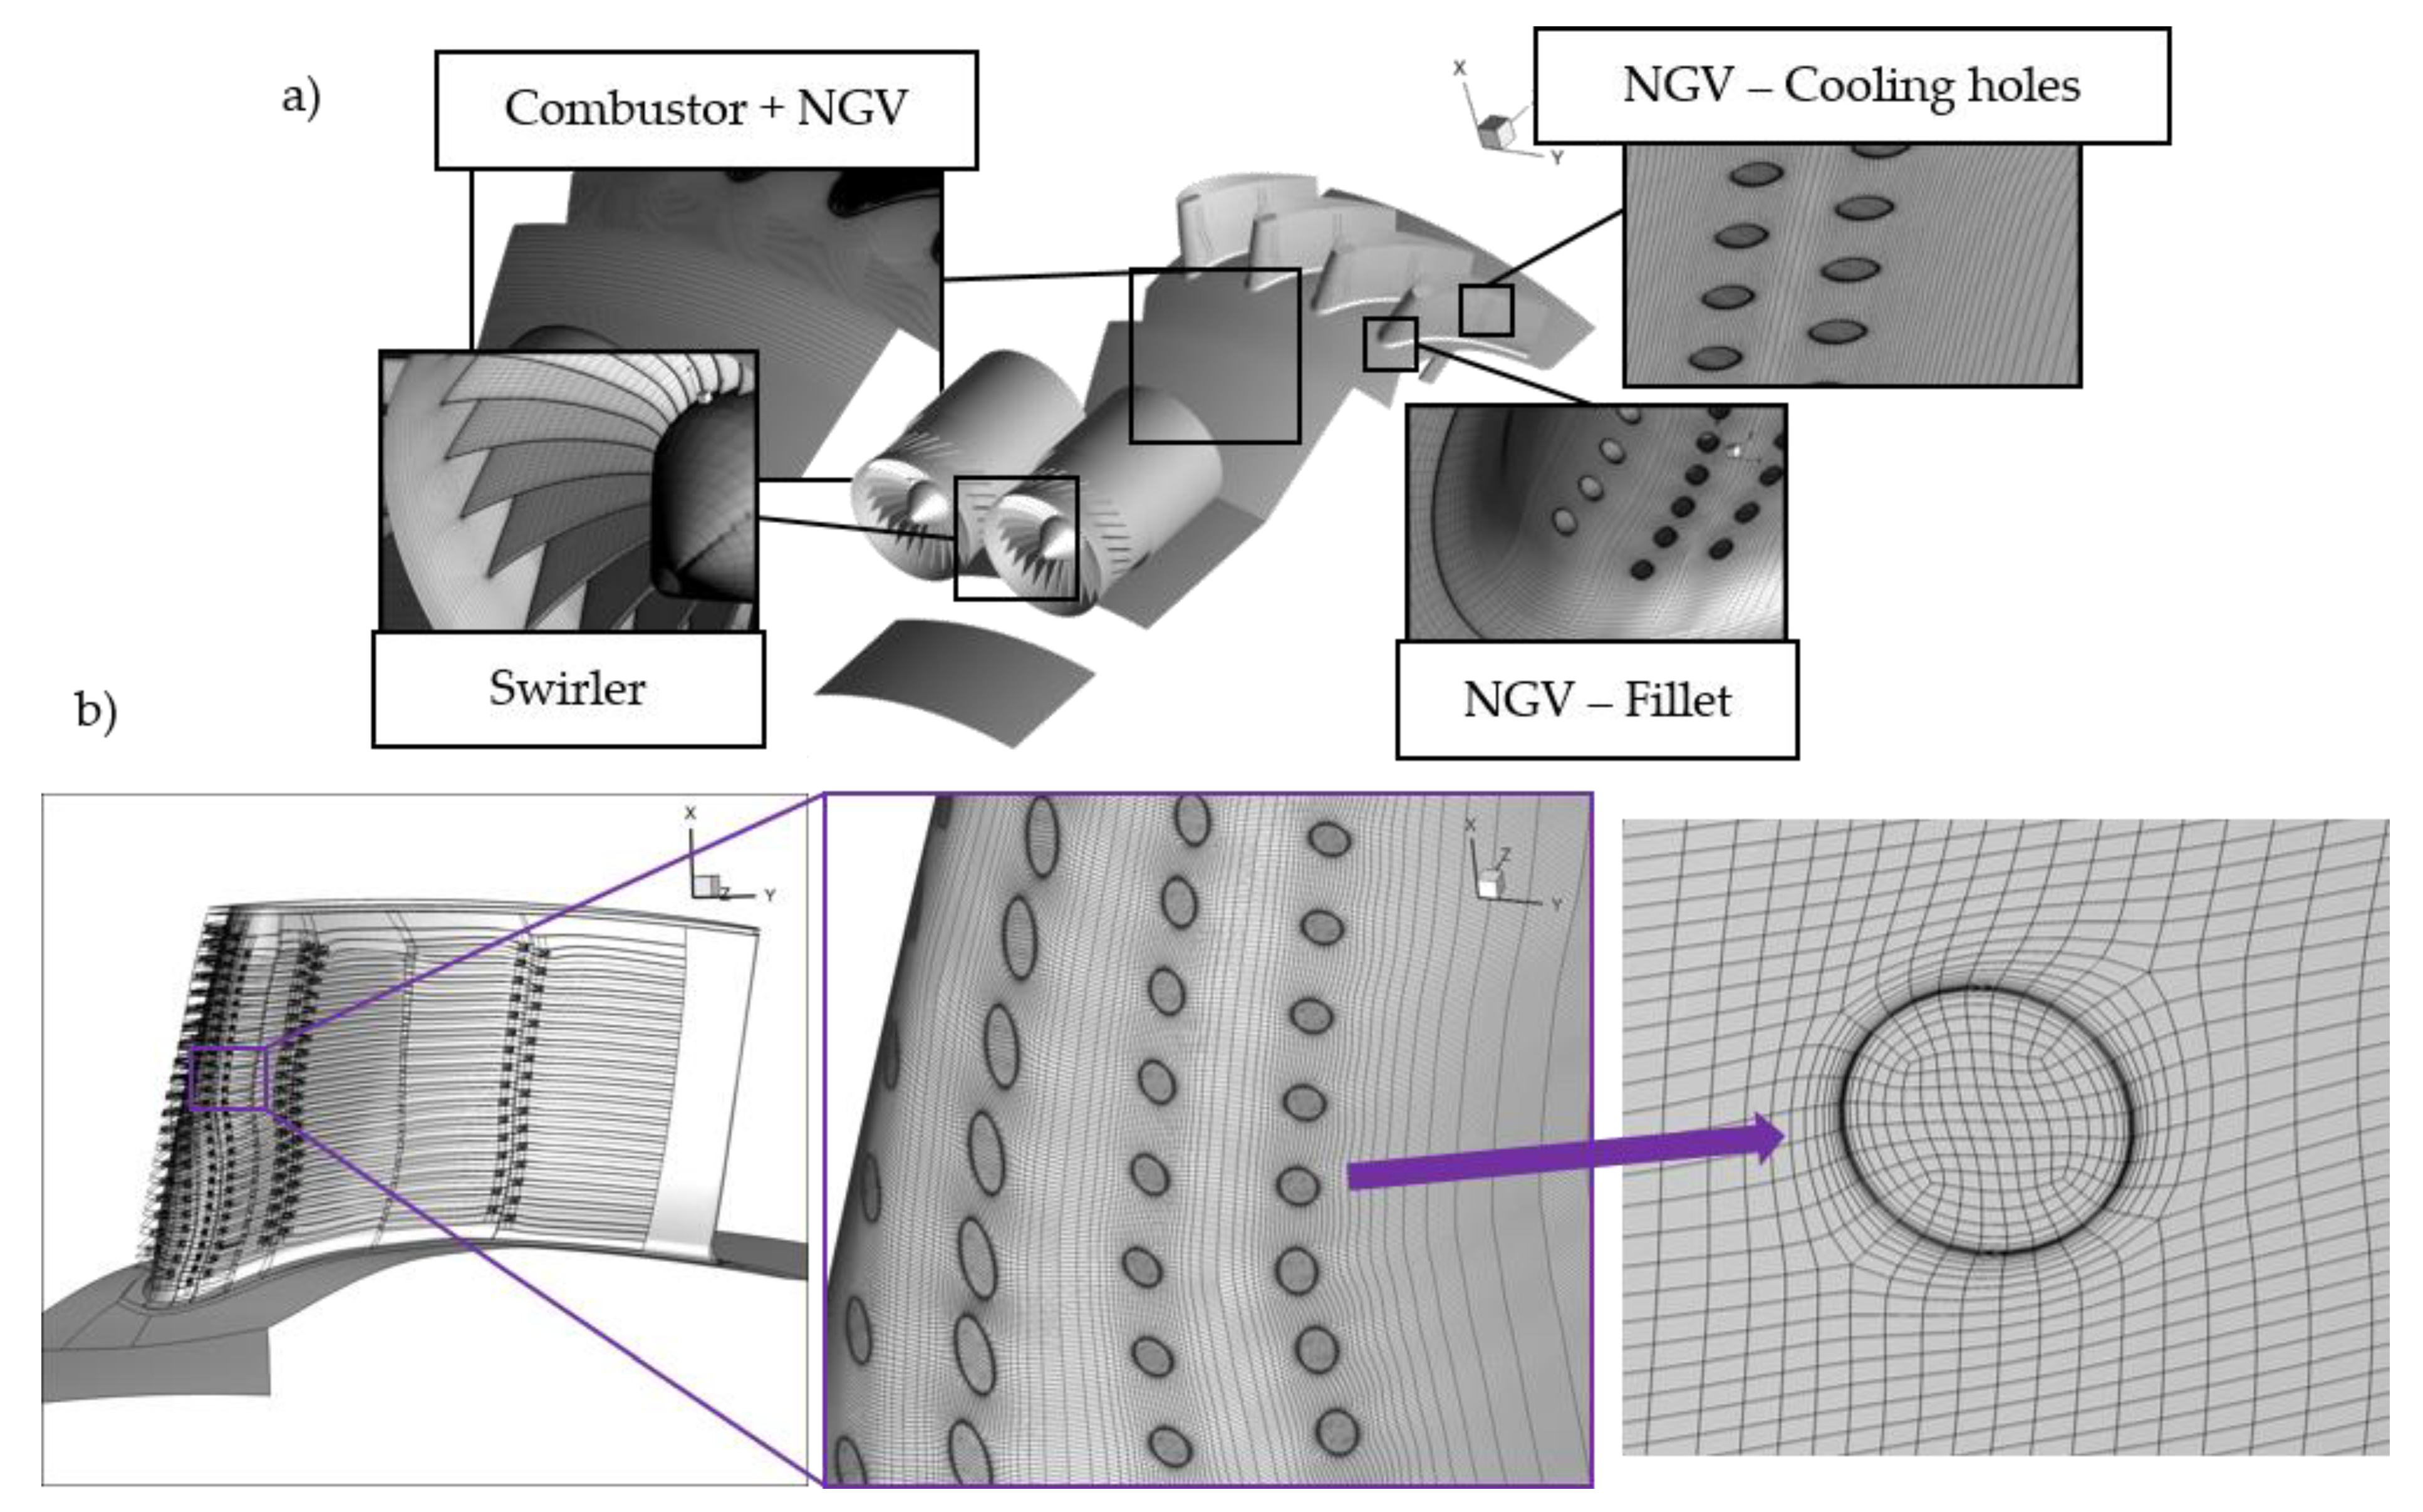
6 grid cells for the model including cooled nozzle guide vanes. The mesh was refined close to the solid walls in order to keep y+ below 1. The block-structured topology was applied with a non-matching connection defined at the following interfaces: inlet duct–swirler, swirler–combustor simulator, combustor simulator–NGV and in the NGV vicinity at the connection between the skin layer including holes and the outer zone in the passage. An example of a mesh for a swirler, a combustor and for NGV cooling holes is shown in
Figure 5. At the bottom, the block structure in the vicinity of the NGV cooling holes and the details of mesh topology in the hole are presented.
The results presented in the paper were obtained for Spalart–Allmaras (SA) and Explicit Algebraic Reynolds Stress Model (EARSM) turbulence models [
22,
23]. Boundary conditions were set according to the experimental data. At the inlet, the mass flow rate was set at 0.155 kg/s, together with a total temperature 512 K, turbulence intensity 1% and turbulent/laminar viscosity ratio 10. At the multiperforated walls, the mass flow was distributed uniformly at each sector. This simplified approach was applied due to the large number of small holes, which significantly increase the model size if all are meshed. The mass flow at each surface mp-ext or mp-int was set according to the combustor simulator design. The flow angle was defined according to the geometry and inclination of the drilled holes. The weakness of the uniform mass flow distribution on the multiperforated walls is a lack of a local jet at each hole, which affects the underpredicted velocity distribution close to the liners. In
Table 2, the ratio of mass flow at each sector to the mass flow at the main inlet is presented. There is also a flow angle indicating the cooling flow inclination to the wall.
In the case of configurations with NGV, additional cooling flow was applied, so additional boundary conditions have to be considered. At the inlet of each coolant plenum, the mass flow rate was set as 0.009 kg/s for plenum 1 and 0.0045 kg/s for plenum 2. The total temperature was 297.6 K, while the turbulence intensity was 1% and viscosity ratio 10.
The success of modelling a case using any technique that requires a discretization of phenomenon, such as coupling fluid (CFD) and structural (FE), depends strongly on the chosen mesh size. Consequently, a convergence study known as the Grid Convergence Index (GCI) was carried out in order to find the proper mesh size for this kind of computational model.
The Grid Convergence Method—GCI (based on RE [
24])—is a method to estimate the discretization error even when the successive mesh refinements are not integer multiples. This technique is defined as an error percentage, providing a confidence bound in which the numerical solution is likely to be.
The mesh sensitivity study was performed using the GCI method proposed by [
25] for the combustor simulator only. The mesh resolution was increased by 30% per level in the chamber downstream of the swirler. The control surface is defined at the plane P40 (combustor simulator—NGV interface). The total number of elements in this plane varies as follows: 12,393 (mesh 1—coarsest), 19,005 (mesh 2), 25,625 (mesh 3—finest). The area-averaged static pressure, total temperature and velocity magnitude were chosen as the monitoring parameters.
The apparent order
, approximate relative error
, extrapolated error
and grid convergence index GCI are presented in
Table 3, where:
—order of accuracy;
—coarse approximate relative error;
—coarse extrapolated relative error;
—coarse grid convergence index;
—fine approximate relative error;
—fine extrapolated relative error;
—fine grid rid convergence index.
Based on this study, we could say that the pressure in the control plane is predicted in the error band of 0.9% (
) for mesh coarse and 0.5% for fine mesh. A detailed description of the procedure is presented in [
25].
In the paper, mesh 2 is used, as this mesh resolution is enough for RANS simulations, and further refinement does not lead to significant differences in results.
The solution process was monitored by the residuum of density and velocity components dropped by six orders of magnitude, and additional parameters defined locally to track the solution. The mass flow was considered as the crucial parameter and the solution is considered as converged if the mass flow does not change by more than 0.05%.
4. Combustor Simulator—Numerical Model Validation
In this section, a comparison of numerical simulation results and experimental data for the combustor simulator is presented. As the measurements were performed for the combustor simulator only (no NGV), simulations were carried out for the domain presented in
Figure 2a. The measurement data were available in plane P40. In the case of simulations for the combustor simulator and NGV (
Figure 2b) presented in the next section, the interface between the two computational domains is defined at this location. It is an important aspect of this comparison, because it enables the assessment of the upstream potential effect of NGV.
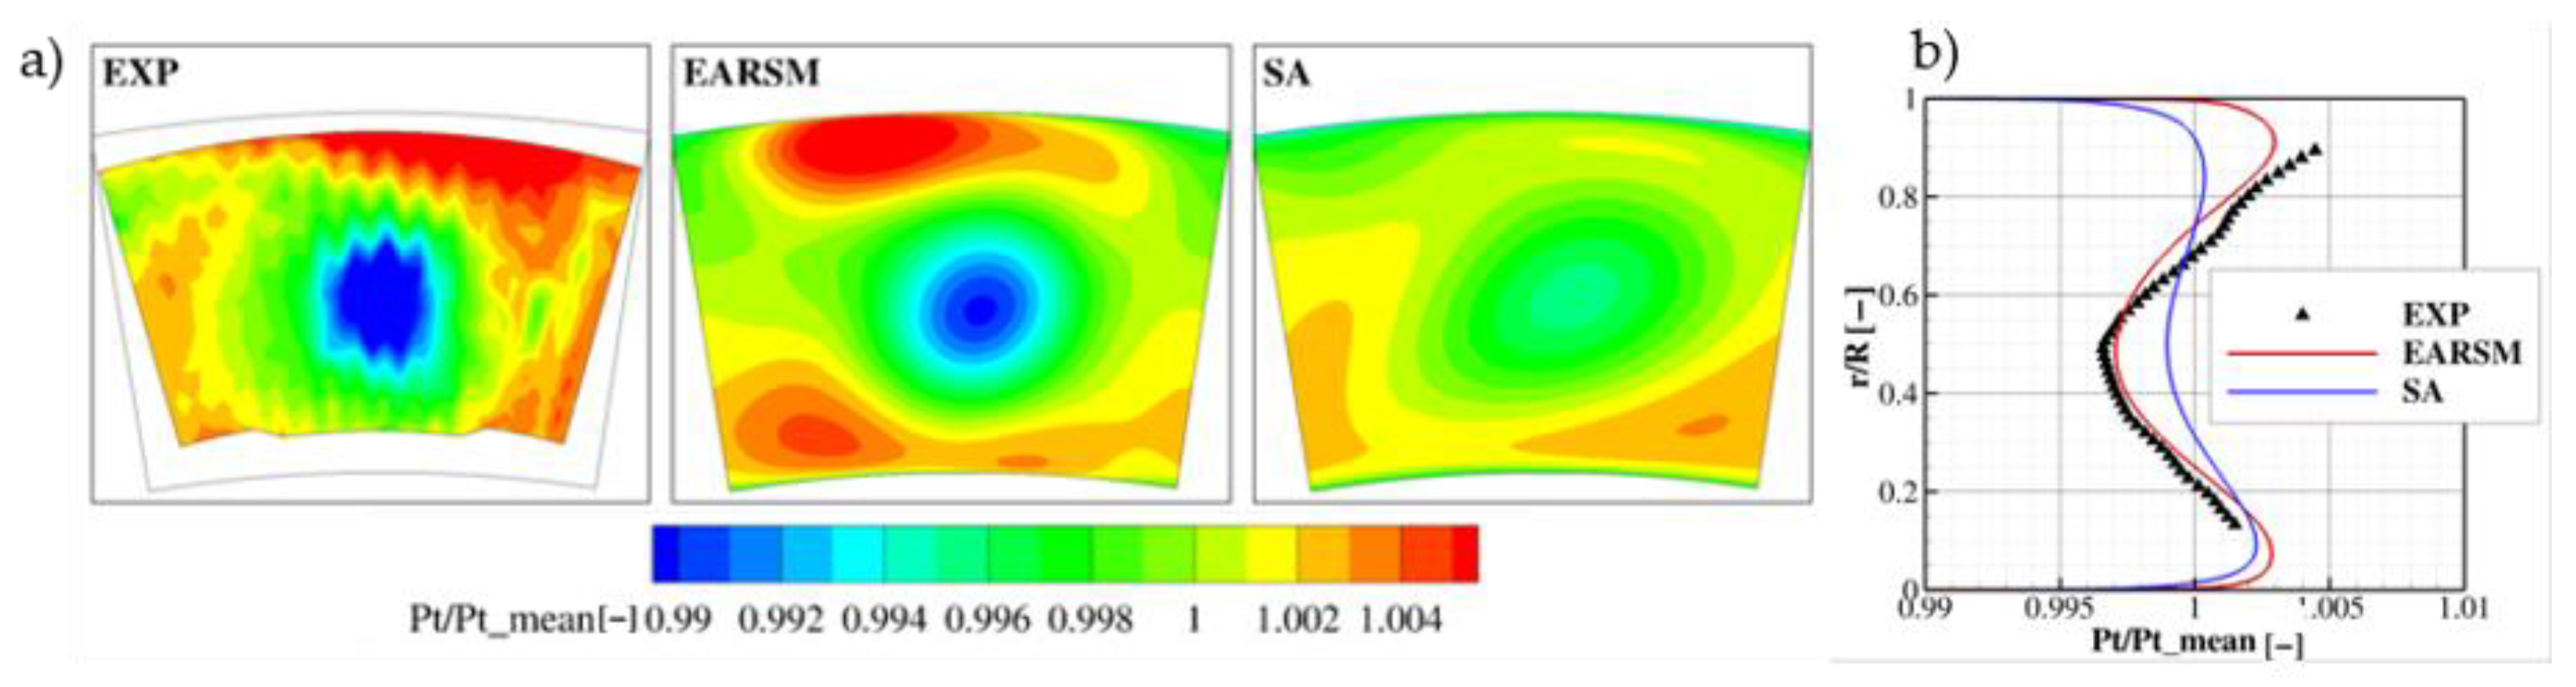
The distribution of total pressure normalized by the mean total pressure is shown in
Figure 6. One has to remember that due to the limited measurement access close to the liners, the experimental data are not presented up to both walls. A low-pressure area can be observed in the middle of the control plane, which arises from the wake generated downstream of the swirler. Moving away from the vortex core generated by the swirler, total pressure increases, reaching a maximum closer to end walls. The distribution is highly non-uniform and it is driven by the interaction of the swirling flow in the combustor middle zone, and the cooling flow ejected at upper/lower end walls and annular surfaces.
The Explicit Algebraic Reynolds Stress Model (EARSM) of turbulence better predicts the level of losses both in the vortex generated by swirler and outside. Additionally, it correctly predicts the minimum value as well as a circumferentially averaged pressure presented in
Figure 6b. In the case of the Spalart–Allmaras (SA) turbulence model, the distribution of these parameters is more uniform, which may result from a less accurate prediction of swirling flow. It is known that eddy viscosity models are much less effective than LES in the prediction of the complex, highly anisotropic and unsteady flow structures produced by the swirler. The EARSM model, which is an improved SST model, by taking into account anisotropic effects, shows better agreement with the measurements. The difference in total pressure distribution close to the liner is also affected by the simplified boundary conditions on this wall, where uniform mass flow distribution is applied to the multi-perforated walls instead of resolved flow in the holes.
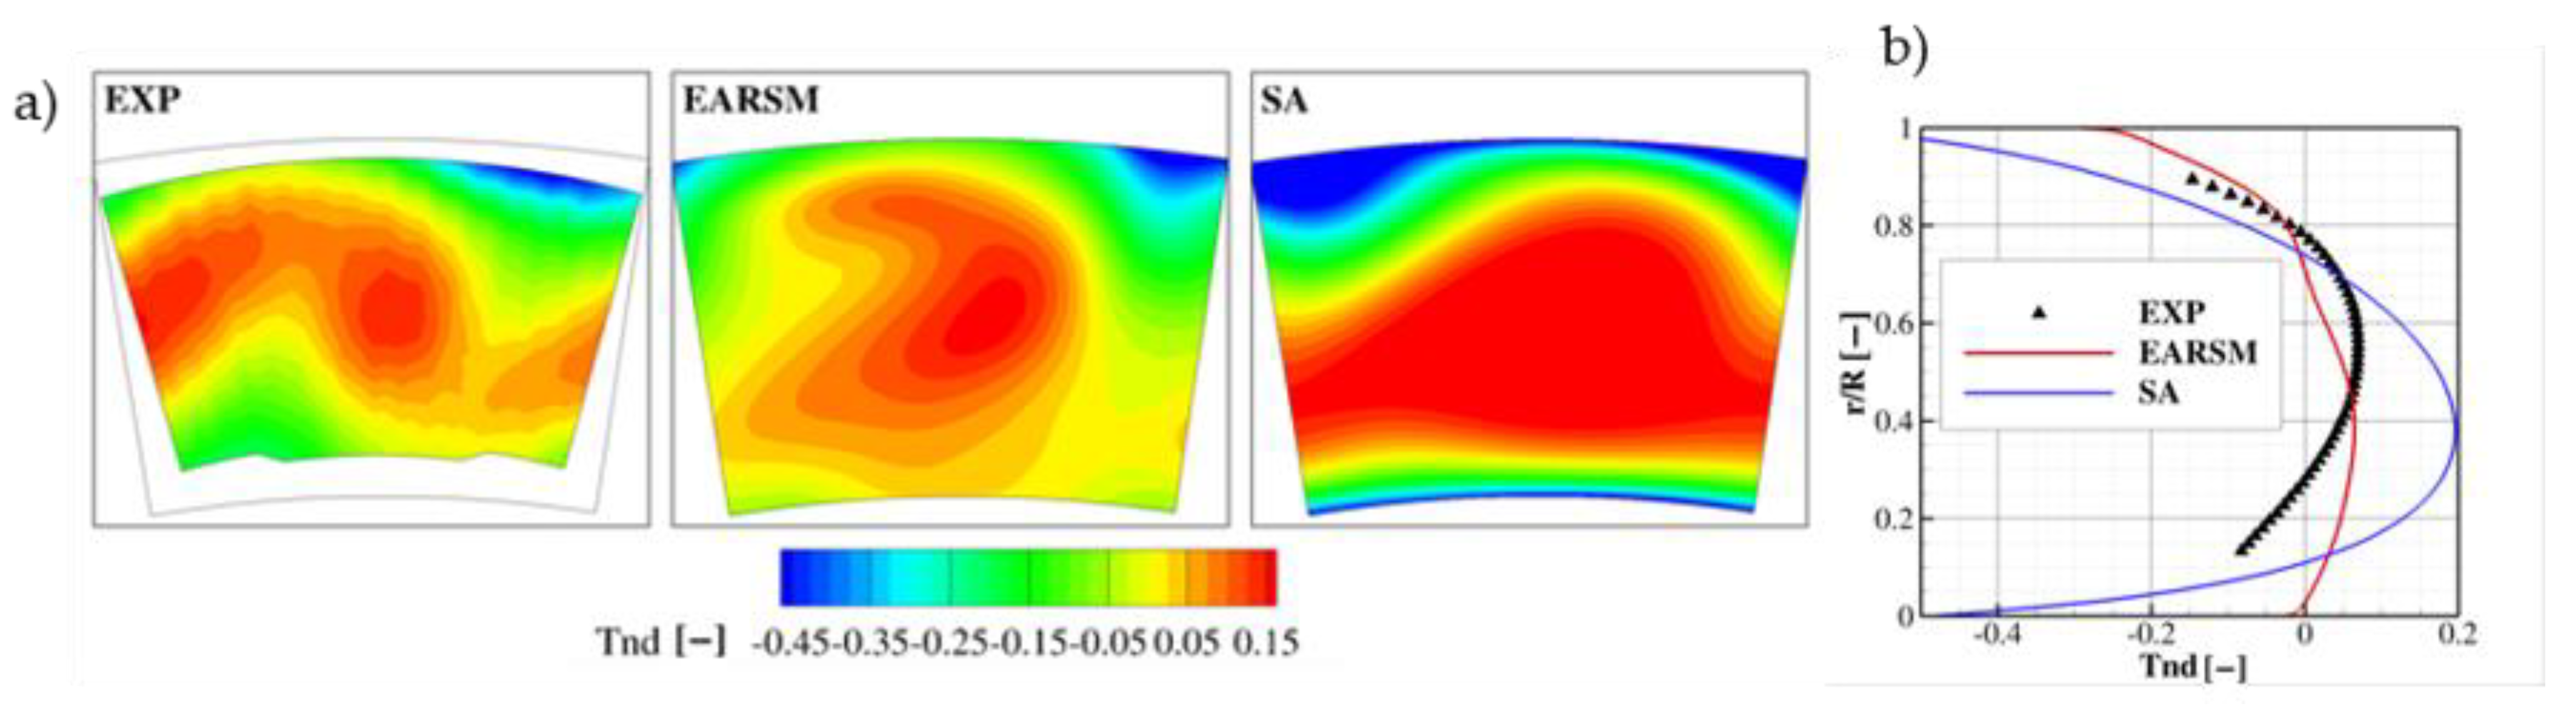
The non-dimensional total temperature shown in
Figure 7 was defined according to the following equation:
where
total temperature,
—area-averaged total temperature and
—total temperature of coolant supplied by multi-perforated walls.
The experimental data indicate that the test section including the duct downstream of the swirler enables investigations of hot streak transport directly to the combustor outlet. It is an important effect which needs to be modelled in this additional duct, as no combustion is considered and the temperature is much lower than in the real combustor. There are two zones where the temperature maximum can be seen (
Figure 7). The high temperature in the centre is an effect of the hot flow downstream of the swirler, while the zones at both sides arise from the presence of neighbouring swirlers. It should be remembered that the experimental data are presented for the three-sector rig limited by side walls.
Likewise, the total pressure of the EARSM turbulence model is closer to the measurements, and again, this is noticeable in the centre of the plane. Additionally, this model correctly predicts the areas with a local minimum. This may suggest that the predicted intensity of mixing inside the combustor simulator is closer to the existing in the test section. Much larger discrepancies are shown by the SA model. It can be observed that the hot air is transported further downstream than in experimental data, and the location of the total temperature maximum is closer to the internal annulus (multiperforated wall). It can also be clearly seen that the distribution of the temperature in close proximity to both annular walls (internal and external) is much lower than the measured one. This is confirmed by the circumferentially averaged temperature shown in
Figure 7b.
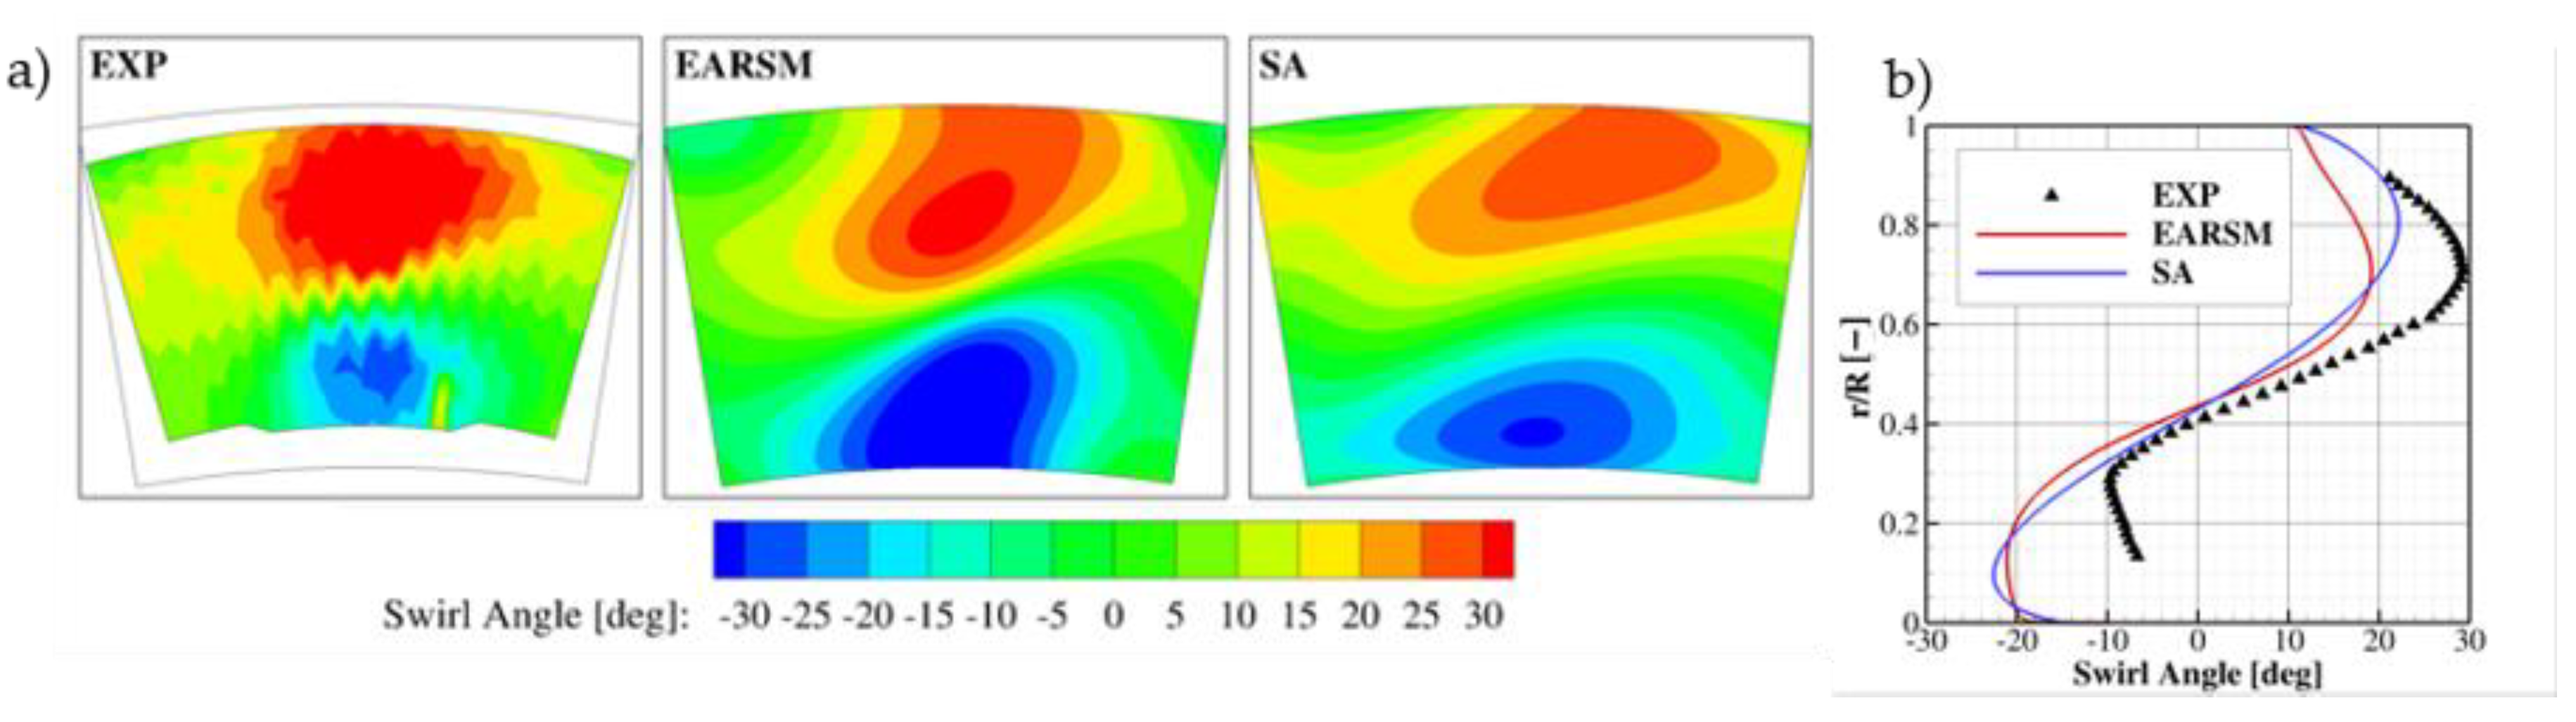
The total pressure and total temperature distribution are dependent on the flow kinematics. Below, swirl and pitch angle are presented in plane P40. Swirl angle, shown in
Figure 8, indicates that both turbulence models correctly predict its distribution only in the middle of the channel, in the centre of the vortex. The differences exist in the zones close to internal and external end walls. They may result from the simplification of the boundary conditions at multi-perforated walls in the combustor simulator, as mentioned above. Another reason for this difference could be the confined test section configuration. As it is a three-sector rig, the vortex generated by the middle swirler is neighboured by two vortices, which interact with the lateral walls. Such an interaction may have an influence on a weaker swirl transported by the side vortices and finally affect the lower swirl in the investigated zone. One should also note that the numerically predicted swirl distribution is more symmetric than the measured one. The measured swirl angle varies in range between −10° and +30°, while the numerically predicted range is −22° and +20° (EARSM) or 24° (SA).
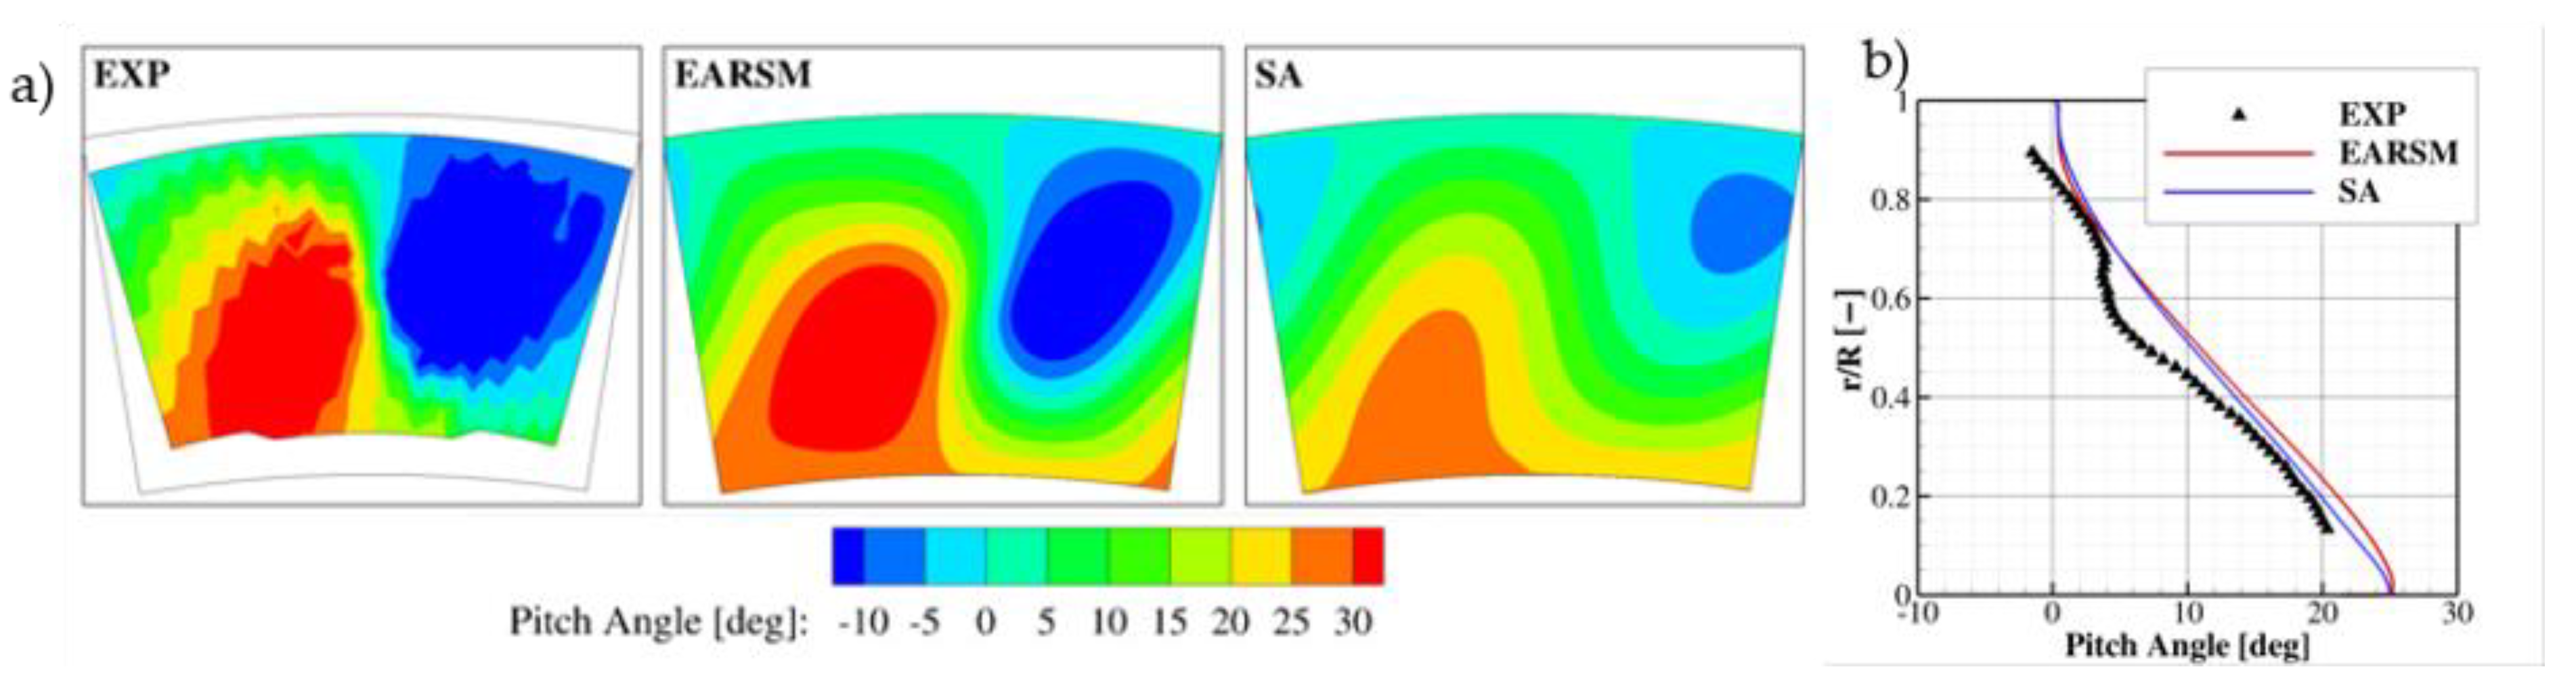
Finally, the pitch angle distribution confirms the earlier observations that results with the EARSM model are closer to the measurements (
Figure 9). The zones with the positive (red) and negative (blue) pitch angle are closer in size and magnitude to the experimental data. The agreement is well presented by circumferentially averaged pitch angle (
Figure 8b). This means that the ratio of radial velocity component and velocity magnitude is quite well predicted by the EARSM turbulence model.
The complex geometry of the combustor simulator creates a strongly three-dimensional flow structure. Applying simplifications of the existing test section and replacing the multi-perforated walls with a uniform mass flow distribution affect the flow quantity distribution close to the end walls. It is also somehow affected (unfortunately, no more details are available at this stage of research) by the reduction in the computational domain to one sector only, with applied periodic conditions at the side surfaces. As a consequence, the flow angle distribution in the end wall zones shows under- or overprediction. The results obtained with the EARSM model can be considered as consistent with the experimental data, which allows us to apply this model in the next step of investigations and to analyse the interaction of the combustor and NGV with a focus on the effect of the swirler and the nozzle guide vane relative to the azimuthal position.
One should underline that the numerical model is validated for the combustor without the NGV. However, as presented in the next section, the upstream effect of the NGV at this location is very weak, and the distribution of the flow quantity is weakly affected by cascade.
5. Potential and Clocking Effect
In this section, numerical investigations of the combustor–NGV interaction for two clocking positions (LEC and PAC) are presented. Simulations were carried out for the domain, as shown in
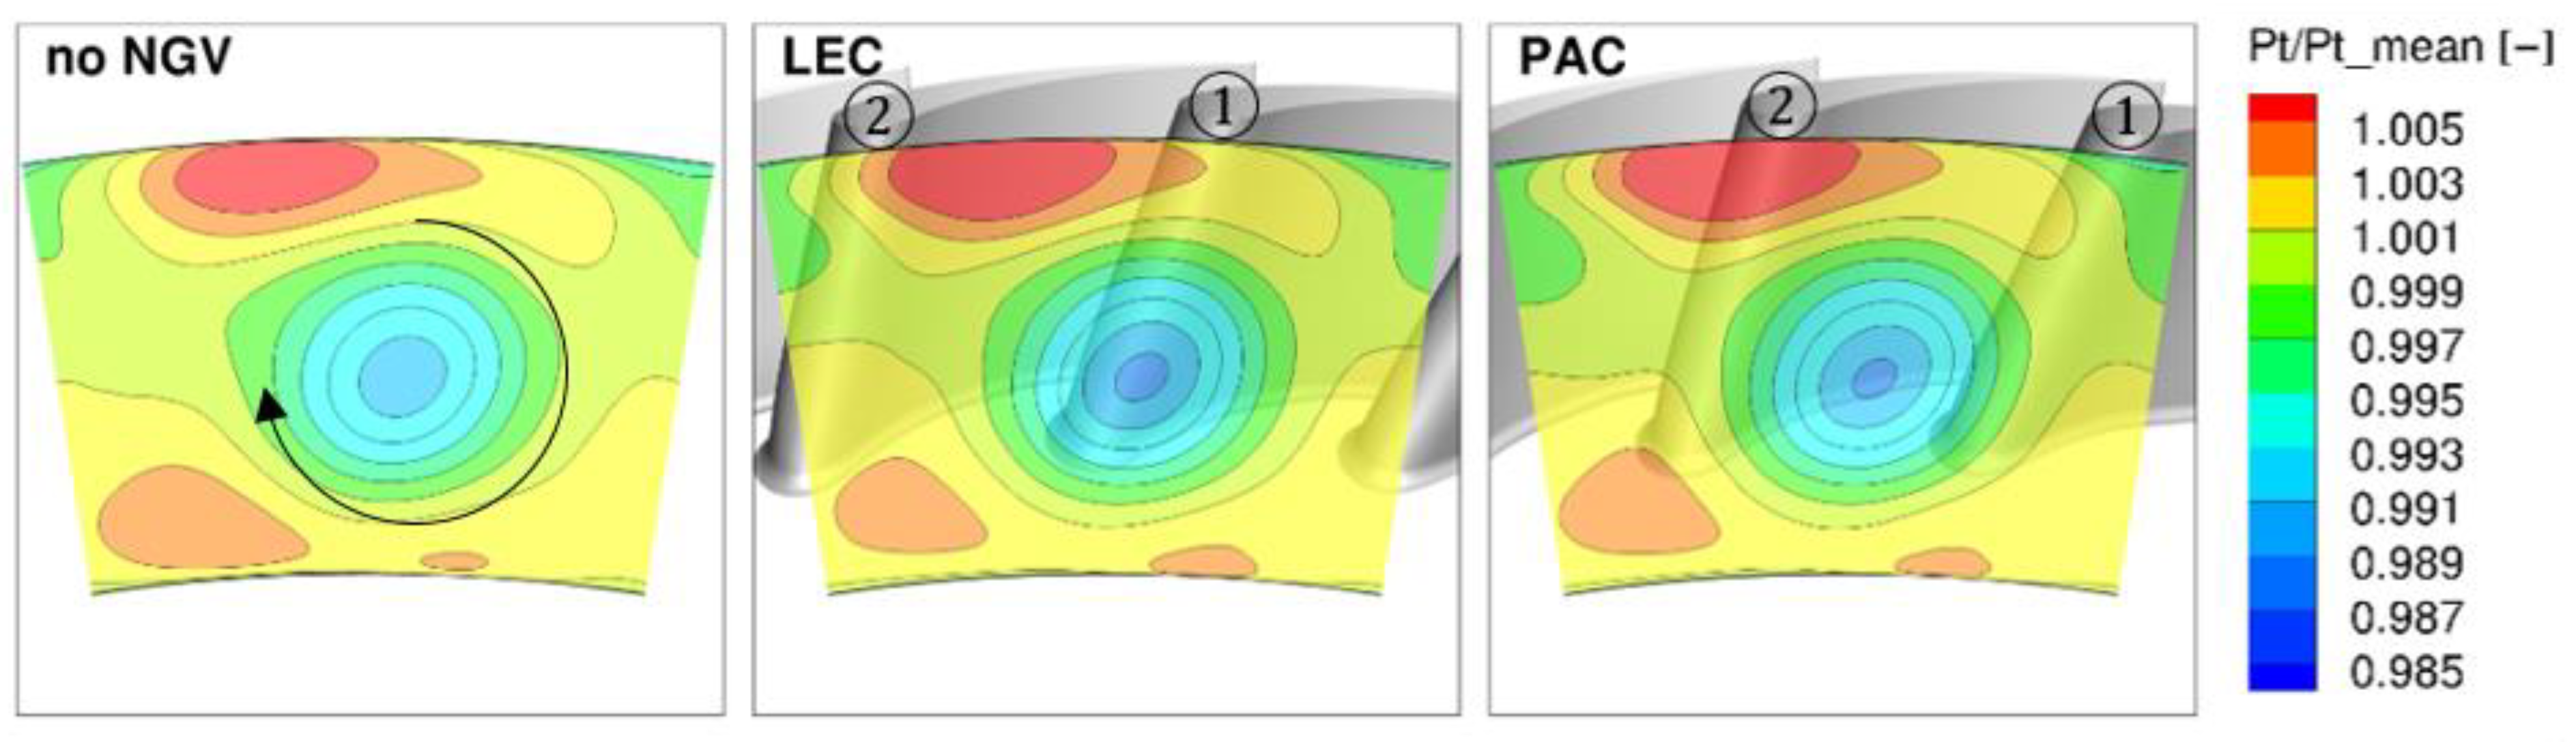
Figure 2b. Firstly, a potential effect of the NGV on the flow field in the combustor can be assessed by comparison of the total pressure and total temperature in plane P40. In
Figure 10, the normalized total pressure is shown for three cases: no NGV—already presented above, LEC and PAC—representing the two limiting circumferential locations of the NGV downstream of the swirler. One can notice a weak upstream effect of the NGV on the total pressure distribution in plane P40, which is located 42.5% of the NGV axial chord in front of cascade. This is consistent with the LES results for the FACTOR configuration presented by [
12], who state that a significant impact is seen up to 25% of the axial chord. The azimuthal NGV position has an insignificant effect on the total pressure distribution in plane P40.
Some differences can be found if one compares the non-dimensional temperature distribution in this plane (
Figure 11), but again, the azimuthal position of the NGV does not significantly affect the temperature at this axial location. Nevertheless, the main flow features are very similar in all cases, with and without NGV. The shape of high-temperature zones is a result of a clockwise vortex generated by the swirler. The rotation direction is indicated by the black arrow in the contour plot in
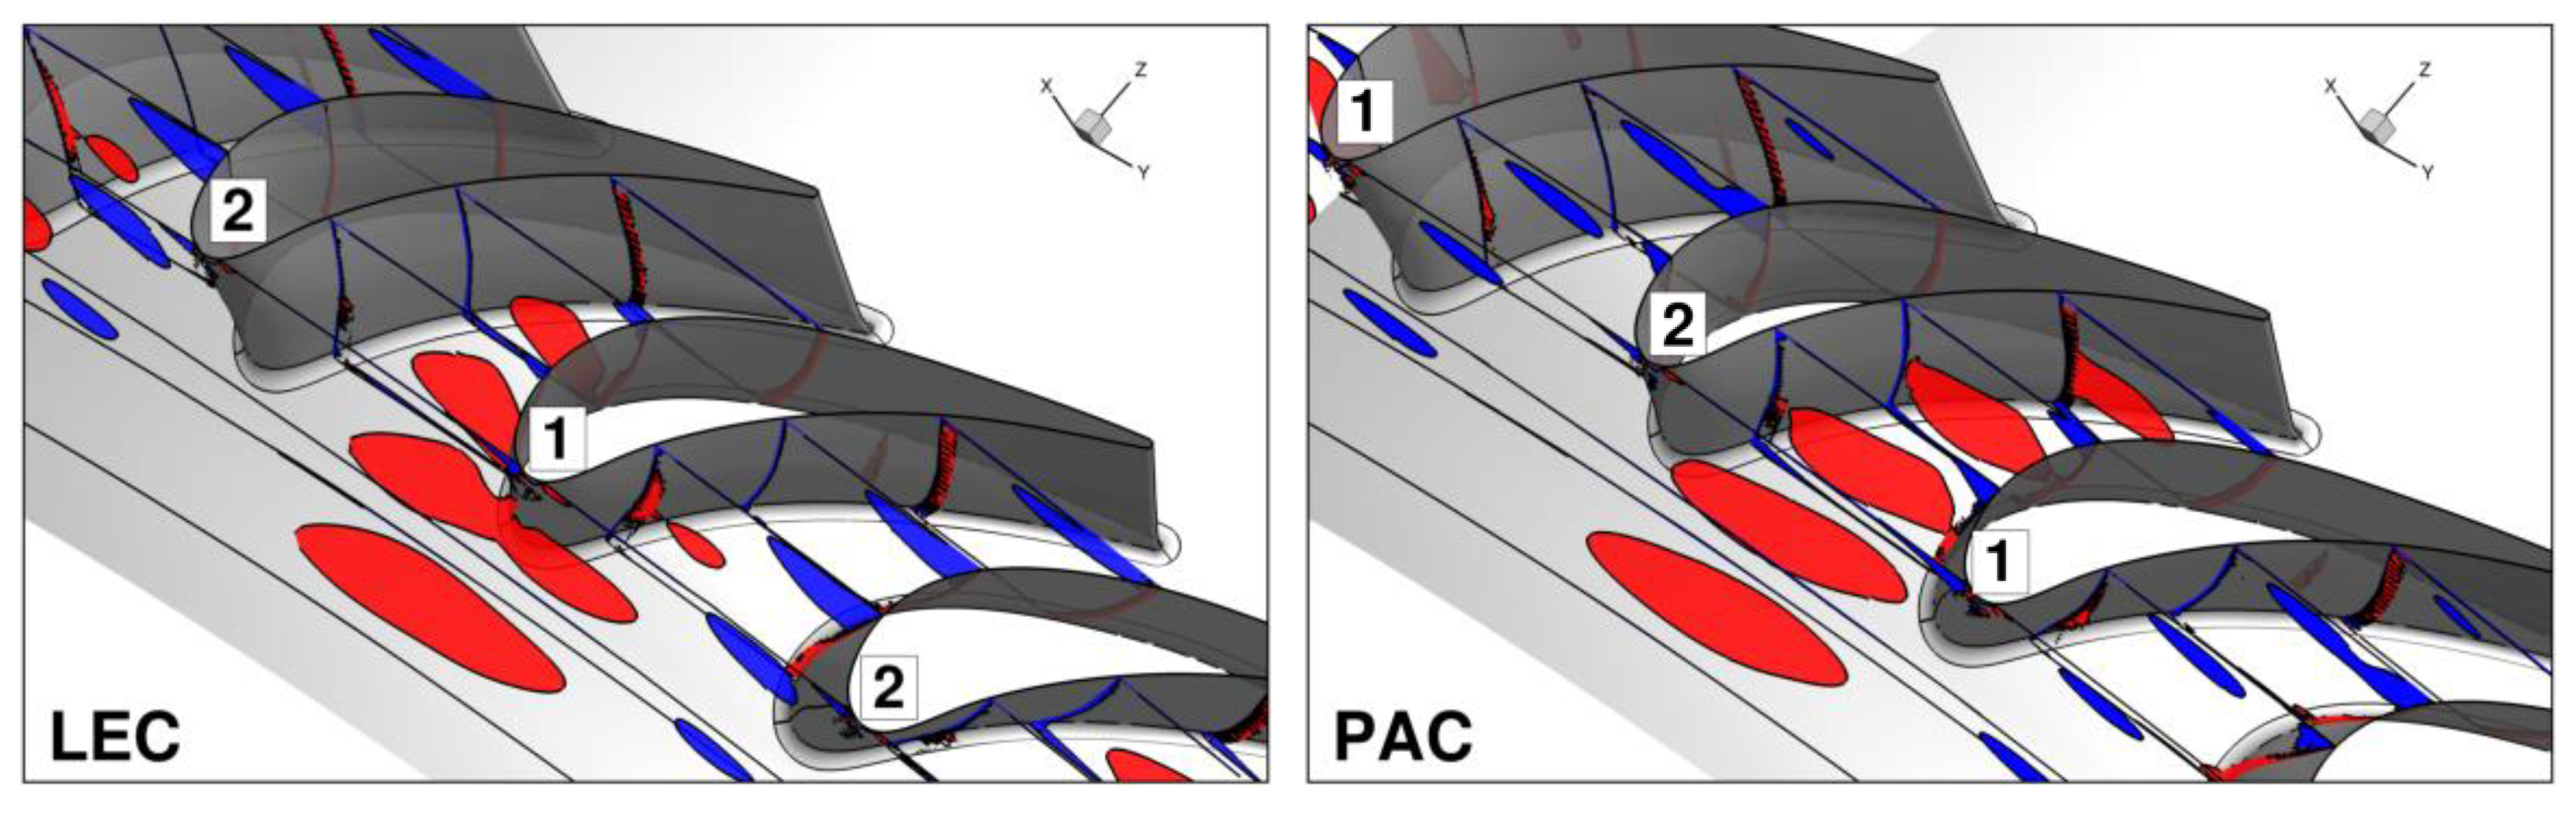
Figure 10. As shown above, the presence of guide vanes weakly influences the total pressure distribution close to the end walls, but is enough to act on the developed streamwise vortex and to modify the temperature distribution by its stretching towards the hub. The location of the vortex and its evolution at the inlet-to-blade passage is presented in
Figure 12. The red zone shows the location of a high value of the axial vorticity component, which is considered the main vortex representation, in contrast to blue zones, indicating counter-rotating vortices. The red zone indicates a positive sense of rotation (black arrow in
Figure 10), while the blue zone—negative. The vortex is visualized by the axial component (z direction) of the vorticity vector, which means that in the passage it only approximates the streamwise component. For the sake of clarity, it should be mentioned that it also does not represent the passage vortex. In the LEC case, the vortex is divided into two branches on the suction and the pressure side. Its part on the pressure side is much weaker and quickly dissipates. If the swirler is located upstream of the passage, the vortex does not interact with the leading edge, and it is well visible inside the passage.
The location of the vortex is strongly coupled with the temperature distribution, and the picture of the hot air zone indicates that the flow core in the LEC case is split by the leading edge of the NGV1 into two zones, transported at both sides of one NGV (
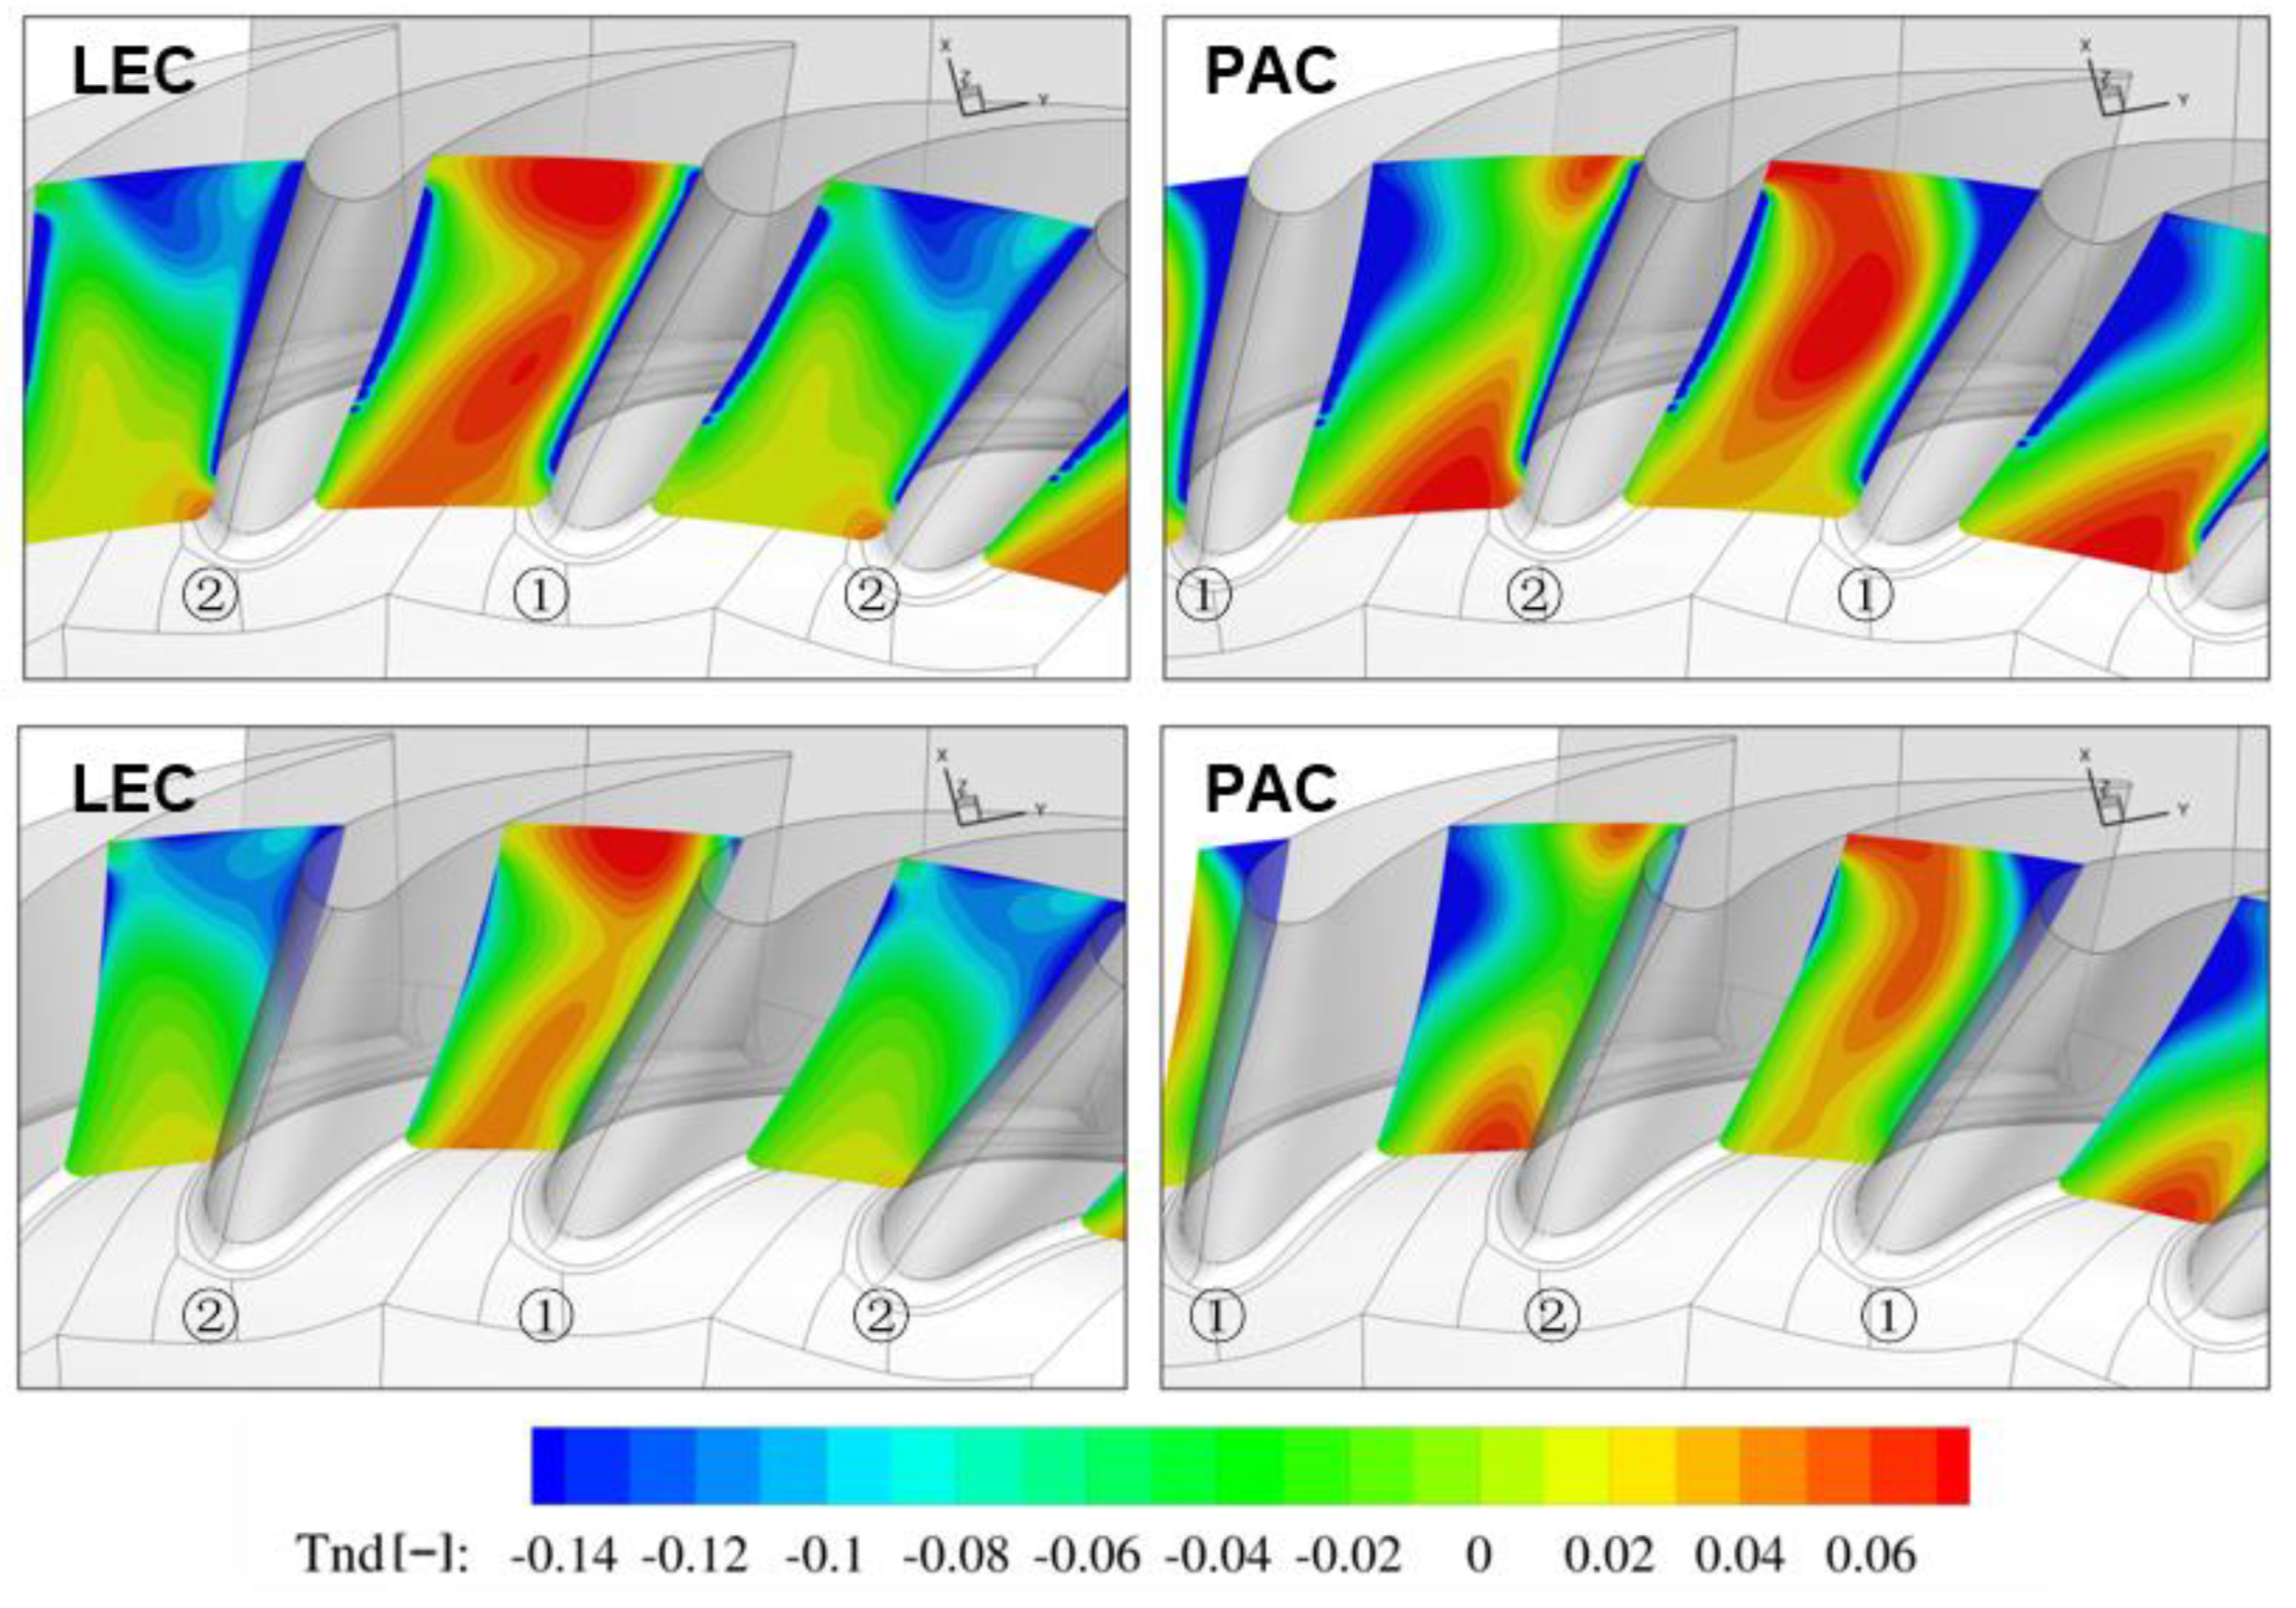
Figure 13). A significant part of the hot stream migrates towards the suction side of the NGV1. The non-dimensional temperature at planes downstream of the leading edge is shown in
Figure 14. It can be observed that despite the presence of the NGV in the LEC configuration, the major part of the hot stream is transported within only the one passage. Additionally, in this case the hot spot may affect the rotor blade tip and be a reason for high thermal loading.
In the PAC configuration, the hot stream is located in the middle of the blade passage and both neighbouring NGVs are swept with the high-temperature flow. The hot stream is located between the pressure side of NGV2 and suction side of NGV1. In this configuration, the temperature distribution close to both NGVs is also highly non-uniform. However, one can notice that the hot stream zone is more uniform along the passage height, which may also be crucial for the turbine durability.
In both cases, LEC and PAC, the higher-temperature zone close to the hub at the cascade inlet is present. This effect may arise from the simplified boundary conditions at multi-perforated walls and the assumed uniform mass flow distribution. As a consequence, it may be a reason for the lower momentum generated close to the end walls than could be created by the distributed jets.
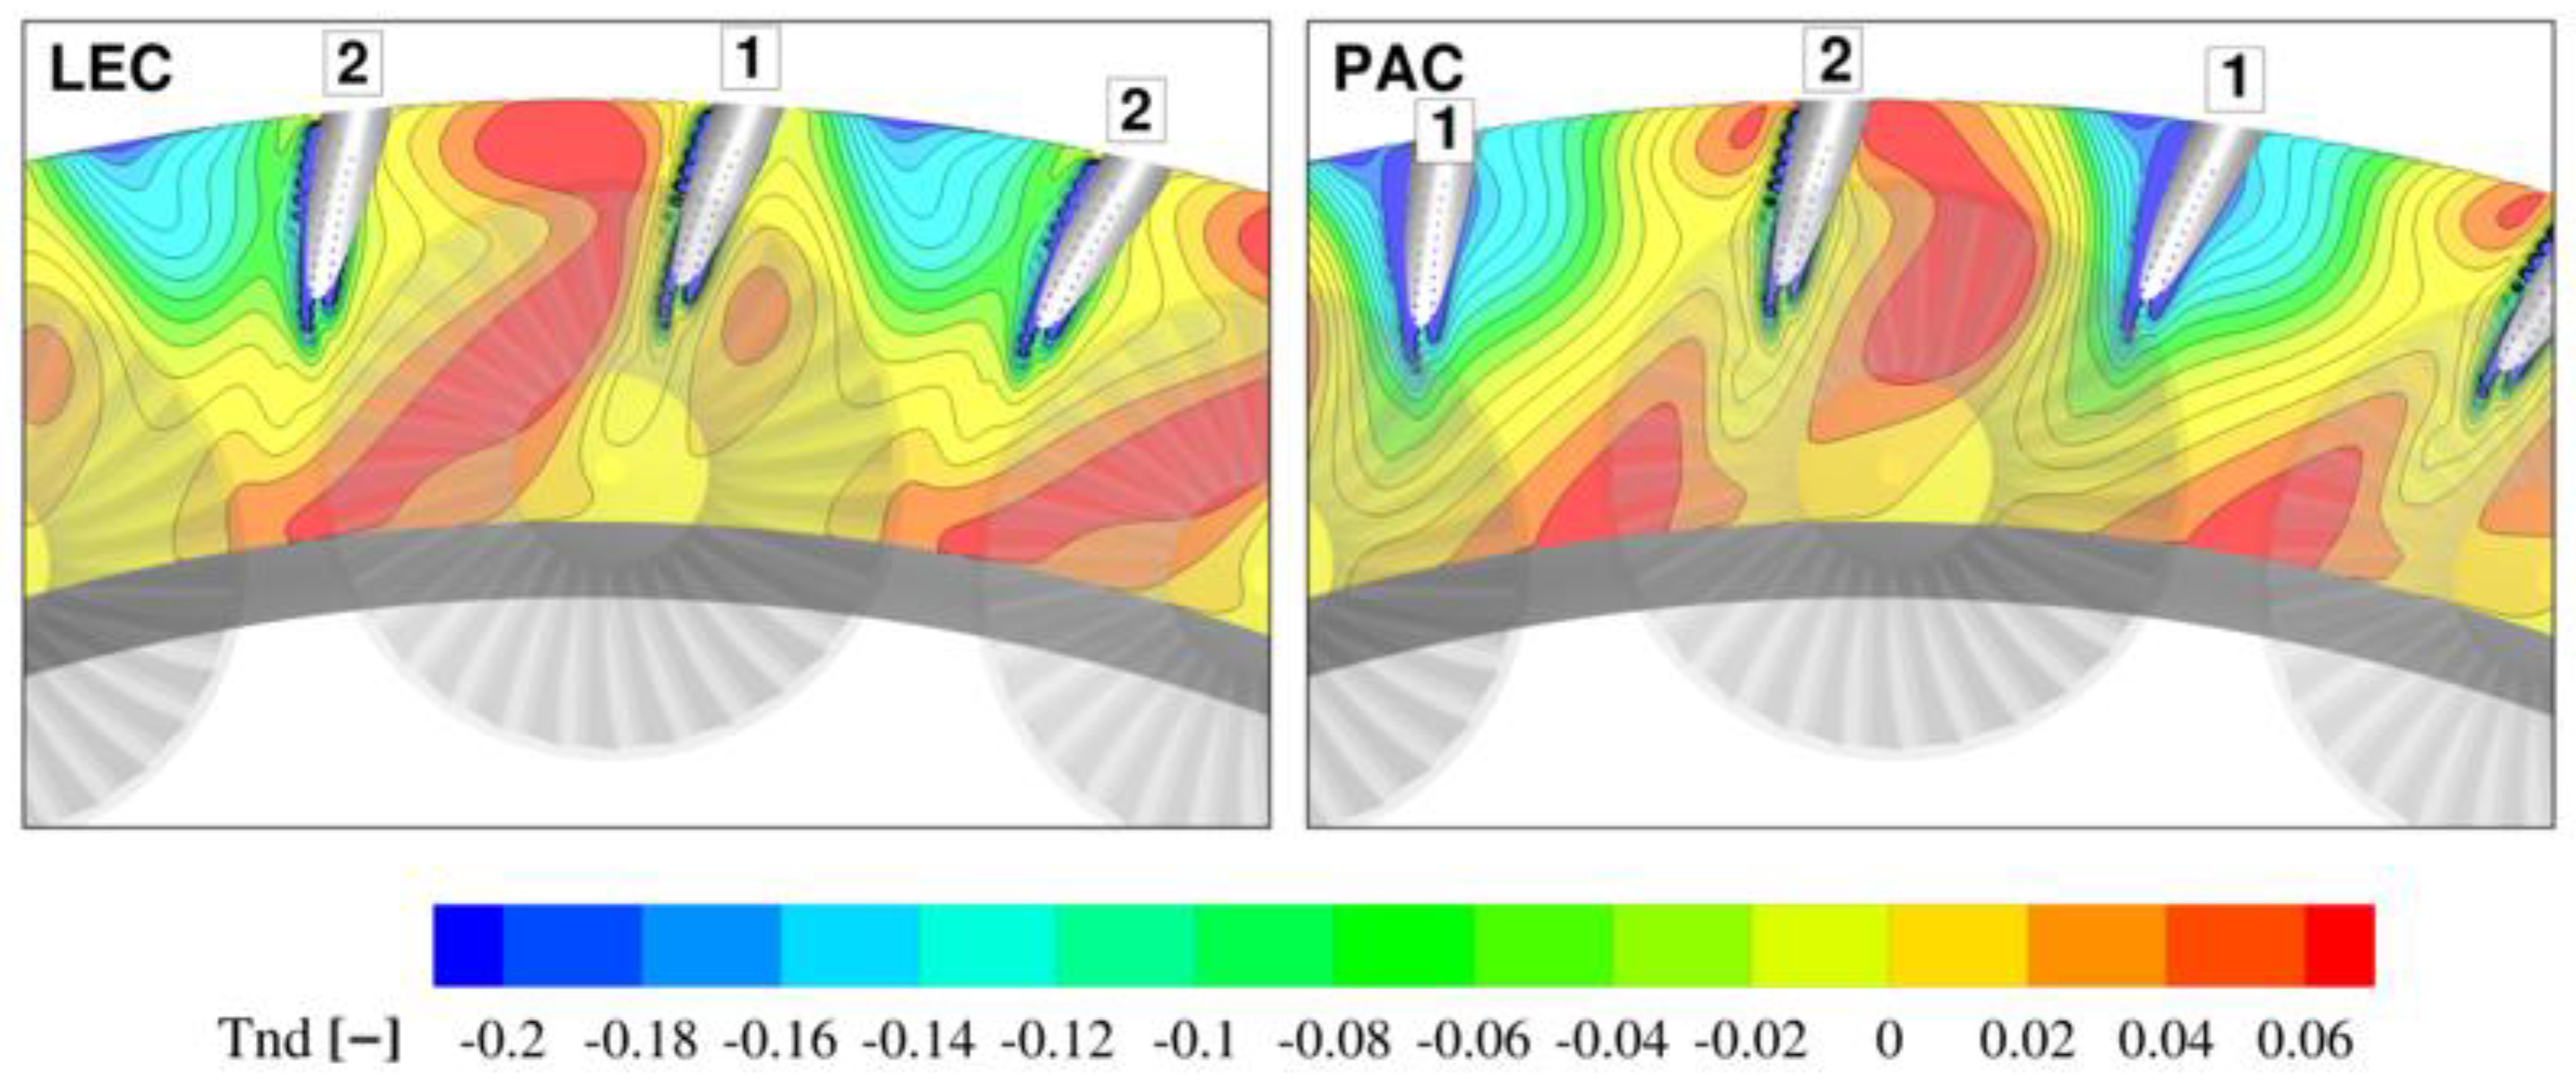
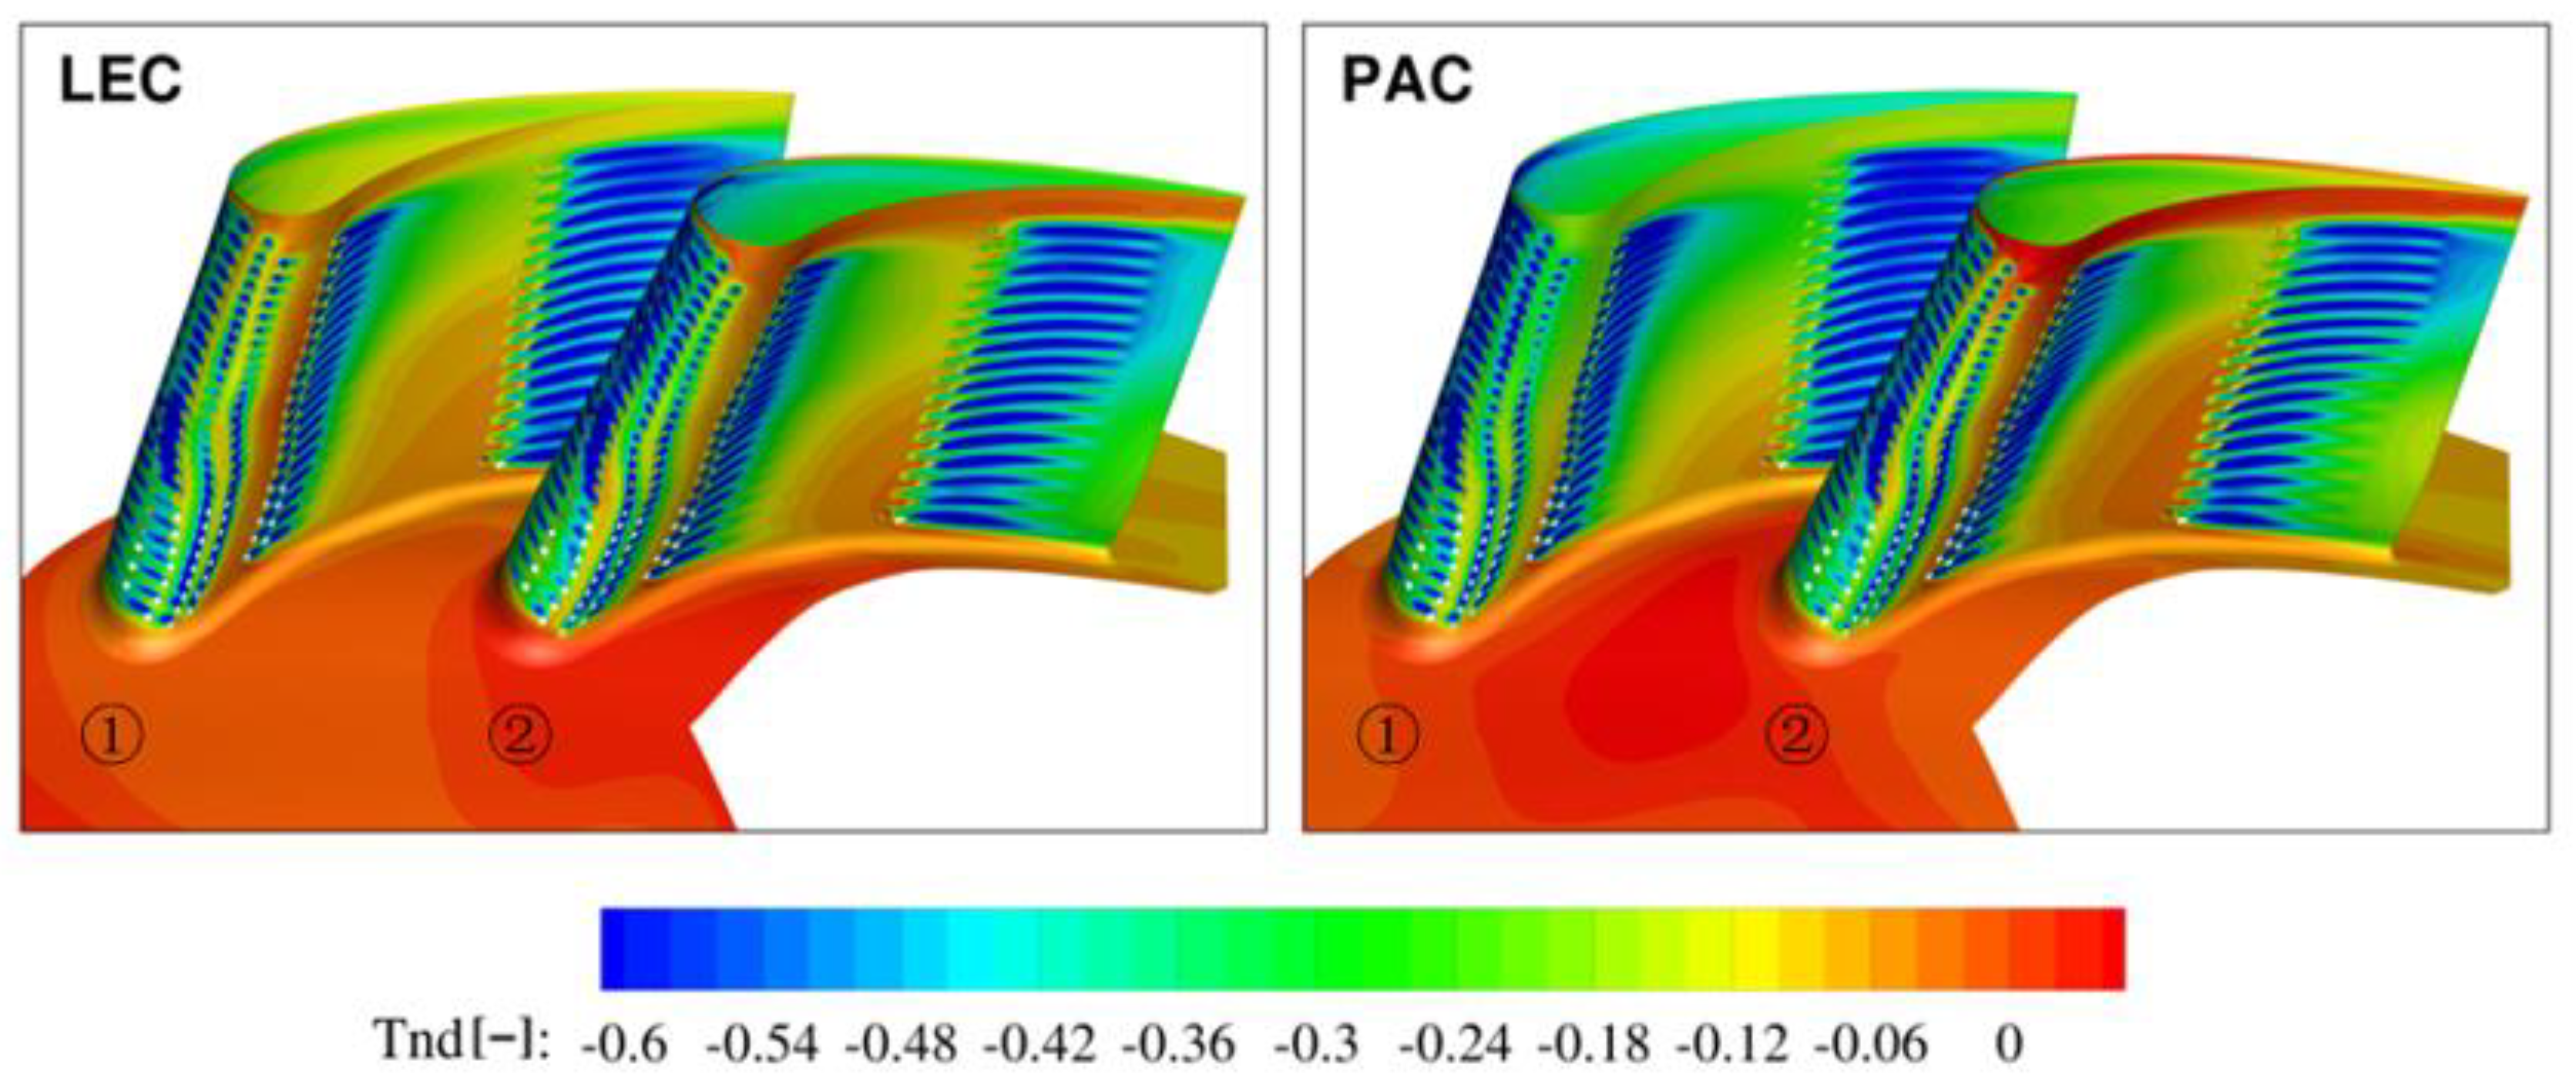
The flow structure difference forced by the NGV location directly affects the NGV wall temperature. In the LEC case, the temperature distribution on the pressure side for both NGVs is very similar (
Figure 15). The effect of the film cooling flow is pronounced and low temperature streaks are clearly visible downstream of the cooling holes, close to the leading and trailing edges. The higher-temperature zone increases farther downstream of the first rows near to the hub and is closed by film cooling rows closer to the trailing edge. The difference in temperature between both NGVs is also seen close to the leading edge near the hub. Due to the hot zone migration, the lower part of the hot streak is moved towards NGV2. However, one has to emphasize that this local effect may be also driven by the simplification of multi-perforated walls. In the case of PAC, the swirler is located in front of the passage, so the hot spot is also located centrally. Closely upstream of the leading edge, the flow migrates in the circumferential direction and pushes the hot stream towards the pressure side of NGV2. As a result, the wall temperature on the pressure side of NGV2 is much higher than on NGV1. Similarly to the previous configuration, it can also be noticed that the higher-temperature zone is located close to leading edge—hub zone.
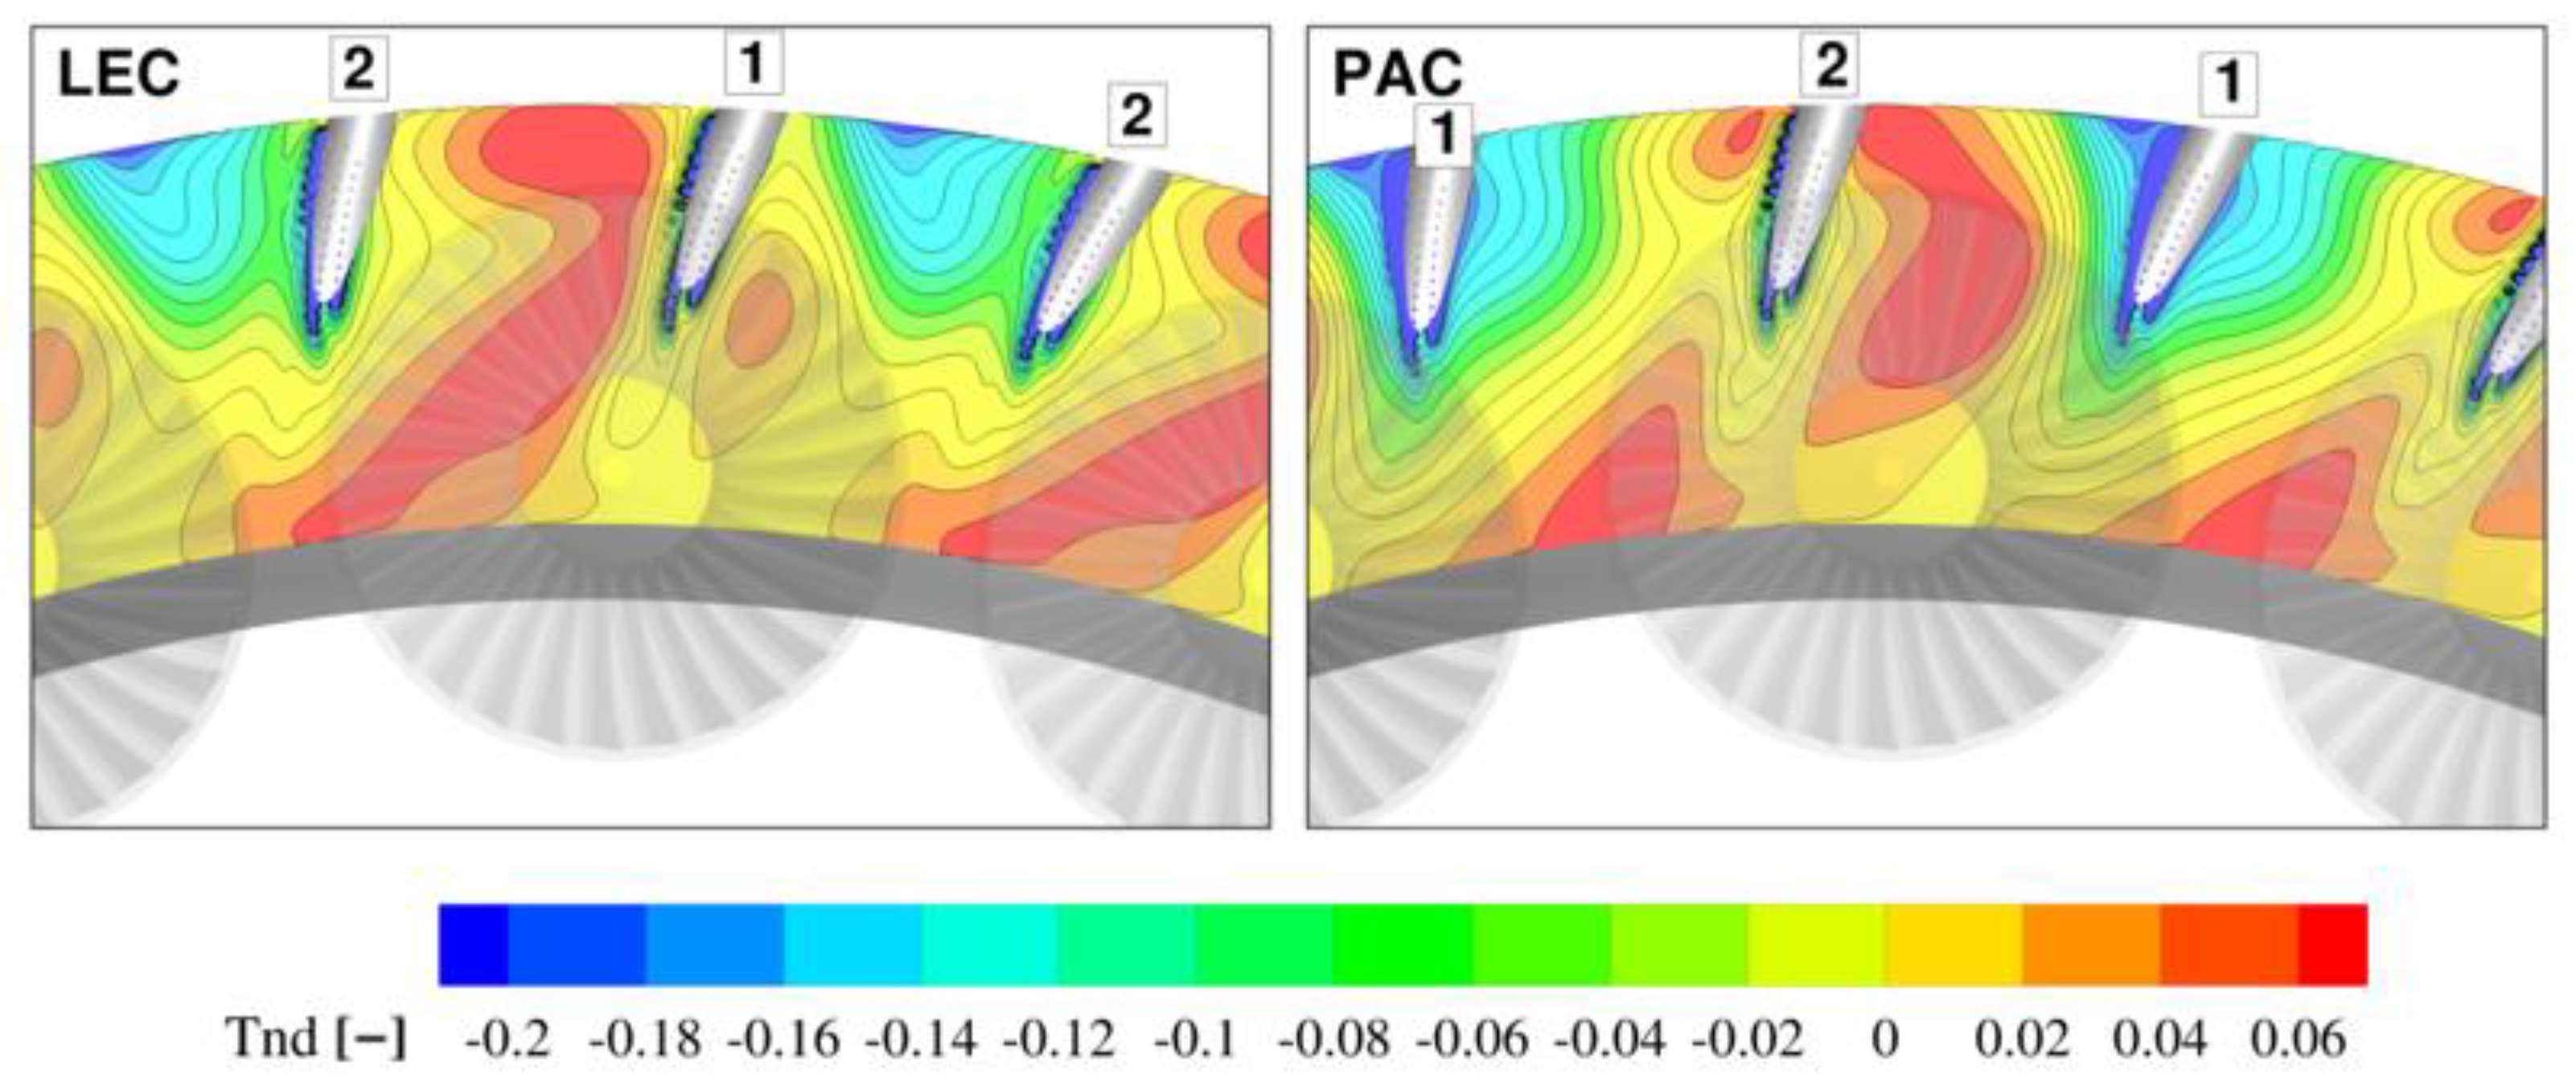
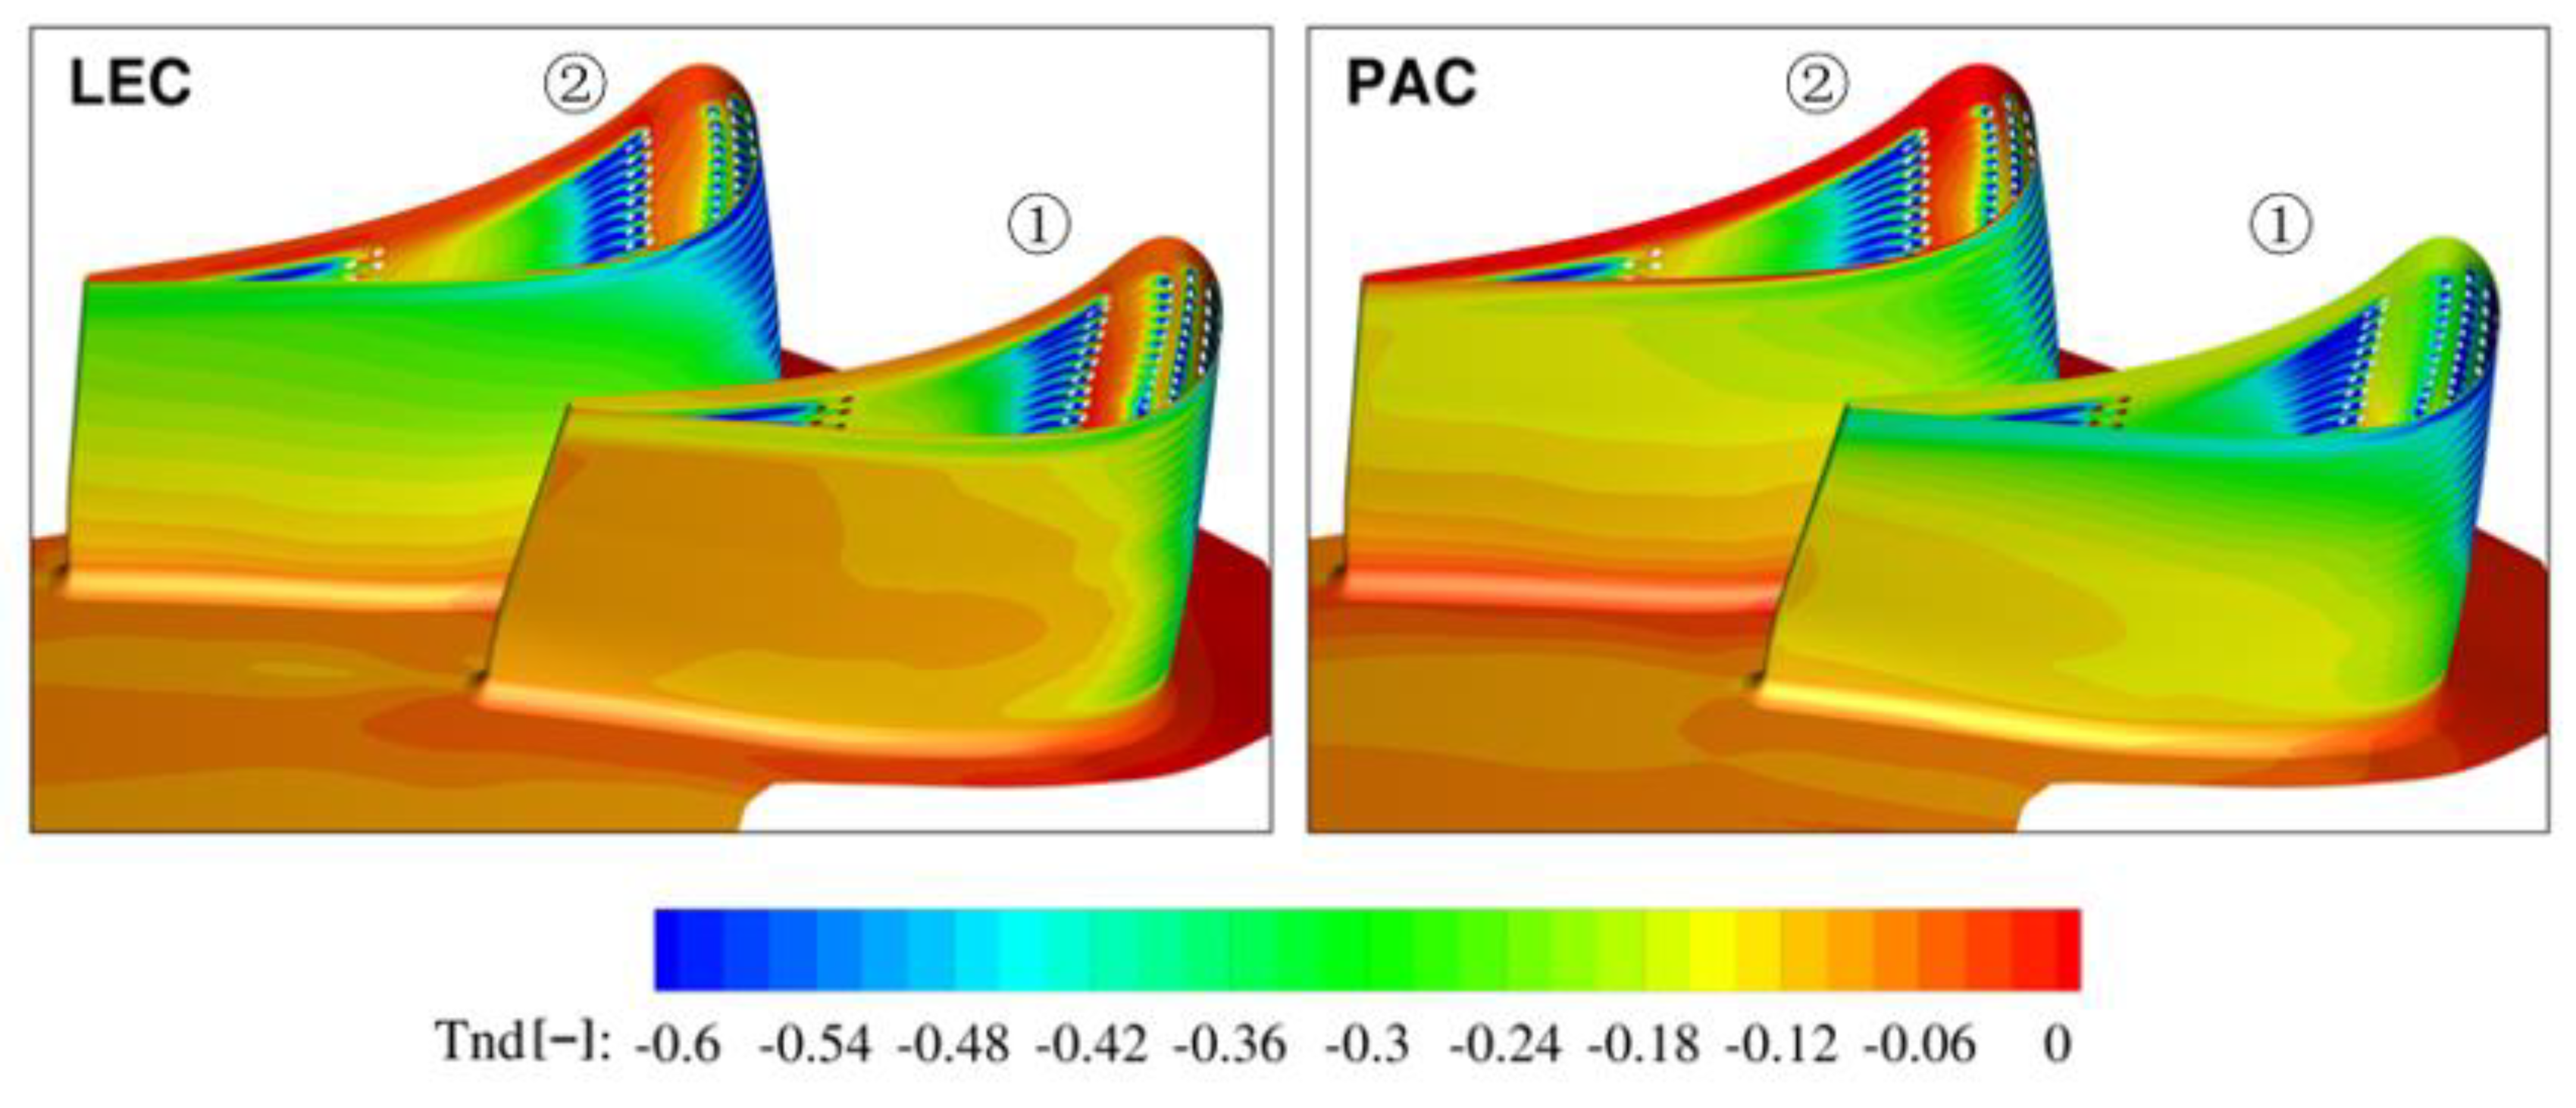
A comparison of the temperature distribution on the suction side (
Figure 16) indicates that the hot stream location in front of NGV1 (LEC) leads to a higher temperature on NGV1 than on NGV2. This is the effect of the hot spot migration towards the suction surface of NGV1. The temperature on NGV1 for the LEC case is also higher than for PAC, where the hot flow is pushed towards the NGV2 pressure side. On the suction side of NGV 2, differences between the LEC and PAC configurations are lower, but the temperature is higher if the hot spot (swirler) is located upstream of the NGV passage (PAC). The higher temperature in this configuration is caused by the hot streak split into two parts close to inner end wall, as shown in
Figure 13 and
Figure 14.
6. Conclusions
The potential and clocking effect in a combustor–turbine interaction is presented by means of numerical simulations for the FACTOR configuration. The comparison of numerical simulations results against experimental data in the plane at the combustor outlet was a validation step before the application of the model to investigations of potential and clocking effects. Boundary conditions were set according to the available measurements, but the simplified approach was applied to multi-perforated walls at the combustor simulator liner. The two turbulence models were employed: Spalart–Allmaras and Explicit Algebraic Reynolds Stress Model. A better prediction of the flow quantities at the combustor simulator outlet was obtained by the EARSM model, so EARSM was selected for the interaction investigations and analysis of the clocking effect on the nozzle guide vane.
It was shown that the potential effect of the NGV at the combustor–turbine interface located at 42.5% of the axial chord is weak, which is consistent with LES for this configuration. This conclusion can be useful for setting boundary conditions if turbine simulations are considered without the combustor.
The clocking effect due to the azimuthal position of guide vanes downstream of the swirlers strongly affects the temperature and flow conditions in the stator cascade. The effect of the hot spot location upstream of the leading edge or the passage on the locally higher temperature on both sides of the neighbouring vanes is presented. In the investigated case, the area-averaged temperature on NGV2 is the same in both configurations, the LEC and the PAC. However, the maximum calculated temperature close to the leading edge is 8% (of the averaged temperature) higher for the LEC configuration. The lower difference in maximum temperature is noticed on NGV1, but the averaged temperature is almost 2% higher if the hot spot is located in front of the leading edge (LEC).
The hot spot may influence not only the thermal loading of the turbine stator, but can also strongly impact the temperature level and flow non-uniformity at the turbine rotor inlet.


