1. Introduction
Fatigue is a critical reason for human-error-related aviation accidents [
1,
2]. A recent review of major airline crashes reported that 48% of aviation crashes were attributed to pilot errors, and approximately 20% of these errors were associated with pilot fatigue [
3,
4]. Previous studies have identified that high levels of fatigue severely affect a pilots’ ability to attend to complex information, detect safety issues, and provide timely responses [
5,
6,
7]. Therefore, it is important to evaluate and, if possible, also predict pilot fatigue levels so that intervention measures can be implemented on time.
Fatigue can hinder the pilot’s ability to stay alert and be attentive during a short-haul flight consisting of multiple consecutive flight missions. Short-haul flights usually include 4–5 legs per day, whereas long-haul flights usually include 20 or more hours of non-stop single leg flight [
8]. Limited to short-haul flights, the survey results showed that the number of legs per day, flight duration, and time of day can be factors that increase fatigue [
8,
9,
10]. In detail, the number of flight legs and duty length (time-on-task) were the most significant factors that increased pilot fatigue in short-haul flights, whereas the time of day had a weaker impact. Furthermore, prior duty and sleep substantially affected the pilots’ fatigue [
11]. In detail, the reduction in pilots’ prior sleep resulted in the increase in self-rated fatigue and decrease in mean response speed.
Some approaches have focused on observing physiological and subjective data including PVT, electroencephalography (EEG), electrooculogram (EOG), Samn–Perelli fatigue scale (SPS), and the Karolinska sleepiness scale (KSS) [
12,
13]. The results showed that factors, such as unpredictable duty, number of legs, prolonged duty periods (i.e., time-on-task), insufficient sleep, and circadian disruptions, had substantially influenced pilots’ fatigue.
Building a pilot fatigue prediction model is crucial for developing timely alerting or scaffolding methods to prevent fatigue-induced aviation accidents. The effectiveness of a fatigue prediction model depends on the methodology used to evaluate pilot fatigue. For example, intrusive fatigue evaluation methods (requiring the task to be paused for assessing fatigue) will hinder the fatigue prediction model’s adaptation for real-time fatigue prediction. Hence, before developing the pilot fatigue prediction model, we explored the limitations of the various pilot fatigue evaluation methods so that we could implement the most appropriate method (or a combination of eye tracking and PVT) in our case. The various pilot fatigue evaluation methods implemented in earlier studies can be broadly categorized into subjective methods [
14], objective methods [
15,
16,
17,
18,
19,
20,
21,
22,
23], and hybrid of subjective and objective methods [
11,
24,
25,
26,
27,
28].
Subjective methods consist of evaluating pilot fatigue through self-assessment scores, for example, fatigue rating and sleepiness scales, that allow us to understand a pilots’ opinions and fatigued feelings [
14]. Despite their ease of use, these methods might suffer from biased judgment, and it also requires pilots to recollect and write down their self-perceived fatigue level while the experiment is paused [
29]. Hence, these methods might affect the accuracy of the fatigue prediction model. Objective methods include psychomotor vigilance tasks (PVTs) [
15], EEG [
16,
17,
18], eye tracking [
19,
20], or a combination of those methods (e.g., PVT and eye tracking) [
21,
22,
23].
In detail, PVT evaluates pilot fatigue by measuring the change in their task-based performance [
15]. The PVT approach has been proven to be very effective in assessing pilot fatigue [
11,
24,
25,
26]. However, PVT can be intrusive, as it requires the pilots to pause the current task at hand to assess fatigue level. Thus, it affects the natural working environment of a pilot flying an aircraft. Therefore, developing a fatigue prediction model using PVT measures alone might hinder its adaptation for near real-time pilot fatigue prediction that does not require intervention.
The EEG method evaluates pilot fatigue by analyzing their brain waves, and it does not require the task to be paused [
16,
17,
18]. Evaluation of the brain activities can be viable approach to assess fatigue, but the EEG device can be intrusive because the electrode cap has to be placed on the pilot’s head throughout the task. Thus, it might be challenging to implement this approach for a long duration task, as it impacts the pilots’ free movement in their natural working environment [
30,
31].
The eye tracking method can be used to evaluate fatigue by analyzing pilots’ eye movements collected using a small eye tracker placed beneath a monitor or anywhere within the pilots’ visual field. Prior studies [
19,
20] demonstrated that eye tracking methods might effectively measure fatigue levels of pilots, since the pilots do not need to pause their task allowing continuous data collection in real time. Thus, eye tracking provides a viable, unintrusive, and real-time fatigue evaluation method, thereby making it suitable for developing a pilot fatigue prediction model. Furthermore, existing studies combined PVT and eye tracking measures that investigated fatigue for a single take-off and landing task [
21,
22] or where the participants were only novices [
23].
To the best of our knowledge, there has been no research on investigating the following research questions: (a) how fatigue increase might differ based on a pilot’s expertise for a multi-leg flight mission; (b) how fatigue levels increase after each flight leg; (c) how eye movement measures are correlated with fatigue levels (measured using PVT that proved to measure accurate fatigue levels as briefly explained above); (d) whether a fatigue predictive model can be created using only eye movement measures. Furthermore, PVT has several measures (such as reaction times, false alarms, and number of lapses), and there is no research on how to combine those into a single fatigue assessment measure. Motivated by our preliminary research efforts [
22,
23,
28], the present study addresses the questions.
2. Background
In this section, an in-depth literature review based on the fatigue evaluation methods within the aviation and other relevant domains is provided below.
Table 1 provides a concise summary and classifications based on research topic, evaluation method, expertise, single vs. multiple legs, short vs. long duration flights, and statistical analysis method.
2.1. PVT Measures and Fatigue Assessment
In the absence of any direct fatigue measurement approach, PVT has been proven to be the most effective and widely used fatigue evaluation method. PVT evaluates fatigue by assessing changes in an individual’s performance for a particular button-pressing task when a visual stimulus (e.g., lights) is sequentially presented one by one on a display at random time intervals [
35]. Specifically, three measures are evaluated: (a) reaction times (RT), where 150 ms < RT < 500 ms; (b) number of false alarms (tallied when RT < 150 ms); (c) number of lapses (tallied when RT > 500 ms) [
36].
Note that RT increases with the rise in fatigue level. Furthermore, for RT < 150 ms, the button pressing action is considered a false alarm, which implies that either the onset of the visual stimulus was anticipated or the action was performed without seeing the stimulus. Conversely, the button pressing act having an RT > 500 ms is counted as a lapse, thus implying a temporary failure of concentration due to the fact of fatigue. Another possible measure, also used by researchers to assess fatigue, is the response speed, which is defined as the inverse of RT (i.e., 1/RT). For example, if RT is 200 ms, then the response speed is 0.005 ms−1.
Different researchers have used one or a collection of the four PVT measures mentioned above to evaluate pilot fatigue. For example, the number of lapses was found to increase, whereas response speed decreased with a rise in pilot fatigue levels for short-haul flight operations [
15]; a decrease in mean response speed (1/RT) was observed with an increase in time-induced fatigue on pilots in both long [
11], ultra-long flights [
24], and short flights [
25]. Notably, the mean reaction times and the mean number of lapses increased with an increase in pilot fatigue, where pilots performed simulated flying operations under both rested and fatigued conditions [
26].
Regarding the fatigue prediction model development, prior studies (which used a hybrid approach of combining PVT and subjective measures) found different results for long- and short-haul flights. For example, for a short-haul flight, the number of lapses was found to be important for pilot fatigue prediction [
15]; whereas, for a long-duration flight, pilots’ sleep duration was found to be the only significant predictor (in a linear mixed-model regression model) of pilot fatigue [
11].
Note that all these previous studies found similar trends, in which response times, number of false alarms, and number of lapses increased as fatigue increased. Response speed (being the inverse of reaction times) decreased with an increase in fatigue. However, to the best of our knowledge, each PVT measure was evaluated separately when we reviewed the previously published papers on PVT. If we used the PVT measures separately, then would we need to develop 3 times the regression models and would not know which one to apply for prediction. Hence, we would need a single unified PVT measure to develop a single prediction model. Therefore, we devised a simple unified measure which is the weighted linear combination of the three basic PVT measures (i.e., reaction times, number of false alarms, and number of lapses). More details are provided in
Section 3.
The abovementioned studies, due to the PVT method’s implementation, require the current task to be paused, which might not be either favorable or feasible when performing a piloting task. In addition, they include flight operations that only have single take-off and landing tasks for both short- and long-duration flights. Thus, the results obtained cannot necessarily be transferred to our case of multiple take-offs and landing tasks. Furthermore, these studies did not consider the effect of pilot expertise on their fatigue level.
2.2. Eye Movement Measures and Fatigue Evaluation
Eye tracking is nonintrusive and can provide measures such as eye fixation position (or location), duration, pupil dilation, visual scanpath (i.e., the time-order of the eye fixations that occurred on display), saccade, blink, and eyelid closure [
19,
20,
32,
37,
38,
39], in which eyelid closure slowed as fatigue increased [
37,
38] and saccadic velocity decreased as fatigue increased after long simulated flights [
19,
20,
32,
37,
38,
39].
In more detail, previous studies utilizing only the eye tracking method for pilot fatigue evaluation suggested that expert pilots’ saccadic movements decreased with an increase in time-induced fatigue for a single take-off and landing operation [
19,
20]. Moreover, prior studies that implemented a composite objective approach to fatigue evaluation (i.e., combining both eye tracking and the PVT method) noted that a pilot’s pupil diameter increased with a rise in their fatigue level [
21]; expert pilots showed faster reaction times and fewer lapses and false starts than novice pilots at higher fatigue levels [
22]; expert pilots displayed more frequent eye fixations with a shorter duration than novice pilots as their fatigue level increased [
23].
We currently do not know whether similar results can be obtained for a long-duration aircraft piloting task with multiple take-offs and landing operations and whether a fatigue predictive model (i.e., regression model) can be developed for the same. In addition to the traditional measures, eye movement data, especially the saccadic eye movements, can be further processed to evaluate the pilots’ overall eye movement transition behavior using visual entropy [
23,
33]. Visual entropy is a measure that quantifies the randomness of the eye movement transition behavior, where a large visual entropy value suggests more random eye movement transition behavior over the display and vice-versa. The concept of visual entropy has been adapted from information entropy [
40]. Previous studies have used two types of visual entropy measures—transition and stationery—to analyze the impact of fatigue and task complexity on eye movement transition behavior. For example, for a helicopter maneuvering task, expert pilots’ transition entropy was found to decrease with an increase in task complexity levels [
33]; in the case of a simulated driving study, increase in fatigue levels led to an increase in both the visual entropy measures [
41]; in a robotic surgery training task, transition entropy was noted to increase with a rise in perceived workload [
42]. Nonetheless, these studies focused on other aspects and did not consider the impact of fatigue.
Before calculating two visual entropy measures, we first needed to evaluate the eye fixation transition probability matrix, also called area of interest (AOI) transition probability using the design principles [
40]. In other words, within a display or a field of view, we can define certain important areas as AOIs, then analyze the eye movement characters only using those AOIs. The AOI transition probability matrix was defined as
, where
is interpreted as the probability of eye fixation transition from
ith AOI towards the
jth AOI. In other words, the transitions among the AOIs can be investigated using the transition probability matrix. An example of how the AOIs were defined for our research is provided in
Section 4.
Visual entropy can be divided into transition entropy and stationary entropy [
43]. Transition entropy is calculated using only the data collected during the experiment and is also known as the entropy rate [
44], whereas stationary entropy shows to which value it is expected to converge over a very long period. The following Equations (1) and (2) are the most important, which we summarized from [
43].
Stationary entropy:
where,
,
,
, and 𝜋 is the steady stationary distribution (i.e., steady-state vector) associated with AOI transition probability matrix, 𝑖 and
are AOI indexes, and
is the set of the AOIs. An interesting relationship between
and
is
[
45], implying that stationary entropy (
can result in a shorter range compared to the range of the transition entropy (
.
Table 2 shows two extreme numerical examples of eye fixation transition probabilities and the resulting stationery and transition entropy values.
Table 2a shows an extreme example of randomness, whereas
Table 2b shows an extreme example of concentration (i.e., many eye fixations) on certain transitions from one AOI to another AOI. If we consider eye movement transition matrices in between two extreme examples, the range of the transition entropy can be approximately [0.1, 1.6], whereas the range of the stationary entropy can be approximately [1.6, 2.0] having a shorter range. Since either calculation approach (i.e., (1) or (2)) is viable and the entropy values show relative differences, we chose to investigate both approaches to identify which one might better predict fatigue given that any correlations might exist.
In
Table 2, matrix (a) is an extreme example of the eye fixation probabilities based on uniform distribution. The diagonal values were set to zero since we did not consider consecutive eye fixations that occur on the same AOI when calculating the visual entropy. Matrix (b) was an extreme example based on non-uniform eye fixation transition probabilities.
Note that having more eye fixations (leading to more eye movement transitions) does not mean that the entropy is higher. The entropy was calculated based on transition probabilities; therefore, we can have a higher entropy value with a fewer number of eye fixations.
3. Methods
Our proposed method consisted of two steps. In the first step, we evaluated pilot fatigue using PVT measures and investigated the correlation between the PVT measures and various eye movement measures. This correlation study helped us to evaluate the eye movement measures’ validity in assessing pilot fatigue for the given flight scenario. The second step involved developing a fatigue prediction model using a stepwise regression model where only the normalized eye movement measures were treated as predictor variables. Note that fatigue was assessed by normalizing and aggregating three PVT measures into a single fatigue measure. In other words, we assumed that PVT measures were very accurate in providing fatigue levels based on previous research [
21,
22,
23], and we were investigating which eye movement measures could be used as effective predictor variables when considering expertise.
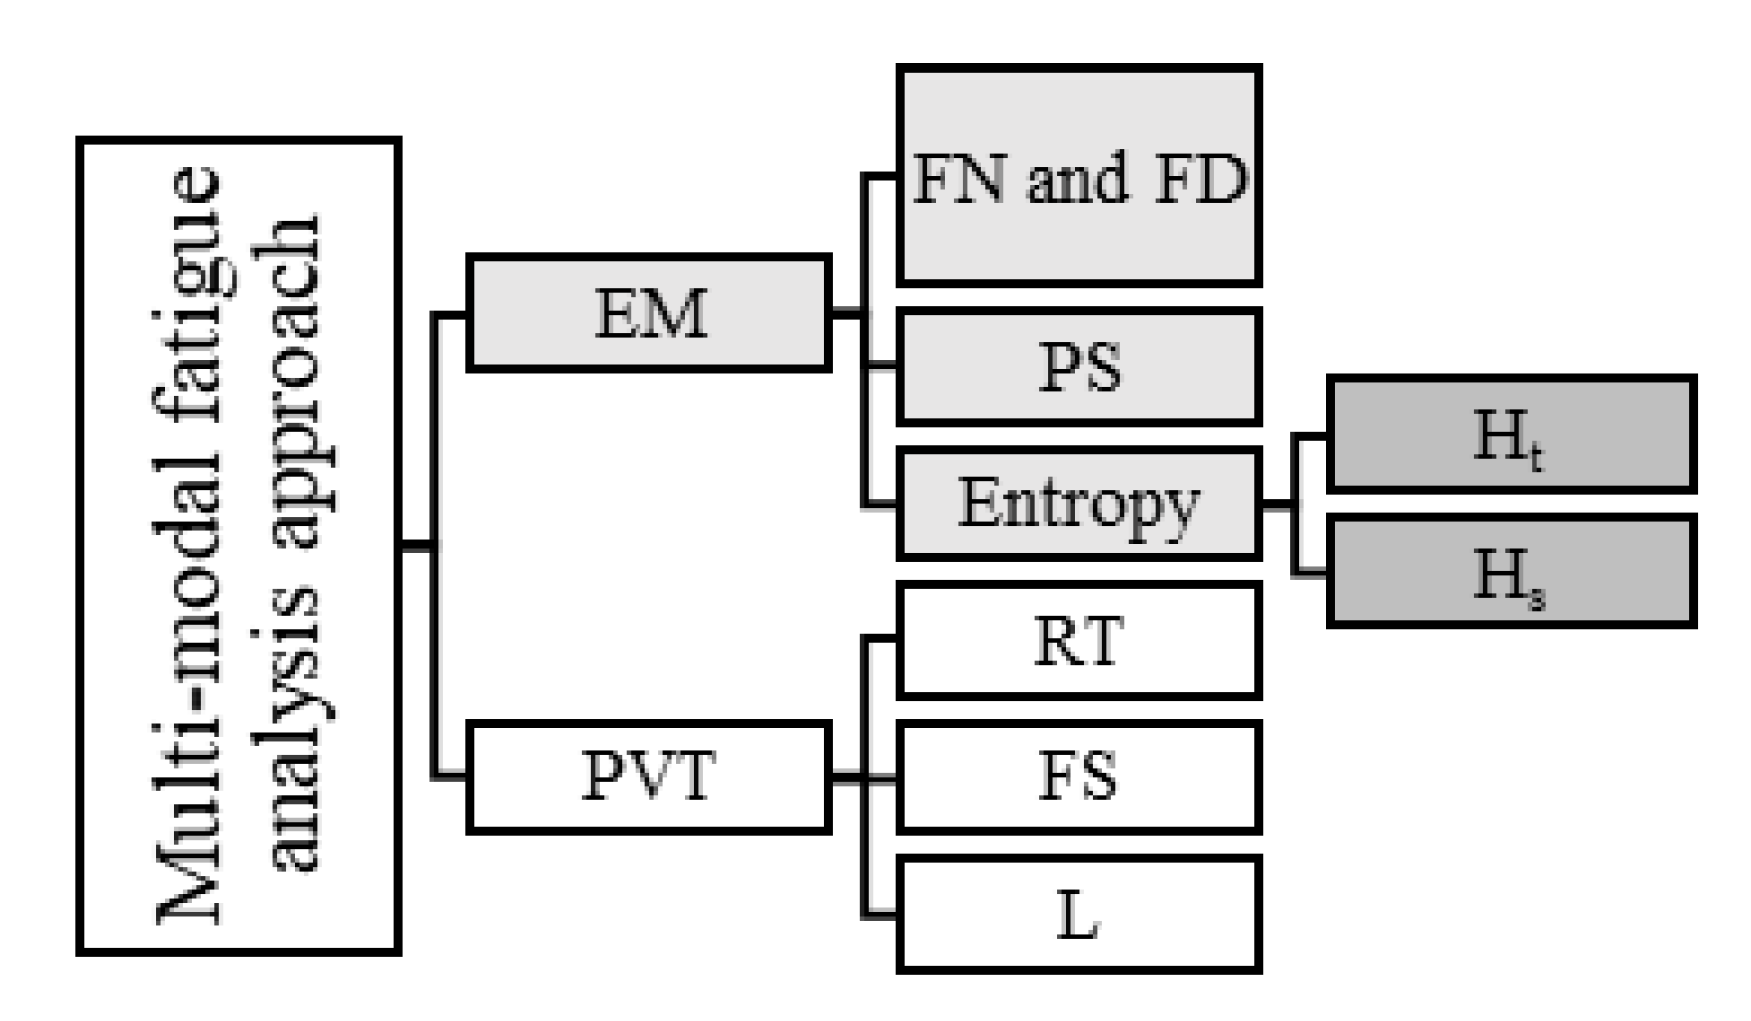
Figure 1 represents the two different types of measures including the PVT measures and eye movement (EM) measures. The widely used PVT measures were used as a basis to assess accurate fatigue levels. The EM measures were then investigated to discover which EM measures might be highly correlated with the PVT measures.
The detailed analysis steps are as follows:
- Step 1:
Assess fatigue level through PVT after each task. Measures are (a) reaction times (RT), (b) number of false starts (FS), and (c) number of lapses (L).
- Step 2:
Collect eye tracking data, analyzing the data using the context-specific areas of interest (AOIs). Measures are:
- (a)
Mean eye fixation number on AOIs;
- (b)
Mean eye fixation duration on AOIs;
- (c)
Mean pupil size on AOIs;
- (d)
Visual entropy (calculation process explained below).
The visual entropy evaluates the amount of randomness associated with the visual scanning strategy of the pilots. Higher visual entropy value means that relatively more randomness (in eye movements) exists. We hypothesized that experts’ visual entropy would be lower than that of the novices, meaning that the novices’ eye movements might show more randomness, especially when fatigued. Although we followed the procedures provided in [
43] to calculate visual entropy, one major difference was that in [
43], they used context independent AOIs by dividing an image into equally sized grids, whereas we used context-specific (or context-dependent) AOIs. An example of how we defined the context specific AOIs is provided in the
Section 4.
- Step 3:
Plot the relationships of the variables and investigate the correlations between the PVT measures and the eye tracking measures. The measures were all those provided in Steps 1 and 2. Step 3 was needed to first see whether linear correlations could be observed prior to applying multiple regression. In other words, different regression models should be applied based on the relationships. For example, if the relationship among the variables were quadratic, then a quadratic regression should be applied.
- Step 4:
Create a “unified” PVT measure by combining the PVT measures of RT, FA, and L. The unified measure (S) is expressed as follows:
where
. The weight values can be set to be either the same or different based on the analyst’s needs. For example, if a task requires false alarms to be most important factor to consider, then its weight can be increased. In this paper, we assigned the same weight to each factor. Note that we created the “unified” PVT measure to better investigate the relationships between the PVT measures and the eye tracking measures. Note that normalized RT, FA, and L values were used, meaning that the minimum and maximum values obtained from all the experiment participants were mapped to 0 and 1.
- Step 5:
Discover an optimal regression model that can predict fatigue using one or more eye-tracking measures. Stepwise regression approach was applied (both forward and backward) to discover the optimal regression model. We assumed that the unified PVT measure accurately represented one’s fatigue level, and we found eye tracking measures that could predict fatigue level. All eye tracking measures were normalized, meaning that the minimum and maximum values obtained from all the experiment participants were mapped to 0 and 1. The full model and associated variable for the backward regression is:
where
S is the unified PVT measure,
is number of eye fixations,
is eye fixation duration,
is pupil dilation,
is transition entropy,
is steady state entropy,
is the model intercept, and
(where
) represents the coefficients for eye movement measures. Note that the forward regression model starts with finding a best predictor variable, then adds more and more variables. Both methods, in general, should produce the same outcome.
4. Experiment
A moderate fidelity flight simulation environment was created that involved the short-haul multiphase flight. Details are as follows.
4.1. Participants
A total of twenty pilots participated in the experiment. Ten participants were defined as “novices” who had moderate expertise (pilot experience: mean of 18 months and SD of 2.4), less than 36 months of experience, and at least met the minimum requirements of 40 h of actual or simulated IFR flights. The other ten participants were defined as “experts” who had more expertise (pilot experience: mean of 42 months SD of 4.5), more than 36 months of experience, and expressed they completed substantially more IFR flight hours (at least more than twice) than the minimum requirement of 40 h. Unfortunately, all pilots were not able to exactly recall their IFR flight hours; therefore, the statistics are not provided.
The power analysis indicated that the sample sizes provided reasonable power of 0.91 for the mixed design of within-subjects design related to the tasks and between-subjects design related to the expertise. In addition, other research papers related to evaluating pilots’ performance had a mean sample of ten pilots [
5,
19,
34,
46,
47].
4.2. Apparatus
Microsoft flight simulator software (i.e., FSX) was used for generating the Boeing B-52 aircraft and the flight scenarios. B-52 aircraft was selected to possibly induce more visual attention from the pilots. However, since a moderate fidelity flight simulator was used, piloting a simulated B-52 should be not as difficult as piloting the actual B-52.
The PVT measures were assessed using the Psychology Experiment Building Language (PEBL) software version 0.13 [
48]. Tobi TX 300 eye tracker (having 300 hz data collection rate having 0.5 degrees of visual angle accuracy) and Tobii Studio software was used to collect and process the raw eye tracking data. The I-VT algorithm provided by the Tobii Studio software was applied to calculate the eye fixations. The eye tracking data exported from the software were analyzed using MATLAB and R software. A 21-inch monitor was used for displaying the simulated flight scenarios. A Logitech Extreme 3D Pro Joystick was applied to control the aircraft. A keyboard was used to collect the PVT-related task responses.
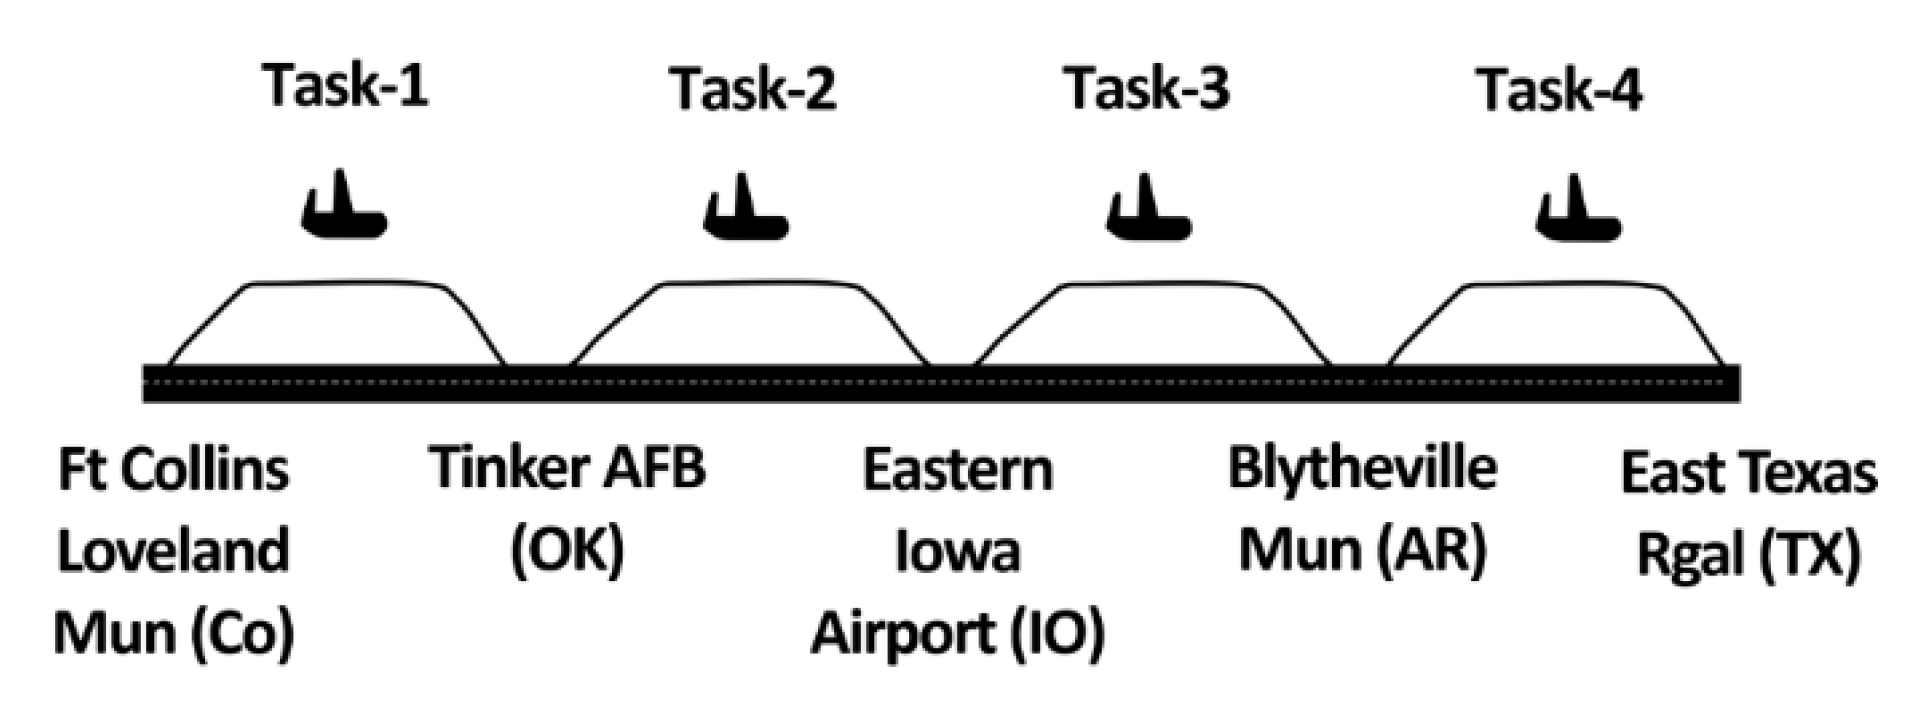
4.3. Tasks and Procedures
The four consecutive tasks (tasks 1–4, which were equivalent to each leg) are provided in
Figure 2. All the participants were instructed to maintain a regular sleep schedule and sleep at 9 pm on the day before the experiment day in order to prevent the possible confounding effect of sleep. The experiment started at 8:30 am and ended around 1:00 pm. At the beginning of the experiment, calibrations were performed to start collecting accurate eye tracking data. Each task lasted for 60 min and involved takeoff, climb, cruise, descent, and landing following the FAA’s IFR.
IFR flights mean that the pilot does not have visibility out the window and has to rely on the information obtained from the flight instruments. After completing each flight task, pilots underwent the PVT, which lasted for approximately 5 min (providing 30 stimuli during the 5 min), following the guidelines offered [
49]. Therefore, a total of four PVTs were administered for each pilot. Since we used simulator software, the runway configuration was similar among all airports, and no other aircraft were placed on the runway.
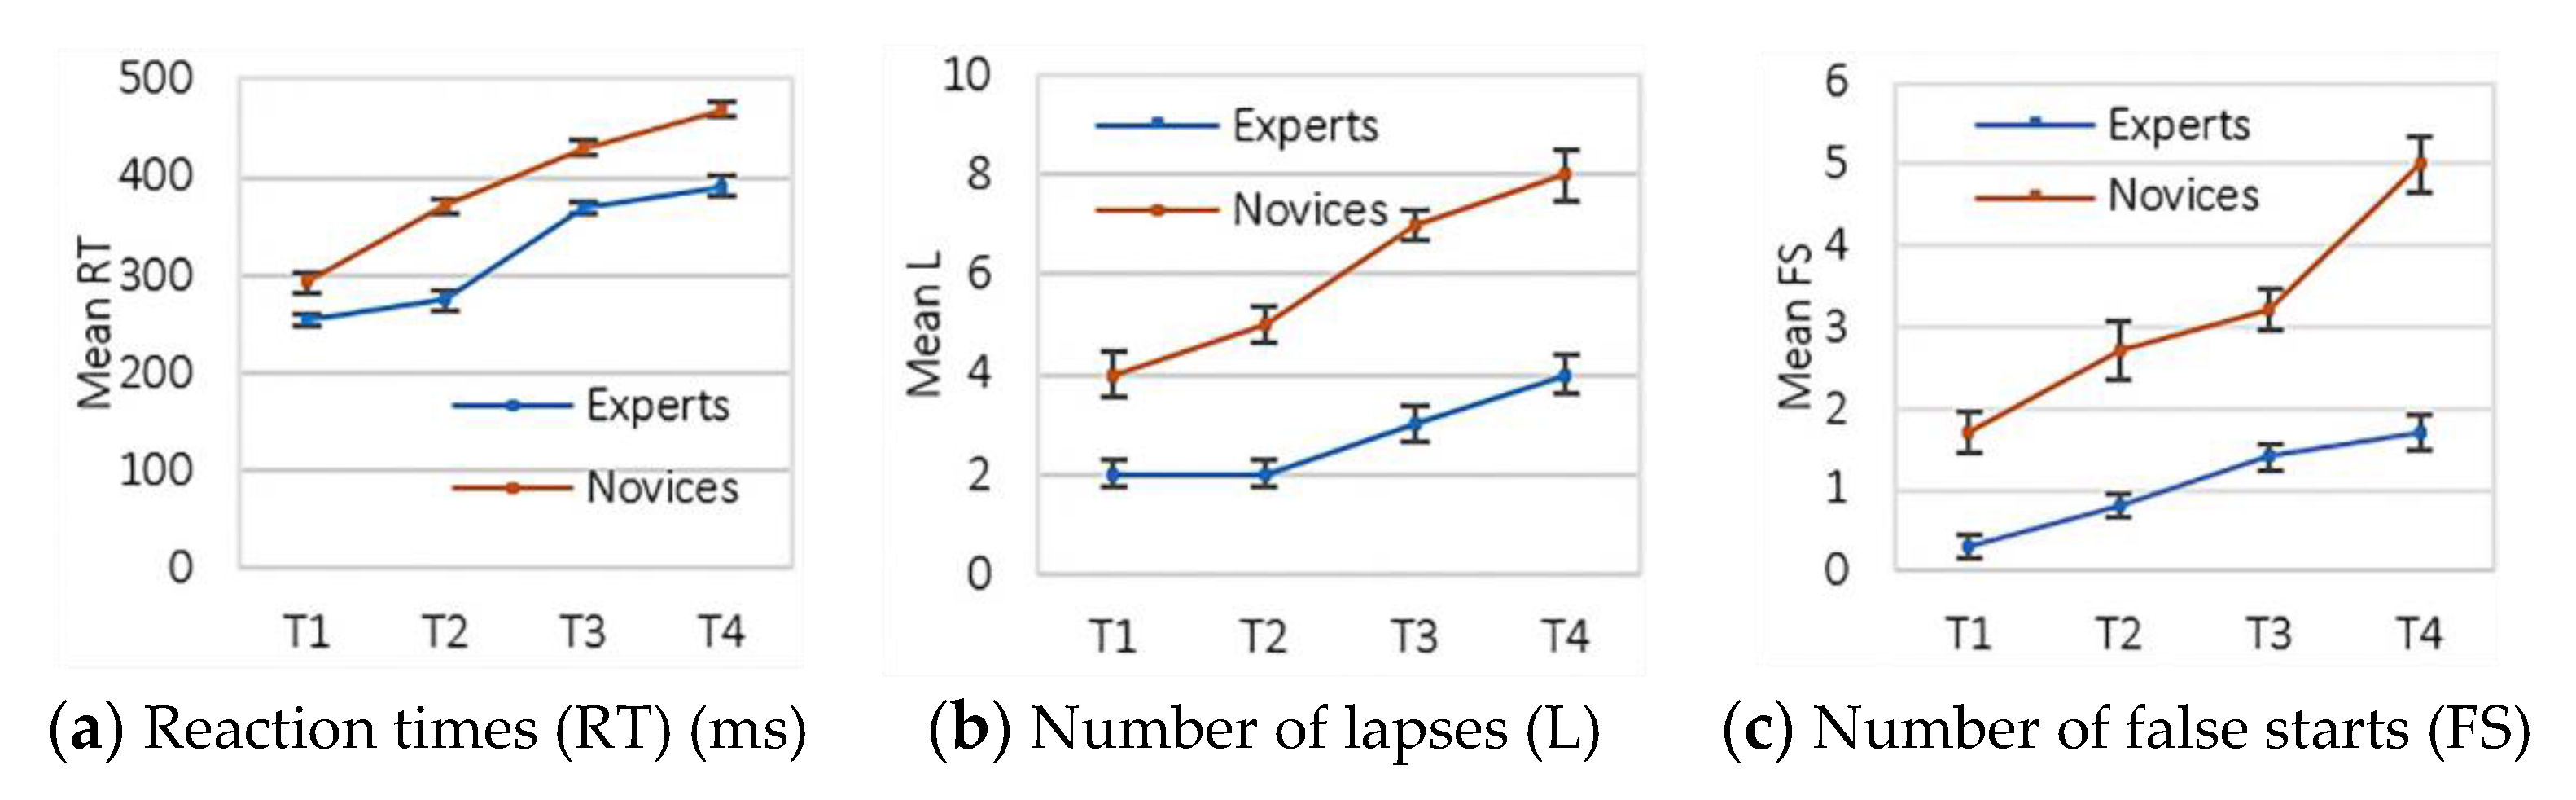
4.4. Measures
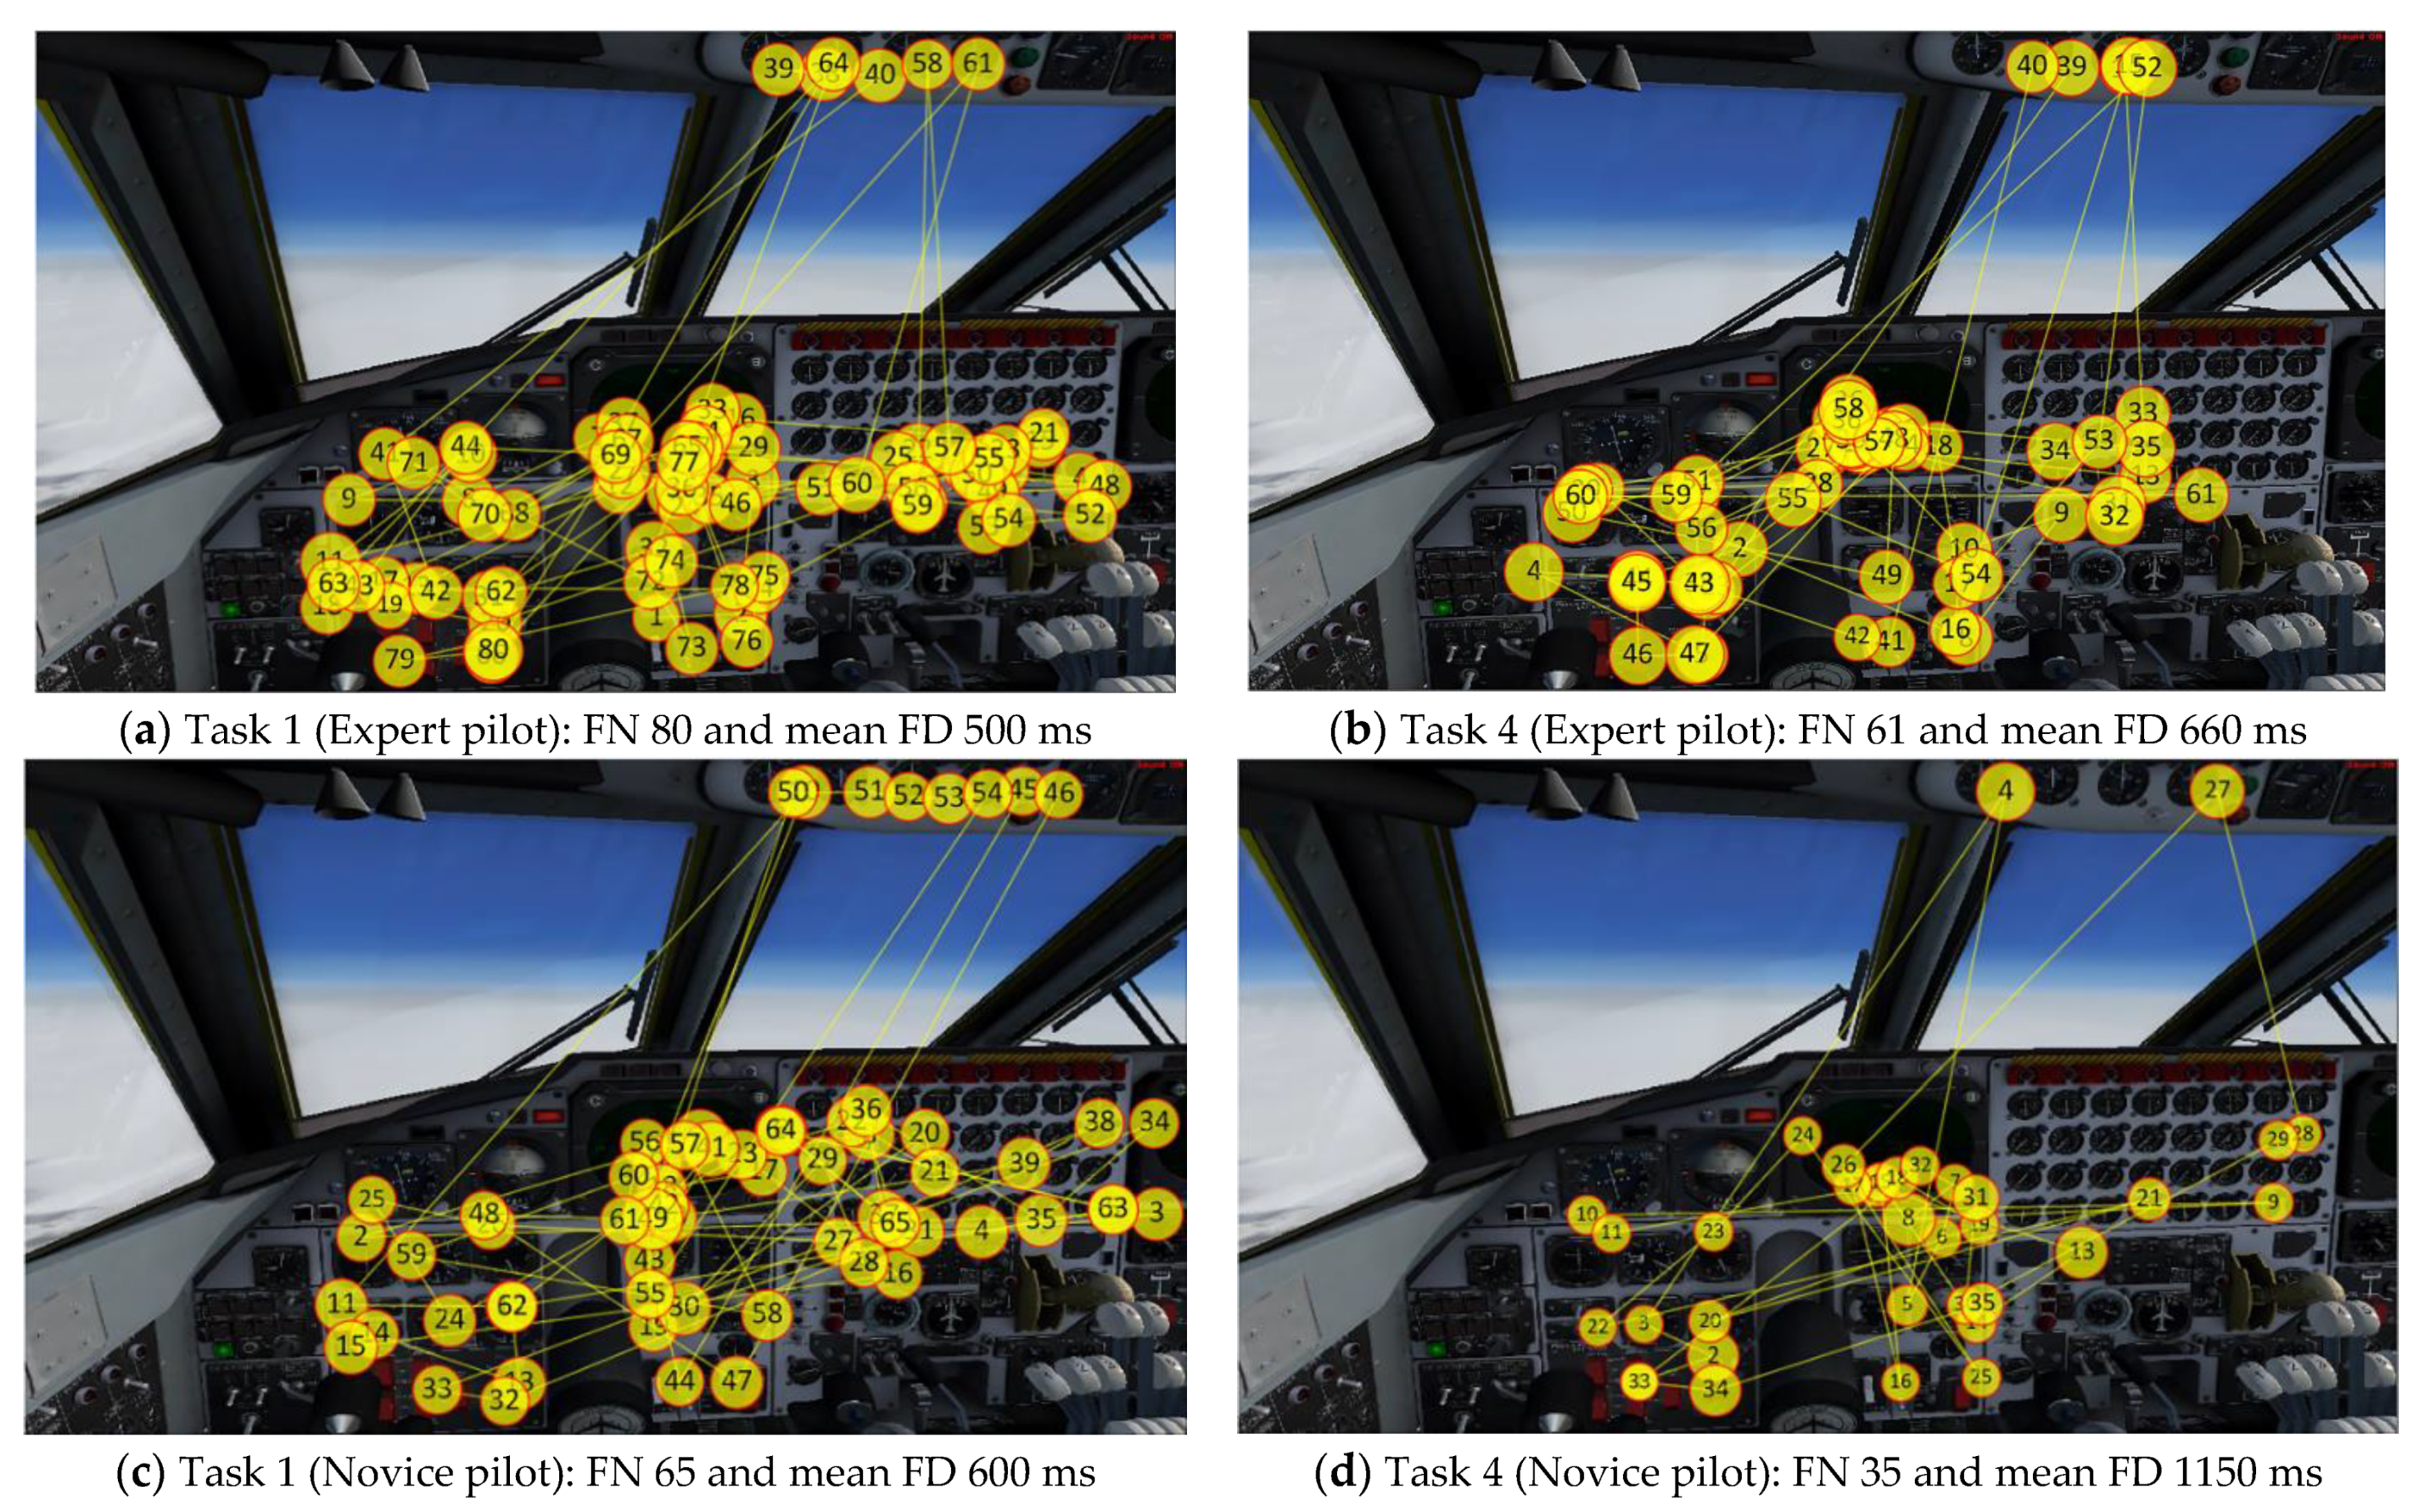
The response variables extracted from the PVT task were mean reaction times, mean number of lapses (i.e., number of reaction times greater than 500 milliseconds), and mean number of PVT false starts (i.e., defined as the number of reaction times less than 150 milliseconds). In addition, the unified PVT measure (see Step 4 within the proposed analysis approach above) was calculated using the three PVT measures by assigning equal weights. Context-dependent important AOIs for an IRF flight were identified as shown in
Figure 3. The context dependent AOIs were identified based on experts’ inputs as well as the collected eye fixation data overlaid on to the visual field of view (see
Figure 3) and analyzed using the eye fixations that occurred on those AOIs instead of dividing the whole field of view into AOIs. For example, the front and side windows were not defined as AOIs, since pilots only observed the instruments during the IRF flight. In addition, we verified that the pilots hardly looked through the front and side windows when we analyzed the recorded eye tracking data.
4.5. Data analysis
Two-way mixed model analysis with repeated measures were applied to consider tasks (i.e., tasks 1–4) and the expertise (i.e., novices vs. experts). After, the relationships among the variables were plotted followed by correlation analysis. After identifying the linear relationships, stepwise regressions were conducted using Equation (4).
6. Discussion
In summary, the increase in fatigue was verified through the PVT measures of reaction time, number of lapses, and number of false starts, and the results accord with many previous research efforts in aviation [
11,
15,
21,
22,
23,
24,
25,
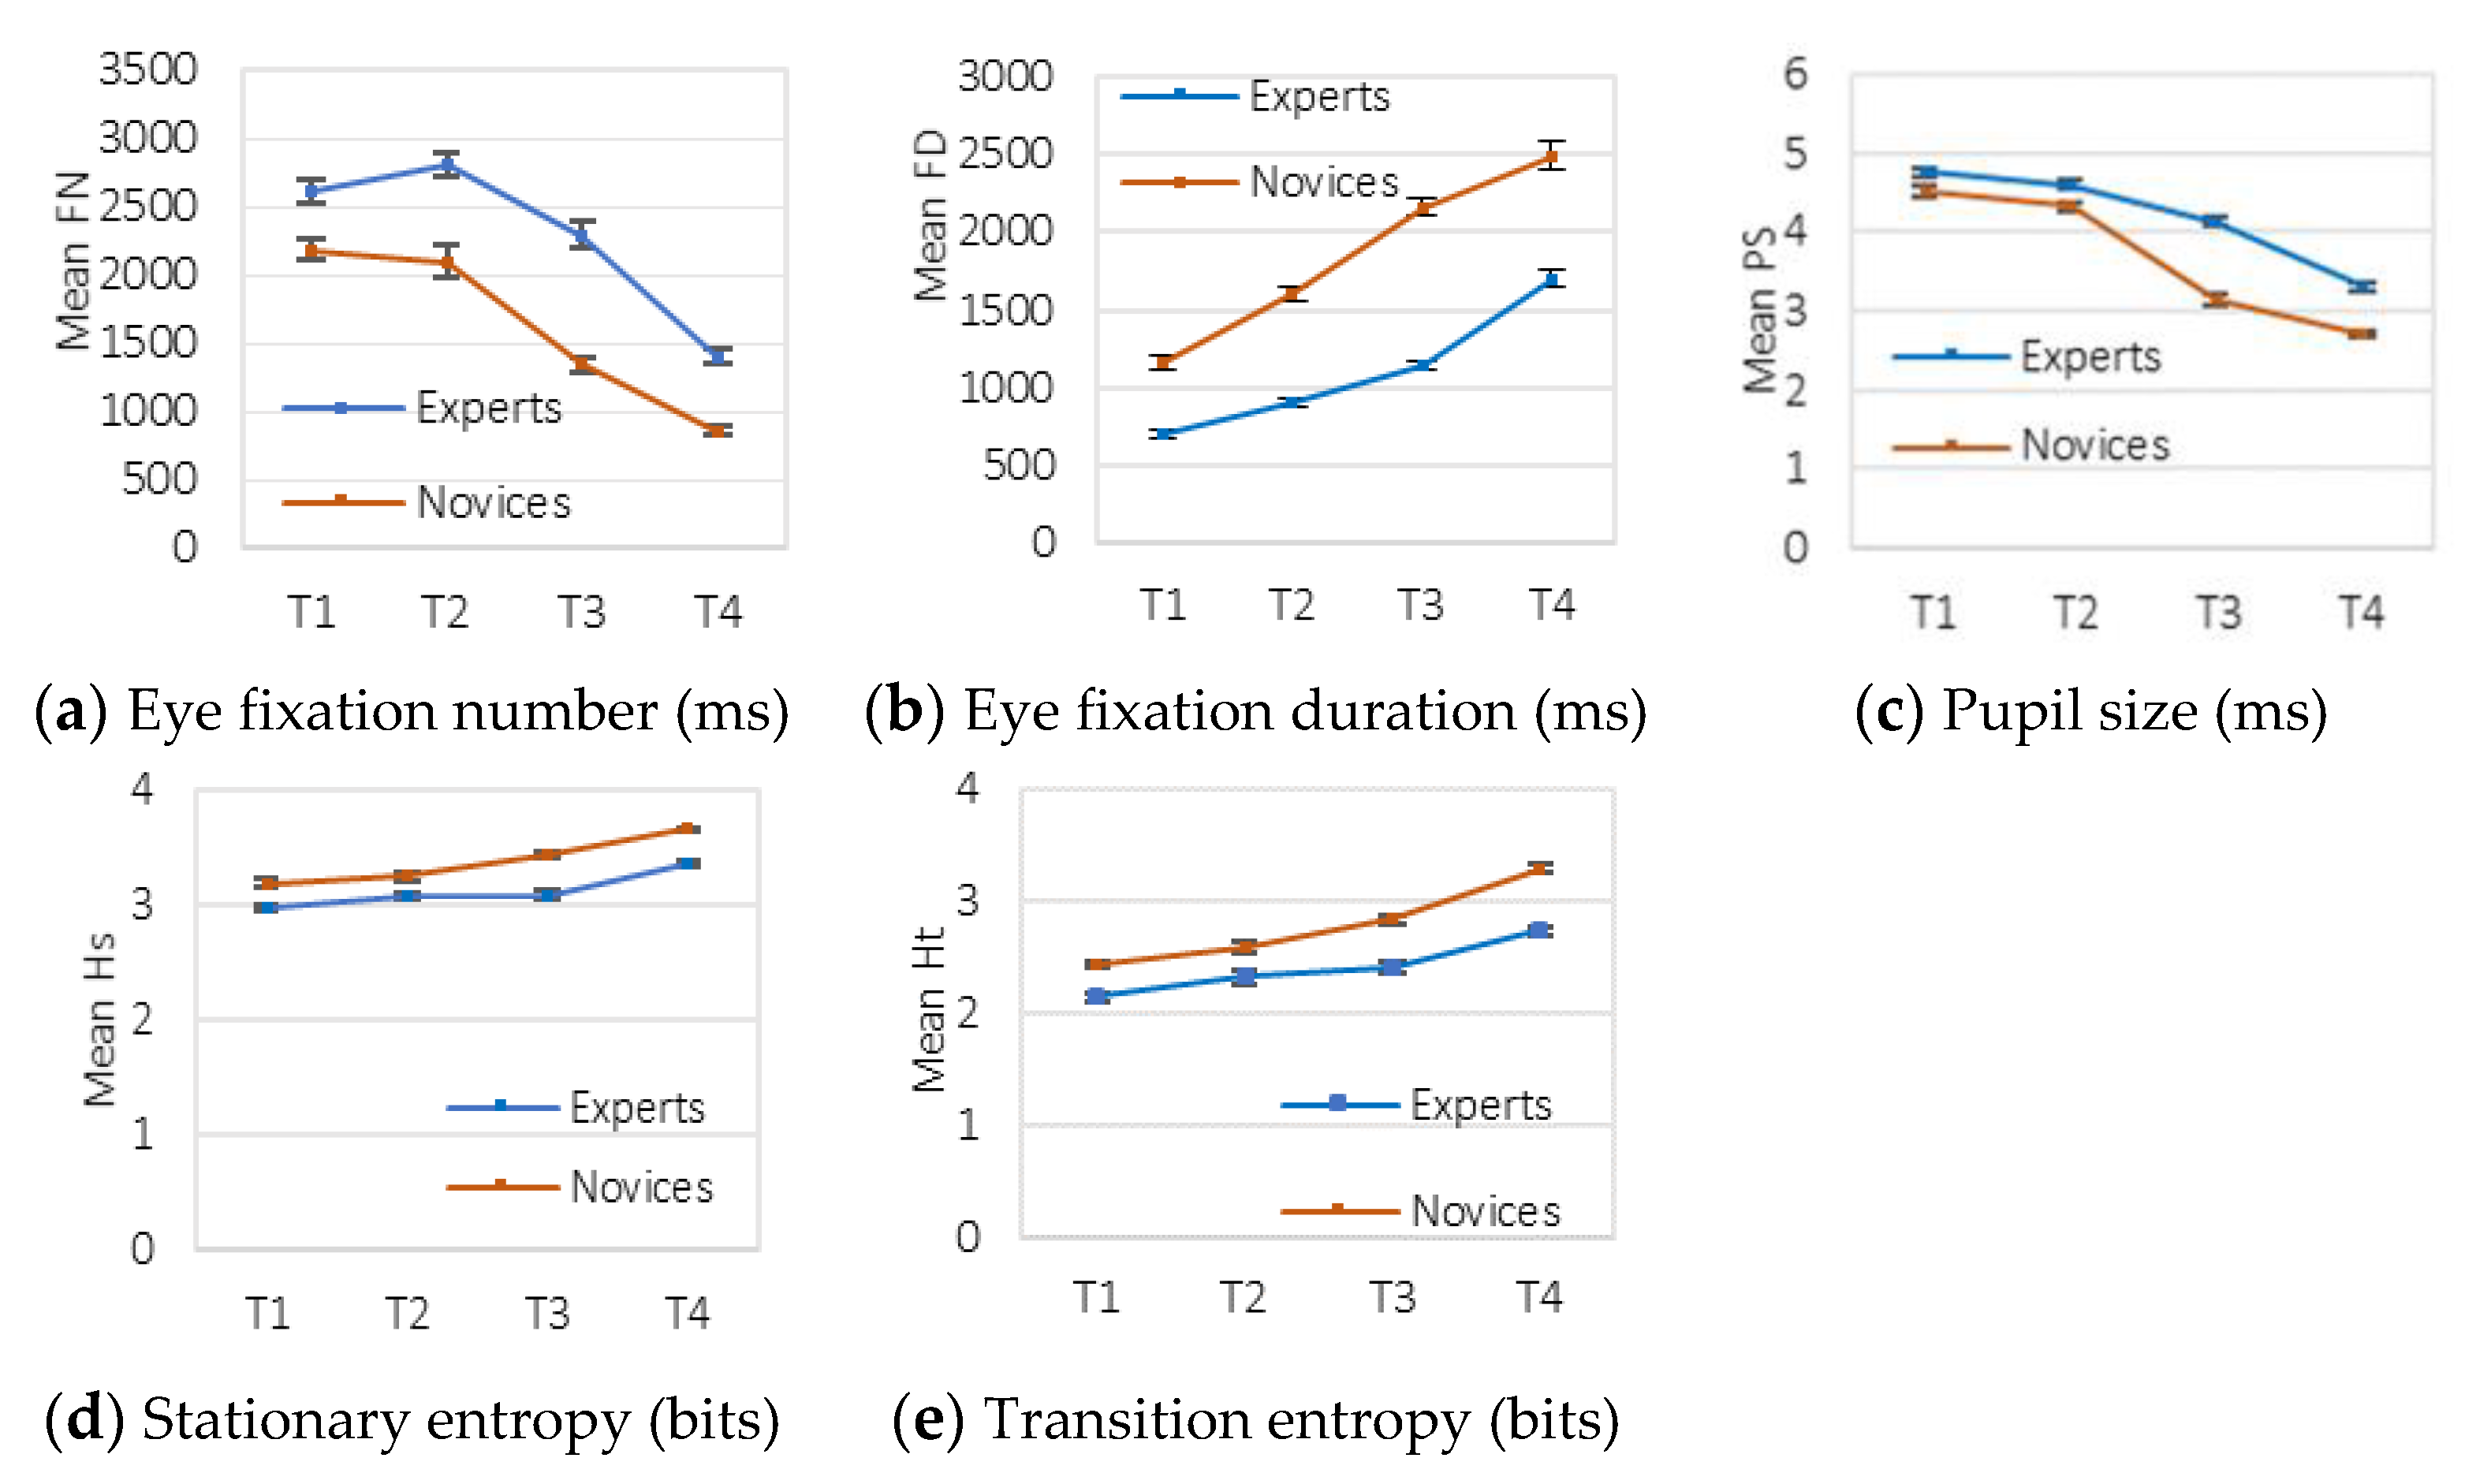
26]. The results allowed us to devise a unified PVT measure of combining the three measures to quantify a fatigued state as a single point. In addition, as fatigue increased, eye fixation duration increased, visual entropies (i.e., transition and stationary) increased, eye fixation number decreased, and pupil size decreased. The results enabled us to discover viable fatigue prediction models in a multi-leg flight based on expertise and using eye movement measures.
We learned that, unlike novices, the expert pilots had a greater number of eye fixations and shorter eye fixation duration on the context dependent AOIs throughout the flight mission. The results accord with a previous research [
34], in which expert pilots fixated upon more instruments and spent less time viewing each individual instrument compared to the novice pilots. We believe that, limited to the piloting task, more eye fixations might indicate more active information processing, whereas longer eye fixation might indicate the pilot needing more time to focus and process the information of interest.
Furthermore, in the case of the pupil size, it became progressively smaller (for both expert and novices) as fatigue increased over the course of the flight mission. The results are similar to existing research [
39], which also reported significantly smaller pupil size with increased pilot fatigue. What we have additionally discovered is that the experts’ pupil size remained relatively larger compared to the novice pilots as the task number increased (see
Figure 6c in the Results section). The size of the pupil varies with a person’s state of arousal, with an increase in arousal level resulting in dilation [
51]. Therefore, it seems that the novices were affected more by fatigue, meaning that the experts were able to keep the arousal state better than the novices.
Regarding the visual entropy outputs, both the stationary entropy and the transition entropy increased with higher fatigue levels. One possible reason might be that, with higher fatigue levels, pilots’ visual search strategy became more random in nature resulting in higher entropy values. Expert pilots showed significantly lower visual entropies (both stationary entropy and transition entropy) compared to novice pilots (see
Figure 6d,e in the Results section), indicating that the experts might have applied more overall organized (less random) visual search strategies that can reduce fatigue. Note that we have introduced the concept of entropy to better develop the fatigue prediction model and have not considered characterizing and classifying the visual search strategies. The analysis of the visual search strategies is out of the scope of this paper and requires an in-depth follow-up research.
The regression results show that, depending on the level of expertise of the pilot (experts vs. novices), a different set of eye tracking measures can be used for predicting fatigue. Furthermore, limited to our experiment conditions in a multiphase consecutive flight mission, the optimized models show that some eye movement measures can be more effective at predicting fatigue than others. Specifically, when observing the optimized models (Equations (7) and (8)), eye fixation duration was a significant predictor variable for both pilot groups, whereas the eye fixation number and the visual entropies can be additionally useful when assessing the fatigue of the novice pilots.
In addition, note that only eye fixation duration (FD) was sufficient in the optimized model for the expert pilots even though the eye fixation numbers (FN) seemed to be equally highly correlated. The reason is that FN was highly correlated with reaction times (RT) and number of lapses (L), but not highly correlated with false starts (FS). Since we used the unified PVT measure that considers all three measures of RT, L, and FS, the stepwise regression analysis resulted in not including FN as a predictor and only using FD was sufficient, in which the results are limited to our experiment conditions. We do not recommend the stakeholders to simply use the computed coefficients and the predictors in their unique environment. We do believe that the stakeholders could benefit by applying our developed research methods. We would be very interested in any insight other researchers could provide if they obtained similar or different regression models.
In detail, the results make us question whether we should only use the optimized models to predict fatigue. The important contribution of this research is that we were able to discover that all eye movement measures introduced in this paper are somewhat strongly correlated with fatigue, and some eye movement measures might better predict fatigue over other measures. The optimized models can vary based on individual differences, experiment settings, and/or the flight task types. Therefore, we recommend that the proposed research approach should be used as a foundation that can be further customized based individual needs and flight environment.
Furthermore, it will be possible to use each eye movement measure separately or in different combinations to provide multiple evidence (or accumulated evidence) to better detect and verify fatigue levels. To the best of our knowledge, the general guidelines are recommending a break after piloting an aircraft for a certain number of hours or legs. The multimodal analysis approach provided in this paper can be utilized to develop near real-time fatigue detection models that can be used as a tool to manage fatigue-related risk by proactively detecting fatigue of pilots.
7. Limitations and Future Research
One of the limitations of this research is that we collected and analyzed the data based on each flight phase (or leg) rather than across a continuous flow of time. The reason that we chose the above option was to compare the eye movement measures against the discrete PVT measures. Therefore, future research involves devising methods to evaluate fatigue continuously using only eye movement measures. The continuous evaluation can be done based on time (i.e., seconds, minutes, hours) or based on detailed events during take-off, cruising, and landing.
Another limitation in on defining an expert and a novice. How to define an expert and a novice has always been an issue raised by the research communities in all applications. Although we have used the thresholds based on the inputs of the flight instructors, opinions can differ, and unfortunately, the participants were not able to precisely recall their IFR flight hours. However, we believe that out classification of the participants into two groups were somewhat successful, as we did obtain distinctive differences between the two groups. We are planning to apply a set of carefully constructed criteria for follow-up research.
In addition, this research is concentrated on providing aggregated outputs. It is possible that individual differences can exist. Therefore, future research involves investigating whether individual eye movement characteristics, especially the individual’s visual scanning patterns, differ as fatigue levels increase. The analysis of the visual scanning patterns involves developing algorithms to effectively characterize and compare those differences.
In terms of the methodology, we have proposed the concept of the unified PVT measure, but more in-depth analysis is required on how to assign an optimal weight to each PVT measure. In this research, we assumed equal weights, but our assumption might be incorrect. Discovering an optimal weight value for each PVT measure is a challenging task which can be investigated through various algorithms and associated sensitivity analyses. We are currently working on how improve the regression models by developing appropriate algorithms that can find optimal weight values.
In addition, we had assumed that the initial fatigue levels of all the participants should be somewhat similar since the sleep and experiment time were controlled to the best of our abilities. In our future research, baseline measurements of initial fatigue should be obtained before the experiment is conducted.
The reason for the significant differences in term of the PVT measures seems that the experts might have developed more effective visual scanning strategies to reduce fatigue, and more in-depth analysis on the visual scanning strategies will be needed as future research. In more detail, the visual scanpaths were analyzed using the concept of visual entropy in this research; however, the visual scanpaths can be also characterized and classified based on the concept of visual groupings [
52] or graph theory [
53], among many others that we have published. We are currently investing viable options, including machine learning [
54], to better characterize and classify the visual scanning behaviors that can be used to predict fatigue.
Finally, this research can be used as a foundation to further develop near real-time fatigue detection models that can be used to alert the stakeholders and provide scaffolding options to the pilots, but we currently do not know what the threshold should be to trigger such alerts or the scaffolding options. If we could identify the possible thresholds, then the alerting and scaffolding options can be used in conjunction with the Boeing Alertness model [
55], currently used to develop regulations for duty time limitations. Note that the Boeing Alertness model cannot definitively answer whether the work schedule is acceptable and safe [
56], and the fatigue prediction approaches provided in this research might be able to provide a solution, possibly tailored to each pilot.


