Article

Aircraft Pilots Workload Analysis: Heart Rate Variability Objective Measures and NASA-Task Load Index Subjective Evaluation

1
Faculty of Engineering and Architecture, Kore University of Enna, 94100 Enna, Italy
2
Istituto de Engenharia Mecanica, Universidade Federal de Itajubá—UNIFEI, Minas Gerais 37500-903, Brazil
*
Author to whom correspondence should be addressed.
Aerospace 2020, 7(9), 137; https://doi.org/10.3390/aerospace7090137
Submission received: 30 July 2020 / Revised: 9 September 2020 / Accepted: 14 September 2020 / Published: 16 September 2020

Abstract

:
Workload and fatigue of aircraft pilots represent an argument of great interest in the framework of human factors and a pivotal point to be considered in aviation safety. 75% of aircraft accidents are related to human errors that, in most cases, are due to high level of mental workload and fatigue. There exist several subjective or objective metrics to quantify the pilots’ workload level, with both linear and nonlinear relationships reported in the literature. The main research objective of the present work is to analyze the relationships between objective and subjective workload measurements by looking for a correlation between metrics belonging to the subjective and biometric rating methods. More particularly, the Heart Rate Variability (HRV) is used for the objective analysis, whereas the NASA-TLX questionnaire is the tool chosen for the subjective evaluation of the workload. Two different flight scenarios were considered for the studies: the take-off phase with the initial climb and the final approach phase with the landing. A Maneuver Error Index (MEI) is also introduced to evaluate the pilot flight performance according to mission requirements. Both qualitative and quantitative correlation analyses were performed among the MEI, subjective and objective measurements. Monotonic relationships were found within the HRV indexes, and a nonlinear relationship is proposed among NASA-TLX and HRV indexes. These findings suggest that the relationship between workload, biometric data, and performance indexes are characterized by intricate patterns of nonlinear relationships.

1. Introduction

Increasing safety is one of the most crucial priorities in aviation transport, leading the aeronautical authorities and industries to increase aircraft reliability constantly, among other initiatives. Aviation safety is a very complex area that can be improved not only by taking into account the reliability of an aircraft and its systems but also considering and monitoring the crews’ performance and everyone involved in the aviation system. Seventy-five percent of aircraft accidents are related to human errors that, in most cases, derive from mental workload and fatigue of pilots and aviation operators in general [1]. Human error can be a consequence of design flaws, inadequate training, incorrect procedures, old manuals among other technical, environmental and organizational factors [2]. For example, the increasing technology in aircraft systems that, on the one hand, supports the pilots in reading, interpreting, and controlling flight variables, helps to carry out their tasks more efficiently and accurately. On the other hand, it can deeply increase the mental effort needed to manage the huge amount of information displayed. The drawback of the increasing advance in avionics technology along with job responsibilities, irregular sleep and the stressful shifts can consequently cause fatigue and work overload problems [1,3,4,5]. On this basis, in recent decades, the accurate comprehension of psychological and physiological characteristics associated with human errors have become of significant interest. The awareness of the pilots’ psycho-physical state and the real time monitoring of the mental workload during simulator training activity or in real flight can improve the efficiency of a crew and the safety of aviation operations. High and low workload conditions for pilots can affect flight performance and predispose crews for making errors [6,7,8].
Different methods are used to evaluate the mental workload that can be grouped into three main categories: task-related performance measurements, subjective assessments, and objective evaluation [9]. The first category is directly related to the definition of performance, provided by Paas et al. [10]. Performance can be roughly defined as the effectiveness in accomplishing a particular task, and thus the workload can be evaluated by analyzing the decrease in performance by the pilots.
The subjective assessment is based on standardized evaluations especially developed to make comparisons feasible; questionnaires belong to this category. However, since the responses are subjective, the results may differ depending on the personal interpretation of the evaluated criteria. For example, newly formed pilots experience uneven workload levels for the same task compared to more experienced pilots. On the other hand, physiology data are obtained by biometric sensors and are based on reliable information for evaluating and comparing workload [11,12,13].
Despite the differences, all methods of analysis should be employed in the evaluation of workload. The subjective assessment contains information related to the pilot’s perception that only can be investigated by this method. Simplicity, low cost, and in some cases, lack of invasive procedures [14], represent reasons that motivate the use of subjective measurements [15,16]. The National Aeronautics and Space Administration Task Load Index (NASA-TLX) is the commonly used instrument for subjective workload measurement due to its sensitivity and reliability [2,17,18,19]. There are two ways for a pilot to evaluate a stressful situation: (i) by a scale, usually numeric; (ii) by comparison between different items. The first method requires the pilot to attribute a value to the accomplished task, while in the comparison between items, the pilot chooses the type of demands that were perceived as most prominent.
For the objective measurement, the evaluation of workload can be obtained through the analysis of physiological signals directly related to the body’s natural response under stress situations. Factors such as Heart Rate Variability (HRV), body temperature, cerebral activity and ocular movement are examples of measurements to analyze the workload level [8,20,21]. Due to the technological advances, the available devices today are smaller, portable, more comfortable and more reliable [22]. Such advantages are more relevant in a cramped workspace, as the cockpit. A compact, wearable device with no connecting cables is mandatory for an in-flight activity analysis to not obstacle the use of the cockpit instruments. Moreover, distributed sensors potentially allow a more detailed analysis of each action and the identification of the main factors that contribute to stress. On the other hand, these measurements are not faultless. Some measurements are sensitive to the activity that is being carried out, especially in the case of multiple tasks, so for the evaluation of the workload more than one methodology should be considered [23].
This work presents a study on the relationship between the collected HRV biometric data of the pilots and the subjective data collected through the NASA-TLX questionnaire. In particular, the cardiac rhythm is used to determine the body’s natural response to stressful situations, while the subjective measurements are used to analyze how the pilot perceives these workloads. Moreover, an index is introduced with the aim of quantifying the performance of pilots in executing the requested tasks. The motivation lies in the fact that a reliable correlation of objective and subjective data can aid in the development of tools for real-time measurement of fatigue and workload, enabling more effective prevention of incidents and accidents.

2. Experiment and Methods

2.1. Flight Mission

As first step, a mission flight syllabus was arranged and explained to pilots during pre-flight briefing by a certified instructor. The take-off airport is Milano Linate (International Civil Aviation Organization code: LIML).
The simulation setup preset was 12:00 o’clock local time, wind velocity 3 kts with direction 030, runway dry condition and maximum friction coefficient considered, 6000 [lbs] of fuel symmetrically distributed between right and left tanks, atmosphere temperature equals to 14 C and atmospheric pressure adjusted to sea level QNH was 1013 [hPa]. The take-off was followed by a climb flight segment till the altitude of 10,000 feet where level flight conditions apply. Once the take-off and climb segment was accomplished, pilots performed the same sequence of maneuvers, in particular, two turns one left and one right, a stall maneuver, upset recovery, and a holding circuit. Following the qualified instructor’s request, all the pilots performed the sequence; therefore, it was possible to suppose a degree of additional workload equal for all pilots before starting the approach procedures. After about 30 min of flight, approach and landing were performed on the same runway. In the present work, the research activity is focused on two different flight segments. The first one consists of the take-off and climb phases described before and it is referred to with the label TO. The second segment, referred to as LA, starts with the procedure for airport runway radial interception at about 10 nautical miles (NM) from the runway threshold and then it continues with the ILS approach procedure and landing.

2.2. Pilots Data

The research sample was twenty-three pilots. Though the size of population appears to be low to achieve high statistical power, samples of similar size are used and reported in other literature works about flight simulation activity [15,16]. In the present study, the main limitation behind the small size of the sample is related to the experimental campaign employing a full flight simulator. Each session requires a time interval of about three hours, considering the pre-briefing, the flight mission, and the post-briefing with a qualified instructor. Such standards involve high costs for both the facility that supports the researchers’ activity free of charge and the pilots that give their time availability to perform the experimental campaign. Data in terms of mean, median and standard deviation of pilot characteristics are listed in Table 1: the value of mean and median are very close for the human body features, flight hours presents a lower median because the majority of the pilots that participated in the experiment had about 300 flight hours experience.

2.3. Experiment Hardware

The simulator used for the missions is located at the M.A.R.T.A. Centre (Mediterranean Aeronautics Research and Training Academy), a facility of the Kore University of Enna. The full flight simulator, replicates the aircraft CESSNA Citation C560 XLS and it is characterized by the highest level of fidelity requested by the EASA (European Aviation Safety Agency) regulation [24].
The sensor used for the HRV measurements is the Movisens EcgMove 3 [25]. Its electrodes are positioned directly on the pilots’ chest using a belt. The device is used to acquire the ECG of pilots during simulated flight missions. The EcgMove 3 has a raw data acquisition of 1024 Hz for ECG measurements, 64 Hz for 3D acceleration and 8 Hz for barometric altitude. The software UnisensViewer was used to check the data and select the time intervals for the analyses of the ECG signal and extract the HRV features [25].

2.4. Objective Measurements

The objective measurements are obtained by analyzing the ECG signal of each pilot in terms of HRV. In particular, the interval measurement between two successive R peaks, shown in Figure 1 and known as Inter Beat Interval (IBI), is considered to be one of the most useful HRV parameters for stress analysis [26].
In fact, when the IBI is constant, HRV is practically zero, and this is generally an indication of high mental stress. Moreover, the IBI parameter can be analyzed both in the frequency and in the time domains to compute workload indexes [27]. Among time domain-based indexes, the Standard Deviation of NN intervals (SDNN) is the standard deviation of “regular” RR intervals [28] and, according to the literature [16,29], the decrease of this parameter reflects an increase in mental workload [30,31] and in physical demand [32]. The NN interval corresponds to RR one when no artifacts are present in the ECG heart-beat waveform. SDNN is often associated with the Root Mean Square of Successive Differences (RMSSD) that varies inversely proportional to the stress variation [33], i.e., when stress increases the RMSSD decreases. Another useful index for workload analysis is the SD1, a geometric method quantity defined as the Poincaré’s ellipse semi axis perpendicular to the line of identity [34]. A low value of SD1 indicates a high level of stress. This parameter is also closely related to statistical measurements, i.e., the Standard Deviation of the Successive Difference (SDSD) of RR intervals [35].
On the other hand, the Low to High Frequency (LF/HF) ratio is a widely used parameter because it can provide information about the parasympathetic and sympathetic activities of the body [36]. The LF/HF index is obtained by using the fast Fourier transform to compute the power spectral density of the ECG signal associated with both low (0.04–0.15 Hz) and high (0.15–0.4 Hz) frequency bands [35,36,37]. It is observable that the LF/HF ratio increases when the difficulty of a demanded task increases due to the predominance of the sympathetic nervous system during stressing events.

2.5. Subjective Measurements

The NASA-TLX questionnaire [17] was designed to assess a person’s workload on a specific task and to compare the “stress” between different work situations. It is composed of six sub-scales: mental demand (related to the mental activity required by the exercise), physical demand (related to the level of physical effort employed to perform the task), temporal demand (related to the duration, intensity and pace at which the exercise occurred), own performance (related to the successes achieved during the task and satisfaction level gained with the results), effort (related to the work necessary to fulfill the task) and frustration (related to the feelings experienced during the task and the ratio between commitment and benefit achieved) [17]. At the end of each flight session, pilots are asked to assign a weight to each sub-scale; for each pair, they are asked to select the scale that, from their point of view, contributed more to the load felt during flight missions [17]. This type of analysis is considered to be a relevant and suitable subjective measurement and it allows comparing workload perceptions across different situations [38].
In the present study, the obtained NASA-TLX results showed the pilot’s perception of the workload level during the simulated flight mission. This afforded the investigation of relationships between objective and subjective data and provided essential information about the most important factors in the perception of workload.
Some inaccuracies can be expected from such results because the subjective measurement is sensitive to pilots’ interpretation, judgment and psycho-social state. In particular, pilots may tend to have a high self-estimation and underestimate difficulties, which may jeopardize the reliability of the data [39,40].

3. Flight Maneuvers Results

Two flight maneuver parameters were chosen to carry out the comparison mentioned above: Heading (HDG) [deg] and True Altitude (ALT) [ft] [14]. The flight segments chosen to analyze such parameters are take-off and climb phase (TO) and approach and landing phase (LA). Such flight maneuver parameters along with time intervals were selected to evaluate the data acquired during flight segments with respect to the thresholds imposed to pilots by the mission syllabus (more details are given in the Heading and Altitude subsections).

3.1. Heading

The Heading parameter was analyzed for the flight segments related to TO and LA. Figure 2a shows the initial climb procedure based on Standard Instrument Departure (SID) pathway tracked by the pilot during the TO segment, while Figure 2b shows the arrival route with ILS procedure related to LA segment. In a pre-flight briefing, systems and procedures were described to the pilots by an instructor. During the simulation, the instructor supervised the execution of the maneuvers. Figure 3 and Figure 4 show the heading angle ψ versus time for these phases, respectively. Take-off was executed from Runway 18/36 of Milan Linate airport, such reference heading is set to 0 . In the same figures, the standard deviation of the 23 pilots is reported together with the mean trend.
Figure 3 shows the HDG values for a time interval of 6 minutes after the release of the parking brake. It is possible to note that the deviation is almost zero during the ground roll, about the first 40 s, it increases until 100 s and then it decreases again close to 180 s. The reason is that the direction of the runway initially forces the route. After 40 s the aircraft detaches from the ground, then the pilot begins to rise in altitude and, simultaneously, heads towards Codogno (COD); during this TO phase, however, some pilots show initial disorientation in intercepting the correct radial vector. In the time interval between 160 and 200 s instead, all the pilots intercept the radial of 150 . The higher deviation values from 240 s on, depends on the way pilots approach towards Codogno, which was requested by the instructor.
As shown in Figure 4, a similar period of 6 minutes is used to analyze the landing performance. The end of this segment corresponds to the parking brake set. HDG equal to 0 in Figure 4, corresponds with the Runway heading 355 of Runway 18/36 of Milano Linate airport. It is possible to see that the deviation from the runway direction is above 50 for the first 100 s. Deviation from runway mid-axis depends on the route that the pilots perform to align with the path. Indeed, the position of aircraft at the beginning of the segment depends on the different position reached per pilot during cruising flight in accordance with the instructions of the instructor. From 120 s on, the standard deviation decreases and becomes negligible during the last 100 s, since the pilots are well aligned with the descent path.

3.2. Altitude

Figure 5 shows the altitude profile during the TO phase. The mission calls for an altitude of 10,000 ft and all pilots reach it after about 240 s from the initial maneuvers. The altitude in Figure 5 and Figure 6 starts from 340 ft that is the elevation of Milano Linate airport runway 36.
The time interval of 360 s is sufficient to analyze the range within which all the pilots reaches 10,000 ft, as required by the mission. The deviation gradually changes in the interval between 150 and 240 s because the pilots climb with different rates, not respecting the rate of climb imposed by the task. Concerning the LA phase, the same considerations made for the heading variation, shown in Figure 4, can be made here. As requested by the instructor in the pre-briefing session, the landing maneuver had to be performed according to the JEPPESEN 21-1 passing through DIXER. The reference altitude for the final approach was 3000 ft. The high deviation values shown in Figure 6 for the first 50 s are related to the way in which the pilots had performed the approach phase to the airport, starting from the previously performed task.

3.3. Maneuver Error Index

A Maneuver Error Index MEI was formulated and determined based on the flight path data recorded during the simulations. As reported in Equation (1) the index consists of two factors, one related to the heading and the other to the altitude; the index is computed for the two different segments TO and LA. The MEI for the heading and the altitude is computed based on Equations (2) and (3) respectively.
M E I = M E I H D G + M E I A L T
M E I H D G = 1 t j t k · ψ r ¯ t k t j ψ i t ψ r t d t
where ψ r ¯ is the mean heading within the segment, t j and t k are the time instants taken into account according to the instructor for computing the M E I H D G , see Table 2, ψ i is the heading for the i-th pilot and ψ r is the heading requested by the instructor.
M E I A L T = 1 t t t s · z r ¯ t s t t z i t z r t d t
Considering the M E I A L T , z r ¯ is the averaged altitude in the segment, the time instants t t and t s are reported in Table 2, z i is the altitude for the i-th pilot and z r is the requested altitude during the maneuver. Figure 7 shows the MEI values computed for each pilot during the TO segment. In particular, it is highlighted the M E I H D G because for each pilot appears dominant if compared with the M E I A L T . In Figure 7 the pilot 12 appears out of the mean, moreover, the pilots 14 and 19 shown a higher contribution of M E I A L T with respect to the M E I H D G .
Figure 8 shows the MEI values computed for the LA segment. Also, in Figure 8 it is highlighted the M E I H D G contribute for each pilot. From the behavior of MEI it is possible to observe that the relative influence of the M E I H D G during LA segment is lower than the TO case; this can be justified by the fact that during LA phase the route is conditioned by the path of the runway.

4. Workload Analysis

4.1. Objective Time-Averaged Data

The results were analyzed in terms of values averaged over time for each pilot and for both the TO and LA phases. The box plot method was used to present the data. Figure 9 shows the results obtained from the sample of 23 pilots. The median value of each index is shown with whiskers from the lowest to the largest data point. Observing the median values, it can be noticed that indexes suggest that the LA is most demanding in terms of workload. A higher LF/HF value is related to a higher level of workload and lower values of SD1 and SDNN are associated with higher workload level, therefore the results are in agreement.
Last, looking at Figure 9, it can also be observed that the sample presents a high degree of variance, in particular, the values of indexes are in some cases far from the median values, for both TO and LA. However, the research of outliers with the interquartile range threshold had shown that possible outliers related to different pilots arose from each HRV indexes. As a consequence, since it was not possible to individuate the existence of pilots samples that are outliers for every index, all the samples have been taken into account to carry out the successive analysis.

4.2. Objective Pilot-Averaged Data

The HRV data acquisition started ten minutes before the pilots entered the simulator cockpit. Figure 10 shows the time history of the HRV indices averaged over all pilot samples for both the TO and LA segments. Observing the range from 30 to 280 s, the TO segment presents higher levels of SD1 and SDNN parameters with respect to LA ones. Instead, the LF/HF parameter values during TO are lower than the LA values. Considering that the increase of workload is related to the increase of LF/HF ratio and to the reduction of SD1 and SDNN, it can be said that the TO segment is characterized by a lower level of the workload with respect to the LA phase. Focusing on the TO phase, and in particular on the initial phase 0–60 s, during which the liftoff occurs, it appears that there is a decrease in SD1 and SDNN; these results suggest that the workload level is slightly increasing during the initial take-off phase. Nevertheless, the LF/HF measurement trend is not consistent with these results. In the 240–360 s interval, SD1 increases allowing arguing that the level of mental workload of pilots is reducing. Such a reduction of mental stress can be associated with the fact that pilots reach the level flight attitude at about 240 s. A slight increase also appears in SDNN confirming SD1 result. Again, the LF/HF does not give significant information for the TO segment. Other variations are not relevant since in TO interval the indexes trend variations are less consistent than in LA phase.
On the other hand, with reference to the LA segment, it is possible to observe that the results show a first peak of LF/HF at 120 s, representative of an increase of the mental workload or stress. The trend of LF/HF anticipates the minimum of SDNN which occurs at about 180 s and that represents a high workload as well. Conversely, SD1 slightly decreases in the interval 0–60 s and then it remains almost contants untill 270 s, suggesting just an initial small increase of workload level. Moreover, the LF/HF ratio reaches its maximum value at 240 s, and then it reduces, indicating that the proximity with ground causes an increase in pilots’ mental stress level. From this point on, the levels of LF/HF decreases while the SD1 and SDNN increase indicating a reduction of the workload or stress level. This may be due to the fact that both the maneuver and mission are almost completed and the pilot begins to relax.

4.3. Subjective Time-Averaged Data

To evaluate the weight of each subscale [17] in the assessment of Overall Workload (OW), the participants was asked to indicate the subscales that, in their opinion, contributed most to the workload of the task. This was done by pairwise comparisons of the subscales, for a total of 15 pairs. In particular, the number of times that each term can be indicated by pilots can range from 0 (not relevant) to 5 (more important than any other factor) at most [17,38]. On this basis, the OW is computed as a weighted average of the six original ratings. Therefore each rating is weighted by its coefficient issued from the pairwise weighting method. The OW value is consequently computed by Equation (4):
O W = i = 1 6 w i · R i 15
where w i and R i denote the weight and rating value associated with the i-th workload source.
Figure 11 shows the results obtained from the sample of 23 pilots in term of OW for the TO and LA flight segments. Analyzing the median values of the sample, the subjective OW shows a value slightly higher for the LA phase which confirms the workload level evaluation obtained by means of the HRV measurements LF/HF, SD1 and SDNN. Moreover, the lower dispersion of the LA data denotes that the workload level was perceived in a more consistent way during the landing phase.

4.4. Subjective and Objective Results Comparison

As observed in the previous section, the degree of variance is high for the objective data, Figure 9, and the same stands for the subjective results, Figure 11. This can also imply that the objective workload index for some pilots may not reflect the result expected from the subjective perception of pilots. This is confirmed by the simple relationship matrix given in Figure 12.
The arrangements of pilot is set to show easily the association between subjective (OW) and objective (LF/HF, SD1 and SDNN) indexes.
Figure 12 shows the boolean relations between the estimation of workload level for LA and TO segments for each pilot and for both subjective and objective measurements based on the hypothesis that the workload for the LA segment is greater than the workload for the TO segment. If the assumption is verified then the cell that relates the measure index with the pilot index is filled in green and the boolean relation equals 1. Conversely, the cell is colored in red and the relation equals 0. This simple representation allows concluding that about the 56.5 % of the pilot population perceive the LA segment as more demanding in terms of overall workload with respect to the TO phase, as shown by result corresponding to the subjective NASA-TLX overall workload OW assessment. However, observing Figure 12 it can be noted that the objective indexes are often in disagreement with the subjective ones. The better agreement between the NASA-TLX OW measure and objective indexes is obtained for the S D 1 with a percentage agreement of 47.8 % . More in detail, from Figure 12, it appears that: pilots 12, 16, 20 and 22 are the only ones with a full correspondence between the overall workload evaluated by NASA-TLX and what emerges from the analysis of the HRV indexes; pilots 4, 8 and 23 show a perception of subjective overall workload for landing segment greater than the take-off one, namely OW LA > OW TO, but the HRV indexes show an opposite trend; vice versa, the OW LA is lower than OW TO (values of zero for the OW) for pilots 10, 14, 18 and 19 but the HRV indexes show discordant result. In all other cases, at least one index is in disagreement with the hypothesis.
Lastly, by comparing the results of the overall workload OW in Figure 11 and Figure 12 with MEI index in Figure 7, it can be pointed out that a low subjective perception of workload does not mean that the mission has been executed correctly. For instance, pilot 12 perceives a lower workload during the TO segment; however the MEI for the TO phase is about three times greater than the MEI mean value of all pilots; this indicates the pilot 12 did a greater amount of error in following the syllabus and instructor’s requests with respect to all the other pilots.

5. Correlation Analysis

The previous sections analyzed the different objective and subjective parameters in terms of HRV, MEI, and OW. The considerations made in that subsections suggest that the association between maneuver performance, subjective perception of workload and its objective estimation during flight is not obvious. For this reason a correlation analysis between the variables was carried out in the present section. The primary purpose was to identify the potential presence of a relationship between the NASA-TLX and the other objective parameters. Thus, the results obtained for all the pairs are presented below, employing a correlation matrix. In order to assess the presence of a correlation, two different methods of analysis were used: the Spearman’s rho [41] and the Randomized Dependence Coefficient (RDC) [42].
For the Spearman’s rho methods, the correlation matrix provides values between −1 and +1 [43]. If the calculated coefficient is 0, there is no relationship. A correlation of −1 or +1 means that there is a perfect correlation, inversely or directly proportional. Values of rho equal to 0.10, 0.30, 0.50 are representative of small, medium, or large effects respectively [44]. In Spearman’s rho case the significance value p has been calculated. If the p-value is low, it suggests the presence of a monotonic relationship between the two variables.
On the other hand, the RDC was used to search for non-linear correlations. The correlation matrix provides positive values between 0 and +1 [42]. Values close to +1 suggest the presence of an association pattern, but no gives information about type or direction. In the present work, to compute the RDC, a convergence analysis is performed over 1000 runs, with a number k of non-linear projections of the copula that varies in the range 1 to 20. A stable result is obtained for all the trials correlation with k = 20 , for more details about the method the interested reader is referred to literature [42].
The standard method of normalization by z-score [45] was used for the tests.
Correlation matrices are useful for examining the presence of a relationship between two or more continuous variables. Thus, Table 3 and Table 4 list, for each pair, the computed value under each considered method for the TO and LA segment, respectively. Analysis of OW data in 
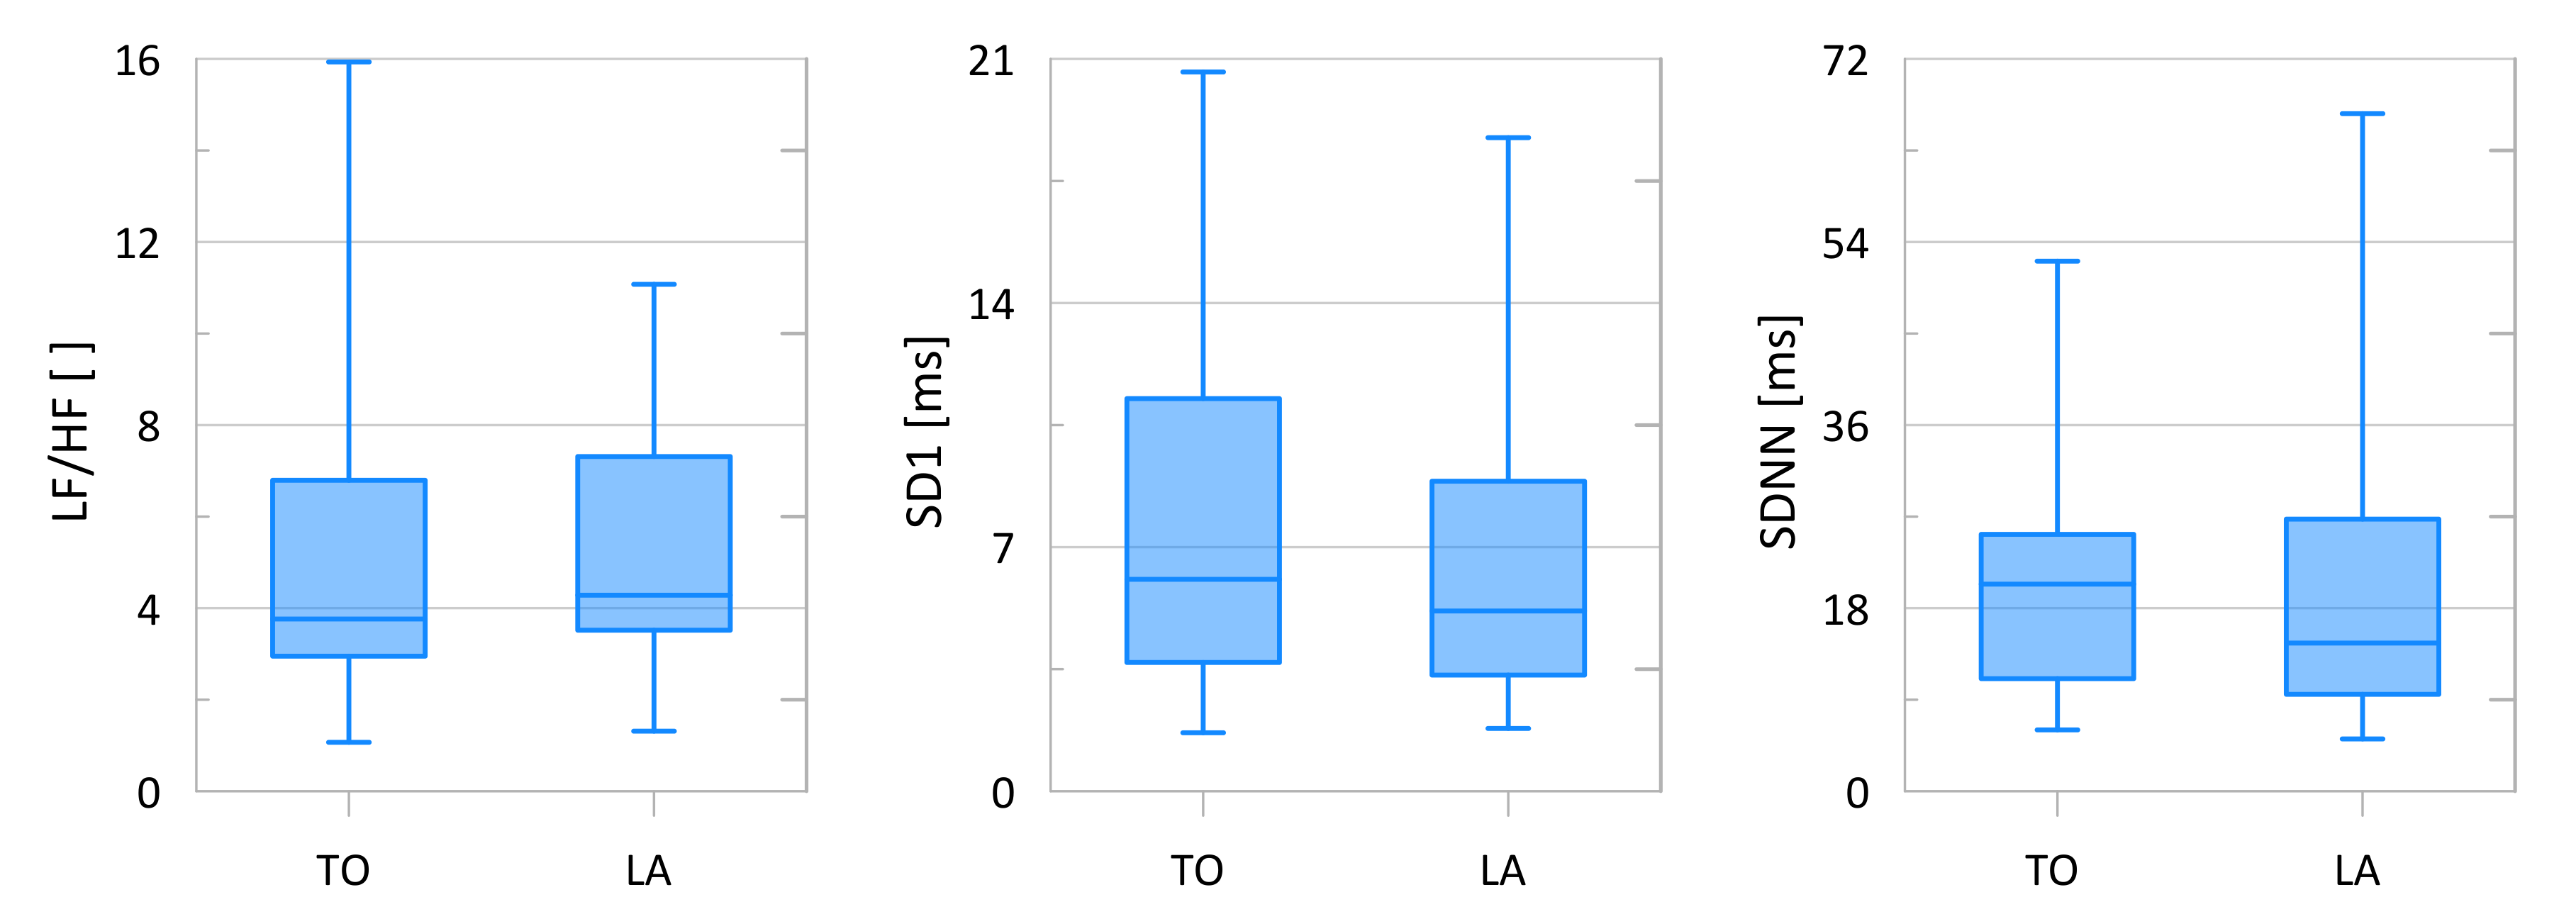
Table 3 shows a low correlation value between OW and HRV indexes. A Spearman’s rho correlation coefficient equal to −0.26 are obtained between NASA-TLX and LF/HF but it is not considered significant since p < 0.05. Similar results are obtained by Hsu et al. [37]. However, the RDC method reports a value equal to 0.66. This leads to consider the presence of a non-linear correlation between such variables. Moreover, RDC values greater than 0.7 for the pair (OW, SD1) and (OW, SDNN) are also obtained underlining non-linear relationships between HRV indexes and NASA-TLX. Analyzing the correlation between HRV indexes, again for the TO phase, it appears that the relationships between SD1 and SDNN is the most significant, with a value p < 0.001. Also the correlation among LF/HF, SD1 and SDNN can be considered large with p < 0.01. The presence of such correlation is confirmed by both Spearman’s rho and RDC coefficients. Last, the Spearman’s rho correlation coefficient values of the pairs with MEI are very low and not significant while the RDC continues to suggests the presence of a non-linear correlation even though its value is lower than the HRV ones.
In Table 4 the data concerning the LA segment are listed. Generally speaking, the results show lower values than the data listed in Table 3 exception made for RDC in the pair (OW, MEI) where higher value occurs, equal to 0.88. Also, for the LA phase, a linear correlation is found for the pair (SD1, SDNN) with values close to 1 and significance p < 0.001 . Analogous results were found by Hoshi et al. [46] in the pairs (LF/HF, SD1) and (SDNN, SD1), with an inverse relationship in (LF/HF, SD1) pairs. Thus, similar conclusions to the ones reported analyzing TO data can be drawn in the present LA case: the RDC suggests the presence of a non-linear relationships among OW, HRV indexes and MEI. This consideration is also supported by the fact that a low value of Spearman’s rank correlation coefficient just indicates that there is no tendency for one variable to either increase or decrease monotonically when the other variable increases.
Previous considerations motivate the search for a nonlinear transformation of raw data that, by applying mathematical functions that changes the variables’ measurement scales, improve the correlation between the data [47]. After the data transformation, the correlation no longer represents a linear or monotonic relationship on the original measurement scales; nevertheless, the Spearman’s rank correlation can still give an insight on the existing relationship [47]. The search of the optimal transformation is out of the scope of the present work; however, as a representative case, a possible transformation function, that has been obtained by a trial and error approach, is here reported for the pair (OW, LF/HF) for both TO and LA phases. More in details, the transformation function is applied to each point in the LF/HF data sets, i.e., each data point is replaced with the following transformed value
L F / H F i , α * = a s i n ( L F / H F i , α ) + b c o s ( L F / H F i , α a ) s i n ( L F / H F i , α )
where the star is used to label the transformed data, i = 1 , 2 , , 23 relates the variable to the pilot index while α = { T O , L A } , as an example. Table 5 gives the obtained results putting into evidence the influence of the transformation function through the values of its coefficients a and b.
As it appears from the results, it is possible to select some nonlinear transformation functions that improve the correlation between variables: a medium-to-large positive monotonic correlation between the L F / H F * index and the subjective NASA TLX index is obtained allowing infering an increase of pilot’s workload from the measurement of a cardiac signal such as the low to high HRV frequency ratio.

6. Conclusions

In this work, the pilots’ workload level was analyzed during the flight mission performed by using a Full Flight Simulator. Workload indexes were studied during two different flight segments presenting high mental demand, namely the take-off and climb phase and the approach and landing maneuver. A performance index named MEI was also proposed to quantify the pilots’ error in tracking the requested path. The results were analyzed considering both their time variation and their average values computed over the flight segments. The objective time-averaged data and the objective pilot-averaged data showed results in agreement with the reference literature in terms of workload levels. Qualitative evaluations were carried out based on comparisons among the different indexes. From those comparisons between the subjective and objective time-averaged measurements, it was possible to observe a higher overall workload for the approach and landing phase with respect to the take-off phase. For part of the pilots’ sample, subjective workload assessment values indicated a similar perception between the flight phases. Moreover, based on overall workload values computed from the NASA-TLX questionnaires, some pilots pointed out a higher workload during the TO phase even if their HRV indexes exhibited the opposite trend. Quantitative analysis was also performed employing statistical correlation approaches and both monotonic and nonlinear relationships were found for some indexes based on the analyzed sample.
The main limitation of the present work is related to the sample size. A larger sample will of course increase the statistical significance of the results. Another limitation regards the application of the RDC method. In fact, even if such method offers the advantage of identifying the presence of a non-linear relationship, at the same time, it does not provide information on the order or direction of such relationship. This leads to a possible future work that regards the identification of the nonlinear transformation functions by means, for instance, of heuristic optimization approaches.
Eventually, results showed that, in the considered aviation framework, it is not possible to evaluate the pilots’ workload level just by means of subjective measurements. In addition, results have shown the possibility and advantages of HRV based workload measurements during flight by using biometric sensors that can be integrated into the cockpit environment. Thus, the identification of the nonlinear transformation between biometric data and the subjective workload level can turn useful to set an algorithm for the online workload monitoring that can lead to an overall improvement of flight safety by giving quasi-real time information about the workload perceived by the pilot during flight.
Other future developments foresee the analysis of other HRV indices, both in time and frequency domain, during different flight segments characterized by workload levels that range from very low to critical. Furthermore, it is possible to extend the research to complementary work environments such as air traffic control operators or unmanned aircraft pilots.

Author Contributions

Conceptualization, A.A., A.E. and C.O.; methodology, A.A., A.E. and C.O.; investigation, A.A., A.E., C.O. and A.S.; data curation, A.E.; writing–original draft preparation, A.E. and A.S.; writing–review and editing, A.E., A.A. and C.O. All authors have read and agreed to the published version of the manuscript.

Funding

The study was funded by grants of the Italian Ministry of Education, Universities and Research (MIUR) under the RPASInAIR project—ARS01_00820, PON Research and Innovation 2014–2020.

Conflicts of Interest

The authors declare no conflict of interest.

Abbreviations

The following abbreviations are used in this manuscript:
ALTTrue Altitude
ANSAutonomic Nervous System
FFSFull Flight Simulator
FRFrustration
HDGHeading
HRHeart Rate
HRVHeart Rate Variability
IBIInter-Beat-Interval
ILSInstrument Landing System
LAApproach and landing segment
LF/HFLow Frequency/High Frequency
MICMaximal Information Coefficient
NASA-TLXNASA Task Load indeX
OWOverall Workload
PNSParasympathetic Nervous System
QNHQ code Nautical Height
RDCRandomized Dependence Coefficient
RMSSDRoot Mean Square of the Successive Differences
SD1Standard Deviation of the Poincaré plot perpendicular to the line of identity
SDNNStandard Deviation of Normal RR intervals
SIDStandard Instrument Departure
SNSSympathetic Nervous System
TOTake-off and climb segment

References

  1. Kharoufah, H.; Murray, J.; Baxter, G.; Wild, G. A review of human factors causations in commercial air transport accidents and incidents: From to 2000–2016. Prog. Aerosp. Sci. 2018, 99, 1–13. [Google Scholar]
  2. Dumitru, I.M.; Boşcoianu, M. Human factors contribution to aviation safety. In Proceedings of the International Conference of Scientific Papper AFASES, Brasov, Romania, 28–30 May 2015; pp. 49–53. [Google Scholar]
  3. Petrilli, R.M.; Roach, G.D.; Dawson, D.; Lamond, N. The sleep, subjective fatigue, and sustained attention of commercial airline pilots during an international pattern. Chronobiol. Int. 2006, 23, 1357–1362. [Google Scholar] [PubMed]
  4. Gander, P.H.; Signal, T.L.; van den Berg, M.J.; Mulrine, H.M.; Jay, S.M.; Jim Mangie, C. In-flight sleep, pilot fatigue and P sychomotor V igilance T ask performance on ultra-long range versus long range flights. J. Sleep Res. 2013, 22, 697–706. [Google Scholar] [PubMed]
  5. Bennett, S.A. Pilot workload and fatigue on short-haul routes: An evaluation supported by instantaneous self-assessment and ethnography. J. Risk Res. 2018, 21, 645–677. [Google Scholar]
  6. Boff, K.R.; Kaufman, L.; Thomas, J.P. Handbook of Perception and Human Performance; Wiley: Hoboken, NJ, USA, 1986. [Google Scholar]
  7. Mansikka, H.; Simola, P.; Virtanen, K.; Harris, D.; Oksama, L. Fighter pilots’ heart rate, heart rate variation and performance during instrument approaches. Ergonomics 2016, 59, 1344–1352. [Google Scholar]
  8. Liu, J.; Gardi, A.; Ramasamy, S.; Lim, Y.; Sabatini, R. Cognitive pilot-aircraft interface for single-pilot operations. Knowl. Based Syst. 2016, 112, 37–53. [Google Scholar]
  9. Miller, S. Workload Measures—Literature Review; National Advanced Driving Simulator: Coralville, IA, USA, 2001. [Google Scholar]
  10. Paas, L.; Vanmerrienboer, J. The Efficiency of Instructional Conditions - an Approach to Combine Mental Effort and Performance-Measures. Hum. Factors 1993, 35, 737–743. [Google Scholar]
  11. Borghini, G.; Astolfi, L.; Vecchiato, G.; Mattia, D.; Babiloni, F. Measuring neurophysiological signals in aircraft pilots and car drivers for the assessment of mental workload, fatigue and drowsiness. Neurosci. Biobehav. Rev. 2014, 44, 58–75. [Google Scholar] [PubMed]
  12. Wanyan, X.; Zhuang, D.; Zhang, H. Improving pilot mental workload evaluation with combined measures. Bio-Med Mater. Eng. 2014, 24, 2283–2290. [Google Scholar]
  13. Baevsky, R.M.; Chernikova, A.G. Heart rate variability analysis: Physiological foundations and main methods. Cardiometry 2017, 10, 66–76. [Google Scholar]
  14. Alaimo, A.; Esposito, A.; Orlando, C.; Tesoriere, G. A Pilot mental workload case study in a Full Flight Simulator. Aerotec. Missili Spaz. 2018, 97, 27–33. [Google Scholar]
  15. Cao, X.; MacNaughton, P.; Cadet, L.R.; Cedeno-Laurent, J.G.; Flanigan, S.; Vallarino, J.; Donnelly-McLay, D.; Christiani, D.C.; Spengler, J.D.; Allen, J.G. Heart rate variability and performance of commercial airline pilots during flight simulations. Int. J. Environ. Res. Public Health 2019, 16, 237. [Google Scholar]
  16. Mansikka, H.; Virtanen, K.; Harris, D. Comparison of NASA-TLX scale, modified Cooper–Harper scale and mean inter-beat interval as measures of pilot mental workload during simulated flight tasks. Ergonomics 2018, 69, 246–254. [Google Scholar]
  17. Hart, S.G.; Staveland, L.E. Development of NASA-TLX (Task Load Index): Results of empirical and theoretical research. In Advances in Psychology; Elsevier: Amsterdam, The Netherlands, 1988; Volume 52, pp. 139–183. [Google Scholar]
  18. Hancock, P.A.; Meshkati, N. Human Mental Workload; Elsevier: Amsterdam, The Netherlands, 1988. [Google Scholar]
  19. Rubio, S.; Díaz, E.; Martín, J.; Puente, J.M. Evaluation of subjective mental workload: A comparison of SWAT, NASA-TLX, and workload profile methods. Appl. Psychol. 2004, 53, 61–86. [Google Scholar]
  20. Pongsakornsathien, N.; Lim, Y.; Gardi, A.; Hilton, S.; Planke, L.; Sabatini, R.; Kistan, T.; Ezer, N. Sensor networks for aerospace human-machine systems. Sensors 2019, 19, 3465. [Google Scholar]
  21. Mélan, C.; Cascino, N. A multidisciplinary approach of workload assessment in real-job situations: Investigation in the field of aerospace activities. Front. Psychol. 2014, 5, 964. [Google Scholar]
  22. Dias, D.; Paulo Silva Cunha, J. Wearable health devices—Vital sign monitoring, systems and technologies. Sensors 2018, 18, 2414. [Google Scholar]
  23. Alaimo, A.; Esposito, A.; Orlando, C. Cockpit Pilot Warning System: A Preliminary Study. In Proceedings of the 2018 IEEE 4th International Forum on Research and Technology for Society and Industry (RTSI), Palermo, Italy, 10–13 September 2018; IEEE: Piscataway, NJ, USA, 2018; pp. 1–4. [Google Scholar]
  24. EASA. Certification Specifications for Aeroplane Flight Simulation Training Devices; EASA: Cologne, Germany, 2012; p. 22. [Google Scholar]
  25. Movisens GmbH. EcgMove 3 User Manual; Movisens GmbH: Karlsruhe, Germany, 2018. [Google Scholar]
  26. Henelius, A.; Hirvonen, K.; Holm, A.; Korpela, J.; Muller, K. Mental workload classification using heart rate metrics. In Proceedings of the 2009 Annual International Conference of the IEEE Engineering in Medicine and Biology Society, Minneapolis, MN, USA, 3–6 September 2009; IEEE: Piscataway, NJ, USA, 2009; pp. 1836–1839. [Google Scholar]
  27. Acharya, R.; Kannathal, N.; Sing, O.W.; Ping, L.Y.; Chua, T. Heart rate analysis in normal subjects of various age groups. Biomed. Eng. Online 2004, 3, 24. [Google Scholar]
  28. Shaffer, F.; Ginsberg, J. An overview of heart rate variability metrics and norms. Front. Public Health 2017, 5, 258. [Google Scholar]
  29. Watson, D.W. Physiological correlates of heart rate variability (HRV) and the subjective assessment of workload and fatigue in-flight crew: A practical study. In Proceedings of the 2001 People in Control. In Proceedings of the Second International Conference on Human Interfaces in Control Rooms, Cockpits and Command Centres, Manchester, UK, 19–21 June 2001; IET: London, UK, 2001; pp. 159–163. [Google Scholar]
  30. Myrtek, M.; Fichtler, A.; Strittmatter, M.; Brügner, G. Stress and strain of blue and white collar workers during work and leisure time: Results of psychophysiological and behavioral monitoring. Appl. Ergon. 1999, 30, 341–351. [Google Scholar]
  31. Tattersall, A.J.; Hockey, G.R.J. Level of operator control and changes in heart rate variability during simulated flight maintenance. Hum. Factors 1995, 37, 682–698. [Google Scholar] [PubMed]
  32. DiDomenico, A.; Nussbaum, M.A. Effects of different physical workload parameters on mental workload and performance. Int. J. Ind. Ergon. 2011, 41, 255–260. [Google Scholar]
  33. Orsila, R.; Virtanen, M.; Luukkaala, T.; Tarvainen, M.; Karjalainen, P.; Viik, J.; Savinainen, M.; Nygård, C.H. Perceived mental stress and reactions in heart rate variability—A pilot study among employees of an electronics company. Int. J. Occup. Saf. Ergon. 2008, 14, 275–283. [Google Scholar] [PubMed]
  34. Brennan, M.; Palaniswami, M.; Kamen, P. Do existing measures of Poincare plot geometry reflect nonlinear features of heart rate variability? IEEE Trans. Biomed. Eng. 2001, 48, 1342–1347. [Google Scholar] [PubMed]
  35. Camm, A.; Malik, M.; Bigger, J.; Breithardt, G.; Cerutti, S.; Cohen, R.; Coumel, P.; Fallen, E.; Kennedy, H.; Kleiger, R.; et al. Heart rate variability: Standards of measurement, physiological interpretation and clinical use. Task Force of the European Society of Cardiology and the North American Society of Pacing and Electrophysiology. Circulation 1996, 93, 1043–1065. [Google Scholar]
  36. Bilan, A.; Witczak, A.; Palusiński, R.; Myśliński, W.; Hanzlik, J. Circadian rhythm of spectral indices of heart rate variability in healthy subjects. J. Electrocardiol. 2005, 38, 239–243. [Google Scholar]
  37. Hsu, B.W.; Wang, M.J.J.; Chen, C.Y.; Chen, F. Effective indices for monitoring mental workload while performing multiple tasks. Percept. Mot. Ski. 2015, 121, 94–117. [Google Scholar]
  38. Hart, S.G. NASA-task load index (NASA-TLX); 20 years later. In Proceedings of the Human Factors and Ergonomics Society Annual Meeting; San Fransisco, CA, USA, 16–20 October 2006, Sage Publications Sage CA: Los Angeles, CA, USA, 2006; Volume 50, pp. 904–908. [Google Scholar]
  39. Casner, S.M.; Gore, B.F. Measuring and evaluating workload: A primer. NASA Tech. Memo. 2010, 216395, 2010. [Google Scholar]
  40. Shakouri, M.; Ikuma, L.H.; Aghazadeh, F.; Nahmens, I. Analysis of the sensitivity of heart rate variability and subjective workload measures in a driving simulator: The case of highway work zones. Int. J. Ind. Ergon. 2018, 66, 136–145. [Google Scholar]
  41. Spearman, C. The proof and measurement of association between two things. Am. J. Psychol. 1987, 100, 441–471. [Google Scholar]
  42. Lopez-Paz, D.; Hennig, P.; Schölkopf, B. The randomized dependence coefficient. In Proceedings of the 26th International Conference on Neural Information Processing Systems; Curran Associates Inc.: Red Hook, NY, USA, 2013; Volume 1, pp. 1–9. [Google Scholar]
  43. Hauke, J.; Kossowski, T. Comparison of values of Pearson’s and Spearman’s correlation coefficients on the same sets of data. Quaest. Geogr. 2011, 30, 87–93. [Google Scholar]
  44. Cohen, J. Statistical Power Analysis for the Behavioral Sciences; Lawrence Erlbaum Associates: Mahwah, NJ, USA, 1988. [Google Scholar]
  45. Abdi, H. Z-scores. Encycl. Meas. Stat. 2007, 3, 1055–1058. [Google Scholar]
  46. Hoshi, R.A.; Pastre, C.M.; Vanderlei, L.C.M.; Godoy, M.F. Poincaré plot indexes of heart rate variability: Relationships with other nonlinear variables. Auton. Neurosci. 2013, 177, 271–274. [Google Scholar]
  47. Tabachnick, B.G.; Fidell, L.S. Using Multivariate Statistics, 6th ed.; Pearson: Boston, MA, USA, 2006. [Google Scholar]
Figure 1. RR Peak detection.
Aerospace 07 00137 g001
Figure 2. Path to be followed during TO segment (a) and LA segment (b).
Aerospace 07 00137 g002
Figure 3. Heading during TO segment.
Aerospace 07 00137 g003
Figure 4. Heading during LA segment.
Aerospace 07 00137 g004
Figure 5. Altidude during TO segment.
Aerospace 07 00137 g005
Figure 6. Altitude during LA segment.
Aerospace 07 00137 g006
Figure 7. Maneuver Error Index for TO segment.
Aerospace 07 00137 g007
Figure 8. Maneuver Error Index for LA segment.
Aerospace 07 00137 g008
Figure 9. Values of HRV workload assessment indexes for TO and LA segment over the sample.
Aerospace 07 00137 g009
Figure 10. HVR Comparison within flight segments.
Aerospace 07 00137 g010
Figure 11. NASA-TLX workload assessment indexes for TO and LA segment over the sample.
Aerospace 07 00137 g011
Figure 12. NASA-TLX and HRV comparison.
Aerospace 07 00137 g012
Table 1. Pilots characteristics.
FeaturesFlight HoursYearsHeight [m]Weight [kg]
Mean633.131.81.7475.4
Median285.029.01.7575.0
Standard deviation1146.28.10.0611.7
Table 2. Time values in seconds for evaluation of MEI within TO and LA.
t k t j t s t t
TO0180220360
LA100310100310
Table 3. Correlation Matrix for TO segment.
OWLF/HFSD1SDNNMEI
OWSpearman’s rho-−0.260.040.140.27
RDC-0.660.720.760.59
LF/HFSpearman’s rho -−0.44 *−0.47 *−0.06
RDC -0.820.910.61
SD1Spearman’s rho -0.93 ***0.10
RDC -0.930.59
SDNNSpearman’s rho -0.07
RDC -0.59
Note: * p < 0.05 , ** p < 0.01 , *** p < 0.001 .
Table 4. Correlation Matrix for LA segment.
OWLF/HFSD1SDNNMEI
OWSpearman’s rho-−0.14−0.05−0.050.20
RDC-0.600.570.560.88
LF/HFSpearman’s rho -−0.58 **−0.66 **0.04
RDC -0.910.860.64
SD1Spearman’s rho -0.96 ***−0.02
RDC -0.940.72
SDNNSpearman’s rho -0.00
RDC -0.60
Note: * p < 0.05 , ** p < 0.01 , *** p < 0.001 .
Table 5. Spearman’s ρ ( L F / H F * , O W ) and significance value.
TOLA
ab ρ p ρ p
25−8.50.43640.03740.43310.0390
4.59−14.70.48530.01890.67140.0005

