Article

Agent-Based Distributed Planning and Coordination for Resilient Airport Surface Movement Operations

by
Konstantine Fines
1,2,*,
Alexei Sharpanskykh
2 and
Matthieu Vert
2
1
MovingDot B.V., Antareslaan 43, 2132 JE Hoofddorp, The Netherlands
2
Aerospace Engineering Faculty, Delft University of Technology, Kluyverweg 1, 2629 HS Delft, The Netherlands
*
Author to whom correspondence should be addressed.
Aerospace 2020, 7(4), 48; https://doi.org/10.3390/aerospace7040048
Submission received: 3 March 2020 / Revised: 30 March 2020 / Accepted: 15 April 2020 / Published: 19 April 2020

Abstract

:
Airport surface movement operations are complex processes with many types of adverse events which require resilient, safe, and efficient responses. One regularly occurring adverse event is that of runway reconfiguration. Agent-based distributed planning and coordination has shown promising results in controlling operations in complex systems, especially during disturbances. In contrast to the centralised approaches, distributed planning is performed by several agents, which coordinate plans with each other. This research evaluates the contribution of agent-based distributed planning and coordination to the resilience of airport surface movement operations when runway reconfigurations occur. An autonomous Multi-Agent System (MAS) model was created based on the layout and airport surface movement operations of Schiphol Airport in the Netherlands. Within the MAS model, three distributed planning and coordination mechanisms were incorporated, based on the Conflict-Based Search (CBS) Multi-Agent Path Finding (MAPF) algorithm and adaptive highways. MAS simulations were run based on eight days of real-world operational data from Schiphol Airport and the results of the autonomous MAS simulations were compared to the performance of the real-world human operated system. The MAS results show that the distributed planning and coordination mechanisms were effective in contributing to the resilient behaviour of the airport surface movement operations, closely following the real-world behaviour, and sometimes even surpassing it. In particular, the mechanisms were found to contribute to more resilient behaviour than the real-world when considering the taxi time after runway reconfiguration events. Finally, the highway included distributed planning and coordination mechanisms contributed to the most resilient behaviour of the airport surface movement operations.

1. Introduction

Airport surface movement operations are complex processes, which are constantly exposed to different types of adverse events. One regularly occurring adverse event that the airport surface movement system must be able to cope with is that of runway reconfigurations. These occur due to changing weather, traffic demand, or time of day and often result in an altered airport surface situation, as the airport surface movement operations must adapt to accommodate these adverse operational changes. For example, different aircraft taxi routings may be needed, or new traffic streams may suddenly emerge, which require modifications in the handling of the altered traffic flows. These adaptations of the airport surface movement operations should be done in a resilient, safe, and efficient manner, to achieve the fundamental goals of air traffic services [1,2,3,4,5,6] including reducing CO 2 emissions [7]. In this study, a system is considered resilient if it has the intrinsic ability to adapt its functioning prior to, during, or after such adverse events so that it can sustain the required operations [8].
Currently, the airport surface movement operations are controlled by Air Traffic Control Officers (ATCOs) at airports. The ATCOs closely resemble a centralised system where one ATCO is responsible for controlling and coordinating aircraft in their sector in order to ensure the safe and efficient flow of traffic. Within this centralised system, the performance of operations is significantly influenced by the amount of traffic under an ATCO’s control, their experience, and adverse events that affect the operational environment [9,10]. In contrast to this, automation and decentralized approaches have been shown to be beneficial in order to improve safety, ATCO workload and the handling of complex traffic situations [11,12]. Previous studies [13,14] provided evidence that global, centralized control is not indispensable for efficient and safe airport surface movement operations. The distributed approach based on the autonomous Multi-Agent System (MAS) presented in this study is able to manage simultaneously complex, often conflicting traffic flows of aircraft that frequently occur in transition periods of runway reconfigurations. Because of the traffic complexity and cognitive limitations of ATCOs, these traffic flows are often managed sequentially by centralized Air Traffic Control (ATC), i.e., first handling traffic from the previous configuration, and only then proceeding with traffic corresponding to the new configuration. Such a sequential way of controlling by the centralized approach is less efficient than managing multiple flows simultaneously by the distributed agent-based approach. At the same time, both approaches aim at maintaining safety of operations in all cases.
Agent-based distributed planning and coordination has shown promising results with respect to maintaining safe and efficient levels of operations in complex systems, especially in the case of disturbances. For example, this has been achieved in automated, large power grid systems [15], controlling the plan executions of robots [16], and its benefits have been highlighted in certain aspects of air traffic control [17]. Furthermore, decentralisation in airport surface movement systems [13,14] has been shown to be effective in controlling aircraft on the airport’s surface. In particular, decentralised bidding coordination mechanisms [13] resulted in the airport surface movement system performing more efficiently than the real-world. These studies concluded that such approaches were able to safely and efficiently handle complex and chaotic taxi operations with only a limited amount of information exchange being required. This suggests that a distributed planning and coordination approach may enable, potentially, a better organization of the system, especially in the case of disturbed situations due to adverse events. However, no research was done on the application of such methods for studying the resilience of airport surface movement operations. Therefore, the goal of this research is to evaluate the contribution of agent-based distributed planning and coordination to the resilience of airport surface movement operations when runway reconfigurations occur.
Multiple distributed planning and coordination techniques exist such as Generalized Partial Global Planning [18] or delegate multi-agent systems [19]. Although these mechanisms have been shown to be effective in small systems, their effectiveness decreases significantly with scale. This is particularly limiting for the airport surface movement system, which is a large, complex, and dynamic system [20]. To address the efficiency limitations of these approaches, Multi-Agent Path Finding (MAPF) algorithms were used in this research. These algorithms focus on planning and coordinating the paths of numerous agents within complex, dynamic systems. Multiple MAPF planning and coordination mechanisms exist such as Push and Rotate [21], Multi-Agent Path Planning [22] or with specific kinematic constraints [23]. However, these have long computational times, and require specific geometric arrangements of the environment [20]. Instead, the Conflict-Based Search (CBS) MAPF algorithm [24] which coordinates agents by resolving anticipated conflicts, was found to be more suitable for the airport surface movement system. No particular geometric arrangements are required by this algorithm, and it was demonstrated to scale well with the number of agents. For these reasons, it was chosen to be used within this study.
Furthermore, plan merging through highways is a useful mechanism to deal with adverse events in complex systems. Highways encourage agents to follow specific paths, resulting in the coordination of traffic flows. This is used for the resilience of city evacuations [25], and in current ground procedures at Schiphol Airport [26] where platooning is promoted [27]. Specifically, highways were successfully used with the CBS MAPF algorithm, e.g., in warehouses [28]. However, in all these cases, the highways were fixed and pre-defined, limiting their effectiveness during the potential adaptations of airport surface movement operations. For this reason, two types of adaptive highway mechanisms were used in this research, namely Merging Point Highways and Conflict-Based Highways. These were integrated in the model proposed in this study, in addition to the CBS MAPF algorithm.
An autonomous Multi-Agent System (MAS) model was created based on the layout and airport surface movement operations of Schiphol Airport in the Netherlands. This international airport was chosen as it contains a complex taxiway and runway layout, exhibits 14 runway reconfigurations on average per day [13] and has large traffic volumes. We used eight days of real-world data from Schiphol Airport as the input to the MAS model. Real-world operational situations surrounding runway reconfigurations were simulated using the three distributed planning and coordination mechanisms. Within these simulations, the taxi time and taxi distance indicators were measured, as they are commonly used to characterize airport surface movement operations [29,30,31]. The deviations of these indicators in the transient phase during runway reconfiguration events and in the new rest phase after runway reconfigurations were measured, with respect to the nominal level prior to the runway reconfiguration events. These were compared to the real-world deviations. Therefore, the contribution of the three distributed planning and coordination mechanisms to the resilience of airport surface movement operations was compared to the real-world human operated system and evaluated in a retrospective manner. The results from the autonomous MAS model show that the distributed planning and coordination mechanisms effectively contributed to the resilience of the airport surface movement system. In particular, the results show that the model contributes to significantly more resilient behaviour than the real-world, when considering the taxi time deviations after runway reconfiguration events occurred. Furthermore, the mechanisms proposed within this study have the potential to be implemented in upcoming ground control systems such as Follow-the-Greens [32], which will be further elaborated upon in Section 8.
This paper is structured as follows. First, the planning and coordination mechanisms are presented in Section 2. Then, the Schiphol Airport surface movement operations system is presented in Section 3. After this, the MAS model is presented in Section 4. Then, the verification and validation of the MAS model is presented in Section 5. Afterwards, the specific techniques used to evaluate the resilience of the airport surface movement operations are presented in Section 6, followed by the results and analysis of the MAS simulations in Section 7. A discussion is then presented in Section 8. Finally, conclusions are presented in Section 9.

2. The Distributed Planning and Coordination Mechanisms

Three planning and coordination mechanisms were chosen and implemented in a distributed manner within the MAS. These mechanisms will now be further introduced and elaborated.

2.1. CBS MAPF Algorithm

The first mechanism is the CBS MAPF algorithm. The baseline CBS mechanism [24] is chosen to be used within this study as this mechanism has a high success rate in resolving conflicts in environments similar to airport surface layouts and with a number of agents comparable to that in an airport surface operational environment [20]. This mechanism works by determining and resolving anticipated conflicts between the plans of agents. This is achieved by predicting the time at which agents pass segments of their routes. If two agents are predicted to pass the same segment at the same time, or within a time-window to each other, then one of the two agents is delayed or re-routed, thus resolving the conflict. This mechanism is denoted as CBS from now on.

2.2. Merging Point Highways (MP HWYs)

The second mechanism adds merging point highways to the CBS mechanism. In this adaptive highway mechanism, traffic flows are directed towards specific points and are merged for subsequent paths. The merging point is dynamically created, based on common route segments of aircraft paths, which follow the same traffic flow. The point at which common route segments start is the beginning point of the highway. The point at which the common route segments end is the ending point of the highway. Same flow aircraft are therefore encouraged to follow the specific highway after the starting point until the highway end point. Furthermore, the highways are also gradually removed if they are not being used. As the paths of aircraft vary, due to new runways being used, the highway starting and ending points change over time. Figure 1 presents an example of these highways. The red aircraft are encouraged to follow the red highway edges and form one traffic flow. The green aircraft are encouraged to follow the the green highway edges and form a different traffic flow. This mechanism is denoted as CBS + MP HWYs from now on.

2.3. Conflict-Based Highways (CB HWYs)

The third mechanism adds conflict-based highways to the CBS mechanism. This adaptive highway mechanism is based on the amount of anticipated conflicts in localized areas. Highways are created in regions with a high number of anticipated conflicts, as determined by the CBS algorithm. These highways are composed of “one-way” taxiway segments in the most travelled direction of aircraft. This results in short taxiway segment highways, creating more localized directional flows in areas with a high number of anticipated conflicts. Furthermore, these highways are removed if they are not being used. Figure 2 presents an example of these highways. The blue nodes are nodes with a high number of anticipated conflicts, and the blue edges are the conflict-based highways. Their directionality is also indicated by the blue arrow. This mechanism is denoted as CBS + CB HWYs from now on.

3. Schiphol Airport Surface Movement System

The Schiphol airport surface movement system is a large, dynamic, and complex system [20]. To model it, several scoping choices were made, which are described in this section.
First, only the airside operations were considered, where the sole users of the airport surface were aircraft, controlled by flight crews. Their goal was to reach their destination upon the airport’s surface in a safe and efficient manner.
Second, only the taxiing movement operations of aircraft along the airport’s surface were considered, as these operations fundamentally form the largest element of the airport surface movement system.
Third, arrival aircraft were considered from the moment that they vacated the runway. Departure aircraft were considered from the moment that they were ready to taxi. They could, however, wait at gates before receiving a taxi clearance as they had not yet begun moving. Furthermore, all aircraft taxied at their maximum taxi speed, slowing down for turns, other aircraft, and adhered to all air traffic control commands. If they reduced their speed, for any of these reasons, then they attempted to accelerate to their maximum taxi speed again.
Fourth, runway occupancy time was considered, ensuring that departing aircraft would not take off within a specific time-window of each other. Instead, they were supposed to wait for their turn to take-off by forming queues in the taxiway network near the runway holding points.
Finally, historical real-world operational data of Schiphol Airport were used as an input to the MAS model to perform simulations based on real-world scenarios, using runway information and flight schedules. The historical real-world operational data were acquired from the Delft University of Technology archives, and was derived from extensive Automatic Dependent Surveillance-Broadcast (ADS-B) surveillance data analysis undertaken in [13]. These data were chosen in order to consider typical operational traffic levels and runway reconfiguration events that occur at Schiphol Airport. The data contain the real-world taxi times, taxi distances, origin, destination, position, heading, velocity and acceleration of real-world aircraft operations upon Schiphol Airport’s surface over an eight day period. This corresponds to 6852 flights of all fleet mixes which operate at Schiphol Airport. The main features of this data-set can be found in Table 1.

4. The Multi-Agent System Model

This section presents the MAS model and its specification, based on previous studies [13,14]. The model specification is based on a formal ontology, which is defined by a number of sorts or types, sorted constants, variables, and predicates, from which all dynamic properties of the model were constructed. Model formalization based on ontologies was also done in other aerospace applications, in particular in maintenance [33].

4.1. Environment Specification

The environment was modelled by an abstraction of Schiphol airport’s surface as a graph. This abstraction was performed by placing graph nodes at the taxiway intersections, pier entry/exit points and runway entry/exit points. Furthermore, graph edges were placed along the taxiways, thus linking the nodes with each other. The pier entry/exits were simplified and locations were chosen based on previous studies [13]. The ATC Agents were placed at the nodes of the taxiway system. Figure 3 presents a representation of the graph.
The graph edges can either be bi-directional or uni-directional. In addition, the graph edges can be added or removed. Furthermore, each edge on the graph has a corresponding weight associated with it. The weight, directionality, and addition/removal of graph edges are under control of the ATC Agents to which they are connected.
Additionally, the graph edges can be declared as being part of a merging point highway (MP HWY) or a conflict-based highway (CB HWY). MP HWY and CB HWY information can also be stored on the edges. The MP HWY information consists of the flight category of Aircraft Agents for which the highway is created, and the time point at which the edge was declared a MP HWY. Flight category is defined as the arrival or departure property of the Aircraft Agent, and the Aircraft Agent’s destination. The CB HWY information consists of the time point at which the edge was declared a CB HWY. The edge weight is initialized by the computed time that it takes to taxi along the edge, at the maximum taxi speed of the Aircraft Agents [13]. The edge directionality is also initialized as bi-directional and all edges are initialized as not being a MP HWY or CB HWY, with no associated information.
F n represents the flight schedule being used at any time point, where n represents the real-world day to which it corresponds. This is a static environmental object, accessible only by the Entry/Exit Agents and the Airport Operation Status Agent. The flight schedule is represented as a matrix with structure and information as follows.
F n = F l i g h t I D 1 O r i g i n 1 D e s t 1 S c h e d u l e d T i m e 1 F l i g h t I D i O r i g i n i D e s t i S c h e d u l e d T i m e i F l i g h t I D j O r i g i n j D e s t j S c h e d u l e d T i m e j
where i represents the information of a flight, and j represents the index of the last considered flight within F n .

4.2. Agent Specifications

This section presents the specifications of the agents in the MAS. There are four types of agents: Entry/Exit Agents, Aircraft Agents, ATC Agents, and the Airport Operation Status Agent. Their properties and interactions are summarized in Figure 4.

4.2.1. Entry/Exit Agents

The Entry/Exit Agents are responsible for creating initial routes for the Aircraft Agents, safely releasing them into that taxiway network, as well as removing Aircraft Agents from the taxiway network. They are located at all pier entry/exits and runway holding points within the environment. The Entry/Exit agents have three properties.
P1 Check Flight Schedule Property. This property involves interactions between the Entry/Exit Agents and the environment. At each time point, the agent observes the flight schedule and checks whether there is an Aircraft Agent which needs to be created according to the flight schedule. Additionally, the agent knows the origin and destination of the Aircraft Agent from this flight schedule. If the agent determines that there is an Aircraft Agent which needs to be created, then the agent executes the Route Generation Property.
P2 Route Generation Property. This property involves interactions between: 1. Entry/Exit Agents and the environment, 2. Entry/Exit Agents and Aircraft Agents. If the CBS or CBS + CB HWYs mechanism is used, then the agent observes the graph and generates a route for the Aircraft Agent from its origin to destination. To determine the route, the Dijkstra algorithm [34] is used. If the CBS + MP HWYs mechanism is used, then MP HWYs need to be determined. The agent determines the flight category of the Aircraft Agent and observes the graph. Then, MP HWY edges in the graph that are equal to the flight category of the Aircraft Agent are temporarily set to a very low weight, and those that are not equal, are temporarily set to a very high weight. Afterwards, the agent generates a route for the Aircraft Agent from its origin to destination. Then, the agent communicates the route to the Aircraft Agent and executes the Release Mechanism Property [20] to enable it to start taxiing.
P3 Remove Aircraft Agents Property. This property involves interactions between: 1. Entry/Exit Agents and ATC Agents, 2. Entry/Exit Agents and the environment. At each time point, the agent checks if it has received a handover of an Aircraft Agent from an ATC Agent. If the Entry/Exit Agent is located at a pier entry/exit, then the agent removes the Aircraft Agent from the simulation. If the Entry/Exit Agent is located at a runway holding point, then the agent checks whether the runway is not occupied, and then removes the Aircraft Agent from the simulation. While doing so, it triggers a runway occupancy time which prevents subsequent Aircraft Agents from being immediately removed from the simulation. Instead, the subsequent Aircraft Agents must wait until the runway is not occupied. In this way, the Aircraft Agents form queues and are removed on a first come first served basis.

4.2.2. Aircraft Agents

The Aircraft Agents follow the commands of the ATC Agents and taxi along their assigned routes in a safe and efficient way. They maintain a safe distance from other Aircraft Agents, trying to accelerate to their maximum taxi speed whenever possible, and slow down for turns. In addition, the agents measure their taxi distance and taxi time. Additionally, the agents are aware of other Aircraft Agents in their vicinity. Furthermore, the agents know their scheduled time from the flight schedule. Finally, each agent has a flight category. In total, there are 14 possible flight categories, which can be found in [20]. The Aircraft Agents have four properties.
P1 Motion Properties. This property involves interactions between: 1. Aircraft Agents and the environment, 2. Aircraft Agents and Aircraft Agents. At each time point, the agent follows its acceleration, heading and decision making motion protocols as described in [13] in order to taxi along its route. The important aspects of these protocols, which are executed at each time point, will now be presented.
First, the agent checks whether it is taxiing at its maximum taxi speed V m a x , otherwise it attempts to accelerate to it using its acceleration a a c c e l . Second, if the agent is approaching a turn, and if the turn angle, θ t u r n is greater than a threshold θ m a x t u r n , then the agent decelerates at a d e c e l to its maximum turn speed V t u r n to execute the turn. Third, the agent observes whether there is any other Aircraft Agent in their vicinity. If it is the case, then the agent determines whether it is following the other agent. If it is following the agent, then the agent slows to match the speed of the other Aircraft Agent and maintains visual separation from it. Furthermore, if the agent observes that it is too close to other Aircraft Agents, then the agent slows or stops in order to maintain visual separation from other Aircraft Agents. The agent additionally executes the Speed Control Command Property described below. The speed control command, such as the slow down command, is integrated in the MAS model since it can be considered as a realistic option in real life operations. The aforementioned Follow-the Greens concept is capable of communicating taxi instructions such as taxi speeds. This consideration will be discussed in Section 8.
P2 Speed Control Command Property. This property involves interactions between ATC Agents and Aircraft Agents. At each time point, the agent checks whether it has received a “slow down command” from an ATC Agent. If it is received, then the agent decelerates at a d e c e l for the subsequent time points until it receives a “cancel slow down command” from an ATC Agent. Once it receives this command, the agent stops its deceleration.
P3 Compute Distance Travelled Property. At each time point, the agent computes its distance travelled at that time point, t using (1).
d t = v t · Δ t
Δ t represents the time step and v t represents the speed of the agent at the current time point. The distance travelled to the current time point is computed using (2), where t 0 is the time point that the agent was created in the simulation.
d = t 0 t d t
P4 Compute Taxi Time Property. At the time point when the agent is removed from the simulation by the Removing Aircraft Agents Property of the Entry/Exit Agent, the agent computes its total taxi time. This is computed using (3), where S c h e d u l e T i m e i corresponds to the Aircraft Agent’s scheduled time from the flight schedule.
T t a x i , i = t S c h e d u l e T i m e i

4.2.3. ATC Agents

The ATC Agents are responsible for detecting and resolving anticipated conflicts, creating and removing highways, and guiding the Aircraft Agents along their routes. These agents primarily incorporate and make up the distributed planning and coordination mechanisms. They are located at all nodes within the taxiway network that are not Entry/Exit Agents. The ATC Agents have twelve properties.
P1 Anticipated Conflict Detection Property. This property involves interactions between the ATC Agents and Aircraft Agents. At each time point, the agent determines the Aircraft Agents that will pass by it. Then, the agent computes a predicted time point at which these Aircraft Agents are anticipated to pass by it. This is computed by the Forward Simulation presented in Algorithm 1.
Algorithm 1 Forward Simulation of the Aircraft Agent’s route
Input: Localized information of the Aircraft Agent
Output: Predicted time point, t p a s s , of unimpeded passing the A T C Agent
 1:
V→ velocity of Aircraft Agent at the current time point
 2:
A T C a p p → ATC Agent which the Aircraft Agent is approaching
 3:
A T C → ATC Agent which is performing the Forward Simulation
 4:
D→ initialized as distance to A T C a p p
 5:
t→ current time point
 6:
w a s t u r n → boolean variable. True if a turn was just forward simulated, otherwise false
 7:
r o u t e → route of the Aircraft Agent
 8:
t d e l a y → initialized as 0
 9:
θ t u r n → turn angle of route segment
10:
t n t + D / V
11:
if A T C a p p = A T C then
12:
t p a s s t n
13:
else
14:
for each n o d e in r o u t e until n o d e = A T C do
15:
  if w a s t u r n = T r u e then
16:
    t d e l a y t d e l a y + V V t u r n / a a c c e l
17:
    w a s t u r n F a l s e
18:
  end if
19:
  if θ t u r n θ m a x t u r n and V V t u r n then
20:
    t d e l a y t d e l a y + V t u r n V / a d e c e l
21:
    w a s t u r n T r u e
22:
  end if
23:
   D D + D n o d e
24:
   t n t + D / V + t d e l a y
25:
end for
26:
t p a s s t n
27:
end if
28:
return t p a s s
Afterwards, the agent analyses the passing times of the Aircraft Agents. If two Aircraft Agents are anticipated to pass by the agent within a time window, T w i n d o w , then the agent is declared as a conflict node and the Aircraft Agents are declared as the conflict pair C p a i r . Then, the agent executes the Determine Anticipated Conflict Type Property.
P2 Determine Anticipated Conflict Type Property. This property involves interactions between the ATC Agents and Aircraft Agents. This property is executed if the agent has determined a conflict pair C p a i r . The detected anticipated conflict must be further assessed in order to determine what type of conflict it forms and how it can be resolved.
As the agent is the conflict node, it is common to the routes of both Aircraft Agents in the conflict pair C p a i r . The agent determines the next node which the Aircraft Agents will head to after passing the agent, and the previous node which the Aircraft Agents come from prior to passing the agent.
If the agent determines that the next node of one of the Aircraft Agents is the same as the previous node of the other Aircraft Agent, then the Aircraft Agents form an anticipated head-on conflict and the agent then executes the Anticipated Head-on Conflict Resolution Property. Figure 5 presents an example of such a head-on conflict case, where node B is the conflict node, node A is the next node of Aircraft Agent A C 2 and node A is the previous node of Aircraft Agent A C 1 .
If the agent determines that the previous nodes of the Aircraft Agents are not the same, and they do not form the anticipated head-on conflict case, then the Aircraft Agents form an anticipated crossing conflict. In this case, the agent then executes the Anticipated Crossing Conflict Resolution Property. Figure 6 presents such an anticipated crossing conflict, where node B is the conflict node, node A is the previous node of A C 1 , and node E is the previous node of A C 2 .
Finally, if the agent determines that the next and previous nodes of both Aircraft Agents are the same, then the Aircraft Agents are following each other. For this reason, they will maintain visual separation to each other. In this case, the agent takes no further action for this anticipated conflict. This is shown in Figure 7, where the previous node of both A C 1 and A C 2 is node A, and the next node of A C 1 and A C 2 is node C.
P3 Anticipated Head-on Conflict Resolution Property. This property involves interactions between: 1. ATC Agents and Aircraft Agents, 2. ATC Agents and the environment.
This property is executed if the agent has determined that the Aircraft Agents in the conflict pair C p a i r form an anticipated head-on conflict. Head-on conflicts cannot be resolved by speed commands alone, but can be resolved by re-routing of the two Aircraft Agents to avoid the head-on route segment. Figure 5 shows such a scenario and will be used to aid the explanation of this property. In this example, Aircraft Agent A C 1 has the route which traverses along nodes A-B-C, Aircraft Agent A C 2 has the route C-B-A, the agent at node B has been declared as the conflict node and A C 2 is the furthest away aircraft from the conflict node B.
The agent determines a new route for the furthest away Aircraft Agent, in this case A C 2 , re-routing it along a new route of C-F-E-D-A, whilst the route of A C 1 remains unchanged. The new route bypasses the common edges to both Aircraft Agents, namely edges A-B and B-C. Then, the agent communicates the new route to the Aircraft Agent A C 2 , thus resolving the anticipated head-on conflict. If the CBS + MP HWYs mechanism is being used, then the agent includes the MP HWY effects as described in the Route Generation Property of the Entry/Exit Agents whilst determining the new route.
P4 Anticipated Crossing Conflict Resolution Property. This property involves interactions between: 1. ATC Agents and Aircraft Agents, 2. ATC Agents and ATC Agents. This property is executed if the agent has determined that the Aircraft Agents in the conflict pair C p a i r form an anticipated crossing conflict, at the same time point as the Determine Anticipated Conflict Type Property. The agent determines which of the two Aircraft Agents of the conflict pair is furthest away from it, with respect to the remaining taxi distance of its route. The furthest away Aircraft Agent, A C s , is declared as the Aircraft Agent which will receive the speed control command. Then, the agent computes the required speed that A C s must slow to using (4) and (5):
T r e q = t s + T w i n d o w ( t s t o ) t
V r e q = d s T r e q
where t s is the estimated passing time of A C s , T w i n d o w is the time window within which an anticipated conflict is declared, t is the current time point, t o is the estimated passing time of the other aircraft in the conflict pair and d s is the taxi distance of A C s . Afterwards, the agent communicates V r e q to the ATC Agent which A C s is currently approaching.
P5 Issue Speed Control Command Property. This property involves interactions between: 1. ATC Agents and ATC Agents, 2. ATC Agents and Aircraft Agents. At the time point when the agent has received V r e q from an ATC Agent, the agent communicates a “slow down command” to the Aircraft Agent that is heading towards it, A C s . For the time points after this communication, the agent monitors the velocity of A C s . If the agent observes that the velocity of A C s is equal to V r e q , then the agent communicates a “cancel slow down command”. At any time point whilst the agent is monitoring the speed of A C s , if A C s is handed over to the next ATC Agent, then the monitoring of the Aircraft Agent A C s is also passed over to the next ATC Agent.
P6 Create Merging Point Highways Property. This property involves interactions between: 1. ATC Agents and Aircraft Agents, 2. ATC Agents and the environment. At each time point, the agent determines the number of Aircraft Agents per flight category that will pass by its connected edges. Then, the agent determines the edge for which the number of flight category specific Aircraft Agents is greater than or equal to the highway generation threshold. Afterwards, the agent attempts to declare the edge as a MP HWY for that flight category. If the graph edge is not a MP HWY, then the agent declares it as a MP HWY and stores the flight category information and the current time point in the graph edge. If the graph edge is already a MP HWY for the same flight category, then the agent only stores the current time point in the graph edge. Otherwise, if the graph edge already contains MP HWY information for a different flight category, or if the number of Aircraft Agents per flight category is less than the highway generation threshold for any of its connected edges, then the agent executes the Remove Merging Point Highways Property.
P7 Remove Merging Point Highways Property. This property involves interactions between the ATC Agents and the environment. This property is executed if the agent was not able to declare an edge as a MP HWY or if the number of Aircraft Agents per flight category is less than the highway generation threshold for any of its connected edges. This property is executed at the same time point as the Create Merging Point Highways Property. The agent observes if any of its connected edges contain MP HWY information. If none of them do, then the agent takes no further action. Otherwise, if any of its connected edges contain MP HWY information, then the agent determines the amount of time that the edge was a MP HWY. If this amount of time is greater than or equal to the amount of time a MP HWY should persist for, then the agent removes all of the MP HWY information from the edge and it stops being a MP HWY. If the amount of time is smaller than the amount of time a MP HWY should persist for, then the agent takes no further action.
P8 Create Conflict-Based Highways Property. This property involves interactions between: 1. ATC Agents and Aircraft Agents, 2. ATC Agents and ATC Agents, 3. ATC Agents and the environment. At each time point, the agent checks if its anticipated crossing conflict resolution counter n r e s o l u t i o n s is greater than or equal to the highway generation threshold. If it is, then the agent determines the neighbouring ATC Agents for which this is also the case. Then, the agent considers the graph edges which link the agent and these neighbouring ATC Agents. For these edges, the agent determines the most travelled direction of resolved anticipated conflicts. This can either be from the neighbouring ATC Agent to the agent, or vice versa. This determines the direction of the uni-directional edges in CB HWYs. Then, the agent attempts to declare these edges as CB HWYs. The agent checks whether each edge has already been made part of a CB HWY. If it has not, then the agent makes the edge uni-directional in the determined direction. Then, the agent stores the current time point information on the edge. If the uni-directionality of the edge was already in the same determined direction, then the agent only stores the current time point information on the edge. Otherwise, if the edge was already made part of a CB HWY in the opposite direction, or if the agent’s (or its neighbouring ATC Agents) n r e s o l u t i o n s is less than the highway generation threshold, then the agent executes the Remove Conflict-Based Highways Property.
P9 Remove Conflict-Based Highways Property. This property involves interactions between the ATC Agents and the environment. This property is executed if the agent was not able to declare an edge as a CB HWY, or if the agent’s (or its neighbouring ATC Agents) n r e s o l u t i o n s is less than the highway generation threshold. The agent determines if any of its edges were made uni-directional as part of a CB HWY. If none were, then the agent takes no further action. Otherwise, if any of its edges were made uni-directional as part of a CB HWY, the agent determines the amount of time that the edge was a CB HWY. If this amount of time is greater than or equal to the amount of time a CB HWY should persist for, then the agent makes the edge bi-directional again and removes all of its CB HWY information. If the amount of time that the edge was a CB HWY is smaller than the amount of time a CB HWY should persist for, then the agent takes no further action.
P10 Remove Aircraft Agent Edge Property. This property involves interactions between: 1. ATC Agents and Aircraft Agents, 2. ATC Agents and the environment. At each time point, if an Aircraft Agent is under the control of the agent, then the agent determines the edge and direction which the Aircraft Agent is travelling. Then, the agent removes the edge in the opposite direction of the Aircraft Agent’s movement in the graph. At the time point that the Aircraft Agent finishes travelling over the edge, the agent makes the edge bi-directional again, unless the edge is part of a CB HWY.
P11 Change Runway Crossing Edge Property. This property involves interactions between the ATC Agents and the Airport Operation Status Agent. At each time point, the agent checks whether it has received information from the Airport Operation Status Agent about an edge which should be added or removed. If the agent receives information about an edge, then the agent observes whether the edge exists in the graph. If the edge exists, then the agent removes the edge from the graph. Otherwise, if the edge does not exist, then the agent adds the edge to the graph.
P12 Handover Property. This property involves interactions between: 1. ATC Agents and ATC Agents, 2. ATC Agents and Entry/Exit Agents, 3. ATC Agents and Aircraft Agents, 4. ATC Agents and the environment. At each time point, the agent checks whether an Aircraft Agent is under its control and is about to pass it. If it is, then the agent checks if the edge which the Aircraft Agent is about to taxi upon exists in the graph. If it does, then the agent hands over the control responsibility of the Aircraft Agent to the next ATC Agent or Entry/Exit Agent. If the edge does not exist, then the agent determines a new path for the Aircraft Agent using the Dijkstra algorithm and communicates it to the Aircraft Agent. Afterwards, the agent hands over the control responsibility of the Aircraft Agent to the next ATC Agent in its new route.

4.2.4. Airport Operation Status Agent

The Airport operation Status Agent is responsible for determining which runways are active and communicating, if required, to the ATC Agents which should add or remove certain edges depending on the runway use. In this way, the agent prevents Aircraft Agents from crossing active runways. The Airport Operation Status Agent has two properties.
P1 Determine Runway Use Property. This property involves interactions between the Airport Operation Agent and the environment. At the very first time point, the agent observes the flight schedule and determines a runway schedule. This is done by sorting the flights in the flight schedule based on their scheduled time and observing their origins and destinations to determine the arrival and departure runways throughout the day. In this way, runway reconfigurations are identified as being triggered at specific time points based on the determined runway schedule.
P2 Remove Graph Edges Property. This property involves interactions between the Airport Operation Status Agent and ATC Agents. At each time point, the agent determines which runways are active for arrivals and departures, based on the current time point and the runway schedule. Then, the agent determines which edges must be removed or added and communicates this information to the ATC Agents which are connected to them.

5. Verification and Validation

The parameters used in the simulations are presented in Table 2. Verification was performed using computerized model verification techniques as well as with plausibility consideration approaches [35]. Code verification was done by performing unit testing [36] and by resolving any compiler errors. Additionally, conceptual verification was performed by small scale sensitivity analyses and observing whether the emergent behaviour matches the expected behaviour of the elements. For example, the runway occupancy time was verified by observing the emergence of queues at runways. In order to test the overall model, fixed scenarios were simulated for which it was known how the included mechanisms should behave. These served as test runs of the model, where a small number of manually inputted flights in the flight schedule were simulated, and the emergent decisions and behaviours of all agents were closely observed and evaluated. Finally, it was checked whether the simulated mechanisms matched the manually computed cases. For example, this was done by manually calculating the elements of the CBS algorithm and comparing them to the simulated elements within the MAS implementation.
Validation was performed by exploring the model behaviour through sensitivity analyses of model parameters using a range of operational scenarios as inputs. The face validity [37] of model outputs in these cases was assessed. Furthermore, real-world scenarios were simulated using the real-world data, and the MAS model outputs were compared to the historical real-world operational data of the same scenarios. Finally, a graphical display was used to observe the animated motion of the aircraft and of the mechanisms. These animations were compared to the dynamics of real-world aircraft motions and traffic streams and were found to have similar behaviour.

6. Evaluating Resilient Behaviour

The main focus of the analysis of the results is to evaluate the contribution of the three distributed planning and coordination mechanisms to the resilience of the airport surface movement operations, using the MAS model outputs. This section presents the analysis methodology used to evaluate the resilience.
There are many diverse definitions for resilience and associated behaviours in systems. Within this study, resilience is considered as the intrinsic ability of a system to adjust its functioning prior to, during or after changes and disturbances, such that it can sustain required operations [8].
In this research considered disturbances were limited to runway reconfiguration events. Furthermore, it was established that these events did not always have a negative effect on the performance of airport surface movement operations. For example, a runway reconfiguration from a geographically far away runway to a geographically closer runway, with respect to the gate location, resulted in a decrease in taxi distance and taxi time after the runway reconfiguration event in the real-world. An adverse event can be considered as anything that undesirably impacts, or may impact, the functioning of a system. For this reason, within this research, the considered adverse events were the runway reconfigurations that decrease the performance of the system in the real-world. The MAS simulation results of these events were used to evaluate the distributed planning and coordination mechanism contribution to the resilient behaviour of the airport surface movement system.
Although there are other possible airport surface movement indicators, e.g., gate departure and arrival punctuality and take-off time compliance [29,38,39,40], taxi time and taxi distance indicators were chosen as they give greater insights into the evolution of the re-organisation of the airport surface movement system. Other indicators such as gate arrival punctuality, for example, showed the effectiveness of the final outcome of the system after it had re-organised and an aircraft had arrived at its gate, without being able to give insights into the dynamics of the system during re-organisation.
For the adverse runway reconfiguration events, the taxi time and taxi distance of each flight within the MAS model were measured and used as the performance measures of the simulated airport surface movement operations. This was done for all three distributed planning and coordination mechanisms. Then, these outputs were compared to each other and to the taxi time and taxi distance of the flights in the real-world. The differences and behaviours were evaluated before, during and after the time at which the adverse runway reconfiguration occurred. In this way, the adaptation and evolution of system behaviour based on the proposed three mechanisms under adverse events was analysed.
More specifically, to quantify system performance, the average taxi time and average taxi distance indicators were computed for the set of flights, F s , which occurred before, during and after the runway reconfiguration time, t 0 . A time window of t w time points was used to measure the indicator levels before and after the runway reconfiguration, by selecting flights within the time window.
In particular, for the “before runway reconfiguration” phase the flights that arrived at their destination at t a r r i v a l such that t 0 t w t a r r i v a l < t 0 were considered, and the average taxi time and taxi distance performance indicators, T b e f o r e and D b e f o r e , were measured.
In the “during runway reconfiguration” phase the average taxi time and taxi distance performance indicators, T t r a n s i e n t and D t r a n s i e n t , were computed for all flights which were taxiing whilst the runway reconfiguration occurred, i.e., { t 0 t w t S c h e d u l e d T i m e t 0 } { t 0 < t a r r i v a l t 0 + t w } .
The “after runway reconfiguration” followed after the transient phase came to rest. In this phase, the average taxi time and taxi distance performance indicators, T r e s t and D r e s t , were computed for all flights which began taxiing after the runway reconfiguration event, i.e., t 0 < t S c h e d u l e d T i m e t 0 + t w .
Then, the differences Δ T t r a n s i e n t = T t r a n s i e n t T b e f o r e and Δ D t r a n s i e n t = D t r a n s i e n t D b e f o r e were computed to evaluate the contribution of the mechanisms to the resilient behaviour of the system during the runway reconfiguration. Then, Δ T r e s t = T r e s t T b e f o r e and Δ D r e s t = D r e s t D b e f o r e were computed to evaluate the resilient behaviour of the system after the runway reconfiguration occurred.
In the next section, based on the proposed method for evaluating resilience, the proposed agent-based planning and coordination mechanisms will be evaluated.

7. Results and Analysis

The MAS model was developed in Python 2.7, and simulations were run using a Windows 10 machine with 16 GB RAM and a hexacore Intel Core i7-8750H processor. The historical real-world data, as presented in Section 3, were used to create the flight schedule, F n . The simulations were run for all three distributed planning and coordination mechanisms using eight days of real-world data and took approximately 21 h to complete. The eight days of simulated operations comprised 6852 flights. All flights reached their destination and all were successfully de-conflicted, with no collisions occurring between aircraft.

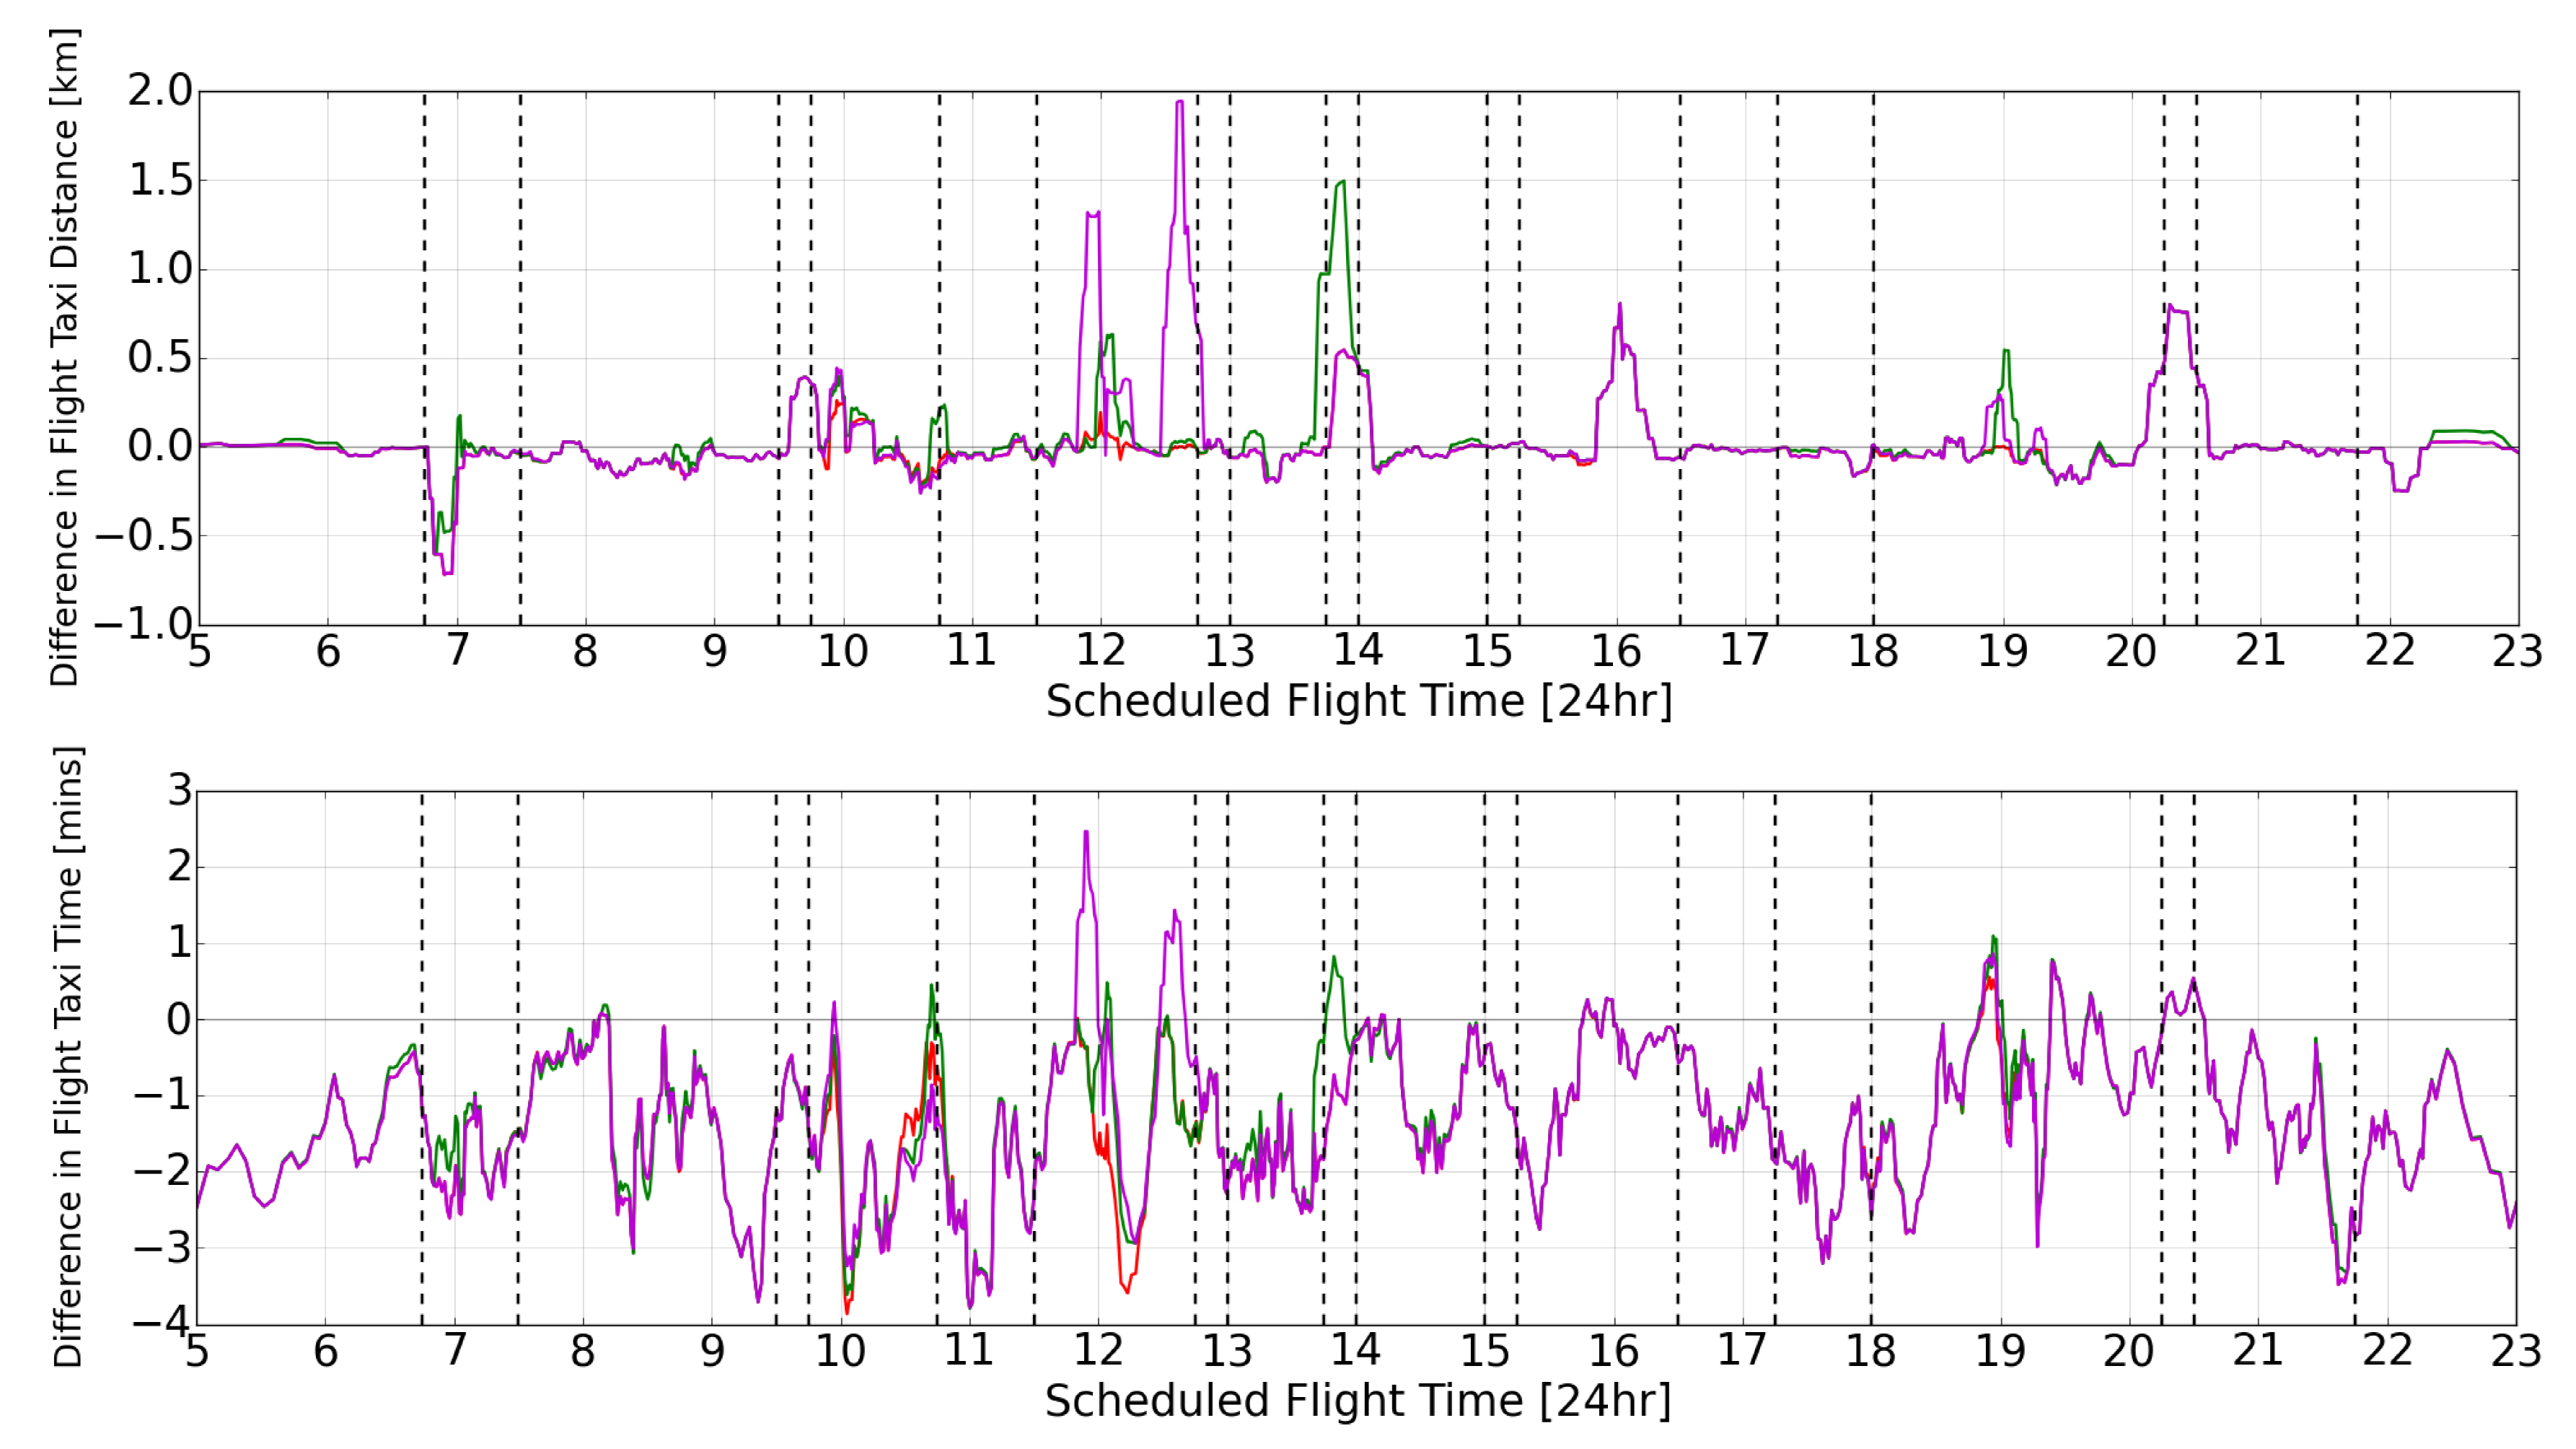
7.1. Taxi Time and Taxi Distance Behaviour

A representative day with a high amount of runway reconfigurations and traffic is chosen to demonstrate the behaviour of the mechanisms, namely the results of 2 May 2016. The results of all other simulated days can be found in [20].
Figure 8 presents the moving average flight taxi time and taxi distance, grouped per 10 flights, for the real-world and the MAS simulations of the three mechanisms. In both the taxi time and taxi distance graphs, the results show that the three mechanisms within the MAS exhibited similar performances to each other, as the lines in the graph completely overlapped for the majority of time throughout the day.
When considering the flight taxi time graph, presented as the top graph in Figure 8, the MAS mechanisms resulted in similar variations and trends of taxi time as in the real-world, and three observations can be made when compared to the real-world. The first observation is that, in certain time regions, all three MAS mechanisms exhibited a decreased taxi time, shown by the lines of the mechanisms mirroring the real-world line, but with a lower offset. This can be seen in the time regions between 05:00–07:30 and 16:30–18:30 for example. For these regions, the MAS resulted in more taxi time efficiency of the airport surface movement system than the real-world. The second observation is that the MAS resulted in almost the same performance as in the real-world, in other time regions. This can be seen in the time regions between 07:45–08:15, 14:00–14:20 and 18:30–19:45, where the lines of all three MAS mechanisms and the real-world overlap. The third observation is that, for some time regions, there was sudden or opposite improvement or deterioration in the taxi time resulting from the MAS, than in the real-world. This can be seen in the time regions between 10:45–11:15, where the MAS resulted in decreasing taxi time in comparison to the increasing taxi time of the real-world, 11:45–12:00, where the MAS mechanisms resulted in an increase of taxi time above the real-world, 13:30–13:45 and 21:00–21:30, where the MAS stayed at a constantly low and unchanged taxi time level than the increasing taxi time of the real-world.
When considering the flight taxi distance graph, presented by the bottom graph in Figure 8 the MAS results and the real-world are almost always at the same taxi distance value, apart from two deviations between the real-world performance at 12:30 and 14:00. These deviations will be further discussed later in this section.
It is interesting to note that the previously mentioned analysis indicates that, when compared to the real-world, the MAS did not result in noticeable improvements in taxi distance, e.g., such as through shorter taxi routes, although there are noticeable improvements in taxi time. This may be explained by the fact that the Aircraft Agents of the MAS model always attempted to accelerate to their maximum taxi speed, which may not be the case in the real-world. This difference will be further elaborated upon in Section 8.
Figure 9 expands on the results of Figure 8, and presents the taxi time and taxi distance moving average differences computed for each 10 flights with respect to the real-world. The results in Figure 9 show that all three mechanisms followed similar trends throughout the day, often overlapping in periods where there were no runway reconfigurations. The average difference in flight taxi time with respect to the real-world of the CBS mechanism was −1.35 min/flight, −1.27 min/flight for the CBS + MP HWYs, and −1.28 min/flight for the CBS + CB HWYs mechanisms. This indicates that all mechanisms resulted, on average, in a shorter taxi time with respect to the real-world operations, with the CBS exhibiting the greatest average saving per flight. The average difference in taxi distance of the CBS mechanism was −0.02 km/flight, and 0.02 km/flight for the CBS + MP HWYs and CBS + CB HWYs mechanisms. This indicates that there was, on average, no significant difference in taxi distance.
All mechanisms followed similar trends for the differences in taxi time and differences in taxi distances, with some notable deviations. Specifically, two clear peaks can be observed at 12:00 and 12:30 for the CBS + CB HWYs mechanism, where the difference in taxi time performance significantly increased above the real-world performance and that of all other mechanisms. As observed on Figure 9, the deviation in taxi distance significantly increased indicating that aircraft travelled longer routes, deviating from the shorter routes which they used in the real-world, or with the other mechanisms. Similarly, the CBS + MP HWYs mechanism also produced a taxi time difference peak at approximately 14:00, accompanied by an increase in the difference in taxi distance at the same time. Again, this shows that the longer taxi routes resulted in longer taxi times. For the CBS mechanism, no such unexpected peaks were observed. By further analysis, it was observed that such a behaviour could be explained by the fact that highways did not emerge in the most effective ways. Instead, long and convoluted highways were generated, which were not particularly beneficial to the flows of the inbound and outbound traffic, often having to cross each other multiple times. As a consequence of these findings, three remarks can be made. First, highways were able to successfully emerge from the implemented highway generation mechanisms. Second, the merging point and conflict-based highways were able to influence the behaviour of the airport surface movement operations at different moments to each other. Third, further work is still required on the highway generation mechanisms such that ineffective or disruptive highways are avoided.
The average simulation results of the other simulated days are presented in Table 3. The results indicate that all three mechanisms resulted in a decreased average taxi time per flight, with the CBS mechanism contributing to the greatest saving of 1.07 min/flight with respect to the real-world taxi time. To compare the simulation results, the Vargha-Delaney A-test [41] was used. It is a non-parametric effect magnitude test, which is often used to compare simulated traces of multiagent system models. In contrast to many classical statistical tests, it provides a statistical measure of the effect magnitude difference between two distributions of the compared simulation traces. The A-test value of all mechanisms was, on average, 0.40. This shows that there was a difference between the real-world and coordination mechanism-based taxi indicators for the airport surface movement results, where there was only an approximately 40% probability that a randomly selected flight had a taxi time larger than that of the real-world, for all three mechanisms. Hence, it is more likely that a randomly selected flight from the MAS simulation resulted in a smaller taxi time than the real-world. Furthermore, all three mechanisms had a standard deviation which was almost seven times smaller than that of the real-world. This indicates that there were significantly more uncertainties or operational delays for the flights in the real-world, which was not the case for the flights in the MAS model. However, the results also showed that there were almost no differences with respect to the average taxi distance per day. This was also further confirmed by the A-test value of, on average, 0.50 for all mechanisms. Overall, these results show that applying these types of distributed planning and coordination mechanisms may be beneficial to improving the performance of average taxi time of the airport surface movement operations.

7.2. Evaluating Resilience

Next, the changes between taxi time and taxi distance indicators prior to, during, and after runway reconfigurations occurred are analysed. Figure 10 presents the deviations in performance indicators between the nominal and transient levels, Δ T t r a n s i e n t and Δ D t r a n s i e n t , and nominal and rest levels, Δ T r e s t and Δ D r e s t , as defined in Section 6. The runway reconfiguration events are numbered from 1 to 9 for convenience, and are considered to evaluate resilience since they are adverse events as described in Section 6. The times at which these runway reconfigurations occurred can be found in [20]. For the results of 2 May 2016 as well as for the average of all eight days in this study, t w = 15 min was chosen as a suitable and representative time window in order to select runway reconfigurations and compare the deviations. However, the results when considering t w = 10 , 20 , 25 , 30 min can be found in [20].
The results presented in Figure 10 show that, regarding Δ T t r a n s i e n t during runway reconfigurations, all mechanisms contributed to a greater resilient behaviour of the airport surface movement operations than the real-world for runway reconfiguration events 2, 3, 5, and 6. This can be seen by all mechanisms having smaller deviation values than the real-world. Runway reconfiguration event 8 indicated that all three mechanisms contributed to an improvement in taxi time and taxi distance during and after the runway reconfiguration. This is because aircraft in the real-world took, in some cases, up to three times longer to taxi from the same origin and destination than in the MAS simulations. There may be multiple operational explanations as to why this occurred in the real-world. The aircraft may have taxied at significantly lower speeds due to their aircraft type or weather conditions, or had to wait for an abnormally long amount of time at the runway holding point. In this runway reconfiguration, runway 24 and runway 18L were used for departures, which require, in some cases, coordinated time-intervals for departures flying the same direction.
Furthermore, for runway reconfiguration 5, the CBS + CB HWYs mechanism contributed to the most resilient behaviour of the airport surface movement operations, indicated by the smallest deviation value. This is also seen in the small taxi distance deviations of Δ D t r a n s i e n t , which indicated that aircraft did not have to taxi along large routes. This effect was also propagated into the rest phase, where the Δ T r e s t value for this mechanism and runway reconfiguration was significantly lower than the other mechanisms and the real-world operations. This highlights that this mechanism was particularly effective at re-organizing the operations in this runway reconfiguration event. The highways had formed effectively prior to the runway reconfiguration, and their persistence into the rest phase was desirable. This shows that effectively formed highways were beneficial in contributing to the resilient behaviour of the airport surface movement operations.
For runway reconfigurations 4, 7 and 9, the mechanisms contributed to less resilient behaviour than the real-world of the airport surface movement operations during the runway reconfiguration. This is seen by the higher Δ T t r a n s i e n t . Runway reconfiguration 7 indicated significantly worse resilient behaviour contribution of the CBS and CBS + CB HWYs mechanisms, indicated by their large values. This can be explained by the coordination properties of the Airport Operation Status Agent. In the real-world, the crossing of runway 18C at taxiway W5 [26] was used for taxiing earlier than in the MAS simulation. Therefore, aircraft could taxi along the shorter route by crossing the runway, which was not the case in the MAS simulation. Instead, more aircraft than in the real-world had to taxi along longer routes to pass behind the runway 18C threshold as they were not able to cross the runway. The CBS + MP HWYs mechanism has the same issue. However, it has a lower deviation value as the average taxi time and taxi distance nominal values before the runway reconfiguration were higher than that of the CBS and CBS + CB HWYs. This shows that the lack of anticipation to the runway reconfigurations is undesirable, as these situations could be improved.
The same analysis was applied to the Δ D t r a n s i e n t performance indicator, which shows that the mechanisms only contributed to resilient behaviour in the airport surface movement operations for runway reconfiguration 1 and 8. This highlights that, overall, there were no improvements in the resilience of the deviations in taxi distance. The deviations were higher than that of the real-world, thus indicating that the mechanisms contributed to less resilient behaviour during runway reconfigurations than the real-world, overall.
In the rest phase, when observing Δ T r e s t , the mechanisms contributed to more resilient behaviour of the airport surface movement operations than the real-world for runway reconfiguration events 1, 6 and 8. This is indicated by the smaller deviation values. For runway reconfigurations 2, 3 and 4, all mechanisms contributed to approximately equal levels of resilient behaviour than the real-world, as the deviation values were almost the same. When considering Δ D r e s t , the mechanisms contributed to more resilient behaviour for only the first runway reconfiguration event.
The overall average values for these deviations are shown in Table 4, which is used to evaluate the overall resilient behaviour of the mechanisms for this day.
The averaged deviation values indicate that all mechanisms contributed to almost the same or more resilient behaviour of the airport surface movement operations than the real-world, with respect to taxi time deviation in the transient phase. The CBS mechanism had a marginally higher average Δ T t r a n s i e n t than the real-world indicating that it contributed to marginally less resilient behaviour than the real-world. However, as the values are almost equal, it can be argued that the CBS mechanism contributed to the same level of resilient behaviour as the real-world. The CBS + CB HWYs exhibited the smallest Δ T t r a n s i e n t suggesting that this mechanism contributed to the greatest degree of resilient behaviour in the airport surface movement operations. The CBS + MP HWYs mechanism exhibited less Δ T t r a n s i e n t than the real-world, indicating that it contributed to more resilient behaviour of the airport surface movement operations, but not as much as the CBS + CB HWYs mechanism which contributed to the most resilient behaviour. When considering the Δ D t r a n s i e n t performance indicator, all mechanisms contributed to less resilient behaviour than the real-world. This is indicated by all values being higher than that of the real-world. However, out of the three mechanisms, the CBS + CB HWYs mechanism contributed to the smallest deviation.
All mechanisms contributed to more resilient behaviour of the airport surface movement operations when considering the average taxi time deviation after a runway reconfiguration event. This is displayed by the smaller Δ T r e s t performance indicator than that of the real-world. Furthermore, it is important to note that the CBS + MP HWYs mechanism contributed to the most resilient behaviour, having the smallest deviation value. Out of the three mechanisms, the CBS contributed to the least resilient behaviour. For the final indicator, Δ D r e s t performance indicator, the CBS + MP HWYs contributed to the same resilient behaviour as the real-world, having almost the same value. The other two mechanisms both contributed to less resilient behaviour, because of the higher deviation values than the real-world.
Overall, for this day alone, the distributed planning and coordination mechanisms contributed to improvements in the resilient behaviour of the airport surface movement operations with respect to Δ T t r a n s i e n t and Δ T r e s t when compared to the real-world. However, the mechanisms contributed to significantly less resilient behaviour when considering the taxi distance of aircraft during the transient phase. After further analysis, this can be explained by the fact that the mechanisms re-organise the airport surface system by keeping the aircraft moving along longer taxi routes, for all the mechanisms, instead of making them stop and wait. Furthermore, for the CBS + MP HWYs mechanism, it is observed that the MAS was able to adapt to utilize the disturbed, transient state of the airport surface movement operations and propagate the highway effects to the rest phase more successfully, on average, than the CBS + CB HWYs, after the runway reconfiguration has occurred. This highlights a strength of the merging point highway generation mechanism, where generated highways were sustained beyond the transient phase to the rest phase in a more successful way, on average. However, as was highlighted, more research is required to ensure that only effective highways are generated.
In addition to the day of 2 May 2016, the same resilience analysis was performed for all simulation days, and is shown in Table 5. In total, 58 runway reconfiguration adverse events were considered for this analysis, in order to evaluate the contribution of the mechanisms to the resilient behaviour of the airport surface movement operations using a wider range of runway reconfiguration events.
These results show that all mechanisms exhibited a slightly smaller taxi time deviation in the transient phase. This shows they contributed to slightly more resilient behaviour than the real-world. The CBS + MP HWYs mechanism contributed to the greatest degree of resilient behaviour, which is almost the same as the CBS + CB HWYs mechanism. However, all mechanisms contributed to less resilient behaviour in terms of the deviations in taxi distance. This is indicated by all values being larger than that of the real-world. This further supports the previously given argument that the MAS adapted by making aircraft move along longer routes rather than making them follow shorter routes, but making them stop or taxi at slower speeds in the taxiway network.
When considering the taxi time performance deviations after the runway reconfiguration event, all mechanisms contributed to significantly more resilient behaviour than the real-world. Out of all the mechanisms, the CBS + MP HWYs contributed to the greatest degree of resilient behaviour, having the smallest deviation value. Finally, when comparing Δ D r e s t , all mechanisms marginally contributed to a greater degree of resilient behaviour than the real-world, as they displayed slightly better improvements, with the CBS + MP HWYs mechanism again yielding the most resilient behaviour.
Finally, Table 6 presents the associated A-test values for these average results. The A-test results further confirmed the observations from Table 5. Specifically, for the Δ T t r a n s i e n t , the A-test results show that there was a negligible difference between the resulting resilient behaviour of all mechanisms. For the Δ D t r a n s i e n t , the A-test results show that there was a difference in the resilient behaviour of the mechanisms and of the real-world. The value indicates that there was an approximately 63% probability that a randomly selected runway reconfiguration Δ D t r a n s i e n t result, from any of the mechanisms, was larger than a randomly selected runway reconfiguration Δ D t r a n s i e n t from the real-world. However, when considering the Δ T r e s t indicator, all mechanisms resulted in A-test values of approximately 0.40. This shows that there was a difference between the resilient behaviour created by the mechanisms and the real-world. In this case, there is a 60% probability that, for a randomly selected runway reconfiguration, Δ T r e s t of any of the mechanisms was smaller than Δ T r e s t of a randomly selected runway reconfiguration of the real-world. For the Δ D r e s t , there was negligible difference between the resulting resilient behaviour of any of the mechanisms and the real-world.

8. Discussion

This study demonstrates that the implemented agent-based distributed planning and coordination mechanisms are effective in controlling the airport surface movement operations by only communicating routes and when aircraft must “slow down”. This is within the capabilities of the upcoming Single European Sky for ATM Research (SESAR) [42] Follow-the-Greens concept [32,43] which uses Airfield Ground Lighting (AGL) to control aircraft. Specifically, routes could be illuminated by the AGL, and the “slow down” command could be executed by making the illuminated segment flash in front of aircraft. Once the flight crew observes this, they apply brakes to decrease their speed. If the green segment stops flashing, then the flight crew stops decreasing their speed and can continue taxiing at their desired, unimpeded taxi speed, accelerating if required. Further implications of the proposed distributed mechanisms for this novel concept of operation will be explored in the future.
Furthermore, based on the obtained results, it is proposed that large airport environments with many alternative routes for aircraft could be advantageous to the re-organization of the airport surface movement system by the proposed mechanisms. In the previous section, it was determined that the mechanisms use longer taxi distances to re-organize the airport surface movement system. Therefore, larger environments with more route possibilities could further enhance this effect. For this reason, the methodology and mechanisms presented within this study have the potential to be combined into a more general airport planning and coordination framework, which could be applicable to a wider range of airports with single or multi-runway configurations, and multi-apron layouts. Future work is therefore recommended in this area.
The MAS simulations were run for fixed kinematic aircraft profiles, as all Aircraft Agents had the same maximum taxi speed and accelerations, as presented in Table 2. These simulation parameters were chosen based upon two aircraft types that are largely operated at Schiphol Airport, namely the Airbus A320 and Boeing 737–800 aircraft types. However, this does not capture the different kinematic profiles of other aircraft which also operate at Schiphol Airport. Furthermore, aircraft age was not taken into account which affects the acceleration and deceleration of aircraft which may have worn out brakes or engines, for example. These aspects form limitations which could be further improved by utilising variable aircraft performances. To model the dynamics of taxiing aircraft more realistically, as well as to quantify uncertainty of these dynamics, a formalization of the aircraft dynamics based on fuzzy numbers can be performed by using real data [44]. In this way, the mechanisms’ contribution to more variable and realistic airport surface movement operations could be investigated.
In addition, the MAS simulations do not account for flight crew behaviours. In the real-world, not all flight crews taxi at their maximum taxi speed, as they may prefer to taxi at slower and safer taxi speeds. Furthermore, flight crew hesitation, route uncertainty or unfamiliarity with the airport surface layout could be contributors to unforeseen taxi delays in their taxi plan executions. These differences could also contribute to explaining why the mechanisms in this study result in a longer taxi distances and yet shorter taxi time deviations in the transient phases during runway reconfigurations. Therefore, it is recommended that future studies investigate these effects.
Within this study, taxi time and taxi distance were chosen as the indicators to quantify the behaviour of the airport surface movement system in both the real-world and the autonomous MAS model. Although these have been effective in evaluating the re-organisation of the airport surface movement system, the analysis of other indicators which characterize a wider scope of taxi processes, such as take-off slot adherence, are recommended to be investigated in future studies, as these may give greater insights into the mechanisms’ effects by taking into account more realistic operational elements such as take-off slot punctuality.
Finally, the Forward Simulation aspect used within the CBS MAS model is an approximation, as it does not account for the accelerations or slowing due to other Aircraft Agents nearby. Furthermore, it also does not account for any other control commands from other ATC Agents. For these reasons, better prediction methods such as using machine learning [45] may result in improved CBS behaviour and better conflict-based highway generation.

9. Conclusions

This study has taken the first steps into evaluating the contribution of agent-based distributed planning and coordination to the resilience of airport surface movement operations when runway reconfigurations occur.
An autonomous MAS model was created which incorporated a distributed implementation of the CBS MAPF algorithm and two types of adaptive highway mechanisms. Flights based upon eight days of real-world historical data from Schiphol Airport were simulated and the taxi time and taxi distance indicators were measured using the MAS model. The deviations in the taxi time and taxi distance indicators during and after runway reconfigurations were determined, with respect to the nominal levels prior to runway reconfigurations. These deviations were used to evaluate the contribution of the distributed planning and coordination mechanisms to the resulting behaviour of the airport surface movement operations within the MAS model. Furthermore, the deviations of each distributed planning and coordination mechanism were compared to the real-world behaviour resulting from the human operated system and to each other.
In terms of overall performance, it was found that the distributed planning and coordination mechanisms resulted in an average saving of 1.07 min/flight taxi time improvement with respect to the real-world historical data. This suggests that such distributed planning and coordination approaches could result in more time efficient airport surface movement operations. However, no improvements were found with respect to the taxi distance.
In terms of resilience, it was found that the distributed planning and coordination mechanisms were all effective in contributing to the resilient behaviour of airport surface movement operations. Their contribution was found to be similar to that of the real-world, resulting from the centralized real-world system with human ATCOs. When considering the average taxi time deviations during all considered runway reconfiguration events, the three mechanisms did not contribute to any significant differences of the resilient behaviour when compared to that of the real-world. When considering the average taxi distance deviations during the considered runway reconfigurations, all three distributed planning and coordination mechanisms resulted in significantly greater deviations than the real-world, thus showing that they all contributed to less resilient behaviour of the airport surface movement operations. However, in terms of the average taxi time deviations after the runway reconfiguration had occurred, all three distributed planning and coordination mechanisms contributed to significantly more resilient behaviour, indicated by smaller deteriorations in the nominal performance than that of the real-world. Although all mechanisms had similar results, the CBS + MP HWYs and CBS + CB HWYs mechanisms contributed to the most resilient behaviour of the airport surface movement operations. When considering the average taxi distance deviations after the runway reconfigurations, the three mechanisms did not contribute to any significant differences with that of the real-world.
Finally, it can be concluded that the distributed planning and coordination mechanisms incorporating highways are more beneficial in contributing to the resilient behaviour after runway reconfigurations, with the CBS + MP HWYs mechanism resulting in the most overall contribution to the resilient behaviour of the airport surface movement operations.

Author Contributions

Contribution of each co-author to the current work may be distinguished as: conceptualization, K.F., A.S. and M.V.; formal analysis, K.F.; methodology, K.F., A.S. and M.V.; project administration, A.S.; software, K.F.; supervision, A.S. and M.V.; validation, K.F., A.S. and M.V.; writing—original draft, K.F.; writing—review and editing, K.F., A.S. and M.V. All authors have read and agreed to the published version of the manuscript.

Funding

This research received no external funding.

Conflicts of Interest

The authors declare no conflict of interest.

References

  1. ICAO. Annex 11: Air Traffic Services; Technical Report; International Civil Aviation Organization: Montreal, QC, Canada, 2001. [Google Scholar]
  2. Malandri, C.; Mantecchini, L.; Reis, V. Aircraft turnaround and industrial actions: How ground handlers’ strikes affect airport airside operational efficiency. J. Air Transp. Manag. 2019, 78, 23–32. [Google Scholar] [CrossRef]
  3. Postorino, M.N.; Mantecchini, L.; Malandri, C.; Paganelli, F. A methodological framework to evaluate the impact of disruptions on airport turnaround operations: A case study. Case Stud. Transp. Policy 2020, in press. [Google Scholar] [CrossRef]
  4. Janic, M. Modeling Airport Operations Affected by a Large-Scale Disruption. J. Transp. Eng. 2009, 135. [Google Scholar] [CrossRef]
  5. Malandri, C.; Mantecchini, L.; Paganelli, F.; Postorino, M.N. Impacts of unplanned aircraft diversions on airport ground operations. Transp. Res. Procedia 2020, in press. [Google Scholar]
  6. Pejovic, T.; Noland, R.B.; Williams, V.; Toumi, R. A tentative analysis of the impacts of an airport closure. J. Air Transp. Manag. 2009, 15, 241–248. [Google Scholar] [CrossRef]
  7. Postorino, M.N.; Mantecchini, L.; Paganelli, F. Improving taxi-out operations at city airports to reduce CO2 emissions. Transp. Policy 2019, 80, 167–176. [Google Scholar] [CrossRef]
  8. Hollnagel, E.; Paries, J.; Woods, D.D.; Wreathall, J. Resilience Engineering in Practice: A Guidebook; Ashgate: Farnham, UK, 2011. [Google Scholar]
  9. Majumdar, A.; Ochieng, W. Factors Affecting Air Traffic Controller Workload: Multivariate Analysis Based on Simulation Modeling of Controller Workload. Transp. Res. Rec. 2002, 1788, 58–69. [Google Scholar] [CrossRef]
  10. Wickens, C.; Mavor, A.; Mcgee, J. Flight to the Future: Human Factors in Air Traffic Control; The National Academic Press: Washington, DC, USA, 1997. [Google Scholar]
  11. EUROCONTROL. European ATM Master Plan: Executive View; Technical Report; Publications Office of the European Union: Luxembourg, 2020; ISBN 978-92-9216-134-7. [Google Scholar] [CrossRef]
  12. European Aviation Artificial Intelligence High Level Group. The FLY AI Report: Demystifying and Accelerating AI in Aviation/ATM; Technical Report; EUROCONTROL: Brussels, Belgium, 2020. [Google Scholar]
  13. Noortman, T. Agent-Based Modelling of an Airport’s Ground Surface Movement Operation. Master’s Thesis, Delft University of Technology, Delft, The Netherlands, 2018. [Google Scholar]
  14. Udluft, H. Decentralization in Air Transportation. Ph.D. Thesis, Delft University of Technology, Delft, The Netherlands, 2017. [Google Scholar]
  15. Dou, C.; Hao, D.; Jin, B.; Wang, W.; An, N. Multi-agent-system-based decentralized coordinated control for large power systems. Int. J. Electr. Power Energy Syst. 2014, 58, 130–139. [Google Scholar] [CrossRef]
  16. King, J.; Pretty, R.; Gosine, R. Coordinated execution of tasks in a multiagent environment. IEEE Trans. Syst. Man Cybern. 2003, 33, 615–619. [Google Scholar] [CrossRef]
  17. Camara, A.; Silva, D.C.; Oliveira, E.; Abreu, P.H. Comparing centralized and decentralized multi-agent approaches to air traffic control. In Proceedings of the Proceedings of the 28th European Simulation and Modelling Conference, Porto, Portugal, 22–24 October 2014; pp. 189–193. [Google Scholar]
  18. Bold, B. Generalized Partial Global Planning (GPGP); Technical Report; University of Wuerzburg: Würzburg, Germany, 2005. [Google Scholar]
  19. Claes, R.; Holvoet, T.; Weyns, D. A Decentralized Approach for Anticipatory Vehicle Routing Using Delegate Multiagent Systems. IEEE Trans. Intell. Transp. Syst. 2011, 12, 364–373. [Google Scholar] [CrossRef]
  20. Fines, K. Agent-based Distributed Planning and Coordination for Resilient Airport Surface Movement Operations. Master’s Thesis, Delft University of Technology, Delft, The Netherlands, 2019. [Google Scholar]
  21. de Wilde, B.; ter Mors, A.W.; Witteveen, C. Push and Rotate: A Complete Multi-agent Pathfinding Algorithm. J. Artif. Intell. Res. 2014, 51, 443–492. [Google Scholar] [CrossRef] [Green Version]
  22. Wang, K.H.C.; Botea, A. MAPP: A Scalable Multi-Agent Path Planning Algorithm with Tractability and Completeness Guarantees. J. Artif. Intell. Res. 2011, 42, 55–90. [Google Scholar]
  23. Honig, W.; Kumar, T.K.S.; Cohen, L.; Ma, H.; Xu, H.; Ayanian, N.; Koenig, S. Multi-Agent Path Finding with Kinematic Constraints. In Proceedings of the Twenty-Sixth International Conference on Automated Planning and Scheduling (ICAPS 2016), London, UK, 12–17 June 2016; pp. 477–485. [Google Scholar]
  24. Sharon, G.; Stern, R.; Felner, A.; Sturtevant, N.R. Conflict-based search for optimal multi-agent pathfinding. Artif. Intell. 2015, 219, 40–66. [Google Scholar] [CrossRef]
  25. Pumpuni-Lenss, G.; Blackburn, T.; Garstenauer, A. Resilience in Complex Systems: An Agent-Based Approach. Syst. Eng. 2017, 20, 158–172. [Google Scholar] [CrossRef]
  26. Air Traffic Control The Netherlands. Available online: http://www.ais-netherlands.nl/aim/2018-10-25-AIRAC/html/index-en-GB.html (accessed on 25 October 2018).
  27. Bergenhem, C.; Shladover, S.; Coelingh, E.; Englund, C.; Tsugawa, S. Overview of platooning systems. In Proceedings of the 19th ITS World Congress, Vienna, Austria, 29 October 2012. [Google Scholar]
  28. Cohen, L.; Uras, T.; Koenig, S. Feasibility Study: Using Highways for Bounded-Suboptimal Multi-Agent Path Finding. In Proceedings of the Eighth Annual Symposium on Combinatorial Search, Dead Sea, Israel, 11–13 June 2015. [Google Scholar]
  29. Civil Air Navigation Services Organisation. Recommended Key Performance Indicators for Measuring ANSP Operational Performance; Technical Report; Civil Air Navigation Services Organisation: Hoofddorp, The Netherlands, 2015. [Google Scholar]
  30. Ithnan, M.; Selderbeek, T.; van Blokland, W.B.; Lodewijks, G. Aircraft Taxiing Strategy Optimization; Technical Report; Department Maritime & Transport Technology, Delft University of Technology: Delft, The Netherlands, 2015. [Google Scholar]
  31. Kharina, A.; Rutherford, D. Fuel Efficiency Trends for New Commercial Jet Aircraft: 1960 to 2014; International Council on Clean Transportation: Washington, DC, USA, 2015. [Google Scholar]
  32. ATRiCS Advanced Traffic Solutions GmbH. Follow the Greens. Available online: http://followthegreens.com/ (accessed on 7 October 2018).
  33. Rodger, J.A. A fuzzy linguistic ontology payoff method for aerospace real options valuation. Exp. Syst. Appl. 2013, 40, 2828–2840. [Google Scholar] [CrossRef]
  34. Cormen, T.H.; Lieserson, C.E.; Rivest, R.L.; Stein, C. Introduction to Algorithms; The MIT Press: Boston, MA, USA, 2009. [Google Scholar]
  35. Helbing, D.; Balietti, S. Social Self-Organization; Springer: Berlin, Germany, 2012; pp. 25–70. [Google Scholar]
  36. Morell, L. Unit Testing and Analysis; Carnegie Mellon University: Pittsburgh, PA, USA, 1989; p. 41. [Google Scholar]
  37. Carson, J. Model verification and validation. In Proceedings of the Winter Simulation Conference, San Diego, CA, USA, 8–11 December 2002; Volume 1, pp. 52–58. [Google Scholar] [CrossRef]
  38. ICAO. Manual on Global Performance of the Air Navigation System—Doc 9883; ICAO: Montreal, QC, Canada, 2009. [Google Scholar]
  39. Khammash, L.; Mantecchini, L.; Reis, V. Micro-simulation of airport taxiing procedures to improve operation sustainability: Application of semi-robotic towing tractor. In Proceedings of the 2017 5th IEEE International Conference on Models and Technologies for Intelligent Transportation Systems (MT-ITS), Naples, Italy, 26–28 June 2017; pp. 616–621. [Google Scholar]
  40. Humphreys, I.; Francis, G. Performance measurement: A review of airports. Int. J. Transp. Manag. 2002, 1, 79–85. [Google Scholar] [CrossRef]
  41. Vargha, A.; Delaney, H. A critique and improvement of the CL common language effect size statistics of McGraw and Wong. J. Educ. Behav. Stat. 2000, 25, 101–132. [Google Scholar]
  42. SESARJU. SESAR Joint Undertaking. Available online: https://www.sesarju.eu/ (accessed on 7 October 2018).
  43. Straube, K.; Roßbach, M.; Vieten, B.D.; Hahn, K. Follow-the-Greens: The Controllers’ Point of View Results from a SESAR Real Time Simulation with Controllers. Adv. Intell. Syst. Comput. 2016, 484, 837–849. [Google Scholar]
  44. Zadeh, L.A.; Kacprzyk, J. Fuzzy Logic for the Management of Uncertainty; Wiley: New York, NY, USA, 1992. [Google Scholar]
  45. Yin, J.; Hu, Y.; Ma, Y.; Xu, Y.; Han, K.; Chen, D. Machine Learning Techniques for Taxi-out Time Prediction with a Macroscopic Network Topology. In Proceedings of the AIAA/IEEE 37th Digital Avionics Systems Conference, London, UK, 23–27 September 2018. [Google Scholar] [CrossRef]
Figure 1. Merging point highways example. Red highways and red aircraft form one flow. Green highways and green aircraft form another flow.
Aerospace 07 00048 g001
Figure 2. Conflict-based highways example. Blue edges indicate the conflict-based highway and its directionality. The blue nodes are the areas with a high number of anticipated conflicts.
Aerospace 07 00048 g002
Figure 3. The graph representation of the taxiways and runways of Schiphol Airport. The red dots represent the ATC Agents. The green dots are the locations of the Entry/Exit Agents. The blue airplanes are the Aircraft Agents, and the purple dot is the Airport Operation Status Agent.
Aerospace 07 00048 g003
Figure 4. Properties of the four types of agents and their interactions.
Aerospace 07 00048 g004
Figure 5. Anticipated head-on conflict example. Node B is the conflict node.
Aerospace 07 00048 g005
Figure 6. Anticipated crossing conflict example. Node B is the conflict node.
Aerospace 07 00048 g006
Figure 7. Aircraft Agents following each other. Node B is the conflict node.
Aerospace 07 00048 g007
Figure 8. Moving average flight taxi time and taxi distance results, grouped per 10 flights for the real-world and MAS simulation results of 2 May 2016. Blue line: real-world performance, red line: Conflict-Based Search (CBS) mechanism performance, green line: CBS + Merging Point Highways (MP HWYs) mechanism performance, purple line: CBS + Conflict-Based Highways (CB HWYs) mechanism performance. Dotted vertical lines represent the runway reconfiguration events.
Aerospace 07 00048 g008
Figure 9. Moving average differences with respect to the real-world data, grouped per 10 flights for the MAS simulation of 2 May 2016. Red line: CBS mechanism performance, green line: CBS + MP HWYs mechanism performance, purple line: CBS + CB HWYs mechanism performance. Dotted vertical lines represent runway reconfiguration events.
Aerospace 07 00048 g009
Figure 10. Deviations in the transient and rest phases for the considered runway reconfigurations of 2 May 2016. Blue bar: real-world performance, red bar: CBS mechanism performance, green bar: CBS + MP HWYs mechanism performance, purple bar: CBS + CB HWYs mechanism performance.
Aerospace 07 00048 g010
Table 1. The main features of the real-world data used in this study.
Date01-05-1602-05-1604-05-1607-05-1609-05-1610-05-1612-05-1613-05-16
Number of departures495414421467510485500512
Number of arrivals327508441433337368314320
Total number of flights822922862900847853814832
Average taxi time (min)8.017.447.187.597.646.37.738.02
Average taxi distance (km)4.003.933.853.943.723.014.004.01
Table 2. Parameters used in the Multi-Agent System (MAS) simulations.
ParametersDescriptionValue
V m a x Maximum taxi speed of the Aircraft Agents 15.4 m/s
V t u r n Turn speed for turns which required to be slowed down 5.14 m/s
a a c c e l Acceleration of Aircraft Agents 0.26 m/s 2
a d e c e l Deceleration of Aircraft Agents 0.78 m/s 2
θ m a x t u r n Angle of turn beyond which V t u r n should be utilized30°
T R O Runway occupancy time60 s
T w i n d o w CBS anticipated conflict detection window15 s
n M P MP HWY generation threshold2 aircraft
T M P p e r s i s t MP HWY time to persist300 s
n C B CB HWY generation threshold3 commands
T C B p e r s i s t CB HWY time to persist180 s
Table 3. MAS simulation average taxi time and taxi distance of flights on all days.
Planning andTaxi TimeTaxi TimeTaxi DistanceTaxi Distance
Coordination Mechanism(min/flight)A-Test Value(km/flight)A-Test Value
Real-world μ = 7.08 σ = 25.11 - μ = 3.82 σ = 2.47 -
CBS μ = 6.01 σ = 3.52 0.40 μ = 3.81 σ = 2.54 0.49
CBS + MP HWYs μ = 6.04 σ = 3.53 0.41 μ = 3.83 σ = 2.55 0.50
CBS + CB HWYs μ = 6.04 σ = 3.53 0.40 μ = 3.83 σ = 2.55 0.50
Table 4. MAS simulation average responses for the runway reconfiguration events on 2 May 2016.
Planning and Coordination
Mechanism
Average
Δ T transient
(min/event)
Average
Δ D transient
(km/event)
Average
Δ T rest
(min/event)
Average
Δ D rest
(km/event)
Real-World2.931.412.061.21
CBS2.952.201.681.36
CBS + MP HWYs2.622.031.391.20
CBS + CB HWYs2.551.981.591.27
Table 5. MAS simulation average responses for the considered runway reconfiguration events of all days.
Planning and Δ T transient Δ D transient Δ T rest Δ D rest
Coordination Mechanism(min/event)(km/event)(min/event)(km/event)
Real-World μ = 3.89 σ = 2.15 μ = 2.15 σ = 1.32 μ = 2.12 σ = 1.39 μ = 1.19 σ = 0.76
CBS μ = 3.71 σ = 2.39 μ = 2.71 σ = 1.70 μ = 1.59 σ = 1.17 μ = 1.13 σ = 0.84
CBS + MP HWYs μ = 3.65 σ = 2.38 μ = 2.70 σ = 1.69 μ = 1.50 σ = 1.17 μ = 1.09 σ = 0.83
CBS + CB HWYs μ = 3.66 σ = 2.43 μ = 2.71 σ = 1.74 μ = 1.55 σ = 1.15 μ = 1.12 σ = 0.83
Table 6. MAS simulation A-test values of the average resilient responses for the considered runway reconfiguration events of all days.
Planning andA-Test ValueA-Test ValueA-Test ValueA-Test Value
Coordination Mechanismof Δ T transient of Δ D transient of Δ T rest of Δ D rest
CBS0.510.630.410.50
CBS + MP HWYs0.500.630.380.49
CBS + CB HWYs0.500.620.390.48

