1. Introduction
A sessile water droplet on an aerodynamic surface can be shed by airflow. Under the flow, the droplet experiences an aerodynamic drag. An incipient motion of the droplet shedding, which is the beginning of the droplet movement, occurs when the external forces overcome the adhesion between the interfaces of the droplet and surface [
1,
2,
3]. In recent years, a superhydrophobic coating has been gained attention for its anti-wetting and self-cleaning properties [
4,
5,
6,
7,
8,
9]. A sessile droplet on such a coating can be easily shed by a lower aerodynamic drag [
2]. There is a critical velocity at which a sessile droplet starts running downstream on a superhydrophobic coating. In terms of aerodynamics, while the impingement and coalescence of incoming water droplets can increase a resting sessile droplet’s size, the velocity will be related to the droplet size as the critical droplet size for a given coating [
2]. The shedding of a sessile droplet by airflow has become important for the anti-icing of aircraft wings or the blades of wind turbines [
10,
11,
12], clear visibility through car windows [
13,
14,
15], and other aerodynamic objects that are exposed to environmental flows for engineering purposes. A superhydrophobic surface under airflow is a passive method that provides benefits to applications where a surface needs to be kept clean without additional energy expenditure [
4,
16].
The shedding of a sessile droplet is dependent on the surface property of the aerodynamic object and the airflow. If we choose a superhydrophobic coating as the former factor, it promotes the mobility of a sessile droplet due to its anti-wettability, low adhesion, water repellency, and self-cleaning abilities [
17,
18,
19,
20,
21]. For the latter factor, the airflow creates aerodynamic drag. The shedding of a sessile droplet can be influenced by the magnitude of air velocity and the cross-sectional area of the droplet exposed to the airflow. When we consider a droplet on a surface under airflow, we need to take into account a velocity profile in a boundary layer. Based on the air velocity, the boundary layer will be thicker than the cross-sectional area of the droplet, or the droplet will be larger than the boundary layer thickness. Inside the boundary layer, the droplet can experience a velocity gradient that may influence the incipient motion and critical droplet size.
There are studies on the behavior of the shedding of a sessile droplet. In terms of aerodynamics, Olsen and Walker [
1] studied the surface water flow and shedding near a stagnation region on a scaled airfoil model. They reported the effect of airspeed on the droplet size. For the prediction of droplet shedding, White and Schmucker [
3] investigated the runback threshold of water droplets under an accelerated boundary layer. Their studies discuss the aerodynamic effects on the incipient motion of a droplet. However, their work was limited to a hydrophilic surface, and the effect on a hydrophobic surface was not discussed. In the view of interface science, there are some studies on the incipient motion of a droplet related to the surface property. There are also evaluations on different coatings, including a superhydrophobic one. However, their experimental method is to use gravitational force as an external driven force. Milne and Amirfazli [
2] investigated the incipient motion by shear flow with various coating surfaces. Moghtadernejad et al. [
22] investigated the droplet shedding under the impact of shear flow on hydrophilic and superhydrophobic surfaces. Even though they covered a wide velocity range, it is still necessary to discuss the incipient motion of a droplet under a continuous airflow instead of the impact of a shear flow to characterize the critical velocity. This will give great insights into aerodynamics, as well as interface science, of droplet behavior on a superhydrophobic surface under continuous shear flow. These insights can be directly related to the engineering applications described above. It is challenging to simulate and observe such a phenomenon experimentally. At the leading edge of an aircraft wing, for example, a droplet size would be in the order of sub-millimeters [
1]. Therefore, an indirect method is used to investigate the phenomenon of water droplets shed by continuous airflow.
In this paper, we focus on the measurement of a pinned droplet shedding on a superhydrophobic surface exposed to a continuous shear flow. To experimentally simulate the size increase in a droplet under a continuous airflow, the droplet is pinned through the pore water. The droplet size is arbitrarily changed to understand the relationship between the critical droplet size and the critical air velocity. The relationship between the boundary layer thickness and critical droplet size is also considered.
2. Materials and Methods
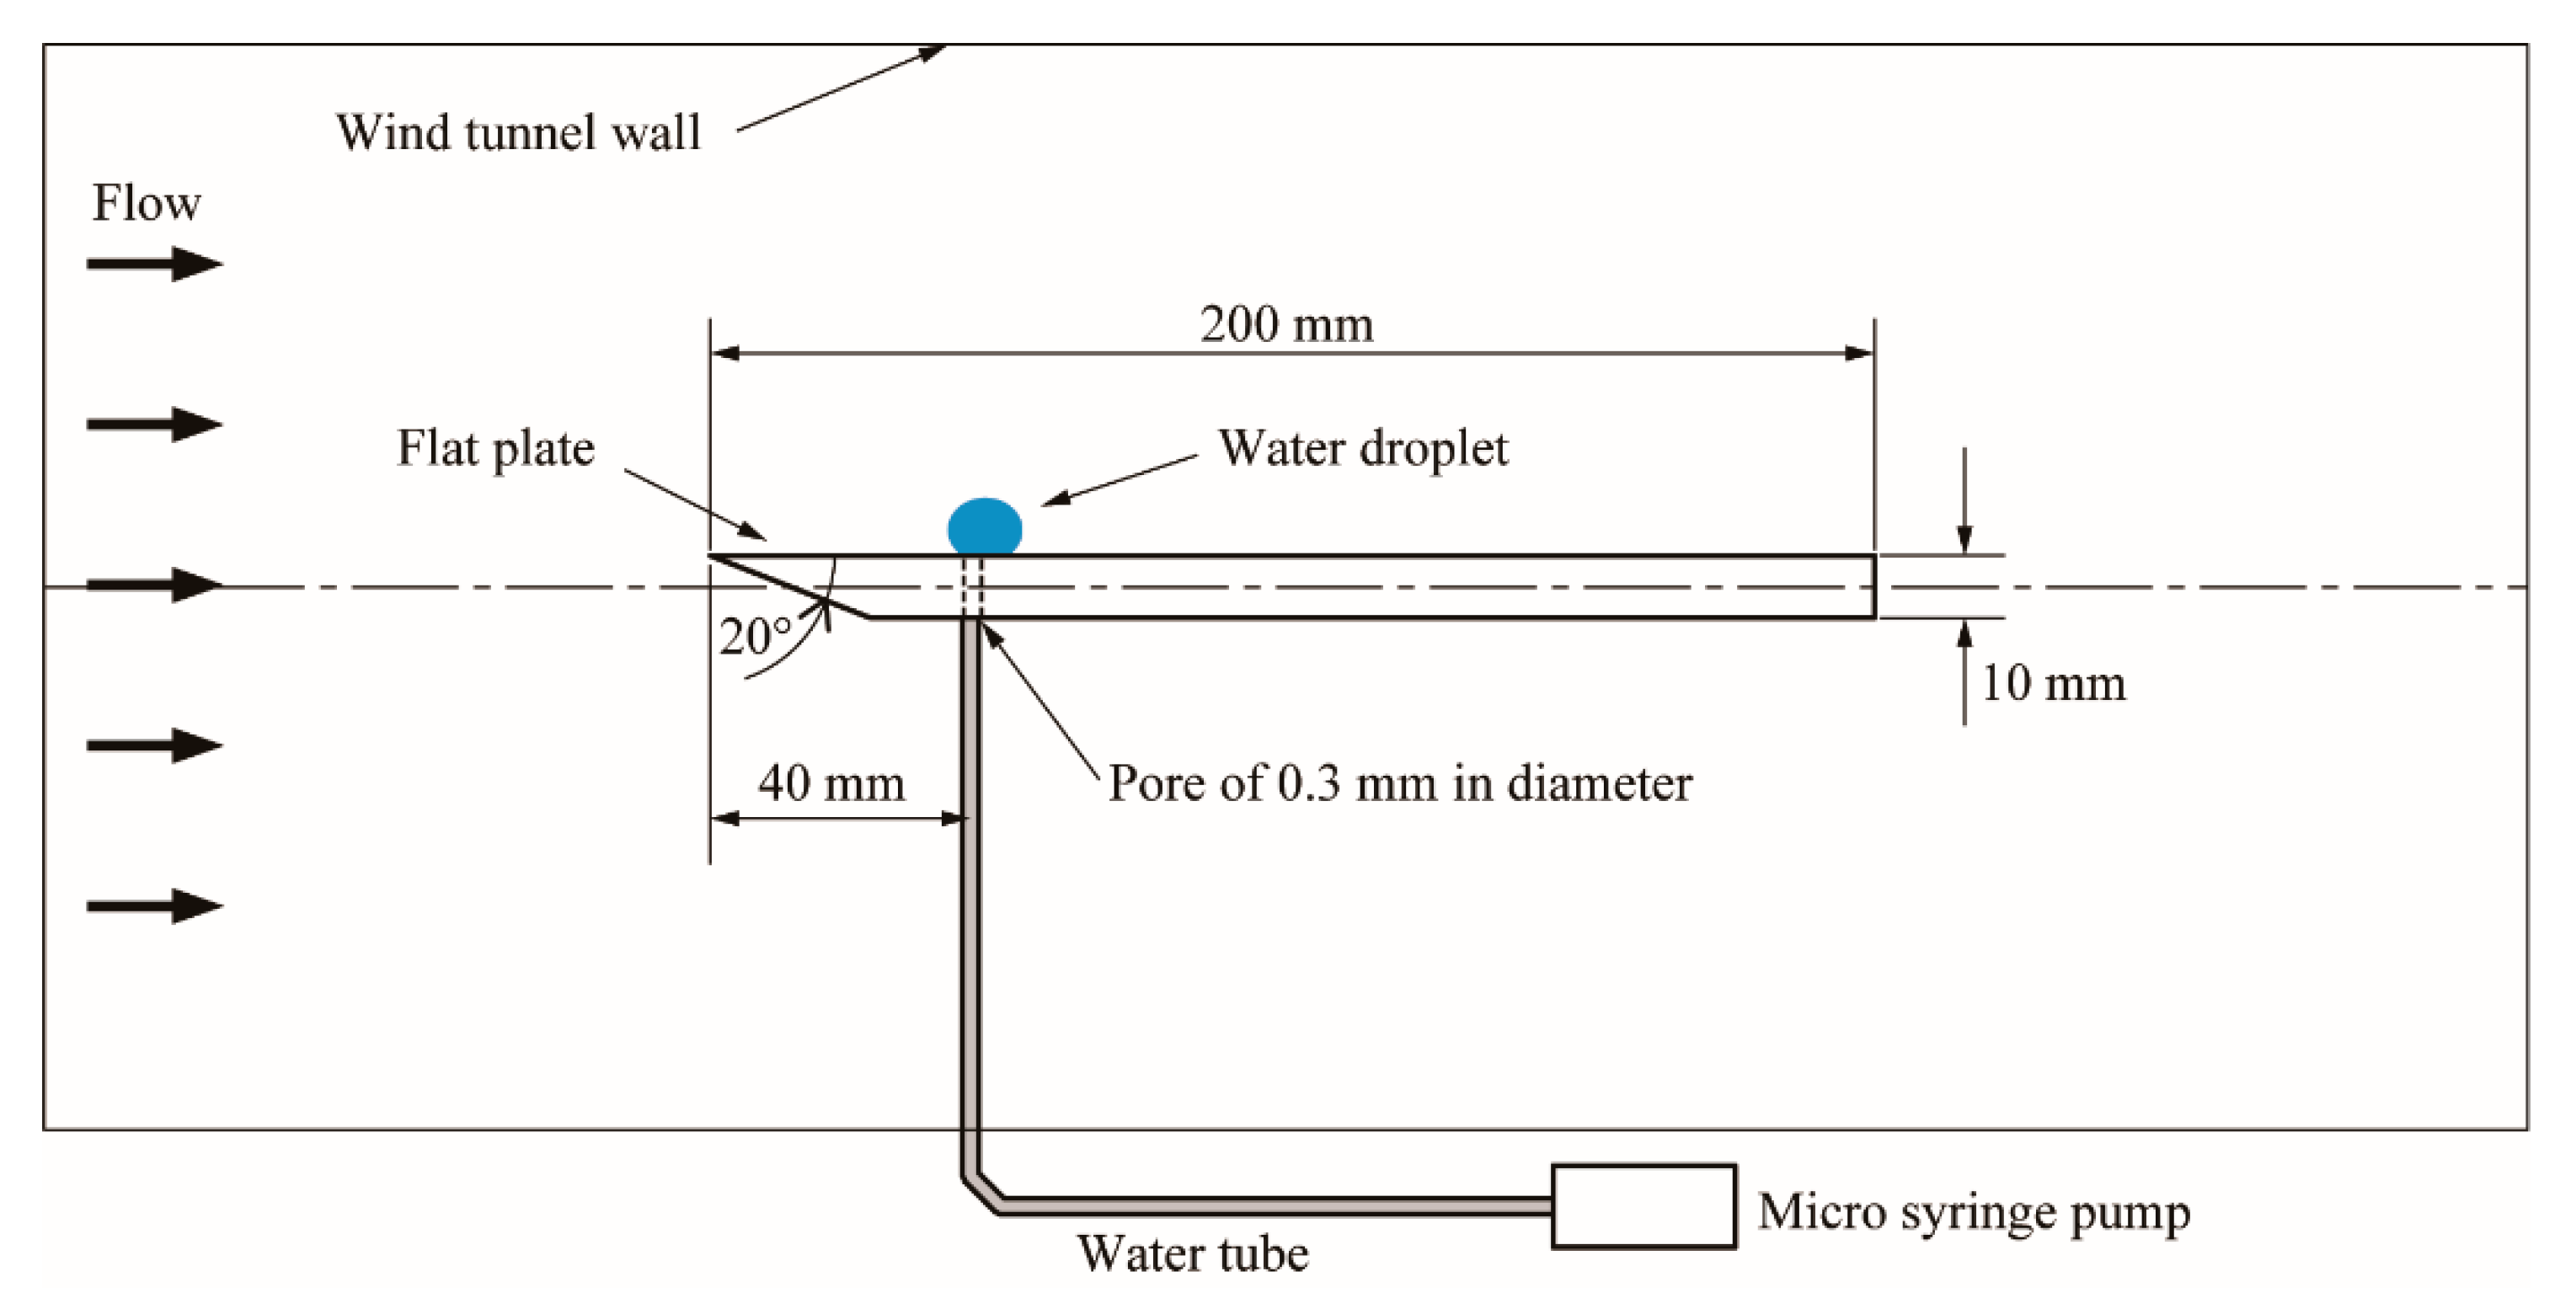
Figure 1 shows a schematic of the experimental setup. An open-return wind tunnel at Kanagawa Institute of Technology was used to conduct the experiment. The dimension of the test section is 100 mm in depth, 300 mm in height, and 1800 mm in width. A flat plate was used to produce a wall boundary layer flow. The dimension of the flat plate was 200 mm in width, 100 mm in depth, and 10 mm in thickness. It was installed and horizontally mounted at the test section of the wind tunnel. The leading edge of the plate has an inclined shape of 20 degrees to start a new boundary layer from the frontal edge of the plate.
A pore of 0.3 mm in diameter was provided on the flat plate to introduce a water droplet to be pinned over the surface. It was located at 40 mm from the leading edge along the centerline of the plate. At this location, the boundary layer should be laminar based on the Blasius exact solution [
23]. A micro syringe was connected to a mechanical pusher that allowed us to constantly inject water at 0.3 μL/min into the pore.
A superhydrophobic coating of HIREC 1450 (NTT A.T. Corp., Tokyo, Japan) was applied to the plate surface by spraying. The HIREC coating has demonstrated its superhydrophobic characteristic [
24,
25,
26,
27]. A water contact angle characterized the hydrophobicity of the surface under static conditions [
28,
29].
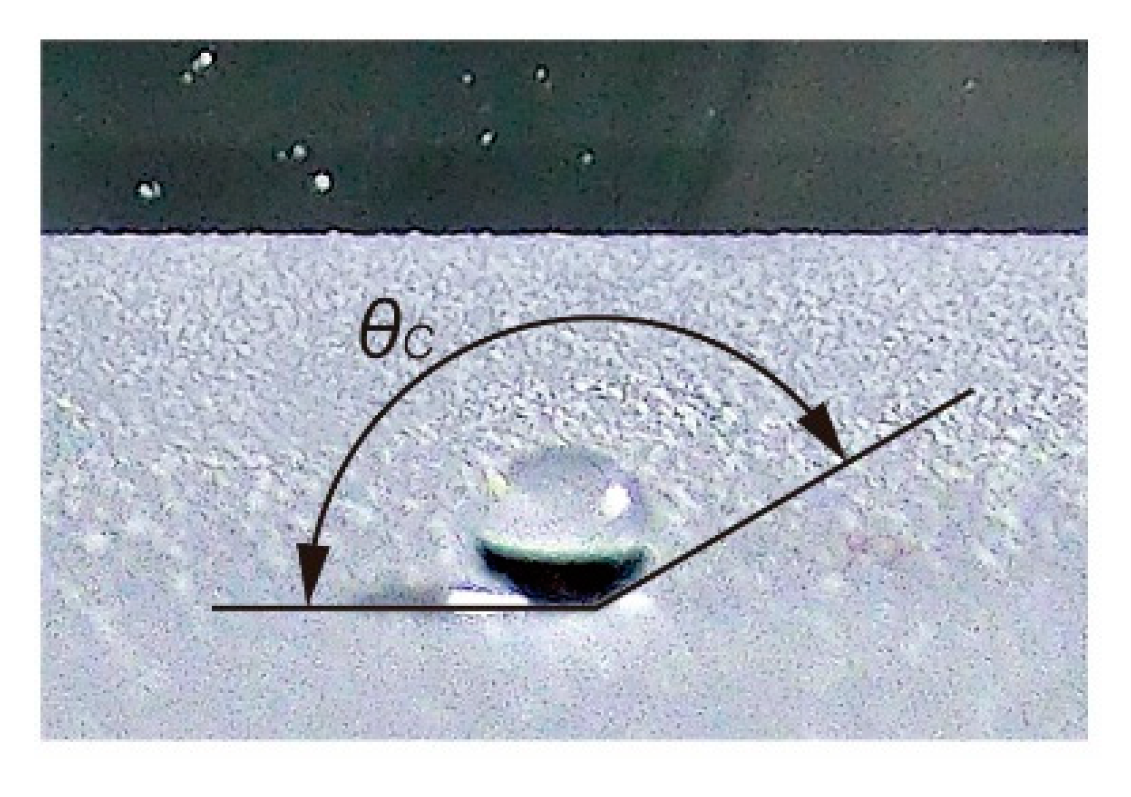
Figure 2 is an example of the shape of a water droplet on the coating surface. The water contact angle,
θC, of the HIREC coating was 150 degrees. The contact angle of water repellent material is formulated as shown in Equations (1) and (2) [
28,
29]. Equation (1) describes the Wenzel model, which relates the contact angle,
θC, to the contact angle of a smooth surface,
θS.
where
r is roughness factor defined in an actual wetted area, which is expressed as the ratio of rough surface to smooth surface. Equation (2) describes the Cassie Model.
where
θ1 defines the contact angle between air and water, and
θ2 defines the contact angle between the solid surface and water.
f1 and
f2 are the coefficients of the surface areas of the gas interaction and water interaction. On the other hand, a contact angle hysteresis is a common parameter used to characterize the hydrophobicity of the surface under dynamic conditions [
28,
29]. The contact angle hysteresis is the difference between advancing and receding angles. A lower hysteresis angle demonstrates a better hydrophobic surface. Based on Karmouch and Ross [
25] and Salazar-Cerreño [
26], a HIREC coating can show a smaller hysteresis angle lower than 10 degrees. In addition, the roll-off angle is less than 20 degrees for a water droplet of 1 mm, and five degrees for 2 mm [
27].
A high-speed camera (FASTCAM-APX RS, PHOTRON LIMITED, Tokyo, Japan) was used to capture the incipient motion of a shedding droplet. It was installed at the lateral side of the test section. The frame rate of the camera was changed from 2000 to 5000 frames per second, depending on the air velocity. For each test case, the motion capturing was repeated five times to obtain the mean and standard deviation as an error in the post-processing of the image analysis.
To measure the critical size of a pinned droplet at shedding, an instantaneous snapshot at the incipient motion was analyzed. The procedure of the experiment was carried out as follows: (1) the air velocity was fixed at a target velocity; (2) then, the syringe started supplying water and a pinned droplet was formed on the pore; (3) the pinned droplet expanded its volume until the pinning was released from the pore and the droplet started running downstream. Image inspection was performed to determine the frame at which the incipient motion of the droplet started running downstream from the consecutive images. The extracted frame was used to measure the size of the water droplet.
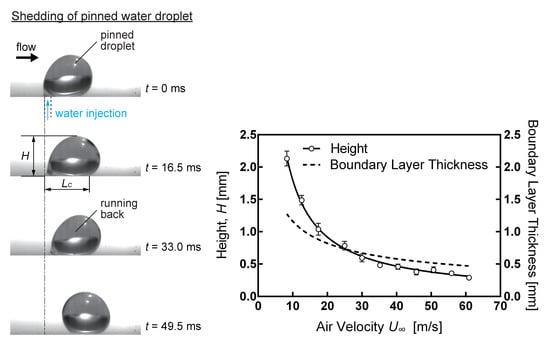
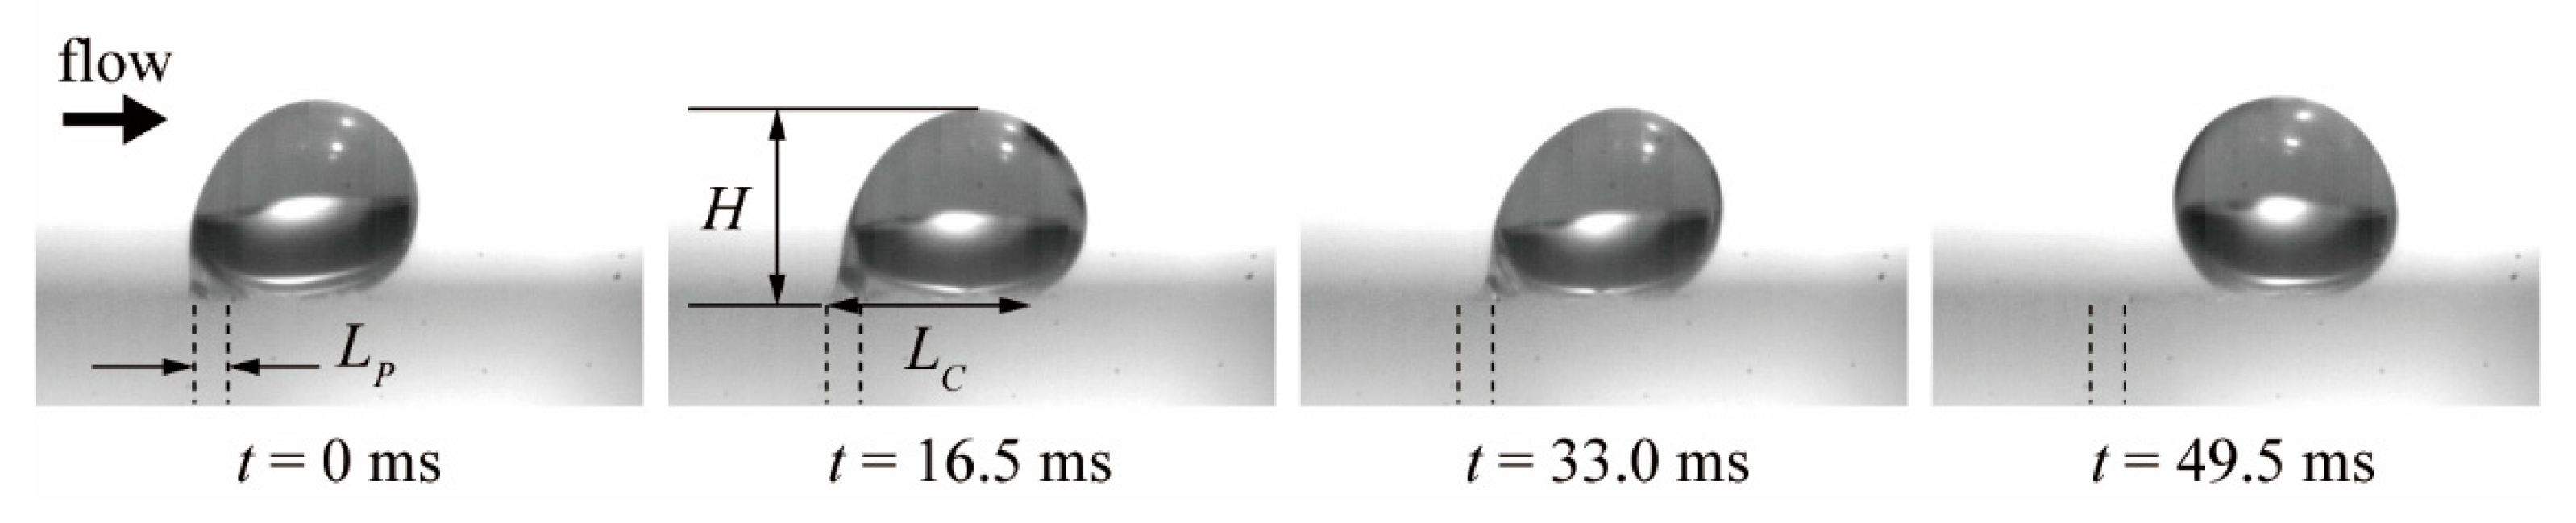
Figure 3 shows representative frames of a droplet shedding on the superhydrophobic surface. As the size of droplet, which was pinned by the water within the pore, increased by the water injection under a fixed air velocity, the droplet reached a critical size, which meant that the droplet finally started running downstream due to an aerodynamic drag. Right at the incipient motion, the drag overcame the adhesions of the droplet-coating surface and the pinning force of the water through the pore. In the case of
Figure 3, the droplet started running after 16.5 ms.
The incipient motions for various air velocities were determined from instantaneous snapshots captured with a high-speed camera. Each image frame was converted from pixel to actual length in millimeters. The droplet at 16.5 ms in
Figure 3 also shows one of the incipient motions defining the height,
H, of the droplet. It was defined as the length from the coating surface to the top of the droplet image compared to a numerically estimated boundary layer thickness. We also defined the contact length,
LC, which is the width of the contact area, to describe the contact area associated to the pore diameter,
LP, which can affect the droplet size, since the water droplet was pinned through the pore.
The air velocity,
U∞, varied from 8 to 61 m/s. A total of eleven velocity cases were tested with an accuracy of ±1.8 m/s. The local Reynolds number,
Rex, at the maximum air velocity of 61 m/s was 1.7 × 10
5 based on the following equation:
where
x is a distance from the leading edge of the flat plate to the pore location and
ν is the kinematic viscosity of air. This theoretically meets the laminar flow condition. For a lower air velocity, the boundary layer was also considered to be laminar. During the experiments, supplied water, the plate and ambient air were maintained at the same temperature of 13 ± 1 °C. Within the velocity range in the present experiment, the Reynolds number, based on the height of the droplet, was in the order of 10
3, which covered the Reynolds number of the droplet at the leading edge of the aircraft [
1].
3. Results
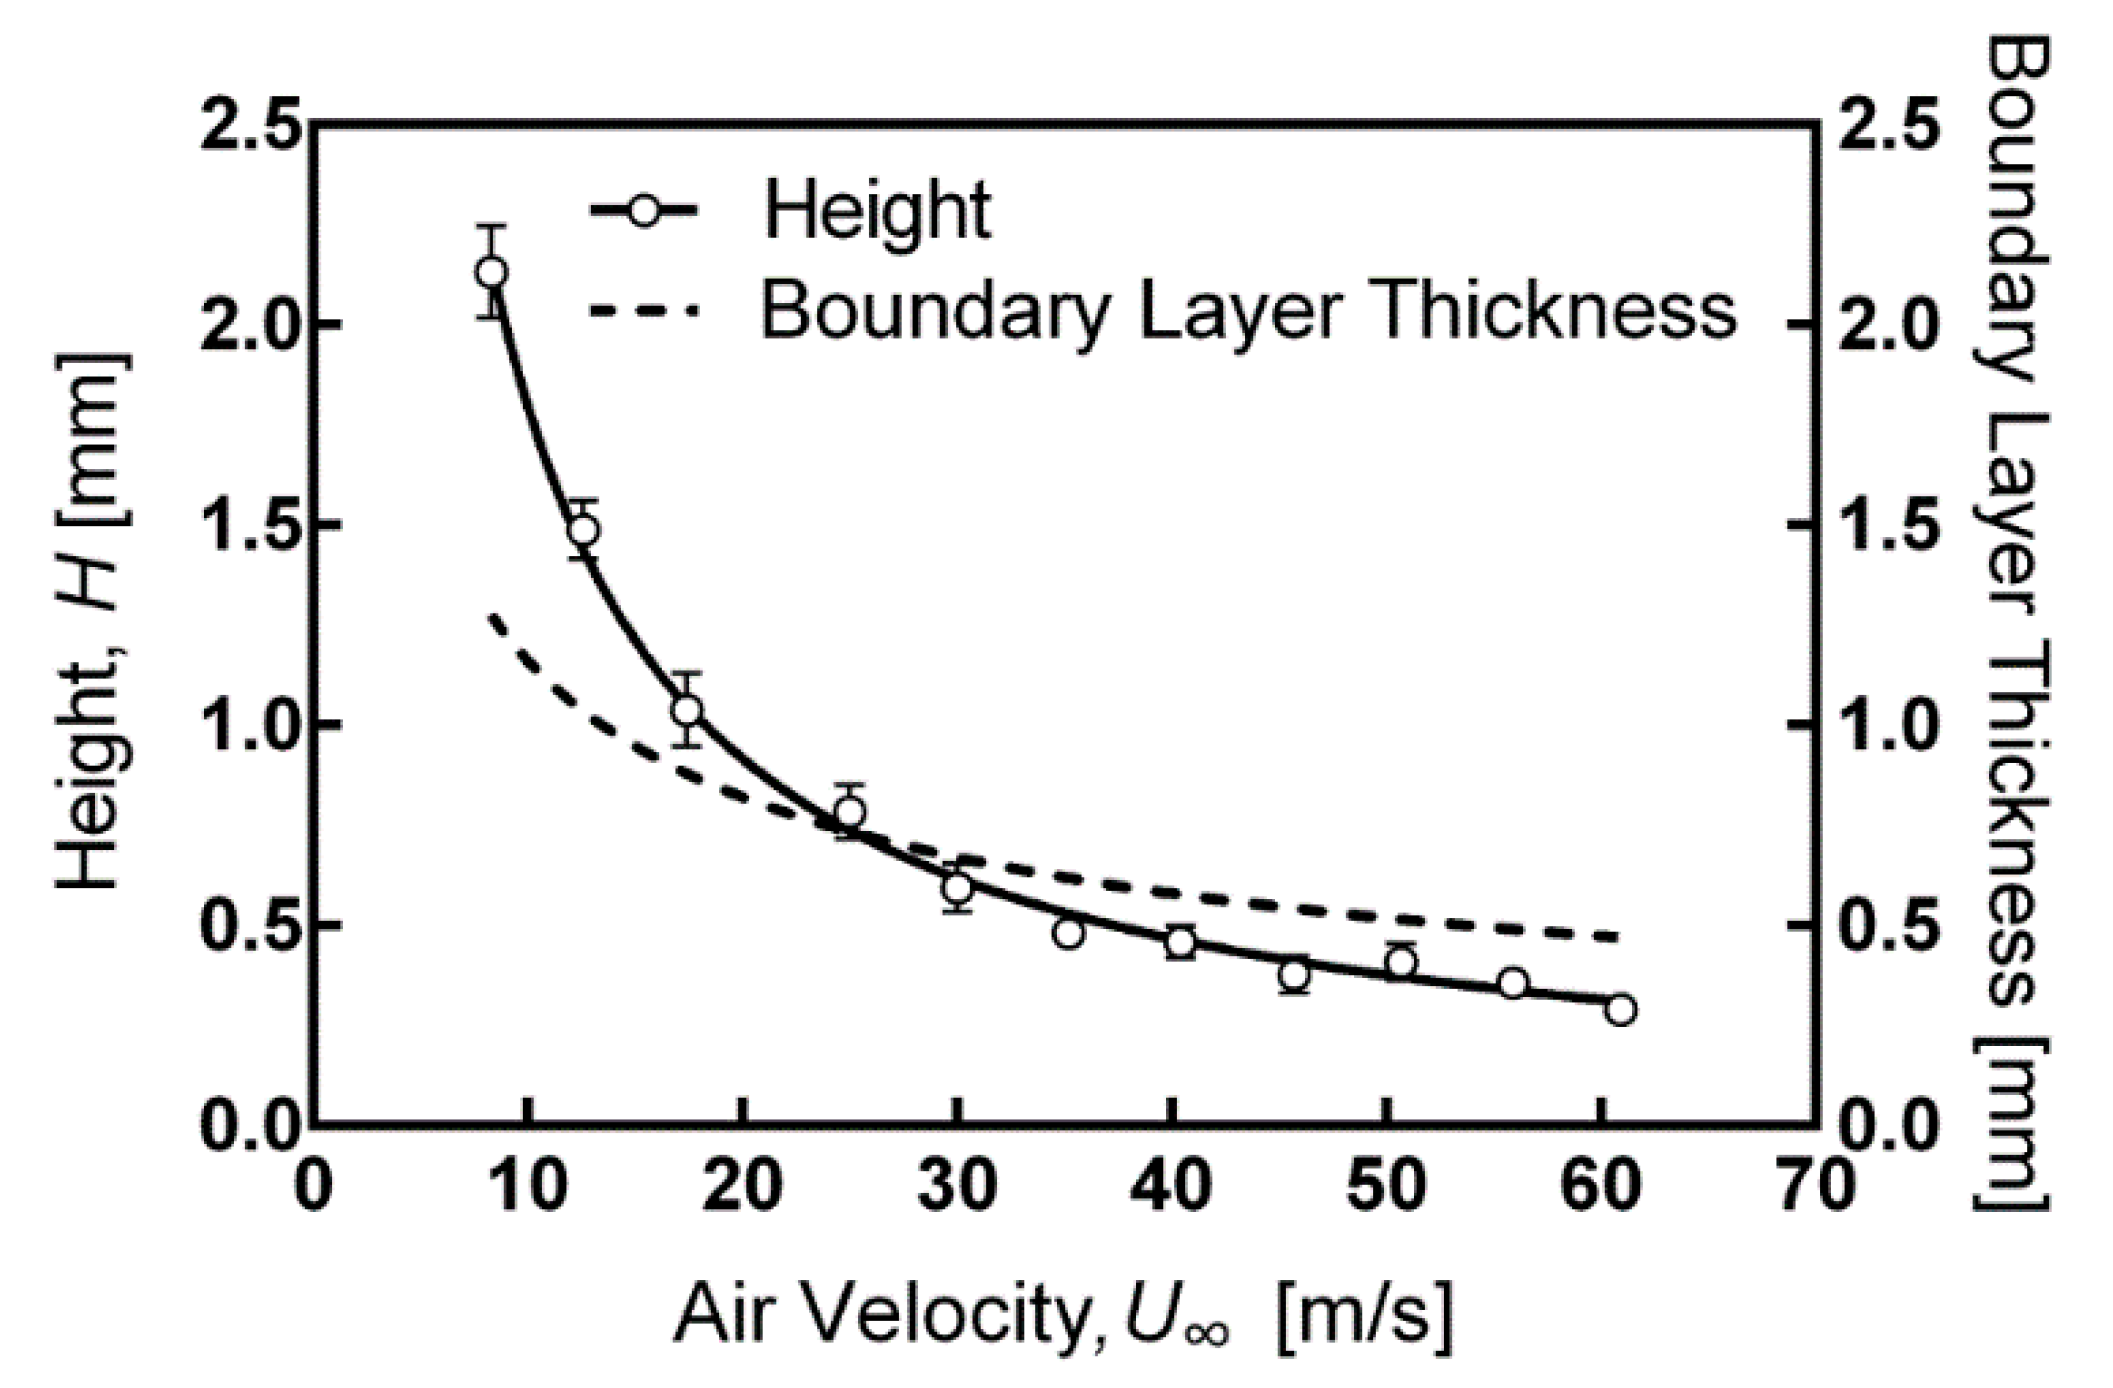
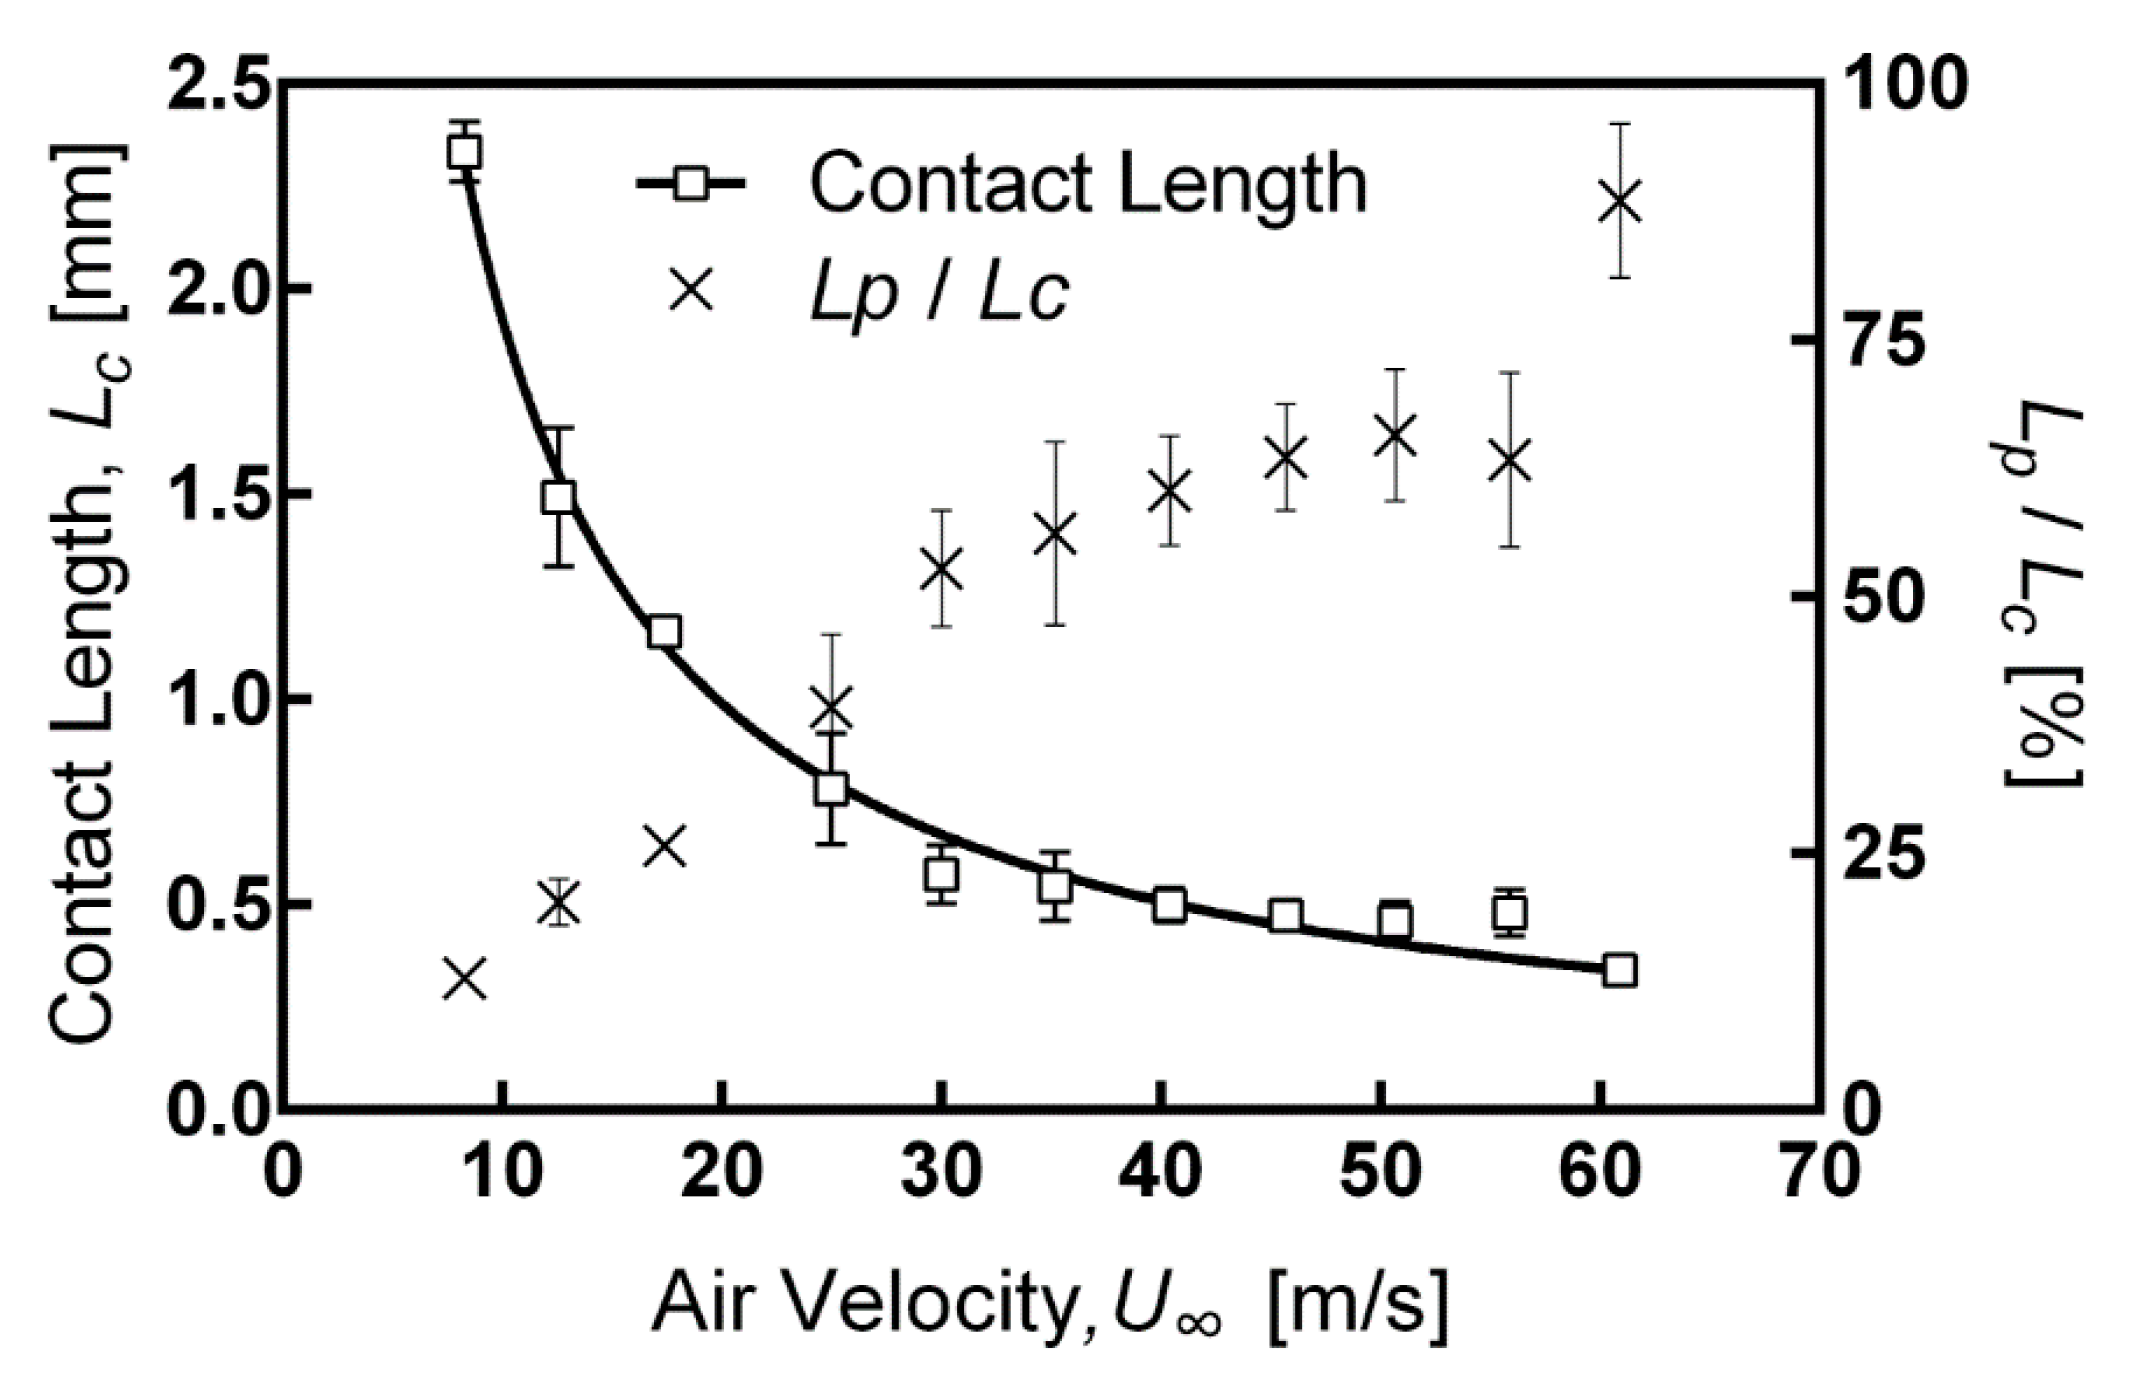
Figure 4 and
Figure 5 show
H and
LC related to the freestream velocity,
U∞. It can be seen from
Figure 4 and
Figure 5 that an increase in
U∞ to shed the droplet required smaller
H and
LC. For example, at
U∞ of 25 m/s, the droplet size,
H and
LC, was smaller than 1 mm to allow the droplet to be shed from the superhydrophobic surface. When
U∞ increases, for example, to 40 m/s, the shed droplet size was reduced to a size as small as 0.5 mm. For the correlation between the droplet height and the freestream velocity, it was shown that
H was inversely proportional to
U∞.
Similar to the relationship between
H and
U∞, it was obtained that
LC was inversely proportional to
U∞.
Equations (4) and (5) merged within the error band. This can be seen by an overlay of H and LC in relation to U∞.
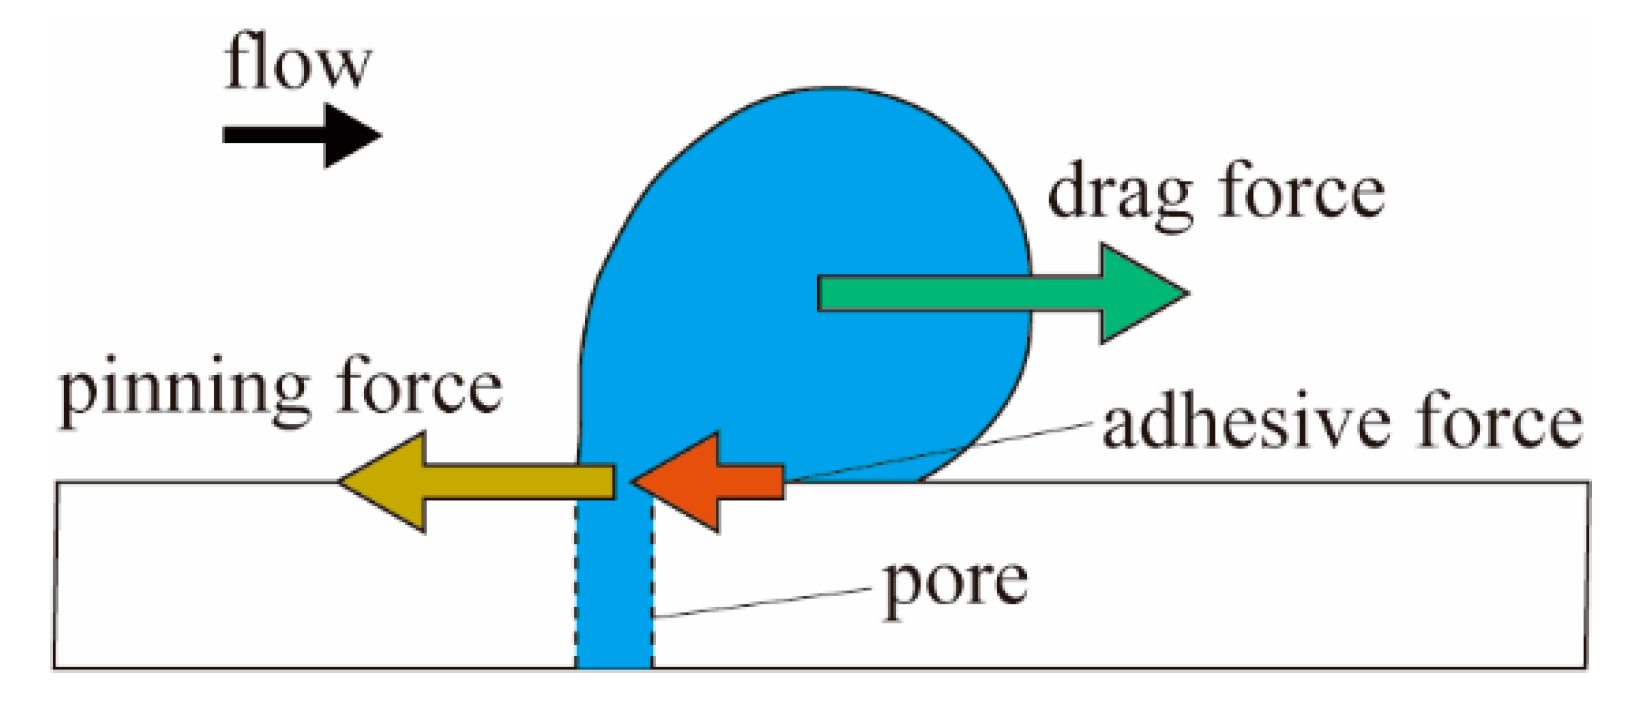
Empirical Equations (4) and (5) are analyzed in the following manner. Three forces, aerodynamic drag force, adhesive force and pinning force, are acting on the droplet at the moment it starts running back, as shown in
Figure 6. The aerodynamic drag force is a driving force. The adhesive force is acting on the interface between the droplet and the coating surface as a resistance force [
30]. The pinning force is also working as a resistance force, since the water droplet is pinned by water through the pore and the droplet cannot start running until the pin is broken. If the pinning force is significantly larger than the adhesive force due to a low adhesive force of superhydrophobic surface, the adhesive force can be negligible and then the force balance is expressed as follows:
where the right-hand side is the aerodynamic drag force of a sphere. Here,
ρ,
cd,
A and
U are the air density, drag coefficient, cross-sectional area of a droplet and airflow speed, respectively. The left-hand side represents the pinning force,
FP, with the assumption that
FP only depends on the diameter of a pore, which gives
FP as a constant.
Let drag coefficient
cd be expressed as a power function of the Reynolds number,
Re, as follows:
where
α and
β are constant parameters determined empirically. The Reynolds number,
Re, is then shown as follows:
where
d is a characteristic length and
ν is the kinematic viscosity of air. Then the drag coefficient,
cd, can be expressed as follows:
As shown in
Figure 4 and
Figure 5, there is no significant difference of the size between the contact length,
LC, and the height,
H, in relation to the air velocity. Thus, let us assume that the aerodynamic drag force of the droplet can be regarded as the drag of a sphere. Then, by substituting Equation (9) into Equation (6) and solving it for the sphere diameter,
d, it becomes inversely proportional to the air velocity, as follows:
where
γ is
Here,
γ can be considered as a constant. If the contact length,
LC, or the height,
H, are regarded as the sphere diameter and they correspond to the characteristic length,
d, then we can find that the relationship between the air velocity and the droplet size are inversely proportional, which shows the same trend as shown in Equations (4) and (5).
If the adhesive force is dominant and the pinning force is negligible, the correlation between the size of the droplet and the critical air velocity would not follow Equation (10), but would still be inversely proportional. As can be seen in
Figure 5, the contact length,
Lc, decreases with increasing air velocity. If we assume the pore size is reduced, the ratio of
Lp and
Lc is reduced. Because of the decrease in the ratio, the overall
Lc value would rise, keeping the inverse relationship.
Figure 4 also showed a numerically approximated boundary layer thickness using the Blasius exact solution. As one can see from
Figure 4, the droplet is likely to be fully covered by the boundary layer when
U∞ is greater than 30 m/s. Even under 25 m/s of
U∞, at least over 60% of the droplet height was immersed in the velocity profile. This indicates that the incipient motion is mainly governed by the velocity profile associated with
U∞. Even though we take into account a boundary slip by the superhydrophobic surface, the surface velocity is still smaller than
U∞. This creates a velocity profile. If the droplet experienced the velocity gradient in the height direction, and the velocity was not uniform, a practical velocity, such as an average velocity affecting the droplet, should be applied when aerodynamic drag force is considered. Based on our experimental setup, we could not identify the rolling motion of the droplet as being shed from the surface. However, we could relate
U∞ and the size of the droplet for the incipient motion. If the rolling motion is involved, it would be efficient to shed the droplet with the same amount of
U∞. The droplet could be deformed by drag, which depends on the velocity profile around the droplet. The ratio between the thickness of the boundary layer and the height of the droplet should be considered. If the thickness of the boundary layer is much smaller than the height of the droplet, the shape of the droplet would be unlikely to be deformed due to a uniform flow profile. If the droplet is completely immersed in the boundary layer, it would experience the velocity gradient of the boundary layer. The velocity is different above and below the droplet. In that case, the droplet may deform depending on the velocity profile.
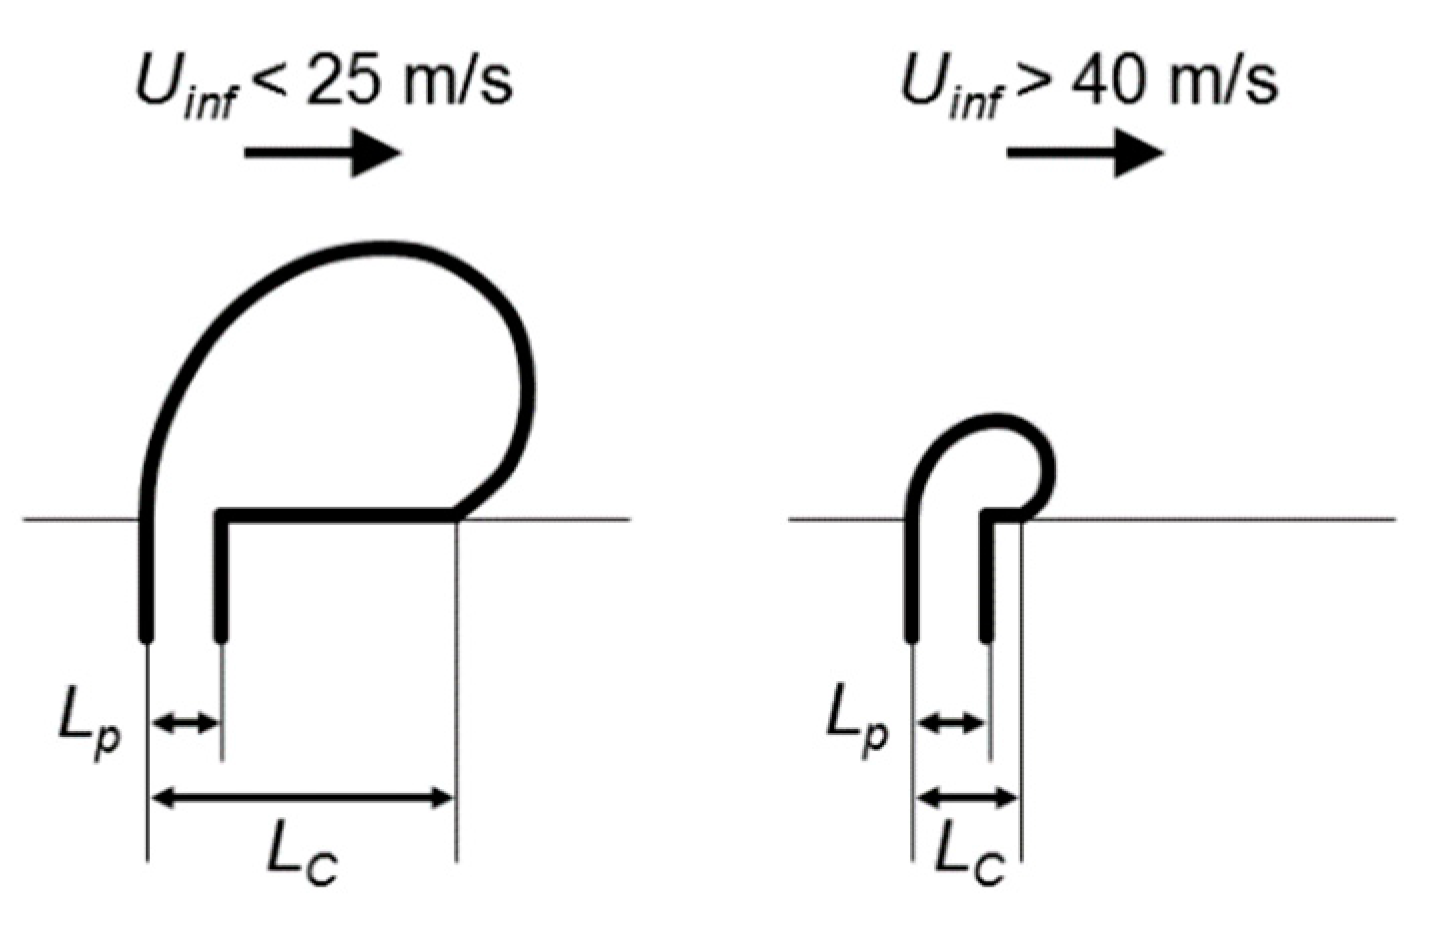
Figure 5 showed that the ratio between pore diameter,
LP, and contact length,
LC. The ratio,
LP/
LC, was over 38% when
U∞ increased over 25 m/s. This can be seen from the right horizontal axis in
Figure 5. This scale indicates that the effect of pinning force exists in relation to this ratio. Above the air velocity of 30 m/s, the droplet can be considered to be being more pinned than the adhesive force between the droplet and superhydrophobic surface, as shown in
Figure 7. To discuss the superhydrophobic effect on the droplet behavior, the air velocity should be considered around or below 25 m/s. To extend the validity of the velocity range, we should use smaller pores to reduce the ratio of pore diameter,
LP, over the contact length,
LC.


