Calibration of a Load Measurement System for an Unmanned Aircraft Composite Wing Based on Fibre Bragg Gratings and Electrical Strain Gauges


Abstract
:1. Introduction
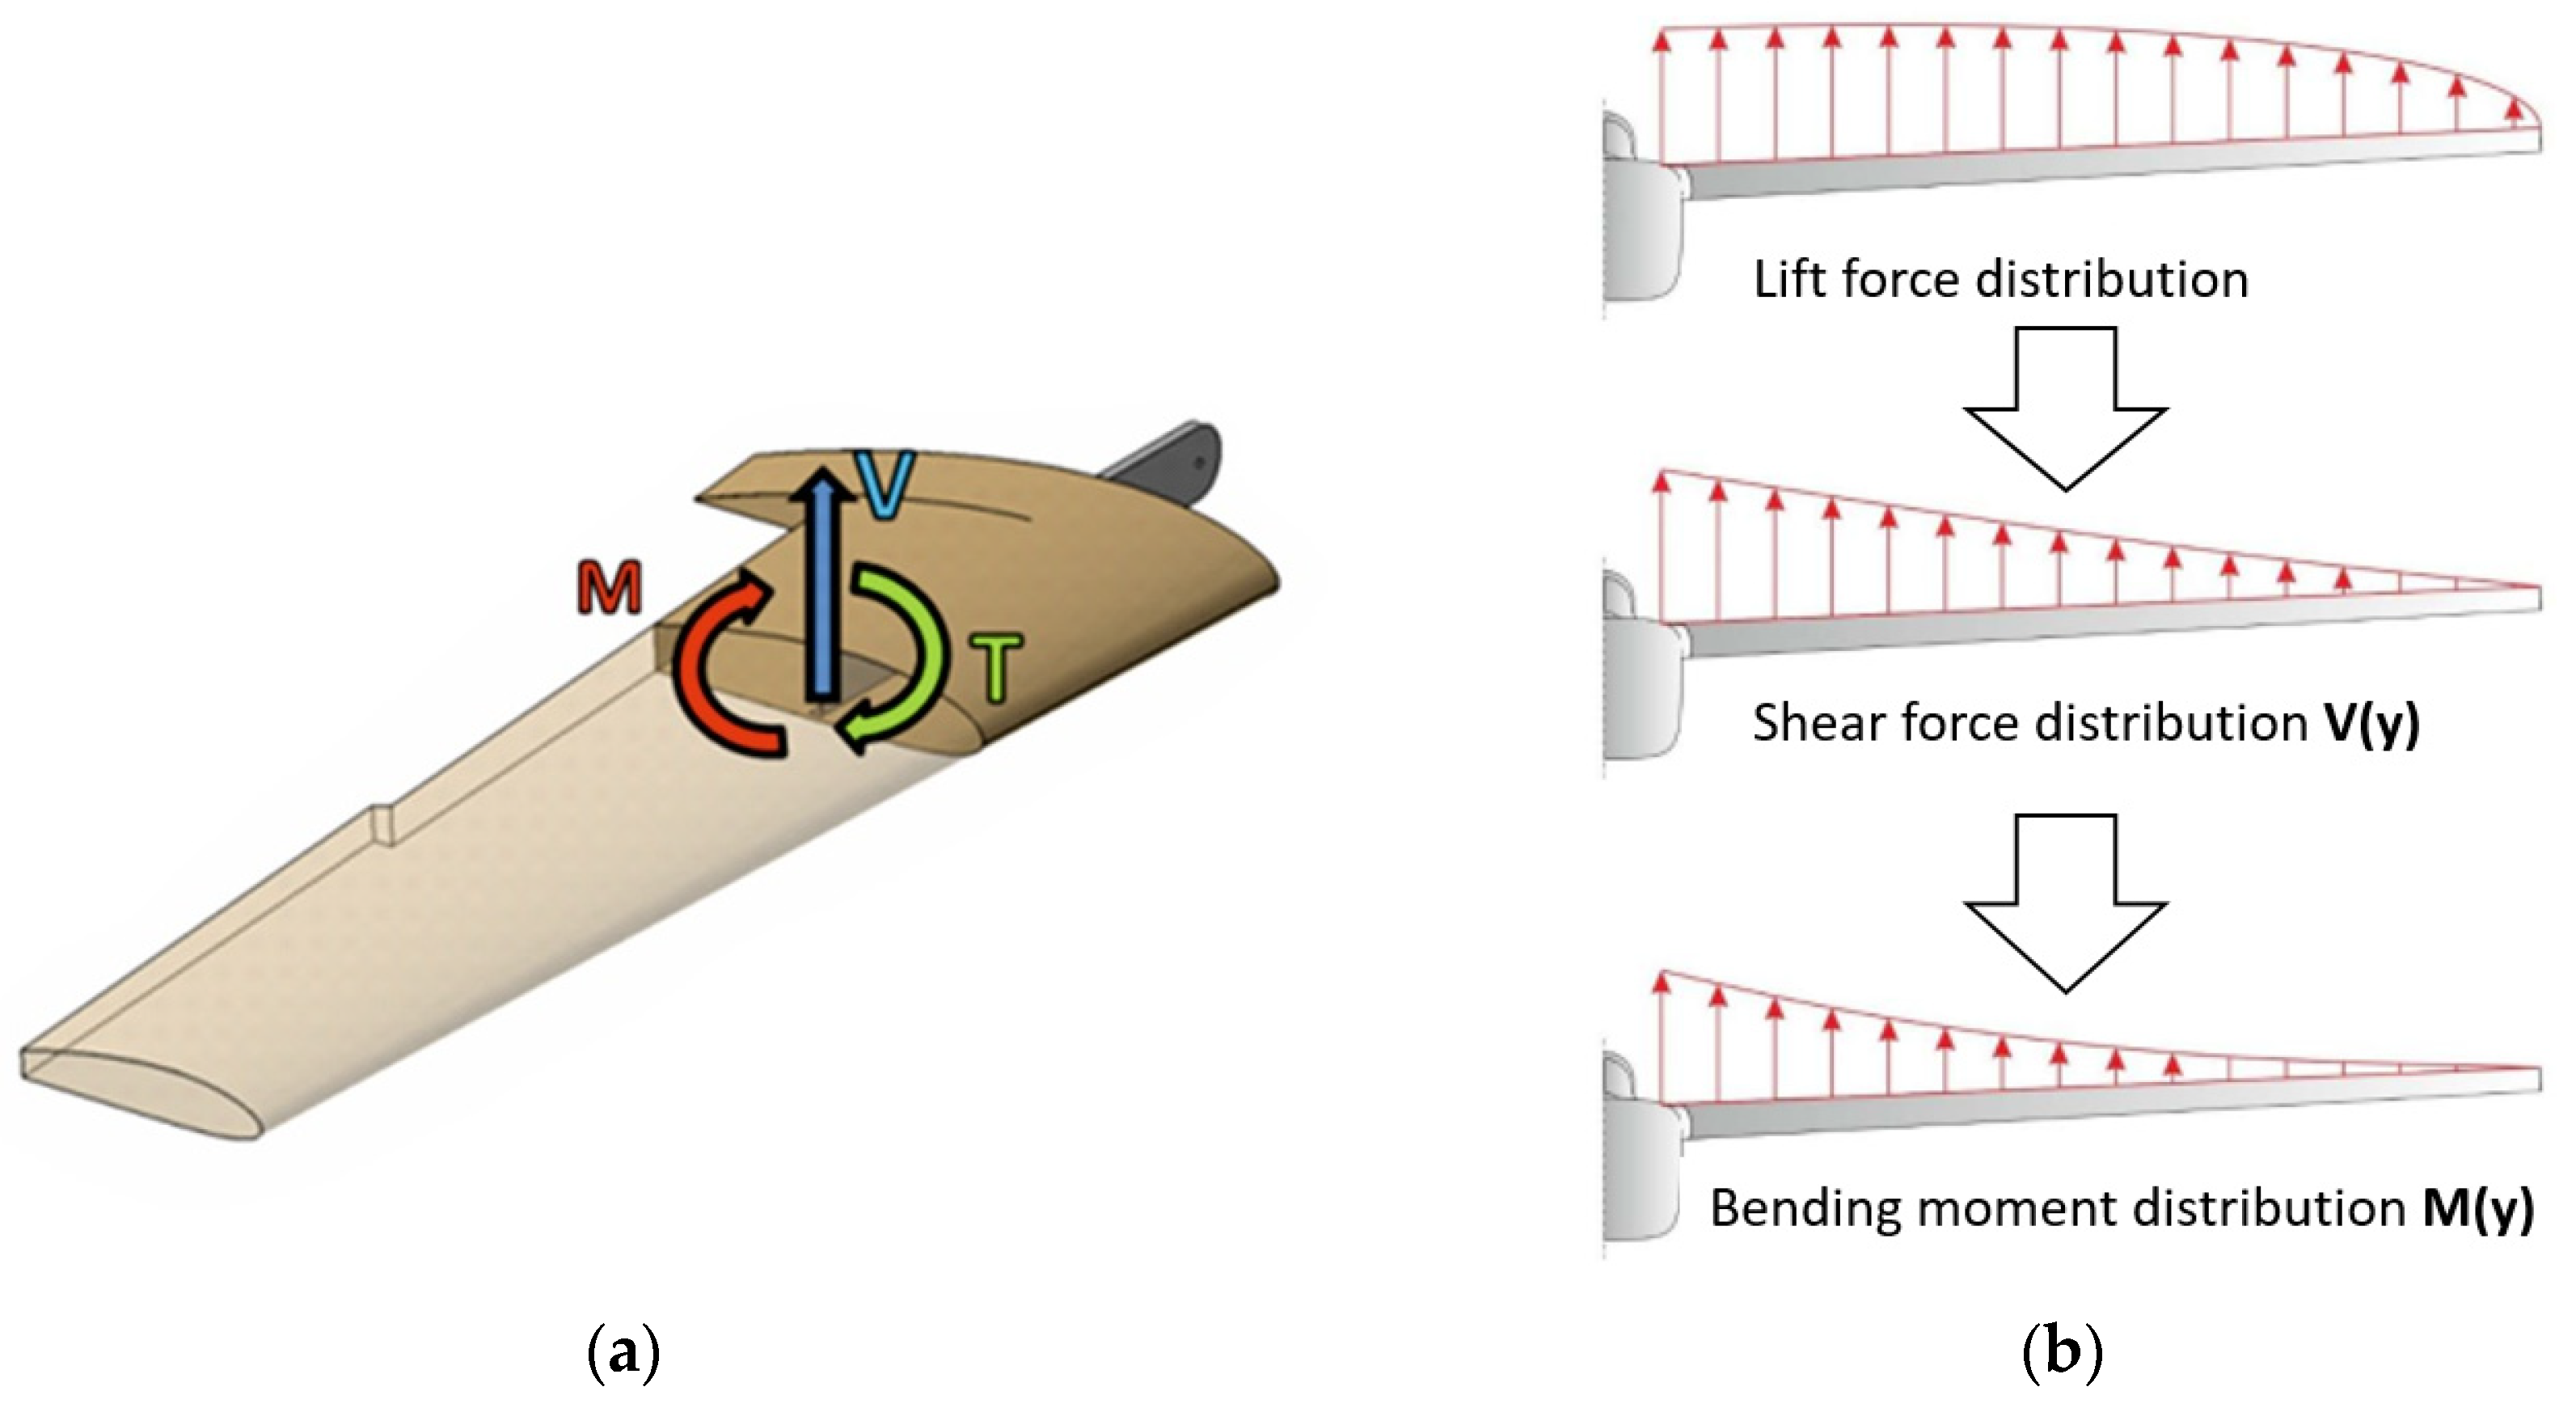
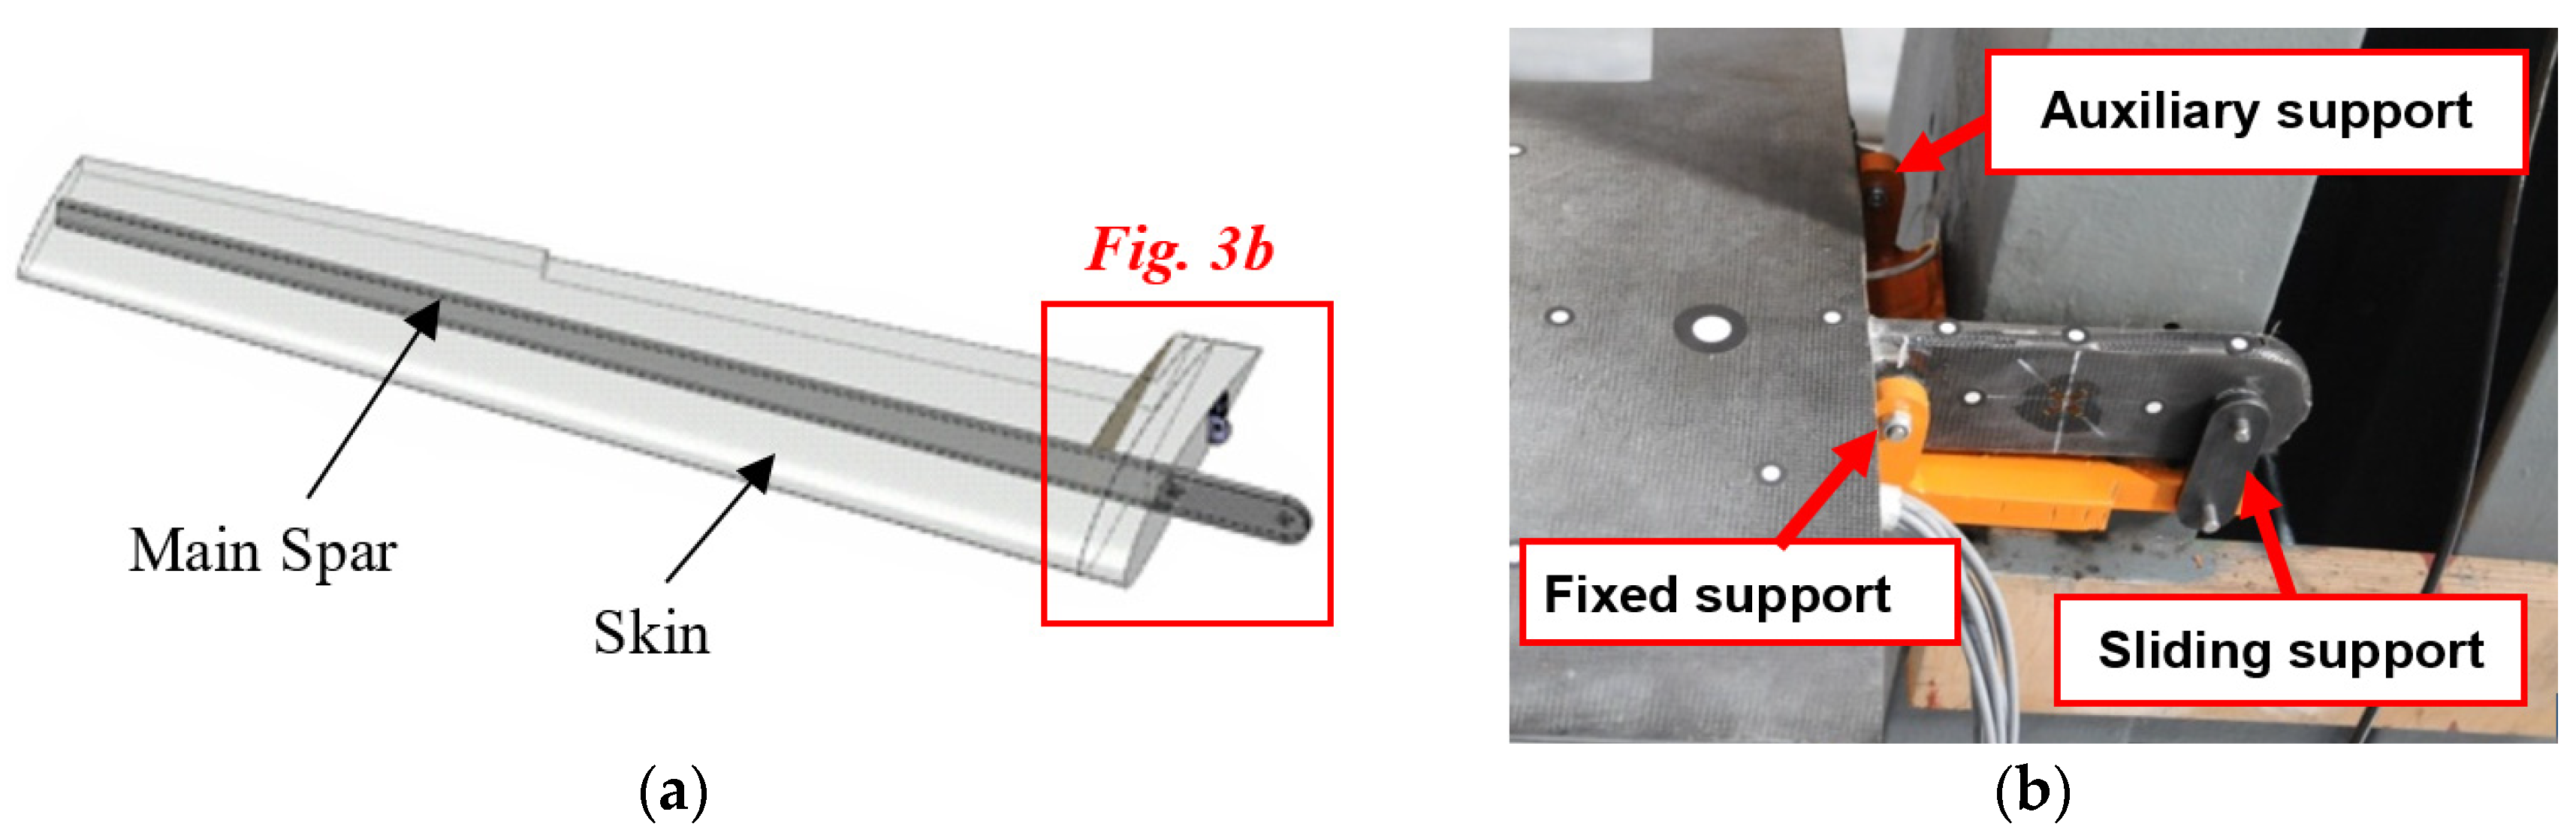
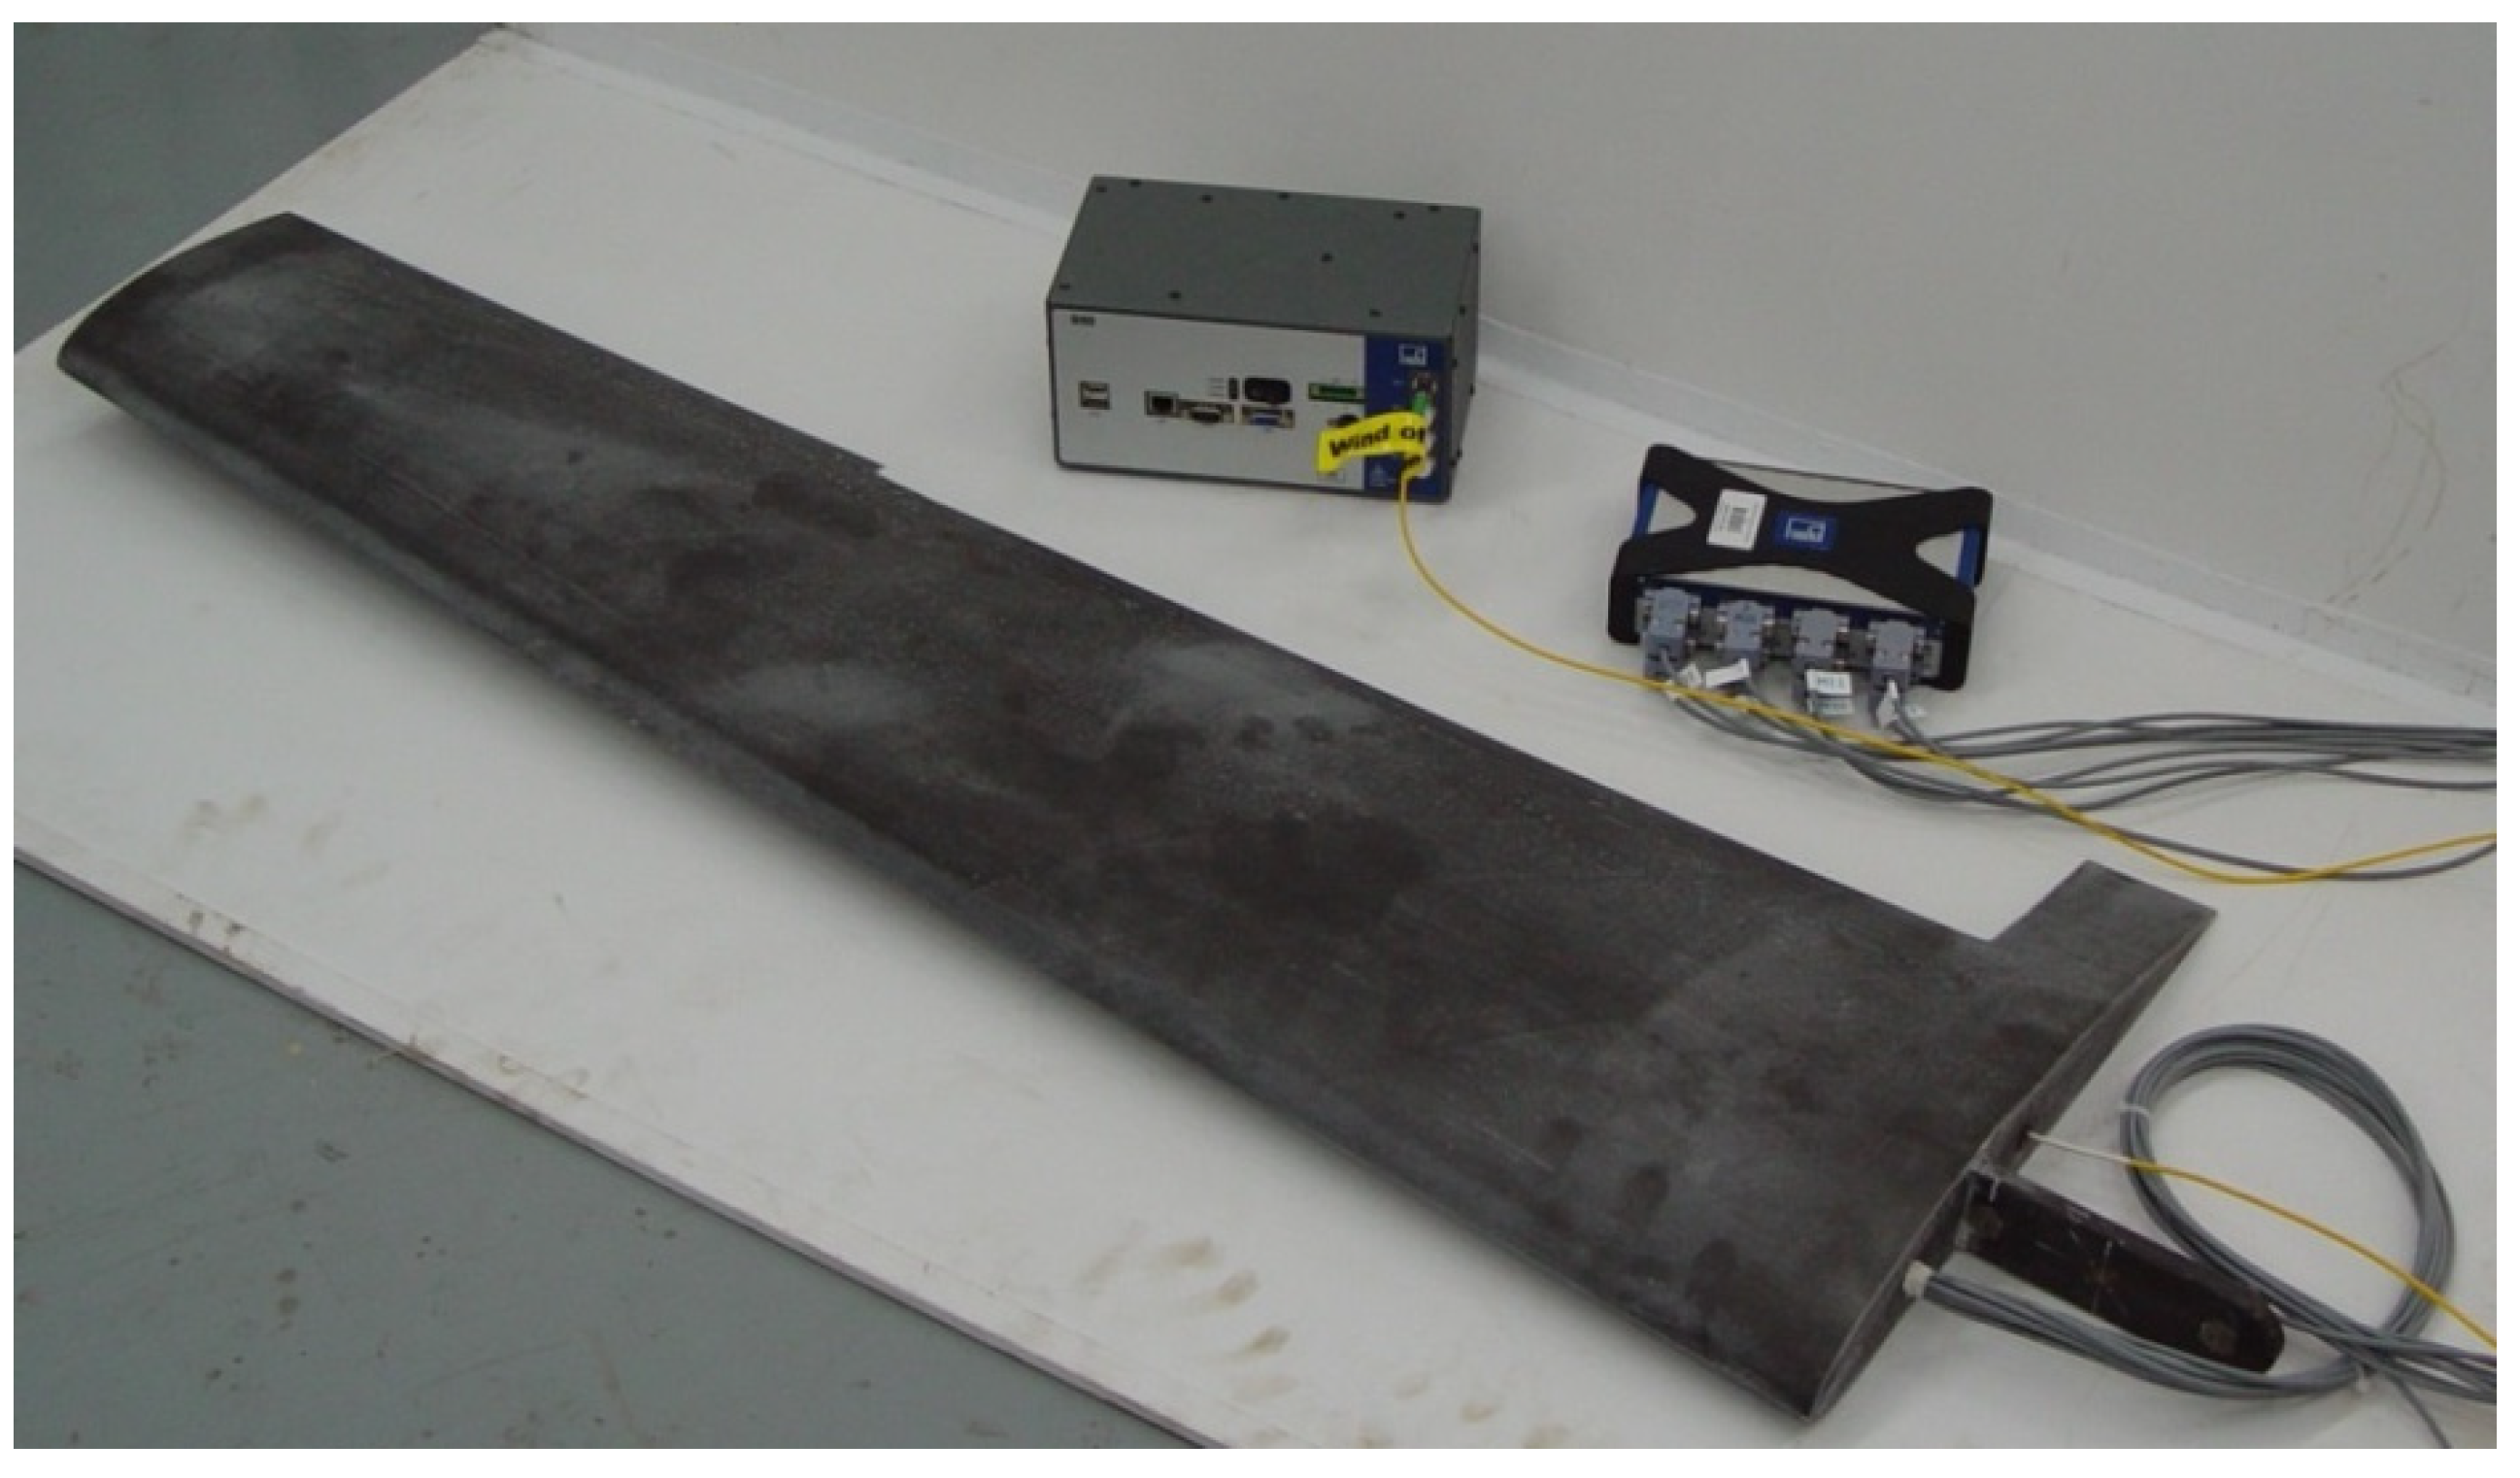
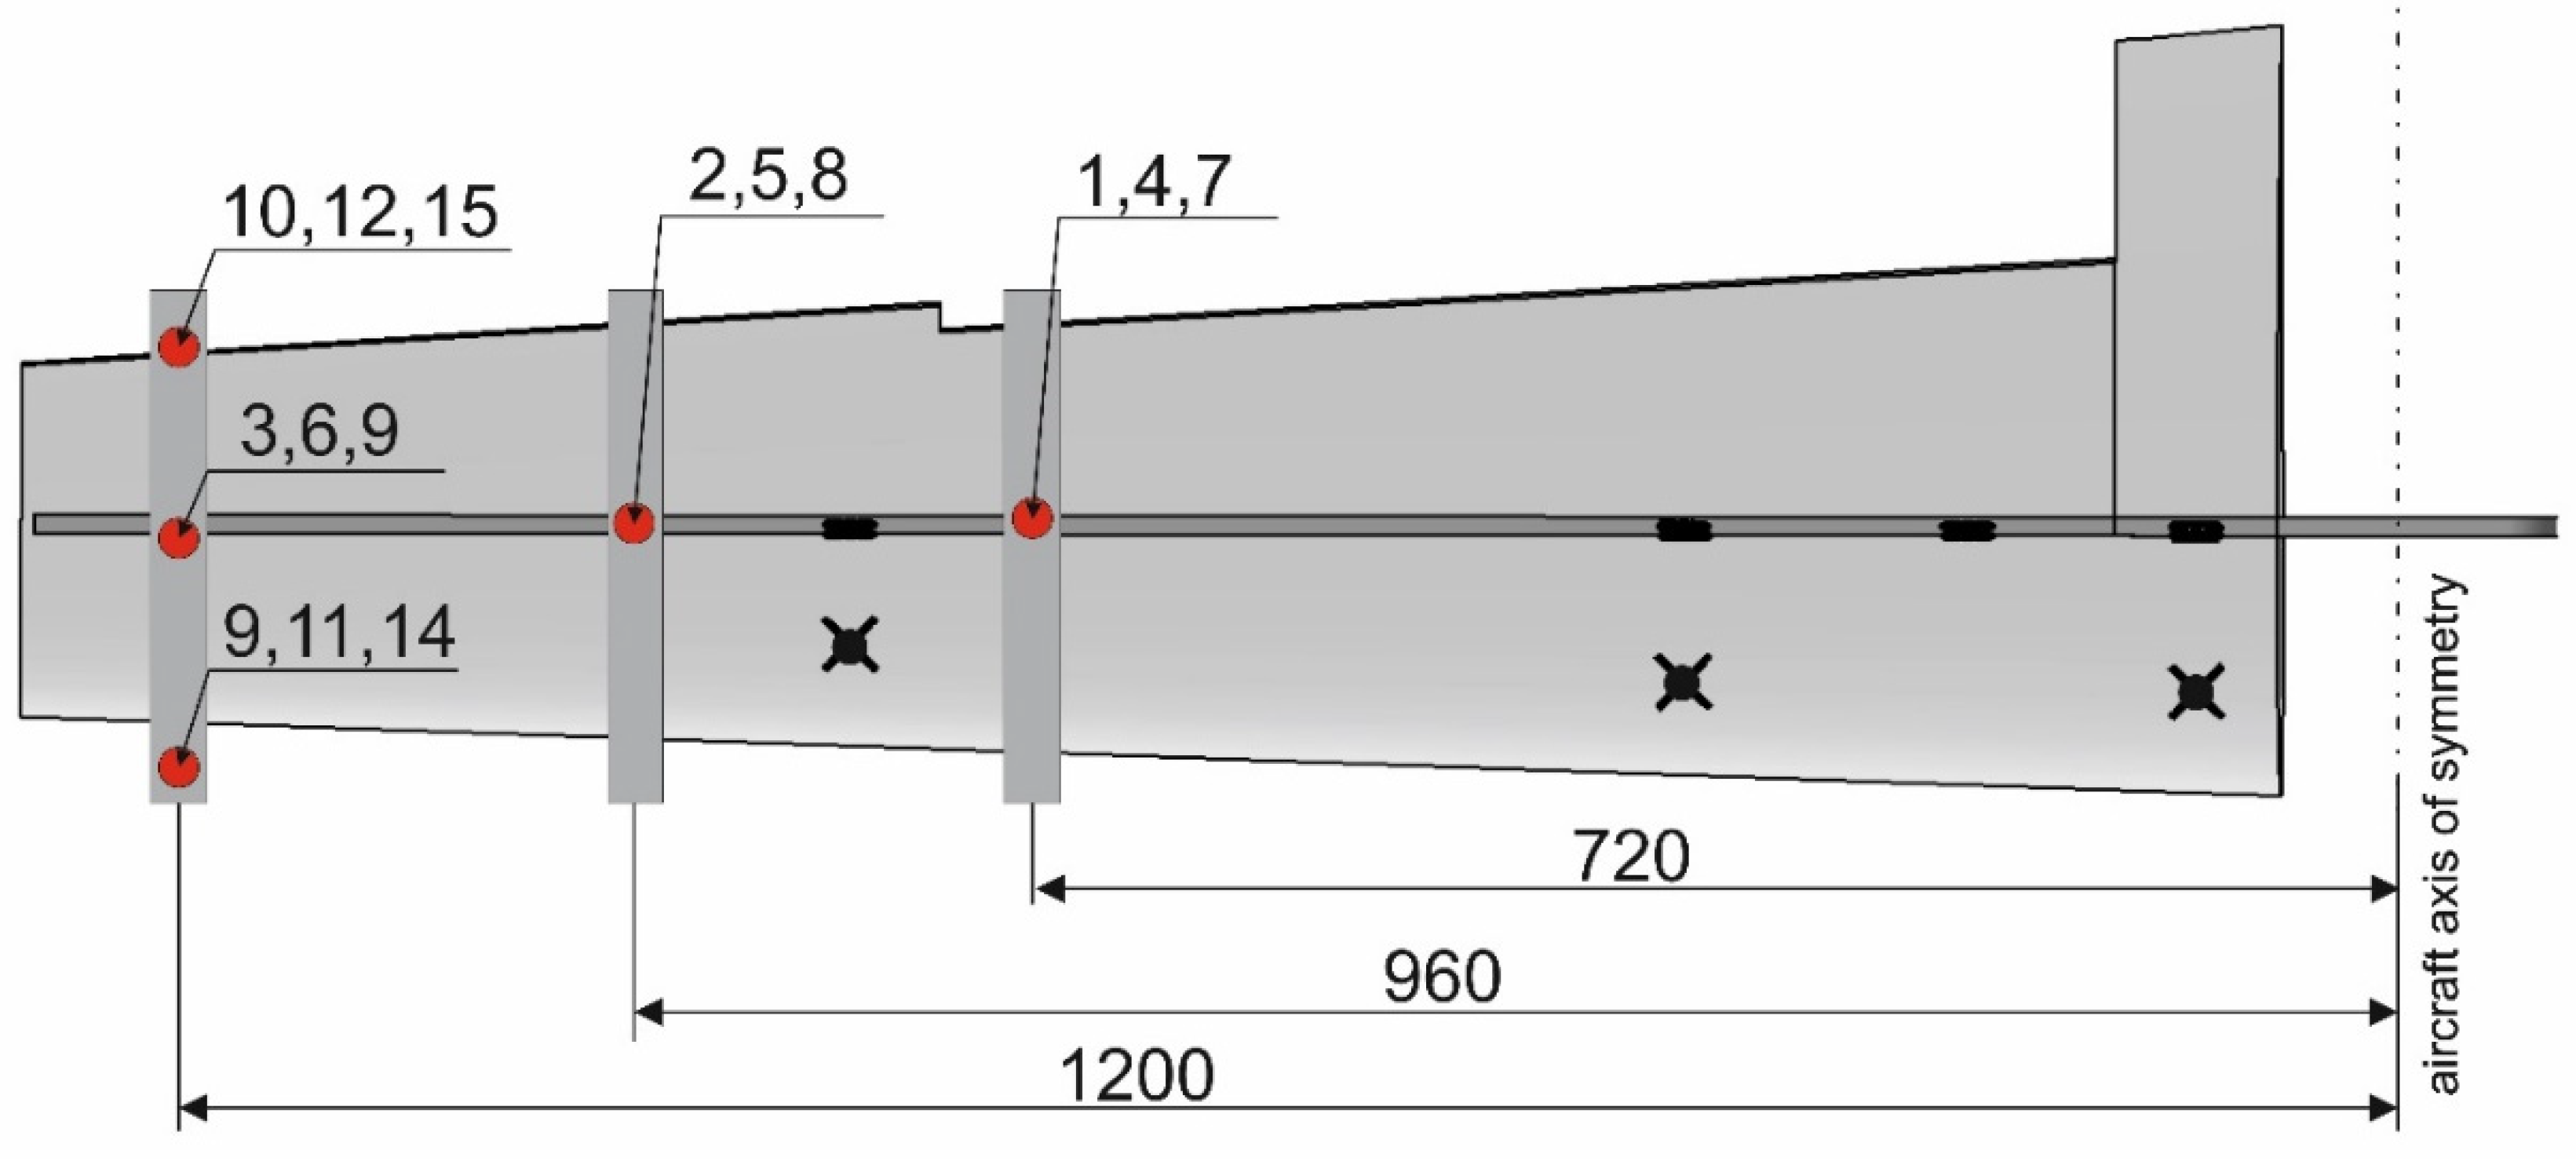
2. Tested Structure
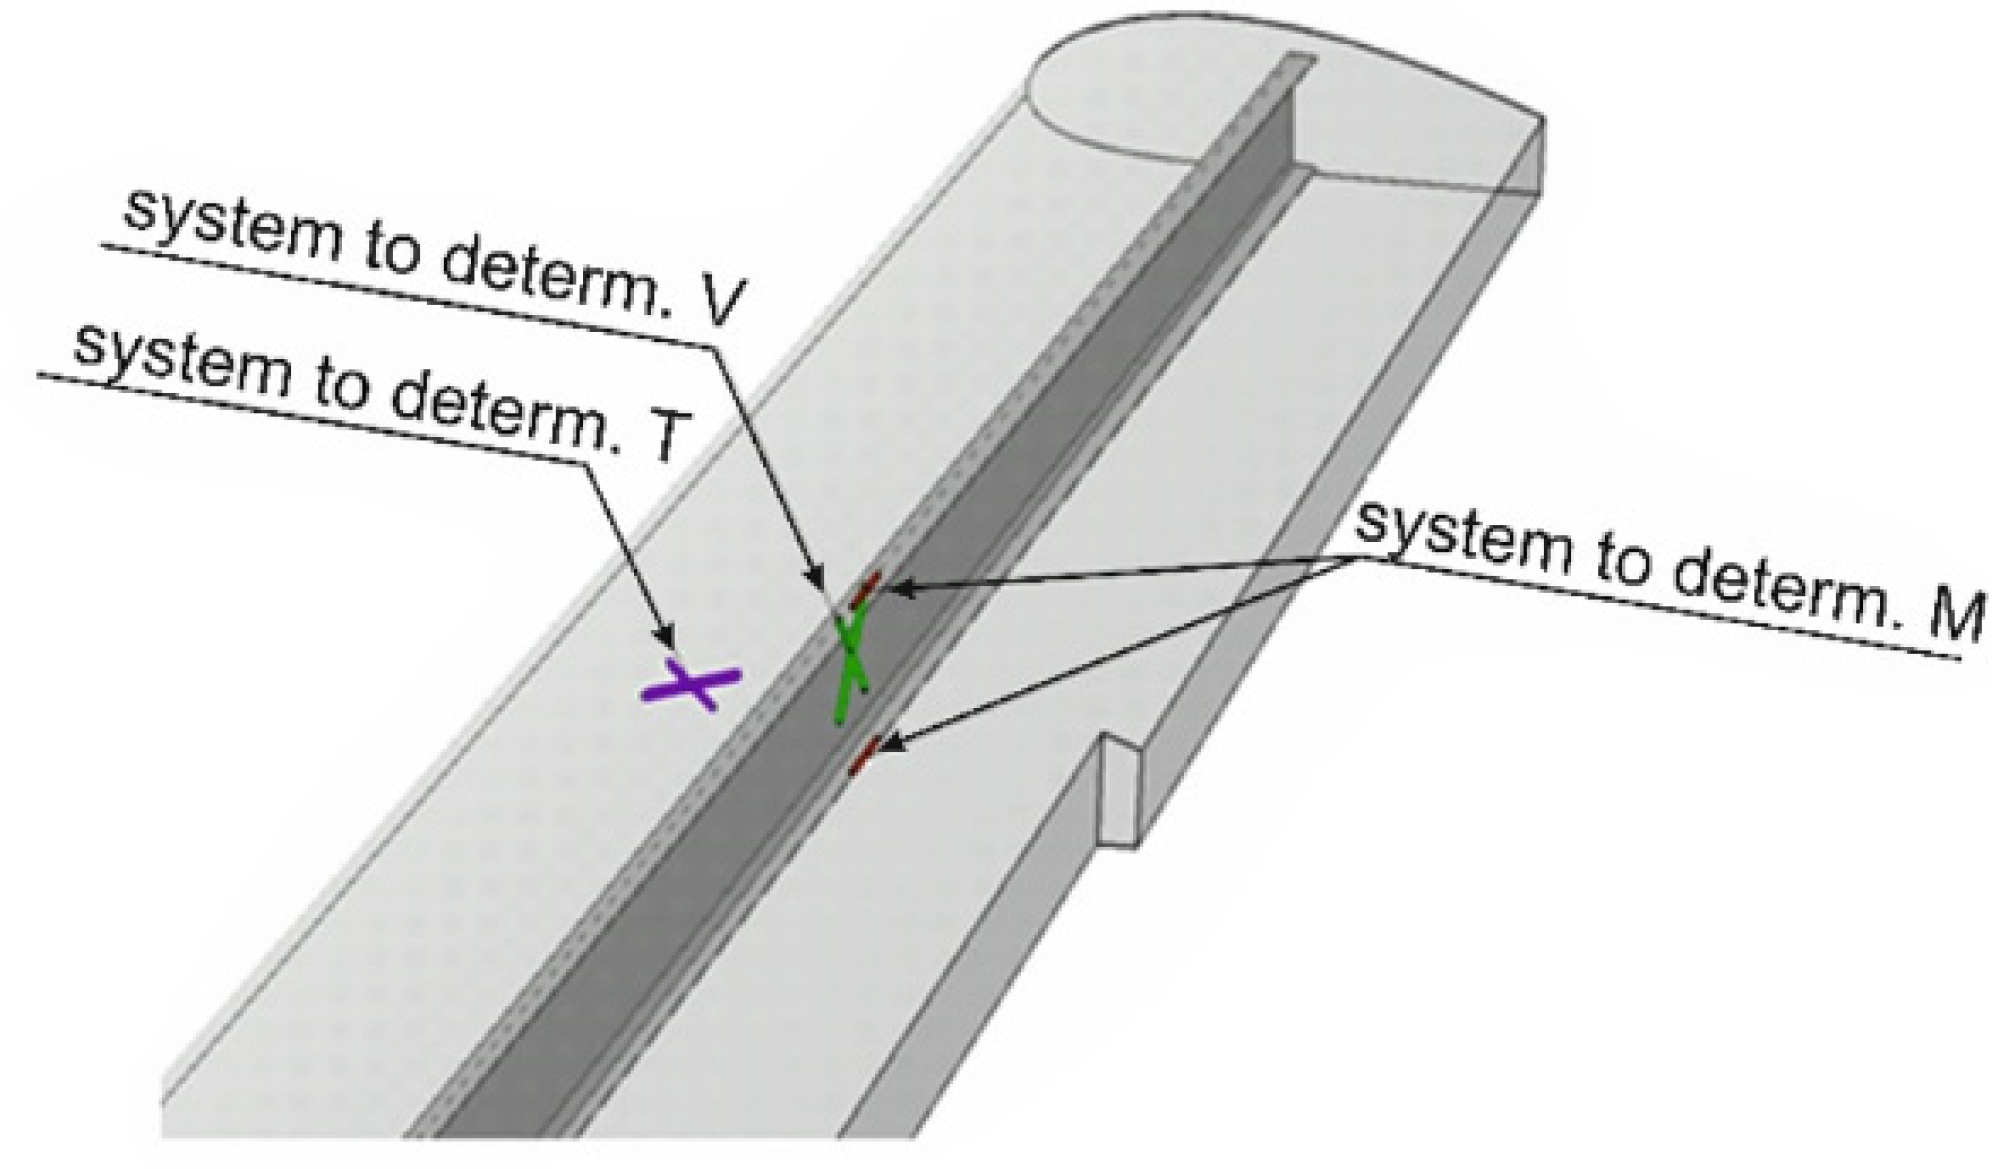
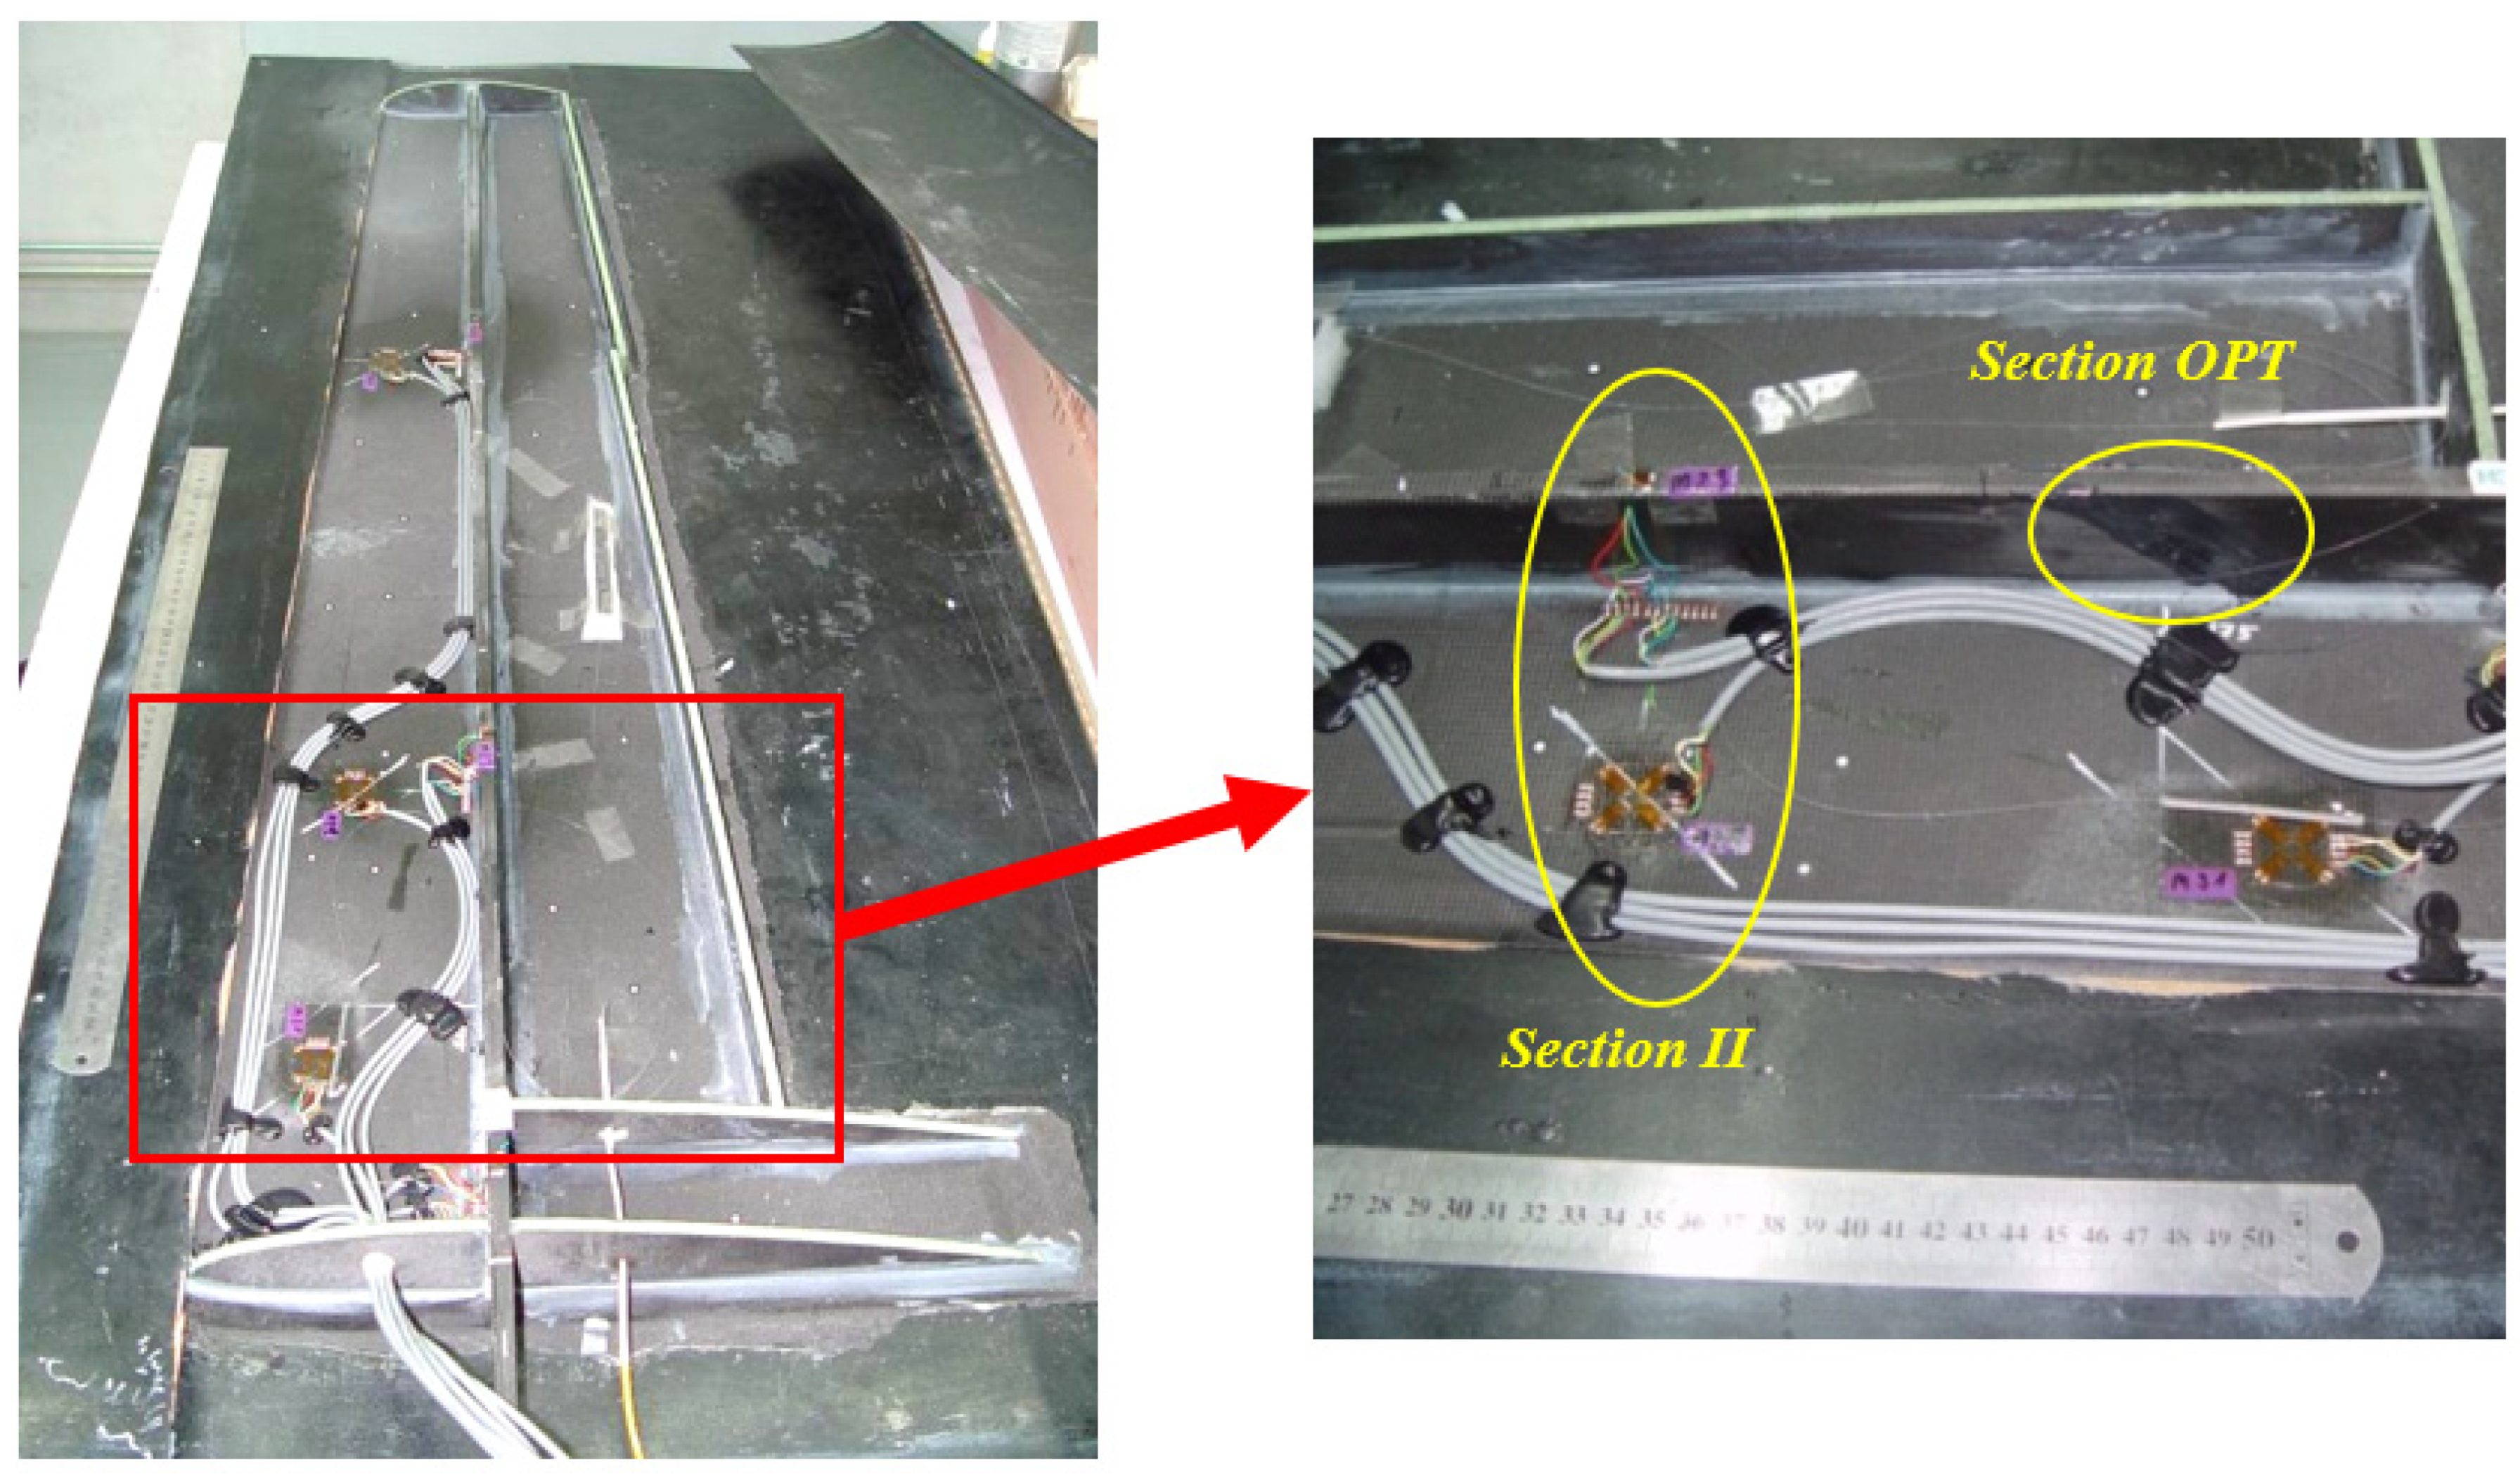
3. Measurement System
4. Measurement System Calibration
5. Measurement Results
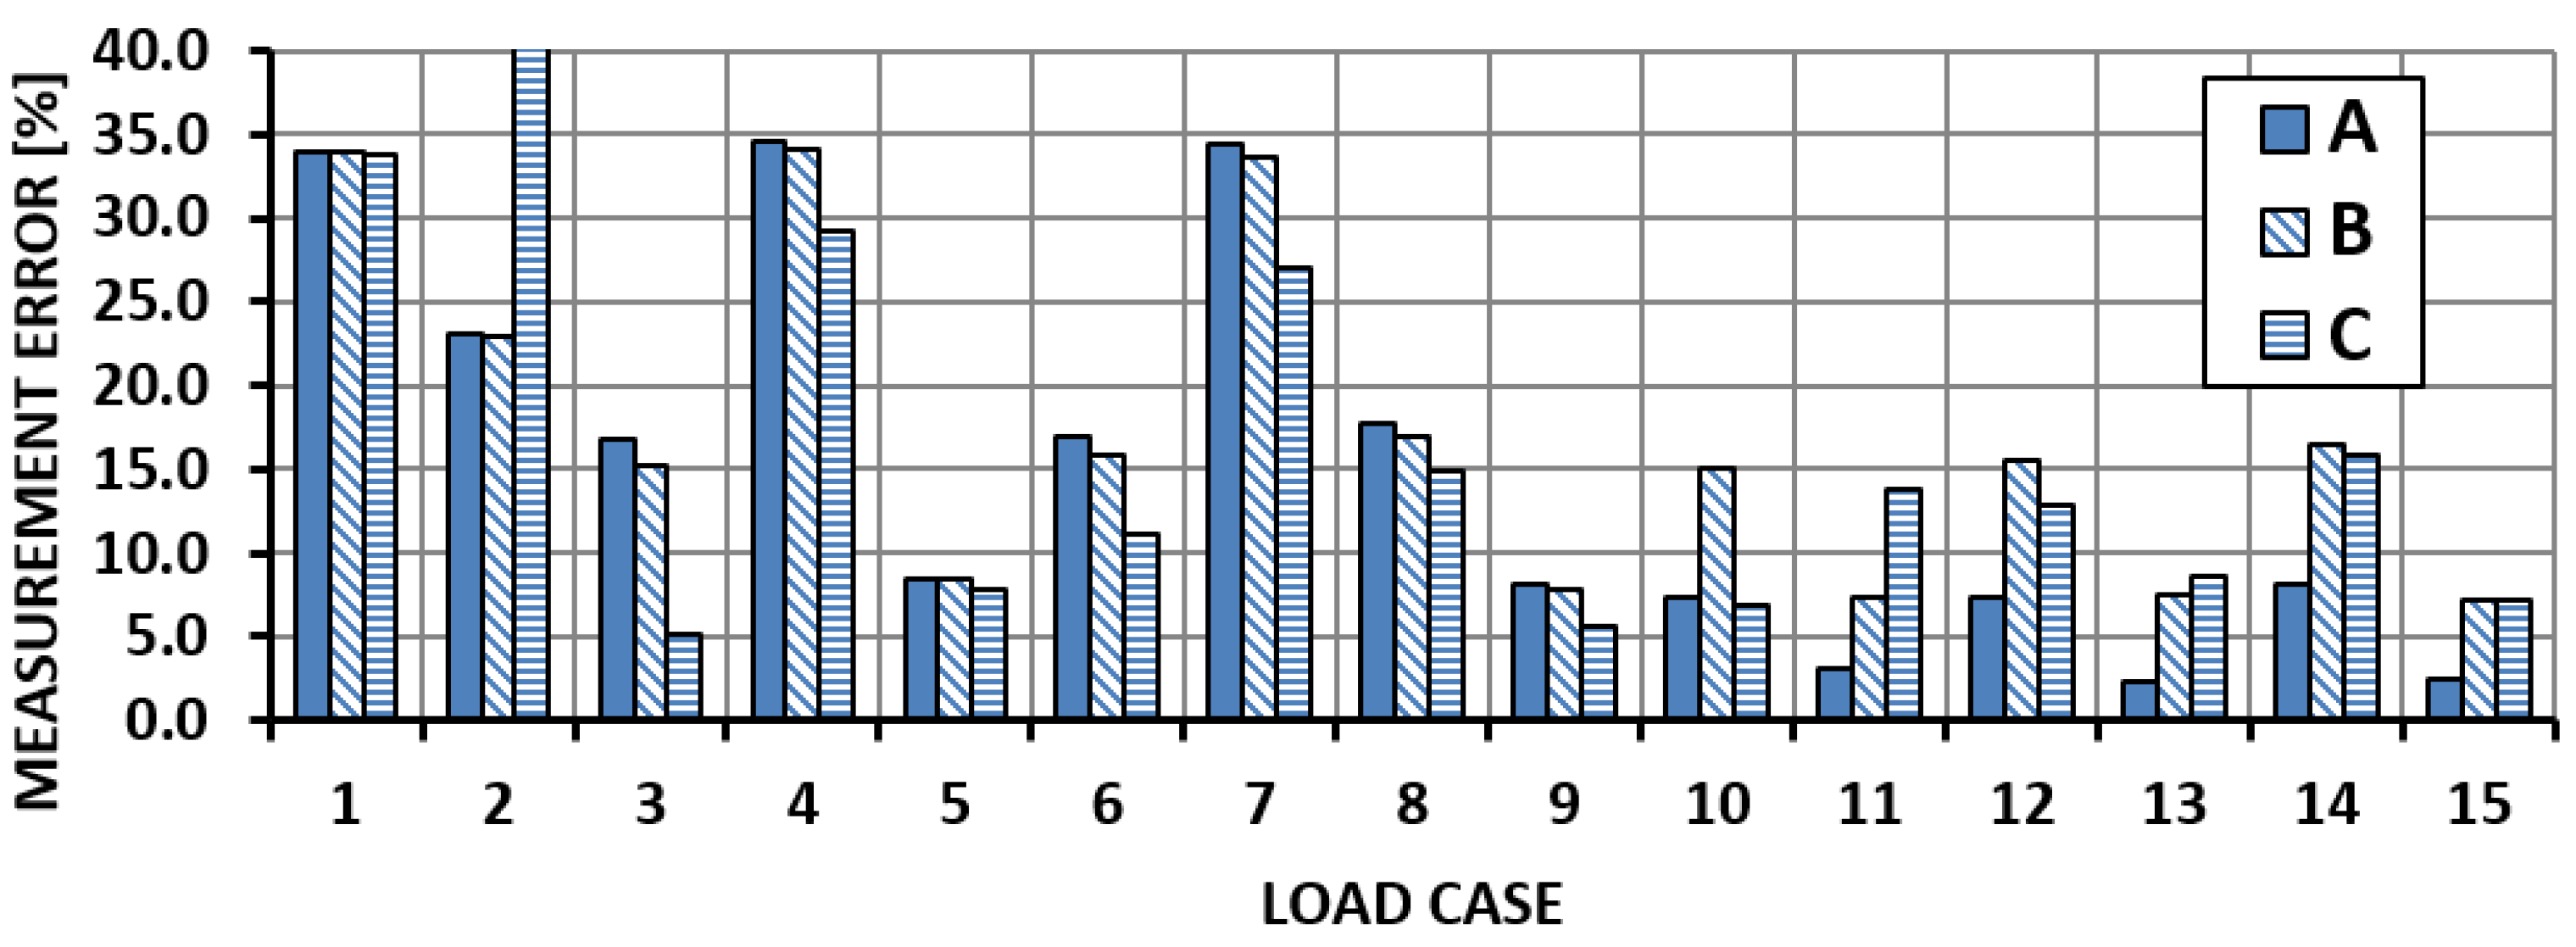
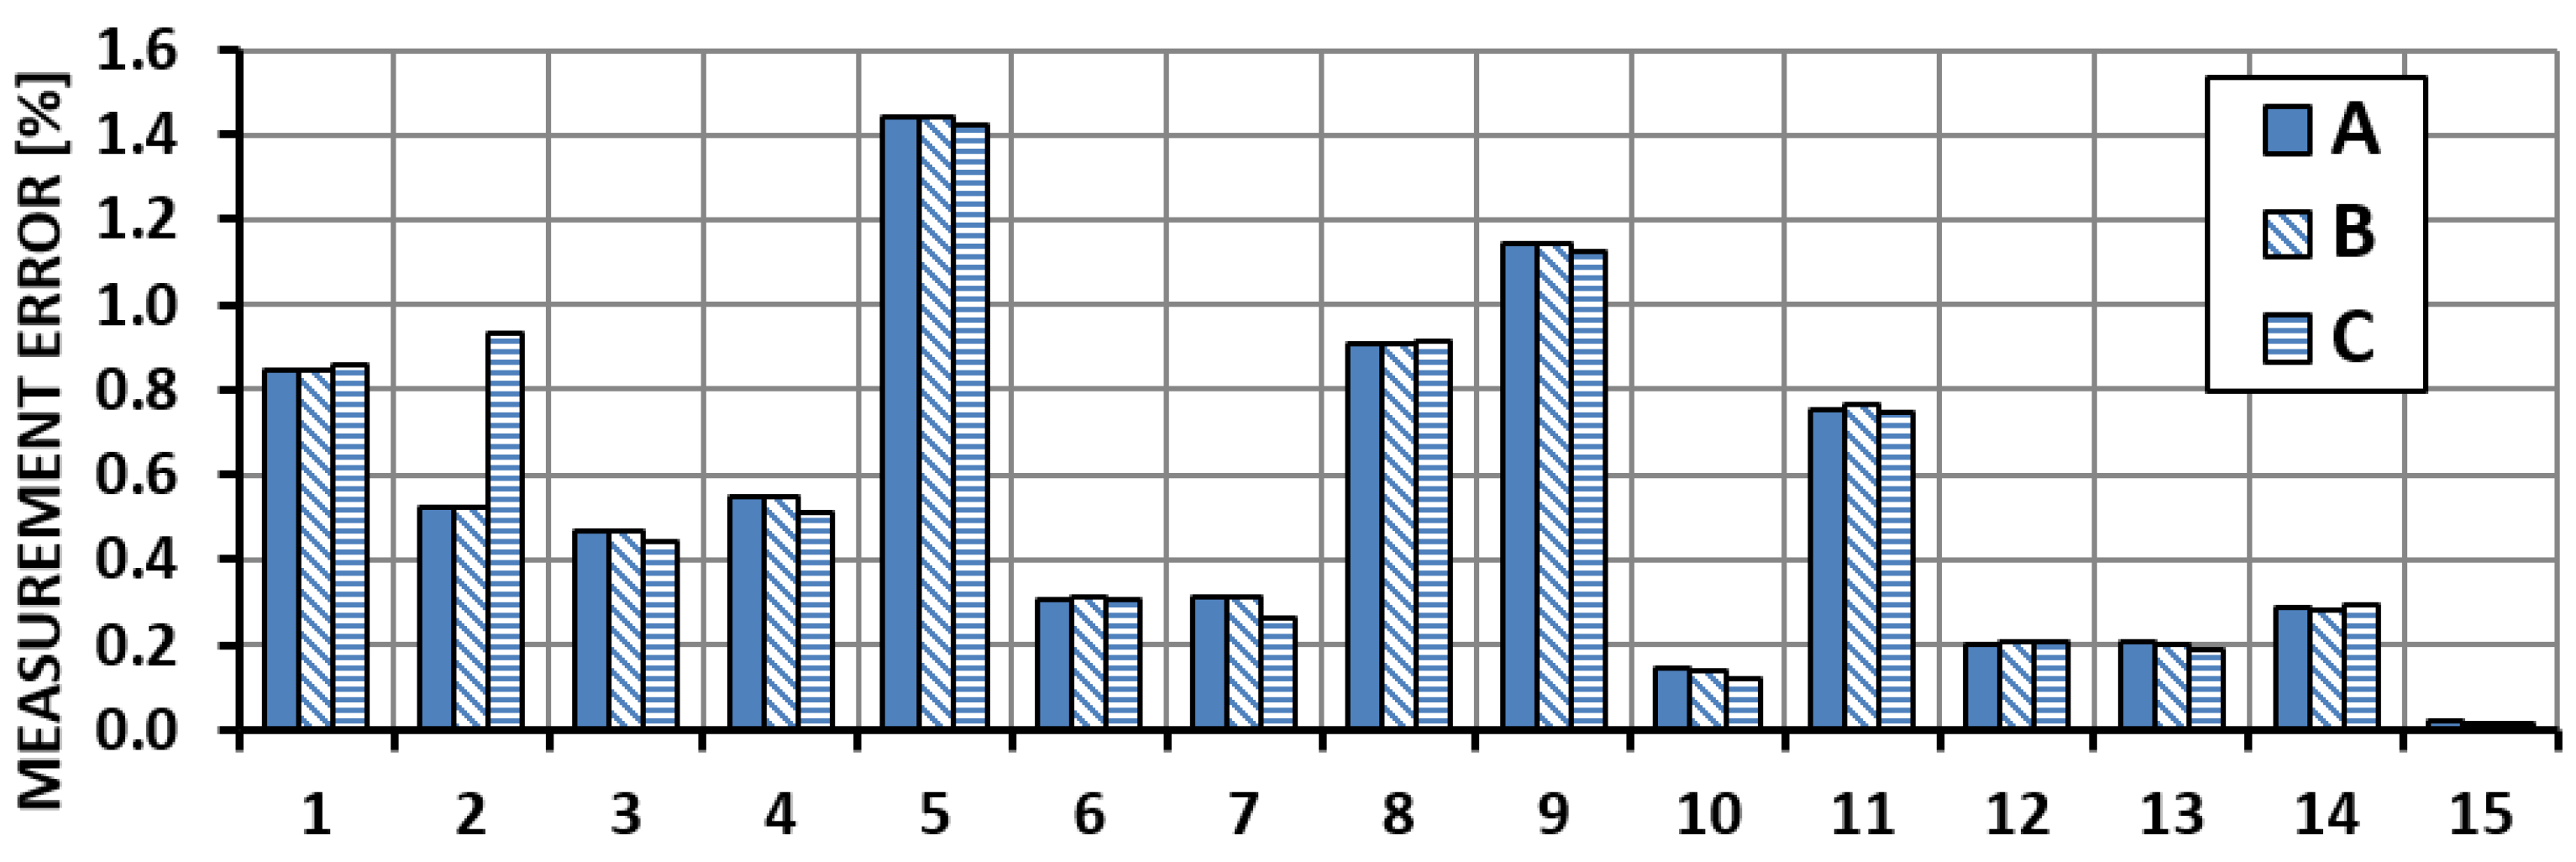
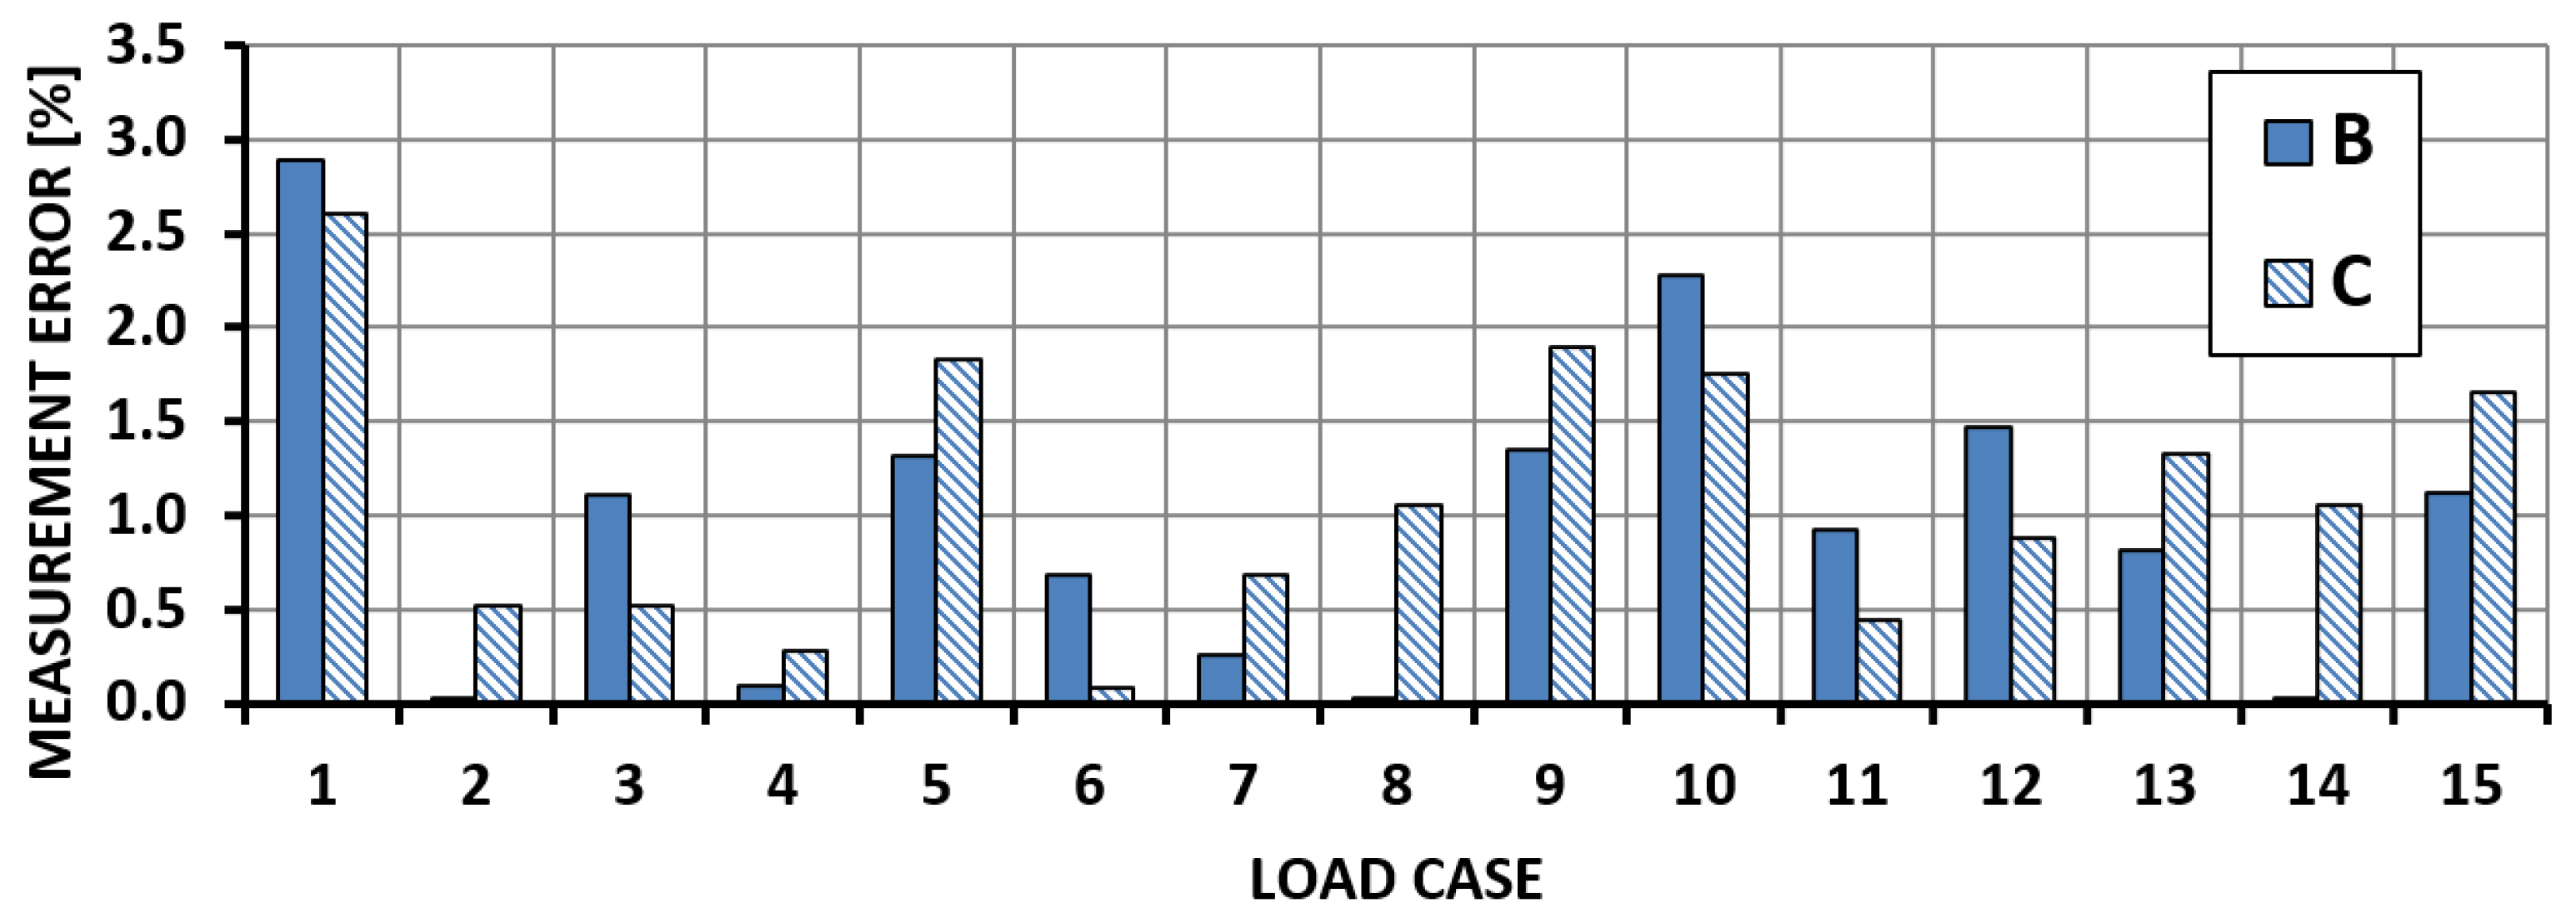
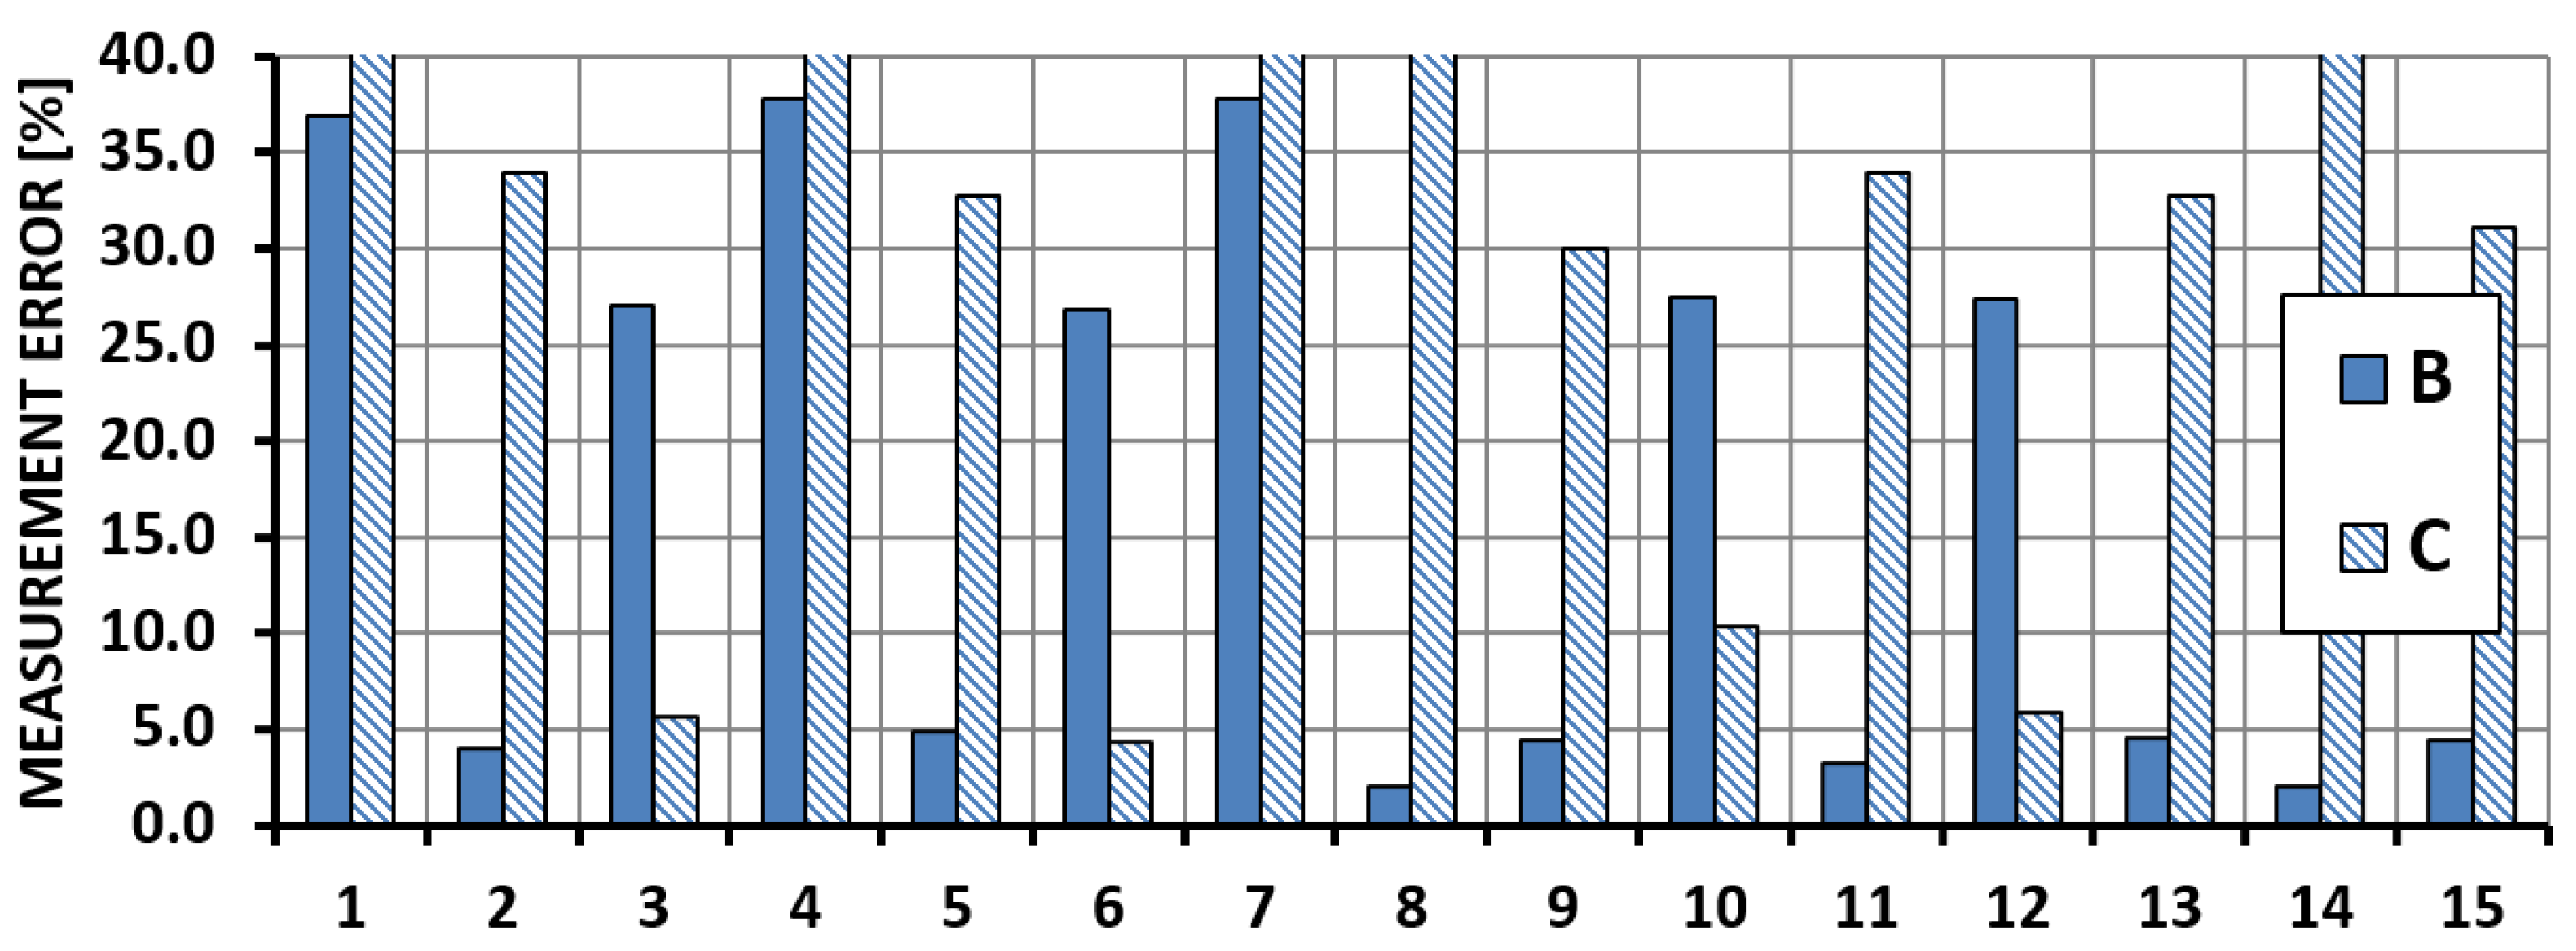
5.1. Calibration Cases
- Calibration with the use of one full measurement system: System A
- Calibration with the use of only the bridges for the measurement of shear force and bending moment: System B
- Calibration with the use of individual bridges—individual measurements of shear force, bending moment and torsional moment: System C
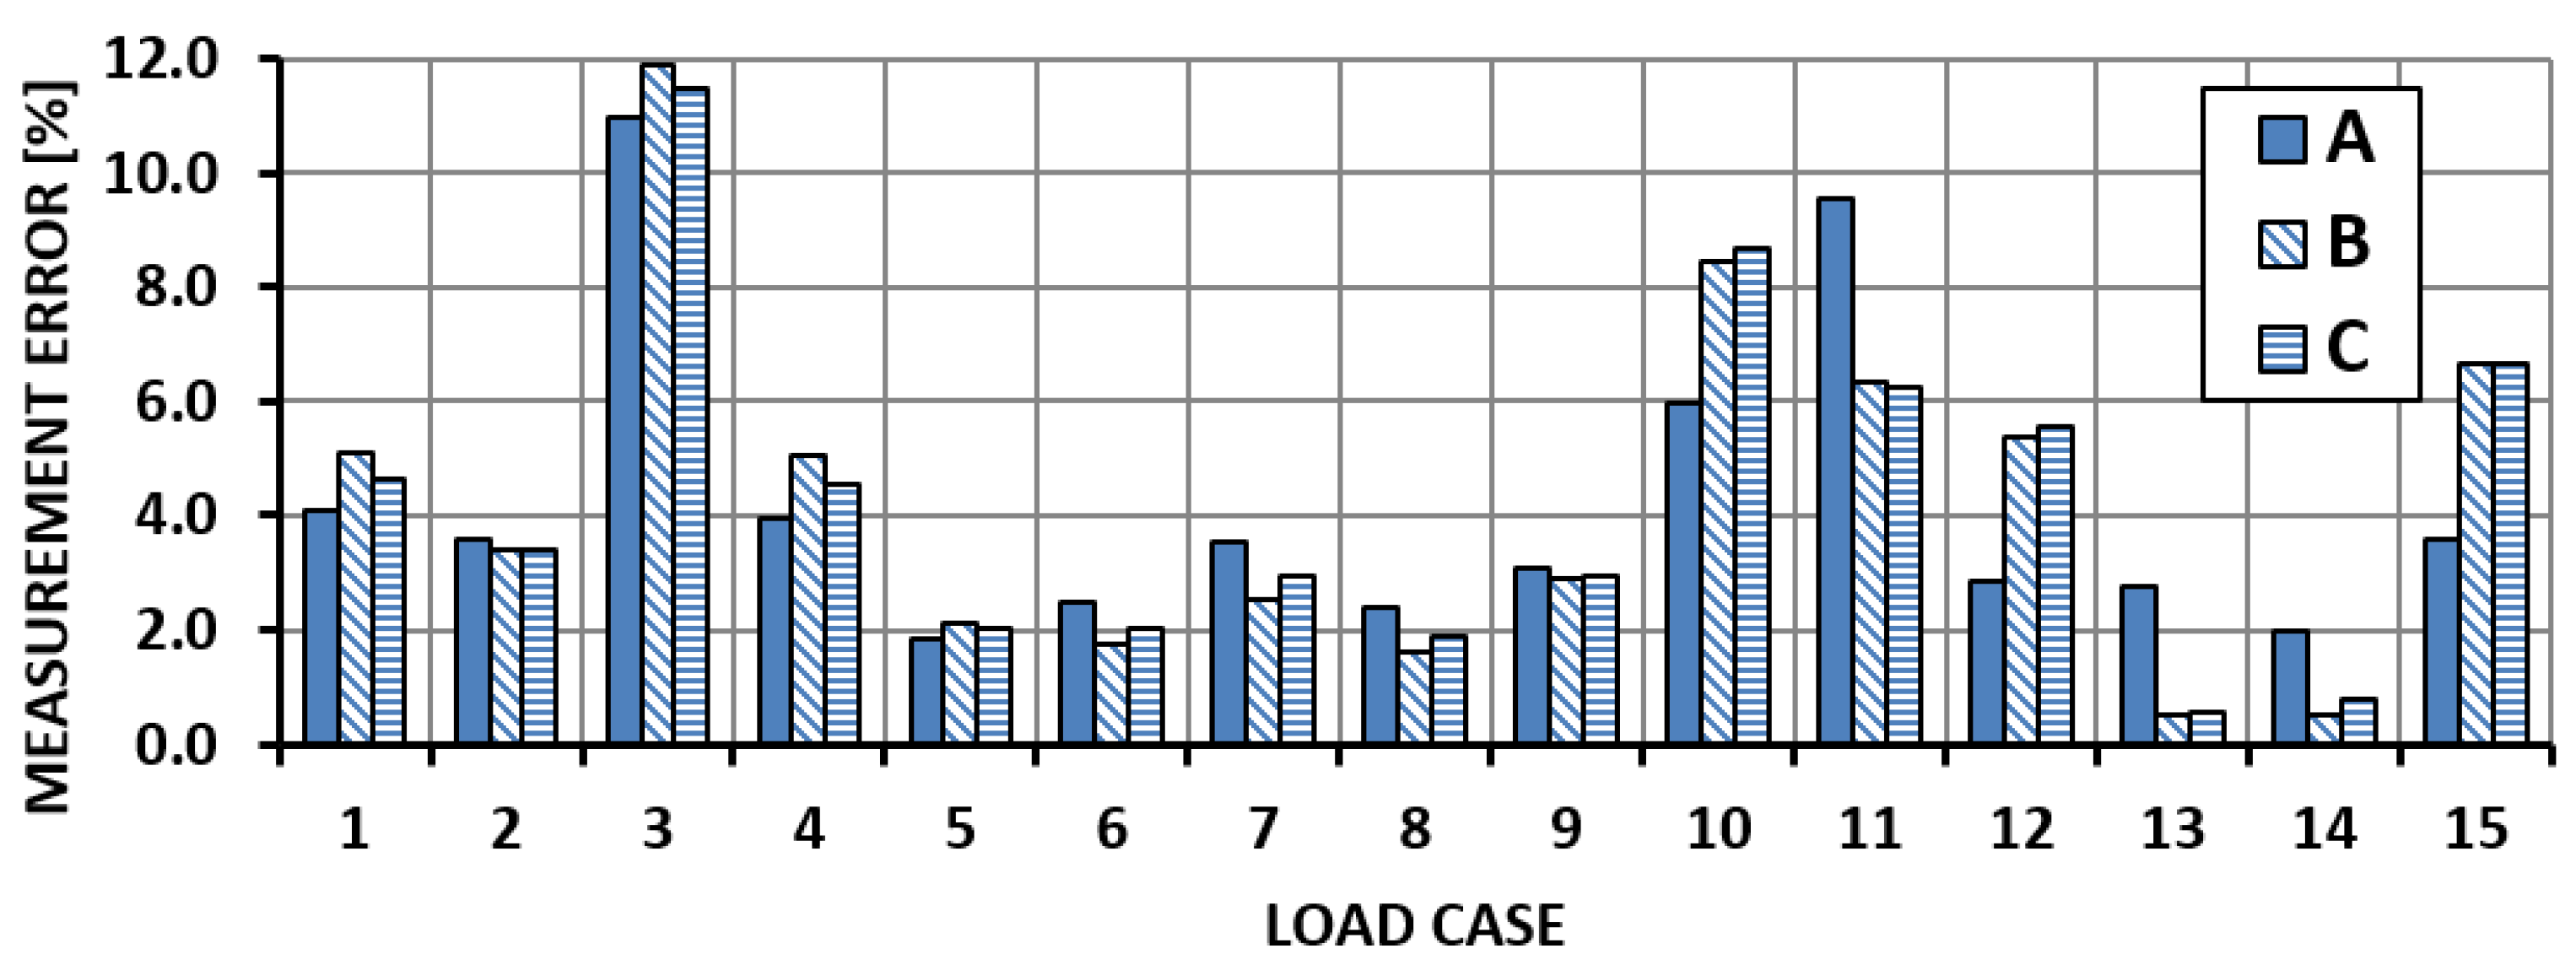
5.2. System Calibration for Resistance Strain Gauges (Sections II and III)
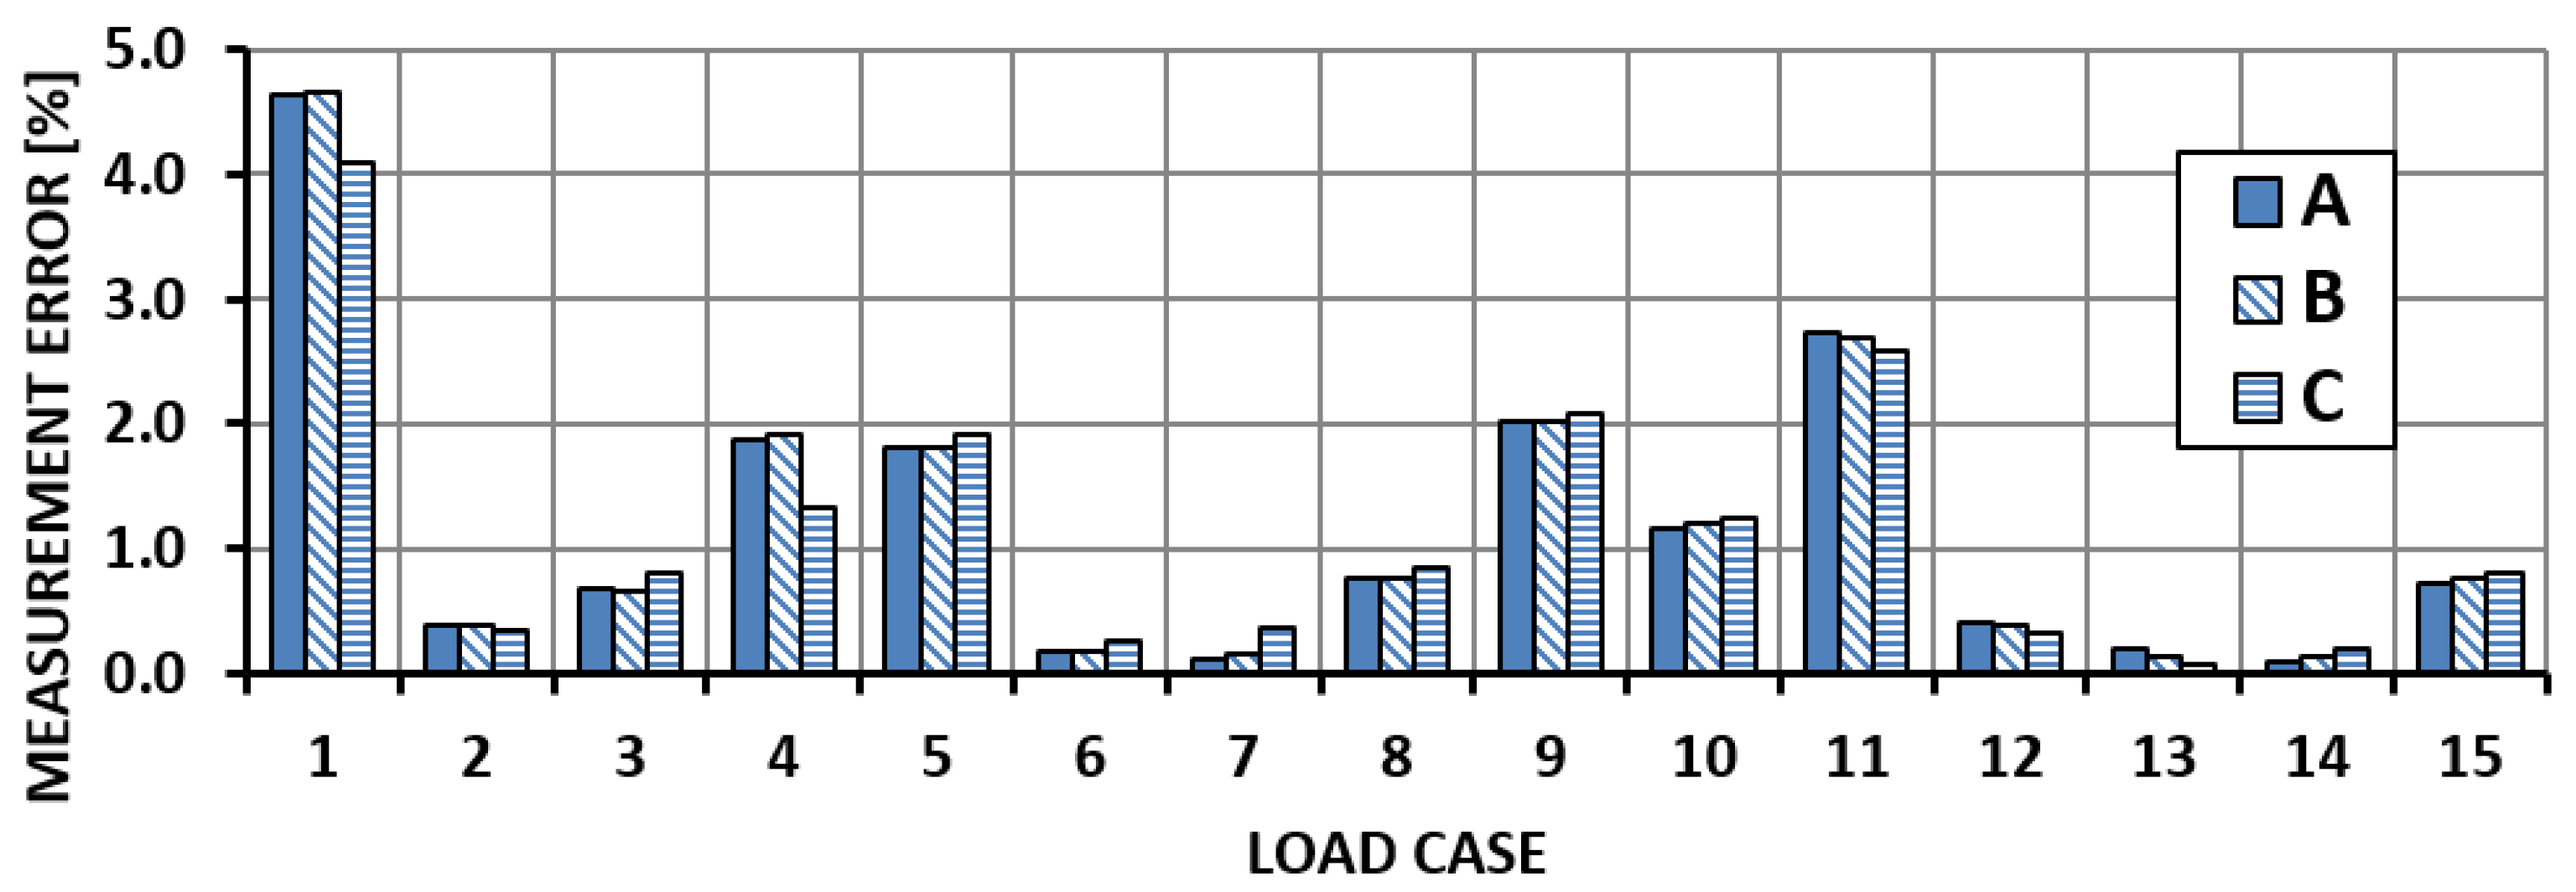
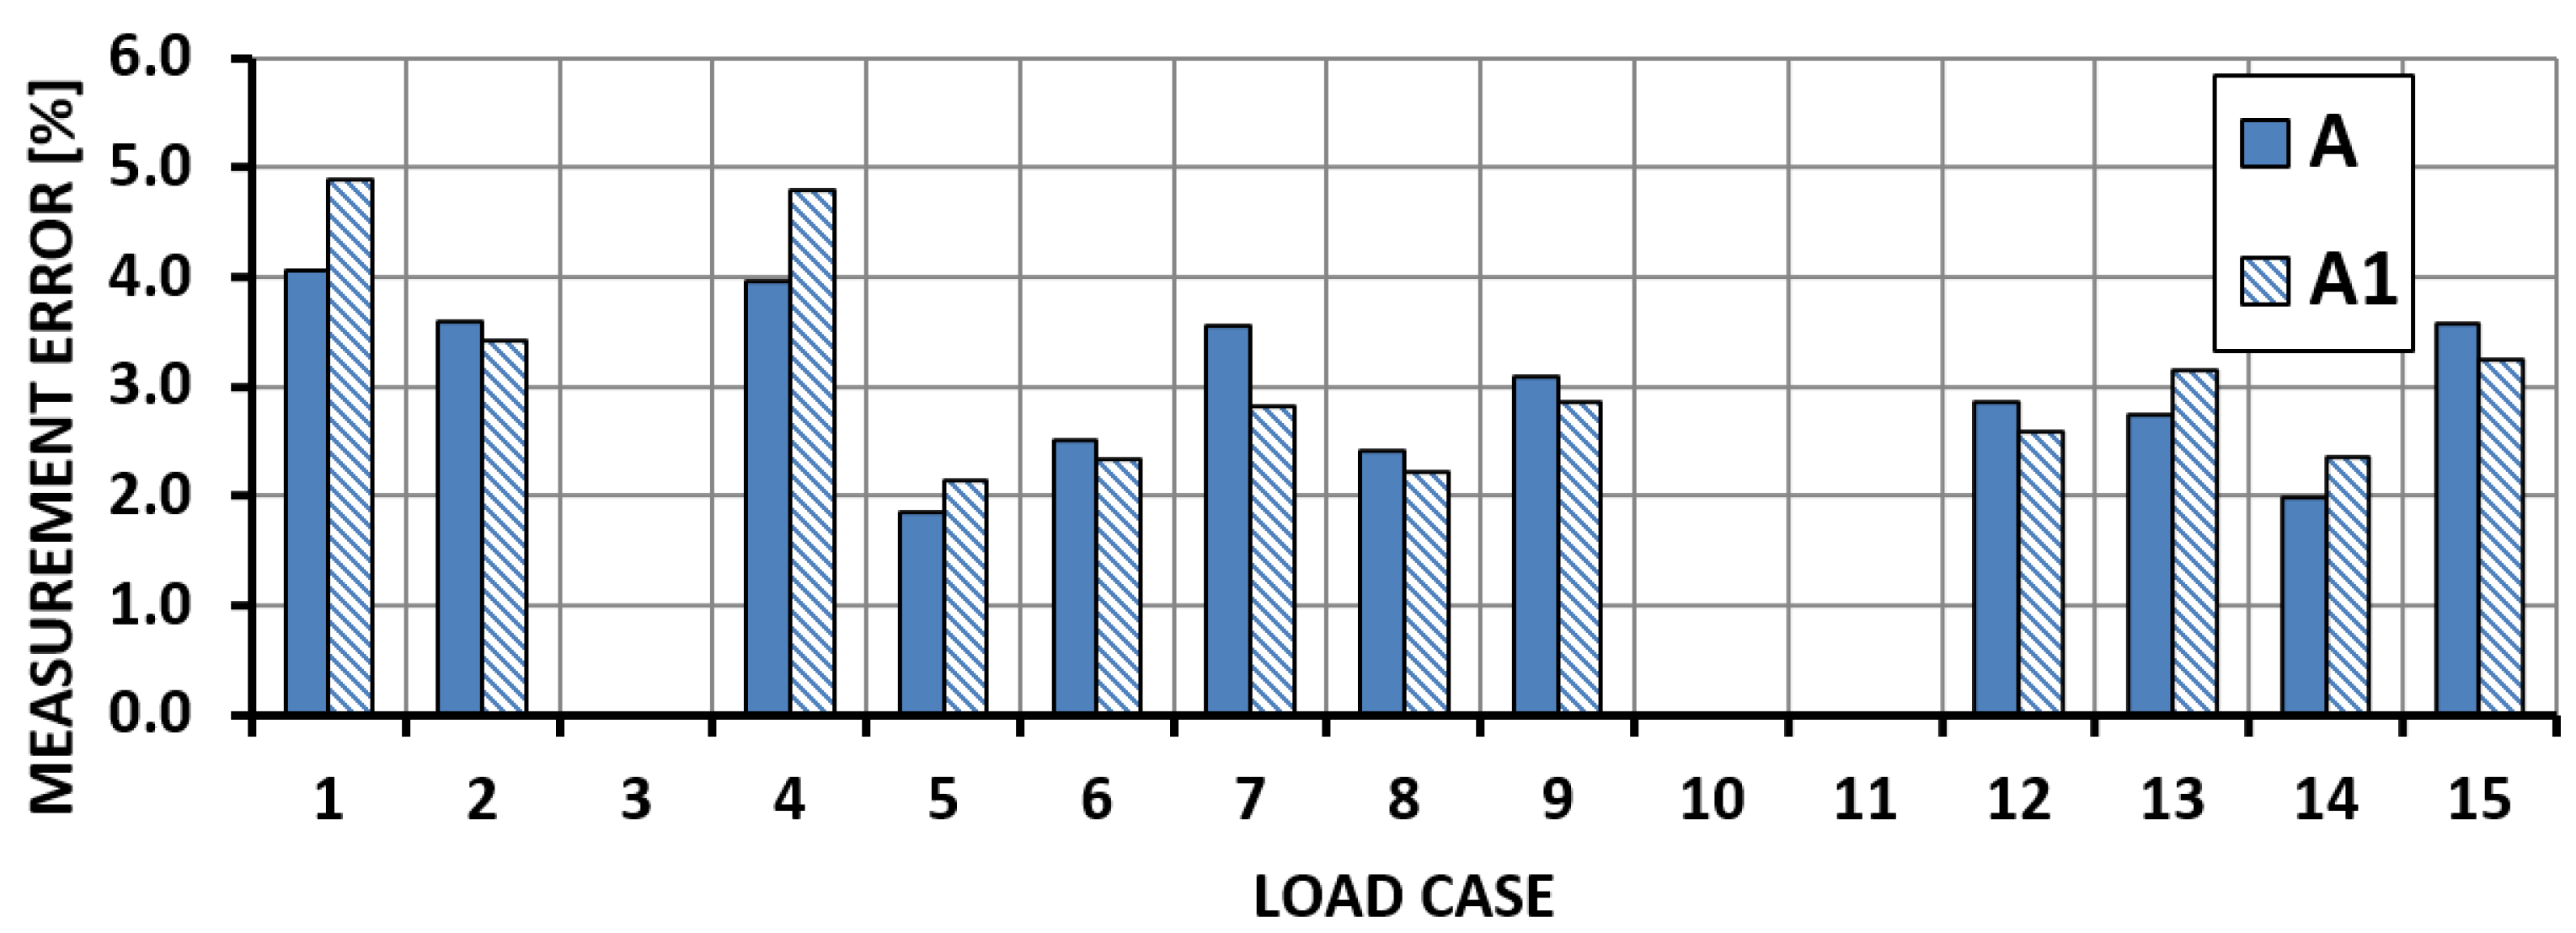
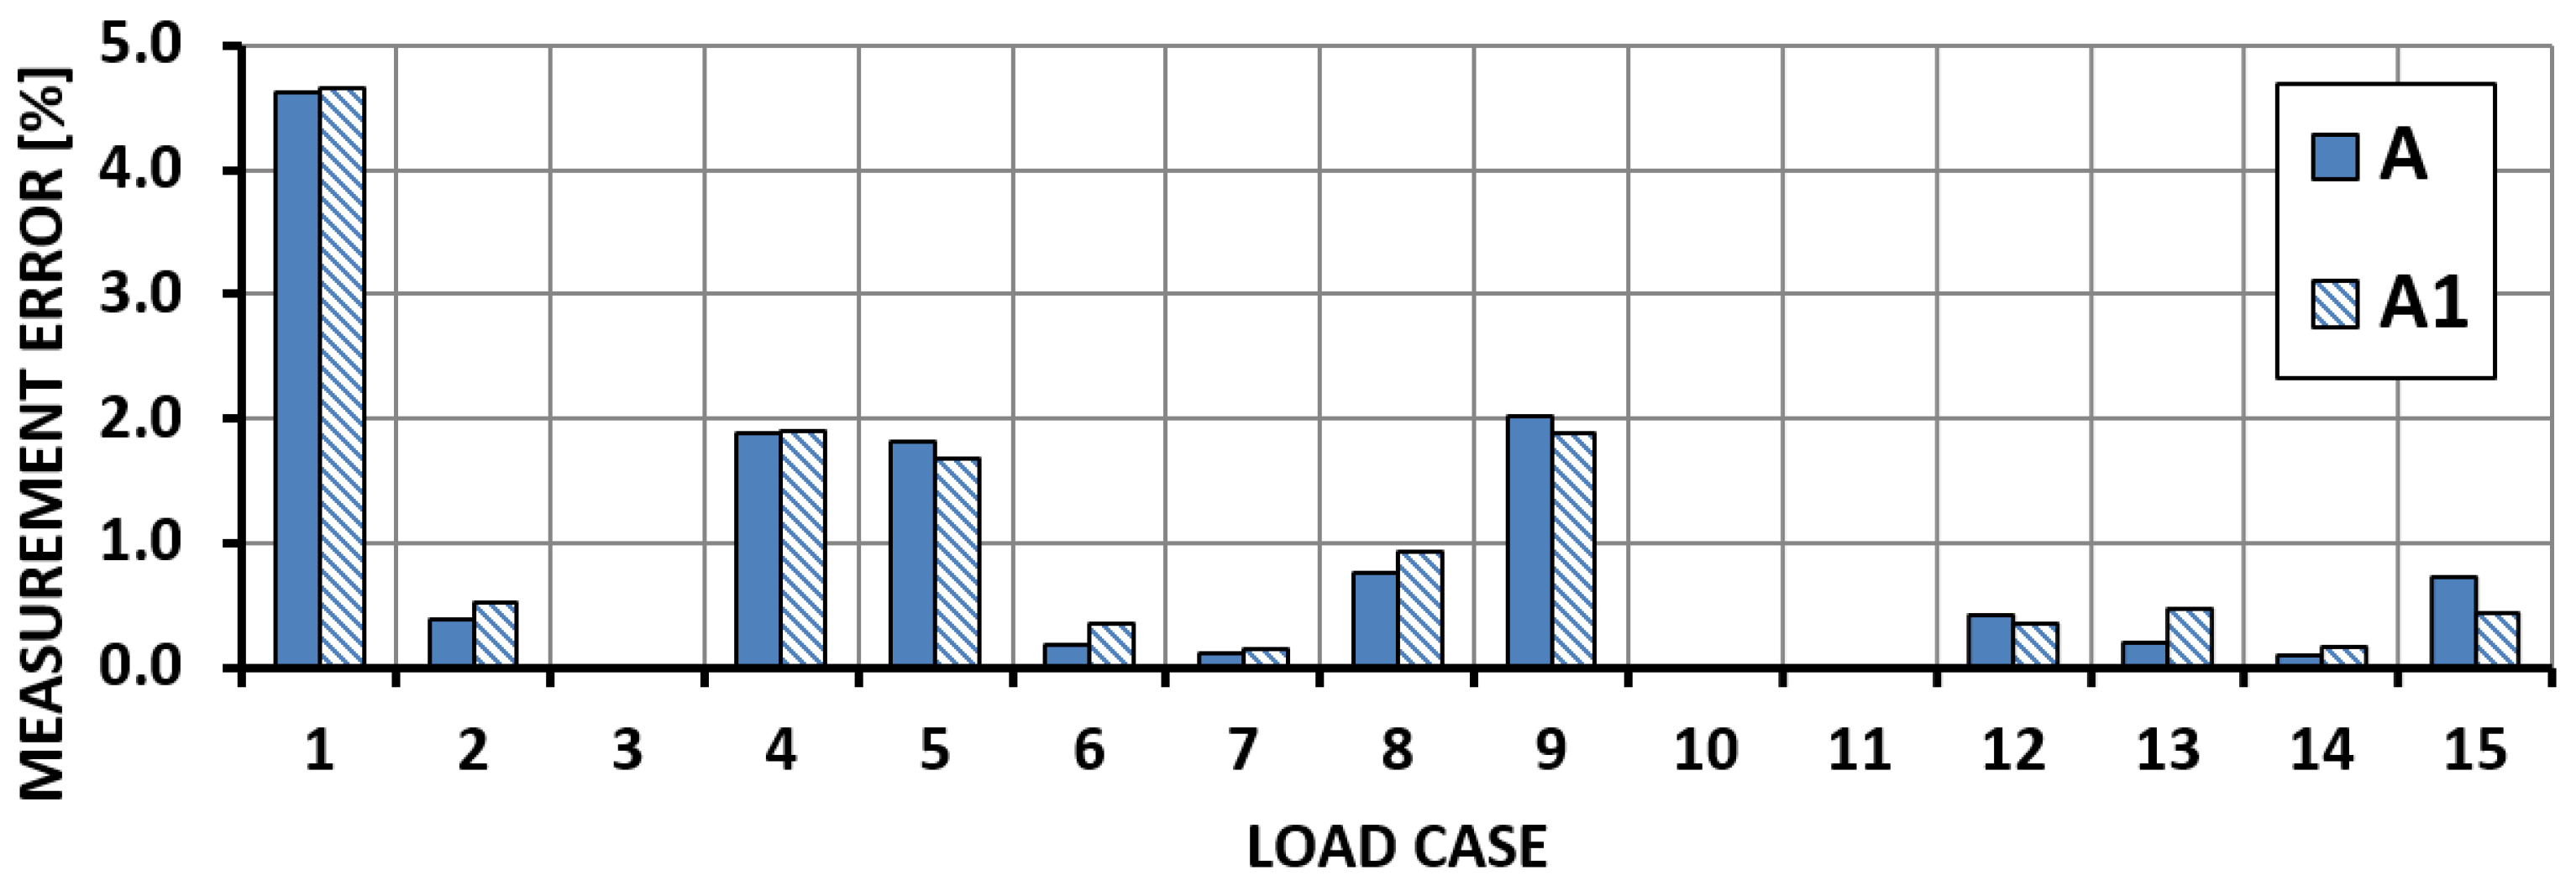
5.3. System Calibration for BRAGG FIBRE STRAIN GAUGES (OPT Section)
6. Summary and Conclusions
Funding
Conflicts of Interest
References
- Schrenk, O. A Simple Approximation Method for Obtaining the Spanwise Lift Distribution. J. R. Aeronaut. Soc. 1941, 45, 331–336. [Google Scholar] [CrossRef] [Green Version]
- Aoki, Y.; Ishikawa, T.; Takeda, S.-I.; Hayakawa, Y.; Harada, A.; Kikukawa, H. Fatigue test of lightweight composite wing structure. Int. J. Fatigue 2006, 28, 1109–1115. [Google Scholar] [CrossRef]
- Baraniecki, R.; Kaniewska, M.; Leski, A. Fatigue Life Assessment of Selected Structural Elements of MI-24 Helicopter. Fatigue Aircr. Struct. 2010, 2010, 5–13. [Google Scholar] [CrossRef] [Green Version]
- Diamanti, K.; Soutis, C. Structural health monitoring techniques for aircraft composite structures. Prog. Aerosp. Sci. 2010, 46, 342–352. [Google Scholar] [CrossRef]
- Reymer, P. Validation of the FEM model of the Mi-24 tail boom and vertical stabilizer. J. KONES Powertrain Transp. 2011, 18. [Google Scholar]
- Takeda, S.-I.; Aoki, Y.; Ishikawa, T.; Takeda, N.; Kikukawa, H. Structural health monitoring of composite wing structure during durability test. Compos. Struct. 2007, 79, 133–139. [Google Scholar] [CrossRef]
- Brzoska, Z. Statyka i Stateczność Konstrukcji Prętowych i Cienkościennych; PWN: Warsaw, Poland, 1965. [Google Scholar]
- Megson, T.H.G. Introduction to Aircraft Structural Analysis, 2nd ed.; Butterworth-Heinemann: Oxford, UK, 2014. [Google Scholar]
- Skopinski, T.; Aiken, W.; Huston, W. Calibration of Strain-Gauge Installation in Aircraft Structures for the Measurements of Flight Loads; NACA Technical Note 2993; NACA: Washington, DC, USA, 1953. [Google Scholar]
- Eckstorm, C. Flight Loads Measurements Obtained from Calibrated Strain-Gage Bridges Mounted Externally on Skin of Low-Aspect-Ratio Wing; NASA TN D-8349; NASA: Washington, DC, USA, 1976. [Google Scholar]
- Hovell, P.; Webber, D.; Roberts, T. The use of Calibrated Strain Gauges for Flight Load Determination; Aeronautical Research Council Technical Report 1041; NASA: Washington, DC, USA, 1969. [Google Scholar]
- Jenkins, J.; DeAngelis, V. A Summary of Numerous Strain-Gauge Load Calibrations on Aircraft Wings and Tails in a Technology Format; NASA Technical Memorandum 4804; NASA: Washington, DC, USA, 1997. [Google Scholar]
- Lokos, W.; Stauf, R. Strain-Gage Calibration Parametric Study; NASA TM 212853; NASA: Washington, DC, USA, 2004. [Google Scholar]
- Monaghan, R.; Fields, R. Experiments to Study Strain-Gage Load Calibrations on Wing Structure at Elevated Temperatures; NASA TN D-7390; NASA: Washington, DC, USA, 1973. [Google Scholar]
- Bao, P.; Yuan, M.; Dong, S.; Song, H.; Xue, J. Fiber Bragg grating sensor fatigue crack real-time monitoring based on spectrum cross-correlation analysis. J. Sound Vib. 2013, 332, 43–57. [Google Scholar] [CrossRef]
- Grouve, W.; Warnet, L.; de Boer, A.; Akkerman, R.; Vlekken, J. Delamination detection with fibre Bragg gratings based on dynamic behavior. Compos. Sci. Technol. 2008, 68, 2418–2424. [Google Scholar] [CrossRef]
- Takeda, N.; Okabe, Y.; Kuwahara, J.; Kojima, S.; Ogisu, T. Development of smart composite structures with small-diameter fiber Bragg grating sensors for damage detection: Quantitative evaluation of delamination length in CFRP laminates using Lamb wave sensing. Compos. Sci. Technol. 2005, 65, 2575–2587. [Google Scholar] [CrossRef]
- Mulle, M.; Zitoune, R.; Collombet, F.; Robert, L.; Grunevald, Y.-H. Embedded FBGs and 3-D DIC for the stress analysis of a structural specimen subjected to bending. Compos. Struct. 2009, 91, 48–55. [Google Scholar] [CrossRef]
- Rao, Y. Recent progress in applications of in-fibre Bragg grating sensors. Opt. Lasers Eng. 1999, 31, 297–324. [Google Scholar] [CrossRef]
- Antonucci, V.; Esposito, M.; Ricciardi, M.; Giordano, M.; Zarrelli, M. Strain monitoring of composite elements by fibre Bragg grating sensors during a quasi-static indentation. Compos. Part B Eng. 2014, 56, 34–41. [Google Scholar] [CrossRef]
- Minakuchi, S.; Takeda, N.; Takeda, S.-I.; Nagao, Y.; Franceschetti, A.; Liu, X. Life cycle monitoring of large-scale CFRP VARTM structure by fiber-optic-based distributed sensing. Compos. Part A Appl. Sci. Manuf. 2011, 42, 669–676. [Google Scholar] [CrossRef]
- Papantoniou, A.; Rigas, G.; Alexopoulos, N.D.; Rigas, G.-P. Assessment of the strain monitoring reliability of fiber Bragg grating sensor (FBGs) in advanced composite structures. Compos. Struct. 2011, 93, 2163–2172. [Google Scholar] [CrossRef]
- Iadicicco, A.; Natale, D.; Di Palma, P.; Spinaci, F.; Apicella, A.; Campopiano, S. Strain Monitoring of a Composite Drag Strut in Aircraft Landing Gear by Fiber Bragg Grating Sensors. Sensors 2019, 19, 2239. [Google Scholar] [CrossRef] [PubMed] [Green Version]
- Orkisz, M.; Święch, Ł.; Zacharzewski, J. Fatigue tests of motor glider wing’s composite spar. Maint. Reliab. 2012, 14, 228–232. [Google Scholar]
- Ramly, R.; Kuntjoro, W.; Rahman, M.K.A. Using Embedded Fiber Bragg Grating (FBG) Sensors in Smart Aircraft Structure Materials. Procedia Eng. 2012, 41, 600–606. [Google Scholar] [CrossRef] [Green Version]
- Tserpes, K.I.; Karachalios, V.; Giannopoulos, I.; Prentzias, V.; Ruzek, R. Strain and damage monitoring in CFRP fuselage panels using fiber Bragg grating sensors. Part I: Design, manufacturing and impact testing, Compos. Struct. 2014, 107, 726–736. [Google Scholar]
- Růžek, R.; Kudrna, P.; Kadlec, M.; Karachalios, V.; Tserpes, K. Strain and damage monitoring in CFRP fuselage panels using fiber Bragg grating sensors. Part II: Mechanical testing and validation. Compos. Struct. 2014, 107, 737–744. [Google Scholar] [CrossRef]
- Ryu, C.; Lee, J.; Kim, C.; Hong, C. Buckling behaviour monitoring of composite wing box using multiplexed and multi-channeled built-in fiber Bragg grating strain sensor. NDT&E Int. 2008, 41, 534–543. [Google Scholar]
- Ma, Z.; Chen, X. Fiber Bragg Gratings Sensors for Aircraft Wing Shape Measurement: Recent Applications and Technical Analysis. Sensors 2018, 19, 55. [Google Scholar] [CrossRef] [PubMed] [Green Version]
- Nicolas, M.; Sullivan, R.W.; Richards, W.L. Large Scale Applications Using FBG Sensors: Determination of In-Flight Loads and Shape of a Composite Aircraft Wing. Aerospace 2016, 3, 18. [Google Scholar] [CrossRef] [Green Version]


| SECTION III | SECTION II | OPT SECTION | |||||
|---|---|---|---|---|---|---|---|
| Load Case | V | M | T | M | T | M | T |
| [N] | [Nm] | [Nm] | [Nm] | [Nm] | [Nm] | [Nm] | |
| 1 | 1.0 V | 1.0 M | 0.0 | 0.5 M | 0.0 | 0.8 M | 0.0 |
| 2 | 1.0 V | 1.4 M | 0.0 | 1.0 M | 0.0 | 1.2 M | 0.0 |
| 3 | 1.0 V | 1.8 M | 0.0 | 1.3 M | 0.0 | 1.6 M | 0.0 |
| 4 | 1.6 V | 1.6 M | 0.0 | 0.8 M | 0.0 | 1.2 M | 0.0 |
| 5 | 1.6 V | 2.2 M | 0.0 | 1.5 M | 0.0 | 1.9 M | 0.0 |
| 6 | 1.6 V | 2.8 M | 0.0 | 2.1 M | 0.0 | 2.5 M | 0.0 |
| 7 | 2.2 V | 2.2 M | 0.0 | 1.1 M | 0.0 | 1.7 M | 0.0 |
| 8 | 2.2 V | 3.8 M | 0.0 | 2.8 M | 0.0 | 3.4 M | 0.0 |
| 9 | 2.2 V | 3.1 M | 0.0 | 2.0 M | 0.0 | 2.6 M | 0.0 |
| 10 | 1.0 V | 1.8 M | 0.2 M | 1.3 M | 0.2 M | 1.6 M | 0.2 M |
| 11 | 1.0 V | 1.4 M | −0.2 M | 1.0 M | −0.2 M | 1.2 M | −0.2 M |
| 12 | 1.6 V | 2.8 M | 0.4 M | 2.1 M | 0.4 M | 2.5 M | 0.4 M |
| 13 | 1.6 V | 2.2 M | −0.4 M | 1.5 M | −0.4 M | 1.9 M | −0.4 M |
| 14 | 2.2 V | 3.8 M | 0.5 M | 2.8 M | 0.5 M | 3.4 M | 0.5 M |
| 15 | 2.2 V | 3.1 M | −0.5 M | 2.0 M | −0.5 M | 2.6 M | −0.5 M |
| SECTION III | SECTION II | |||
|---|---|---|---|---|
| Load Case | A | C | A | C |
| [%] | [%] | [%] | [%] | |
| 10 | 9 | 16 | 3 | 109 |
| 11 | 9 | 73 | 6 | 52 |
| 12 | 3 | 13 | 2 | 109 |
| 13 | 2 | 77 | 3 | 53 |
| 14 | 3 | 12 | 2 | 109 |
| 15 | 0 | 78 | 4 | 54 |
| average | 4.33 | 44.83 | 3.33 | 81.00 |
© 2020 by the author. Licensee MDPI, Basel, Switzerland. This article is an open access article distributed under the terms and conditions of the Creative Commons Attribution (CC BY) license (http://creativecommons.org/licenses/by/4.0/).
Share and Cite
Święch, Ł. Calibration of a Load Measurement System for an Unmanned Aircraft Composite Wing Based on Fibre Bragg Gratings and Electrical Strain Gauges. Aerospace 2020, 7, 27. https://doi.org/10.3390/aerospace7030027
Święch Ł. Calibration of a Load Measurement System for an Unmanned Aircraft Composite Wing Based on Fibre Bragg Gratings and Electrical Strain Gauges. Aerospace. 2020; 7(3):27. https://doi.org/10.3390/aerospace7030027
Chicago/Turabian StyleŚwięch, Łukasz. 2020. "Calibration of a Load Measurement System for an Unmanned Aircraft Composite Wing Based on Fibre Bragg Gratings and Electrical Strain Gauges" Aerospace 7, no. 3: 27. https://doi.org/10.3390/aerospace7030027