1. Introduction
Increasing concentrations of Greenhouse gases in the atmosphere produced by human activities is the most significant driver of climate change [
1]. The impacts of climate change are expected to negatively affect water quantity and quality in most arid and semi-arid areas [
1]. Furthermore, low agricultural productivity throughout the tropics and subtropics is expected, accompanied by damage to ecosystems and biodiversity in these areas. The Abu Dhabi State of Environment Report 2017 highlighted key vulnerabilities associated with climate change, principally sea-level rise coastal flooding; increased salinity of coastal aquifers; impacts on the marine environment; heat stress; built environment impacts; more extreme weather events (floods, droughts, etc.); increased risk of dust storms; and risk from airborne contaminants (e.g., pesticides) [
2].
Carbon dioxide and methane are the two most prevalent greenhouse gases. While methane does not last in the atmosphere as long as carbon dioxide, it is approximately 21-times more heat-absorptive than carbon dioxide per unit of weight [
3]. This property makes methane 84-times more potent than carbon dioxide in the first twenty years following its release. Hence, both emissions (methane and carbon dioxide) have to be addressed and monitored in order to effectively reduce the impact of climate change.
Several algal bloom occurrences took place recently in the Arabian Gulf. Such Algal blooms can have a significant detrimental effect on the economy in the UAE. In addition, the Arabian Gulf hosts some of the largest desalination plants in the world, and most of them are located along the UAE coastline [
1]. These desalination plants produce a significant percentage of the potable water consumed by UAE residents, and their desalination capacity is constantly increasing. Increased number of algal bloom occurrences in the UAE is threatening the optimal operation of these desalination plants, hence affecting water availability in the UAE. Effective monitoring and early sensing of algal blooms are required to manage the operations of the desalination plants efficiently. Algal blooms are also threatening the water quality in the coastal areas, thus becoming a health hazard. The algae produce toxins which (i) in small quantities make consumption of shellfish dangerous, and (ii) in large quantities decimate the fish population. Furthermore, other more common problems associated with harmful algal blooms include environmental damage, impact on tourism and commerce due to the repulsive green residue and its offensive odor [
4]. An efficient and early sensing system is required to facilitate a swift response [
1].
Algal bloom build-up is usually initiated from nutrient pollution, an overabundance of the essential plant nutrients nitrogen and phosphorus [
4]. Sources of these elements are typically point sources (such as wastewater treatment plant discharges), non-point sources (such as septic tanks and stormwater runoff, urban areas and residential areas), and from nutrient-enriched rainfall or dust storms, which frequently occur in the region [
4]. When the concentrations of nitrogen and phosphorus increase in a water body; the right combination of temperature, sunlight, and low flow can trigger an algal bloom [
1,
4]. While nitrogen and phosphorus occur naturally and are essential plant nutrients, an overabundance of these nutrients can cause significant imbalances in the water body’s ecology, and blooms are one symptom [
1,
4].
The current research aims to explore and study the performance of the sensing in the shortwave infrared (SWIR) region (1000–1650 nm) in combination with the RGB camera to predict possible algal boom occurrences through estimation of the concentration of nutrients in the coastal waters of the Arabian Gulf [
1]. Eventually, facilitating precautionary measures by the local authorities. Rather than using a single wavelength, the appropriate method for monitoring N content is by using spectral profiles to mitigate the effect of other mixtures. There are several indices defined for measuring nitrogen content in plants with a lot of success. However, not much work is identified to estimate nitrogen content in coastal waters. Nitrogen Indices are robust spectral transformations of two or more spectral bands, of which at least one is directly or indirectly related to Nitrogen content [
5]. One commonly used index is the Normalized Difference Nitrogen Index (NDNI), which is a log10 transformed reflectance Nitrogen Index (NI) that is based Nitrogen’s absorption feature at 1510 nm and a reference band at 1680 nm [
5].
Furthermore, the SWIR region can also be used to map through aerosols, especially dust efficiently. Visible imagers are frequently incapable of seeing through fog, haze, smoke, and dust, contract to the capabilities of the longer wavelengths of the short-wave infrared that are more capable of penetration in such conditions and hence provide better imaging quality. At the same time, longer wavelengths in the SWIR region (>2000 nm) can be used to detect dust and characterize mineralogical information. Apart from this, the SWIR bands have been used for accurate atmospheric correction of visible and very near-infrared bands of sensors such as MODIS [
6]. This experiment can also validate those measurements apart from providing complementary information to the information obtained from the camera on-board the proposed CubeSat and UAE satellites such as DubaiSat-1 [
7], DubaiSat-2 [
8], and KhalifaSat [
9] images.
The primary payload of MeznSat is the Argus 2000 SWIR spectrometer, which is a miniature, low-cost, space-certified spectrometer that operates in the near-infrared bands (1000 nm to 1650 nm) [
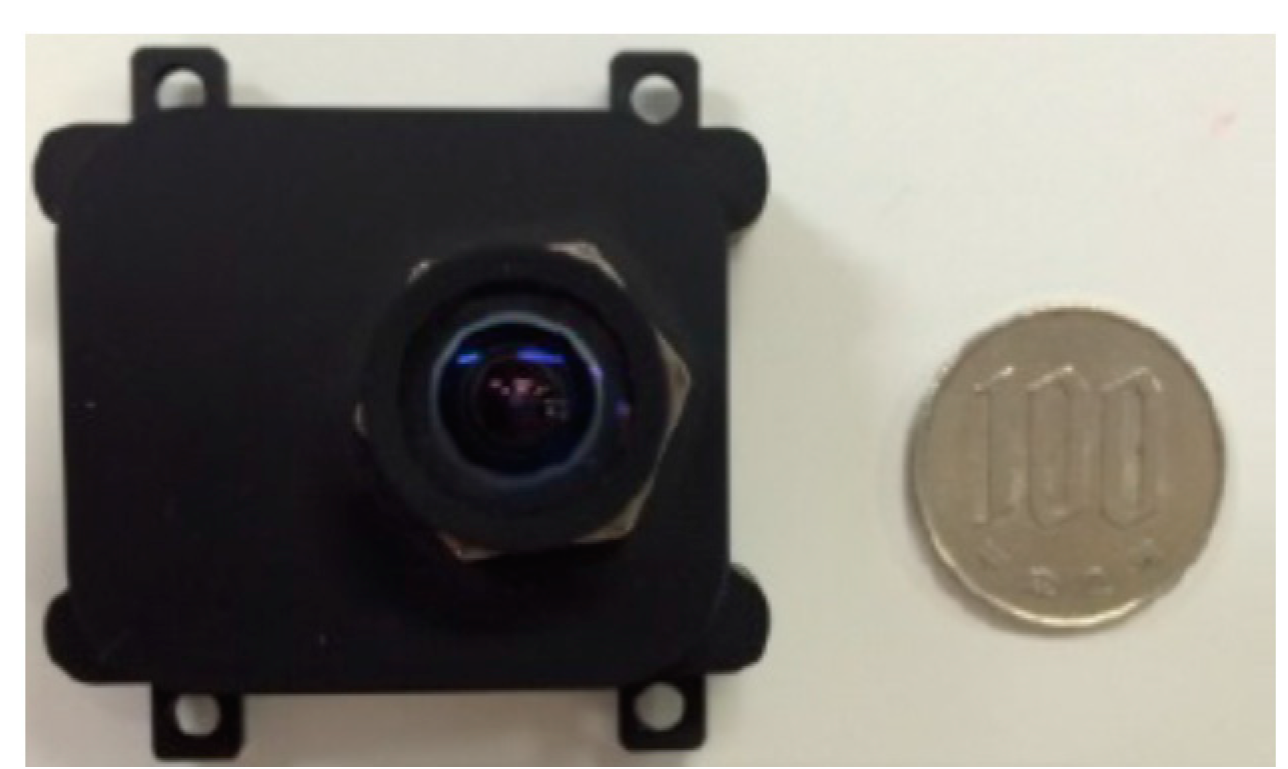
1]. MeznSat’s secondary payload is a High Definition camera that will allow post-processing to achieve the high geolocation accuracy required for the spectrometer. This setup of using visible and SWIR spectrometer together with a visible-optical imaging camera will generate an interesting dataset to explore atmospheric correction algorithms which employ SWIR data to process visible channels.
The MeznSat spacecraft bus design consists of an attitude determination and control system (ADCS), a power system, a Command and Data Handling (CDH) System, a communications system and the structure. The ADCS is required to achieve an accuracy of less than 1 degree due to the narrow Field of View (0.15 degrees) of the Argus 2000 spectrometer [
10]. The ADCS uses three reaction wheels and three magnetic torquers for control, and sun sensors, a horizon sensor and a star tracker for attitude determination. The CDH consists mainly of an On-Board Computer board with an ARM9 processor, 64 MB SDRAM and two SD cards for mass storage. The power system design includes 22 solar cells capable of producing 6.5 Watts of average power. The satellite’s communications system consists of a UHF transmitter for the downlink, a VHF receiver for the uplink and a set of deployable dipole antennas.
The most relevant CubeSat projects include the CANX-2 mission [
11] and the SathyambaSat mission [
12]. CANX-2 is a 3U CubeSat mission that was launched in 2006 and uses the same spectrometer but does not carry an RGB camera on-board. SathyambaSat is a 2U CubeSat that was launched in 2016. SathyambaSat uses the ARGUS 1000 spectrometer as its only payload, and it has a moderate ADCS system, which relies on magnetic actuation [
12]. While there are several similar missions reported in the literature, this is the first mission that uses Shortwave Infrared Spectrometer in combination with an RGB camera and a reactive attitude control system capable of less than 1-degree accuracy on a 3U form factor. The advantage of having the RGB Camera with the spectrometer is for geolocation.
In a previous paper, we provided an overview of the initial MeznSat design [
1]. In this paper, we present a detailed description of the final MeznSat mission concept, analysis, and design, including a comprehensive overview of the spacecraft bus. The launch of MeznSat is expected to take place in March 2020 into sun-synchronous orbit with an altitude of 550 Km.
Section 2 provides details on the mission concept, including orbital analysis, payloads used, and system-level design.
Section 3 describes the different subsystems of the satellite, while
Section 4 provides a summary of the mission analysis. The conclusions are provided in
Section 5.
3. System Design and Platform Subsystems
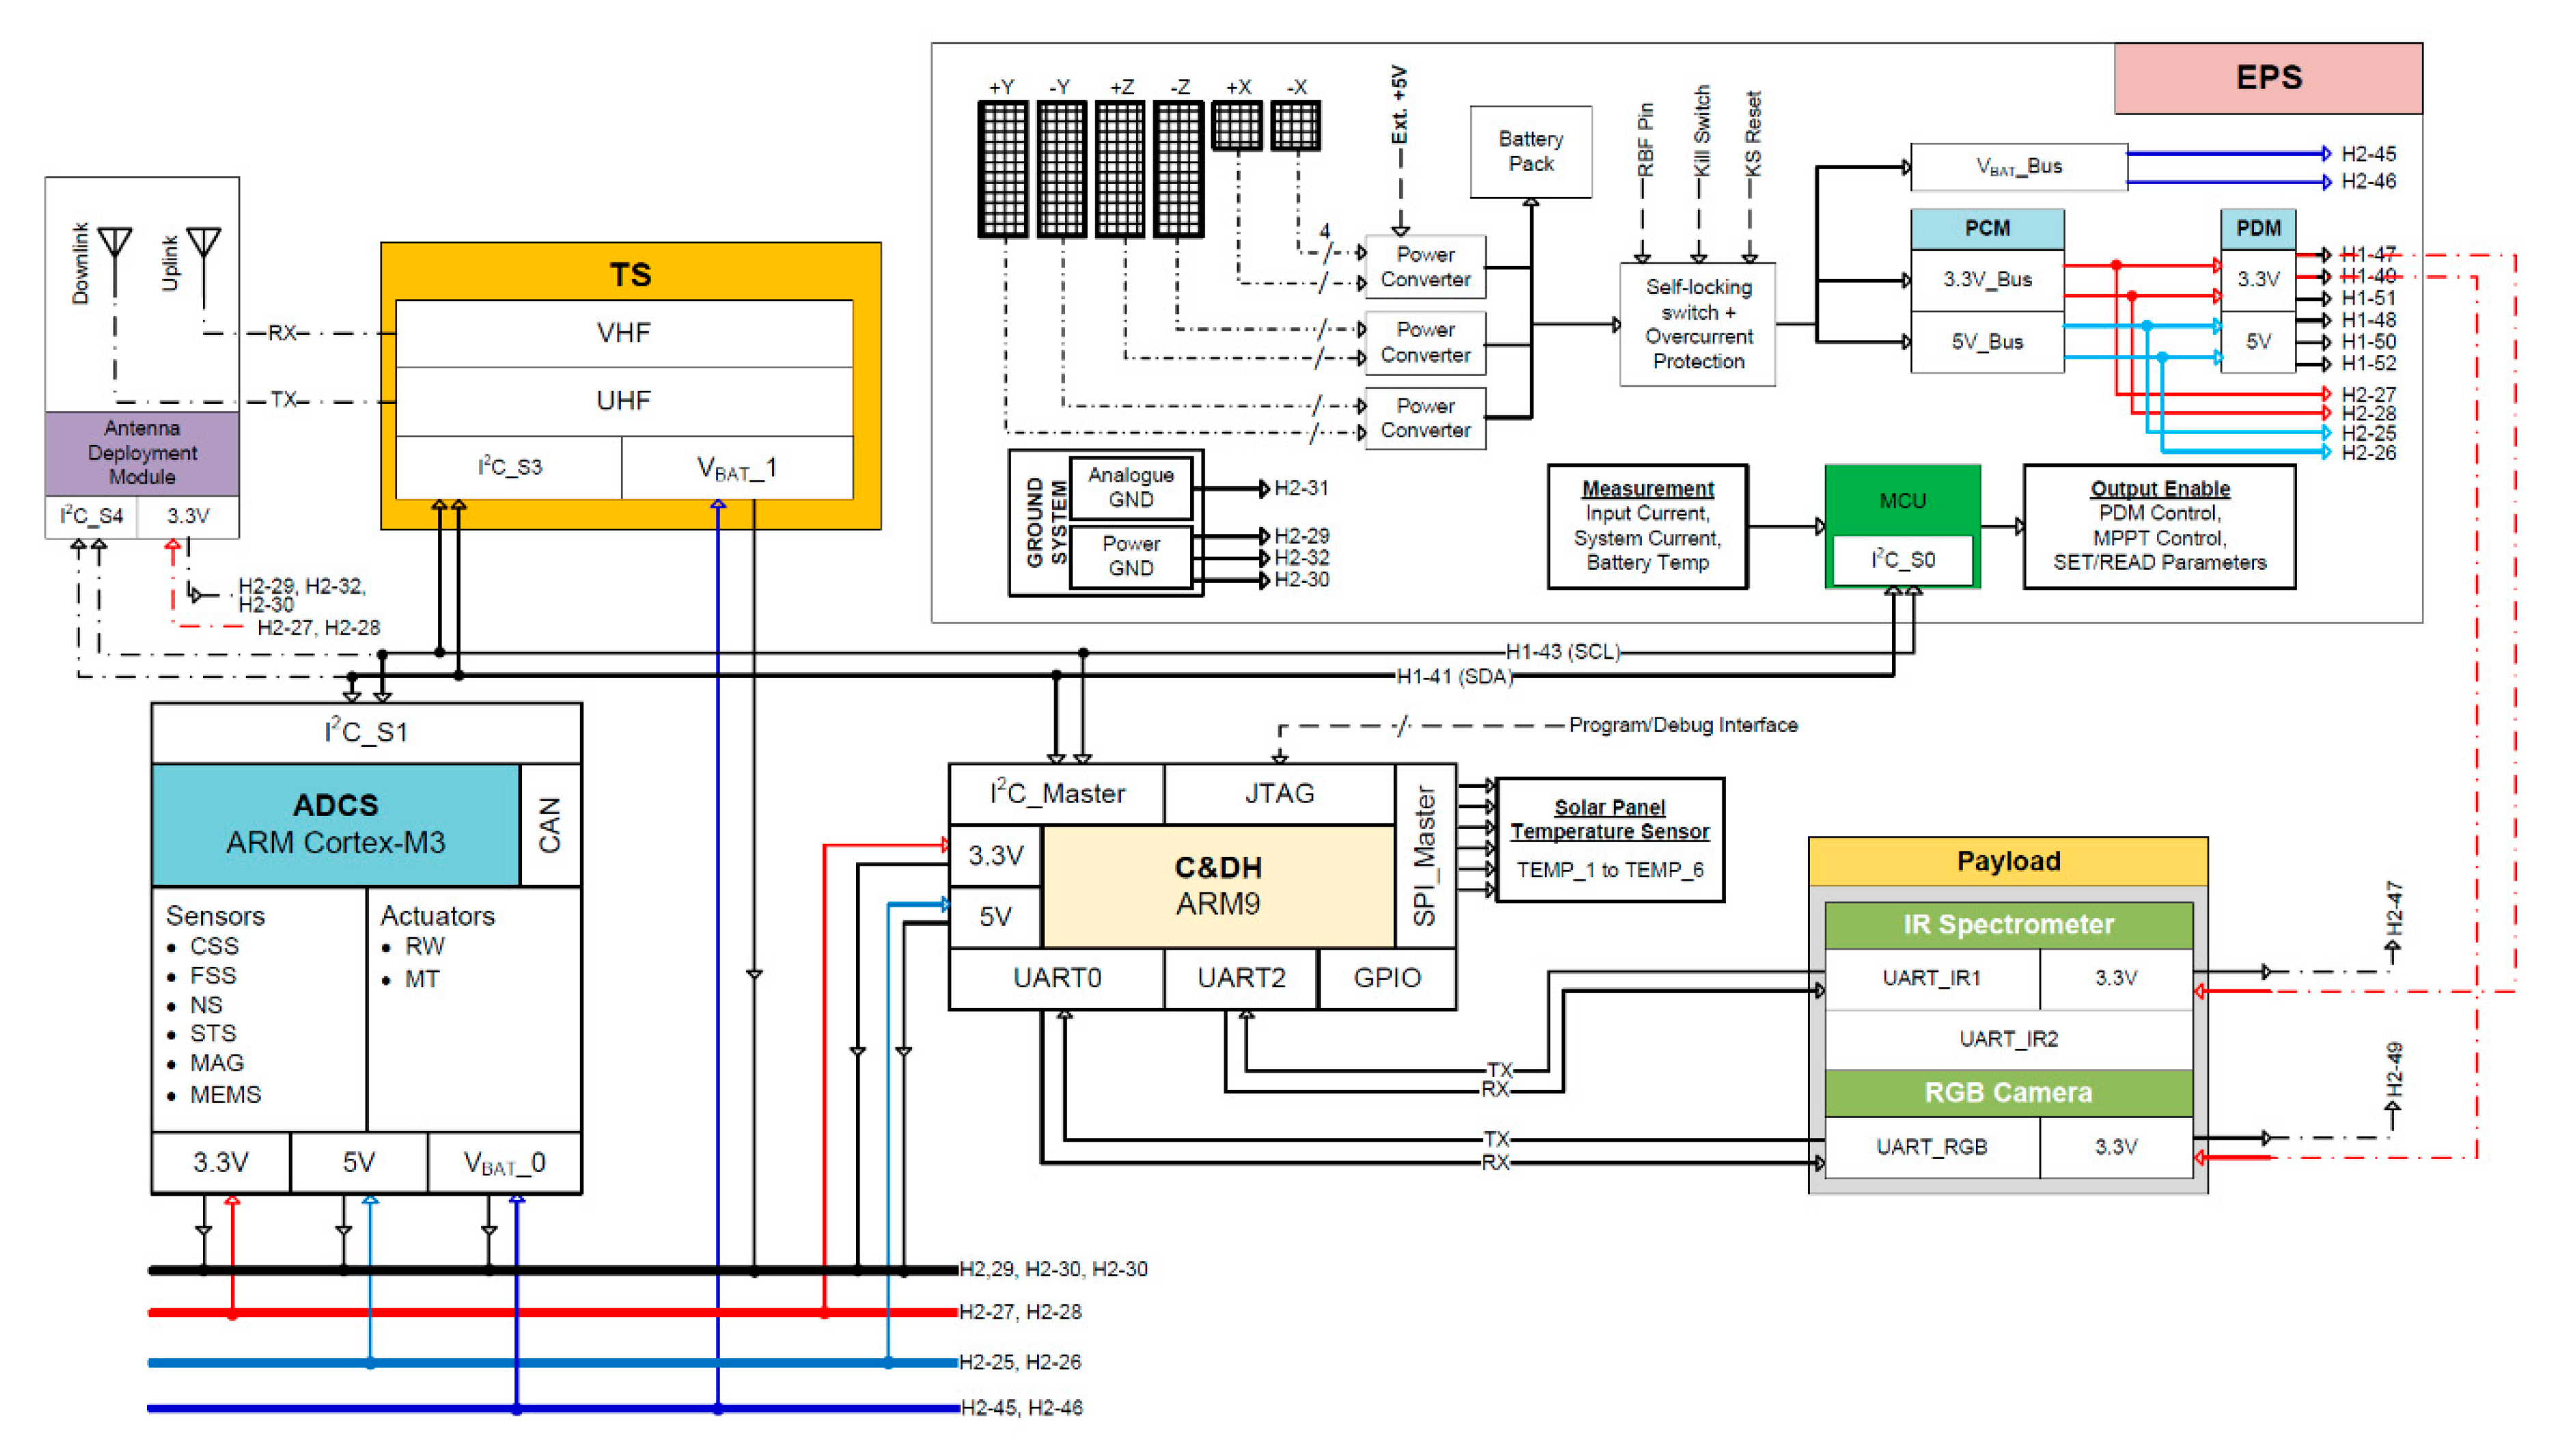
This section describes the system-level design of MeznSat and provides an overview of the subsystems used on-board. The spacecraft bus design includes five main subsystems that support the operation of the mission payloads. These are the Electrical Power Subsystem (EPS), the Attitude Determination and Control Subsystem (ADCS), the Command and Data Handling Subsystem (CDHS), the Telecommunications Subsystem (TS) and the mechanical subsystem. The overall system-level block diagram of MeznSat is shown in
Figure 5.
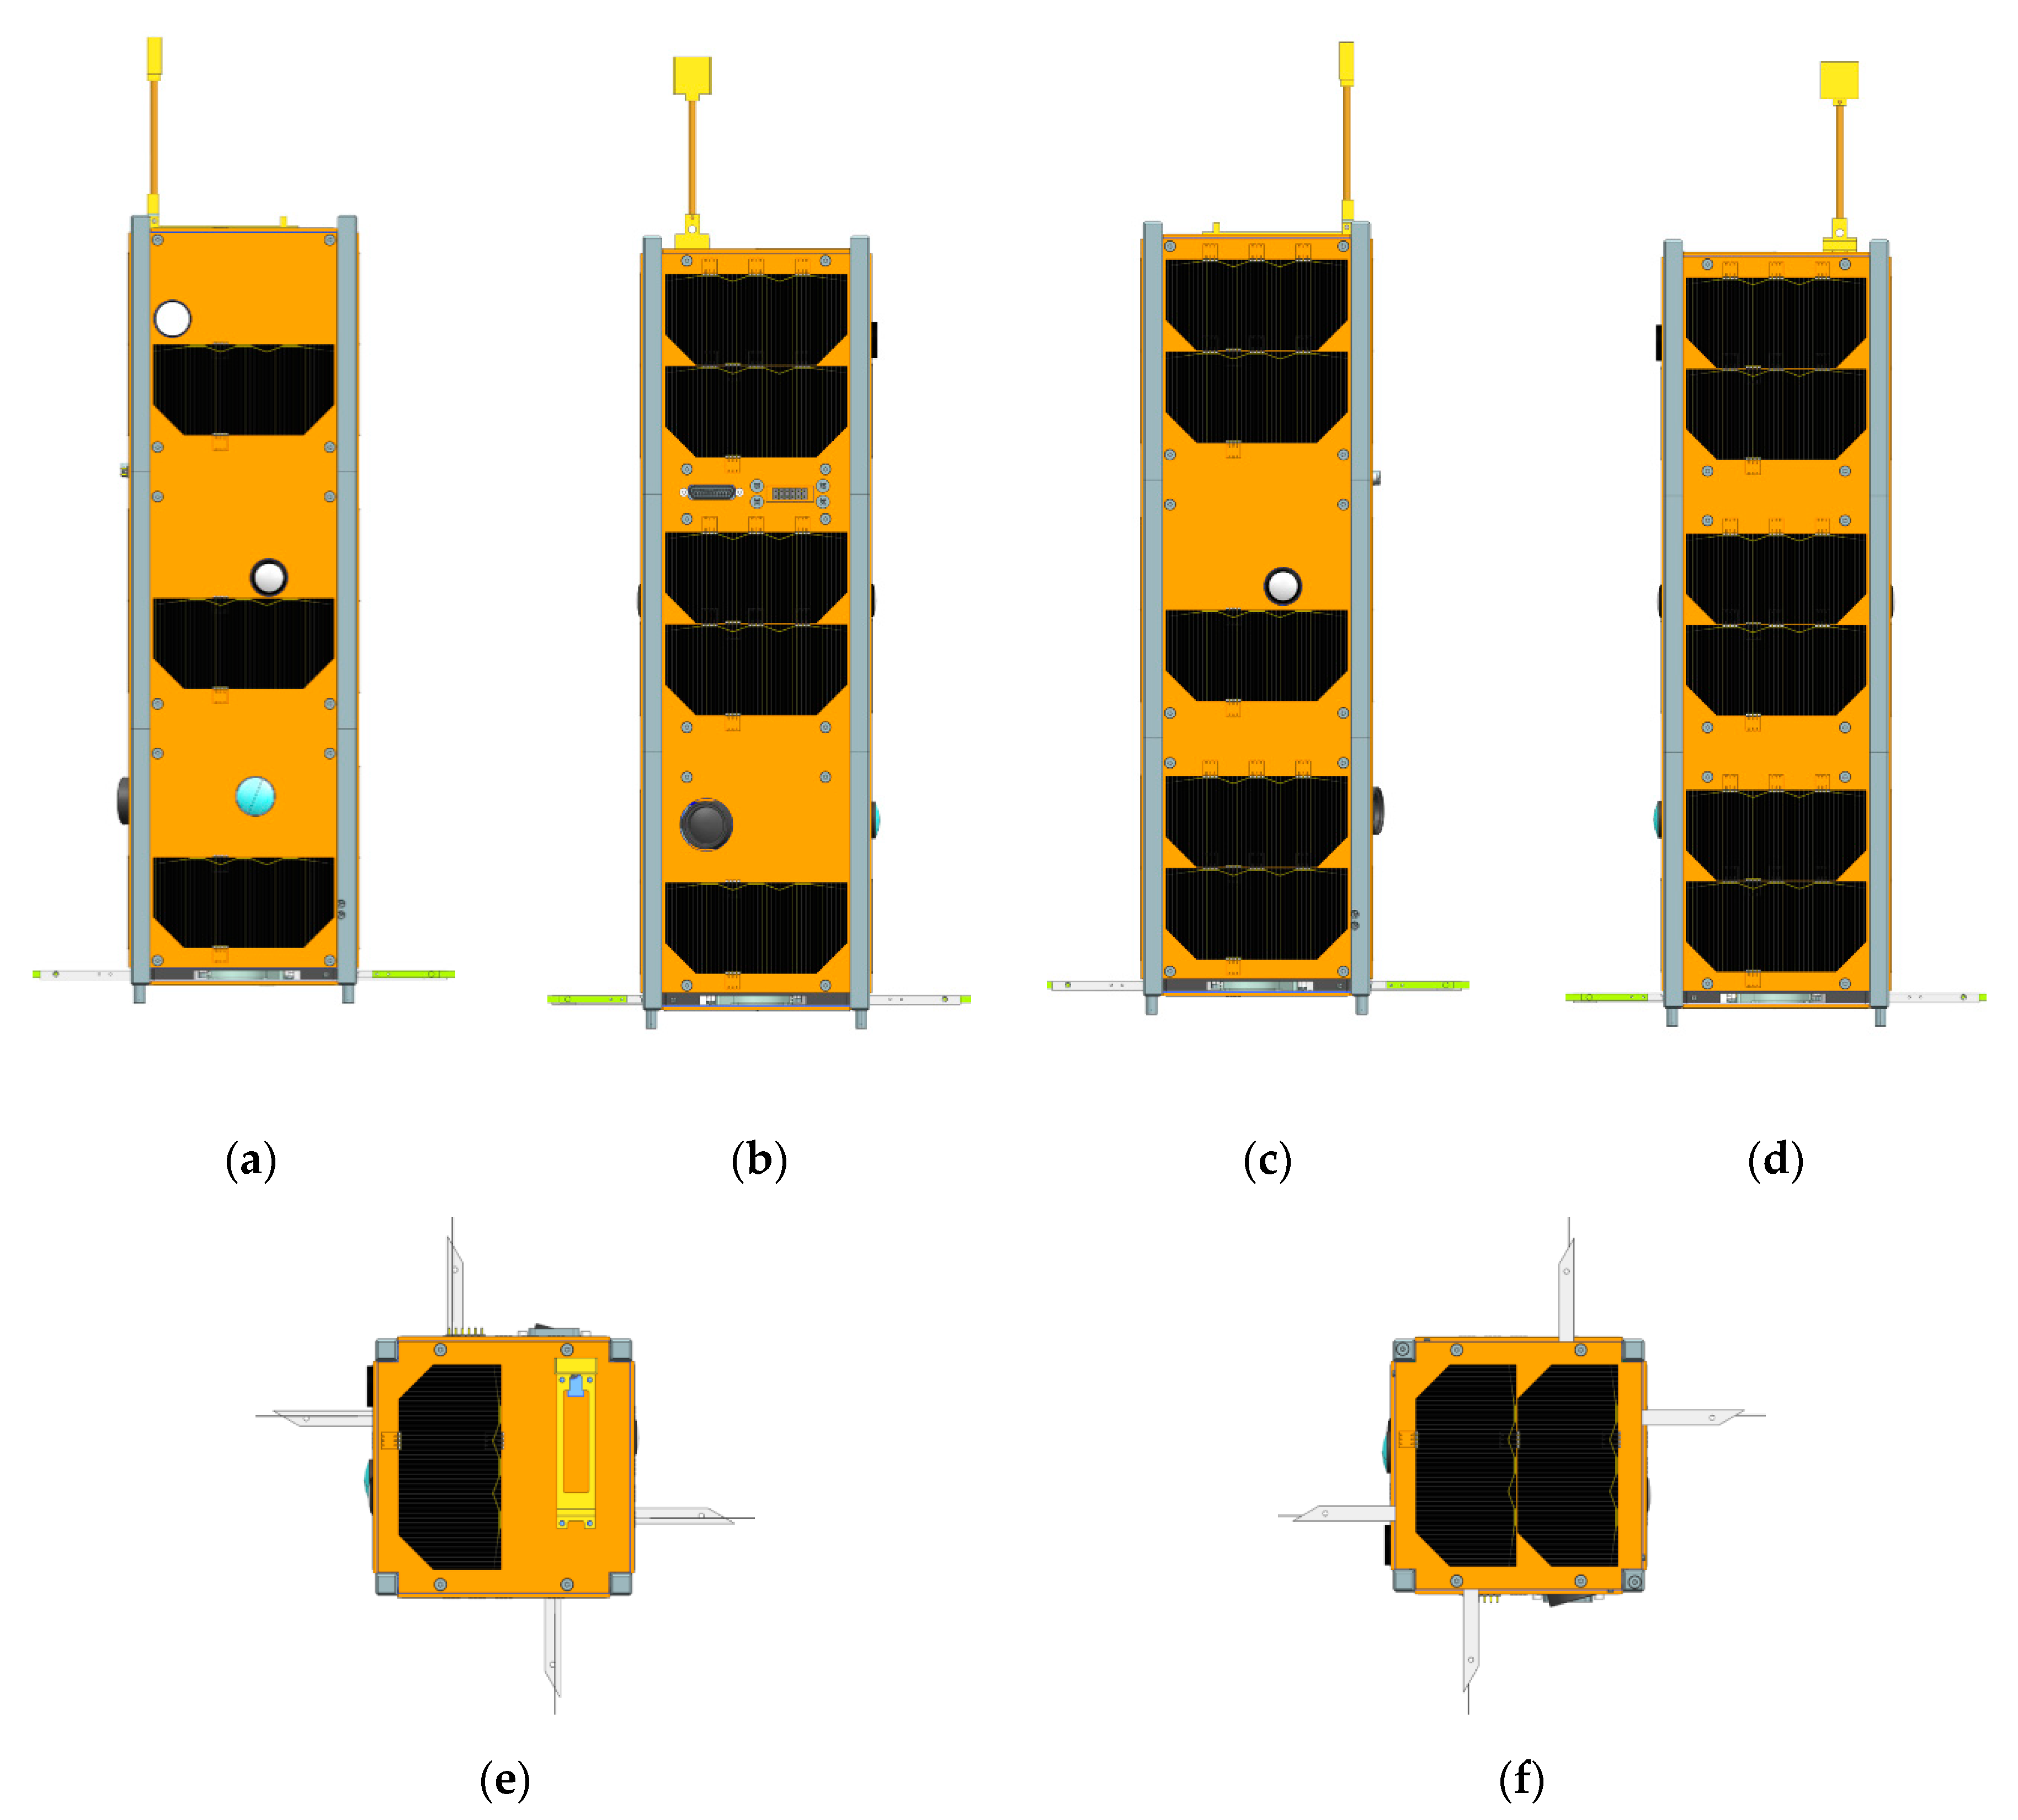
3.1. Mechanical Structure
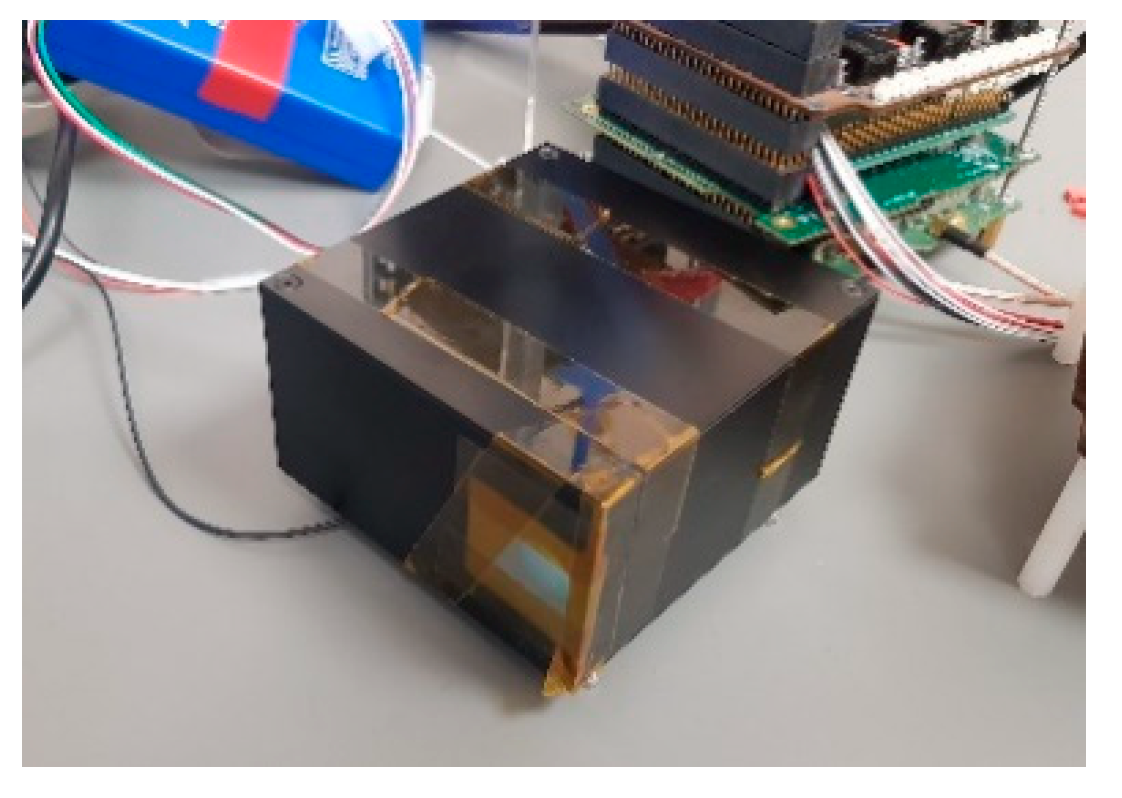
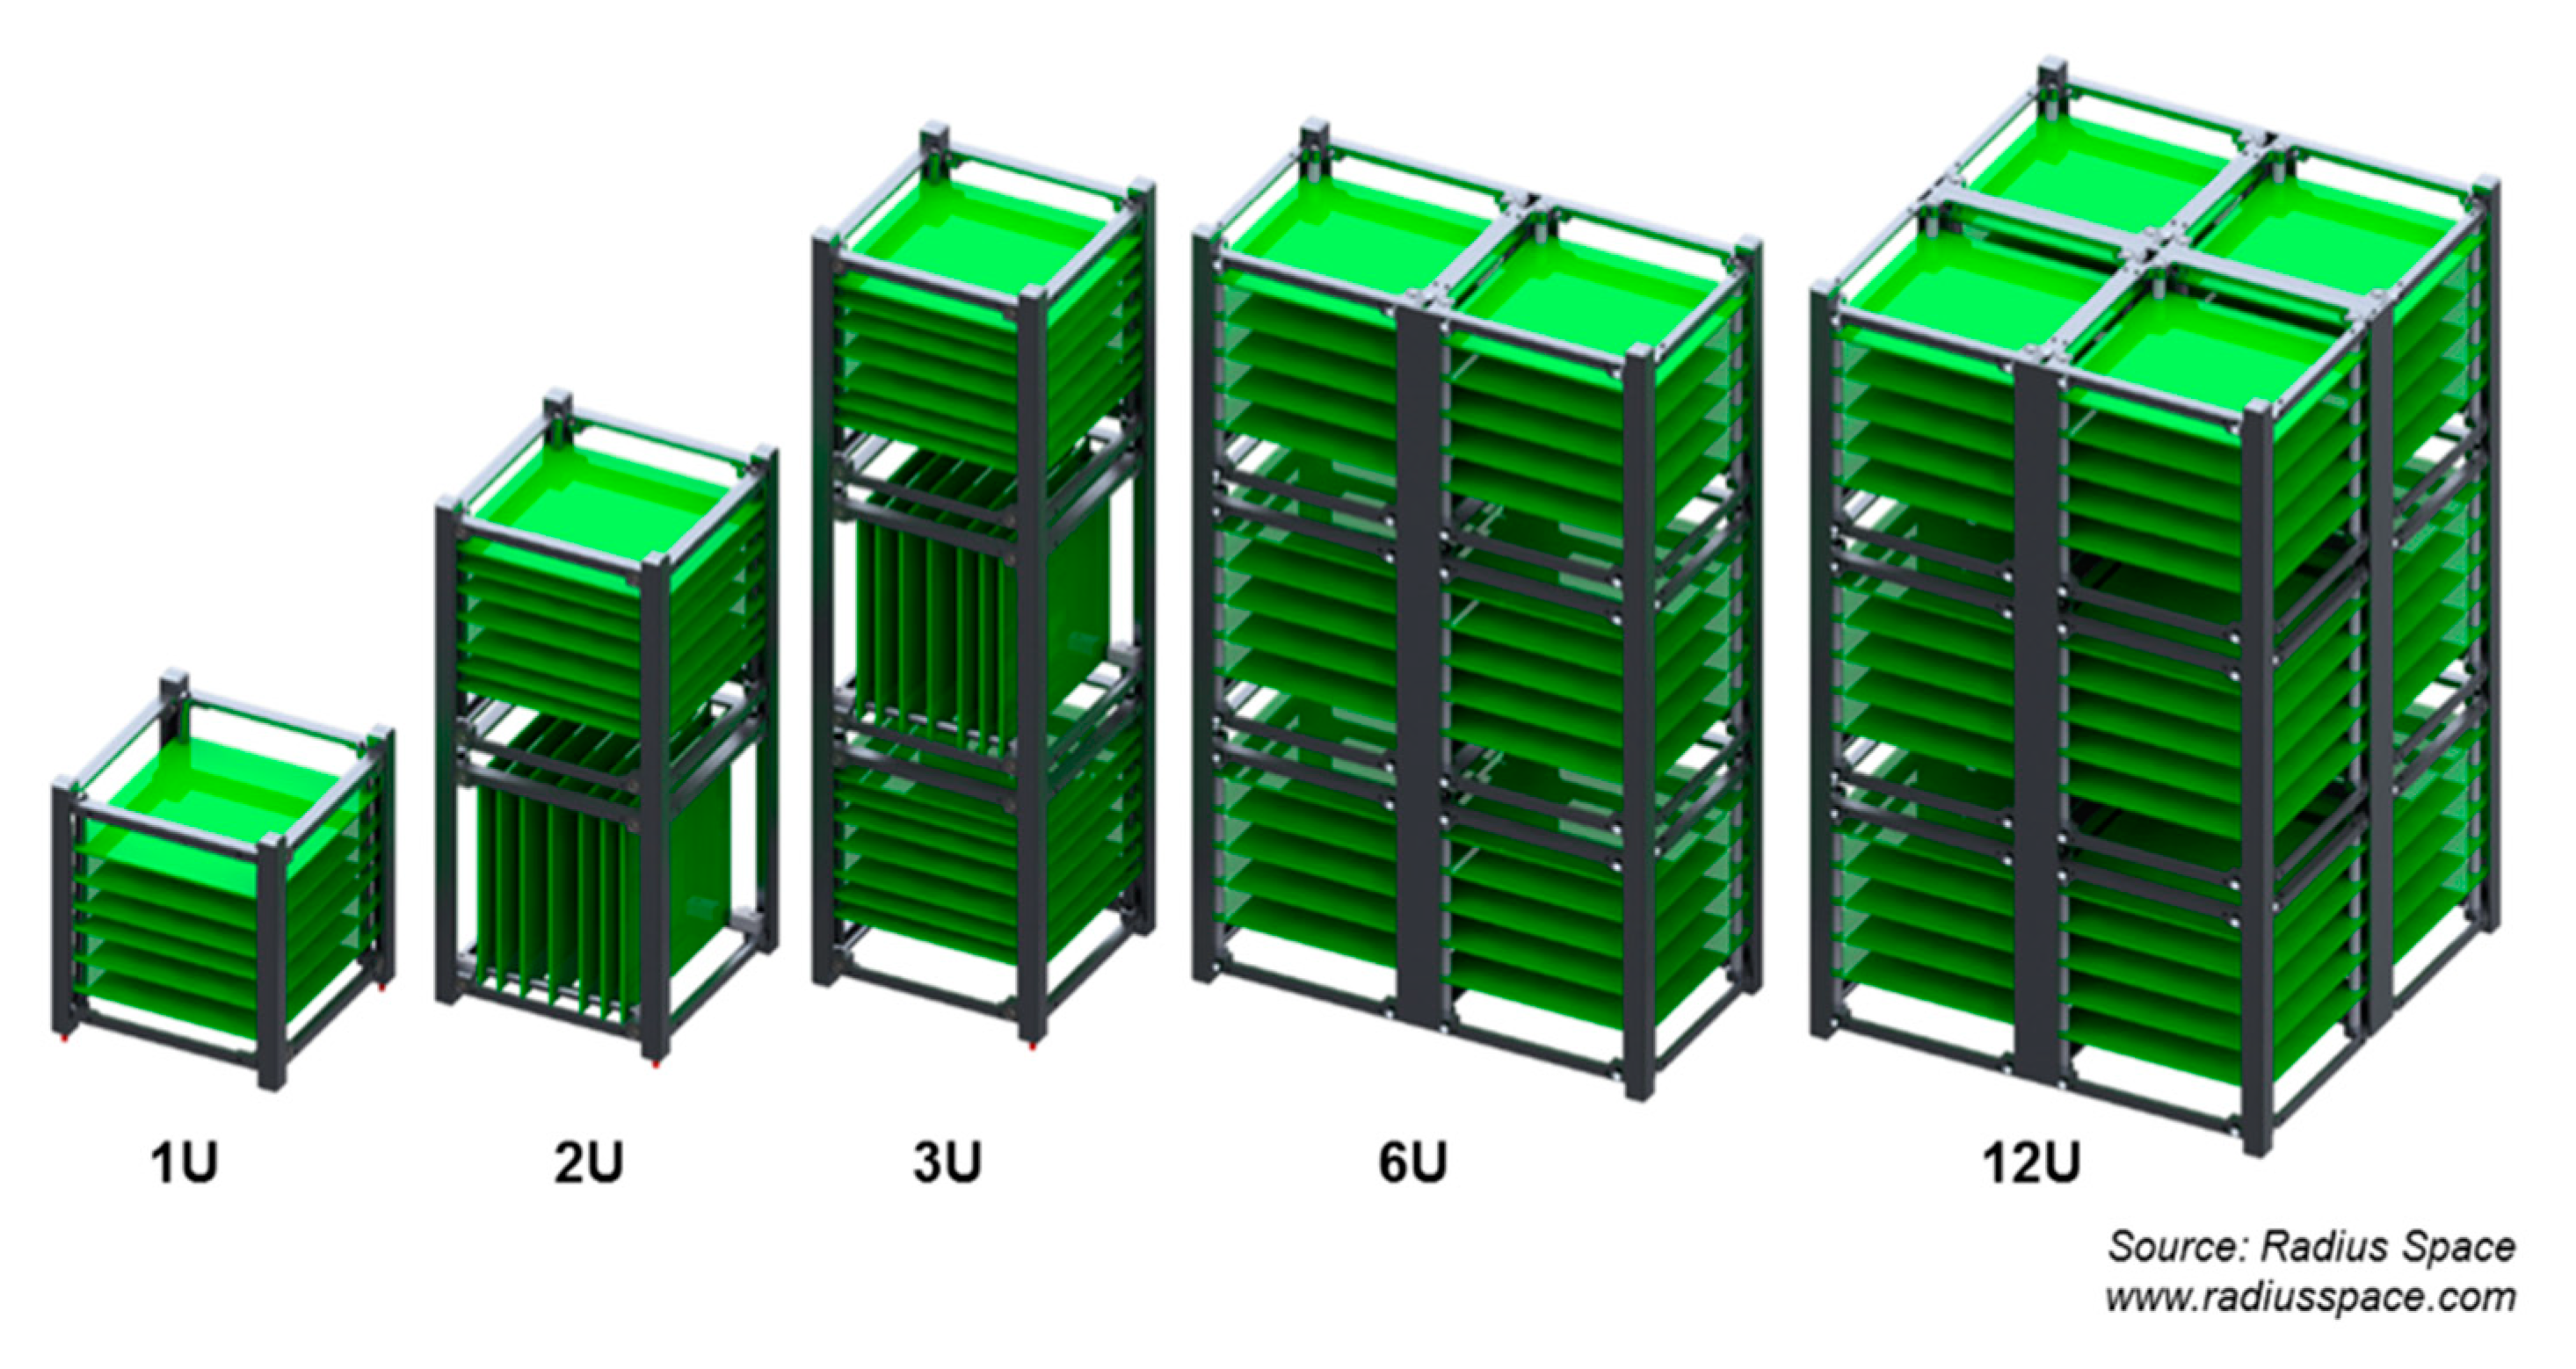
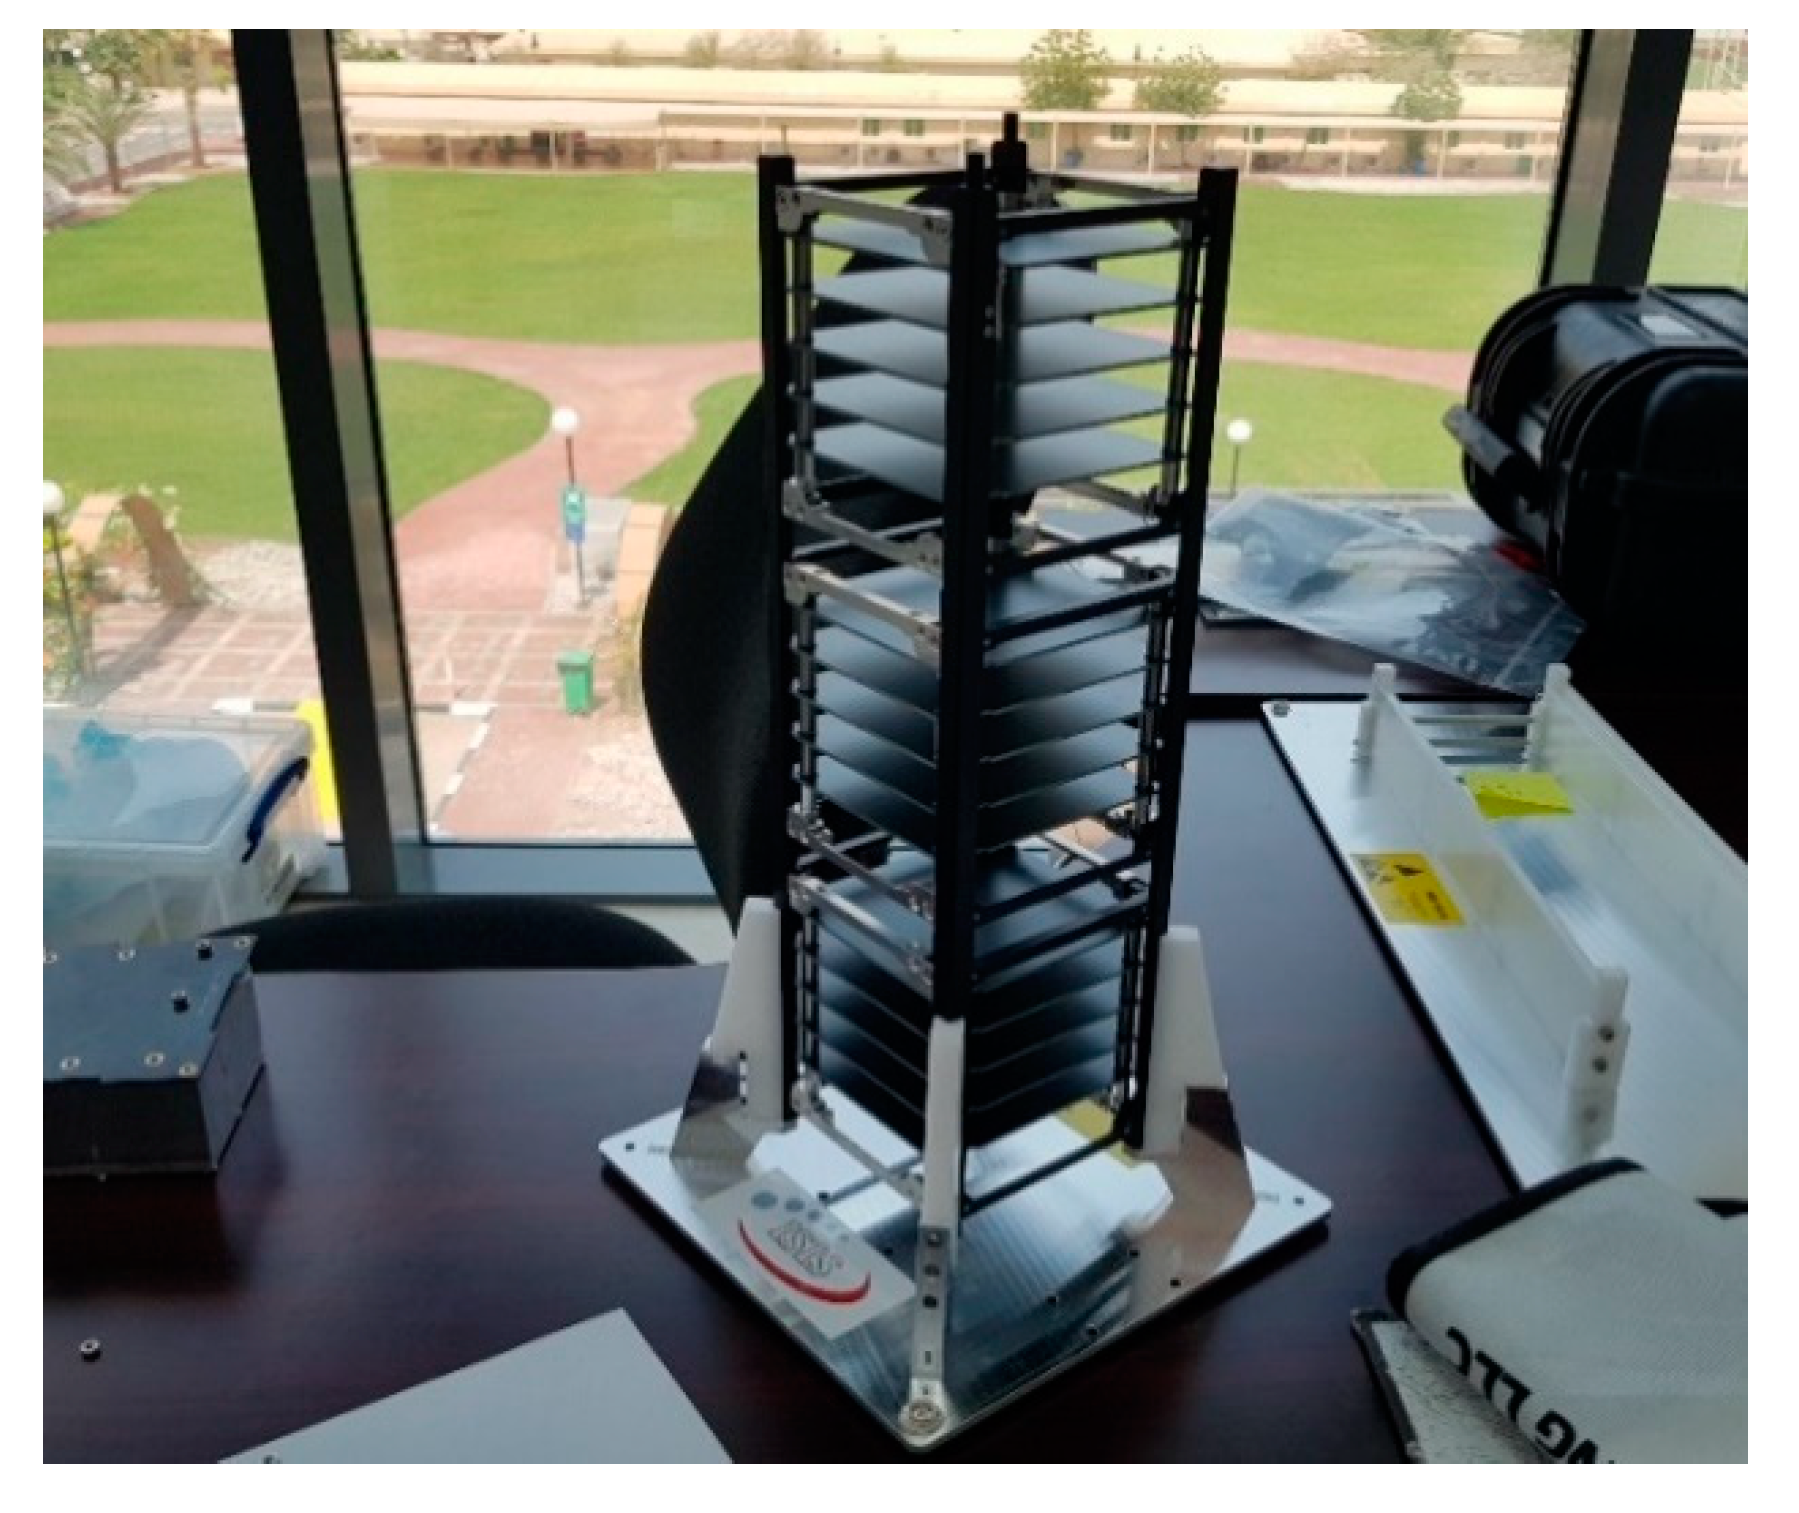
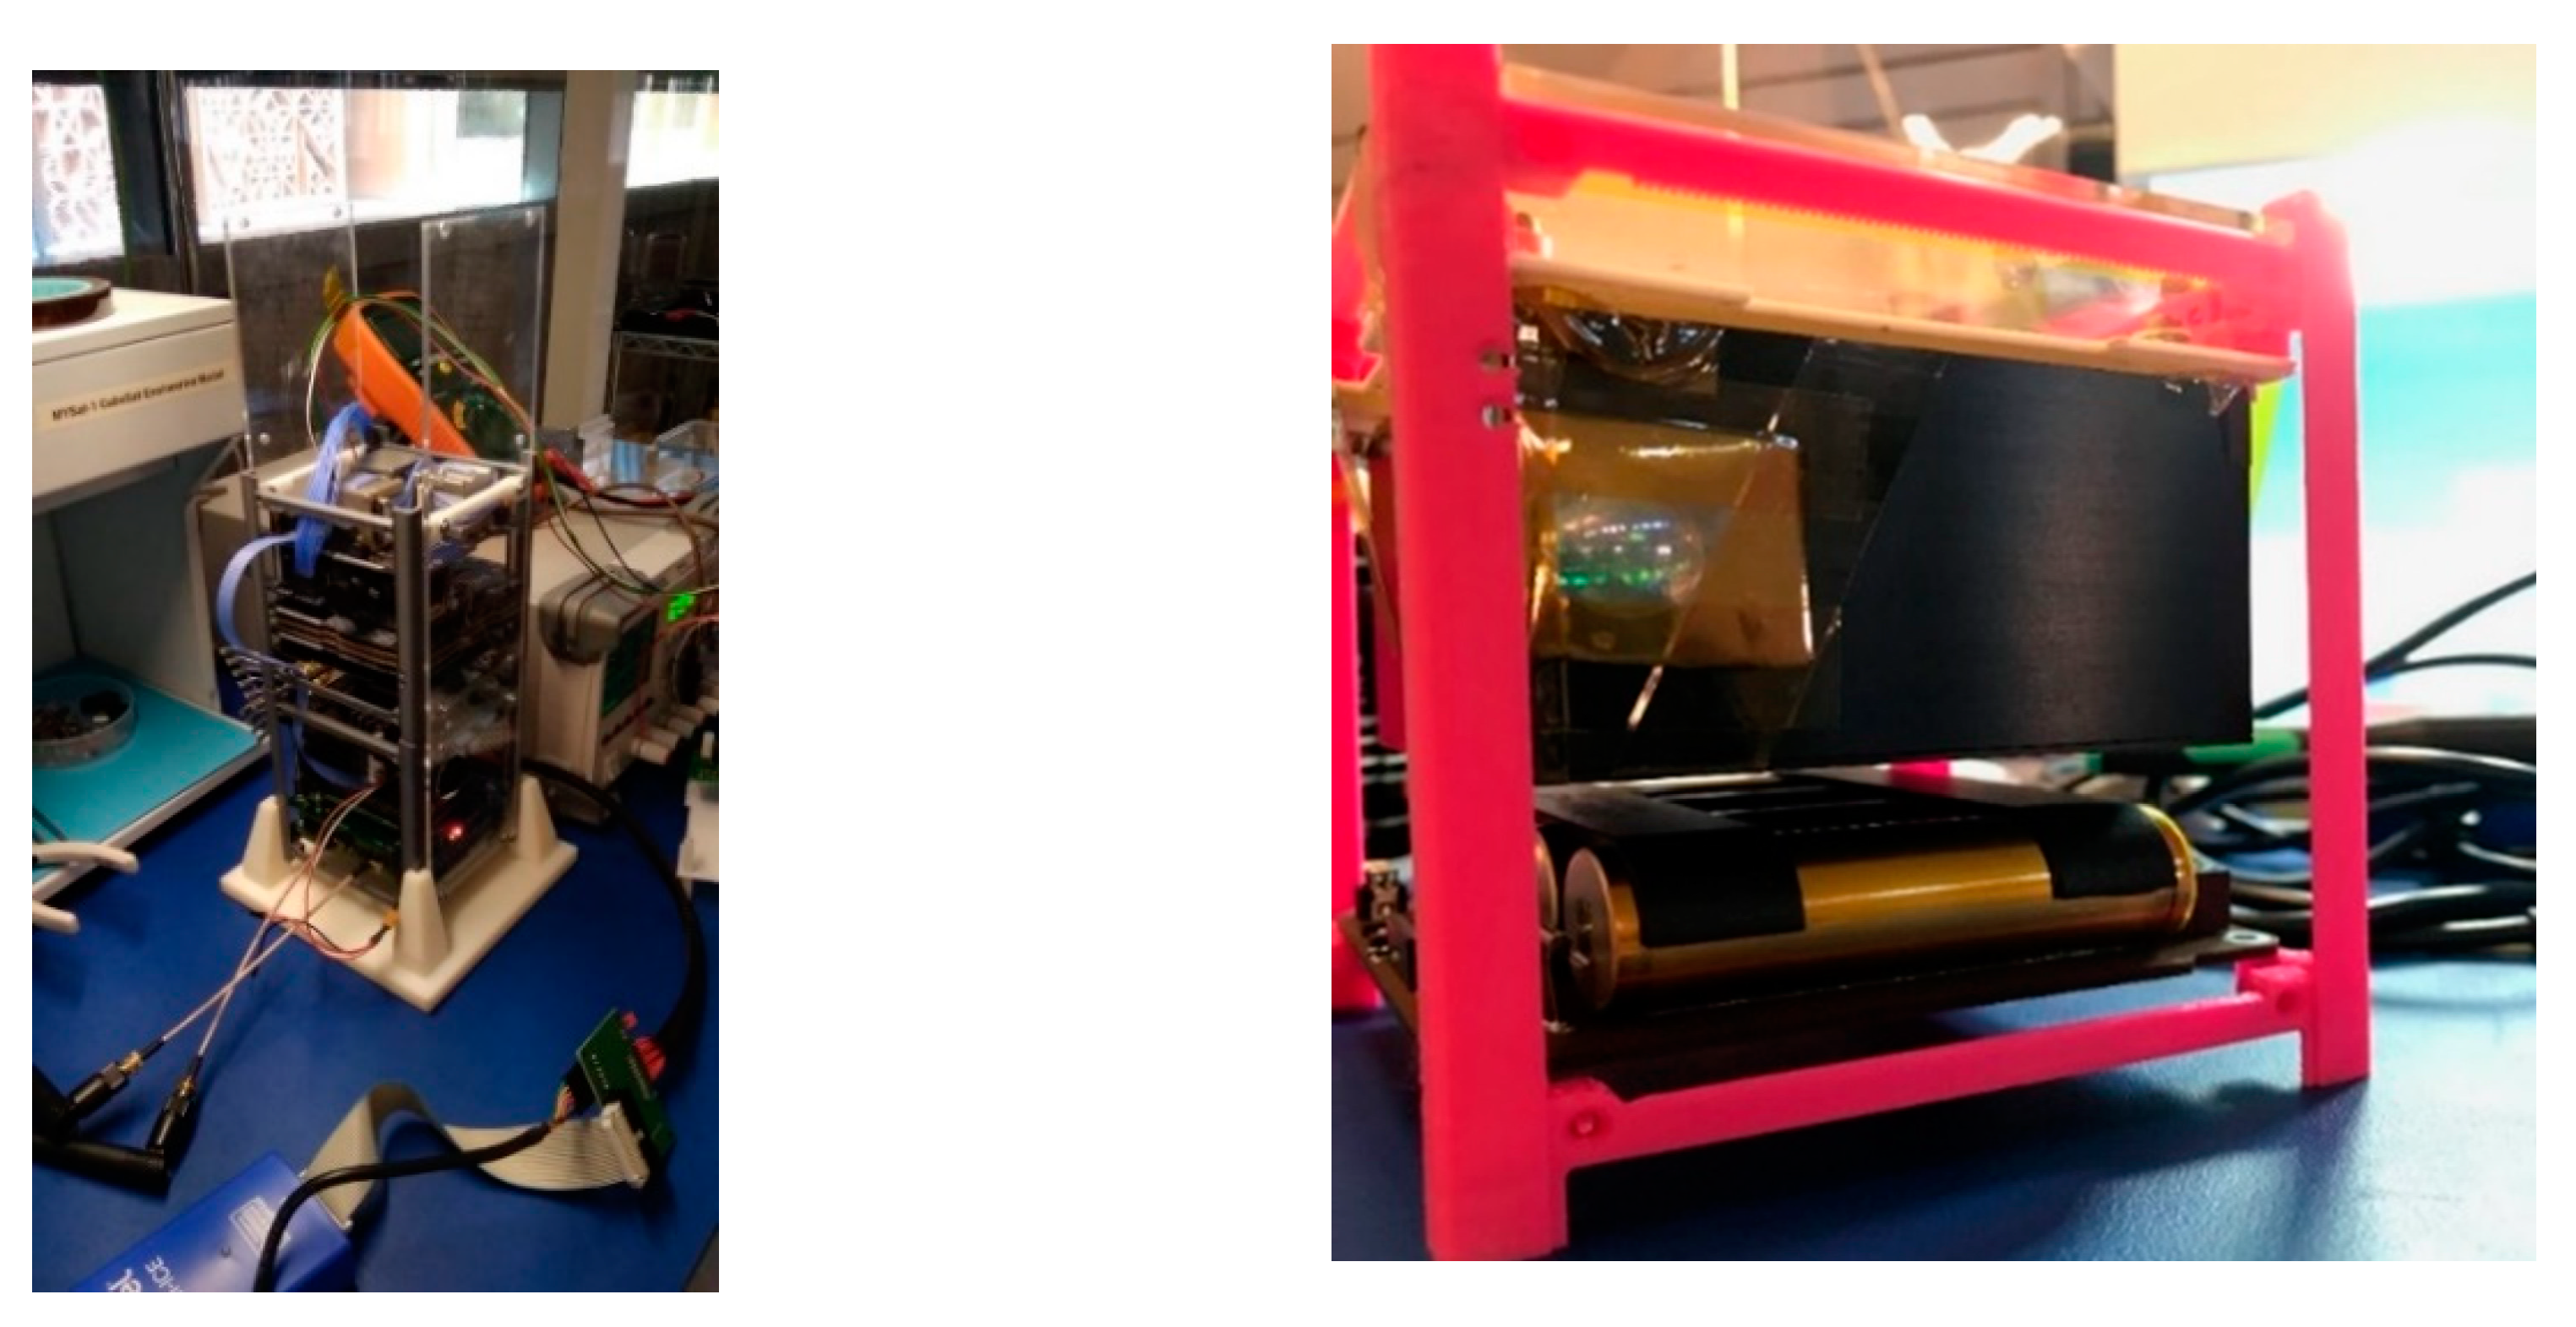
The mechanical structure is a 3U modular structure based upon the CubeSat standard from Innovative Solutions In Space (ISIS) [
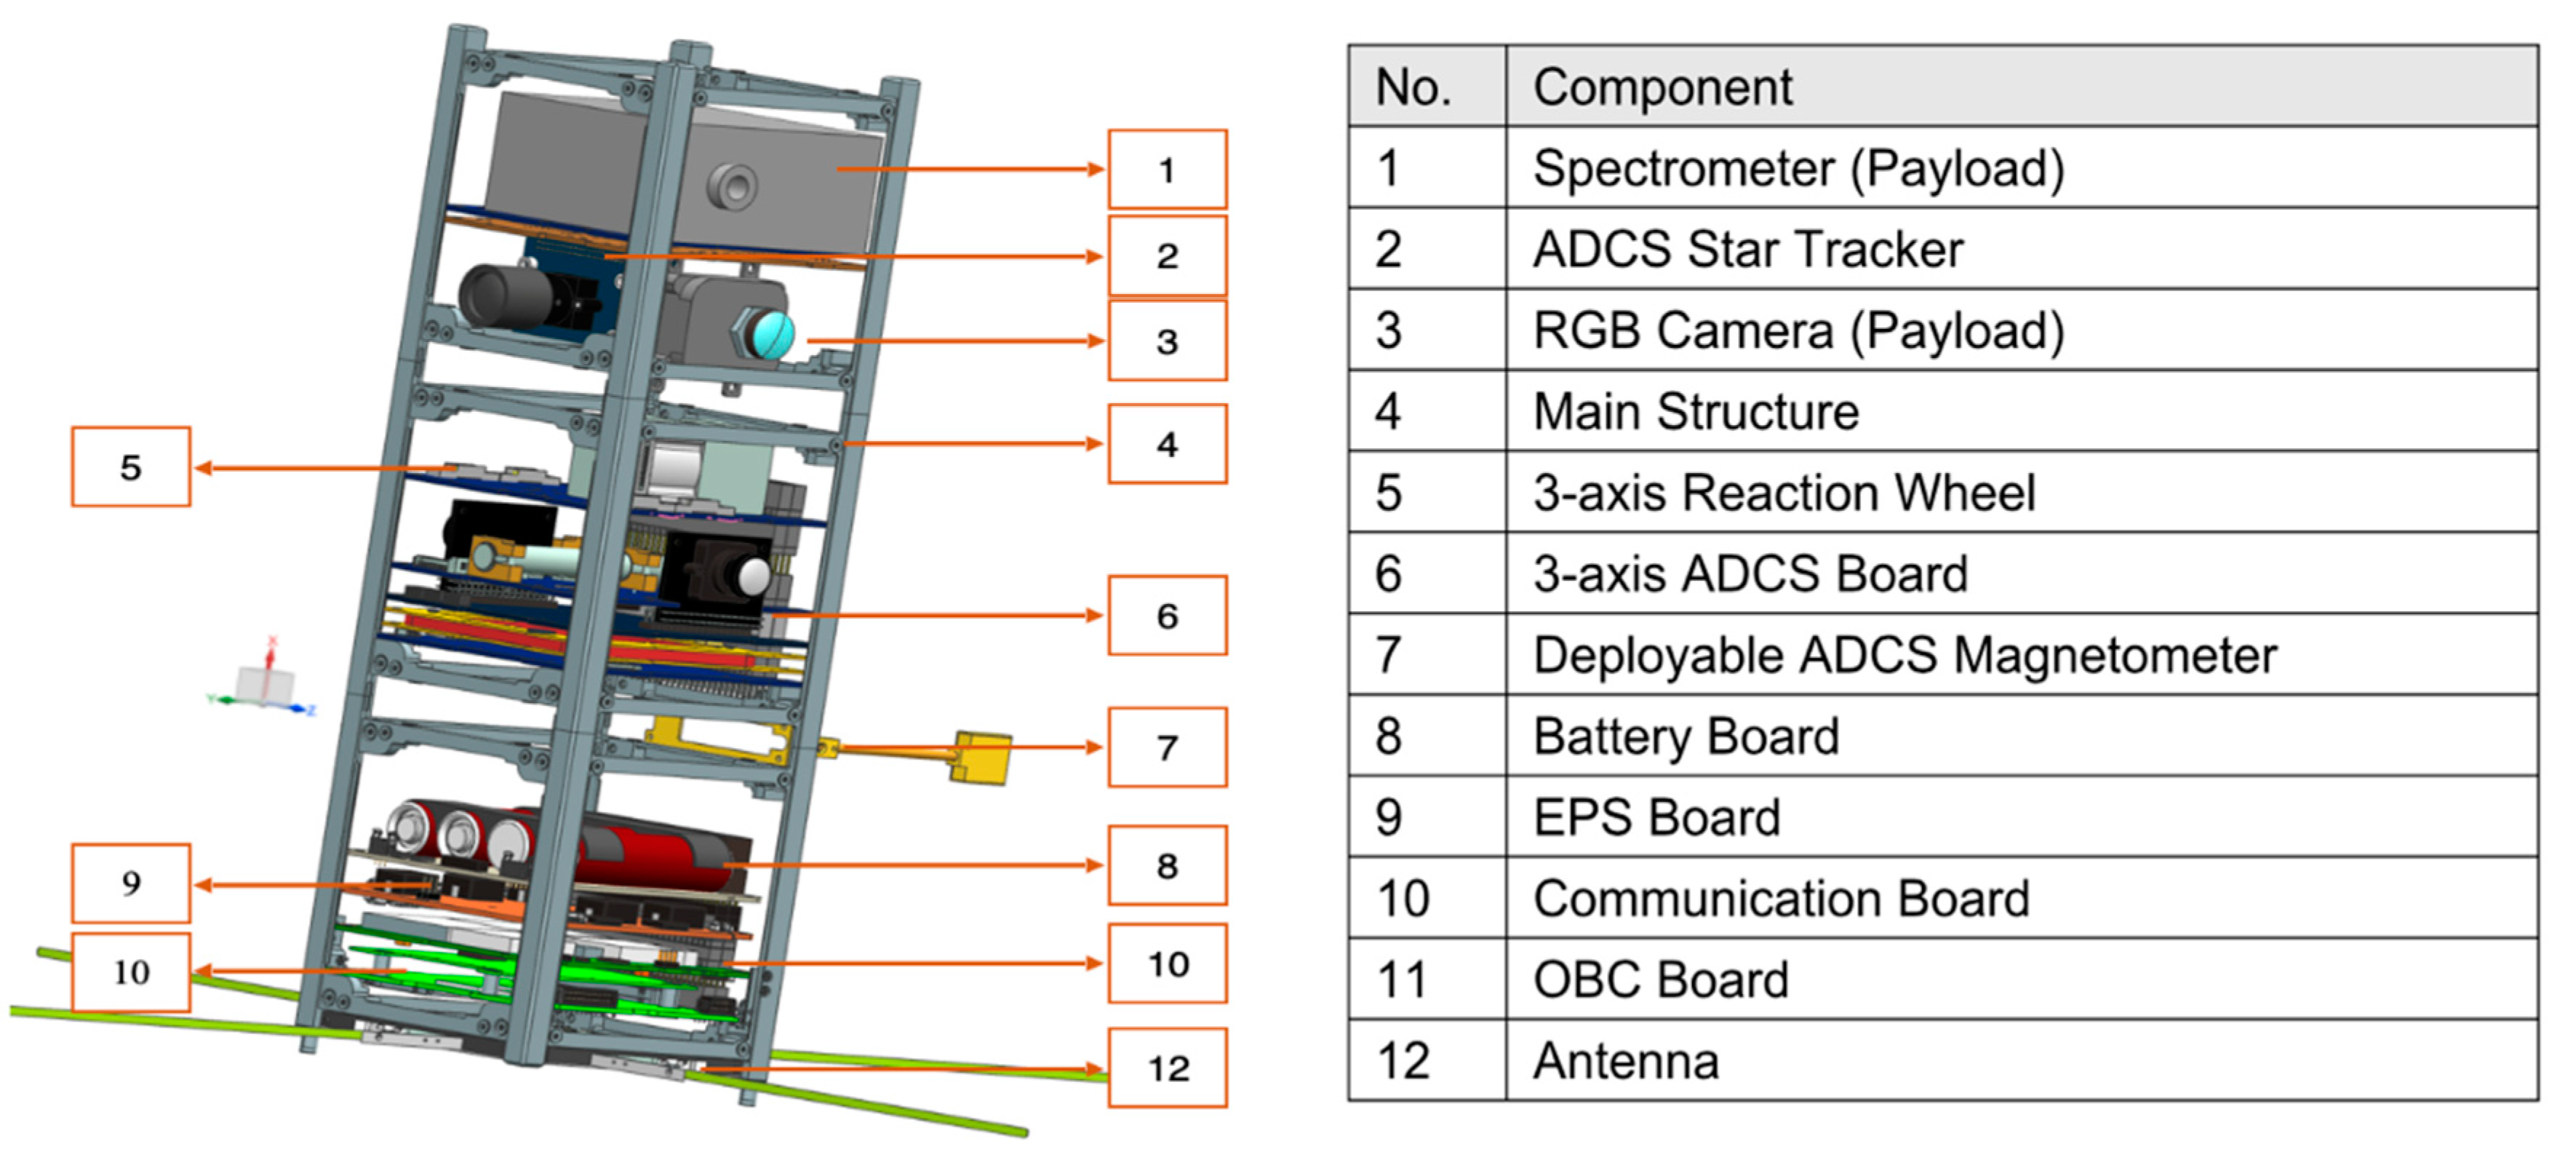
17]. It consists of three 1U PCB stacks that are contained within a secondary structure that forms the chassis of the structure that holds the PCBs in the stack (
Figure 6).
3.2. Telecommunications Subsystem (TS)
The Telecommunications Subsystem consists of a UHF transmitter and VHF receiver. Four deployable dipole antennas are used for the UHF and VHF. The Transceiver provides the uplink and downlink communications between the satellite and ground stations.
A UHF transmitter is used for transmitting telemetry, science and image data from the satellite to the ground station. It transmits at 9.6 kbps data rate using the BFSK modulation technique. The frequency range for the transmission carrier is from 430 MHz to 450 MHz.
Table 1 shows the data volume generated by the payloads. The major portion of the payload data volume is generated from the RGB camera with 1,643,530 Bytes and 389,130 Bytes produced for SXGA format images and VGA format images respectively. Considering the SXGA format download a total of 22 min is required to download the payload data using the 9600 bps UHF transmitter. STK simulations verify a total of 28 min per day Ground Station access time available for data download. It should be noted that these calculations do not consider using any on-board image compression.
A VHF receiver receives telecommands from ground station to the satellite. The receiver uses baseband modulator with 1.2 kbps data rate and AFSK modulation. The frequency range for the transmission carrier is from 130 MHz to 150 MHz.
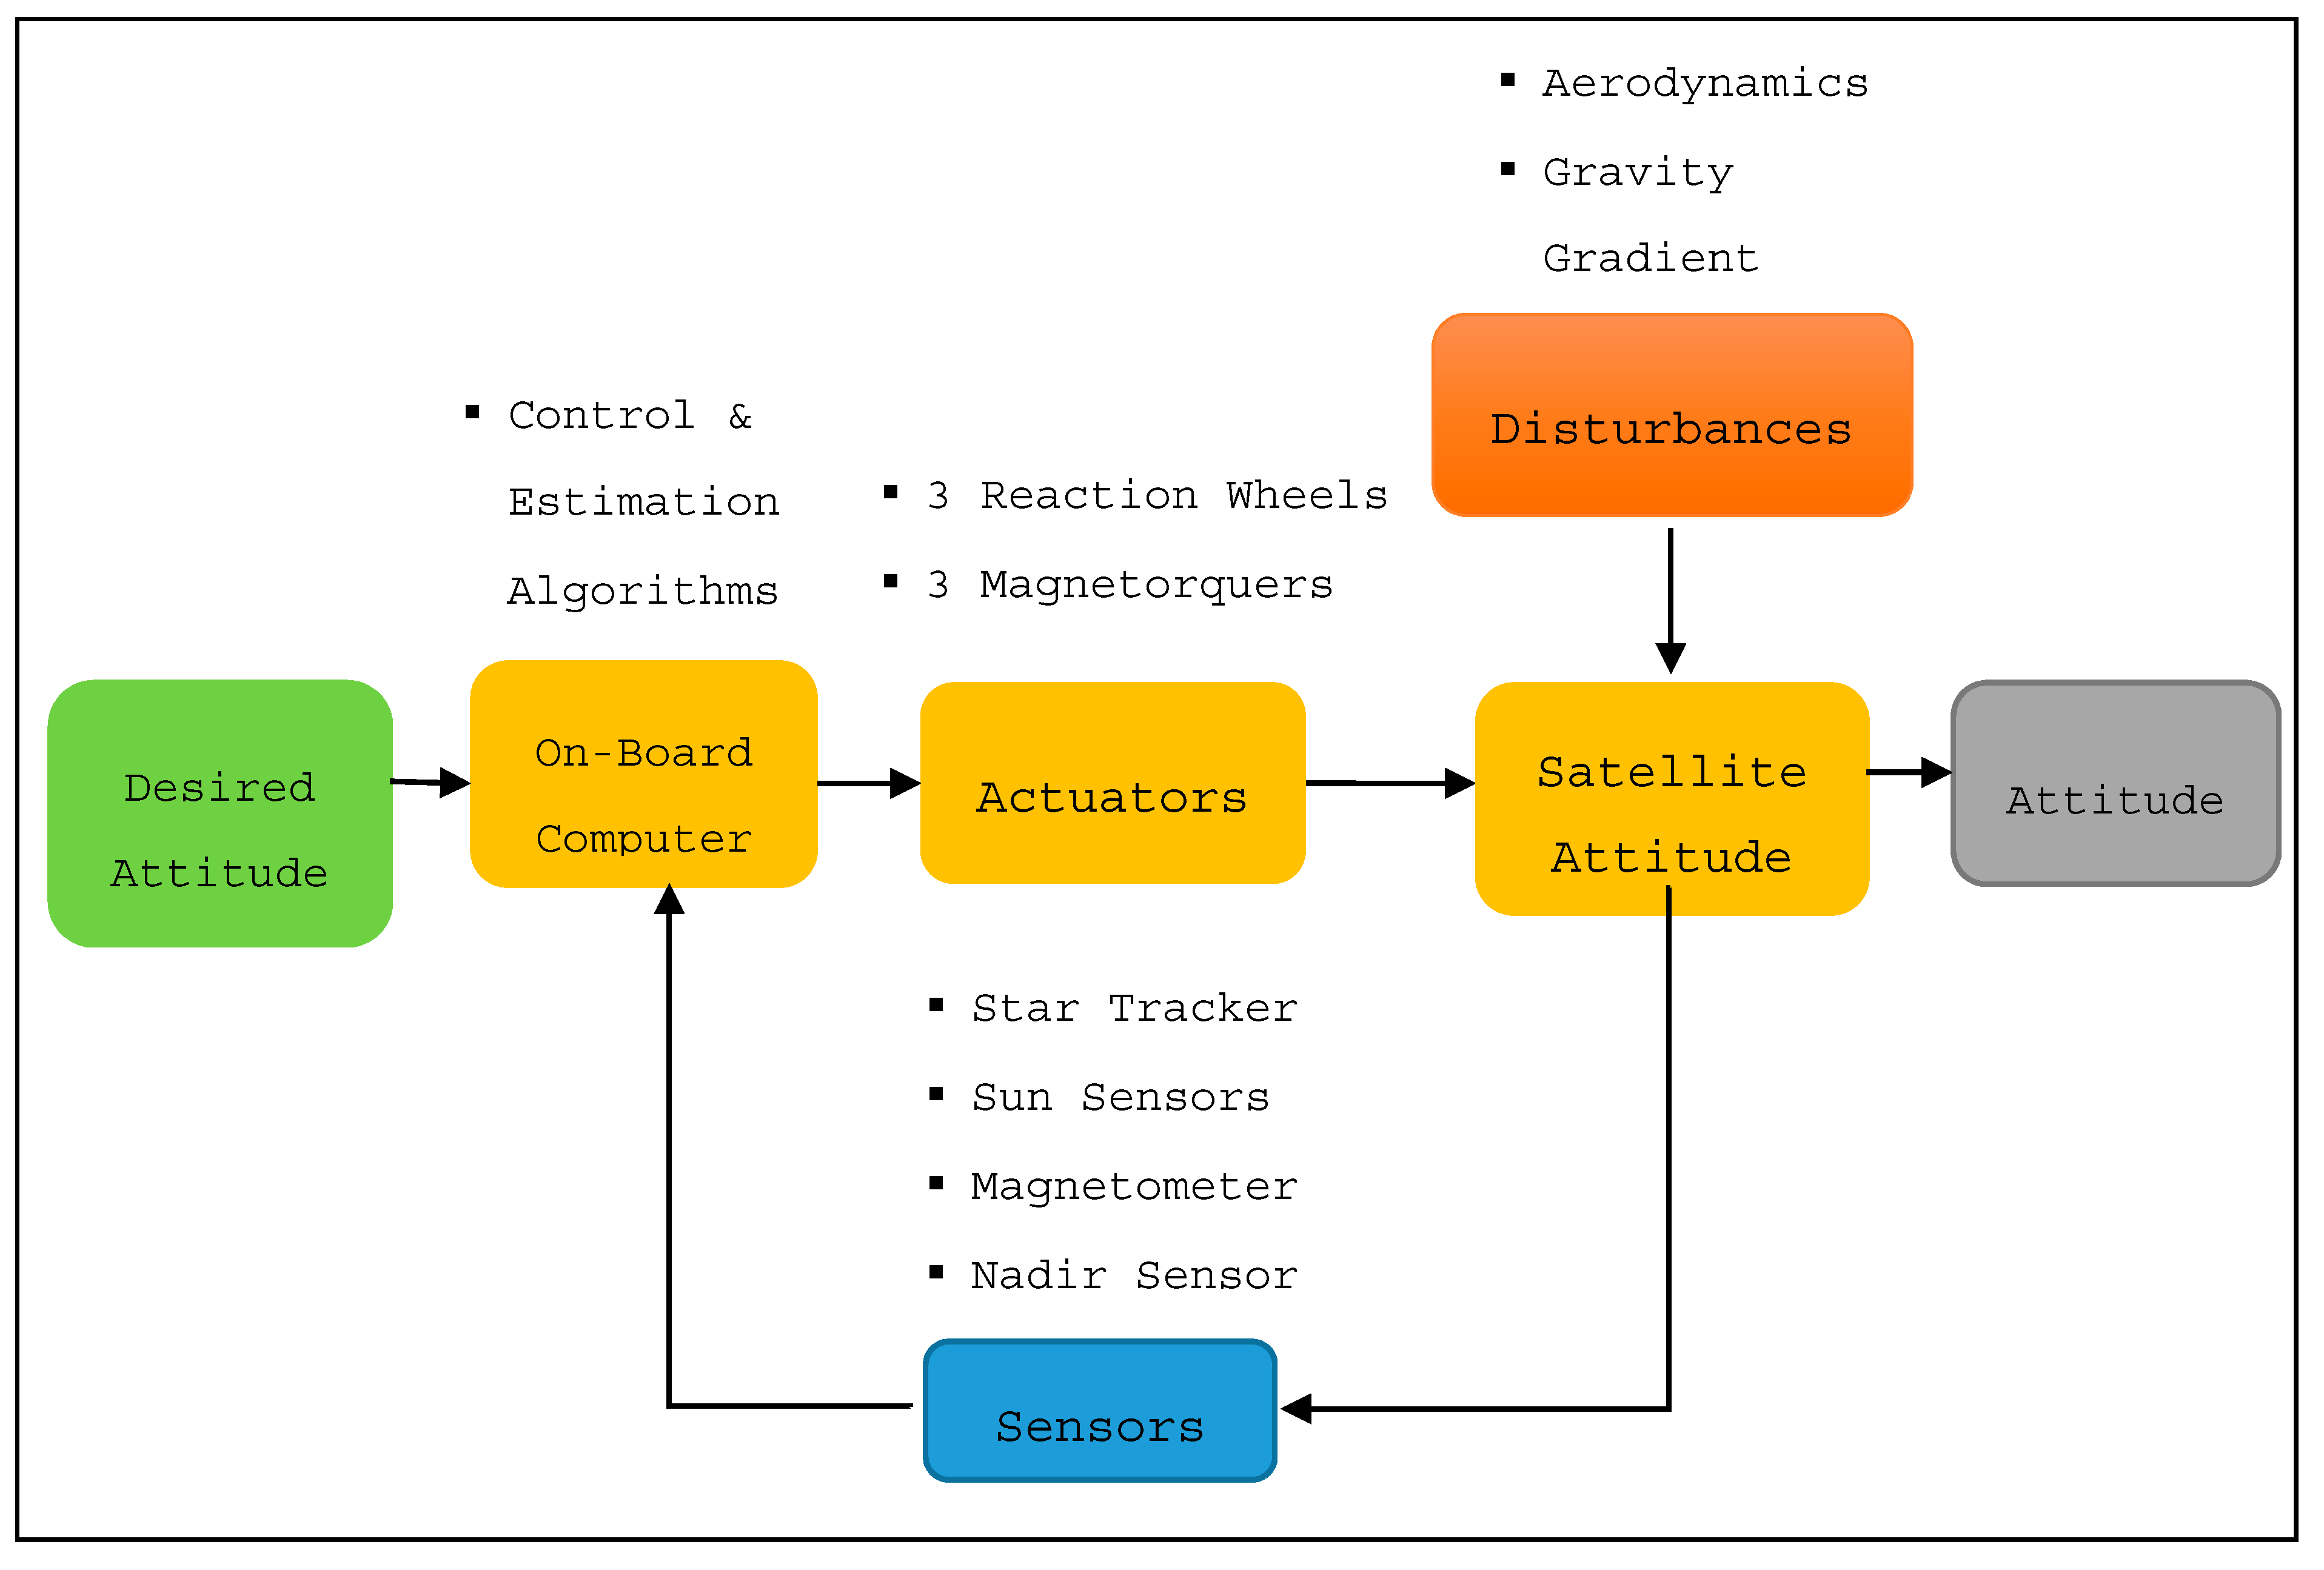
3.3. Attitude Determination and Control Subsystem (ADCS)
The ADCS is the subsystem that is responsible for controlling the pointing of the satellite throughout the mission lifetime including de-tumbling the satellite after deployment, pointing the satellite as per the mission requirements and recovering it from any spin-ups. Given that the spectrometer used as the primary payload of the mission has a Field of View (FOV) of 0.15 degrees and to enable relatively accurate detection of GHG sources, a pointing accuracy of less than 1 degree is required. This requirement means that the passive attitude control mechanisms using magnetorquers usually used in CubeSats is not enough. Using reaction wheels and accurate attitude determination sensing (such as star sensors) would be required.
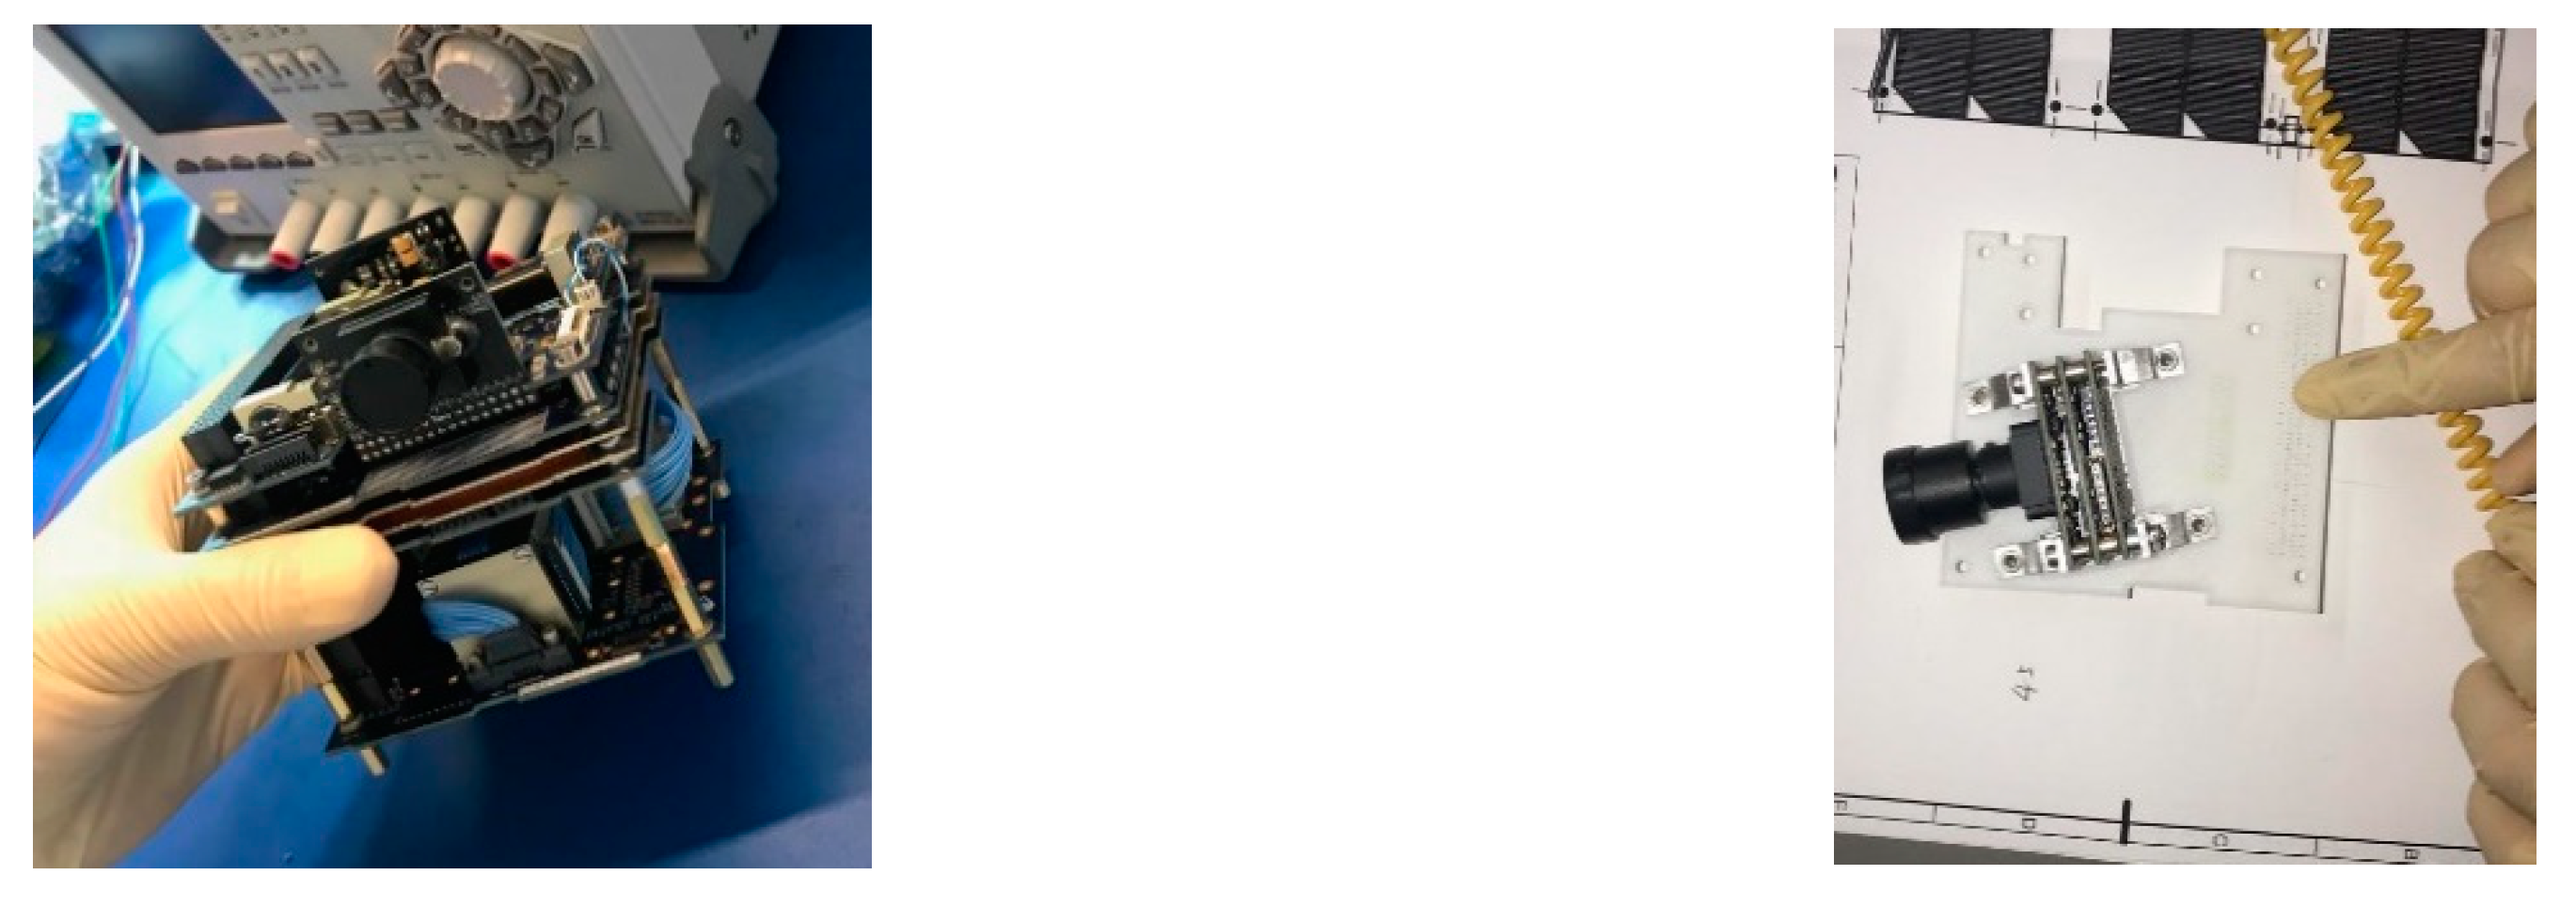
The ADCS used for this mission is a CubeADCS 3-Axis integrated bundle from CubeSpace with a flight heritage of more than ten years (with the exception of the start tracker which has no flight heritage) [
18].
Figure 7 shows an overview of the ADCS architecture and
Figure 8 shows images of the ADCS hardware. The ADCS has three-axis control capability using three Reaction Wheels (with maximum momentum of 1.77 mNms and a maximum torque of 0.23 mNm), in addition to three mangetorquers (to be used mainly for desaturation). The sensor set includes a deployable magnetometer, two CMOS cameras (one used for fine sun sensing and the other for horizon detection), ten coarse sun sensors and a star tracker based on ARM Cortex-M3 architecture.
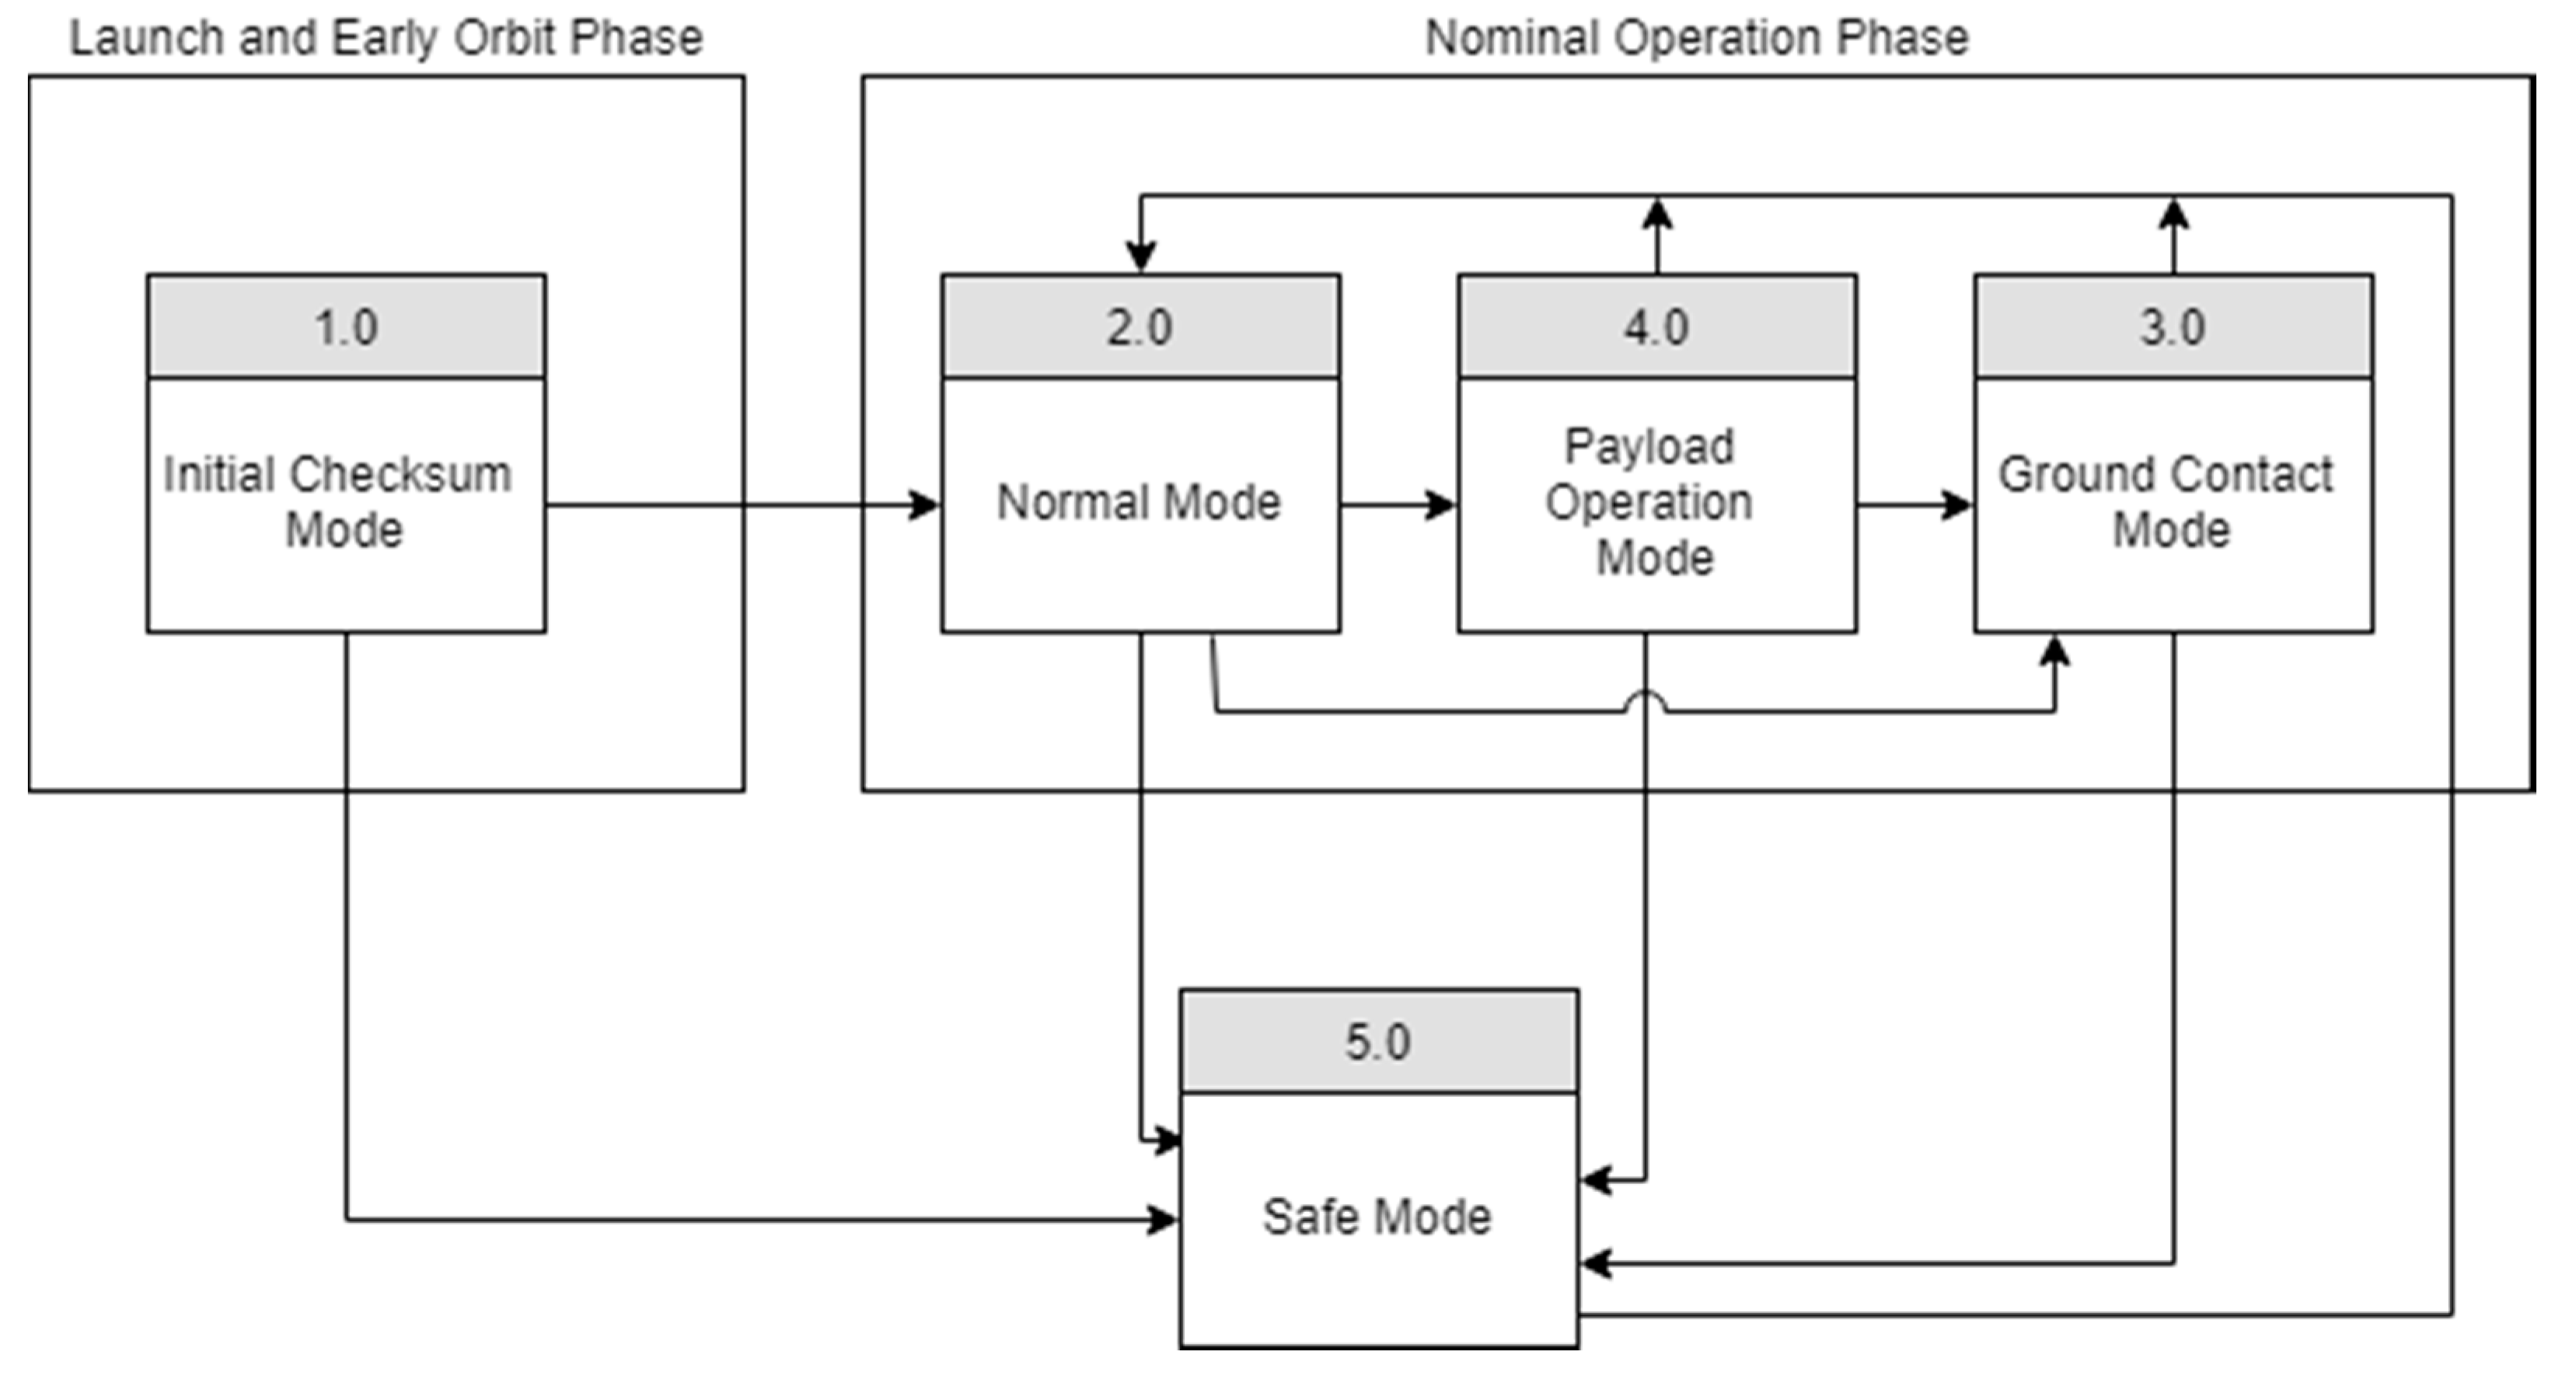
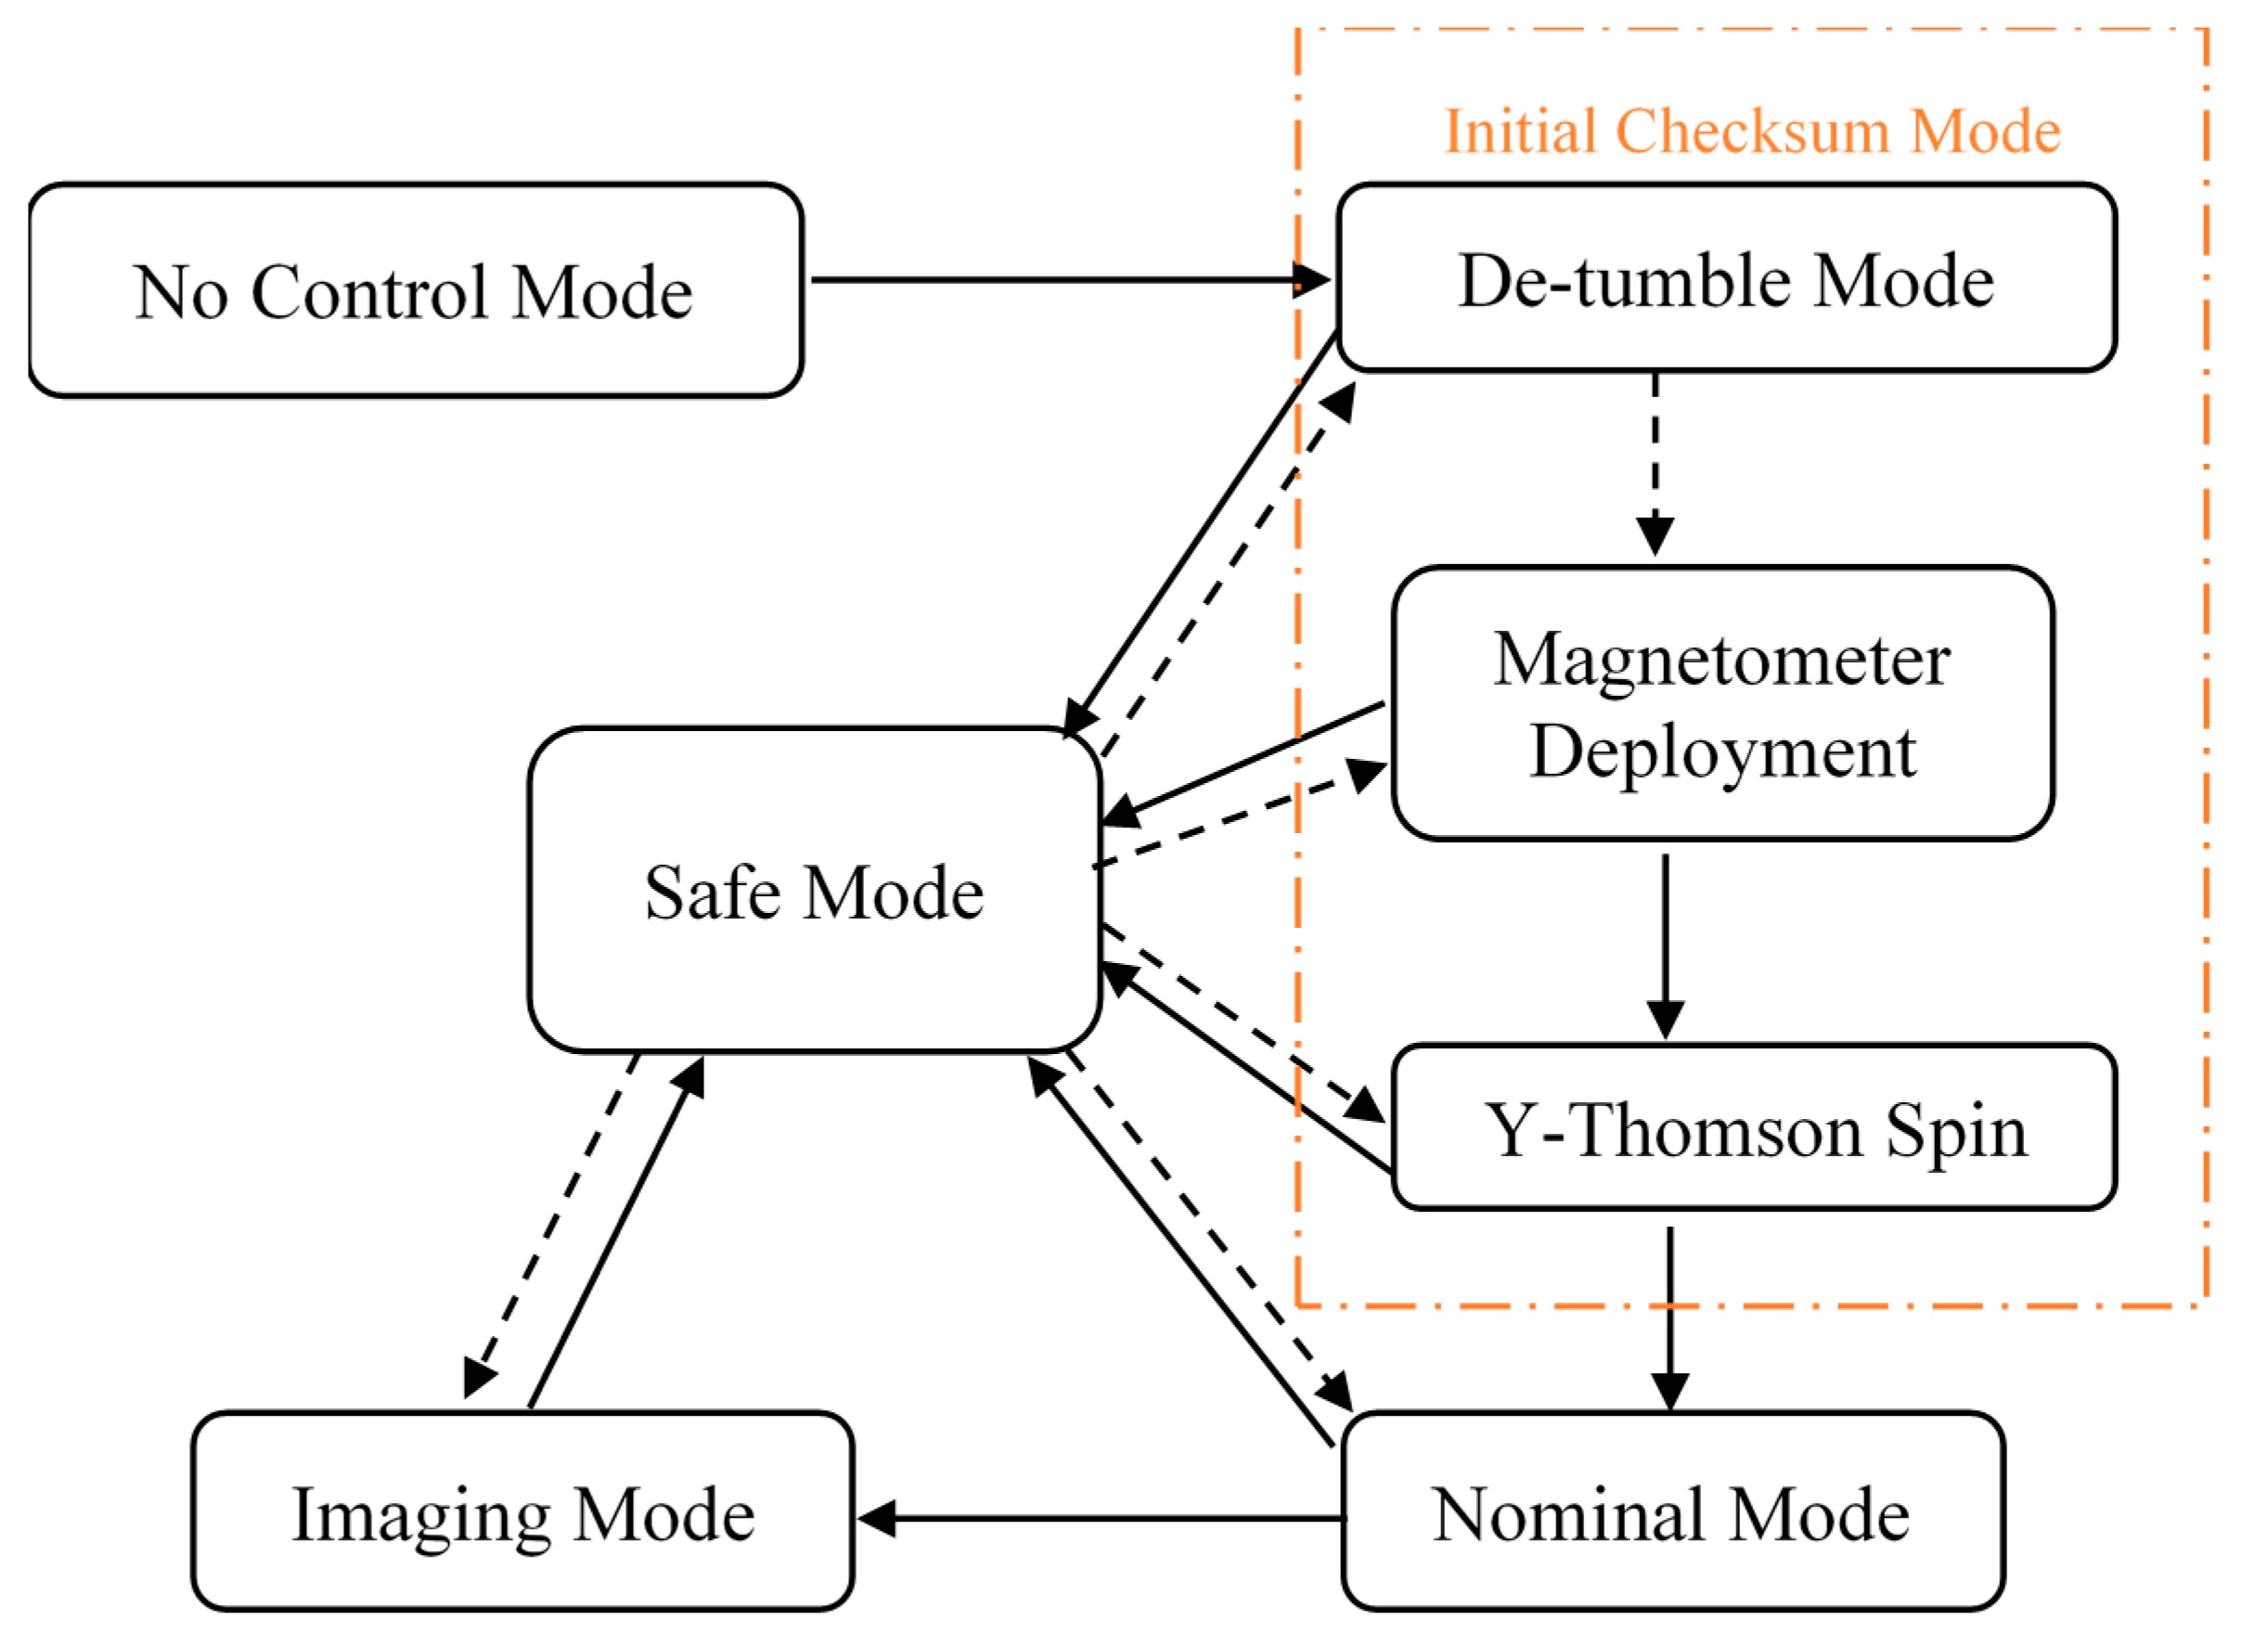
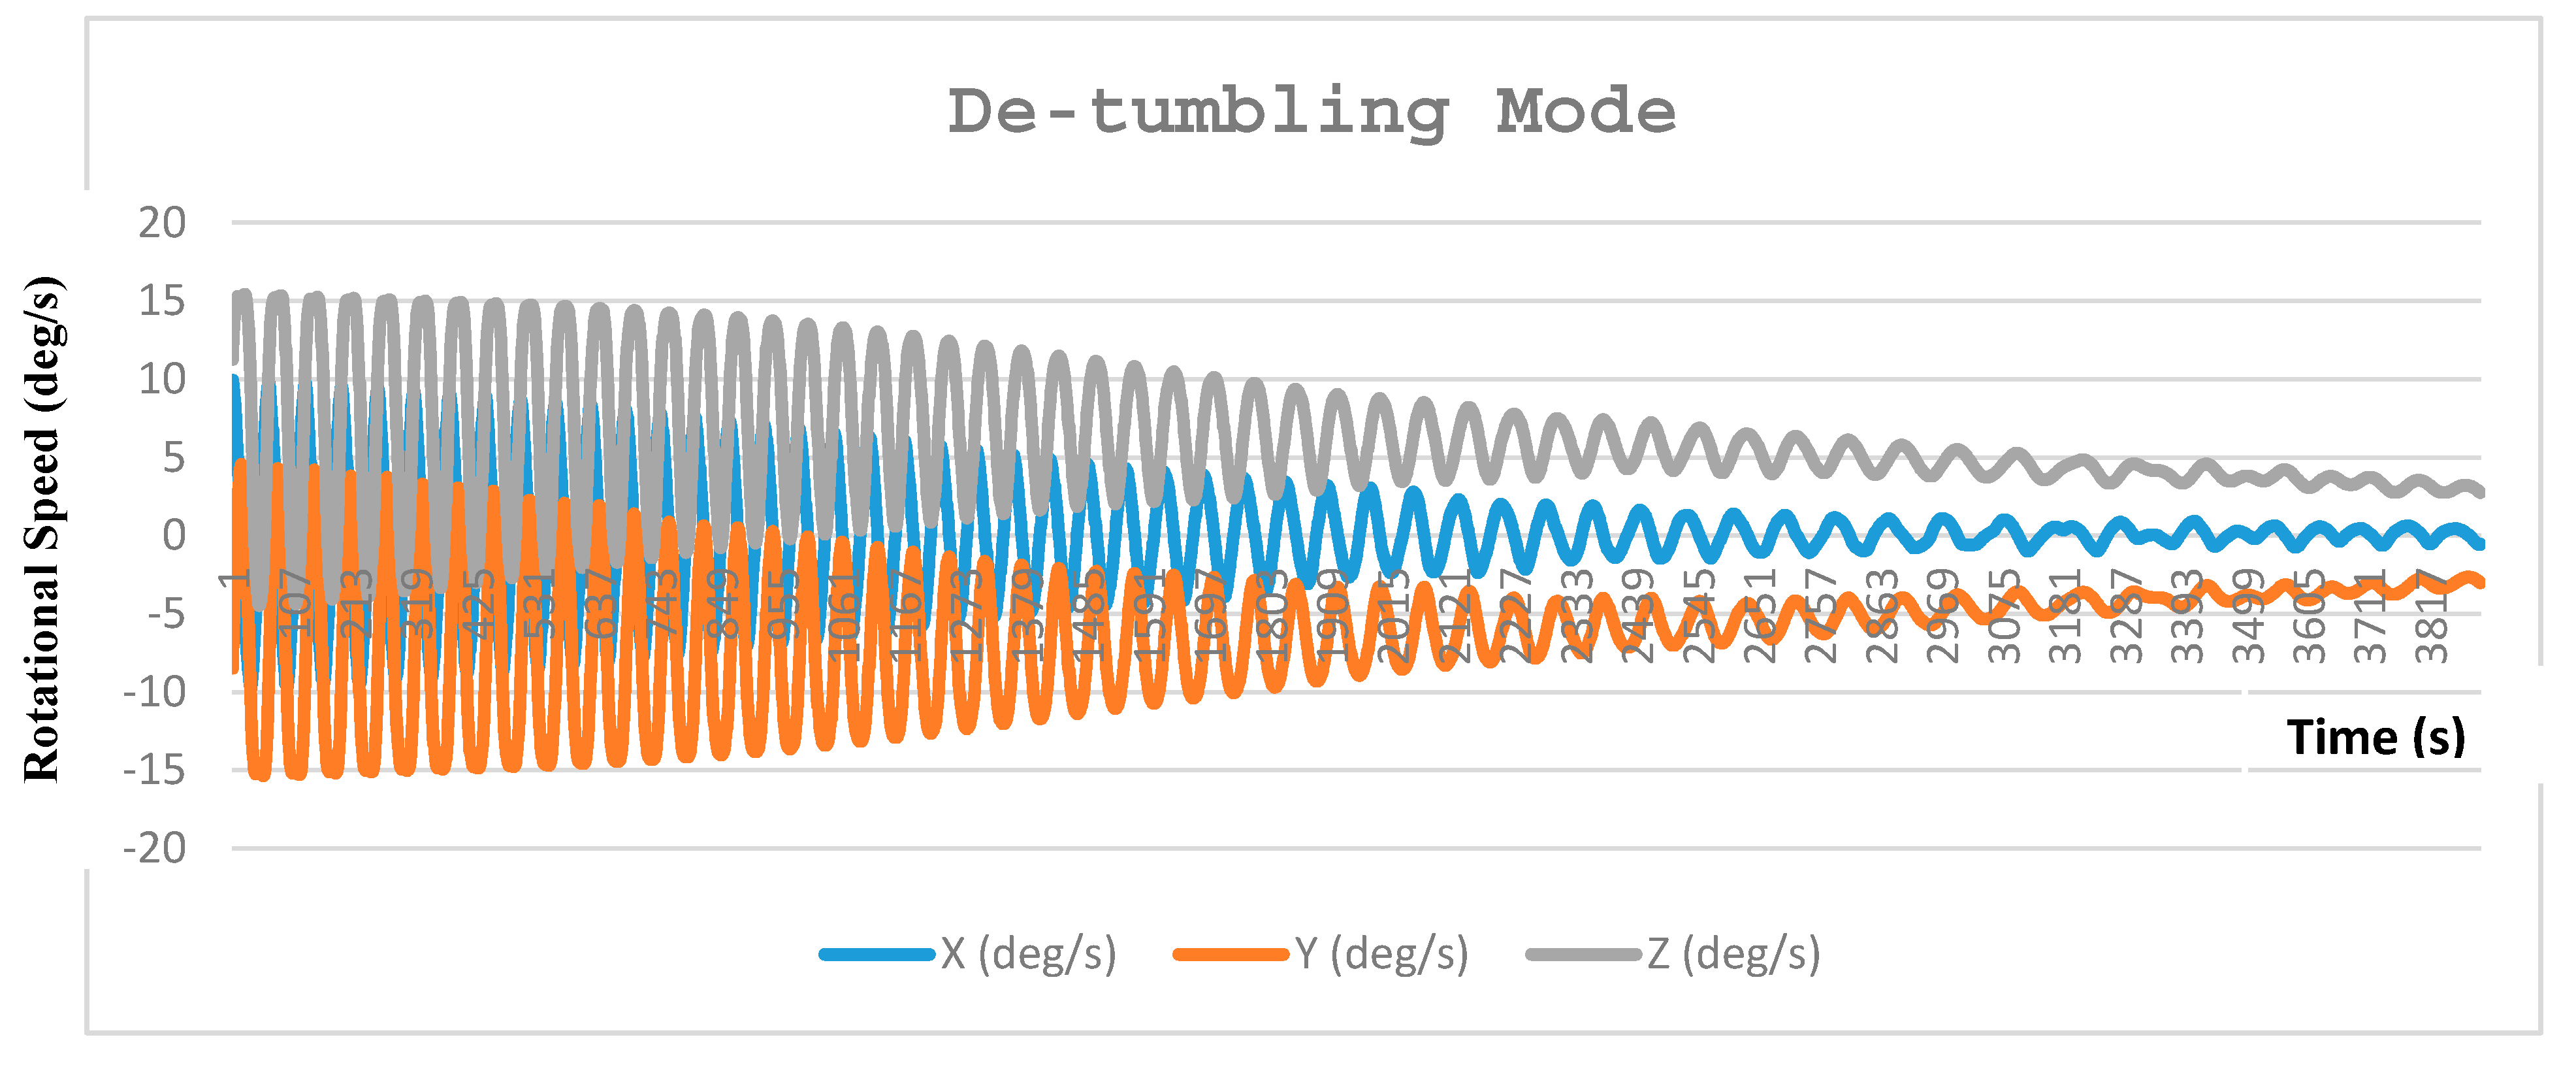
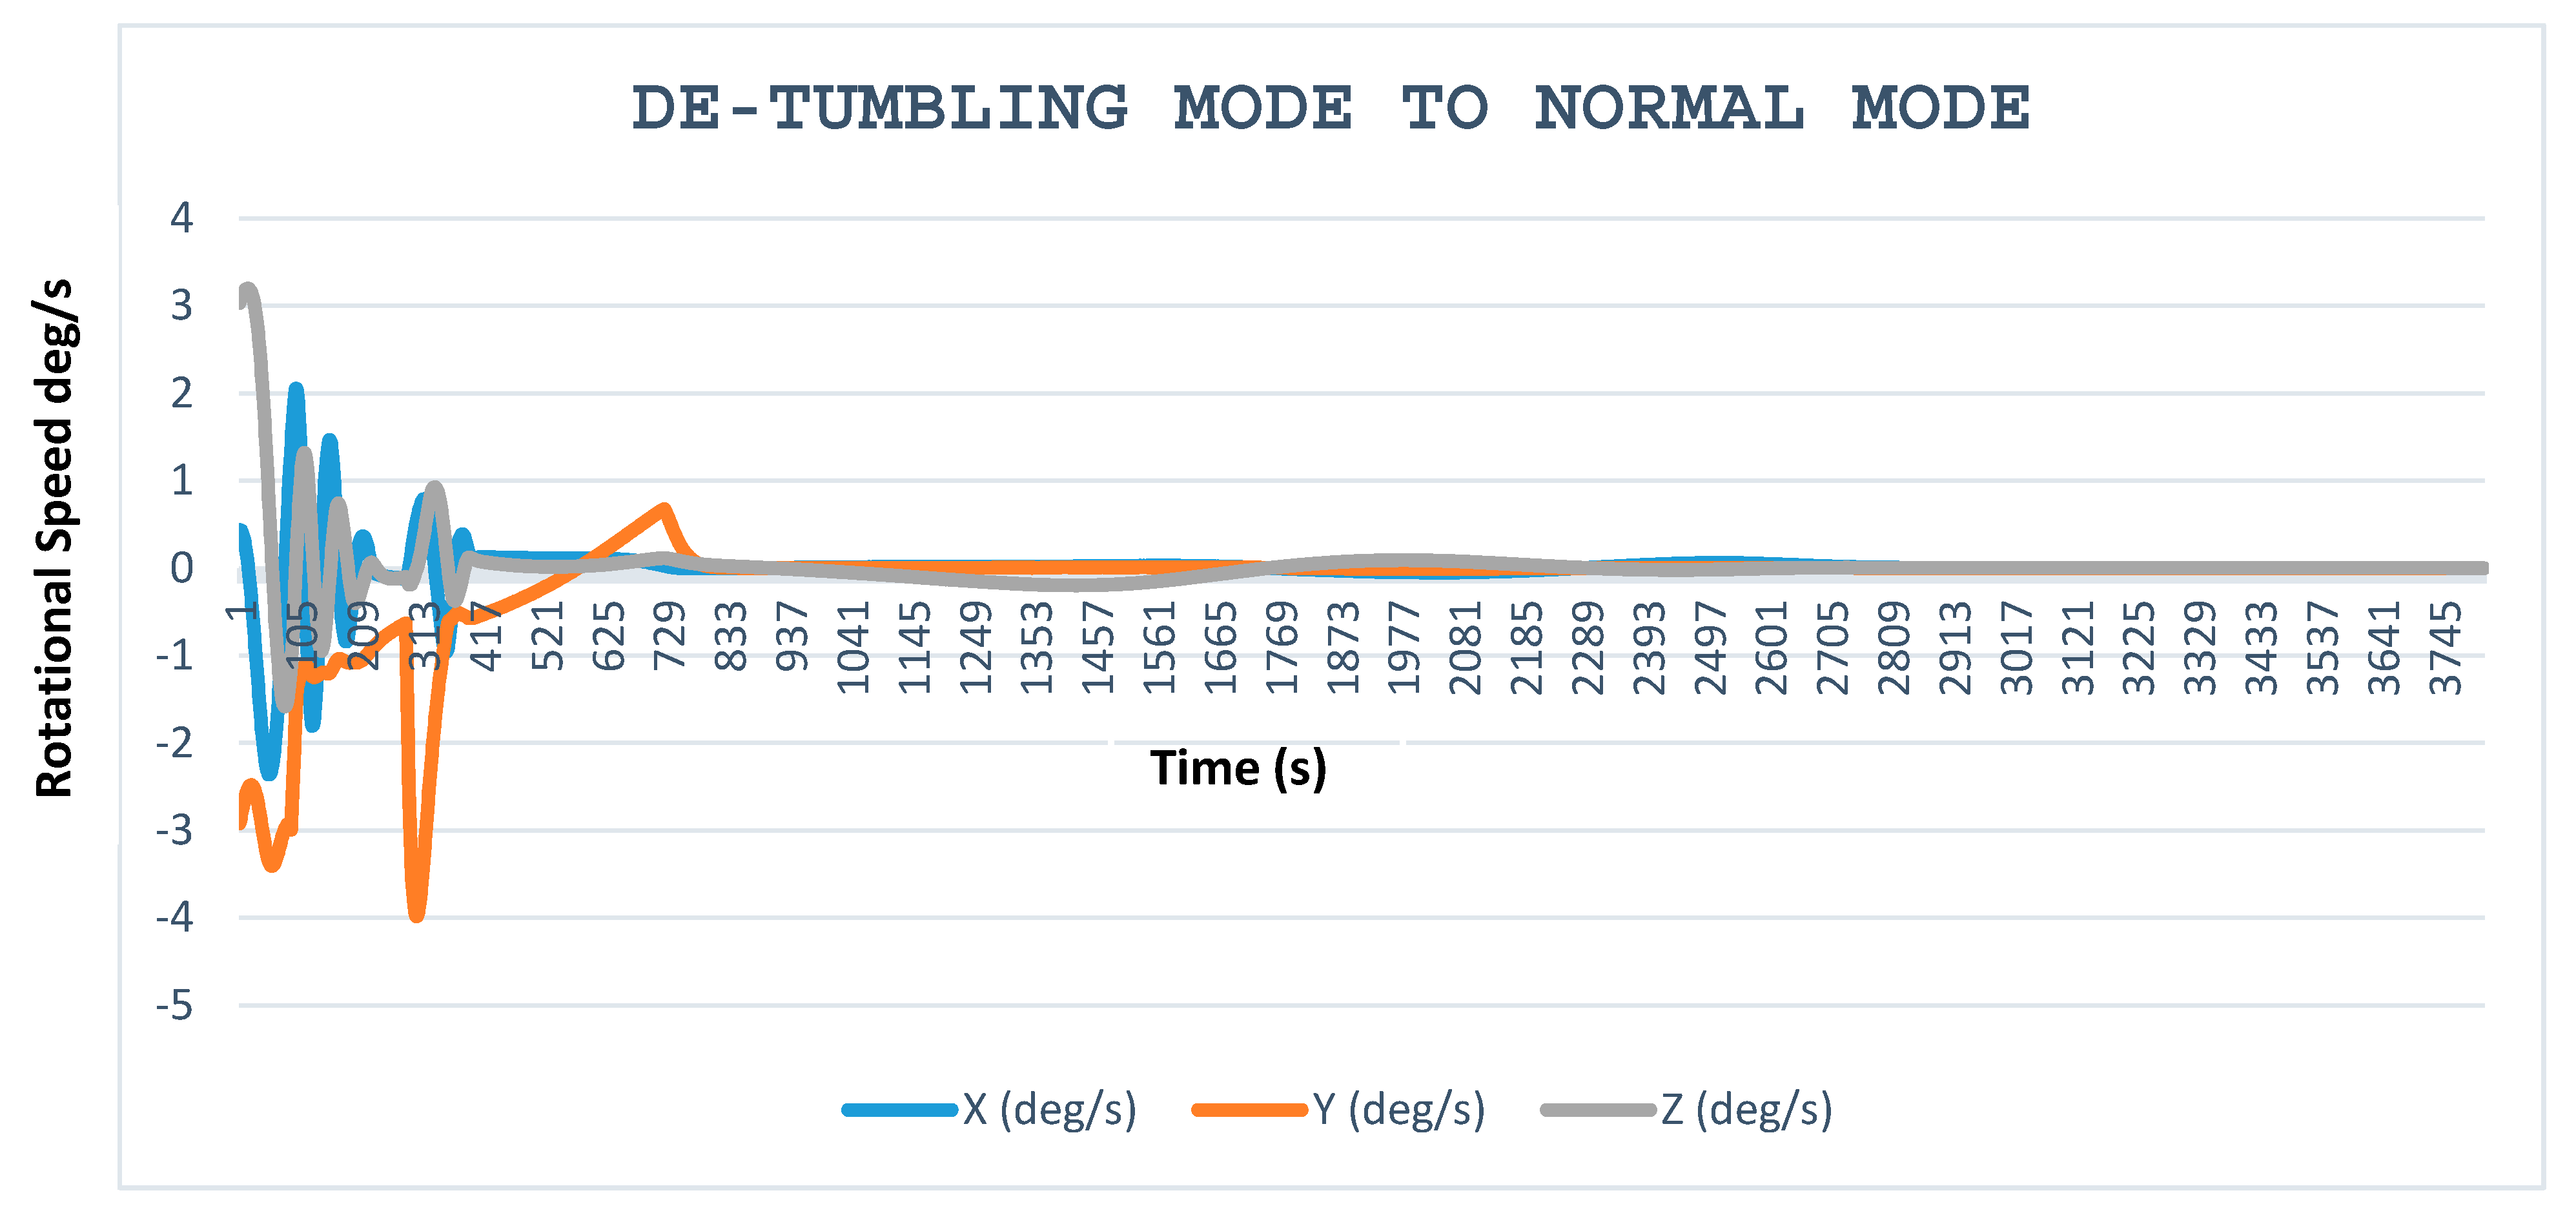
Figure 9 shows the complete set of ADCS modes for MeznSat. Due to the injection from the deployer, it is expected that MeznSat would experience rotation rate up to 10 deg/s. “No Control Mode,” where the ADCS does not perform active control, as per the CubeSat specifications document [
11], which states that no operations need to be performed by the satellite for the first 30 min after deployment. Next, MeznSat will be controlled to move into “De-tumble/Attitude Acquisition Mode.” The purpose of this mode is to reduce the rotation rate of MeznSat from 10 deg/s (worst case) to a slower angular rate of <3 deg/s. This will be followed by magnetometer deployment when ground contact with MeznSat has been established. As a result of the deployment, the Y-axis angular rate will increase. Y-Thomson Controller will reduce X-axis and Z-axis angular rate and control Y-axis angular rate to reach <1 deg/s. During payload operation, XYZ-reaction wheel mode will be operational leading to decreasing the angular rate to <0.03 deg/s.
Changes between one mode to another are done autonomously (no ground intervention needed, except the magnetometer deployment and Y-Thomson spin). Exceptions are made for the satellite to recover from “Safe Mode” to any other mode depending on the satellite’s angular rate only when the satellite receives commands from the ground station.
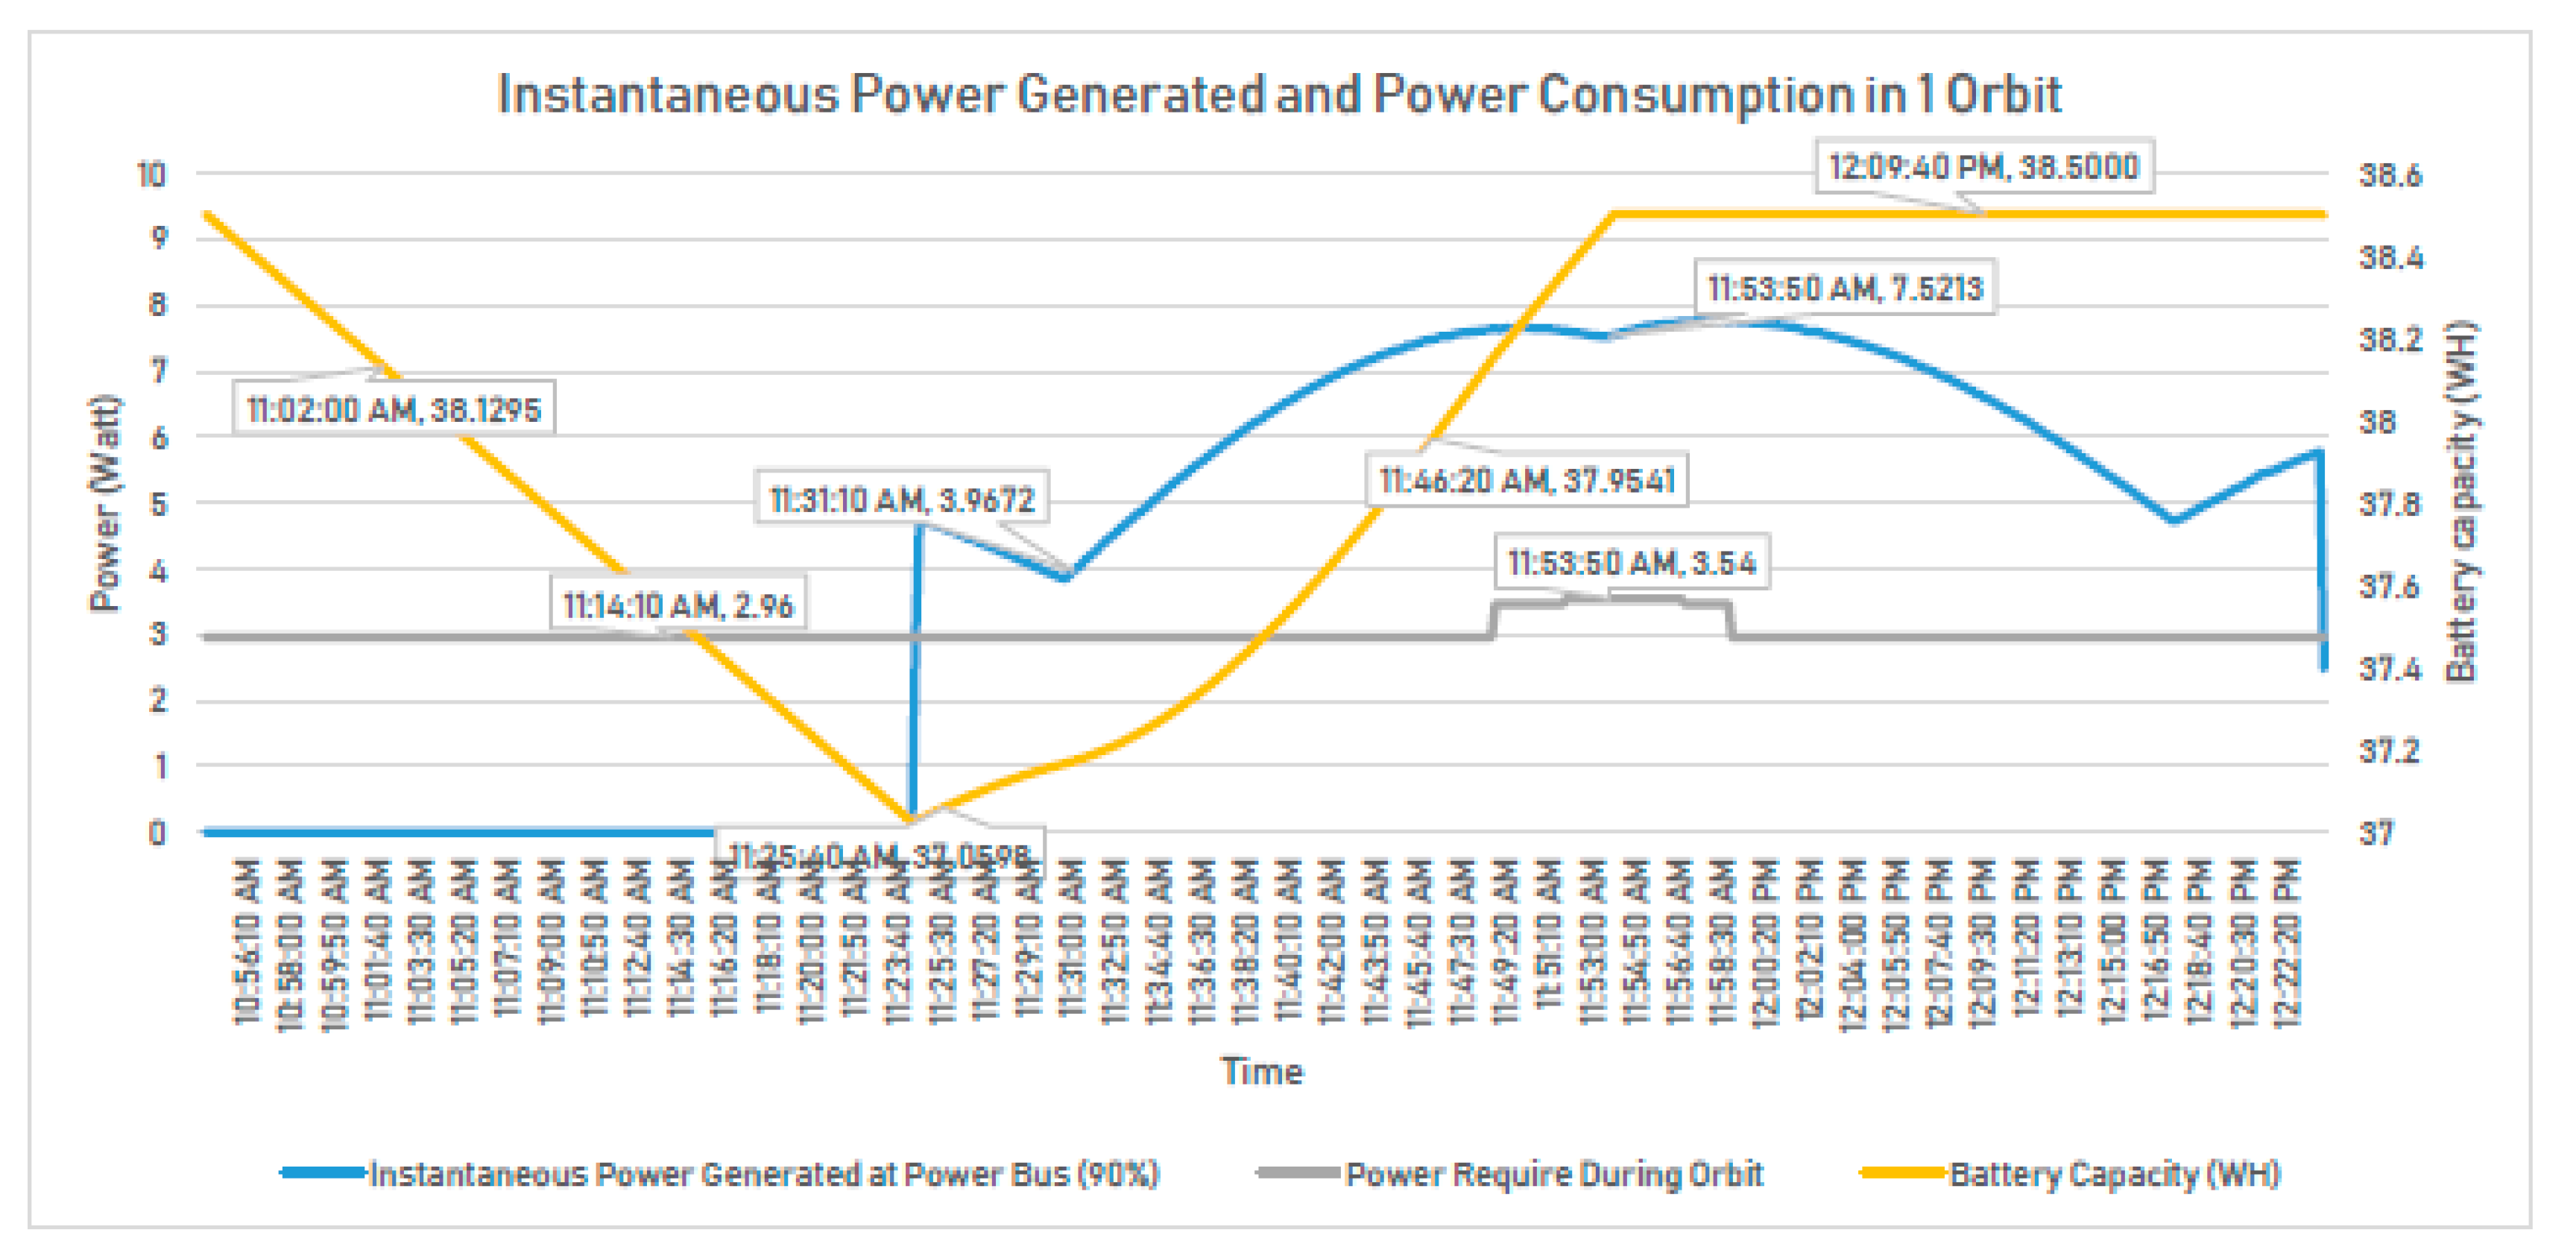
3.4. Electrical Power Subsystem (EPS)
The EPS provides electrical power to the spacecraft’s different subsystems such that the satellite can function during the entire length of the mission. The power system will consist of three main components: the solar panels, the battery, and the power distribution system. Several options were considered for the solar panel configuration. The two most significant approaches suggested are the fixed solar panel configuration and the side deployable solar panel configuration. While the side deployable solar panel configuration appears to be appealing given the significantly higher power generation compared to the fixed solar panel configuration, power budget estimates (typical 6.24 Whr and maximum 7.33 Whr) suggest that the fixed solar panel configuration will provide the required power necessary. A total of 22 solar cells are used to generate the satellite’s power with the solar cell distribution around the structure being as shown in
Figure 10. The power system is also equipped with a Li-Ion battery pack with a density of 38.4 Whr. The EPS can perform the Li-Ion battery charging without interrupting the payload operation.
3.5. Command and Data Handling System (CDHS)
The CDHS is responsible for running the flight software and with handling all data on-board the satellite. The central component of the CDHS is the on-board computer (OBC) which is based on a 400 MHz ARM9 processor with 64 MB RAM, 1 MB NOR flash for code storage, 256 KB FRAM for critical storage and two 2 GB microSD cards. I2C is used as the primary bus for the spacecraft bus, and UART is used for data handling between the OBC and the payloads.
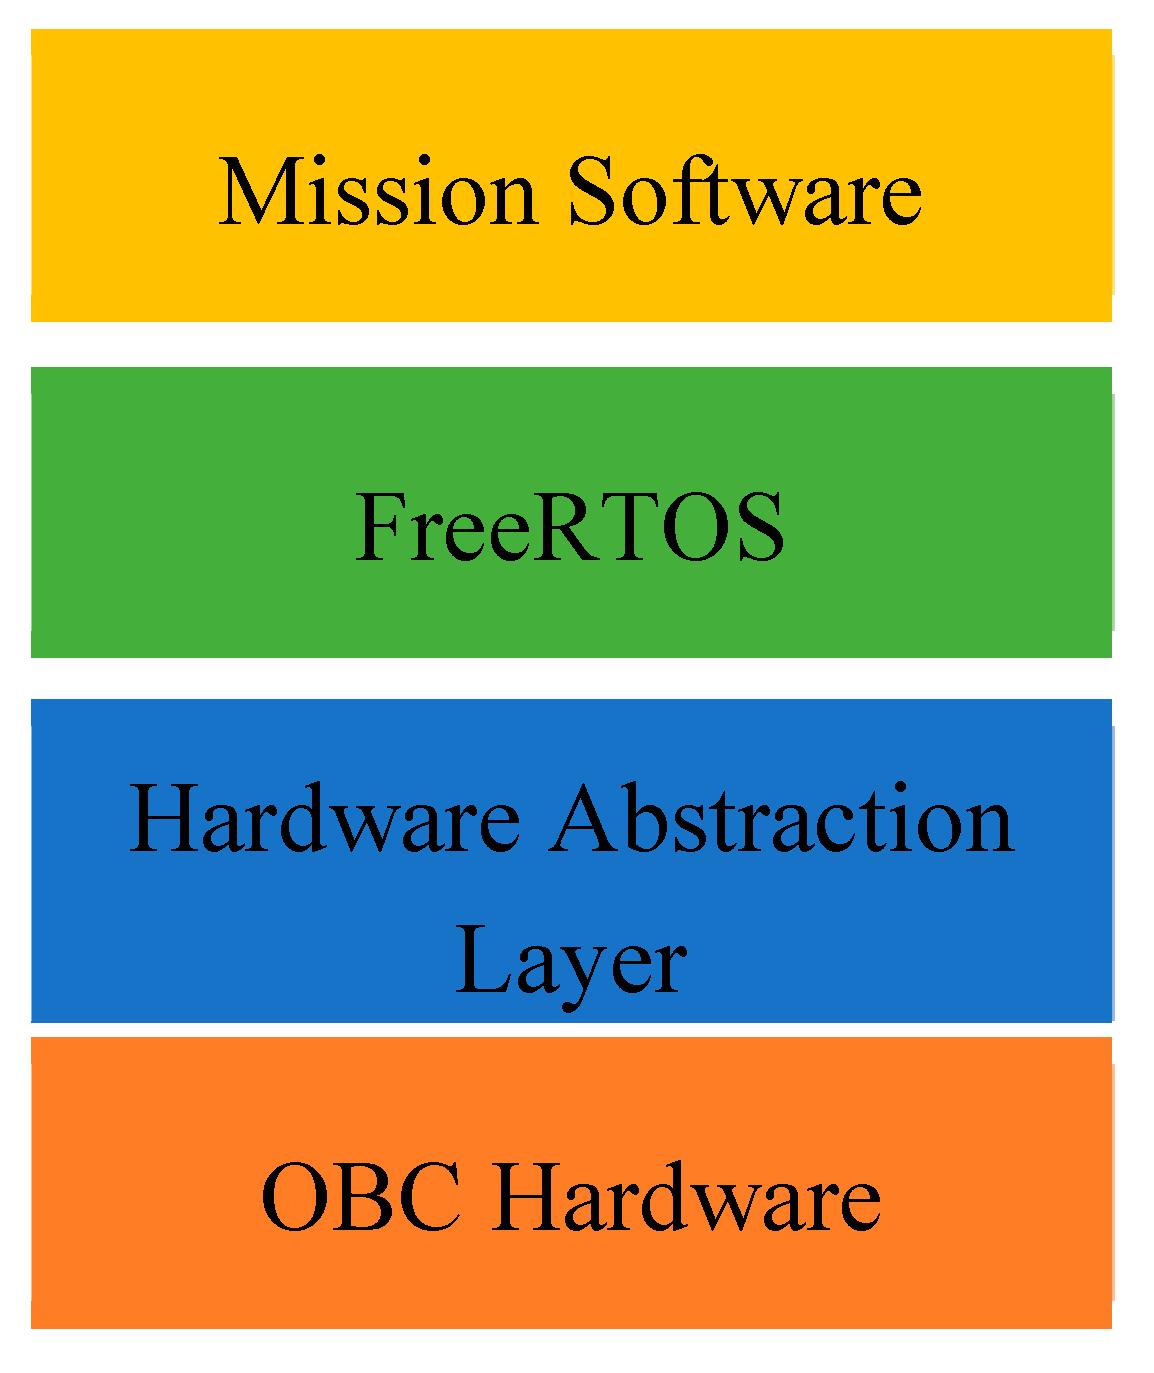
3.6. Flight Software
The satellite flight operating software consists of several layers, as shown in
Figure 11. On the very top of the hierarchy is the Mission Software, which executes MeznSats mission-specific. FreeRTOS [
19] has been selected as the main operating system for the mission due to its lightweight, real-time performance and ease of use. The Hardware Abstraction Layer including (HAL) include all of the hardware-specific drivers and also includes a fail-safe FAT32 file system.
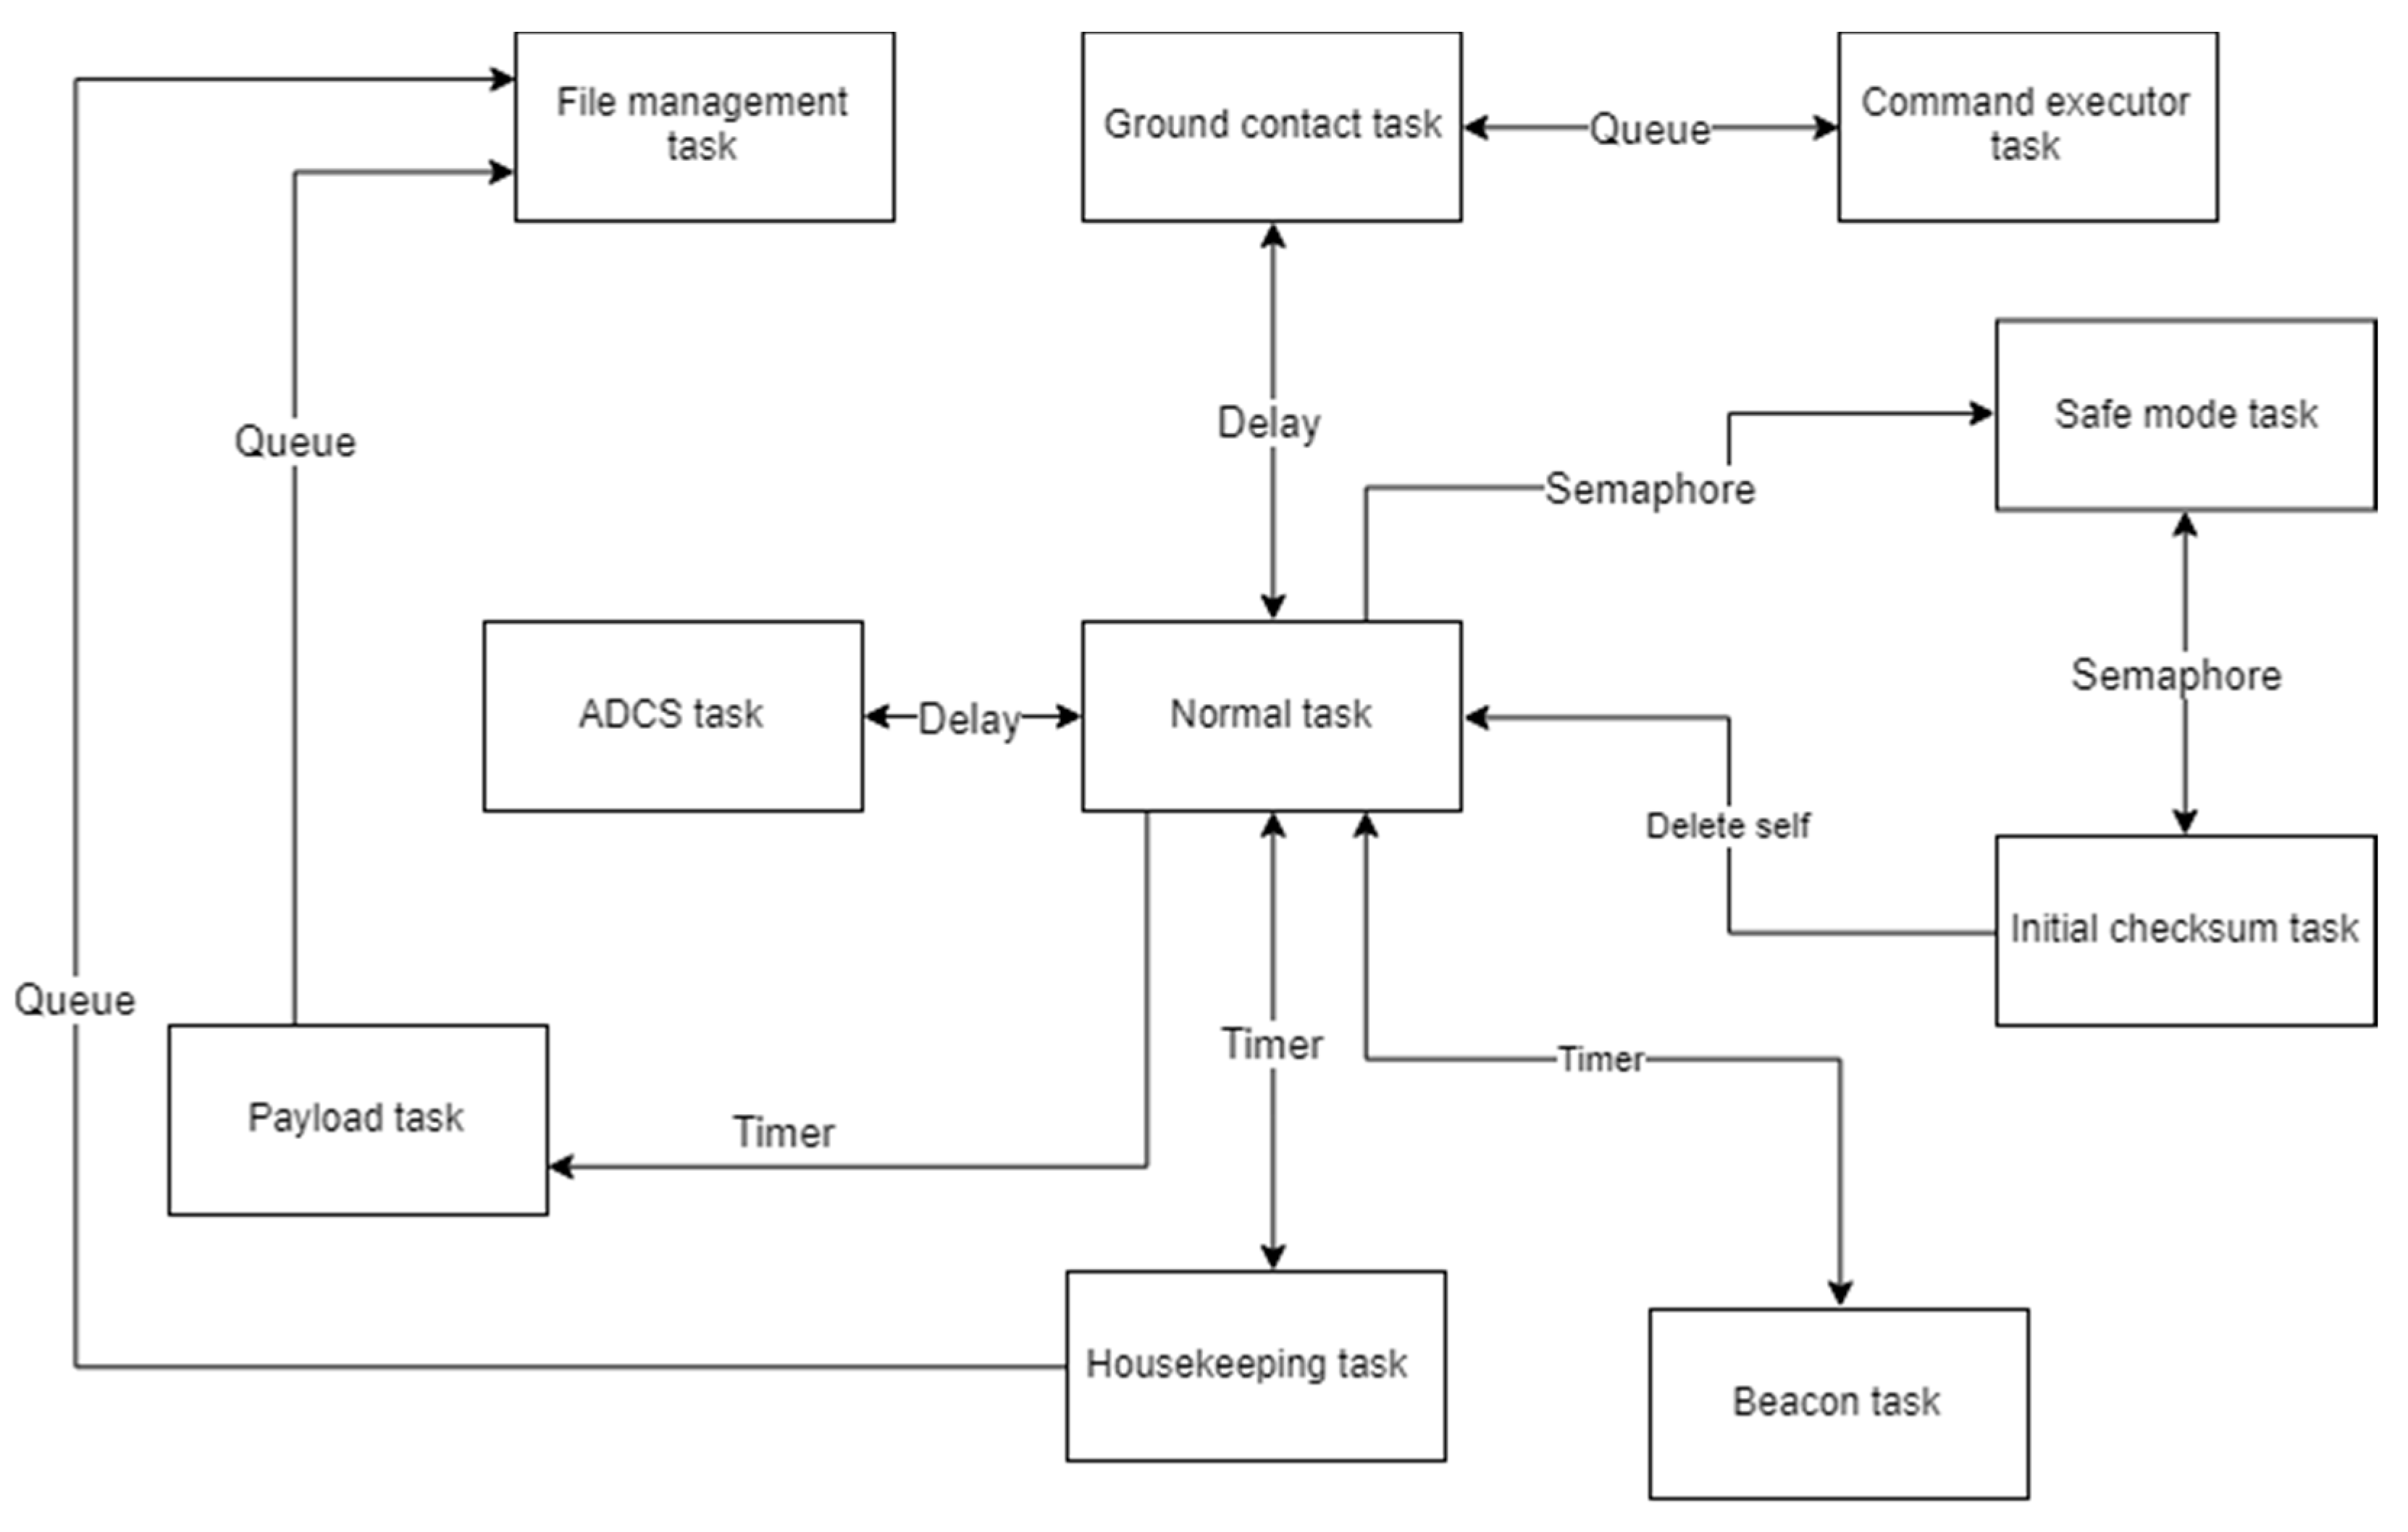
The software tasks in MeznSat have been categorized into four different classes:
- (1)
Tasks that run periodically: Include tasks that need to collect data from subsystems every number of minutes. These tasks include the Housekeeping collection task and the beacon transmission task
- (2)
Tasks that run based on a temporal value: Include tasks that need to run at a specific time. Temporal tasks include the ground contact task and the payload operation task.
- (3)
Tasks that run indefinitely: Tasks that are chosen to enter the running state because their delay is over, and they are the highest priority task within the ready pool of tasks. These tasks include the ADCS task and the normal mode task.
- (4)
Tasks that wait for events to happen: include tasks that are waiting on a semaphore or for data to be available on a queue. These tasks include the file management task, the command execution task, the safe mode task, and the initial checksum task.
The overall architecture of MeznSat software is shown in
Figure 12.
3.7. Atmospheric/Surface State Retrieval Algorithm
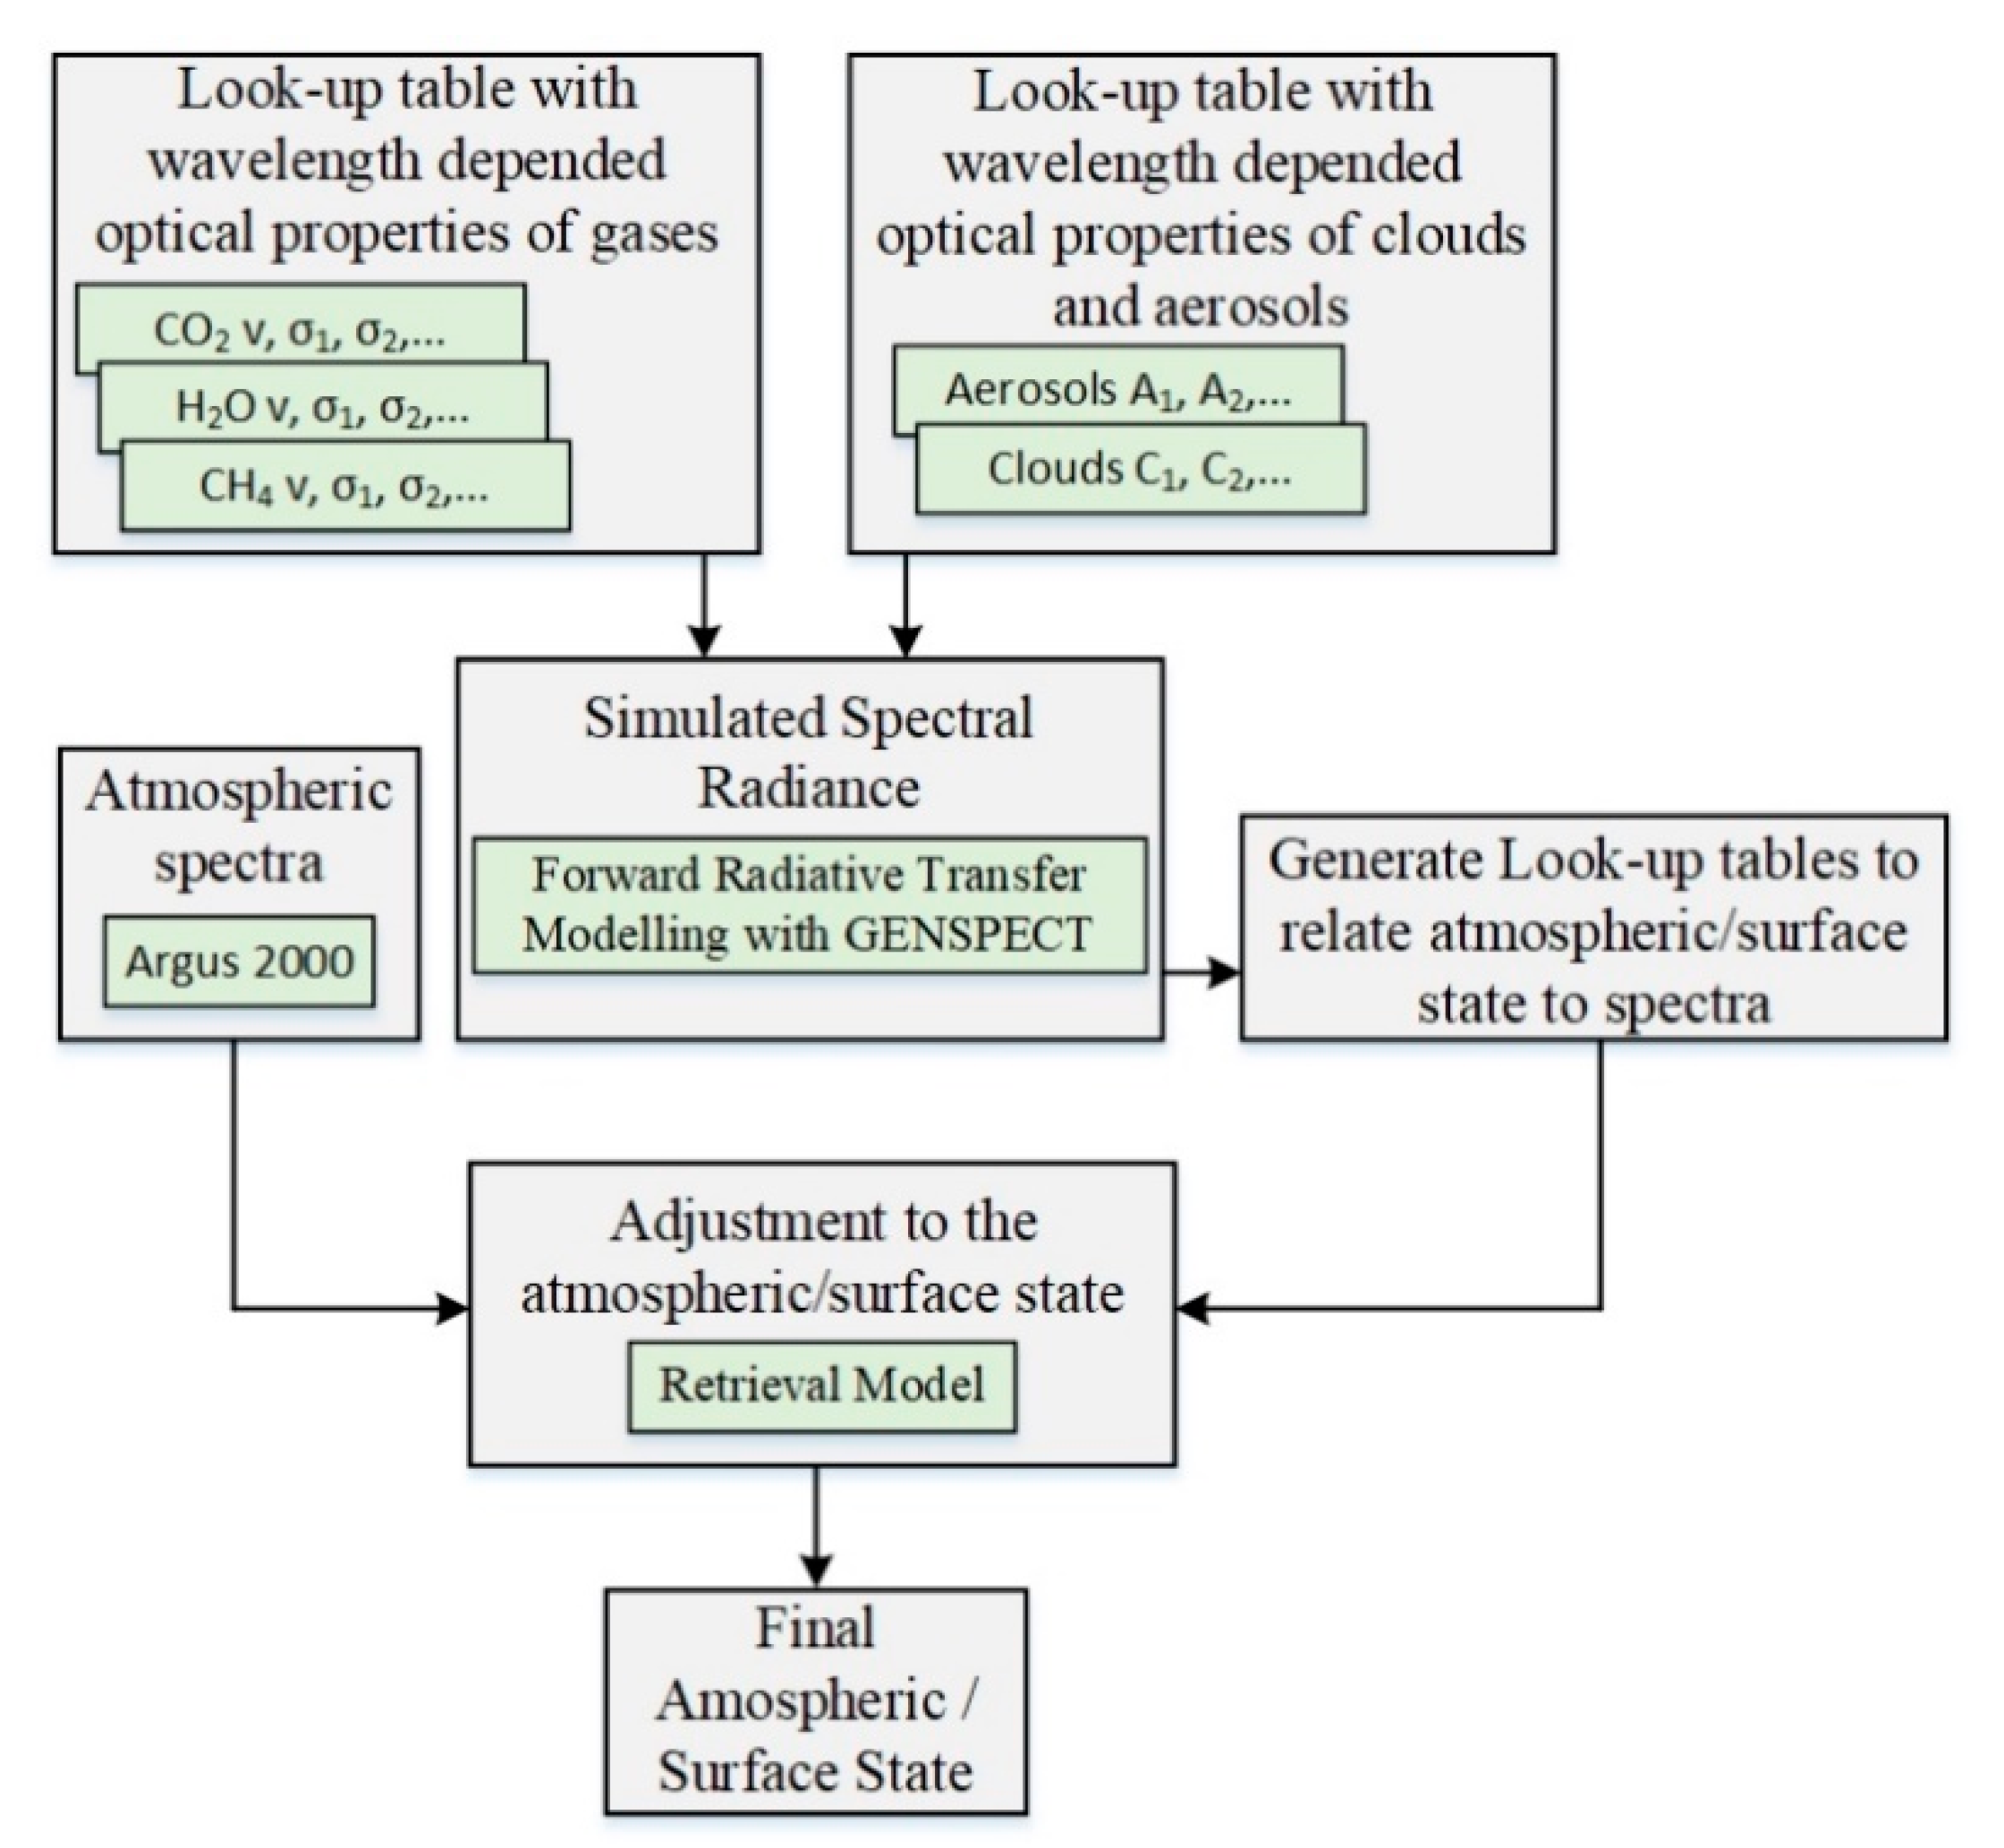
Observations from the Argus 2000 spectrometer constitute a single sounding covering a ground sampling distance of approximately 1.5 × 1.5 km from a 550 km altitude. Each sounding will be analyzed with a retrieval algorithm, which will fit the measured spectra by adjusting the unknown atmospheric, surface, and instrumental parameters. The retrieval consists of two parts: a forward model and a statistical comparison method [
20]. The forward model is an approximate scheme to describe radiative transfer in the atmosphere, reflection by the surface, and the effects of the instrument on the incident radiation to generate detailed lookup tables [
20]. Forward modeling will be performed using GENSPECT [
21] software. GENSPECT is a radiative transfer modeling tool developed for CANX-2 mission.
The principal characteristics and flow of the retrieval algorithm are presented schematically in
Figure 13. The initial step of the retrieval process begins by inputting an assumed environmental state that is defined by the surface pressure, surface reflectance, vertical temperature profile, mixing ratios of primary gases, water vapor, and other trace gases, in addition to cloud and aerosol optical depth distributions [
20]. These parameters can be initialized from known climatology and additional satellite data products e.g., MODIS for surface reflectance, cloud, and aerosol optical distribution. This information is combined with pre-tabulated, wavelength-dependent gas, aerosol, and cloud optical properties. The gas absorption cross-sections for the spectral range are derived and tabulated using GENSPECT and spectral line databases such as HITRAN [
22]. The synthetic spectra are then processed with a solar model and a model that simulates the instrument’s spectral response to the incident radiation and produces results that can be compared directly to the calibrated spectra [
20].
The comparison model compares the synthetic radiance spectra to the observations and uses an optimal estimation technique and produces a match to the measured spectra in the spectral range [
20]. Finally, the atmospheric composition is derived from the best-match atmospheric state validated statistically.
To validate the results, data provided by the Total Carbon Column Observing Network (TCCON) [
23] will be used. The satellite will acquire the data over the stations and the corresponding ground data acquired within ±30 min of satellite overpass time will be considered for comparison as in [
24]. A portable SWIR spectrometer will also be used to accurately measure spectral characteristics of surface and downwelling radiation at a spectrally homogenous desert site in the UAE using systematic sampling to match the GSD. This data will be used to validate the instrument performance and for recalibration if needed.
5. Conclusions
MeznSat is a 3U CubeSat that uniquely combines a SWIR spectrometer with an RGB camera for monitoring the level of GHG in the atmosphere. MeznSat payload is a SWIR spectrometer that will be operating in conjunction with an RGB camera to achieve high geolocation accuracy. Simulations show that the three-year mission will achieve 46% payload footprint coverage that can be leveraged using attitude maneuvering. The paper shows that the minimum possible platform to fulfill the missions’ goals is a 3U platform given the current technology status for the various subsystems.
Available platform volume is the primary limitation found for the mission. It was a struggle to achieve an optimum design for the internal satellite configuration, given the dimensions of the various components, particularly the payloads and the ADCS. The mass budget shows a significant mass margin, and the power analysis shows a healthy power profile that is capable of handling additional pressure on the power system.
The small FOV of the spectrometer derives a requirement for an accurate ADCS system, requiring reaction wheels for actuation and sun sensors, star tracker and magnetometer for sensing, aiming for pointing accuracy of 1 degree. Simulations of the ADCS system shows appropriate performance that meets the stringent mission requirements.
Overall, the analysis presented in the paper included mass, volume, power, lifetime, payload coverage and pointing accuracy shows a feasible mission that uniquely combines SWIR payload with an RGB camera in a compact 3U platform. MeznSat is planned for launch in March 2020 into an orbit of 550 km.


 ,
, 


