Article

Impact of Energy Dependence on Ground Level and Avionic SEE Rate Prediction When Applying Standard Test Procedures

by
Matteo Cecchetto
1,2,*,
Rubén García Alía
1 and
Frédéric Wrobel
2
1
Engineering department, European Organization for Nuclear Research (CERN), 1211 Geneva, Switzerland
2
Institut d’Électronique et des Systèmes (IES), University of Montpellier, 34090 Montpellier, France
*
Author to whom correspondence should be addressed.
Aerospace 2019, 6(11), 119; https://doi.org/10.3390/aerospace6110119
Submission received: 24 August 2019 / Revised: 22 October 2019 / Accepted: 28 October 2019 / Published: 1 November 2019
(This article belongs to the Special Issue Single Event Effect Prediction in Avionics)

Abstract

:
Single event effects (SEEs) in ground level and avionic applications are mainly induced by neutrons and protons, of which the relative contribution of the latter is larger with increasing altitude. Currently, there are two main applicable standards—JEDEC JESD89A for ground level and IEC 62396 for avionics—that address the procedure for testing and qualifying electronics for these environments. In this work, we extracted terrestrial spectra at different altitudes from simulations and compared them with data available from the standards. Second, we computed the SEE rate using different approaches for three static random access memory (SRAM) types, which present a strong SEE response dependence with energy. Due to the presence of tungsten, a fissile material when interacting with high energy hadrons, the neutron and proton SEE cross sections do not saturate after 200 MeV, but still increase up to several GeV. For these memories, we found standard procedures could underestimate the SEE rate by a factor of up to 4-even in ground level applications—and up to 12 times at 12 km. Moreover, for such memories, the contribution from high energy protons is able to play a significant role, comparable to that of neutrons, even at commercial flight altitudes, and greater at higher altitudes.

1. Introduction

The atmosphere radiation environment relevant to single event effects (SEEs) is composed of neutrons, protons and pions. They are generated from the interaction of galactic cosmic rays, which are 83% protons, 16% alpha particles and 1% heavy ions [1], with the atmosphere’s atoms, which are nitrogen (78%) and oxygen (21%). For every cosmic ray, showers of particles are created, which in turn generate other cascades resulting in a complex radiation environment, mainly composed of neutrons. Therefore, neutrons are the primary source of SEEs in electronics, as they indirectly ionize the atoms inside the device, which can trigger errors such as single event upset (SEU) or single event latch-up (SEL). Both are investigated in this paper. Fluxes for the SEE estimation are generally considered above 10 MeV, as the SEE cross sections of most electronics are sensitive above this threshold. However, with technology scaling and for sizes below 150 nm, more and more devices are sensitive to intermediate energy neutrons, even above 1 MeV [2,3] and therefore the 10 MeV limit for flux and component characterization may need to be shifted down to 1 MeV [4]. According to Reference [1], a neutron flux above 10 MeV at ground level (New York City) results in 20 neutrons/(cm2/h), 300 times lower than that at 12 km, although it is reported as 450 times lower (13 neutrons/(cm2/h)) in Reference [5]. The altitude plays a fundamental role in terms of fluxes and particle composition. The highest neutron flux is at around 18.3 km, called the Pfotzer maximum. In addition to neutrons, protons present a similar high energy spectrum and are capable of inducing SEE. Their fluxes are lower than that of neutrons at ground level and increase with altitude, showing the Pfotzer maximum at around 16.8 km. The proton flux in the atmosphere is about 20–30% of the neutron flux up to 400 MeV, while they are comparable at higher energies [1]. These conclusions come from measurements performed at around 3–4 km altitudes. Furthermore, at an altitude of 12 km, neutrons are the dominant particle, inducing 70 % of SEEs, while at 30 km their proportion is less than 50%. This is because above 18.3 km the contribution from heavy ions begins to be relevant [1]. Moreover, low-energy protons (i.e., in the several MeV range), although not treated in this work, are capable of inducing soft errors through direct ionization in 90 nm technology and below [6]. Similarly, muons, though not capable of inducing SEEs through indirect ionization due to their leptonic nature, are also capable of inducing SEUs through direct ionization in highly integrated technologies [7].
Latitude is another important parameter affecting the interaction of cosmic rays with the atmosphere, and is related to the earth’s magnetic field. At the poles, where the magnetic field is parallel to the particle direction, cosmic rays can easily penetrate the atmosphere, whereas at the equator the former is perpendicular to the latter and thus the interactions are reduced.
In the following, different standard test procedures for the qualifications of electronics are summarized, showing their advantages, disadvantages and limitations which may lead to an underestimation of the SEE rate. An additional method that overcomes these issues is presented. The environment overview is given in Section 3, showing the differences in neutron/proton spectra at varying altitude. Raw data were extracted through the Model for Atmospheric Ionizing Radiation Effects (MAIRE) [8], an online tool based on FLUKA simulations [9]. With these spectra, the SEE rate (SEU and SEL) in static random access memory (SRAM) was calculated by applying the different test procedures. These memories present a strong energy dependence due to the presence of tungsten inside their structure, which has also been demonstrated in other works [10,11]. We have found that the proton SEE contribution is comparable to that of neutrons, even at flight altitudes. Results from the different methods are then compared, showing that the SEE rate can be underestimated by the standards as the altitude increases (up to a factor of 12 at 12 km and up to 4 times at ground level).

2. SEE Qualification Approaches

Different procedures for SEE qualification of electronics can be distinguished and are described below. The standards for testing electronics for ground level applications are outlined in Reference [12], and for avionics in Reference [1,5].
  • Method 1 (M1): Spallation neutron source. The source provides a neutron spectrum over a wide energy range, from thermal up to high energy neutrons. Among the neutron sources, it has the closest shape to the atmospheric spectrum. Although energies in the atmospheric spectrum can be as high as 100 GeV, these facilities can normally provide energies only up to 1 GeV. However, the atmospheric flux at such high energies is several orders of magnitude lower than that at 100 MeV and therefore its impact is considered to be negligible. The SEU and SEL cross section measured in such facilities encompasses the information of a very wide spectrum in a single value. Thus, it is not possible to extract the energy contributions separately, such as the thermal neutron and high energy hadron (HEH) cross sections. The most well-known facilities are WNR in Los Alamos, TRIUMF in Vancouver and ChipIr in Didcot (UK).
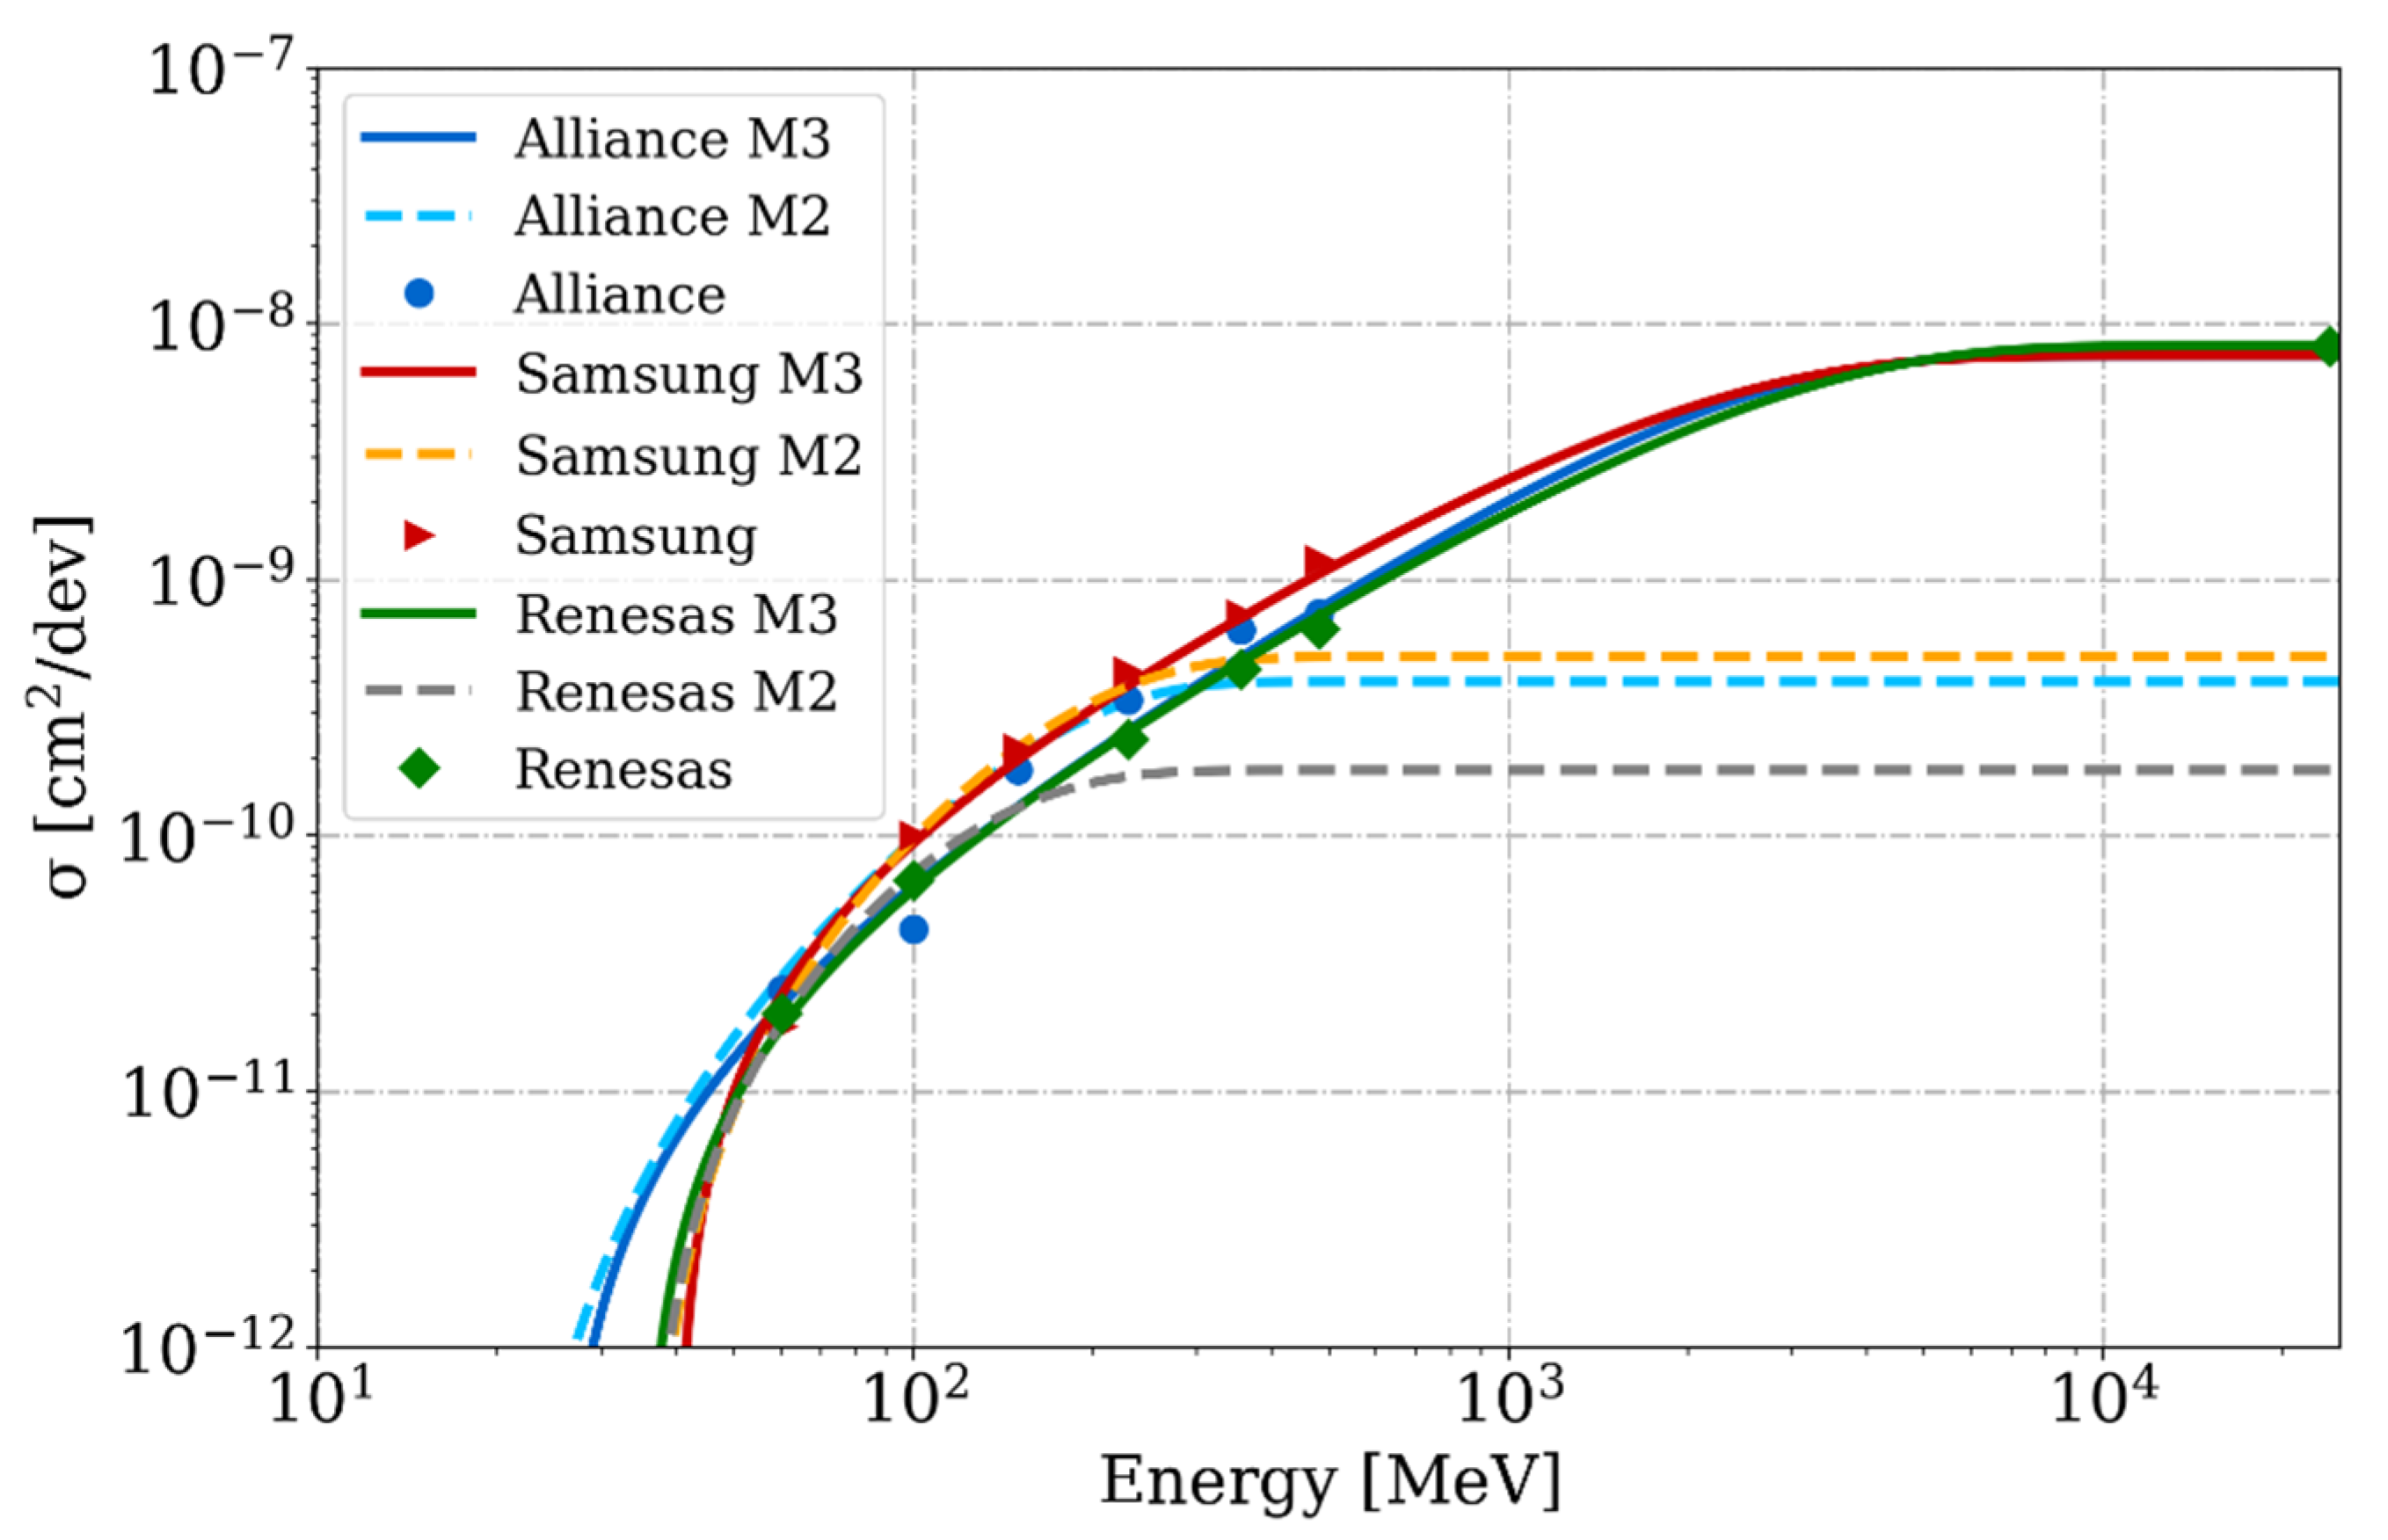
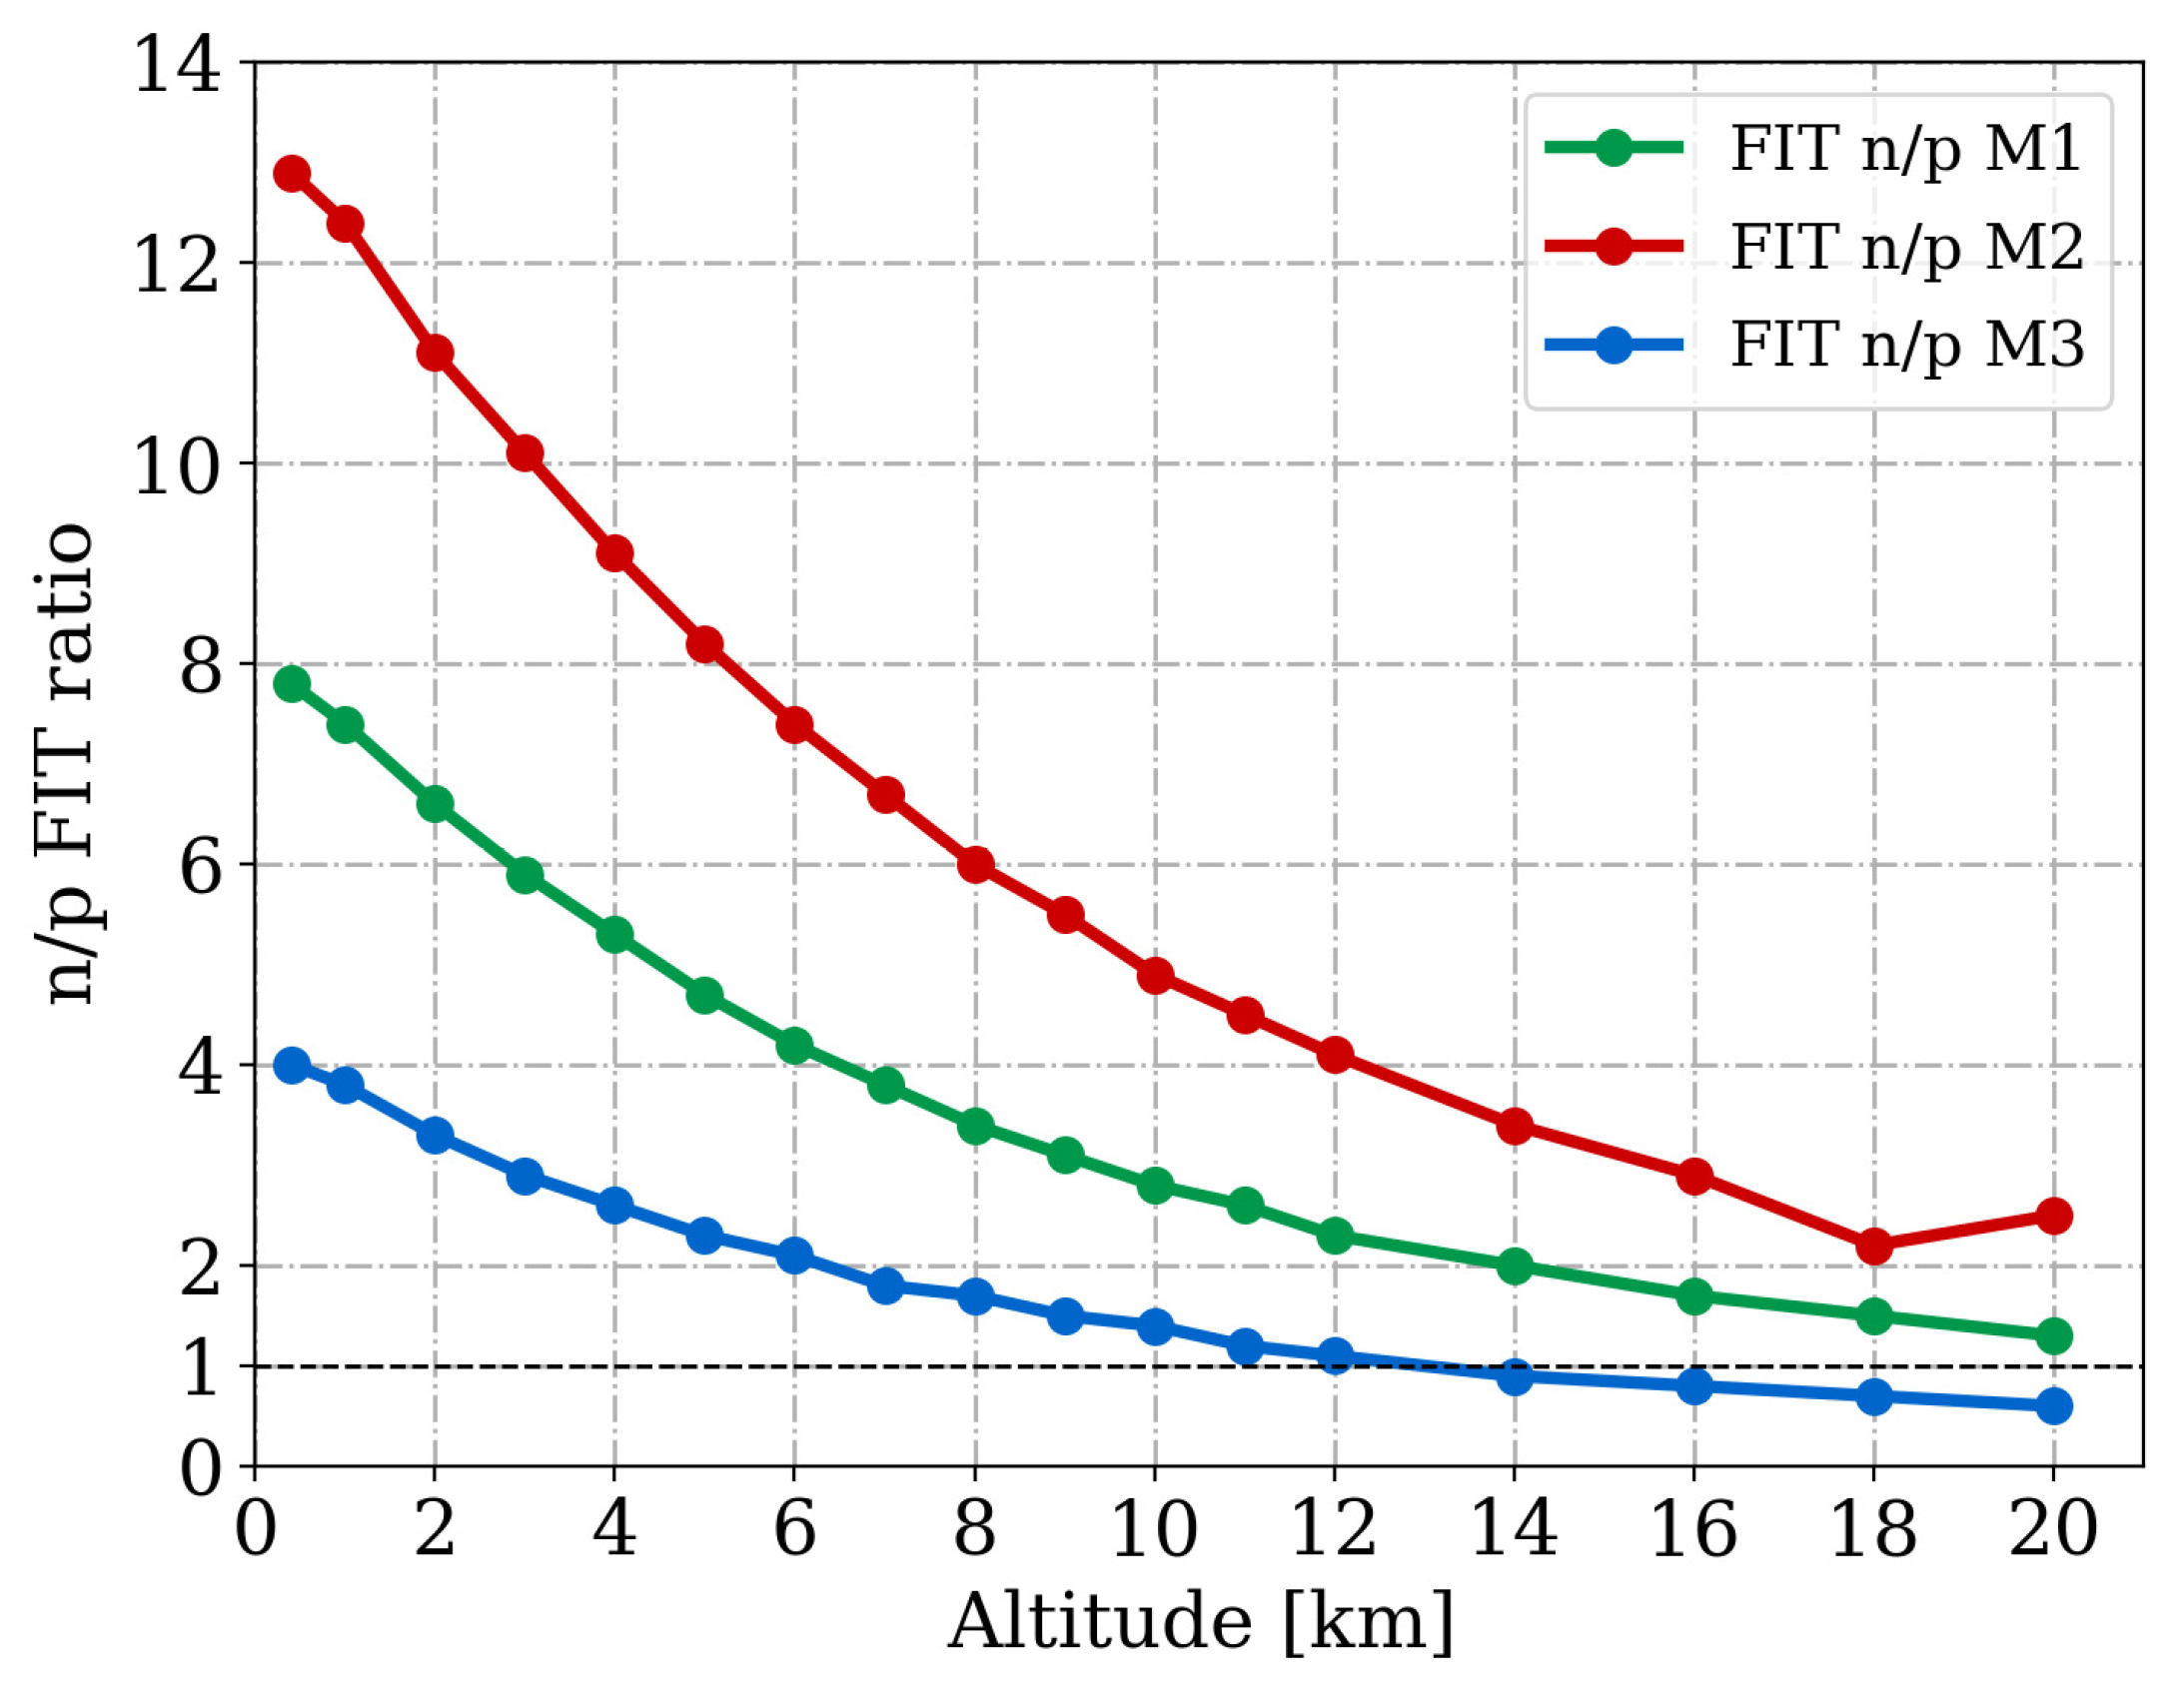
  • Method 2 (M2): Monoenergetic beams up to 200 MeV. The JEDEC standard [5] suggests performing the characterization with at least four different energies: 14, 50, 100 and 200 MeV. Then, from these experimental points, calculating the memory response through the Weibull fit. Tests with 14 MeV should be carried out with a neutron beam, whereas above 50 MeV both neutron and proton beams can be used, as their nuclear cross sections are similar. The SEE rate is calculated through the integral of the operational spectrum folded with the memory response, which is also valid for avionic applications [1].
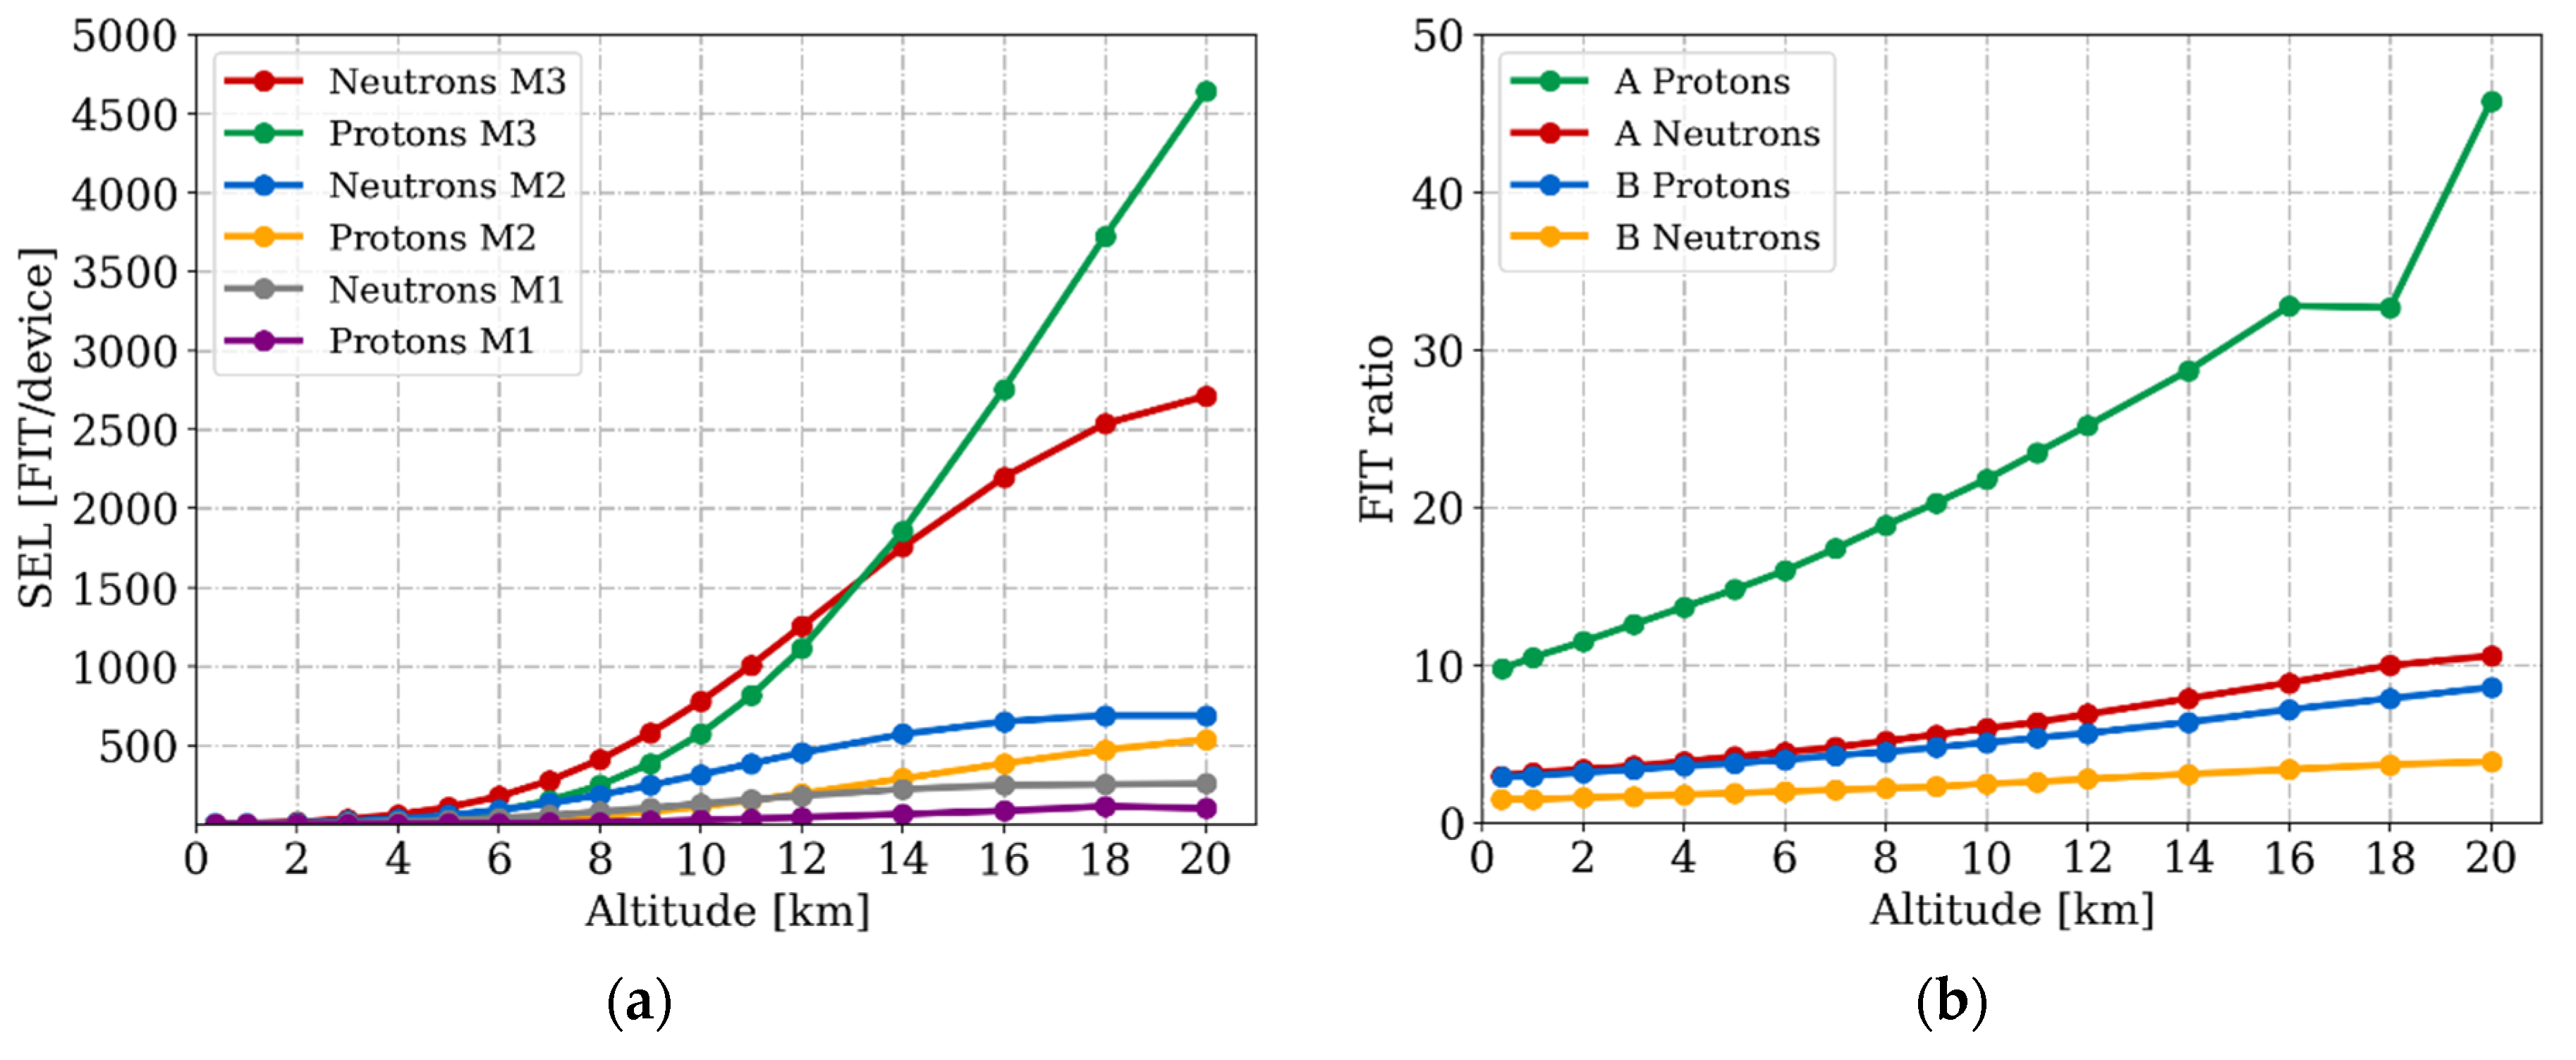
  • Method 3 (M3): Monoenergetic beams/simulations up to several GeV. This method is not outlined in the standards and it overcomes some limitations of M2. M2 makes the large assumption that the memory cross section is saturated after 200 MeV. However, as shown in References [13,14,15], some devices with a strong energy dependence—due to the presence of tungsten near the sensitive volume—show an increasing SEE cross section above 200 MeV, and up to several GeV before saturation. Therefore, the characterization should be performed up to GeV energies in order to assess the SEE impact from high energy particles in the atmosphere. Despite their fluxes being an order of magnitude lower than those around 100 MeV, the fact that the SEE cross section is still increasing after 200 MeV plays an important role, as will be detailed in this paper. Tests with such high energies can be performed for example in the CERN high energy accelerator mixed field facility (CHARM) at CERN, which provides a 24 GeV proton beam extracted from the Proton Synchrotron (PS). Otherwise, the memory cross section can be calculated through simulations with a FLUKA model. FLUKA is a Monte Carlo tool [9,16] for studying the interactions of particles and matter. The model is employed to calculate the deposited energy inside the memory’s sensitive volume needed to trigger an SEE, and it has been validated for protons [13] and neutrons [2]. It requires input of the following information:
    -The geometrical parameters of the memory structure.
    -The layers of materials, especially the amount of possible tungsten, which is the direct cause of the SEE cross section increase.
    -The experimental heavy ion SEE response of the component.
  • Other methods. In addition to the previous methods, the standards mention real time and quasi monoenergetic neutron measurements. The real time method consists of observing SEEs under nominal conditions without accelerated tests, but it is impractical since it would take years (or the testing of a vast number of components) to obtain meaningful statistics. The quasi monoenergetic neutron beam is characterized by a main peak at nominal energy and a tail at lower energies ranging over more than 100 MeV. The difficulty lies in distinguishing between the SEEs induced by the neutron peak and the tail [17]. Due to the aforementioned complications, these two methods were not taken into account in this work.
According to IEC1 for avionic applications, as in most practical cases the SEE cross sections as a function of energy are not known for applying M2, a simplified approach can be implemented. It consists of using a reference differential flux (from a Boeing model), considered at 12 km of altitude and 45° of geographic latitude, integrated above 10 MeV. This flux results in 5600 neutrons/(cm2/h), which is rounded to 6000 cm−2/h to include the effects of protons (therefore, the proton contribution is considered 6.7%). The flux is said to be conservative of a factor 2 compared to in flight measurements. The expected SEE rate for avionics is then calculated by multiplying this flux value by the memory SEE cross section, preferably characterized with a white neutron spectrum (M1) or mono energetic beams (M2), in the case of technologies above 150 nm. It is also acceptable to consider the cross section measured at the highest test energy (200 MeV) since the SEE rate will be conservative [5]. If the feature size is below 150 nm, the contribution of neutrons between 1–10 MeV should also be included using a flux of 9200 neutrons/cm2/h. It is worth noting that this simplified approach for avionics is very similar to that used in accelerator environments, which consists of multiply the 200 MeV SEE cross section by the HEH flux of interest [2,18].

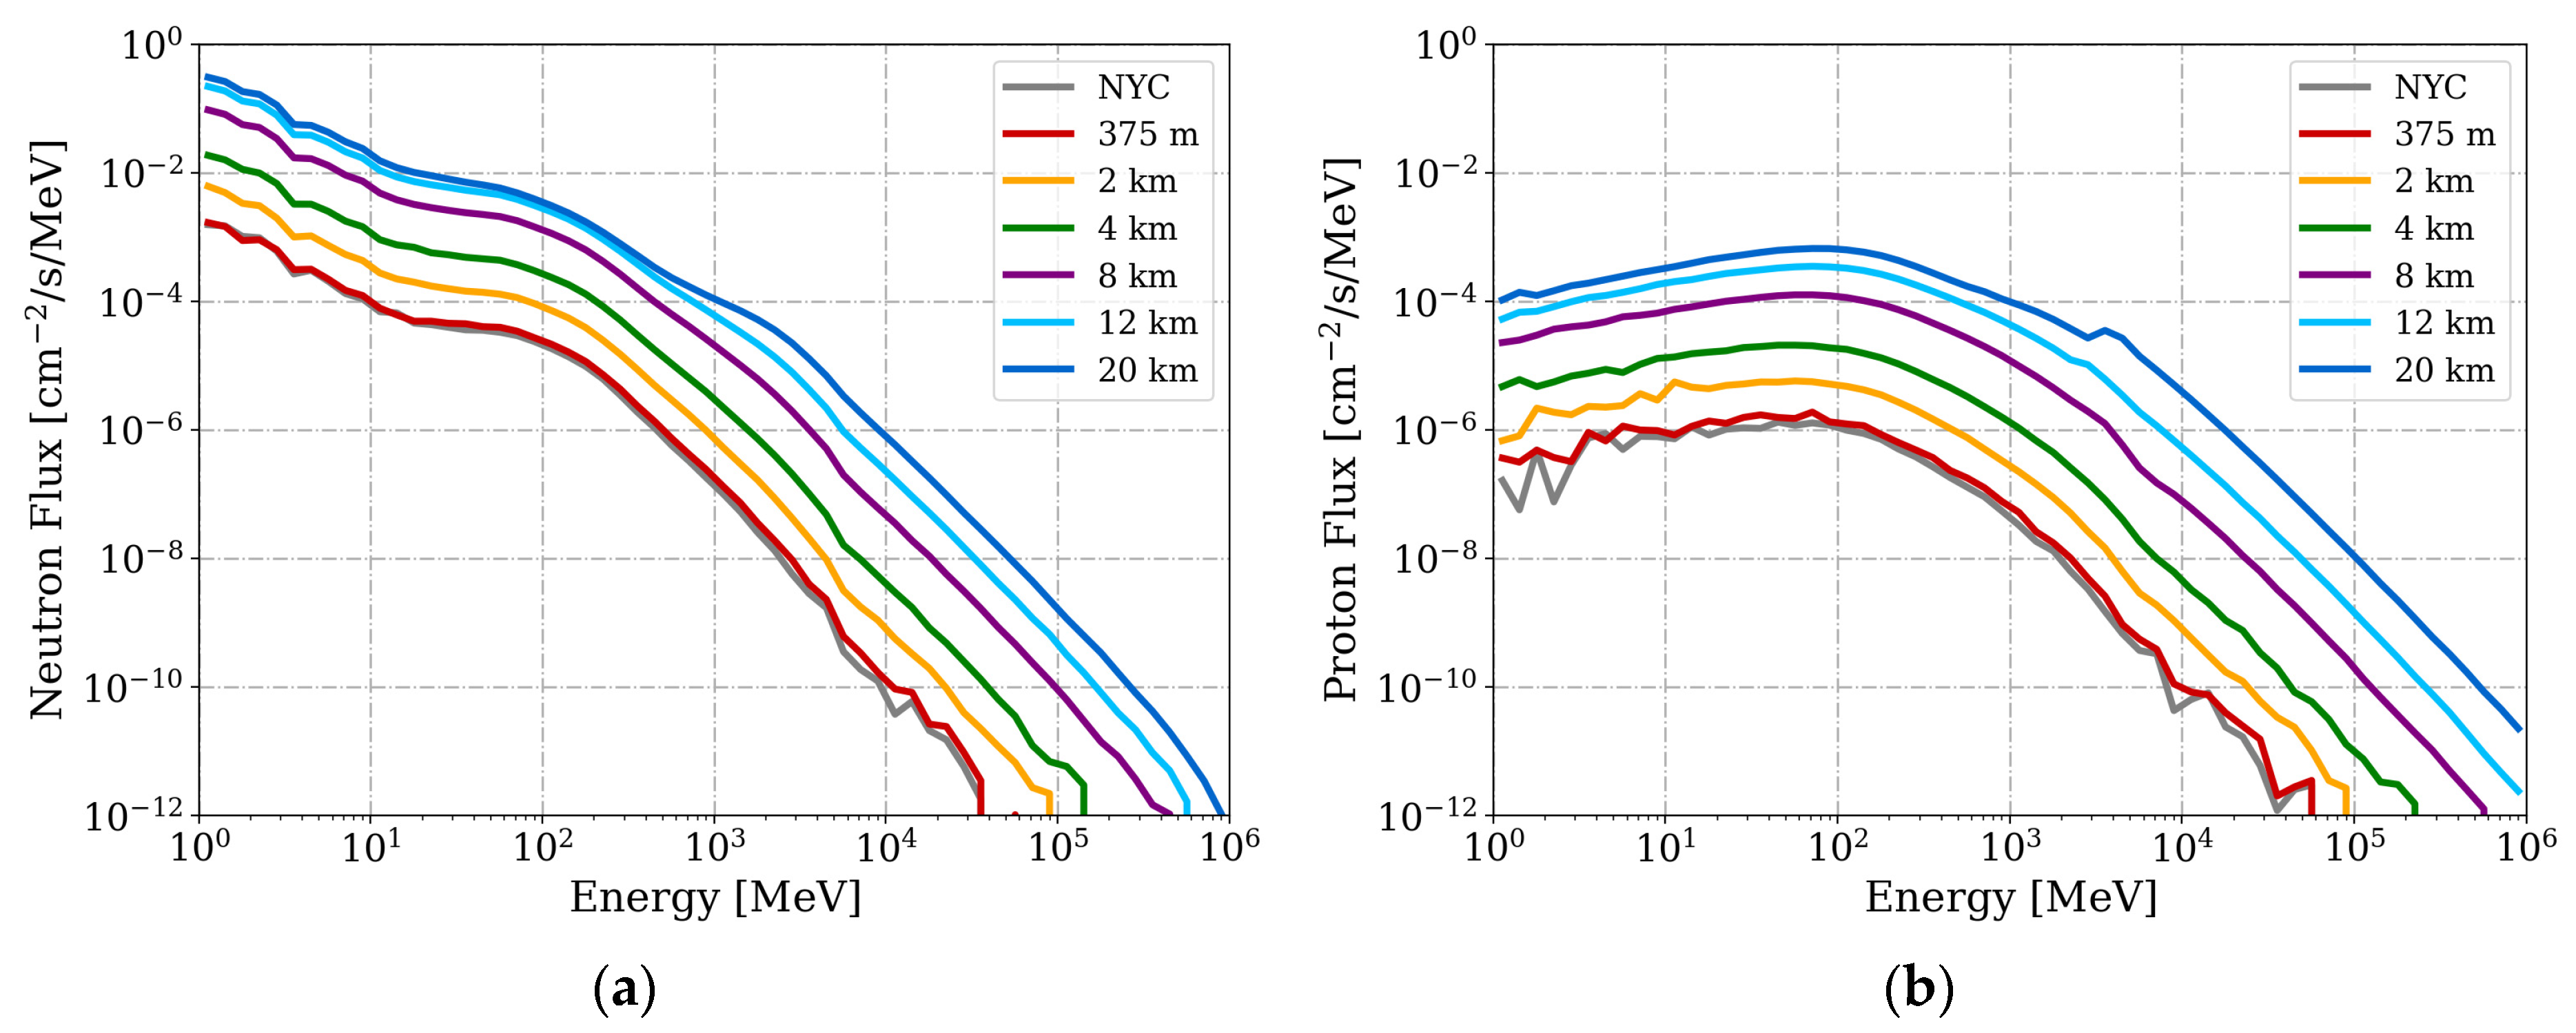
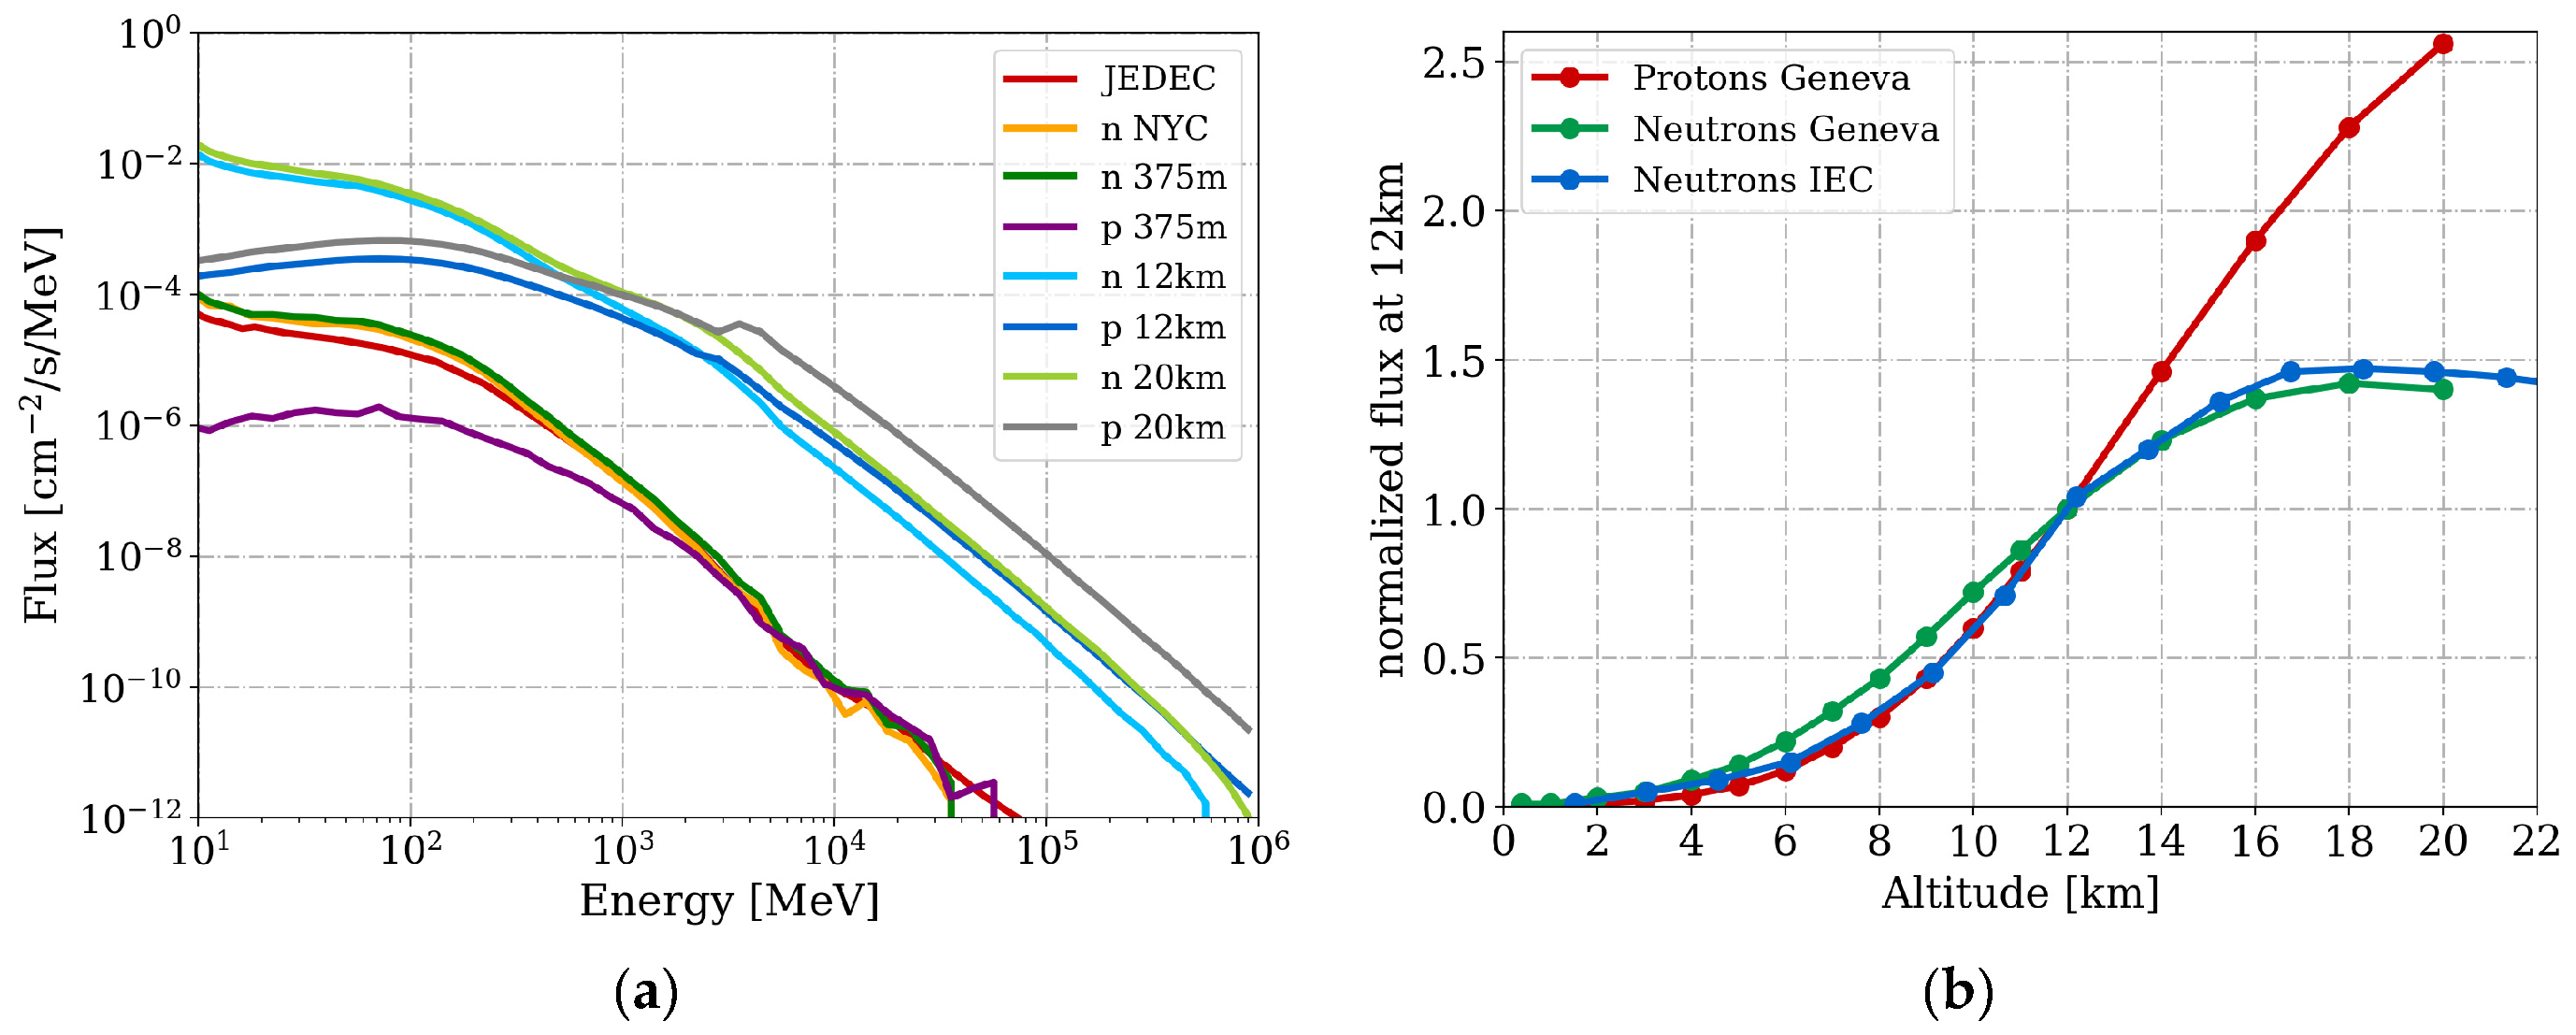
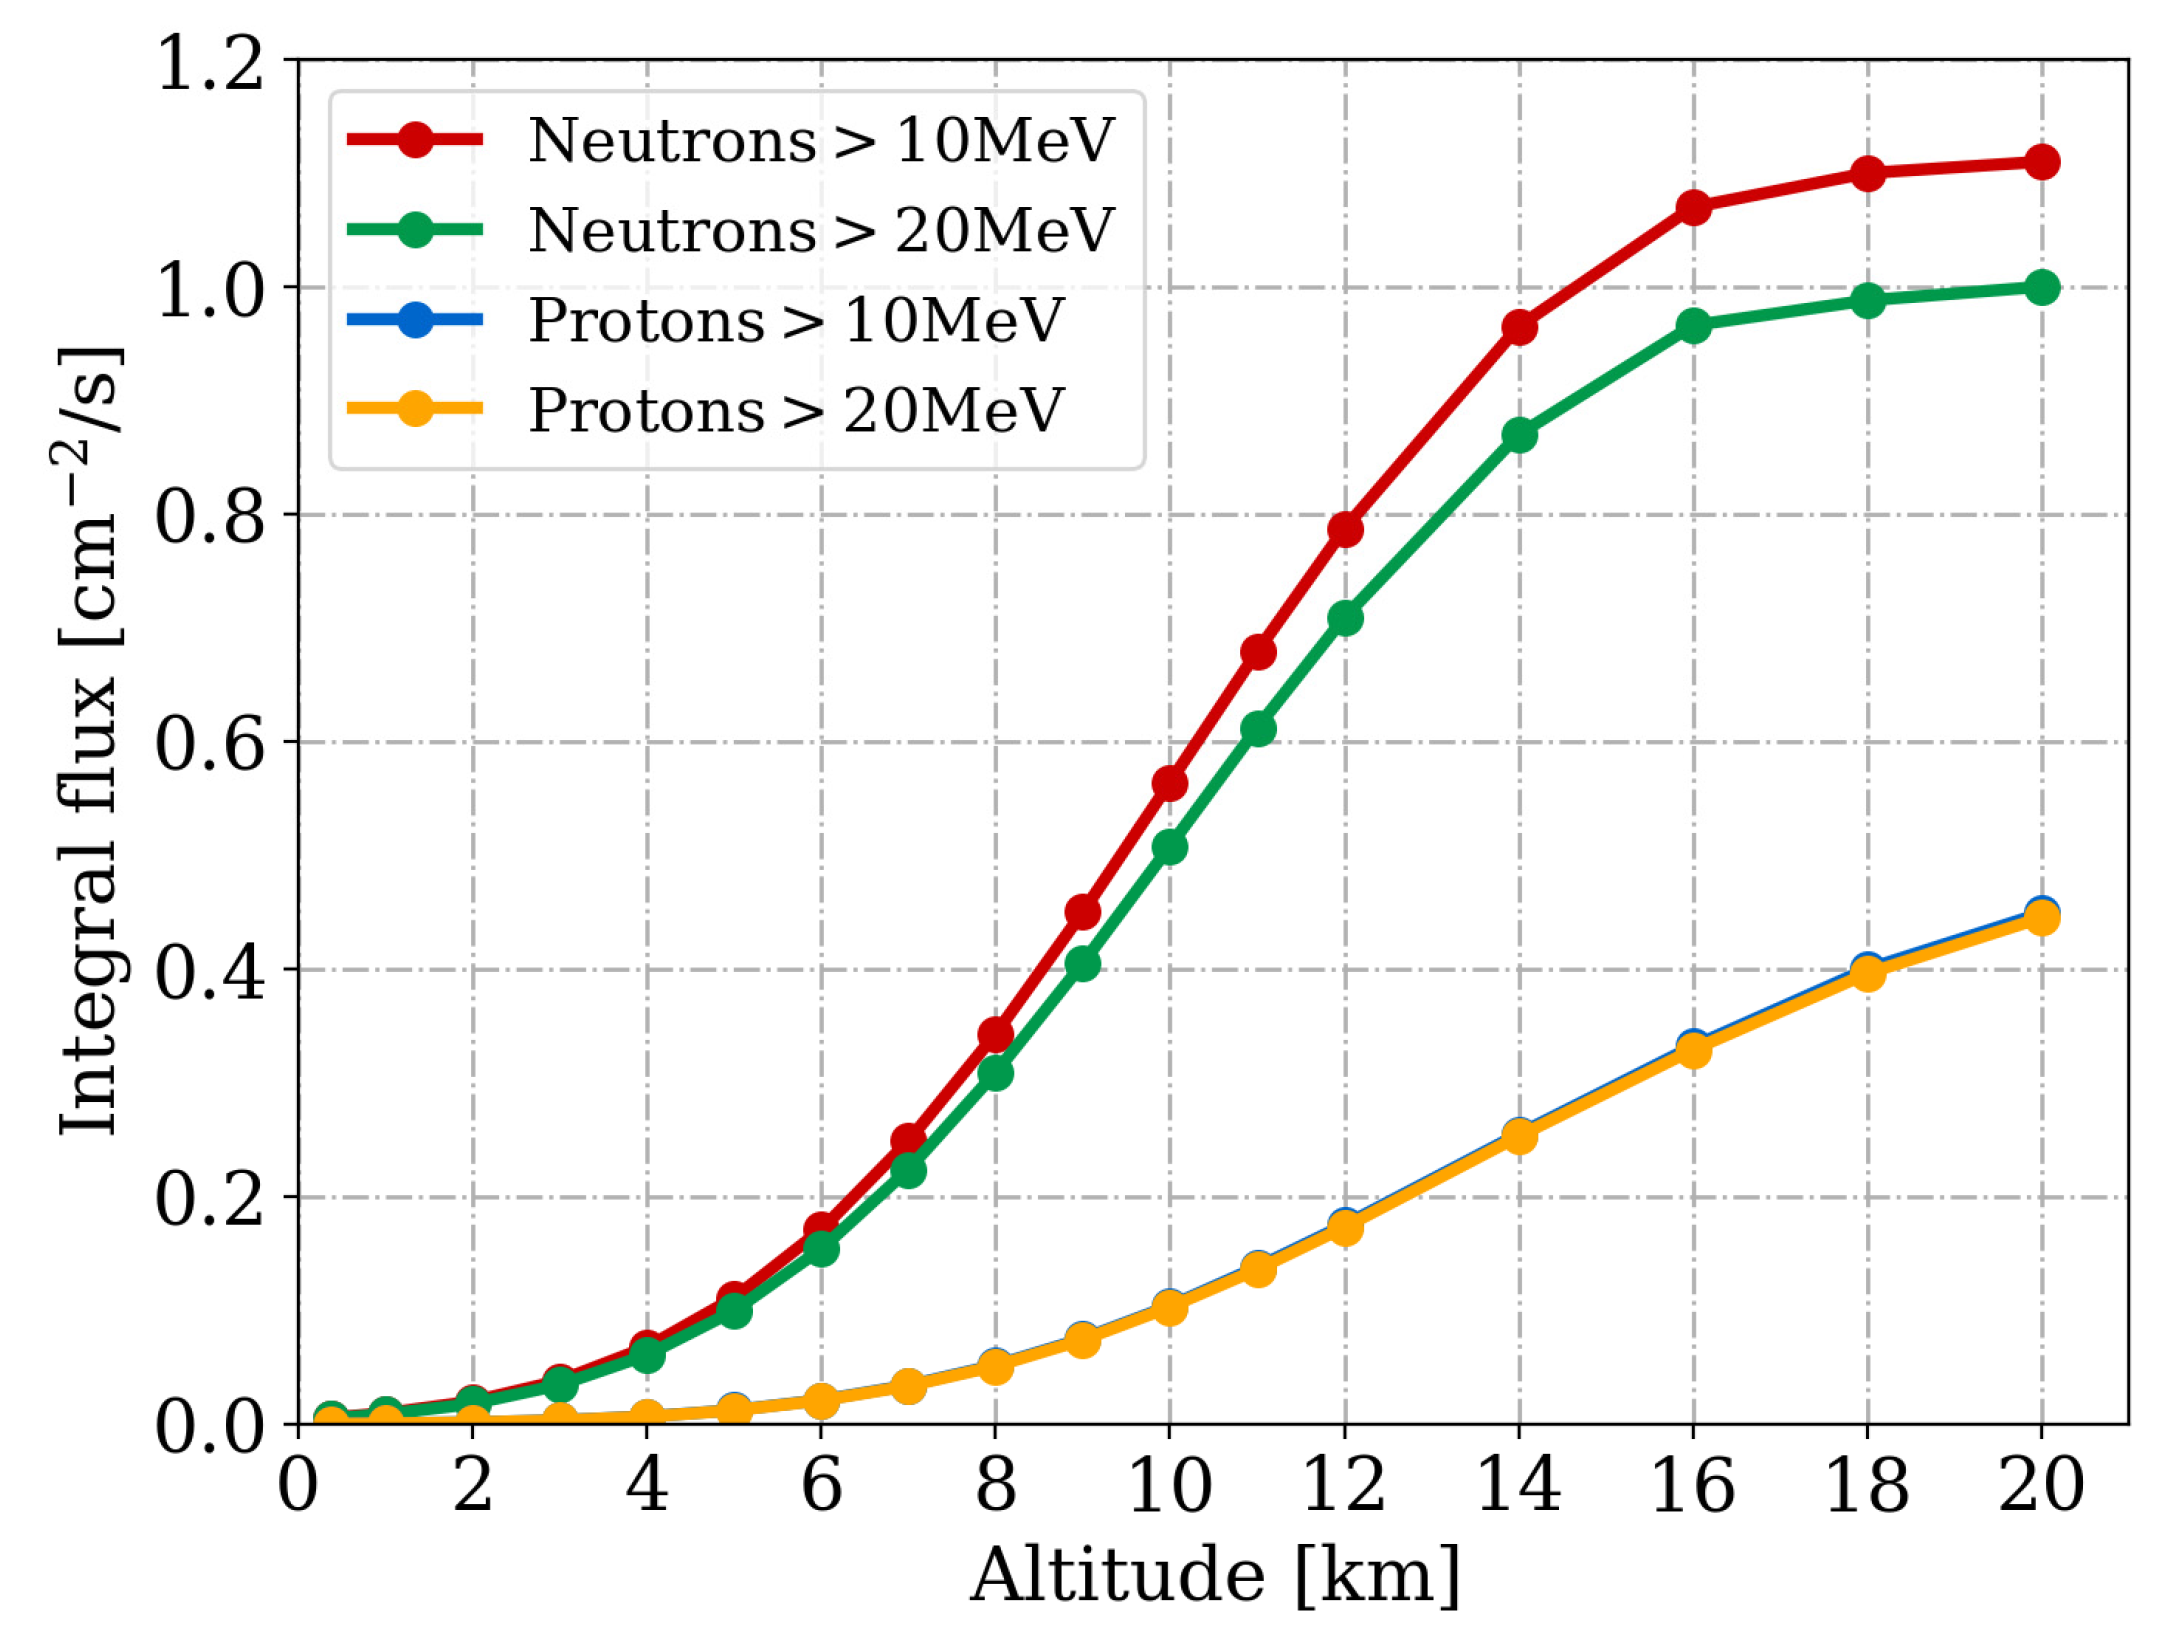
3. Atmospheric Radiation Environments

Neutron and proton spectra were extracted through MAIRE [8] considering a medium geomagnetic index (Kp) of 4 on the 1st of July, 2016 for altitudes up to 20 km. Figure 1 shows the differential fluxes of neutrons (Figure 1a) and protons (Figure 1b) at different altitudes over Geneva in Switzerland (375 m altitude, 46.2° latitude, 6.2° longitude) and at 1 meter above sea level in New York City (NYC). In both cases the flux attenuation moving from 20 km to sea level is noticeable. The neutron and proton fluxes are reduced by three orders of magnitude below 1.5 GeV and 400 MeV, respectively. Above these energies, the attenuation is of four or more orders of magnitude.
A comparison between neutron and proton spectra is shown in Figure 2a at ground level and at 12 km and 20 km of altitude over Geneva. Three ground level spectra are presented: in Geneva (simulations, 375 m above sea level), NYC (simulations, 1 m above sea level) and NYC (measurements performed in November 2002 reported in the JEDEC standard). The simulation overestimates the measured NYC flux around 100 MeV by up to 80%. Proton fluxes are lower than those of neutrons below 2.5 GeV and higher above this threshold; this effect is particularly visible at 20 km of altitude, where protons are 5 times greater than neutrons. Figure 2b depicts the variation of neutron and proton fluxes with the altitude, calculated above 1 MeV and normalized at 12 km. These simulated values are compared to the Boeing model from IEC1, which are reported in the standard from 1 to 10 MeV. Although this energy range covers only a small portion of the spectrum, the standard states that the same altitude variations apply for neutrons above 1 MeV and indeed, the trend is compatible with that from the simulations. The maximum flux value corresponds to the Pfotzer peak at 18 km for neutrons, but it is not the case in regards to protons, which were supposed to present a peak around 16.8 km [1].
Figure 3 depicts the integral fluxes of neutrons and protons, calculated above 10 MeV and 20 MeV. As can be seen, at 12 km of altitude, the proton flux above 10 MeV is 22% of the neutron flux, a factor of 3 higher than what the IEC1 standard alludes (6.7%).
A quick overview of how the hardness of the spectra evolves with the altitude is summarized in Table 1, through the H10% hardness factor. This figure of merit is defined as the energy above which 10% of the HEH flux (> 20 MeV) is present in the considered spectrum [2,15]. It represents in a single value the information about the hardness of a spectrum for a direct comparison between different environments. The spectra, from which the H10% were calculated, derive from the MAIRE simulations, which consider the contribution of neutrons and protons, and the JEDEC measurements, which only include neutrons. In addition, H10% was calculated at the equator and pole for the same longitude of Geneva (6.2°), considering a latitude of 0° and 70°, respectively. As seen in Table 1, there is a general increase in the H10% factor with altitude, showing the presence of larger fluxes of highly energetic particles. The H10% values spread up to almost 1800 MeV (Table 1), which are also typical in accelerator environments. For comparison, the ChipIr spallation facility provides the hardness of 283 MeV [2].
It is important to highlight that, as shown in Table 1, it is not only the flux that changes in the neutron and proton spectra with altitude in the atmosphere, but also the energy spectra shape. Indeed, M1 and M2 neglect this aspect when applying spallation and monoenergetic proton data up to 200 MeV to derive the SEE rate for aviation applications.

4. SEE Calculation and Results

Alliance, Samsung and Renesas memories were selected for the analysis because of their strong cross section dependence with the energy above 200 MeV, which is due to the presence of tungsten near the sensitive volume [13,15,19]. Alliance and Samsung are commercial off the shelf (COTS) SRAMs. The respective references are AS7C34098A-10TCN (200 nm) for Alliance and K6R4016V1D-TC10 (180 nm) for Samsung, both with 4 Mbit of memory. They were tested against SEL in Reference [2] and [15]. In the ChipIr spallation facility, the SEL cross section resulted in 7.1×10⁻¹¹ cm2/dev and 6.8×10⁻¹¹ cm2/dev for Alliance and Samsung, respectively [2]. The SEU analysis was performed using the Renesas SRAM R1LV1616R-1328 (150 nm) of 16 Mbit [19], which uses a radiation hardening technique to increase the critical charge. Indeed, it is worth noting that the impact of tungsten and thus energy dependence is more relevant for components with relatively high linear energy transfer (LET) thresholds (~10 MeVcm2/mg and above), and thus more impacted by the high-LET fission fragments from high-Z materials. Contrarily, typical soft errors, with LET thresholds in the range of ~1 MeVcm2/mg would be less impacted, as silicon-like fragments would dominate.
Table 2 reports the memory characteristics and the Weibull parameters extracted from a standard qualification up to 230 MeV protons from M2 (Weibull MeV) and considering the actual memory response from M3 saturating after few GeV (Weibull GeV). The corresponding SEL and SEU cross section responses are depicted in Figure 4 in units of cm2/devices, in addition to the experimental data. It can be noted that the real saturated cross section is about one order of magnitude larger than that at 230 MeV. Furthermore, the three memories are not sensitive to neutrons below 20 MeV (as their technology is above 150 nm, and they have relatively large LET thresholds).
The SEE rate for the three memories was calculated by applying M1, M2 and M3 at different altitudes, from the ground level (JEDEC NYC, Geneva) up to 20 km. Thus, the different methods were applied to the same environment’s spectra as a starting point. As far as M1 is concerned, the SEL measurements (Alliance and Samsung) were performed in ChipIr, which provides a spallation neutron spectrum up to 800 MeV. The single memory cross sections were calculated considering the flux above 20 MeV, as these memories are not sensitive to intermediate energy neutrons below 20 MeV. The cross section value was multiplied by the operational flux (at different altitudes, see Figure 3) above 20 MeV to obtain the SEE rate. Indeed, provided there is little difference between the experimental and application neutron spectrum in the 10–20 MeV range, having used 10 MeV as lower limit would hardly have an impact on the results.
Regarding M2 and M3, the SEE rate was computed through the integral of the spectrum folded with the Weibull response from Table 2. In the following, the results will be detailed shown for the Alliance memory. They are perfectly representative also for the Samsung, because these memories have a very similar response, as can be deducted from their Weibull functions (Figure 4). The conclusions about M2 and M3 are also valid for the Renesas memory and the possible differences will be mentioned.
The SEL results are presented in unit of failure in time (FIT) per device, which corresponds to 109 working hours. Figure 5a reports the Alliance FIT rate induced by neutrons and protons, by applying the three methods. Figure 5b shows the Alliance FIT ratios between the different methods, which are calculated using the values of Figure 5a. The ratio M3/M1 will be called A and M3/M2 named B. These ratios represent the SEE underestimation factor when using the standard M1 or M2 compared to the actual response measured with M3. A first observation considering the standard methods is that the FIT from M1 underestimates that of M2 by about a factor of 2.
Focusing on neutrons (Figure 5b), M1 and M2 underestimate M3 at ground level by a factor of 3.0 and 1.5, respectively, and the ratios increase with the altitude. At flight altitudes of 12 km, A and B are 6.9 and 2.8, respectively, and these ratios still increase up to about 11 and 4 at 20 km. The SEU rate calculated for the Renesas shows the rate of B as 4.8 (at 12 km) and 7.0 (at 20 km), which is an underestimation even greater than the SEL one. The FIT contribution due to neutrons and protons with energies below and above 230 MeV is shown in Table 3 for the three memories at 12 km of altitude. It is clear that the effect of the energy-dependent SEE cross section is relevant. The memory is sensitive to the higher energetic fluxes, for which contribution to the SEE was underestimated when considering an SEE cross section saturating at 200 MeV. This phenomena is visible in Figure 5a where, using the Weibull fit extracted from 200 MeV (M2) or spallation tests (M1), the FIT rates are flatter with the change in altitude compared to those from M3. The trend of M1 in Figure 5a is, by construction, the same as the integral neutron flux in Figure 3. A consequent remark about the standard methods is that M2 is preferable to M1 (although in this case the conclusion derives from measurements performed at ChipIr, and the results might be different in other spallation facilities).
Concerning protons, the effect of the three methods is the same as with neutrons (since the proton and neutron memory cross sections are assumed to be equal), but the underestimation is even higher in the ratios A and B, resulting in 10 and 3 at ground level and 25 and 6 at 12 km, respectively. For Renesas, the B ratio is doubled. Moreover, when using M1 or M2 for example (Figure 5a), the FIT rates due to neutrons are always larger than those induced by protons (at 12 km protons induce half of SEE compared to neutrons), whereas with M3, protons cause as many SEE as neutrons at 13 km, and their contribution is larger at higher altitudes (at 12 km, the protons SEE rate is 90% that of neutrons). These neutrons/protons contribution to the FIT are shown in Figure 6 for the three methods. Therefore, for these type of memories, SEEs from protons are not negligible compared to those from neutrons already at flight altitudes. In other words, when considering per unit flux, atmospheric protons are more efficient in inducing SEEs than atmospheric neutrons, owing to their larger energies.
In addition, as mentioned in Section 2, the IEC standard for avionic proposes a simplified method for calculating the SEE rate at 12 km. It consists of multiplying the spallation cross section by the value of 6000 cm−2/h rounded from 5600 n/(cm2/h), which is the integrated flux above 10 MeV, and to scale the flux according the IEC curve in Figure 2b for the different altitudes. As shown in the same Figure, the scaling factor is compatible with the curve retrieved from the MAIRE simulations. Calculating the SEE rate at 12 km over Geneva, applying the aforementioned simplified method for the Alliance memory, it yields 426 FIT/dev. At first glance, this value seems compatible with 453 FIT/dev, calculated considering the neutron contribution from M2 (whereas with M1 the rate is 181 FIT/dev). Therefore, one could conclude that the simplified method for memories which do not present an SEE cross section dependence with high energies is valid for neutrons neglecting the proton contribution. However, the two results are compatible due to compensating effects: the simulated neutron flux above 10 MeV at 12 km is 2834 n/(cm2/h), about half compared to 5600 n/(cm2/h), but the M2 cross section is up to 5 times higher (in saturation at 200 MeV) than that from M1. Furthermore, when comparing the result with M3, the FIT rate using the flux of 6000 cm−2/h is 3 times lower, even though it is said to be conservative and incorporate the contribution of protons.
As seen, the SEE underestimation with standard methods is due to two effects: the contribution from high energy particles (neutrons and protons) and the fact that protons are mostly neglected, as in the simplified method that considers only 6.7% of protons in the flux of 6000 cm−2/h at 12 km. The results from Figure 5 and Figure 6 can be used to quantify these two effects, for example at 12 km of altitude, considering M2 as the standard approach (Alliance memory). From Figure 5, the B ratio of neutrons and protons is 2.8 (neutron FITM3 = 1255, FITM2 = 453) and 5.7 (proton FITM3 = 1113, FITM2 = 194), respectively. These factors quantify the separate underestimations due to protons and neutrons. Employing the avionic simplified method—which neglects part of the protons, as shown above—the SEE value is 426 FIT/dev (thus 397 FIT due to neutrons and 29 FIT induced by protons). Therefore, even if the memory was saturating at 200 MeV, the underestimation with the simplified method for neglecting part of the protons is more than a factor of 6 compared to M2.
As summary result, Table 4 reports the FIT rate for ground level, avionic (12 km) and 20 km of altitude for the three memories, considering the contribution of both neutrons and protons, with their respective A and B ratios.
The SEL and SEU underestimation in ground level applications can be up to a factor of 4. This factor increases with altitude and, at nominal high of 12 km for commercial flights, the SEE rate can be from 3 to 12 times greater than that predicted by applying the standards. The ratio is higher at 20 km up to a factor 23, mainly due to the proton contribution.
As a result, the material composition of a new component to test should be assessed, for example by means of a scanning electron microscope (SEM), in order to verify the presence of tungsten or other high-Z materials that can cause the cross section to increase above 200 MeV. The qualification can be carried out accordingly, with the standard methods or through simulations/measurements with facilities providing high energy beams, such as CHARM at CERN. In the absence of such test opportunities, safety margins may need to be incorporated in M1 and M2 in order to account for possible energy dependence.
Moreover, it should be highlighted that whereas this work focuses on the impact of tungsten near the actual sensitive volume of three commercial SRAM components (e.g., metallization and contacts), the effect of other high-Z materials—such as gold packages—has also been investigated in the context of space applications [11].
In addition, it is worth noting that a strong SEE dependence with energy has also been observed for the SEL sensitivity of a commercial analog-to-digital converter ADC device [20].

5. Conclusions

The standard test procedures for the qualification of electronics for ground level and avionic applications make important assumptions that may lead to underestimation of the SEE rate. This occurs with components that present a strong SEE cross section response with energy, which saturates only after several GeV and not around 200 MeV, due to the presence of high-Z materials, such as tungsten, inside the memory structure. For these devices, we showed that high energy particles (above GeV) in the atmosphere play a fundamental role in inducing SEE, even though their fluxes are orders of magnitude lower than those at MeV energies. As shown for SEL and SEU rates in SRAMs, two main conclusions can be drawn. The proton contribution to the SEE is not negligible and comparable to neutrons even at flight altitudes (12 km). Moreover, the FIT rate, using qualification methods from the standards, can be underestimated up to a factor of 4 at ground level and up to 12 times in avionic applications. The solution relies on characterizing these components up to a few GeV, through simulations and/or dedicated facilities capable of providing GeV of these energies, through either monoenergetic beams or spallation environments. If such an experimental approach is not feasible, safety margins accounting for possible energy dependence may need to be taken into consideration.

Materials and Methods

Simulations can be retrieved through the MAIRE online platform: http://82.14.213.187:8080/maire/.

Author Contributions

Conceptualization, M.C. and R.G.A.; Data curation, M.C.; Formal analysis, M.C.; Supervision, R.G.A. and F.W.; Validation, R.G.A.; Visualization, M.C.; Writing–original draft, M.C.; Writing–review & editing, R.G.A. and F.W.

Funding

This research received no external funding.

Conflicts of Interest

The authors declare no conflict of interest.

References

  1. Process Management for Avionics—Atmospheric Radiation Effects. Accommodation of Atmospheric Radiation Effects via Single Event Effects within Avionics Electronic Equipment; IEC Standard 62396-1; International Electrotechnical Commission: Geneva, Switzerland, 2016.
  2. Cecchetto, M.; Fernández-Martínez, P.; Alía, R.G.; Ferraro, R.; Danzeca, S.; Wrobel, F.; Cazzaniga, C.; Frost, C.D. SEE Flux and Spectral Hardness Calibration of Neutron Spallation and Mixed-Field Facilities. IEEE Trans. Nucl. Sci. 2019, 66, 1532–1540. [Google Scholar] [CrossRef]
  3. Lambert, D.; Desnoyers, F.; Thouvenot, D.; Riant, O.; Galinat, J.; Azaïs, B.; Colladant, T. Single event upsets induced by a few MeV neutrons in SRAMs and FPGAs. In Proceedings of the 2017 IEEE Radiation Effects Data Workshop (REDW), New Orleans, LA, USA, 17–21 July 2017; pp. 114–118. [Google Scholar]
  4. Quinn, H.; Watkins, A.; Dominik, L.; Slayman, C. The Effect of 1–10-MeV Neutrons on the JESD89 Test Standard. IEEE Trans. Nucl. Sci. 2019, 66, 140–147. [Google Scholar] [CrossRef]
  5. Process Management for Avionics—Atmospheric Radiation Effects. Guidelines for Single Event Effects Testing for Avionics Systems; IEC Standard 62396-2; International Electrotechnical Commission: Geneva, Switzerland, 2017.
  6. Sierawski, B.D.; Pellish, J.A.; Reed, R.A.; Schrimpf, R.D.; Warren, K.M.; Weller, R.A.; Mendenhall, M.H.; Black, J.D.; Tipton, A.D.; Xapsos, M.A.; et al. Impact of low-energy proton induced upsets on test methods and rate predictions. IEEE Trans. Nucl. Sci. 2009, 56, 3085–3092. [Google Scholar] [CrossRef]
  7. Sierawski, B.D.; Mendenhall, M.H.; Reed, R.A.; Clemens, M.A.; Weller, R.A.; Schrimpf, R.D.; Blackmore, E.W.; Trinczek, M.; Hitti, B.; Pellish, J.A.; et al. Muon-induced single event upsets in deep-submicron technology. IEEE Trans. Nucl. Sci. 2010, 57, 3273–3278. [Google Scholar] [CrossRef]
  8. “MAIRE,” RadMod Research. Available online: https://www.radmod.co.uk/maire (accessed on 24 August 2019).
  9. Fasso, A.; Ferrari, A.; Ranft, J.; Sala, P.R. FLUKA: A Multi-Particle Transport Code; SLAC-R-773, 877507; CERN: Meyrin, Switzerland, 2005. [Google Scholar] [CrossRef]
  10. Schwank, J.R.; Shaneyfelt, M.R.; Baggio, J.; Dodd, P.E.; Felix, J.A.; Ferlet-Cavrois, V.; Paillet, P.; Lambert, D.; Sexton, F.W.; Hash, G.L.; et al. Effects of particle energy on proton-induced single-event latchup. IEEE Trans. Nucl. Sci. 2005, 52, 2622–2629. [Google Scholar] [CrossRef]
  11. Turflinger, T.L.; Clymer, D.A.; Mason, L.W.; Stone, S.; George, J.S.; Savage, M.; Koga, R.; Beach, E.; Huntington, K. RHA Implications of Proton on Gold-Plated Package Structures in SEE Evaluations. IEEE Trans. Nucl. Sci. 2015, 62, 2468–2475. [Google Scholar] [CrossRef]
  12. Measurement and Reporting of Alpha Particle and Terrestrial Cosmic Ray-Induced Soft Errors in Semiconductor Devices. JEDEC Standard 89A (JESD89A). Available online: https://www.jedec.org/standards-documents/docs/jesd- (accessed on 30 October 2019).
  13. Alía, R.G.; Brugger, M.; Danzeca, S.; Ferlet-Cavrois, V.; Poivey, C.; Røed, K.; Saigné, F.; Spiezia, G.; Uznanski, S.; Wrobel, F. Energy Dependence of Tungsten-Dominated SEL Cross Sections. IEEE Trans. Nucl. Sci. 2014, 61, 2718–2726. [Google Scholar] [CrossRef]
  14. Alía, R.G.; Blackmore, E.W.; Brugger, M.; Danzeca, S.; Ferlet-Cavrois, V.; Gaillard, R.; Mekki, J.; Poivey, C.; Røed, K.; Saigné, F.; et al. SEL Cross Section Energy Dependence Impact on the High Energy Accelerator Failure Rate. IEEE Trans. Nucl. Sci. 2014, 61, 2936–2944. [Google Scholar] [CrossRef] [Green Version]
  15. García Alía, R.; Brugger, M.; Danzeca, S.; Ferlet-Cavrois, V.; Frost, C.; Gaillard, R.; Mekki, J.; Saigné, F.; Thornton, A.; Uznanski, S.; et al. SEL Hardness Assurance in a Mixed Radiation Field. IEEE Trans. Nucl. Sci. 2015, 62, 2555–2562. [Google Scholar] [CrossRef]
  16. Battistoni, G.; Cerutti, F.; Fassò, A.; Ferrari, A.; Muraro, S.; Ranft, J.; Roesler, S.; Sala, P.R. The FLUKA code: Description and benchmarking. In Proceedings of the AIP Conference Proceedings, Batavia, IL, USA, 6–8 September 2007; Volume 896, pp. 31–49. [Google Scholar]
  17. Alía, R.G.; Brugger, M.; Danzeca, S.; Mekki, J.; Thornton, A. SEE cross section calibration and application to quasi-monoenergetic and spallation facilities. In EPJ Web of Conferences; EDP Sciences: Les Ulis, France, 2017; Volume 153, p. 08015. [Google Scholar]
  18. Alía, R.G.; Brugger, M.; Danzeca, S.; Cerutti, F.; de Carvalho Saraiva, J.P.; Denz, R.; Ferrari, A.; Foro, L.L.; Peronnard, P.; Røed, K.; et al. Single event effects in high-energy accelerators. Semicond. Sci. Technol. 2017, 32, 034003. [Google Scholar] [CrossRef]
  19. Uznanski, S.; Alia, R.G.; Blackmore, E.; Brugger, M.; Gaillard, R.; Mekki, J.; Todd, B.; Trinczek, M.; Villanueva, A.V. The Effect of Proton Energy on SEU Cross Section of a 16 Mbit TFT PMOS SRAM with DRAM Capacitors. IEEE Trans. Nucl. Sci. 2014, 61, 3074–3079. [Google Scholar] [CrossRef] [Green Version]
  20. Alía, R.G.; Brugger, M.; Cecchetto, M.; Cerutti, F.; Danzeca, S.; Delrieux, M.; Kastriotou, M.; Tali, M.; Uznanski, S. SEE Testing in the 24-GeV Proton Beam at the CHARM Facility. IEEE Trans. Nucl. Sci. 2018, 65, 1750–1758. [Google Scholar] [CrossRef]
Figure 1. Differential spectra of neutrons (a) and protons (b) above 1 MeV at different altitudes over Geneva in Switzerland and 1 m above sea level in New York City (NYC). Simulations retrieved through the Model for Atmospheric Ionizing Radiation Effects (MAIRE).
Aerospace 06 00119 g001
Figure 2. (a): Comparison between neutron and proton differential spectra above 10 MeV at ground level (Geneva, NYC, JEDEC NYC), 12 km and 20 km over Geneva. (b) Simulated neutron and proton fluxes (above 1 MeV) vs altitude, normalized at 12 km, in comparison to the Boeing model from the IEC1 standard (which is calculated from 1 to 10 MeV).
Aerospace 06 00119 g002
Figure 3. Integral neutron and proton fluxes, above 10 MeV and 20 MeV, for different altitudes above Geneva.
Aerospace 06 00119 g003
Figure 4. SEL and SEU cross sections for the three SRAMs calculated from two different Weibull: standard characterization at 230 MeV (M2) and response up to several GeV (M3). Experimental data are shown with markers.
Aerospace 06 00119 g004
Figure 5. (a): Failure in time (FIT)/dev rate for the Alliance memory calculated from M1, M2 and M3 for protons and neutrons. (b) Alliance FIT ratio between different methods for neutrons and protons. A = M3/M1, B = M3/M2. The ratio represents the underestimation factor.
Aerospace 06 00119 g005
Figure 6. Ratio between neutron and proton FIT for the three methods (Alliance memory).
Aerospace 06 00119 g006
Table 1. Hardness factor at different altitudes over Geneva in km, compared to the NYC standard (JEDEC) and at varying latitude (0°, equator), (70°, pole).
Altitude (km)JEDEC0.356481212 (Equator)12 (Pole)20
H10% (MeV)5254505668051275142010141790
Table 2. Single event latch-up (SEL) and single event upset (SEU) static random access memory (SRAM) memories considered for the analysis—Weibull parameters.
MemoryTech (nm)SizeSEEWeibullσsat (cm2/dev)EthWs
Alliance2004 MbitSELM2 4.0 × 10−10201561.93
M3 7.5 × 10−92522101.41
Samsung1804 MbitSELM2 5.0 × 10−10351571.74
M3 7.5 × 10−94020001.25
Renesas15016 MbitSEUM2 1.8 × 10−10351001.6
M3 8.2 × 1093528001.3
Table 3. FIT rate below and above 230 MeV due to neutrons and protons, using the characterization at 230 MeV (M2) and at GeV energies (M3). Calculation at 12 km of altitude.
MemoryFIT for E < 230 MeVFIT for E > 230 MeV
NeutronsProtonsNeutronsProtons
M2M3M2M3M2M3M2M3
Alliance193134342426011211611090
Samsung205169373032112732001187
Renesas12112821231211040751032
Table 4. Summary [FIT/device] from M1, M2, M3 due to the combined contribution of neutrons and protons, at ground level (Geneva, 375 m), 12 km and 20 km of altitude. A = M3/M1, B = M3/M2.
MemorySEEAltitudeM1M2M3AB
AllianceSELGround1.43.15.13.51.6
122256472368113.7
2035812267351216.0
SamsungSELGround1.43.66.14.41.7
12216762266012.33.5
2034314687918235.4
RenesasSEUGround 1.84.7 2.7
12 3382223 6.6
20 6187075 11.4

