
Performance Improvement of a High Loading Centrifugal Compressor with Vaned Diffuser by Hub Contour Optimization
 ,
,
Abstract
:1. Introduction
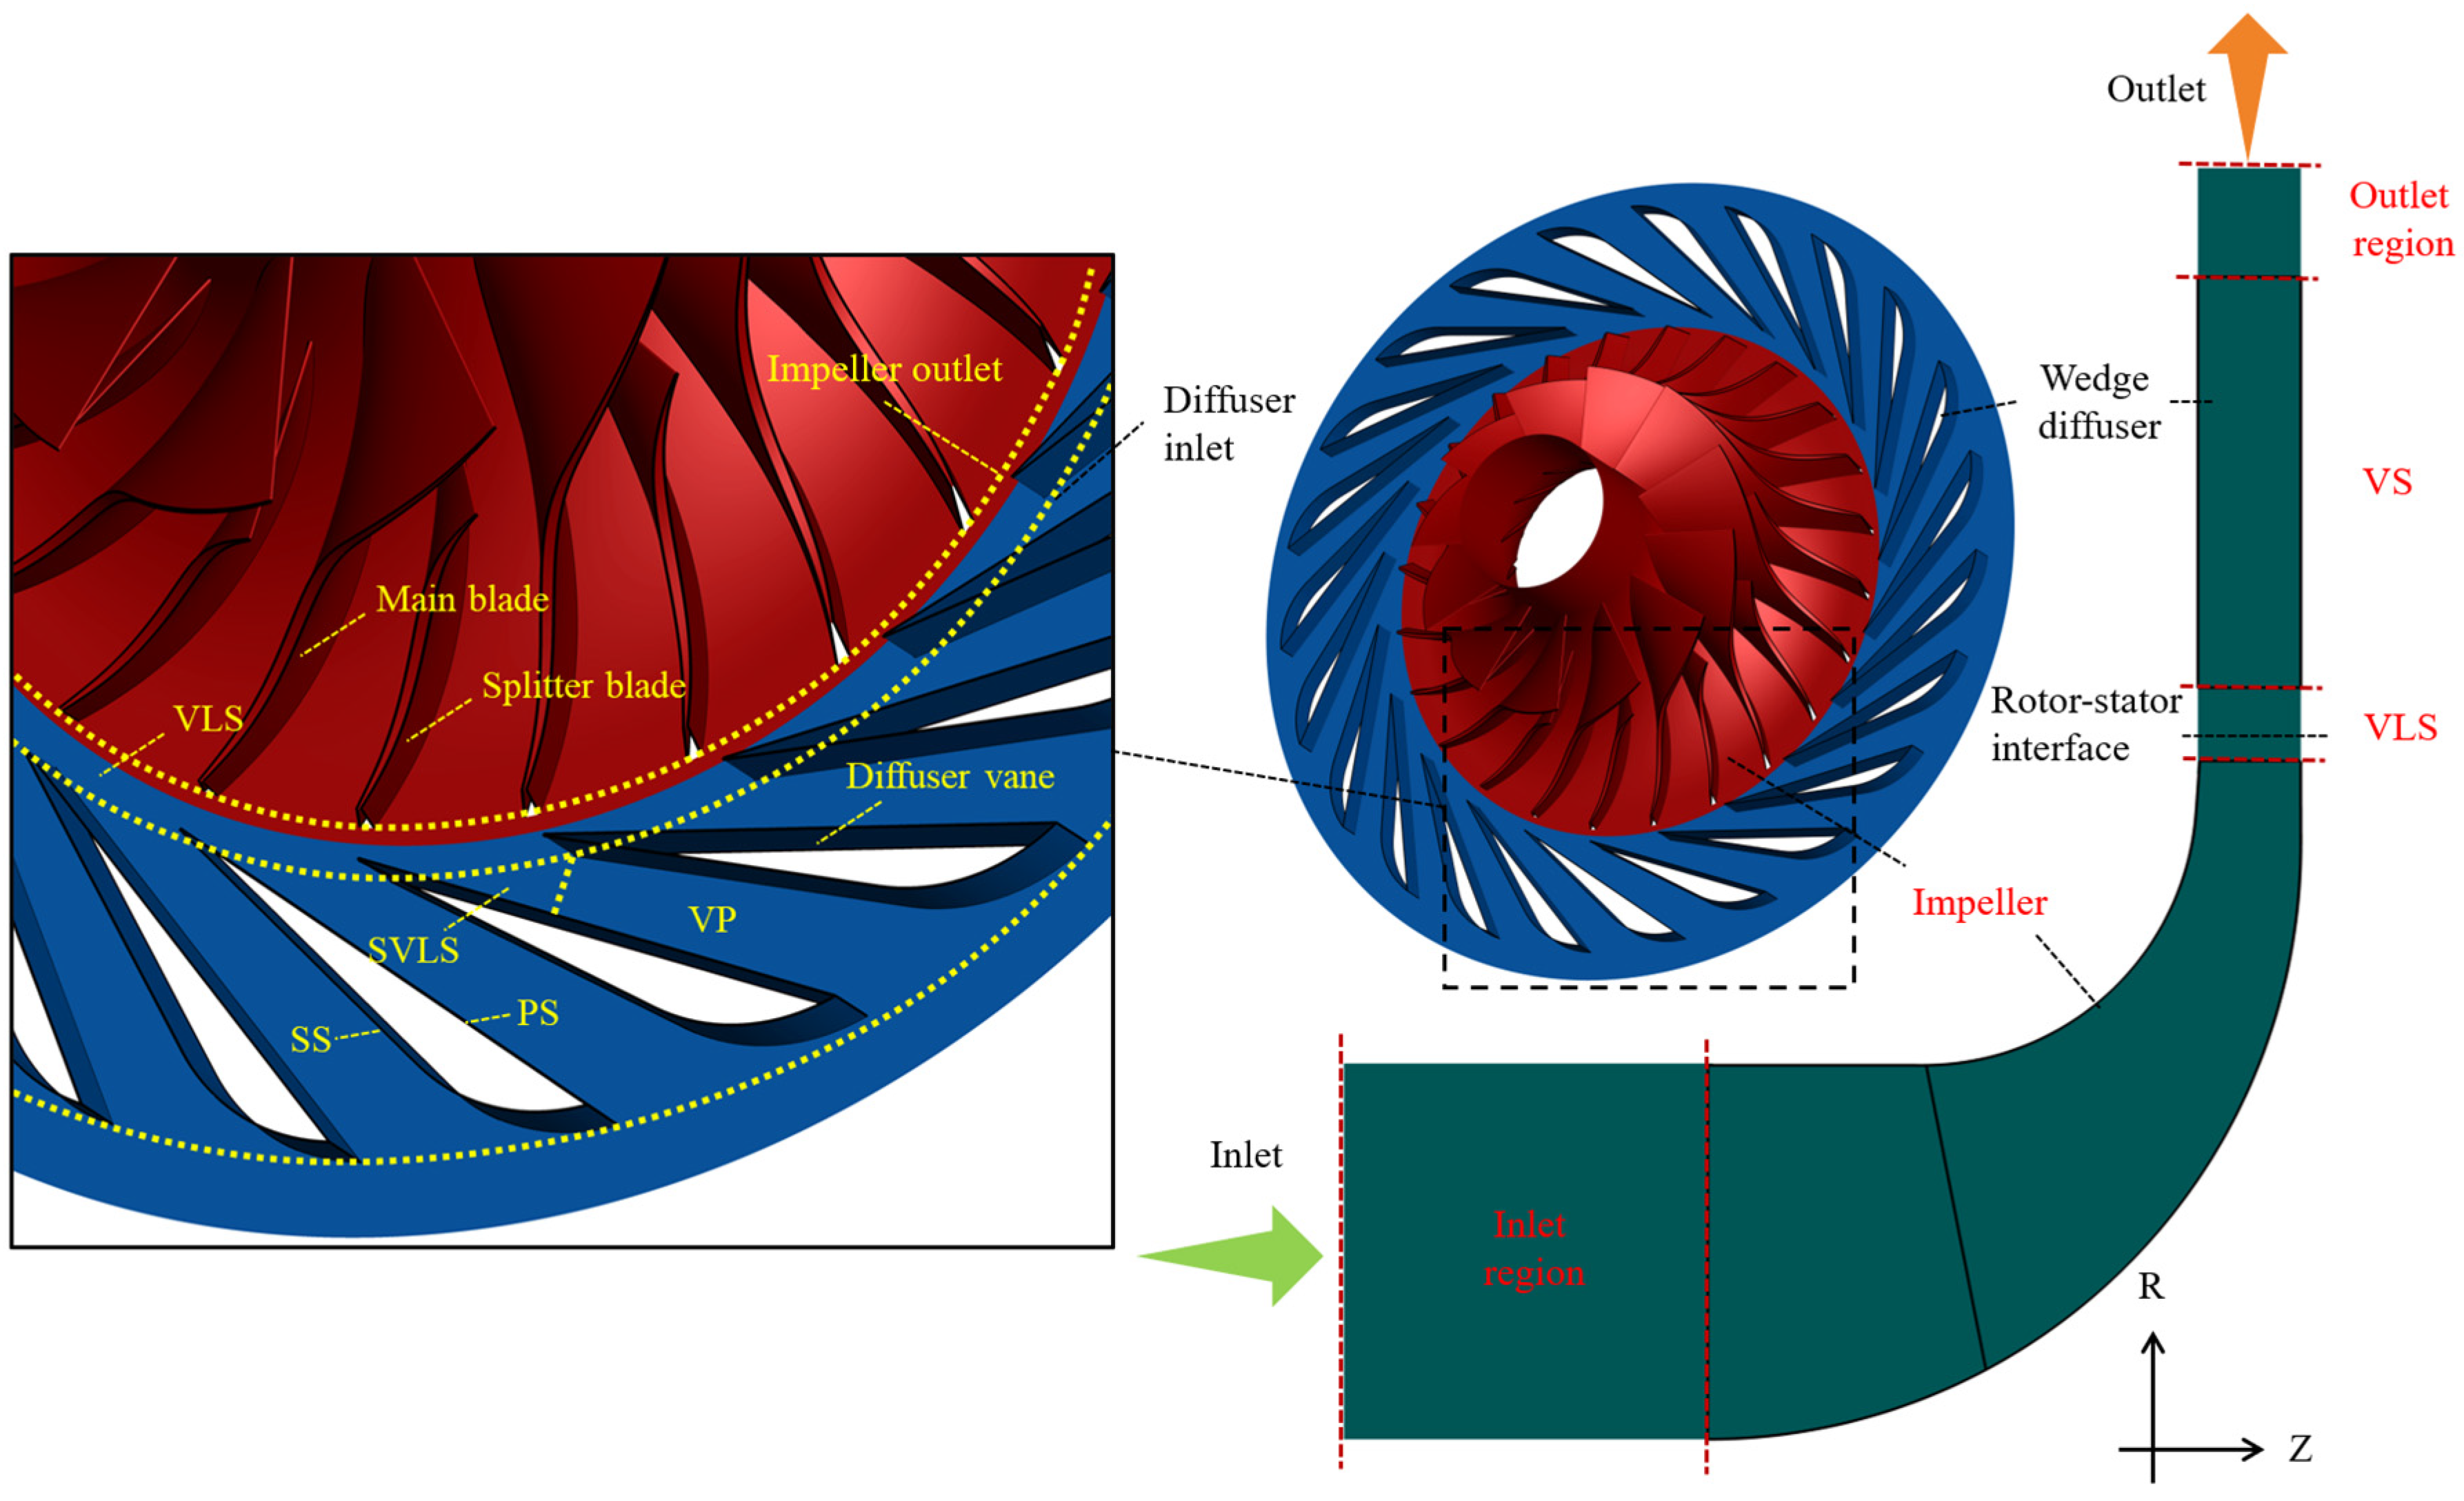
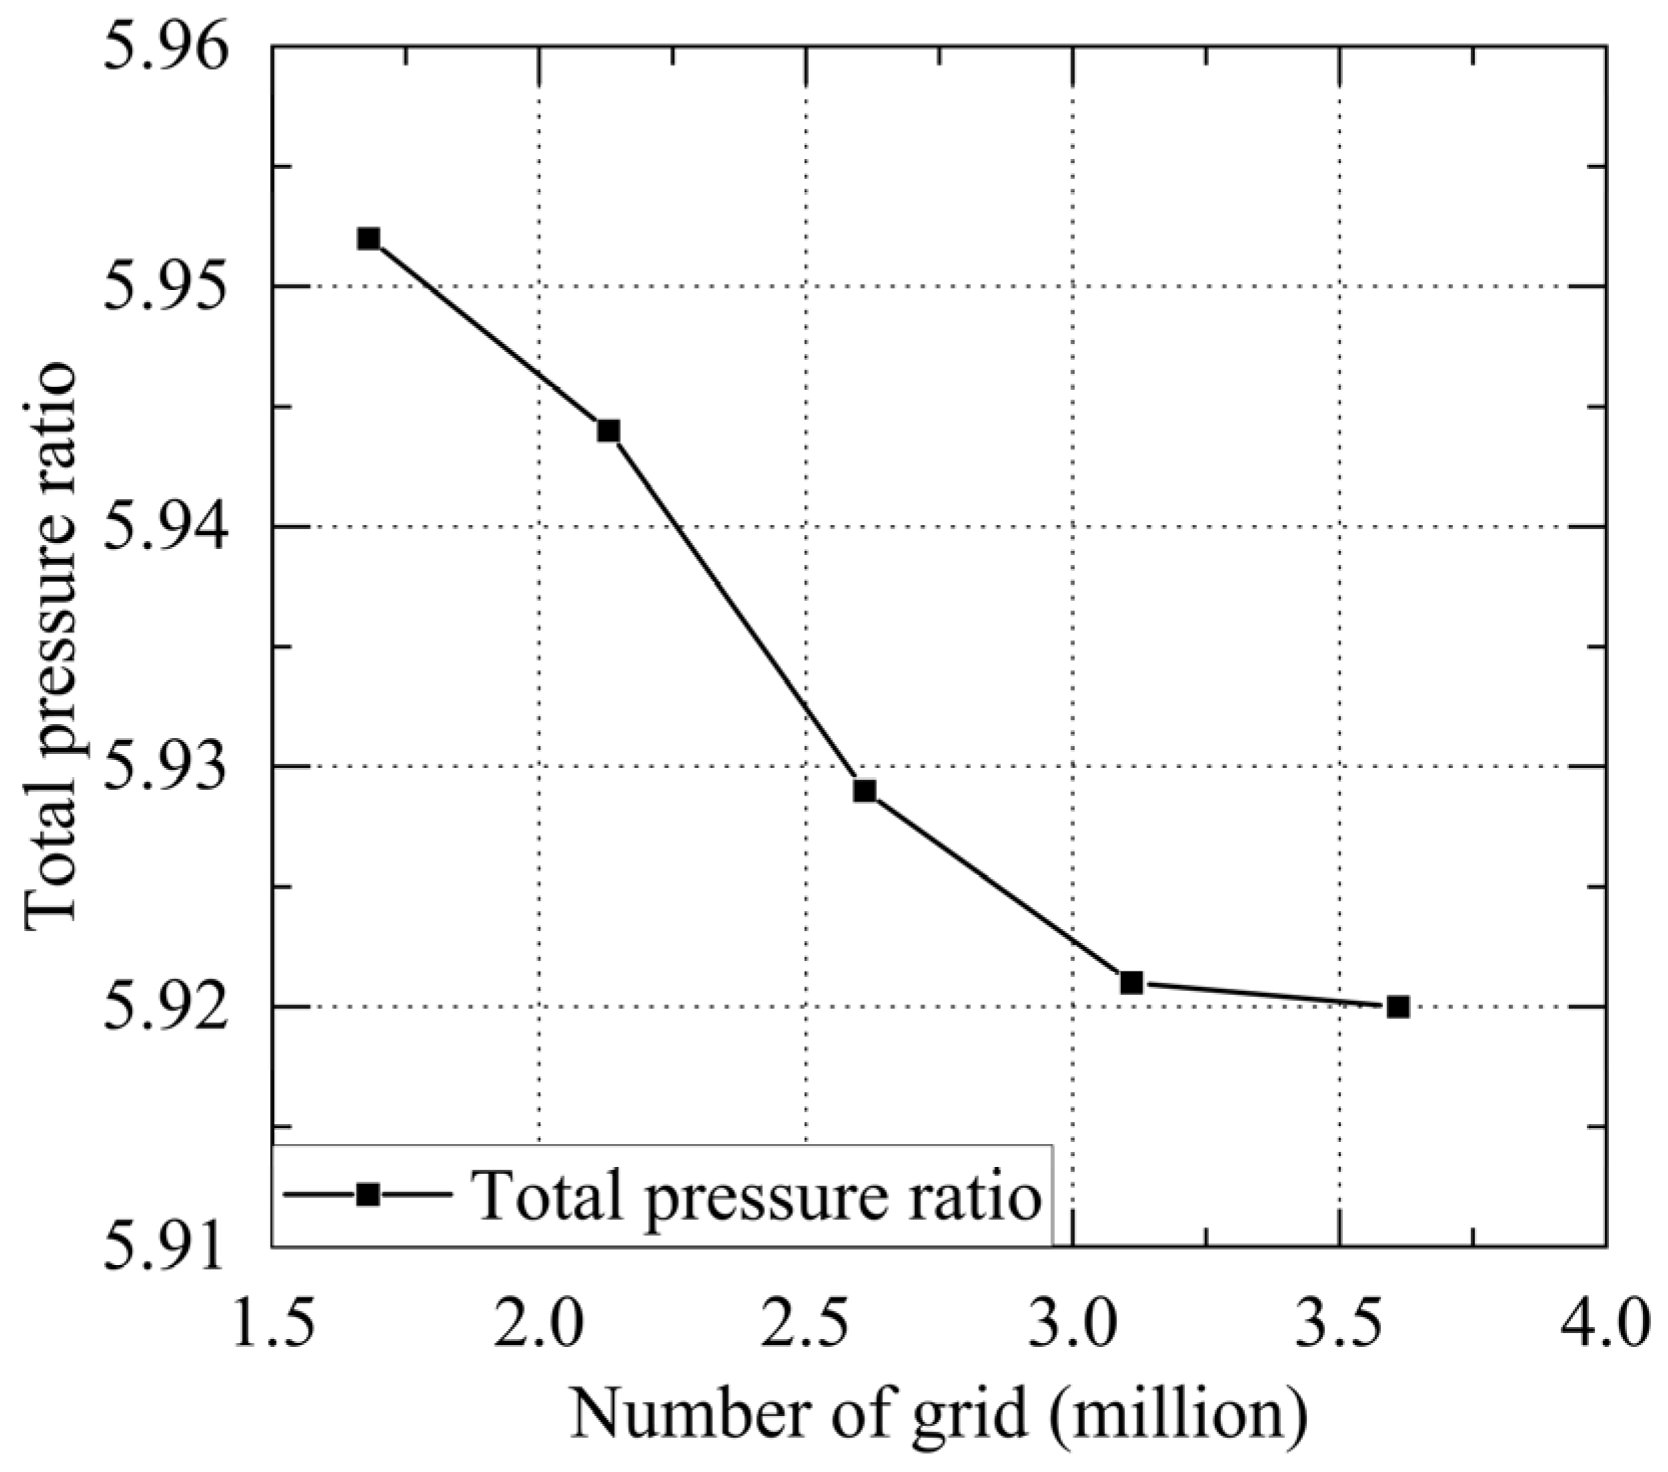
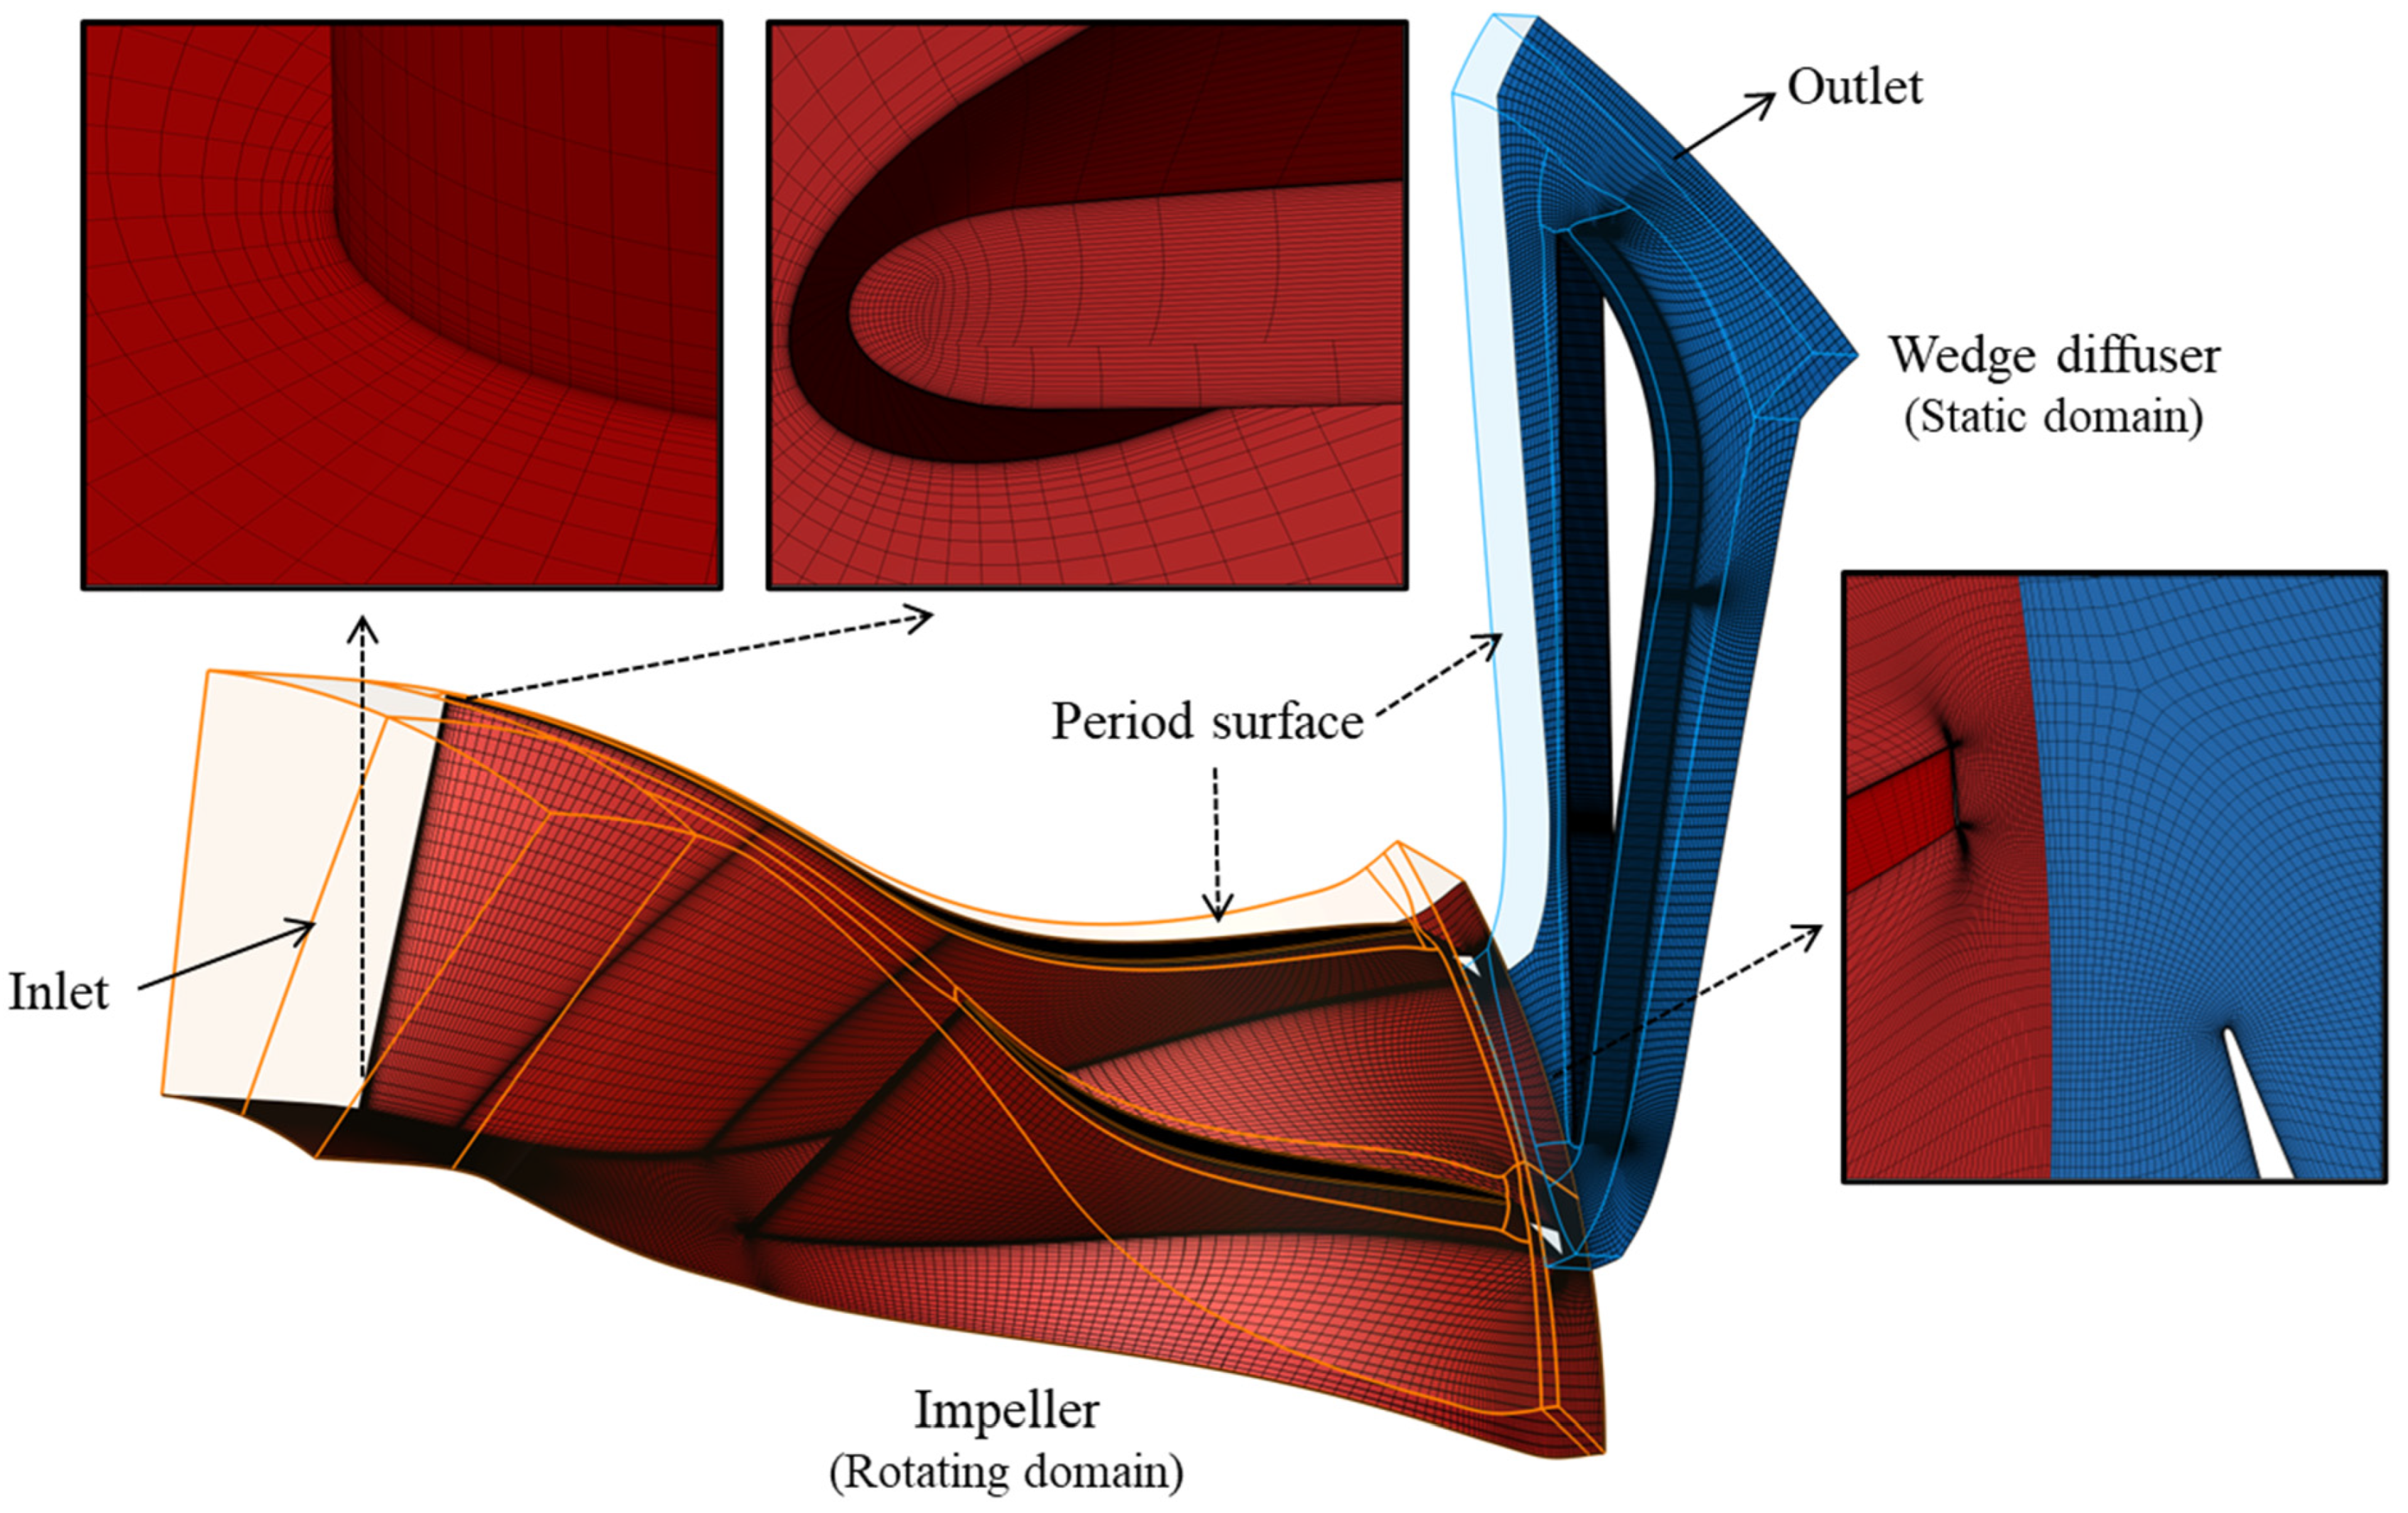
2. Research Model and Methodology
3. Discussion of Numerical Results
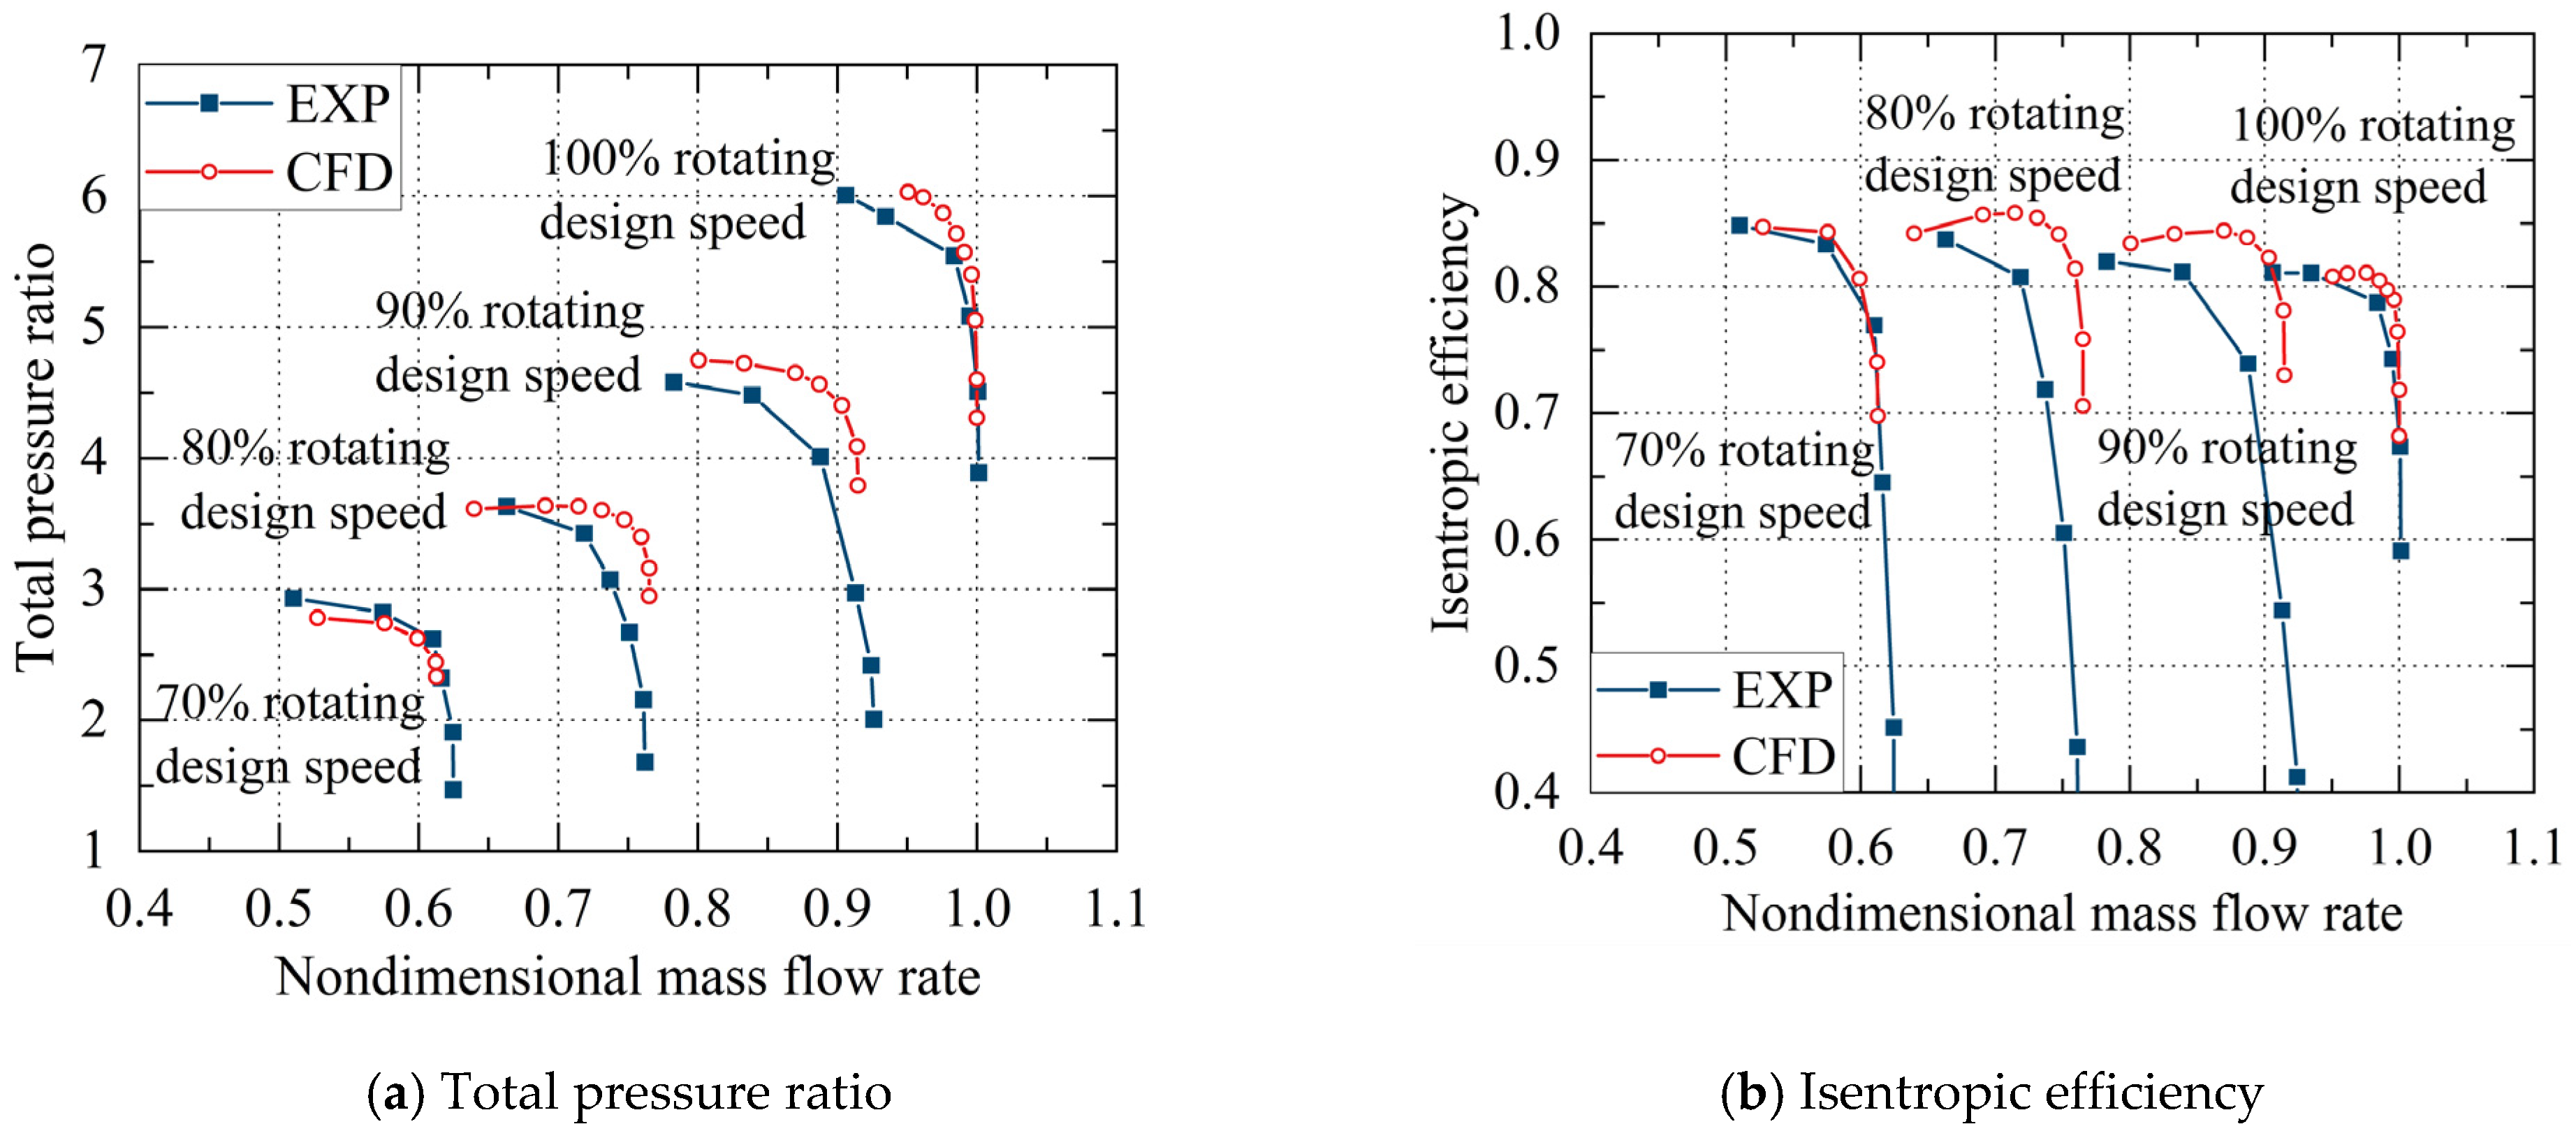
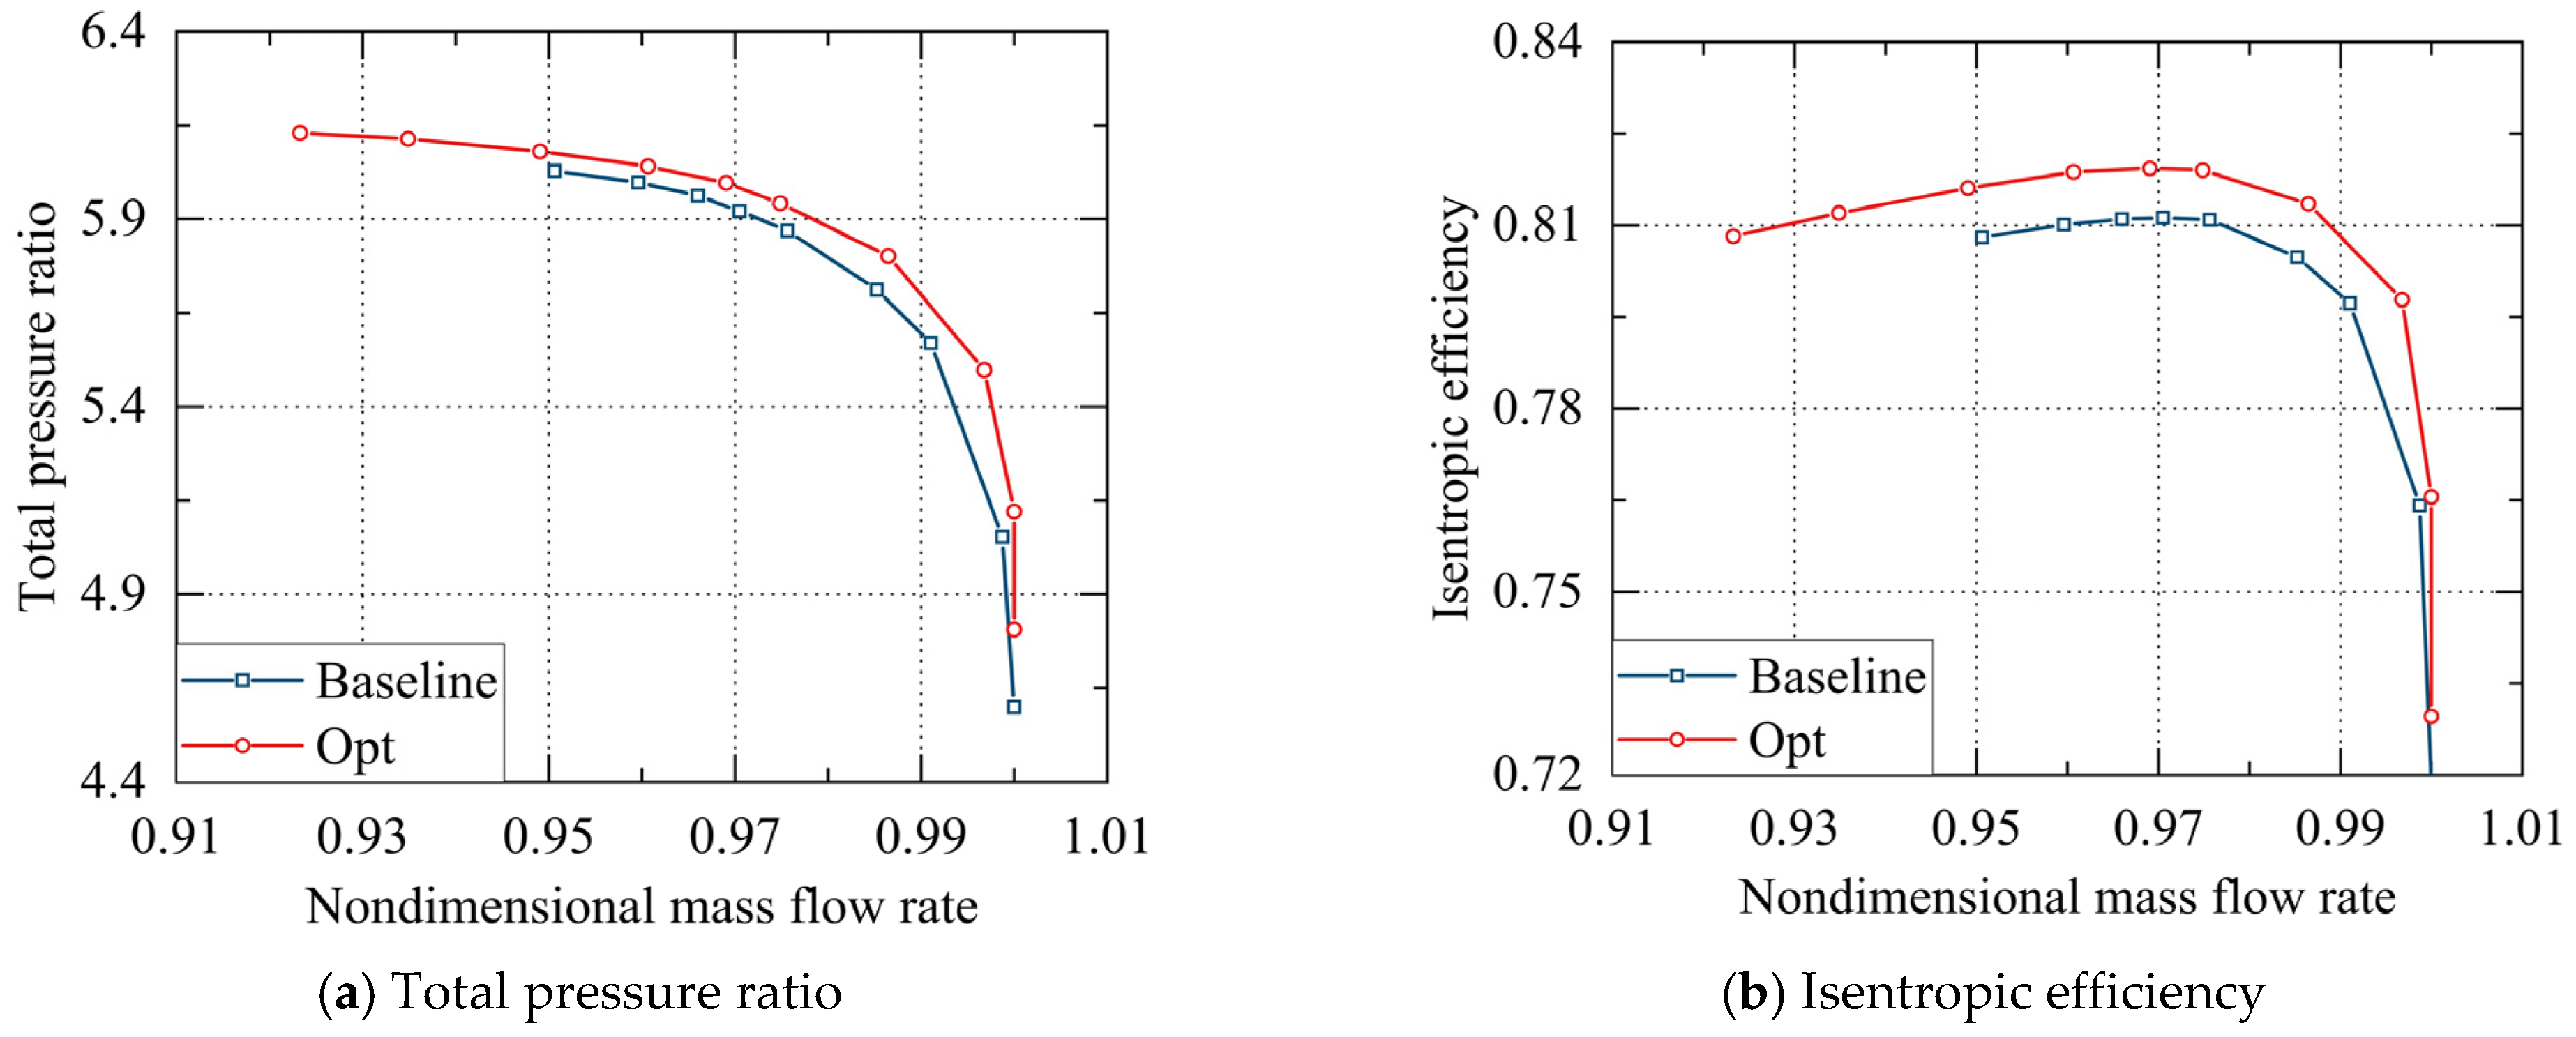
3.1. Comparison of Performance
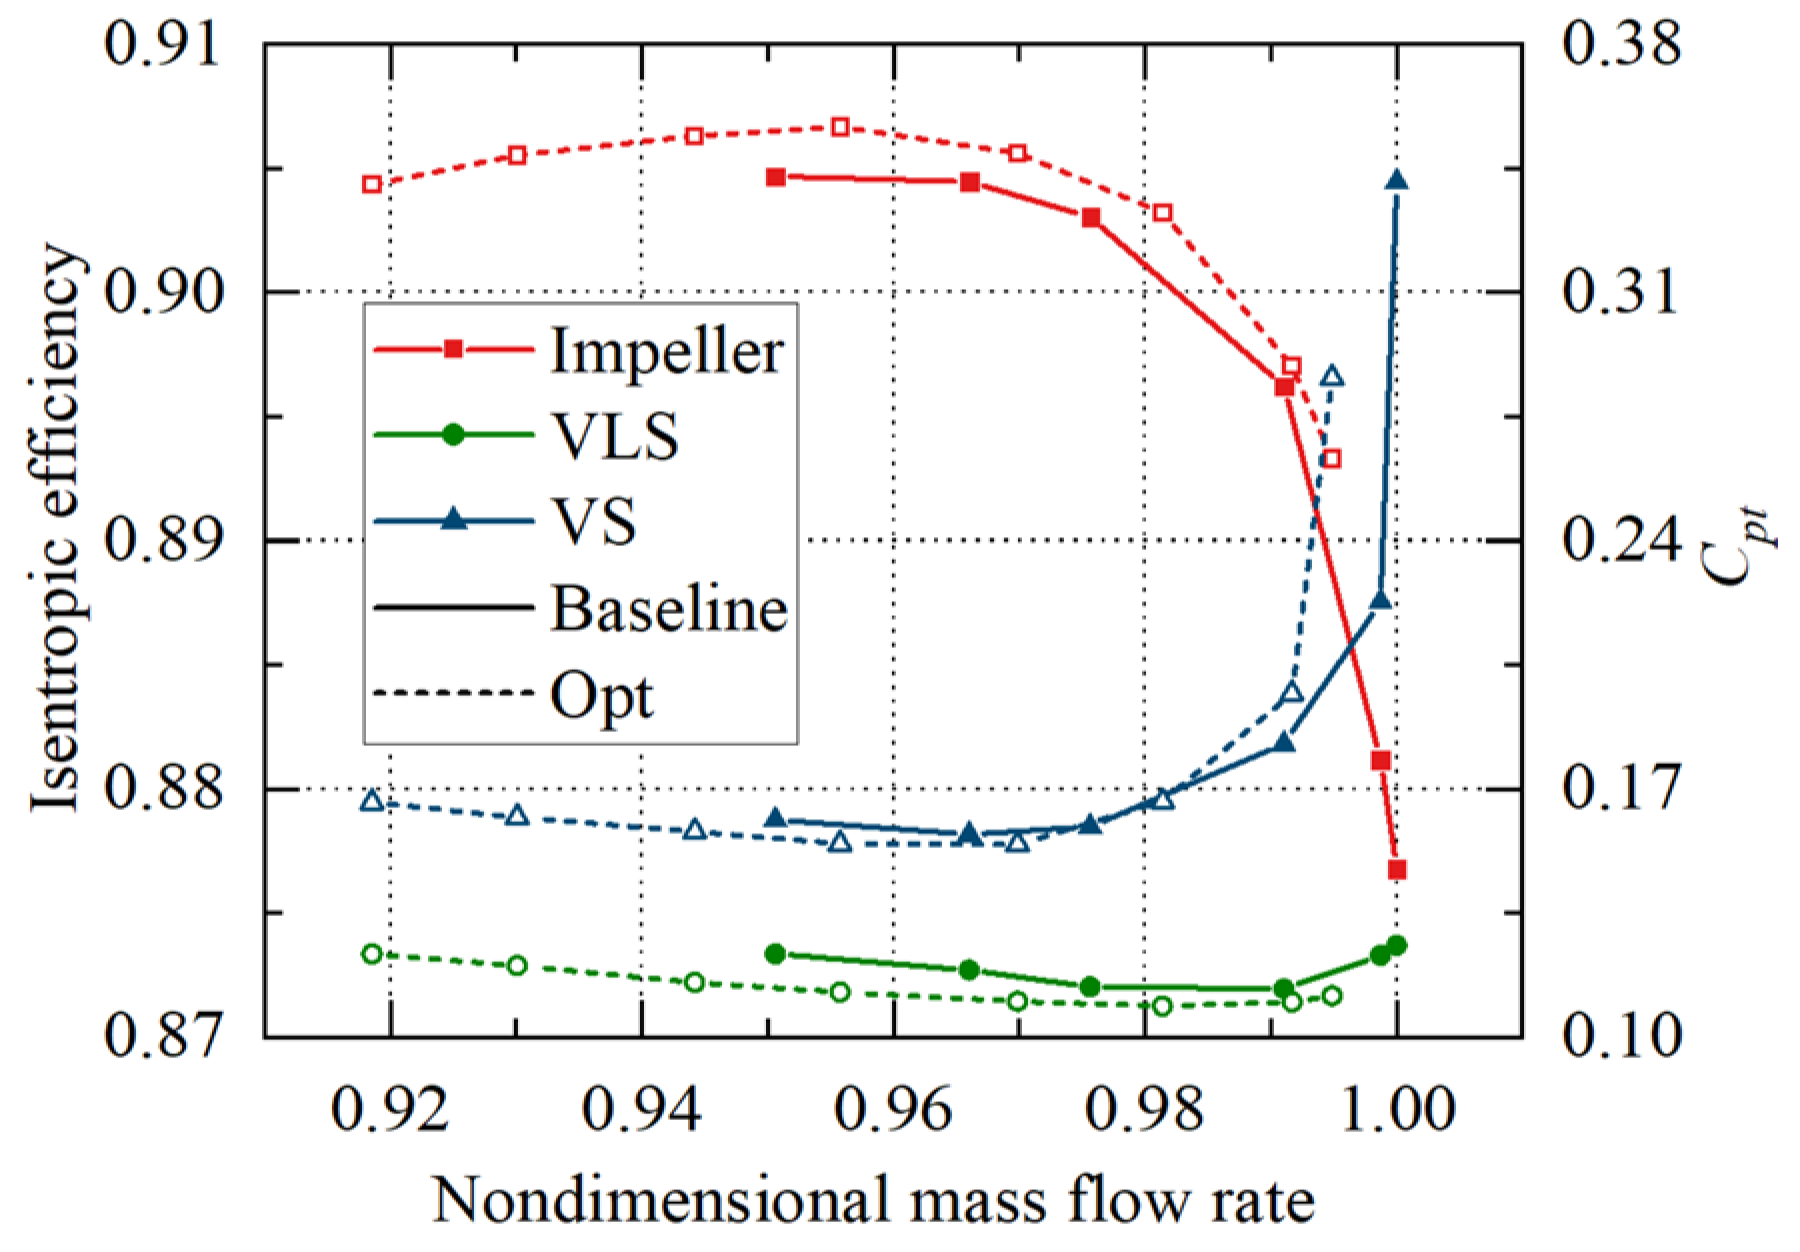
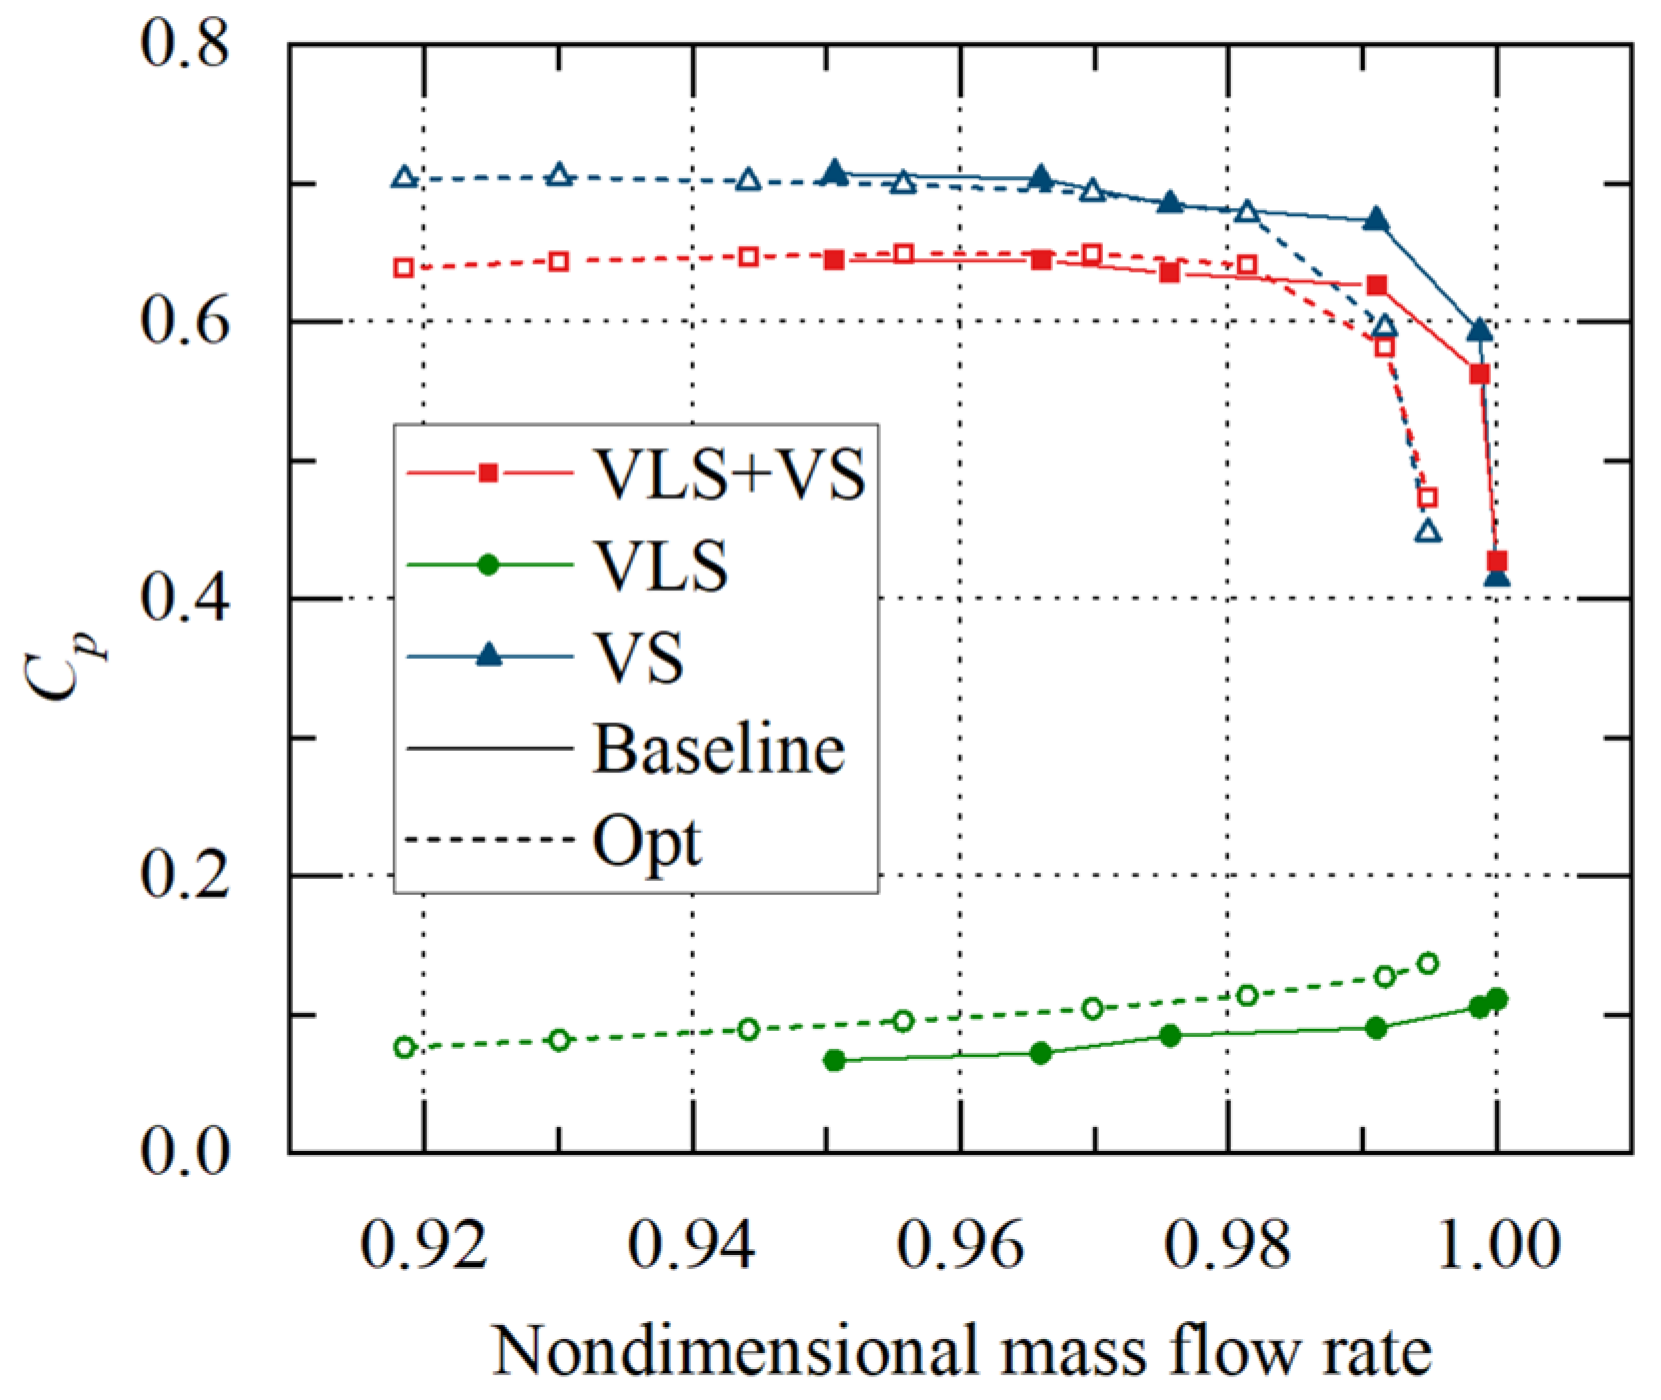
3.2. Comparison Peak Efficiency Point
4. Conclusions
- The study confirms the feasibility of enhancing centrifugal compressor efficiency and operating range by optimizing the diffuser’s hub contour. The optimized centrifugal compressor showed a 0.78% increase in isentropic efficiency and a 7.6% enhancement in the stable operating margin, from 12.8% to 20.4%, compared with the baseline.
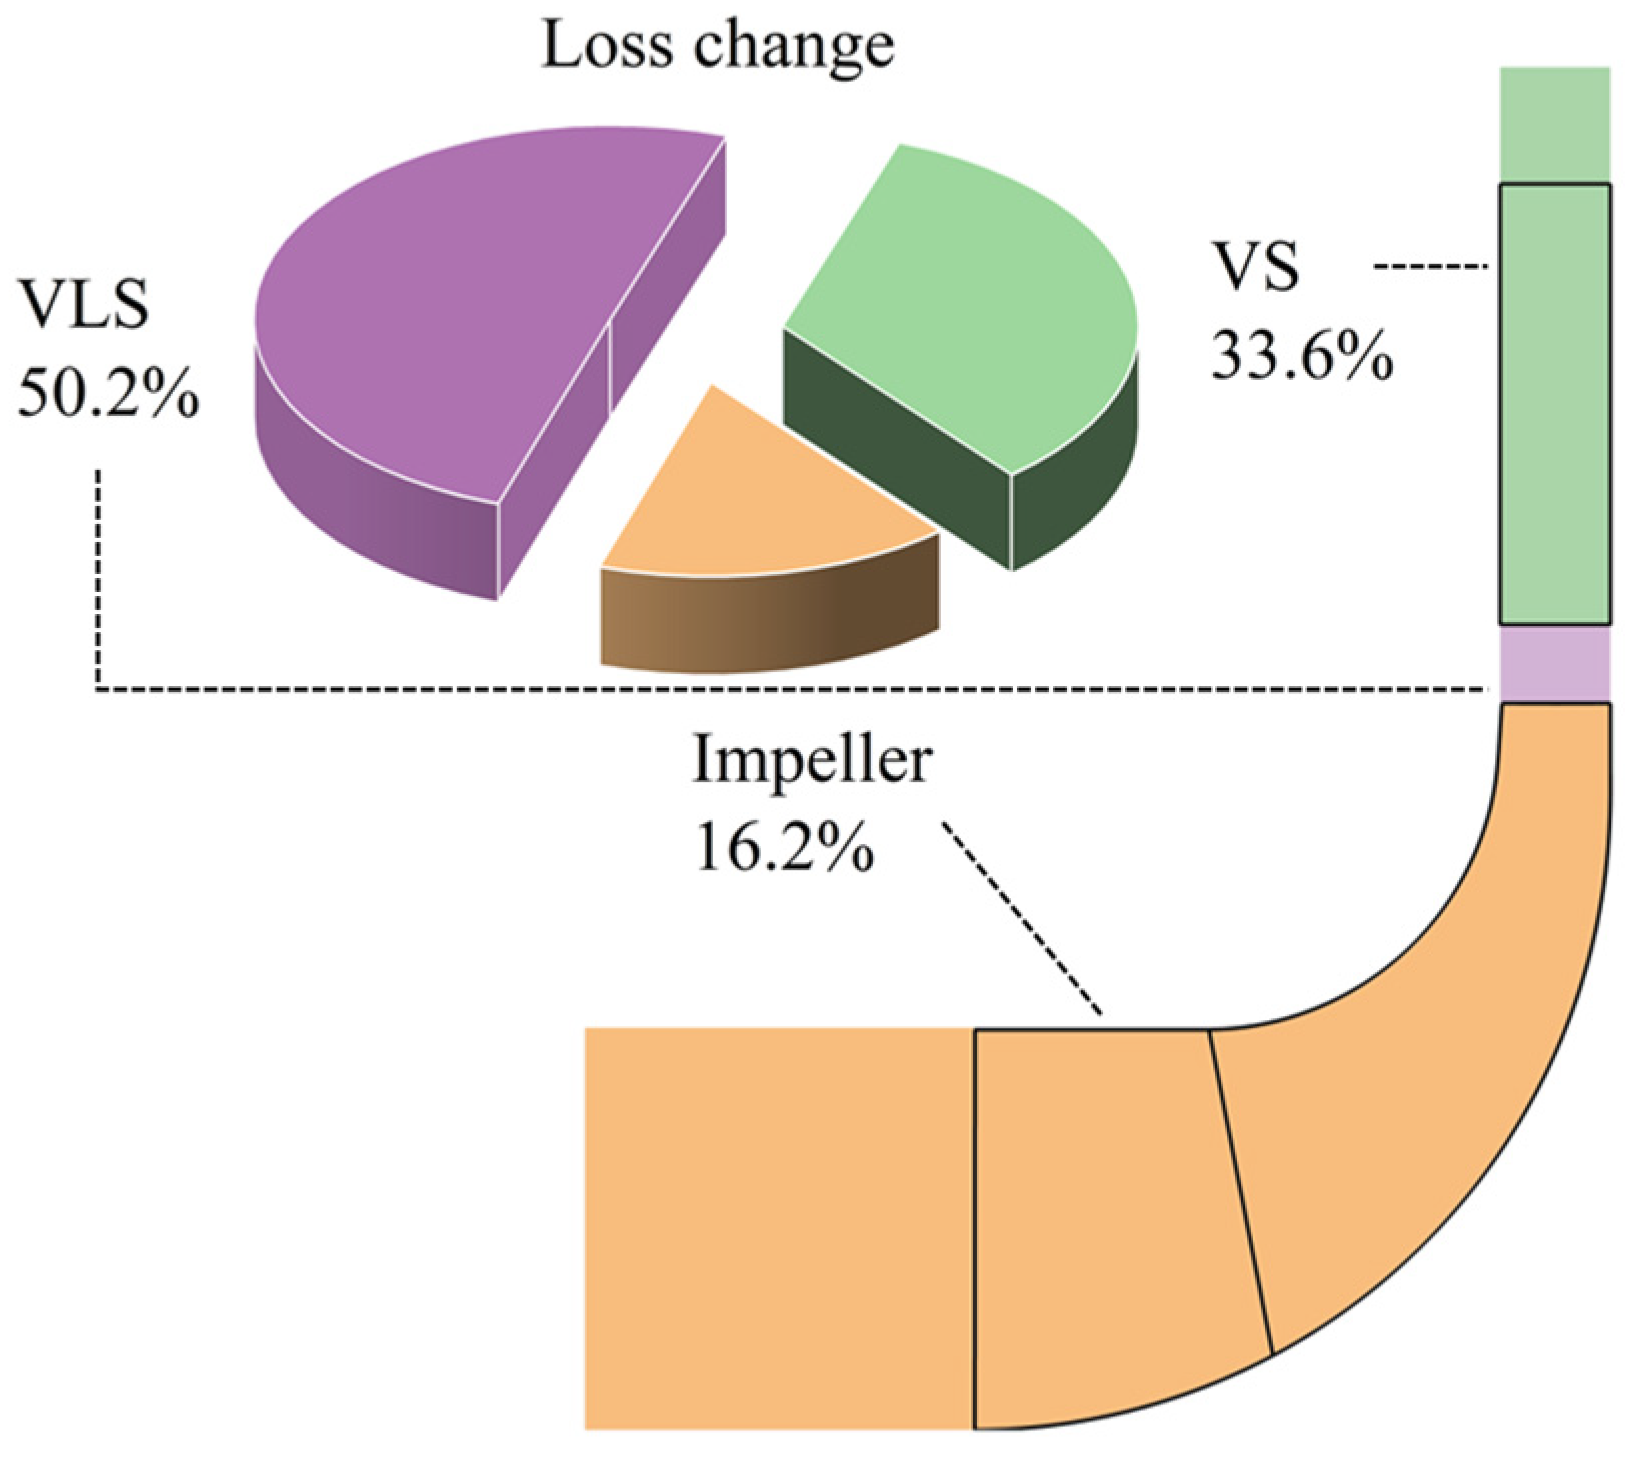
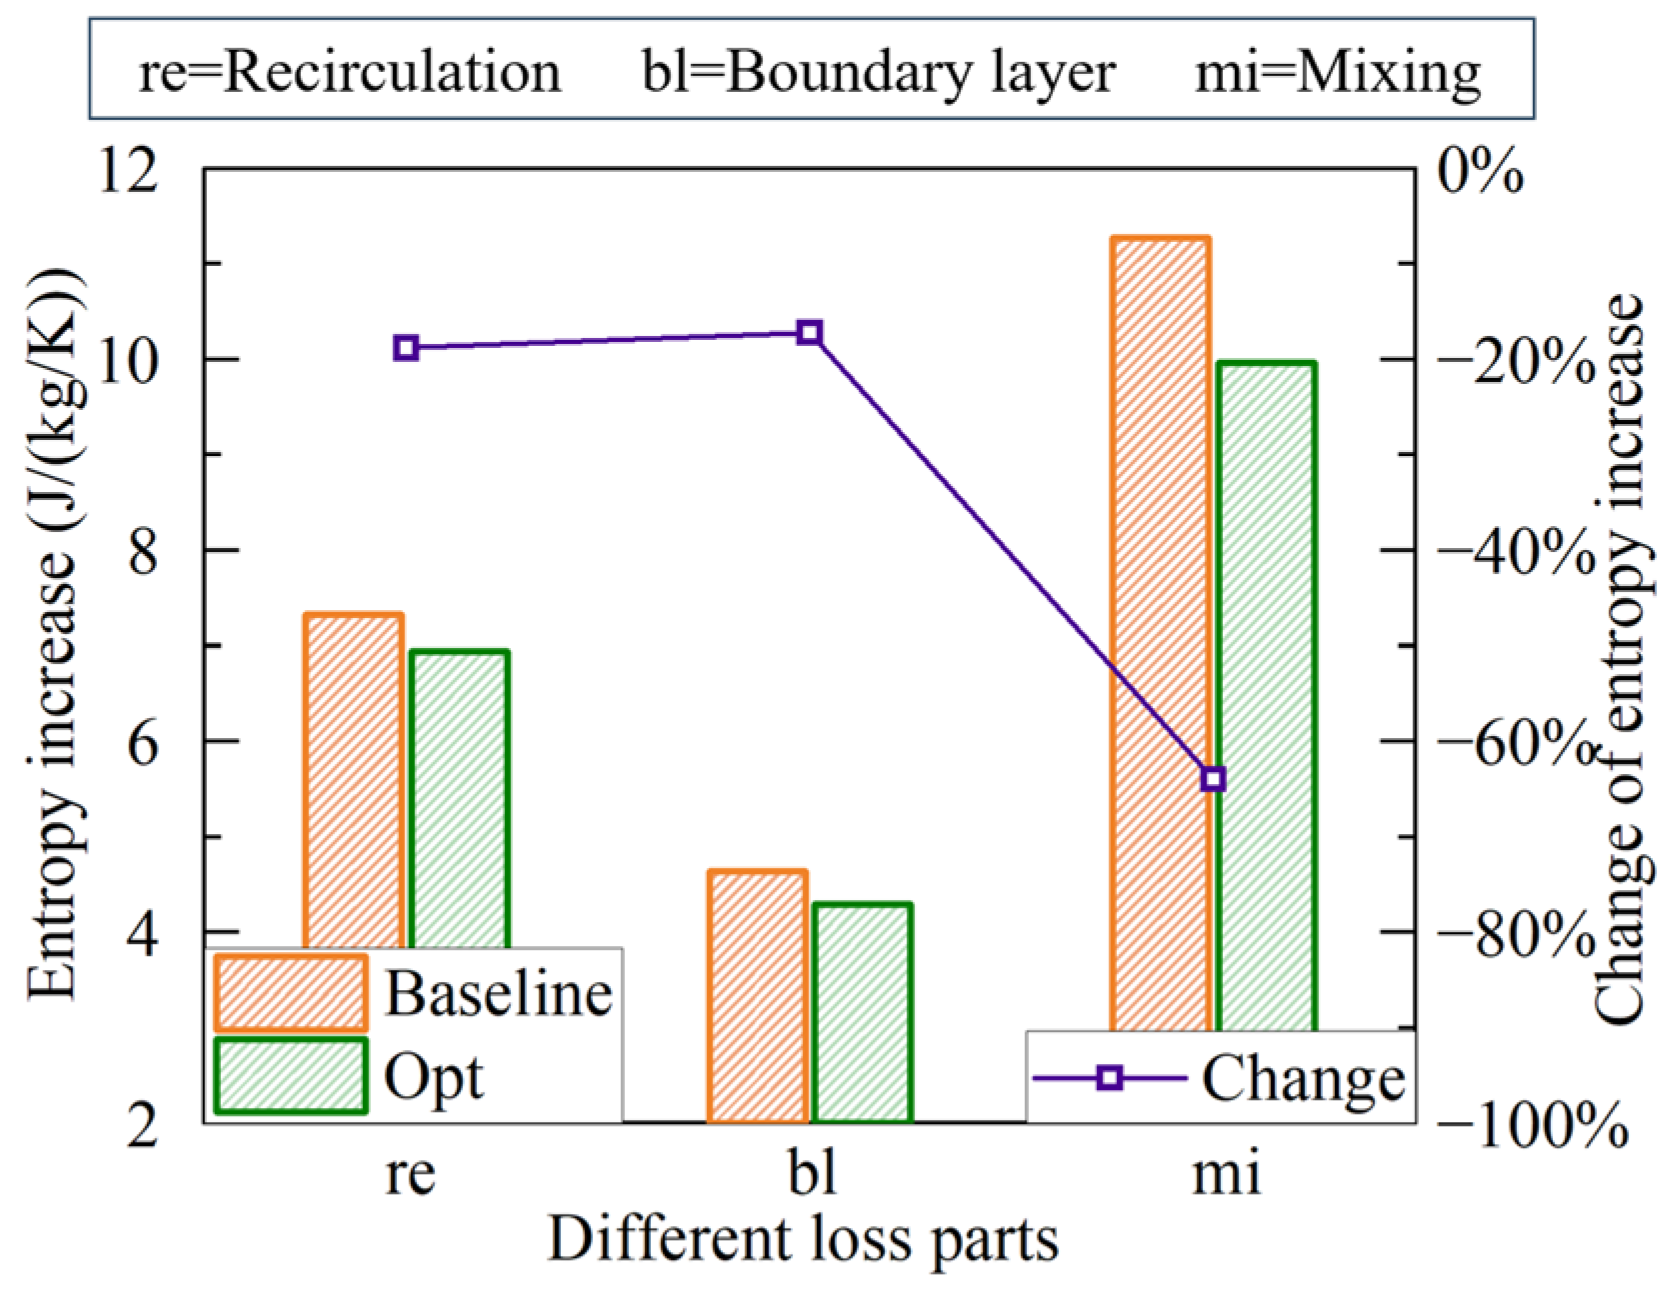
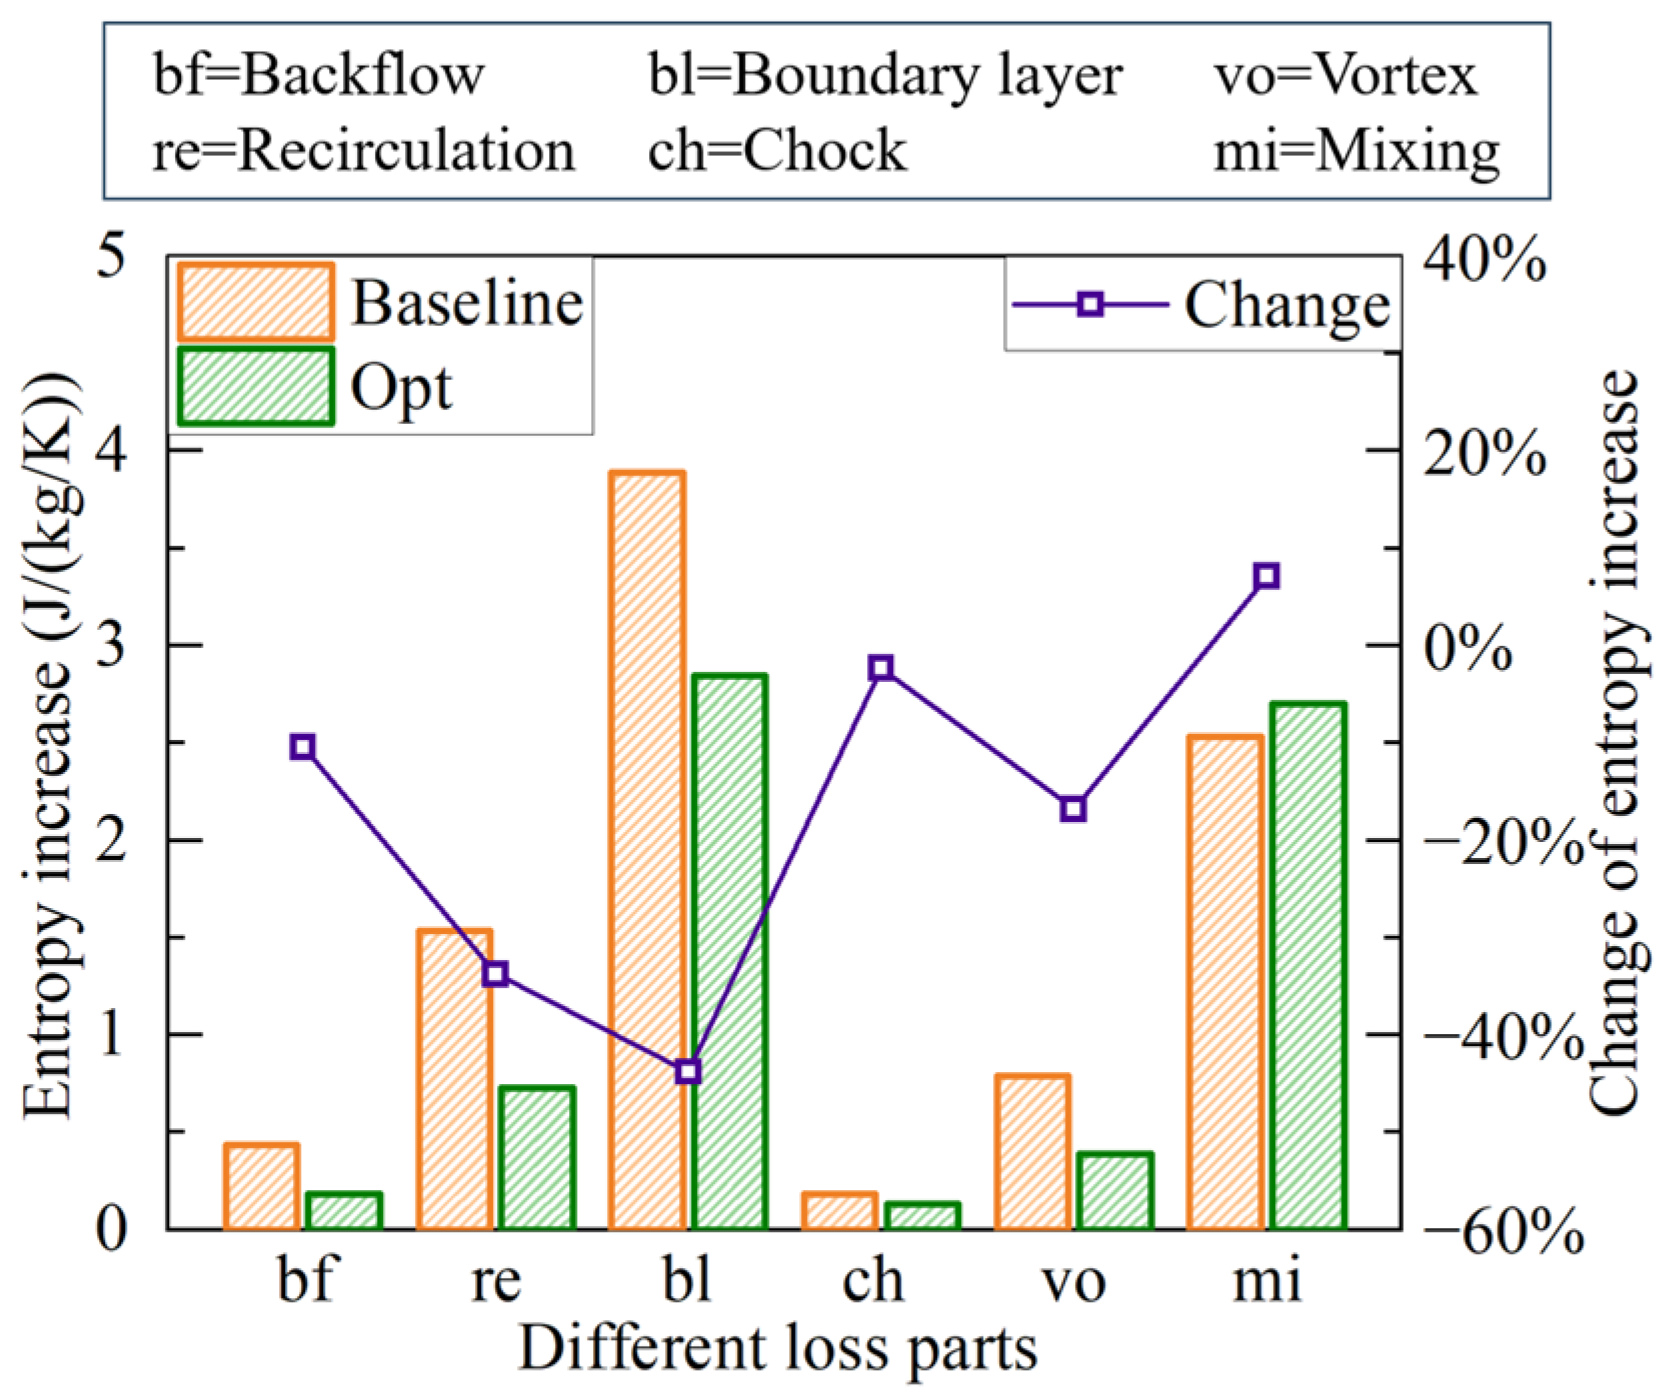
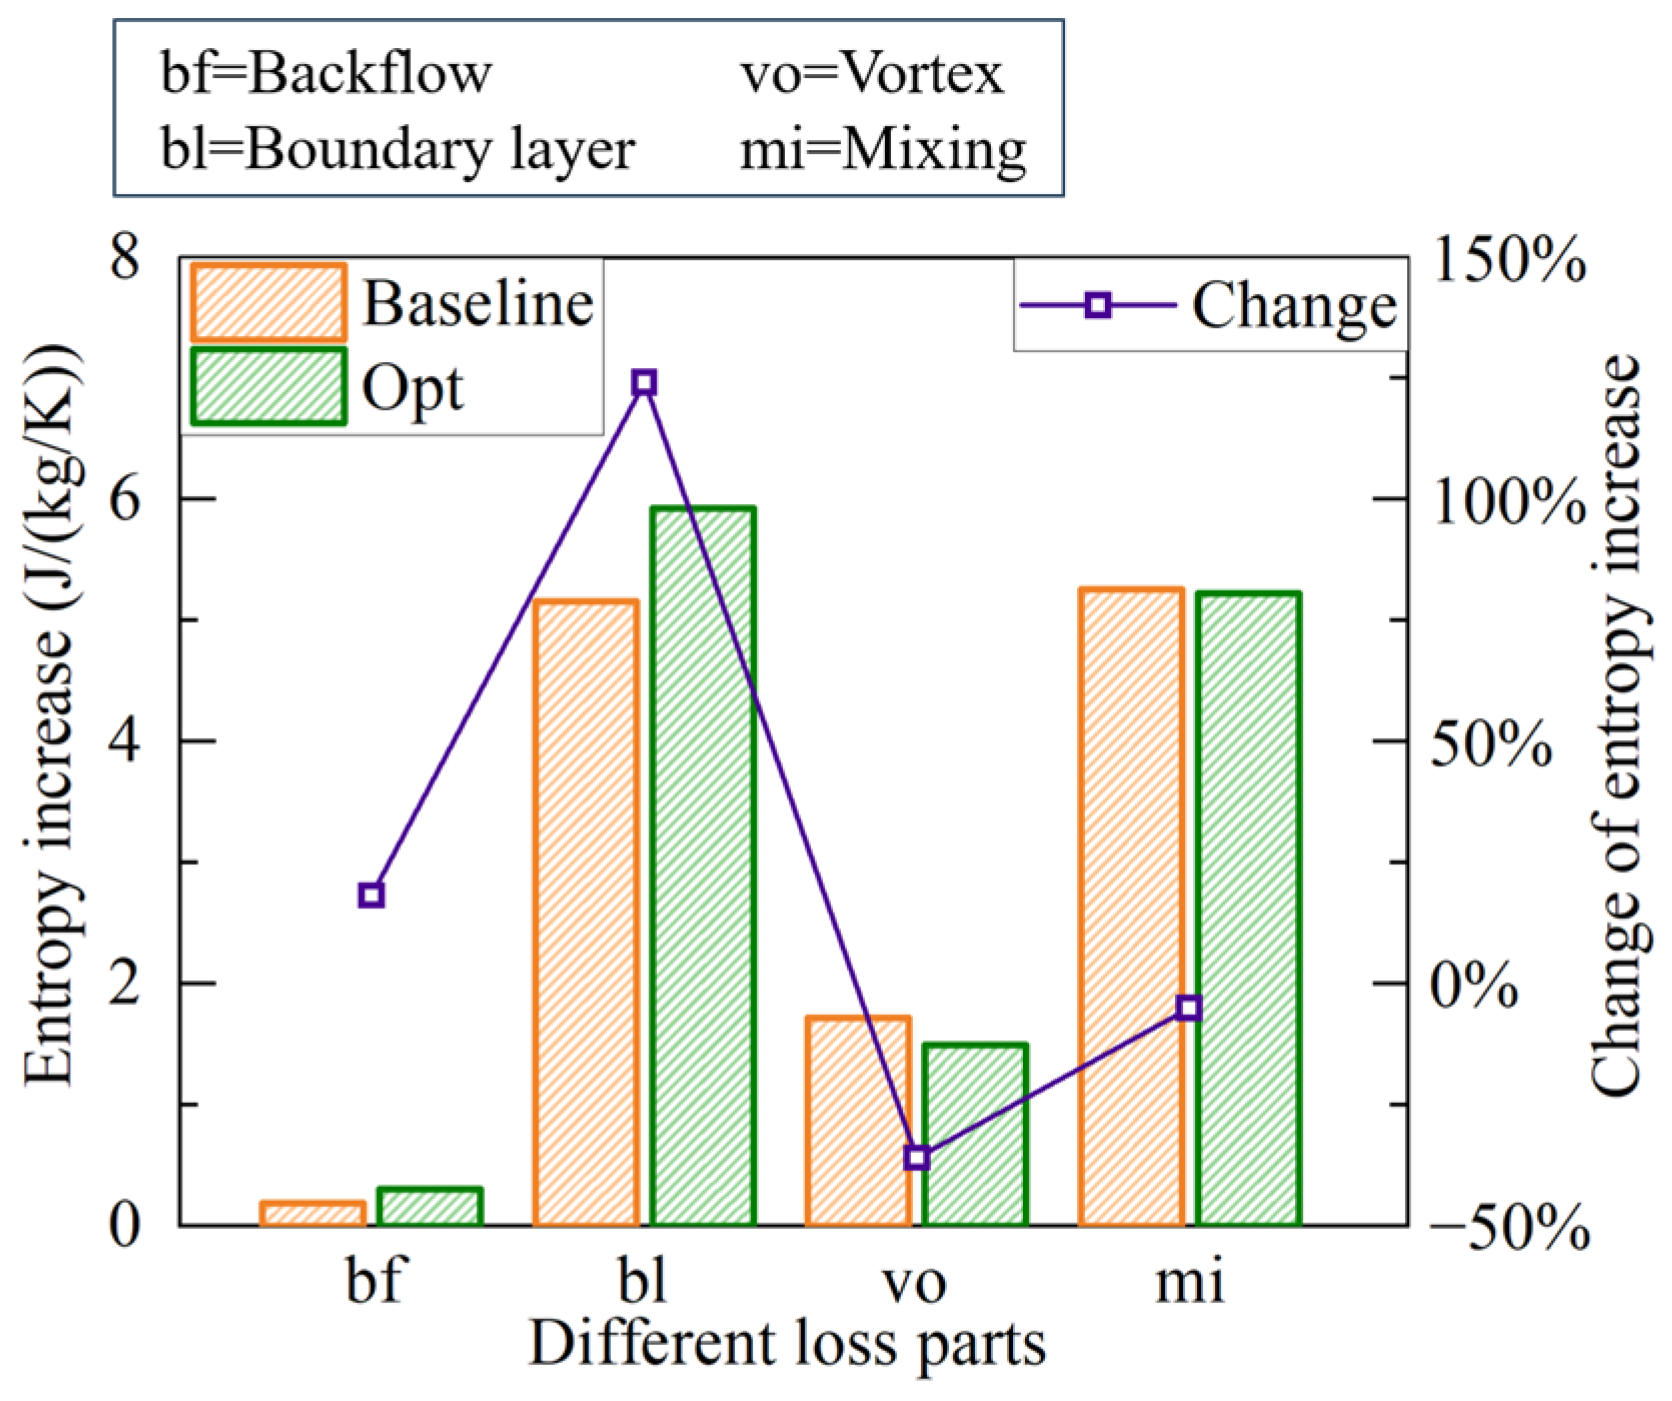
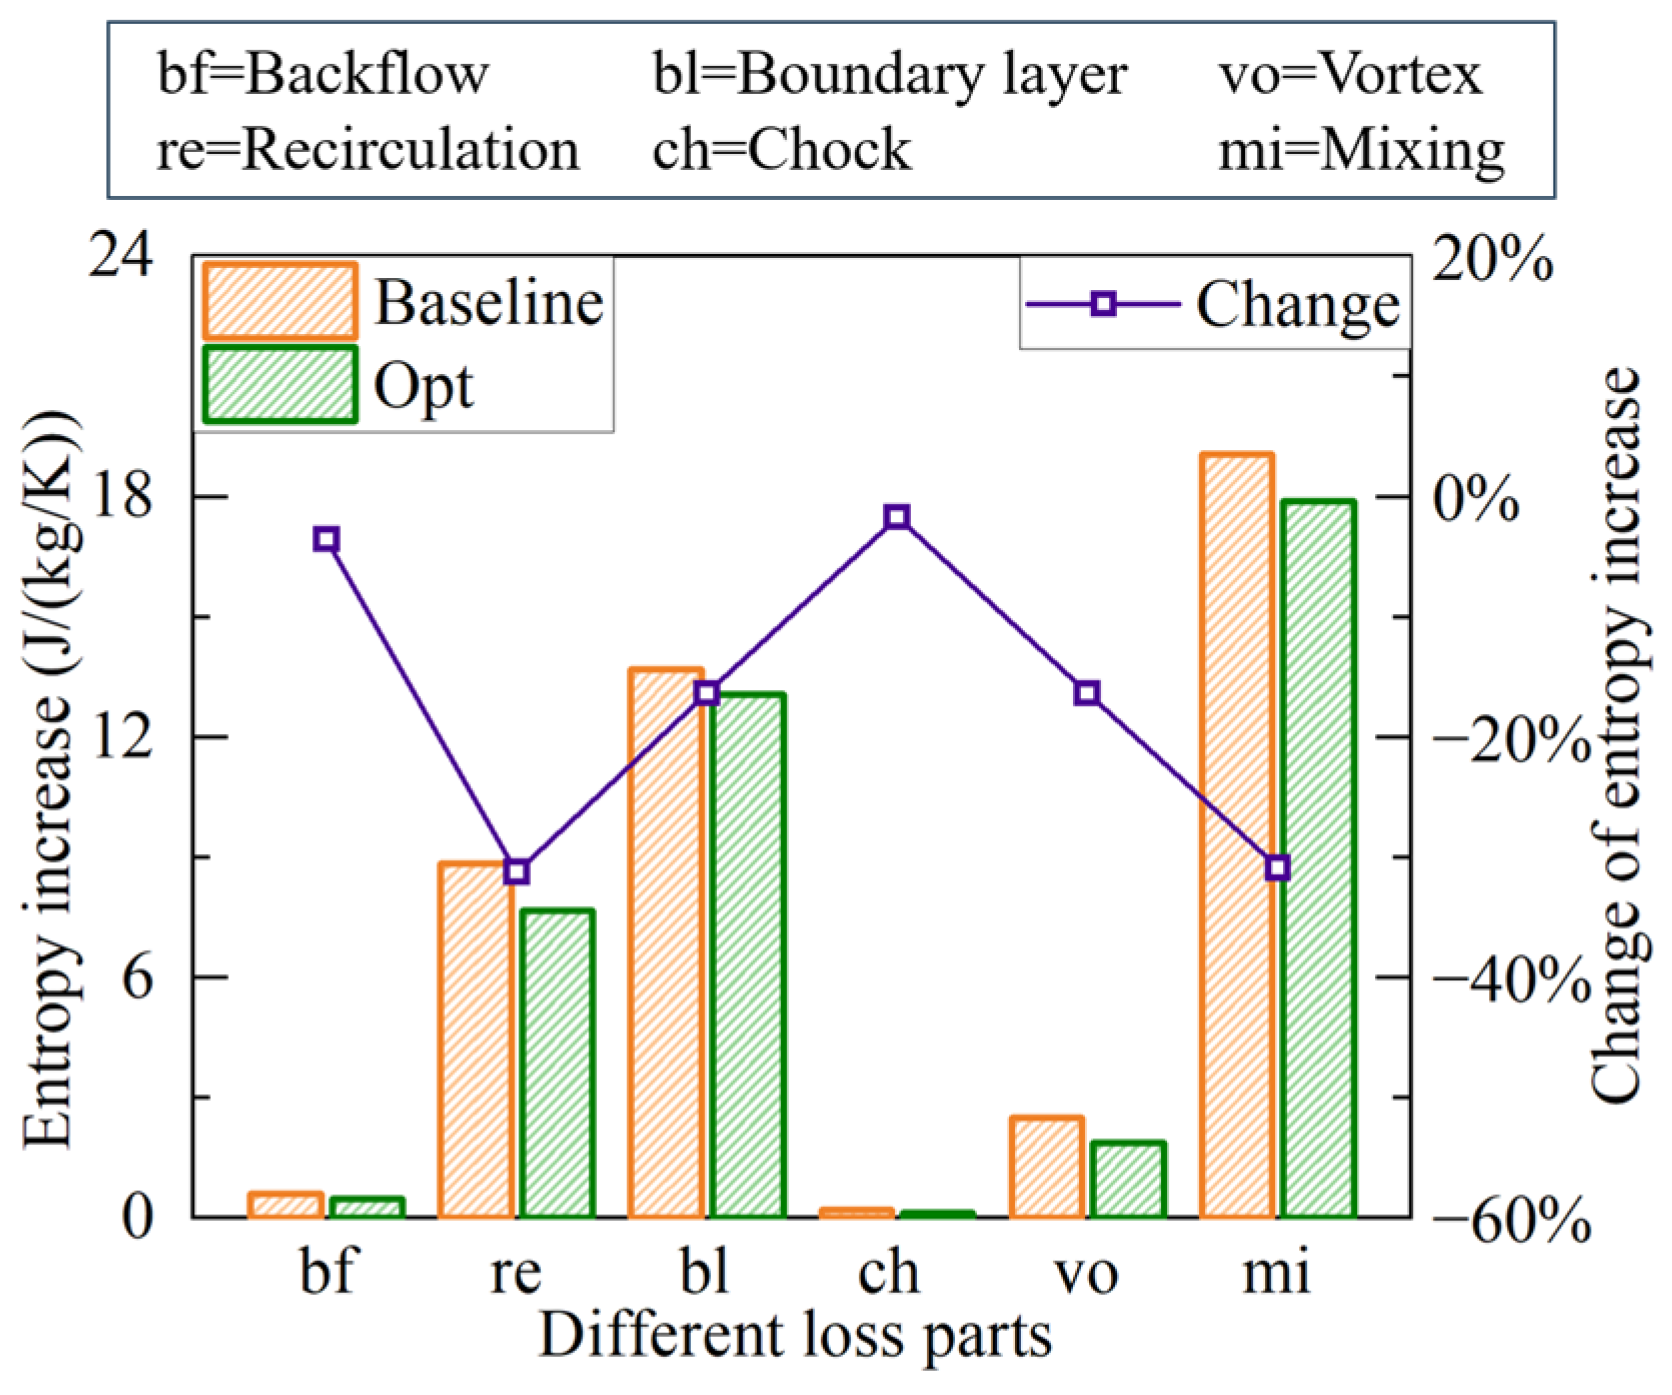
- Optimizing the hub contour significantly affects the centrifugal compressor’s diffuser components. Diffuser loss reduction accounts for 83.8% of the compressor’s overall loss variation, with 50.2% from the vaneless space and 33.6% from the vane space region. Reductions in recirculation and mixing loss were especially notable in the loss classification.
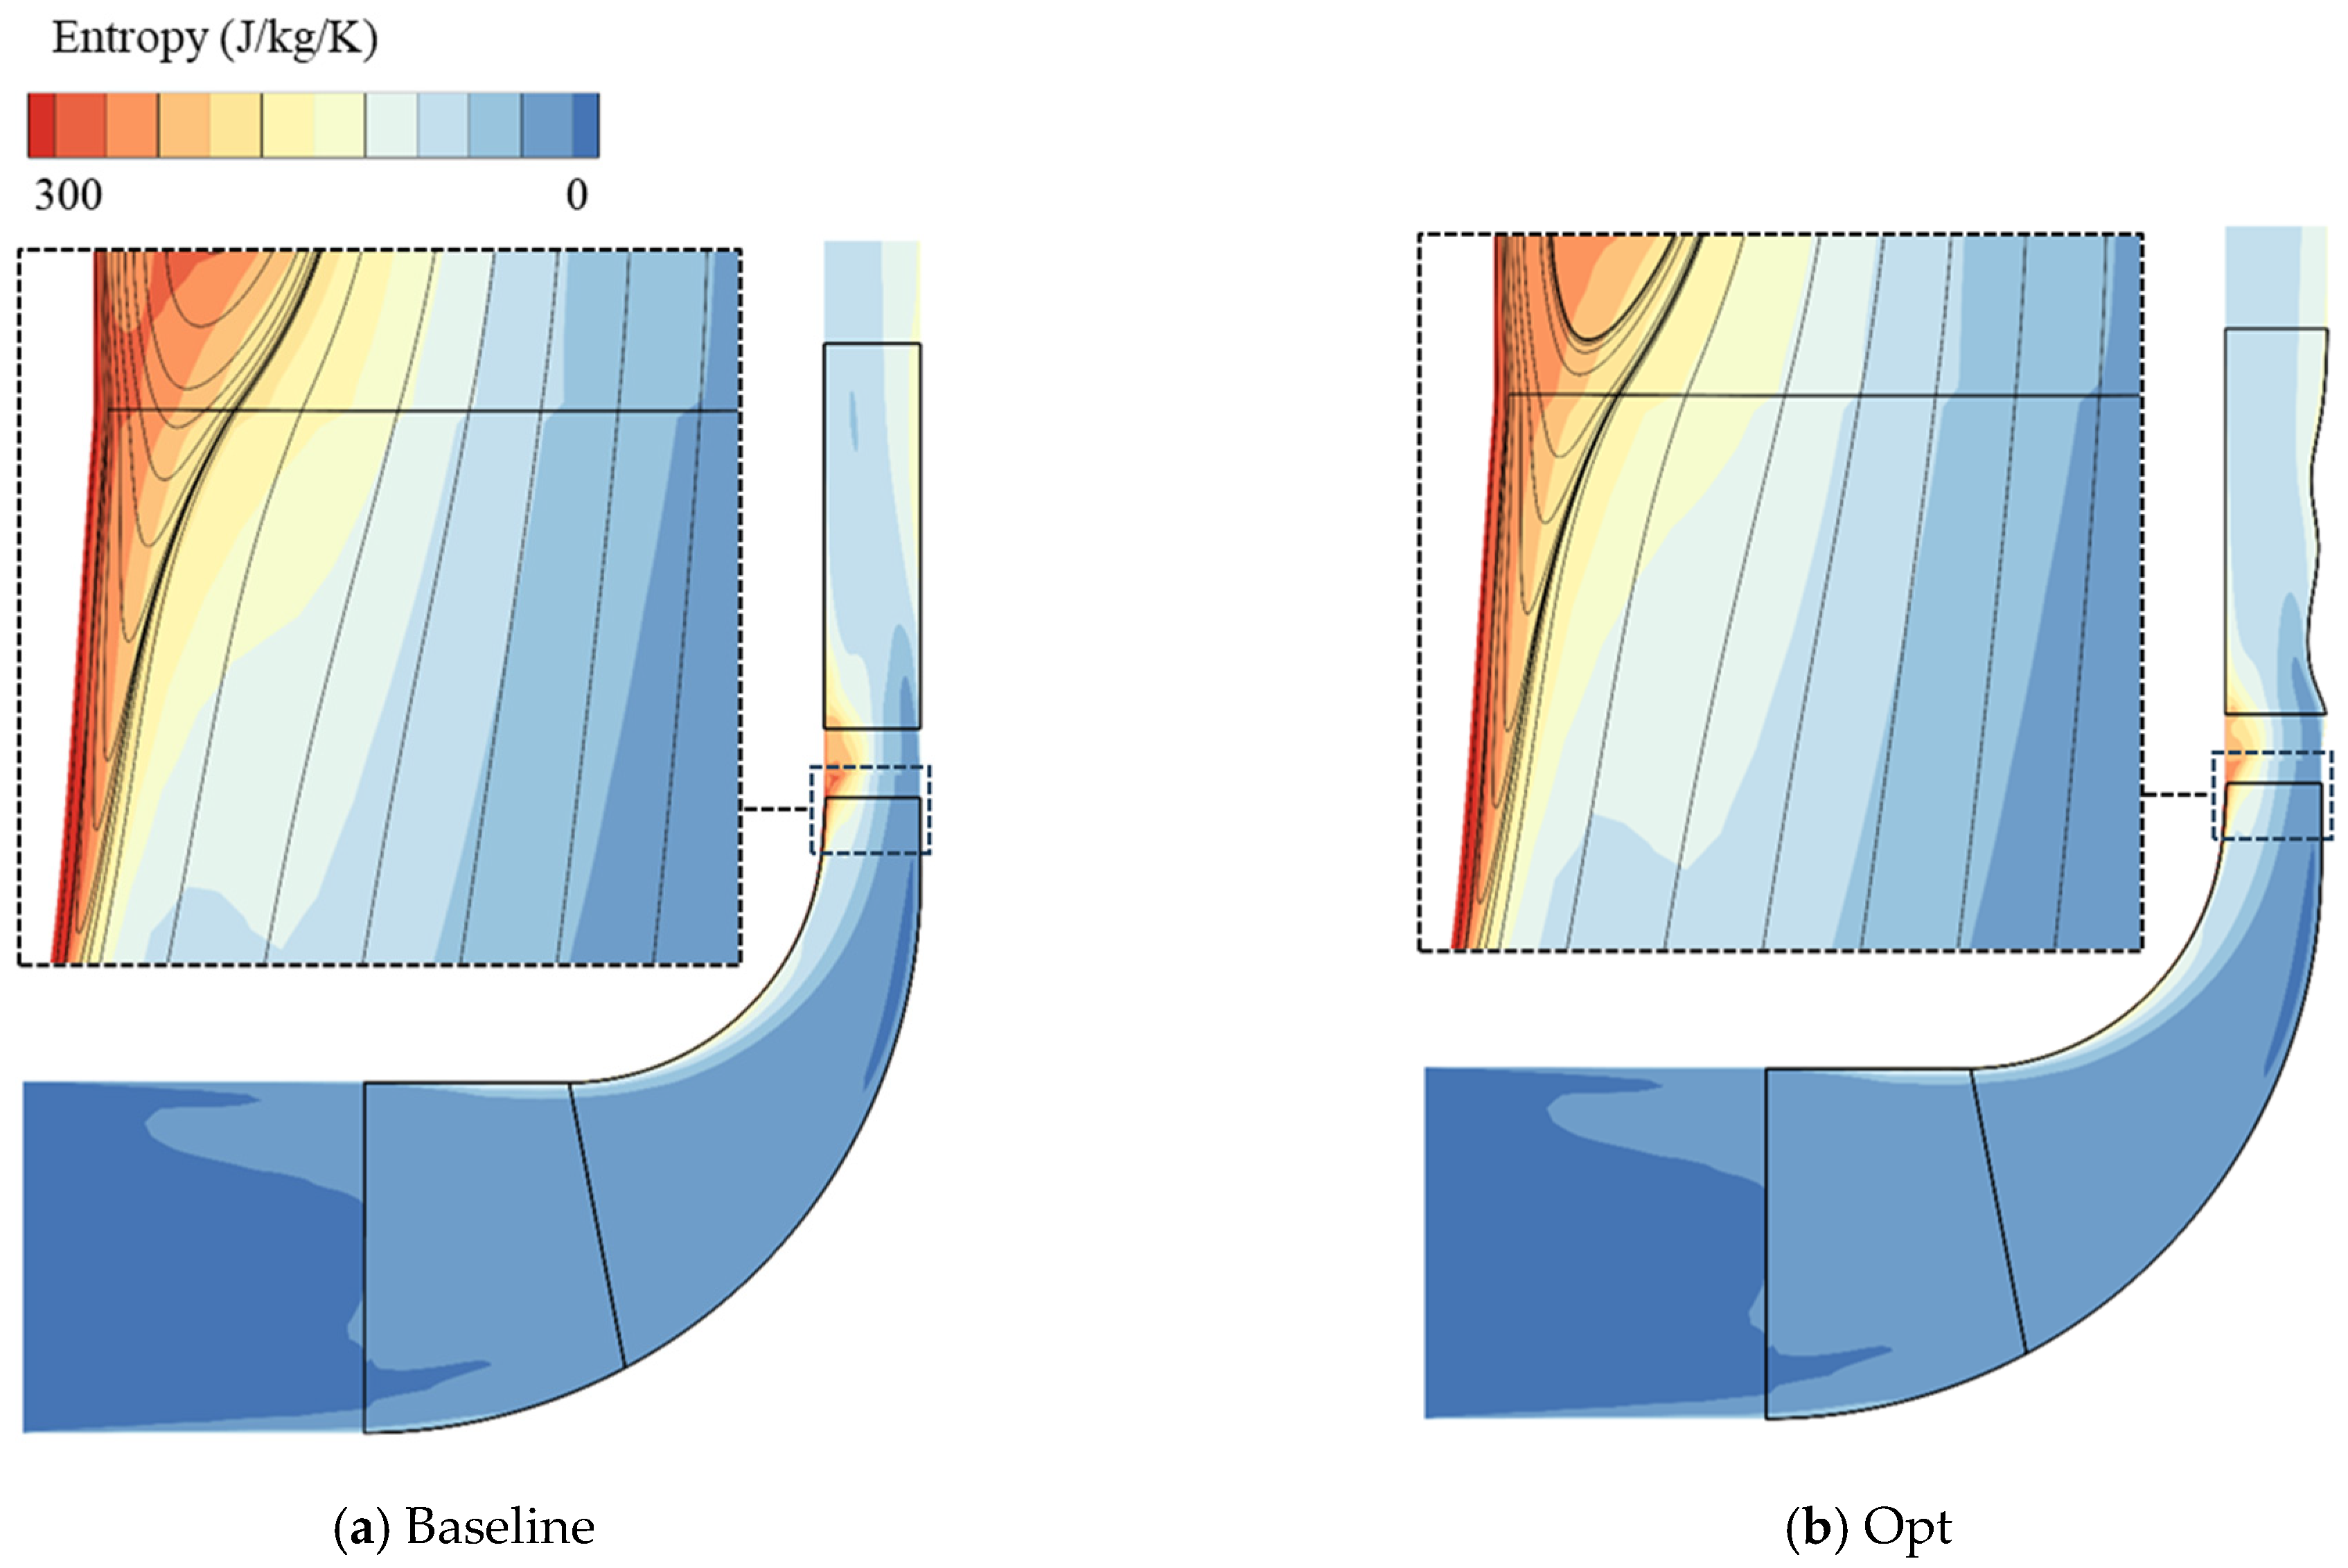
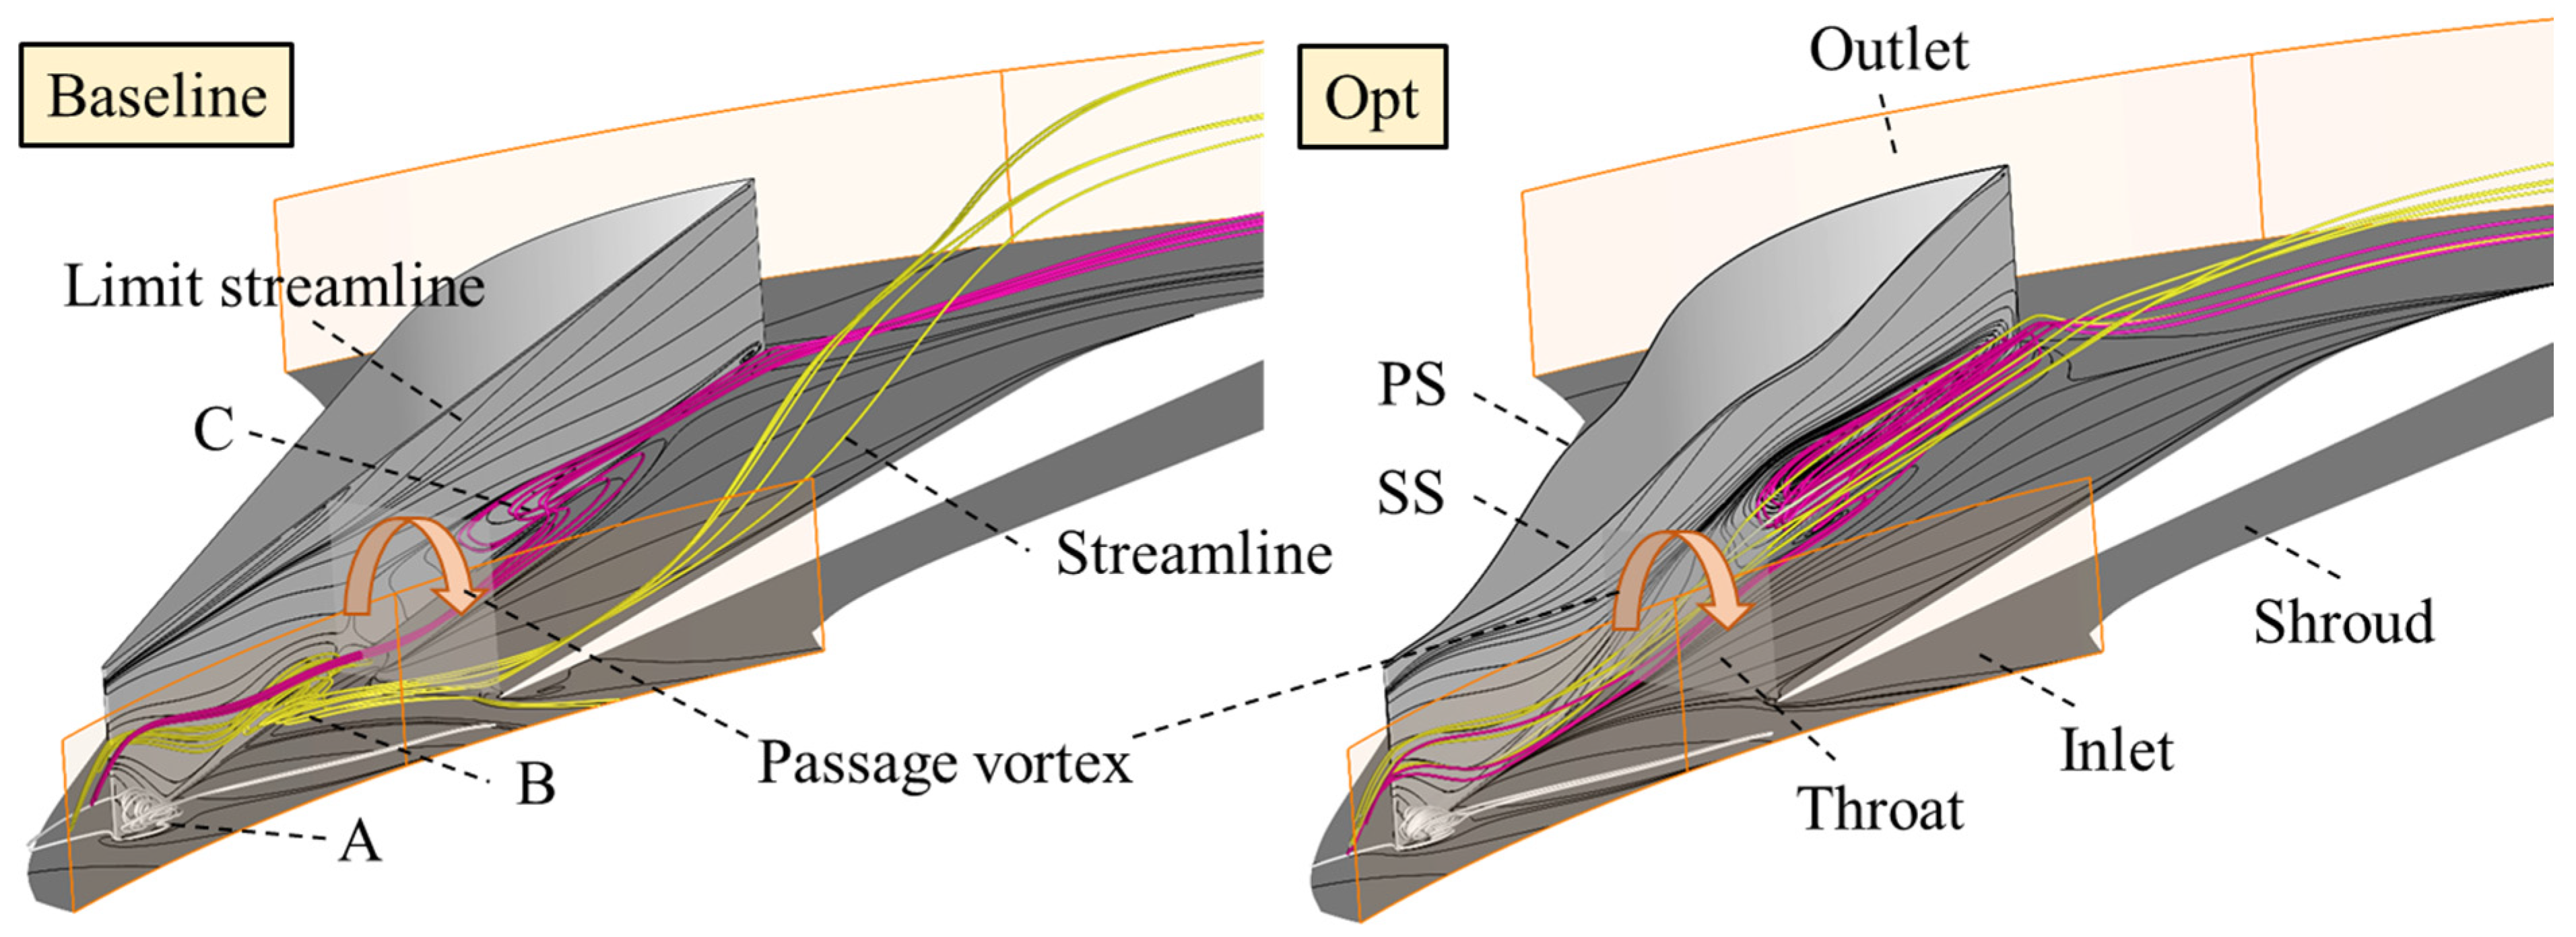
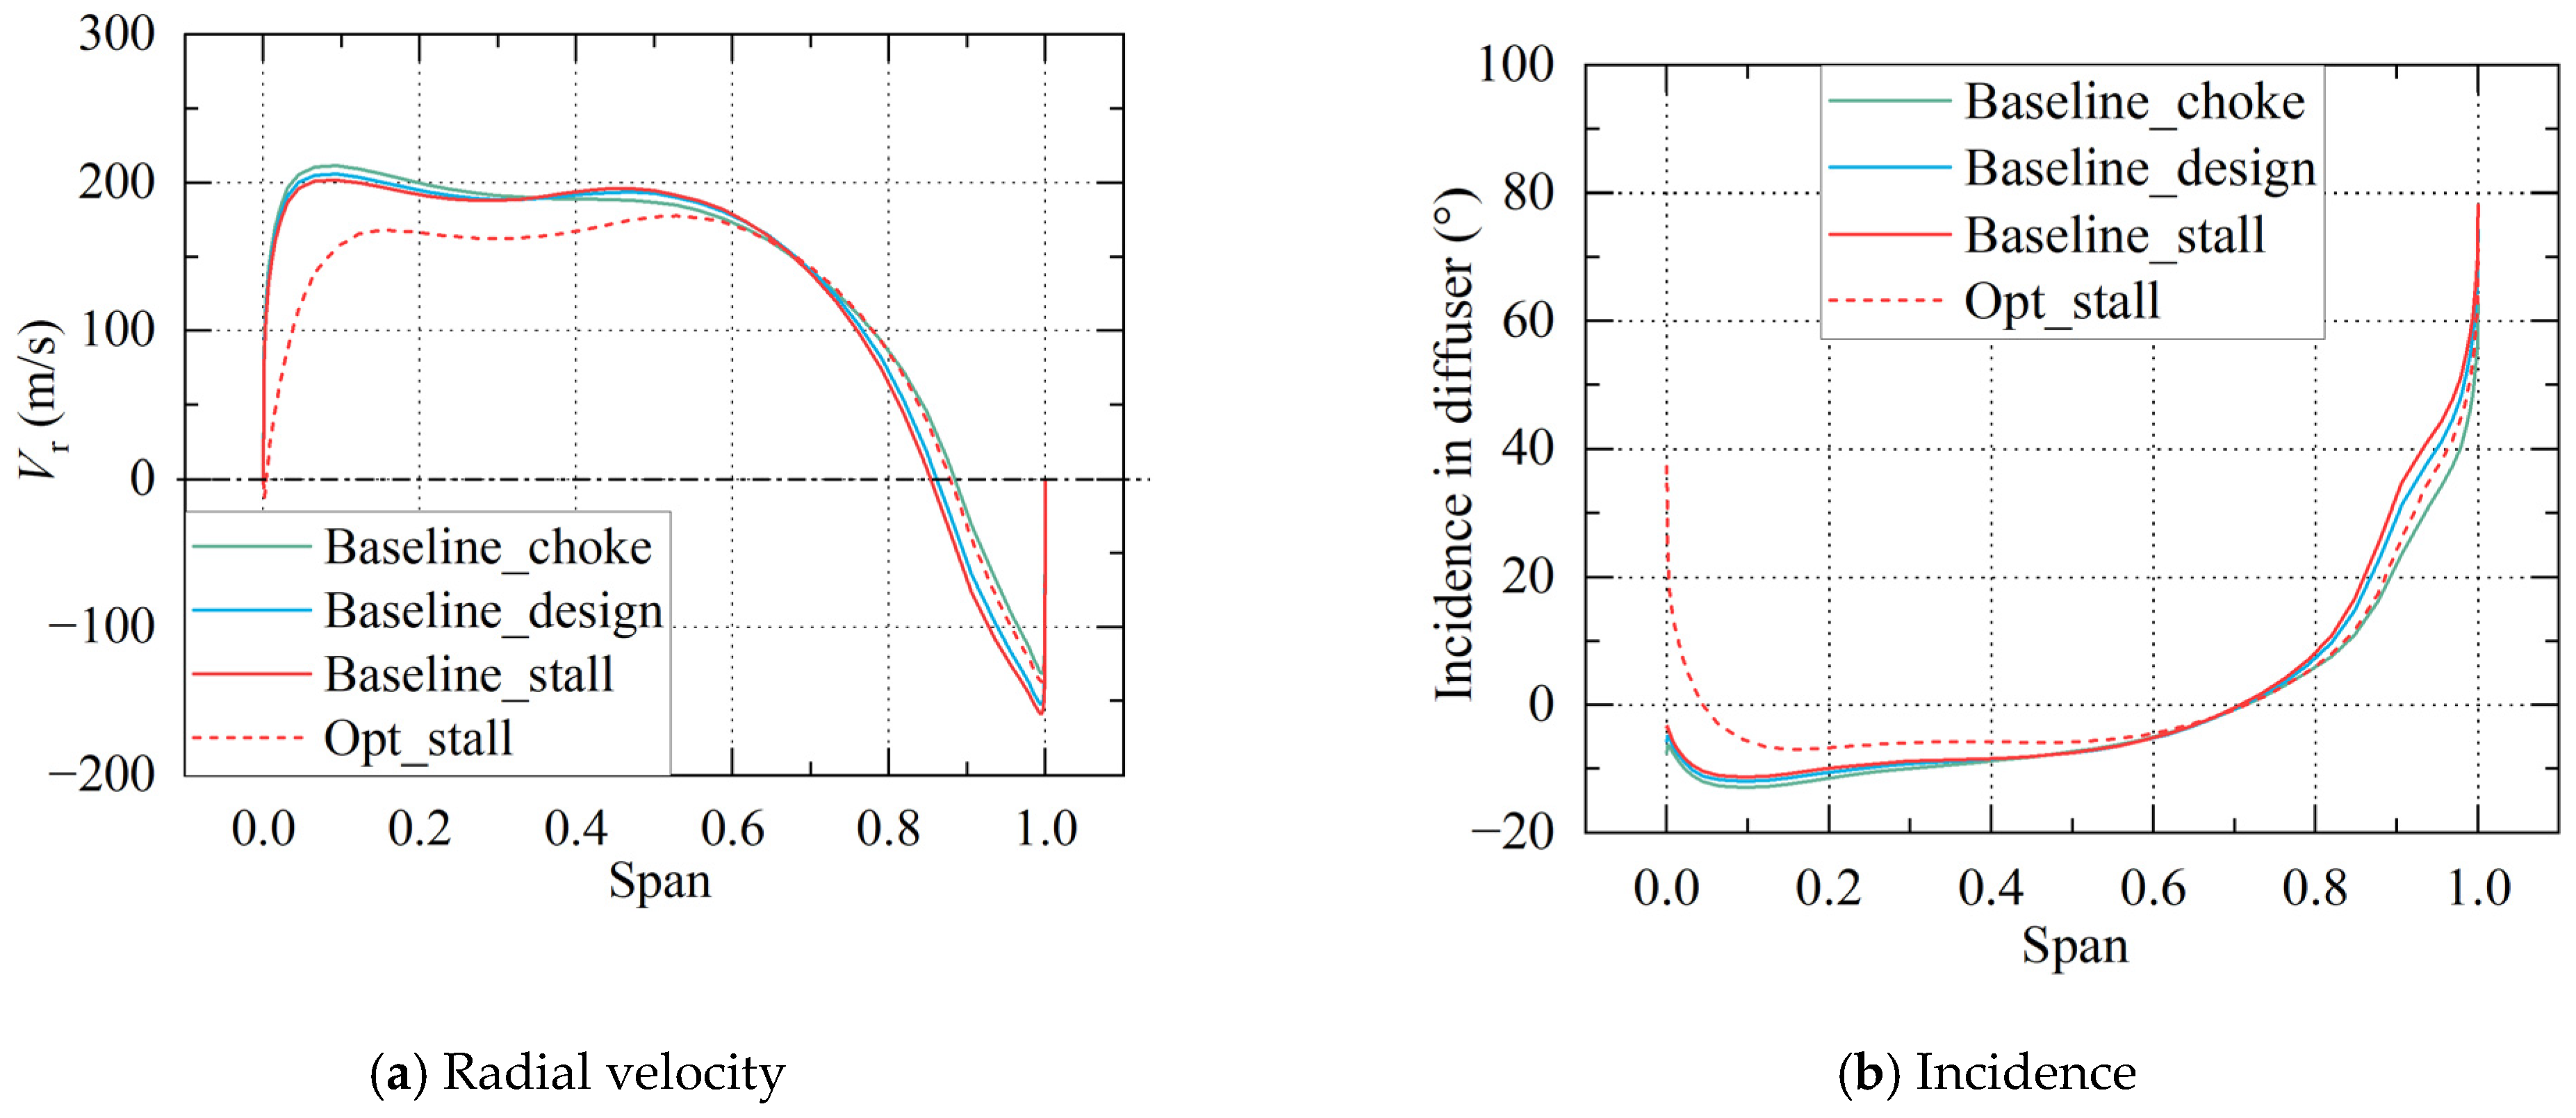
- After adopting the optimized hub contour, radial velocity flow distribution in the diffuser’s vaneless space becomes more uniform, with decreased flow angles at high spanwise locations. Consequently, recirculation flow suppression in the vaneless and semi-vaneless regions improves compressor stability and enables operation at lower mass flow conditions.
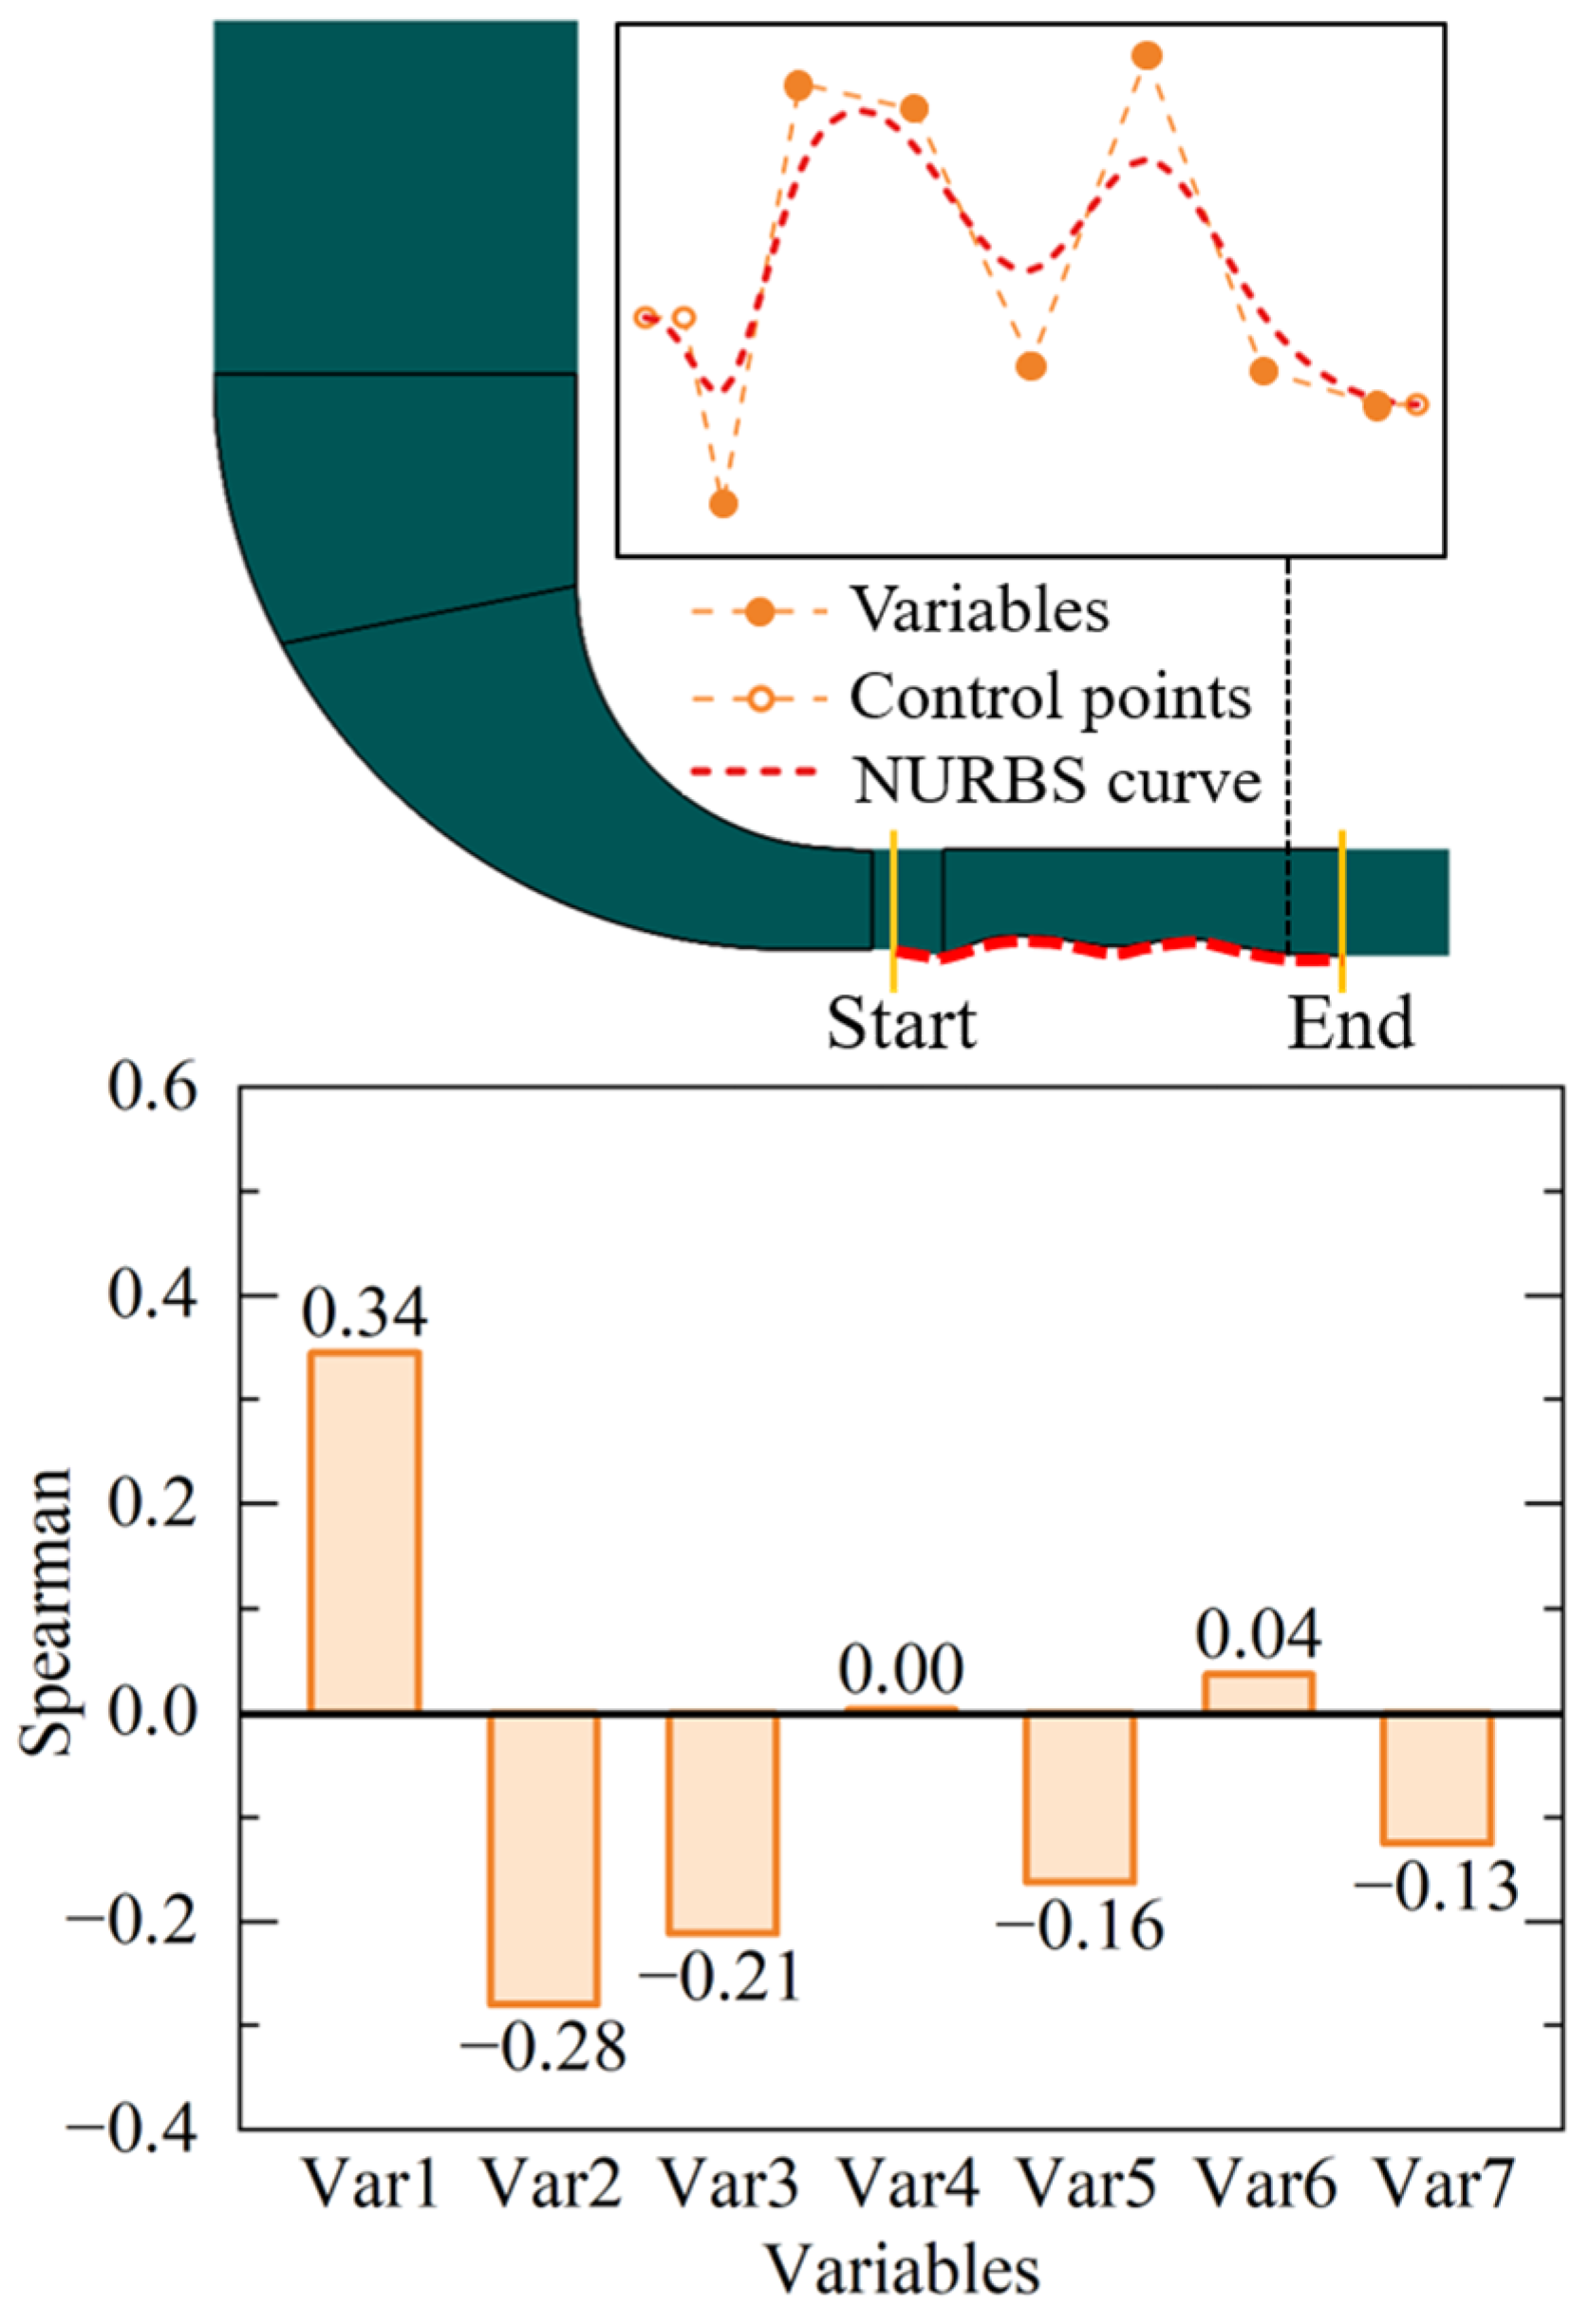
- Analysis reveals that no individual variable determines the compressor’s isentropic efficiency, highlighting the interdependence of variables during optimization. However, the first three variables near the diffuser’s leading edge have a greater influence on the compressor’s isentropic efficiency.
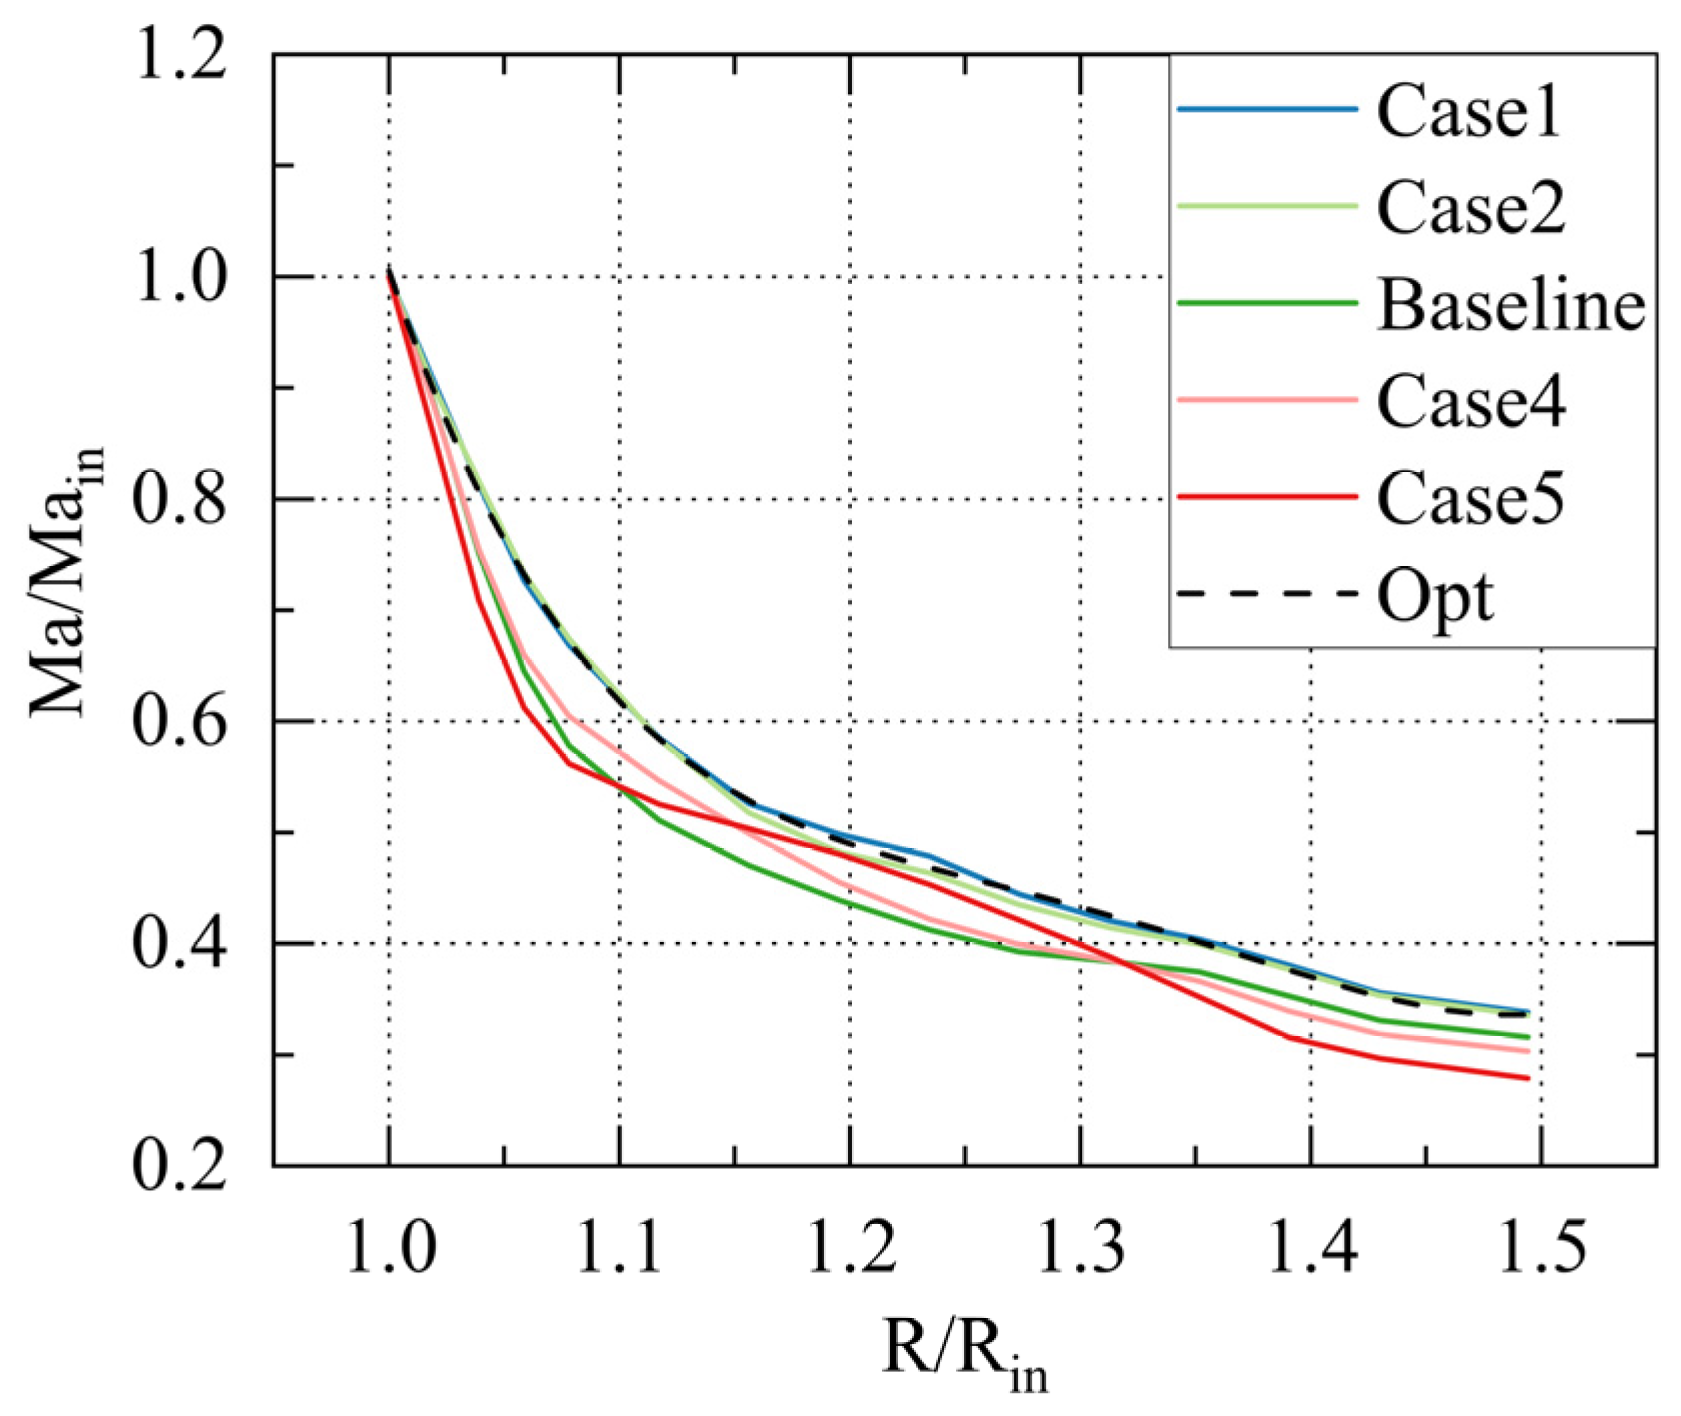
- An examination of the Mach number distribution in the diffuser indicates that the Mach number variation at the diffuser inlet significantly impacts efficiency. Under transonic or supersonic inflow conditions of the diffuser, adherence to the provided rules for Mach number distribution in this paper can minimize diffuser losses.
Author Contributions
Funding
Data Availability Statement
Conflicts of Interest
Abbreviations
| PS | pressure surface |
| SS | suction surface |
| VLS | vaneless space |
| SVLS | semi-vaneless space |
| VP | vaned passage |
| Var | variable |
| SM | stall margin |
| π | total pressure ratio |
| m | mass flow rate |
| MC | mass flow rate change in choke point |
| V | velocity |
| L | work |
| k | adiabatic coefficient |
| R | gas constant |
| η | efficiency |
| P | pressure |
| T | temperature |
| Cpt | total pressure loss coefficient |
| Cp | static pressure recovery coefficient |
| s | specific entropy |
| ρ | density |
| Φ | local dissipation coefficient |
| τ | friction stress tensor |
| u | velocity component in cartesian coordinate |
| λ | thermal conductivity coefficient |
| temperature after Reynold average | |
| μ | dynamic viscosity |
| span | spanwise (from bottom to top of the blade) |
| r | Spearman rank coefficient |
| Subscripts | |
| stall | stall condition |
| design | design condition |
| Opt | optimization case |
| t | total parameter |
| ideal | ideal condition |
| actual | actual condition |
| in | inlet |
| out | outlet |
| r | radial |
| c | core |
References
- Krain, H. Review of Centrifugal Compressor’s Application and Development. J. Turbomach. 2005, 127, 25–34. [Google Scholar] [CrossRef]
- Hong, S.; Chi, J.; Xiang, X.; Lu, W. Theoretical Model and Numerical Analysis of the Tip Leakage Vortex Variations of a Centrifugal Compressor. Aerospace 2022, 9, 830. [Google Scholar] [CrossRef]
- Kenny, D.P. A Novel Low-Cost Diffuser for High-Performance Centrifugal Compressors. J. Eng. Power 1969, 91, 37–46. [Google Scholar] [CrossRef]
- Casey, M.; Robinson, C. Radial Flow Turbocompressors: Design, Analysis, and Applications, 1st ed.; Cambridge University Press: Cambridge, UK, 2021; ISBN 978-1-108-24166-3. [Google Scholar]
- Yoshinaga, Y.; Gyobu, I.; Mishina, H.; Koseki, F.; Nishida, H. Aerodynamic Performance of a Centrifugal Compressor with Vaned Diffusers. J. Fluids Eng. 1980, 102, 486–493. [Google Scholar] [CrossRef]
- Abdelwahab, A.; Gerber, G. A new three-dimensional aerofoil diffuser for centrifugal compressors. Proc. Inst. Mech. Eng. Part A J. Power Energy 2008, 222, 819–830. [Google Scholar] [CrossRef]
- Issac, J.M.; Sitaram, N.; Govardhan, M. Effect of diffuser vane height and position on the performance of a centrifugal compressor. Proc. Inst. Mech. Eng. Part A J. Power Energy 2004, 218, 647–654. [Google Scholar] [CrossRef]
- Erickson, R.D.; Simon, T.W.; Zhang, L.; Moon, H.-K. Experimental Investigation of Disc Cavity Leakage Flow and Hub Endwall Contouring in a Linear Rotor Cascade; American Society of Mechanical Engineers Digital Collection: Washington, DC, USA, 2012; pp. 1769–1780. [Google Scholar]
- Civinskas, K.; Povinelli, L. Application of a quasi-3D inviscid flow and boundary layer analysis to the hub-shroud contouring of a radial turbine. In Proceedings of the 20th Joint Propulsion Conference, Cincinnati, OH, USA, 11–13 June 1984; American Institute of Aeronautics and Astronautics: Wriston, VA, USA, 1984. [Google Scholar]
- Kopper, F.C.; Milano, R.; Vanco, M. Experimental Investigation of Endwall Profiling in a Turbine Vane Cascade. AIAA J. 1981, 19, 1033–1040. [Google Scholar] [CrossRef]
- Burd, S.W.; Simon, T.W. Flow Measurements in a Nozzle Guide Vane Passage with a Low Aspect Ratio and Endwall Contouring. J. Turbomach. 2000, 122, 659–666. [Google Scholar] [CrossRef]
- Dossena, V.; Perdichizzi, A.; Savini, M. The Influence of Endwall Contouring on the Performance of a Turbine Nozzle Guide Vane. J. Turbomach. 1999, 121, 200–208. [Google Scholar] [CrossRef]
- Duden, A.; Raab, I.; Fottner, L. Controlling the Secondary Flow in a Turbine Cascade by Three-Dimensional Airfoil Design and Endwall Contouring. J. Turbomach. 1999, 121, 191–199. [Google Scholar] [CrossRef]
- Bohn, D.E.; Kusterer, K.; Sürken, N.; Kreitmeier, F. Influence of Endwall Contouring in Axial Gaps on the Flow Field in a Four-Stage Turbine; American Society of Mechanical Engineers Digital Collection: Washington, DC, USA, 2014. [Google Scholar]
- Ito, Y.; Watanabe, T.; Himeno, T. Effect of Endwall Contouring on Flow Instability of Transonic Compressor. Int. J. Gas Turbine Propuls. Power Syst. 2008, 2, 24–29. [Google Scholar] [CrossRef]
- Kroger, G.; Voß, C.; Nicke, E.; Cornelius, C. Theory and Application of Axisymmetric Endwall Contouring for Compressors. In Proceedings of the Volume 7: Turbomachinery, Parts A, B, and C, Vancouver, BC, Canada, 6–10 June 2011; ASMEDC: Washington, DC, USA, 2011; pp. 125–137. [Google Scholar]
- Kröger, G.; Cornelius, C.; Nicke, E. Rotor Casing Contouring in High Pressure Stages of Heavy Duty Gas Turbine Compressors with Large Tip Clearance Heights. In Proceedings of the Volume 7: Turbomachinery, Parts A and B, Orlando, FL, USA, 8–12 June 2009; ASMEDC: Washington, DC, USA, 2009; pp. 215–225. [Google Scholar]
- Hoeger, M.; Cardamone, P.; Fottner, L. Influence of Endwall Contouring on the Transonic Flow in a Compressor Blade; American Society of Mechanical Engineers Digital Collection: Washington, DC, USA, 2009; pp. 759–768. [Google Scholar]
- Chen, P.-P.; Qiao, W.-Y.; Hashmi, S.F.A.; Shi, P.-J.; Zhao, L. Passive control of hub-corner separation/stall using axisymmetric-hub contouring. Proc. Inst. Mech. Eng. Part G J. Aerosp. Eng. 2012, 226, 1214–1224. [Google Scholar] [CrossRef]
- Sun, S.; Chen, S.; Liu, W.; Gong, Y.; Wang, S. Effect of axisymmetric endwall contouring on the high-load low-reaction transonic compressor rotor with a substantial meridian contraction. Aerosp. Sci. Technol. 2018, 81, 78–87. [Google Scholar] [CrossRef]
- Han, G.; Yang, C.; Zhao, S.; Zhang, Y.; Lu, X. Investigation of a High Pressure Ratio Centrifugal Compressor with Wedge Diffuser and Pipe Diffuser. Int. J. Turbo Jet-Engines 2021, 38, 1–13. [Google Scholar] [CrossRef]
- Wang, X.-F.; Xi, G.; Wang, Z.-H. Aerodynamic optimization design of centrifugal compressor’s impeller with Kriging model. Proc. Inst. Mech. Eng. Part A J. Power Energy 2006, 220, 589–597. [Google Scholar] [CrossRef]
- Ha, K.K.; Kang, S.H. An Optimization Method for Centrifugal Compressor Design Using the Surrogate Management Framework. In Proceedings of the ASME-JSME-KSME 2011 Joint Fluids Engineering Conference: Volume 1, Symposia—Parts A, B, C, and D, Hamamatsu, Japan, 24–29 July 2011; ASMEDC: Washington, DC, USA, 2011; pp. 679–684. [Google Scholar]
- Ji, C.; Wang, Z.; Xi, G. Computer 3D Vision-Aided Full-3D Optimization of a Centrifugal Impeller. J. Turbomach. 2022, 144, 091011. [Google Scholar] [CrossRef]
- Shaaban, S. Design optimization of a centrifugal compressor vaneless diffuser. Int. J. Refrig. 2015, 60, 142–154. [Google Scholar] [CrossRef]
- Sakaguchi, D.; Tun, M.; Numakura, R.; Wang, B. Global optimization of recirculation flow type casing treatment in centrifugal compressors of turbochargers. Proc. Inst. Mech. Eng. Part C J. Mech. Eng. Sci. 2018, 232, 4461–4471. [Google Scholar] [CrossRef]
- Liu, S.; Geng, S.; Li, X.; Jin, Y.; Zhang, H. Optimization Design of Aspect Ratio and Solidity of a Heavy-Duty Gas Turbine Transonic Compressor Rotor. Machines 2023, 11, 82. [Google Scholar] [CrossRef]
- Ekradi, K.; Madadi, A. Performance improvement of a transonic centrifugal compressor impeller with splitter blade by three-dimensional optimization. Energy 2020, 201, 117582. [Google Scholar] [CrossRef]
- Kim, J.-H.; Choi, J.-H.; Kim, K.-Y. Surrogate Modeling for Optimization of a Centrifugal Compressor Impeller. Int. J. Fluid Mach. Syst. 2010, 3, 29–38. [Google Scholar] [CrossRef]
- Lang, J.; Chu, W.; Spence, S.; An, G.; Galloway, L. Performance enhancement of a centrifugal compressor stage using profiled end wall (PEW) treatments in the radial vaned diffuser. Aerosp. Sci. Technol. 2021, 110, 106488. [Google Scholar] [CrossRef]
- Dutton, J.C.; Piemsomboon, P.; Jenkins, P.E. Flowfield and Performance Measurements in a Vaned Radial Diffuser. J. Fluids Eng. 1986, 108, 141–147. [Google Scholar] [CrossRef]
- Everitt, J.N.; Spakovszky, Z.S. An Investigation of Stall Inception in Centrifugal Compressor Vaned Diffuser1. J. Turbomach. 2013, 135, 011025. [Google Scholar] [CrossRef]
- Hunziker, R.; Gyarmathy, G. The Operational Stability of a Centrifugal Compressor and Its Dependence on the Characteristics of the Subcomponents. J. Turbomach. 1994, 116, 250–259. [Google Scholar] [CrossRef]
- Zheng, X.; Lin, Y.; Gan, B.; Zhuge, W.; Zhang, Y. Effects of Reynolds number on the performance of a high pressure-ratio turbocharger compressor. Sci. China Technol. Sci. 2013, 56, 1361–1369. [Google Scholar] [CrossRef]
- Tiainen, J.; Jaatinen-Värri, A.; Grönman, A.; Backman, J. Numerical Study of the Reynolds Number Effect on the Centrifugal Compressor Performance and Losses; American Society of Mechanical Engineers Digital Collection: Washington, DC, USA, 2016; p. V02DT42A002. [Google Scholar]
- Li, Z.; Lu, X.; Wu, Y.; Cheng, H.; Han, G. Thermodynamic investigation of the secondary flow inside centrifugal compressor for compressed air energy storage based on local dissipation. J. Energy Storage 2023, 74, 109325. [Google Scholar] [CrossRef]
- Zaripov, D.; Li, R.; Dushin, N. Dissipation rate estimation in the turbulent boundary layer using high-speed planar particle image velocimetry. Exp. Fluids 2019, 60, 18. [Google Scholar] [CrossRef]
- Li, Z.; Lu, X.; Wu, Y.; Han, G. Quantitative investigation of the turbulence model effect on high-pressure-ratio centrifugal compressor performance prediction. Int. Commun. Heat Mass Transf. 2023, 142, 106644. [Google Scholar] [CrossRef]
- Liu, C.; Wang, Y.; Yang, Y.; Duan, Z. New omega vortex identification method. Sci. China Phys. Mech. Astron. 2016, 59, 684711. [Google Scholar] [CrossRef]
- Ferrara, G.; Ferrari, L.; Mengoni, C.P.; De Lucia, M.; Baldassarre, L. Experimental Investigation and Characterization of the Rotating Stall in a High Pressure Centrifugal Compressor: Part I—Influence of Diffuser Geometry on Stall Inception. In Proceedings of the Volume 5: Turbo Expo 2002, Parts A and B, Amsterdam, The Netherlands, 3–6 June 2002; ASMEDC: Washington, DC, USA, 2002; pp. 613–620. [Google Scholar]
- Zhang, Y.; Lu, X.; Zhang, Y.; Zhang, Z.; Dong, X.; Han, G. Stall Behavior in an Ultrahigh-Pressure-Ratio Centrifugal Compressor: Backward-Traveling Rotating Stall. J. Turbomach. 2022, 144, 101010. [Google Scholar] [CrossRef]
- Fujisawa, N.; Inui, T.; Ohta, Y. Evolution Process of Diffuser Stall in a Centrifugal Compressor with Vaned Diffuser. J. Turbomach. 2019, 141, 041009. [Google Scholar] [CrossRef]
- Li, Q.; Sun, Z.; Lu, X.; Zhang, Y.; Han, G. Investigation of New Design Principles for the Centrifugal Compressor Vaned Diffusers. Int. J. Aerosp. Eng. 2022, 2022, 4480676. [Google Scholar] [CrossRef]


| Parameter | Value |
|---|---|
| Design mass flow rate | 1.51 kg/s |
| Design total pressure ratio | 5.9 |
| Impeller | |
| Number of blades | 12 + 12 |
| Design rotating speed | 65,000 rpm |
| Tip radial clearance | 0.15 mm |
| Inlet diameter | 112 mm |
| Outlet diameter | 162 mm |
| Wedge diffuser | |
| Number of blades | 23 |
| Inlet diameter | 174 mm |
| Outlet diameter | 242 mm |
| Blade height | 8.5 mm |
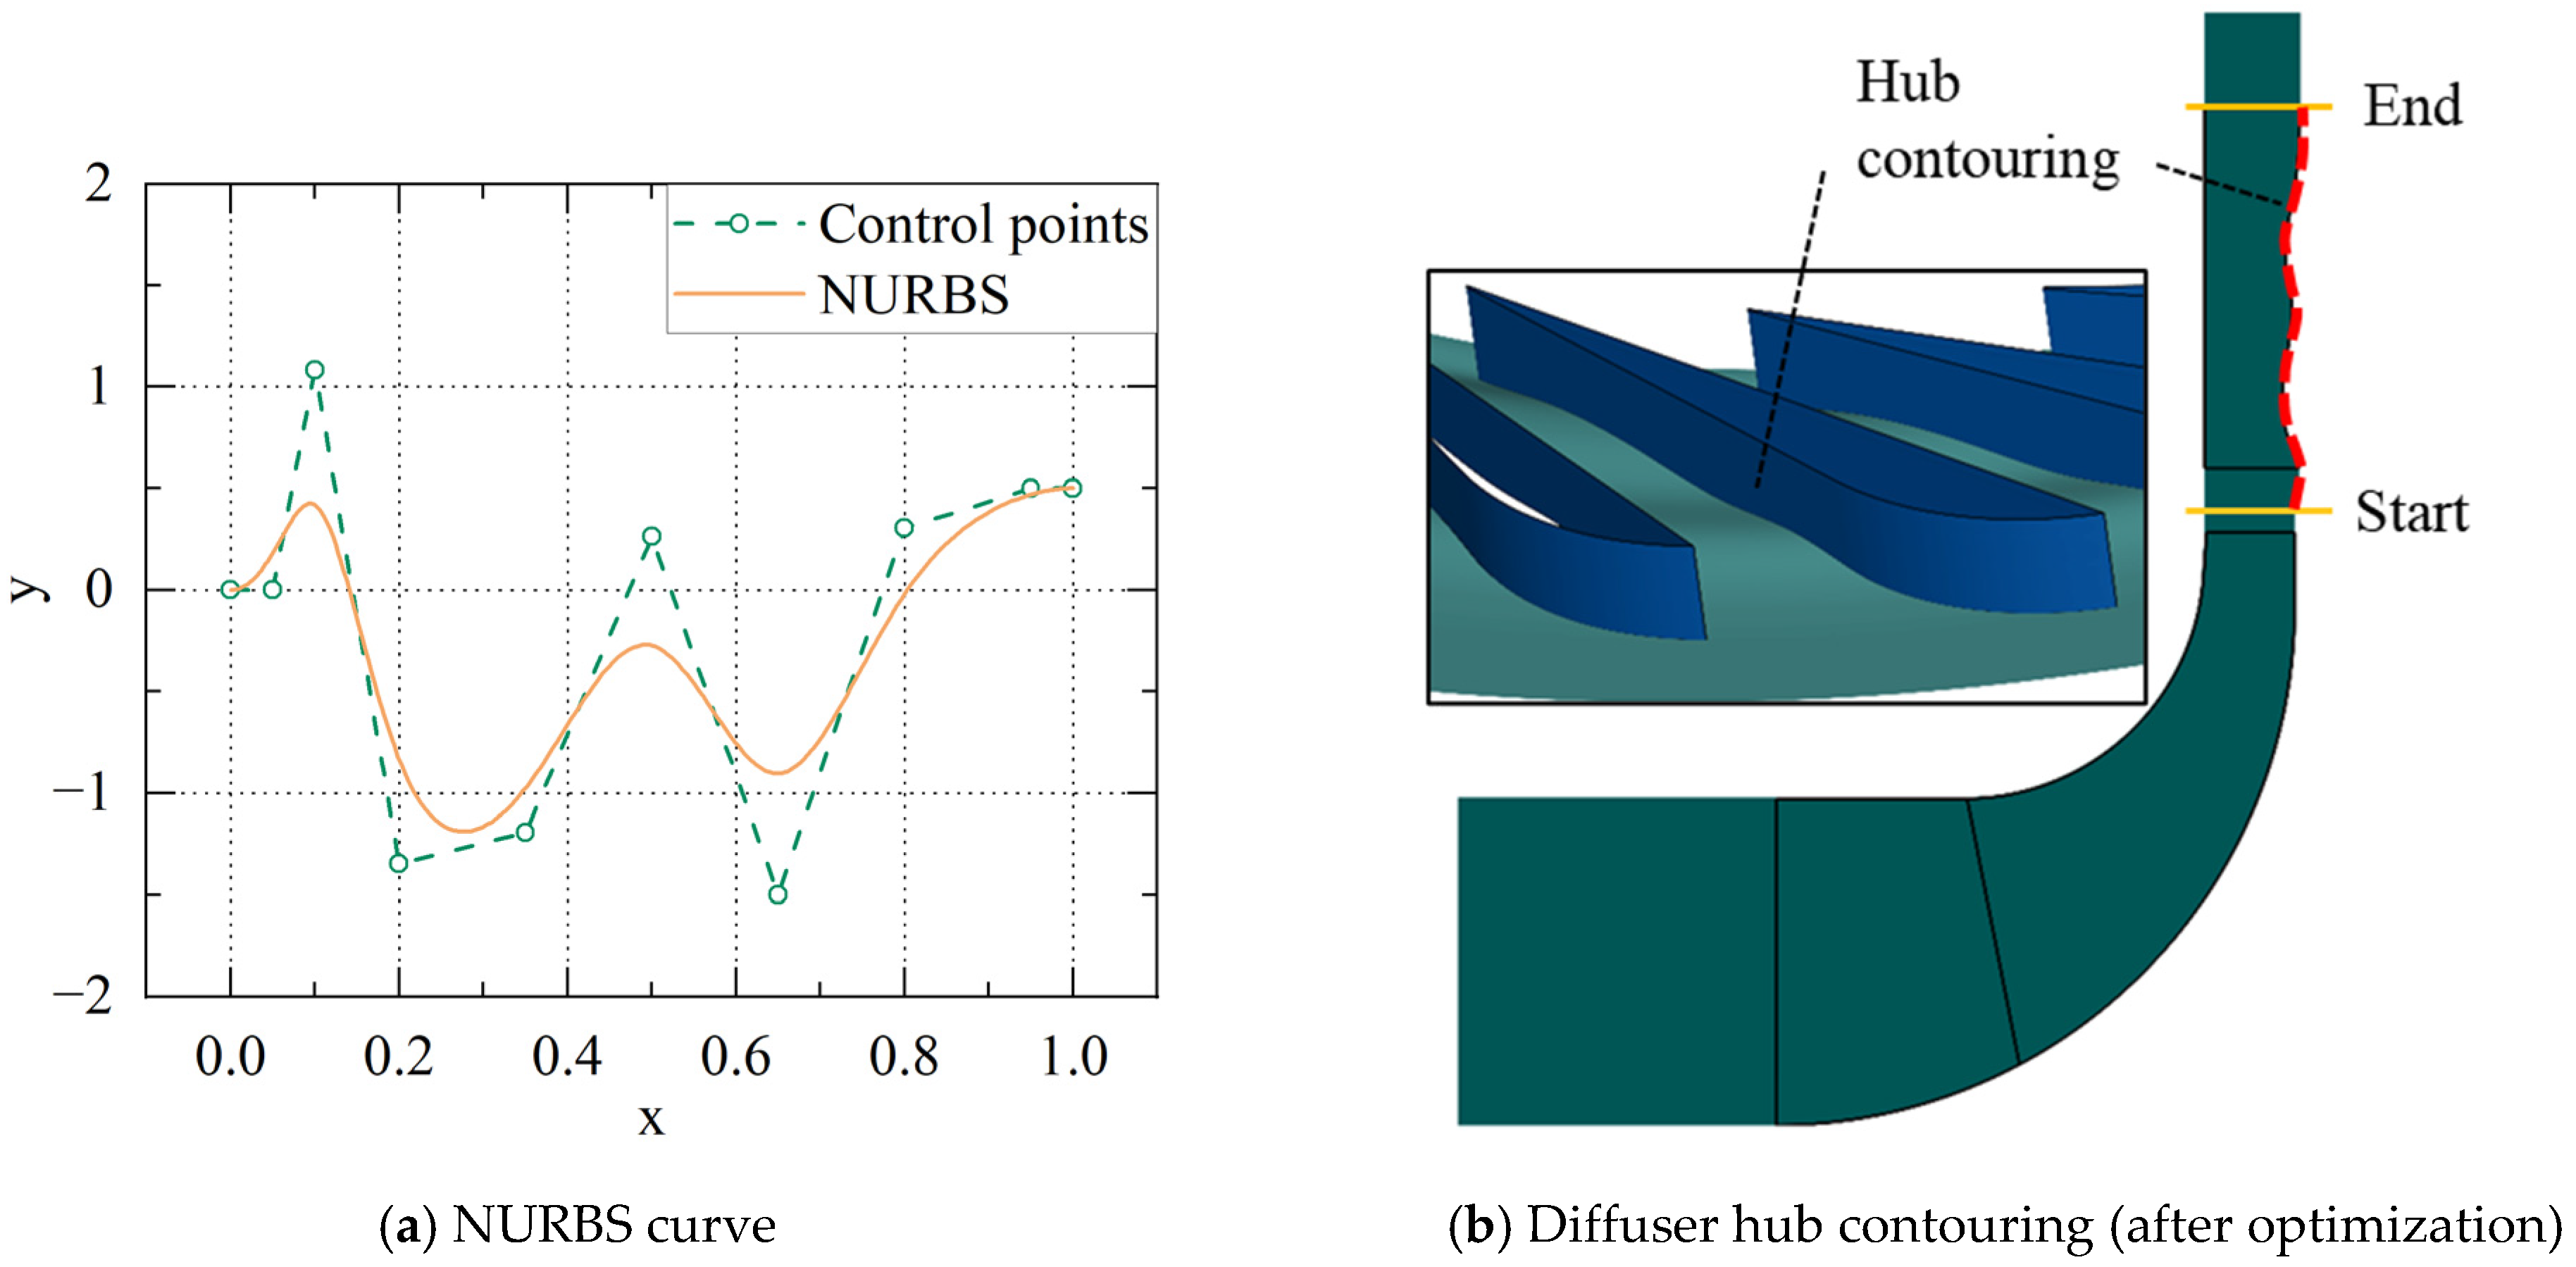
| Control Point Number | 1 | 2 | 3 | 4 | 5 | 6 | 7 | 8 | 9 | 10 |
|---|---|---|---|---|---|---|---|---|---|---|
| R | 0 | 0.05 | 0.1 | 0.2 | 0.35 | 0.5 | 0.65 | 0.8 | 0.95 | 1 |
| Z | 0 | 0 | Var1 | Var2 | Var3 | Var4 | Var5 | Var6 | Var7 | Var7 |
Disclaimer/Publisher’s Note: The statements, opinions and data contained in all publications are solely those of the individual author(s) and contributor(s) and not of MDPI and/or the editor(s). MDPI and/or the editor(s) disclaim responsibility for any injury to people or property resulting from any ideas, methods, instructions or products referred to in the content. |
© 2024 by the authors. Licensee MDPI, Basel, Switzerland. This article is an open access article distributed under the terms and conditions of the Creative Commons Attribution (CC BY) license (https://creativecommons.org/licenses/by/4.0/).
Share and Cite
Wu, Y.; Li, Q.; Yuan, H.; Li, Z.; Zhou, S.; Han, G.; Lu, X. Performance Improvement of a High Loading Centrifugal Compressor with Vaned Diffuser by Hub Contour Optimization. Aerospace 2024, 11, 246. https://doi.org/10.3390/aerospace11040246
Wu Y, Li Q, Yuan H, Li Z, Zhou S, Han G, Lu X. Performance Improvement of a High Loading Centrifugal Compressor with Vaned Diffuser by Hub Contour Optimization. Aerospace. 2024; 11(4):246. https://doi.org/10.3390/aerospace11040246
Chicago/Turabian StyleWu, Yunfeng, Qingkuo Li, Hang Yuan, Ziliang Li, Shiji Zhou, Ge Han, and Xingen Lu. 2024. "Performance Improvement of a High Loading Centrifugal Compressor with Vaned Diffuser by Hub Contour Optimization" Aerospace 11, no. 4: 246. https://doi.org/10.3390/aerospace11040246