Article

Numerical Investigation on Intermittent Maximum Ice Accretion and Aerodynamic Performances of RG-15 Aerofoil at Low Reynolds Number

1
Department of Mechanical Engineering, College of Engineering, University of Canterbury, Private Bag 4800, Christchurch 8140, New Zealand
2
Institute of Aeroengine, Beihang University, Beijing 100191, China
*
Author to whom correspondence should be addressed.
Aerospace 2024, 11(1), 7; https://doi.org/10.3390/aerospace11010007
Submission received: 15 November 2023 / Revised: 7 December 2023 / Accepted: 19 December 2023 / Published: 21 December 2023
(This article belongs to the Collection Unmanned Aerial Systems)

Abstract

:
Ice accretion is inevitable on fix-wing UAVs (unmanned aerial vehicles) when they are applied to surveillance and mapping over colder climates and arctic regions. Subsequent aerodynamic profile changes have caused the current interest in the better prediction of the effect of icing shapes/sizes/distribution patterns on the aerodynamic performances of an aircraft. This study employs a numerical model which investigates the RG-15 aerofoil’s response to various icing scenarios at a Reynolds number of  R e = 2 × 10 5 . Under icing conditions, compared to a clean aerofoil, a reduction in the lift coefficient and an increase in the drag coefficient are observed. Lower temperatures and reduced liquid water content lead to a decrease in the maximum thickness of ice accretion on the RG-15 aerofoil. Particularly noteworthy is the 10.85% reduction in the lift coefficient at a 10° angle of attack, which is in the icing condition at −10 °C with a mean volume diameter of 15 μm. Power consumption increases in the range of 0.46% to 26.5% under various icing conditions, showing synchronization with the rise in drag coefficient. This study underscores the need for future research to investigate various cloud conditions comprehensively and deeply in the context of aerofoil icing.

1. Introduction

In recent years, unmanned aerial vehicles (UAVs), also known as drones, have seen significant growth and are increasingly being developed across various sectors. These autonomous aerial systems exhibit versatility through various categorizations, catering to specific applications within different domains. Fixed-wing UAVs are effective for conducting remote sensing tasks in remote and extreme environments like the Arctic [1]. Nonetheless, deploying UAVs in cold climates poses distinctive challenges due to the potential freezing of supercooled droplets upon contact with aerofoil surfaces. Such a process can alter the wing profile, leading to aerodynamic degradation. Atmospheric icing represents a primary concern for fixed-wing UAVs operating in cold weather conditions [2,3]. This phenomenon impacts UAVs and has implications for commercial aviation, wind energy infrastructure, and architectural integrity. To delve into this exploration, it is essential to recognize the historical trajectory of UAV icing.
The development of UAVs can be traced back to World War I, when they were used for tactical purposes [4], but it was not until the late 1920s that research formally addressed the wing icing of aerial vehicles [5,6,7]. Hazards due to ice formation on aerofoil were first reported by Carroll and McAvoy for a VE-7 aircraft in 1929 [5], and the aerodynamic performance degradation caused by surface roughness and protuberances was investigated by Jacobs [6] and Jones [7] in the early 1930s. In 1942, the icing research tunnel (IRT) was built by the National Advisory Committee for Aeronautics (NACA) at the Lewis Flight Propulsion Laboratory [8]. From 1953, Gary and Von [9,10,11] performed a sequence of tests in which ice was formed under meticulous conditions. The shape of the ice accumulation was recorded, along with alterations in lift, drag, and pitching moment. With the advancement of computational power, early research on computational fluid dynamics (CFD) emphasized computing the flow characteristics and performance of aerofoils with large glaze ice horns [12]. These calculations were based on the NACA 0012 aerofoil and were compared to experimental data that were available at the time. Potapczuk [13] was one of the pioneers in conducting these calculations by employing a thin-layer, Reynolds-averaged Navier–Stokes (RANS) method within a body-fitted curvilinear coordinate system. The outcomes of this assessment thus far demonstrate a favorable correlation with experimental findings, particularly in the context of rime and glaze ice formations.
The ATR-72 accident in late 1994 changed the direction of aerodynamic icing research [14]. Since the cause of the accident was believed to be a unique supercooled large droplet (SLD) ice accretion, unlike any that had been studied up to that point, there was renewed interest in investigating different ice accretion shapes and critical ice accretions [12]. The accident also increased interest in testing the sensitivity of different aerofoil sections to icing. As a result, iced-aircraft safety and aerodynamics became a significant research topic, leading to the discovery of many new avenues of study and several intriguing findings. However, until the 21st century, most research on wing icing was primarily centered around manned aerial vehicles. Koenig et al. [15] published an early paper on fixed-wing icing, in which they conducted UAV icing flight simulations using LEWICE2D to predict the rates of ice accumulation and ice formations on an unspecified aerofoil. The formation of ice on aerodynamic surfaces, caused by supercooled cloud droplets, freezing drizzle, and freezing rain, poses a threat to all aircraft, producing a particularly significant issue for UAVs due to their limited power [15]. The icing phenomenon on UAVs shares similarities with that observed in manned aircraft, albeit characterized by distinctive variations in airframe dimensions, mission profiles, and ice accretion sensitivity [16]. A significant amount of research is available on the icing of manned aircraft at high Reynolds numbers [17,18,19,20], ranging from  R e = 0.5 × 10 6  to  1.8 × 10 6 . Nevertheless, this study makes an original contribution to research on low-Reynolds-number, fixed-wing ice accretion and their aerodynamics performance within a temperature range of −10 °C to −30 °C—an area that has been notably underexplored. Table 1 provides a concise overview of pertinent studies focused on aerofoil investigations at a low Reynolds number from  R e = 0.2 × 10 6  to  0.7 × 10 6 .
The collection of aerodynamic data related to aircraft icing primarily relies on methods including flight tests, wind tunnel experiments, and computational approaches [27,28]. The former two methods are less frequently chosen by researchers, considering the substantial cost implications and inherent technical complexity [28]. For instance, the wind tunnel icing test, despite being indispensable for evaluating running-wet ice protection systems (IPSs) under design scenarios, necessitates complicated scaling laws to ascertain the efficiency of water droplets [29]. Consequently, an increasing number of researchers favor using computational techniques [24,25,30]. This preference stems from the practicality of computational methods in predicting ice formation, designing IPSs, formulating ice removal strategies, and assessing the decrease in aerodynamic performance caused by icing incidents [27,28,29]. In recent years, researchers have been actively developing innovative IPSs to enhance aircraft performance while addressing concerns regarding weight, cost, and energy efficiency [31,32,33,34]. These endeavors encompass promising strategies such as integrating anti-icing systems into the primary aircraft structure [35,36,37]. Nevertheless, the scenario diverges when considering smaller-sized UAVs. Such platforms often lack dedicated de-icing or anti-icing systems [24,34,38,39]. Hann et al. [34,39] emphasizes the need for standardized unmanned aircraft system (UAS) certification procedures, particularly addressing the underexplored threat of in-flight icing, especially for medium-sized UAVs with a focus on energy-efficient operation procedures for IPS. In accordance with Szilder and McIlwain’s findings [40], UAVs are commonly configured for low-altitude cruising due to their operation at reduced flight altitudes. Opting for low-altitude cruising inherently involves lower flight velocities, consequently heightening the potential for surface icing occurrence. Consequently, an augmented comprehension of the influences exerted by icing-accreted aerodynamic degradation for small-size UAVs becomes imperative.
The investigation pertaining to UAVs underscores that Reynolds numbers exert a significant influence on the attributes of icing phenomena and the consequent aerodynamic performance detriments that ensue [41,
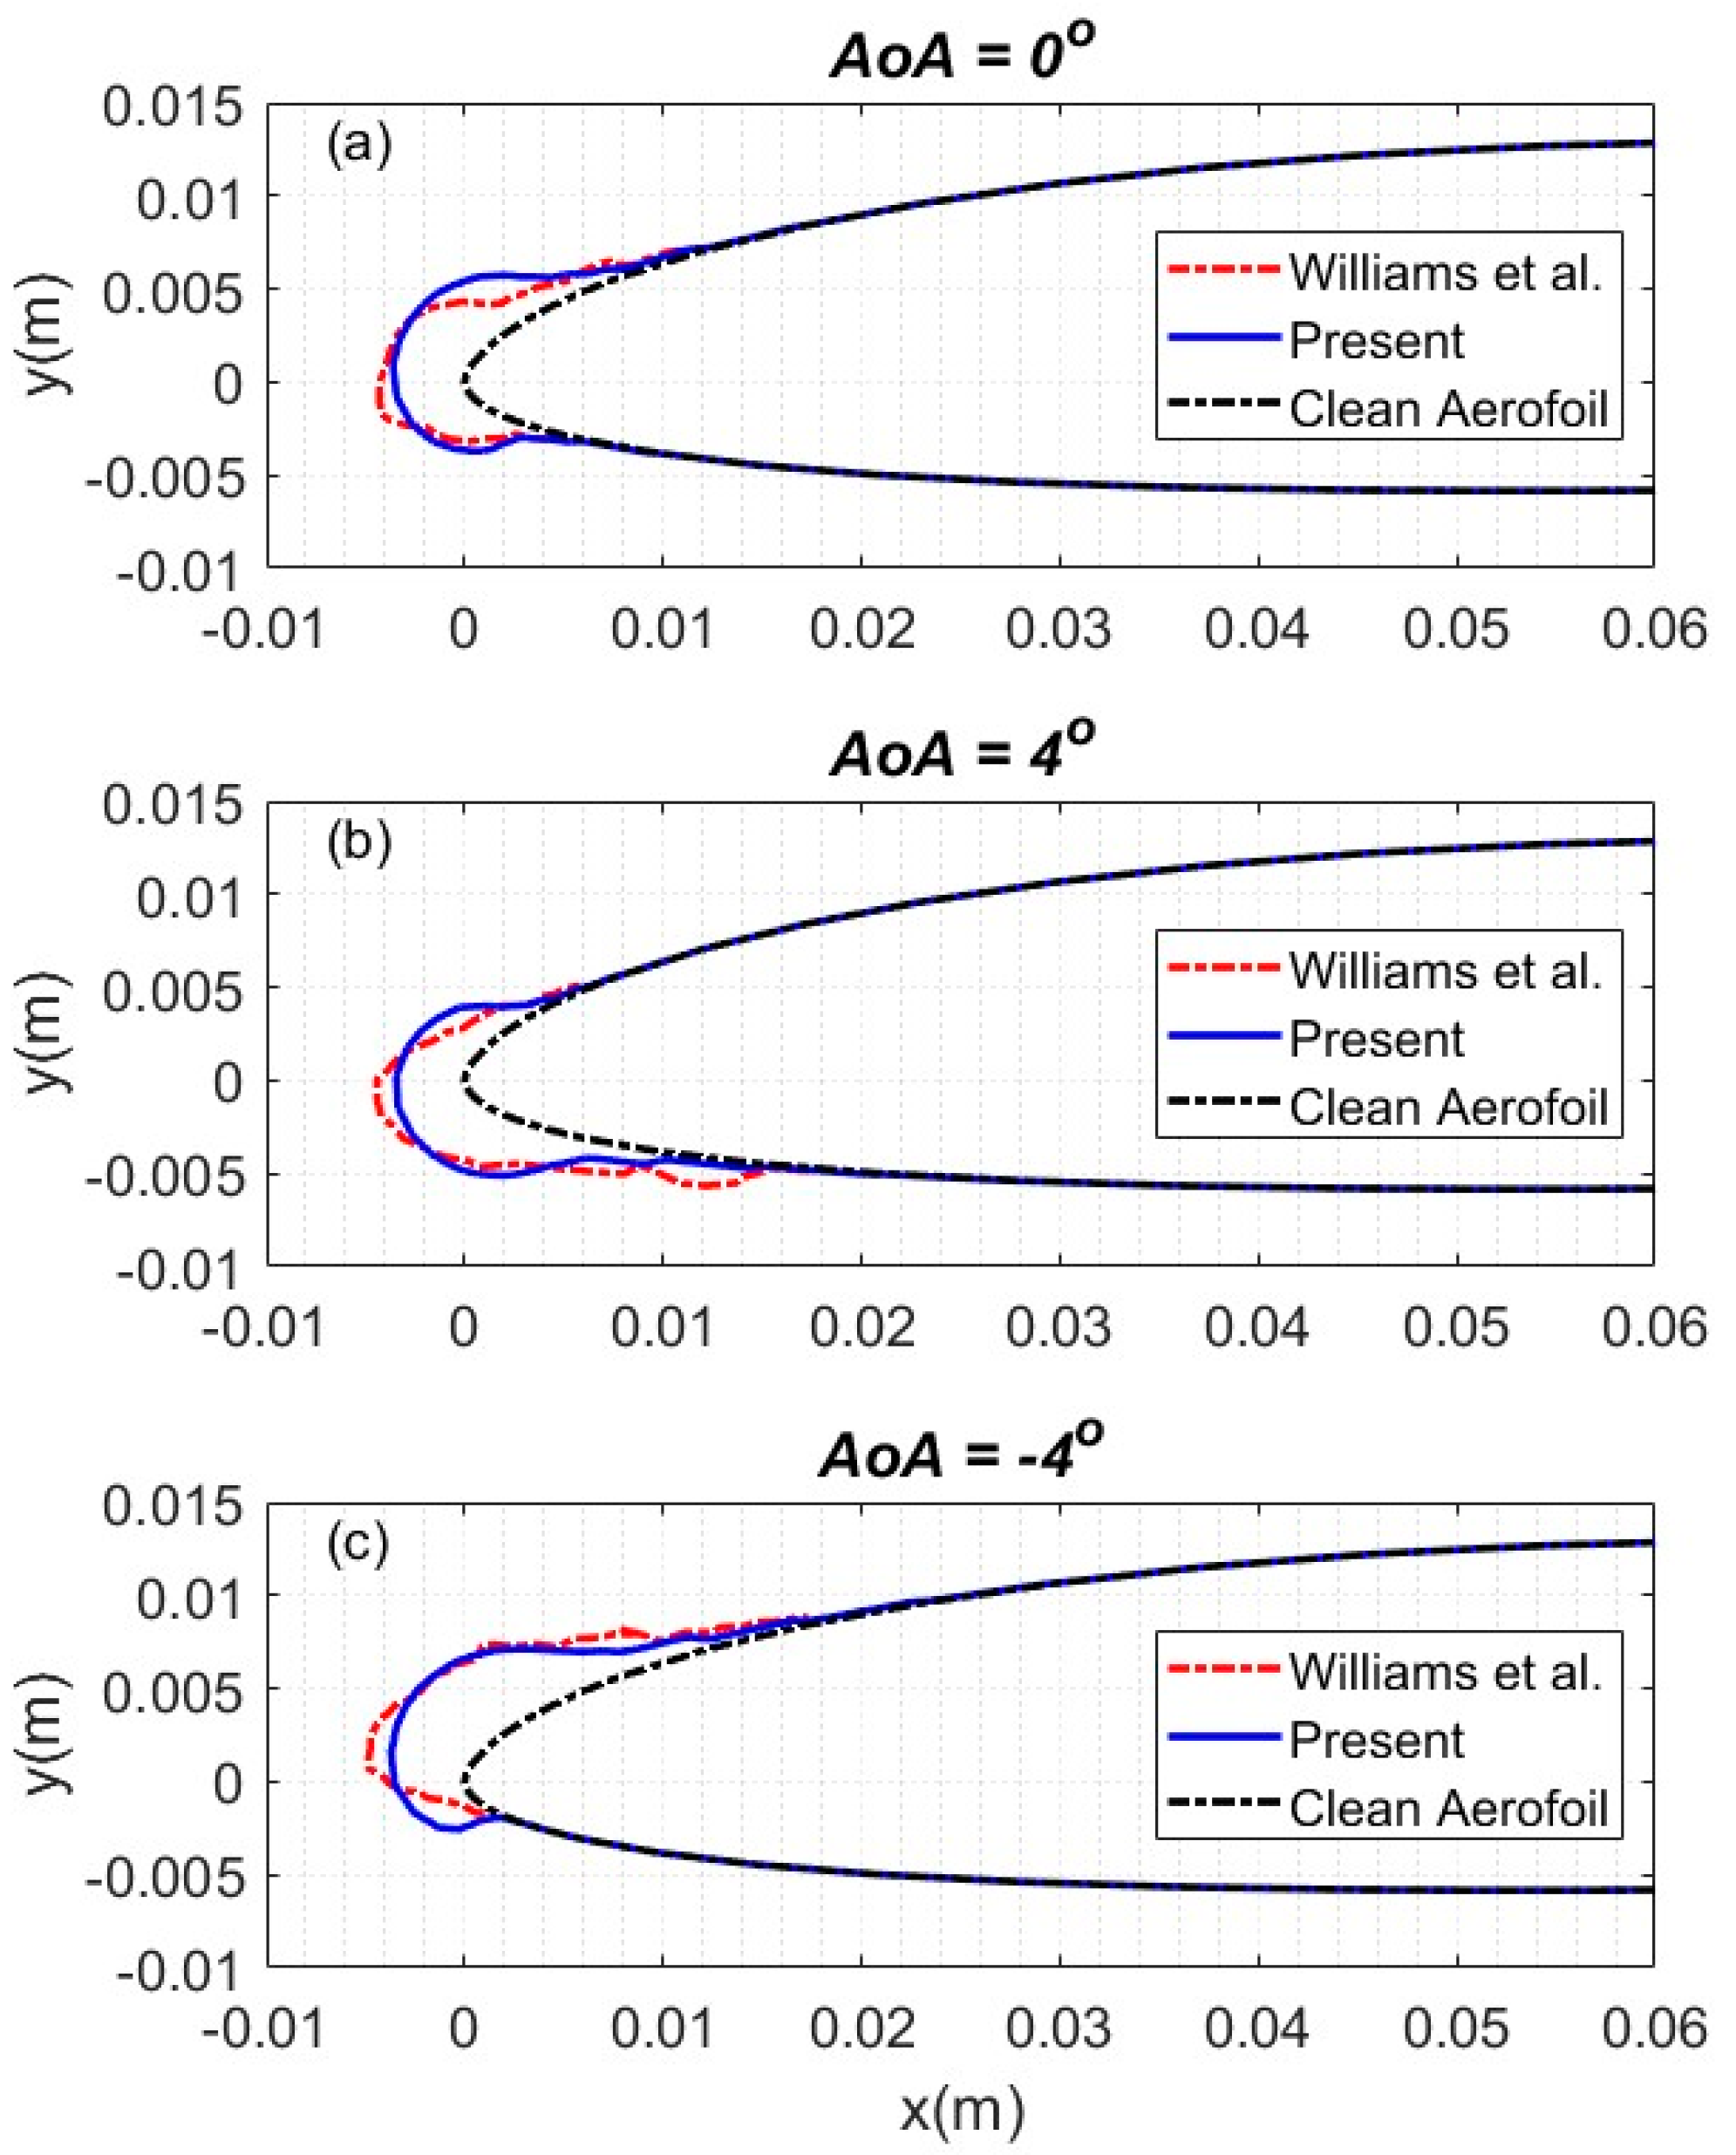
42]. Research activity was undertaken for RG-15 aerofoil by Williams et al. [23] in 2017 at constant temperatures of −5 °C and −20 °C. The present simulated ice shape was validated through a comparison with the physical one upon the aerofoil. Several existing codes for ice accretion have been developed in the last decade, such as LEWICE [43], FENSAP-ICE [44], CIRAML [45], TRAJICE 2 [46], and ONERA [47]. The aerodynamic performance under icing conditions was simulated at specific altitudes and varying temperatures to accurately replicate ice formation in humid environments, such as marine and polar regions. Therefore, FENSAP-ICE, which employs the Eulerian method [44], was selected due to its feasibility of solving the governing equation using the same grid for airflows and supercooled droplets. The droplet characteristics within FENSAP-Ice were aligned with the reference conditions outlined in the Federal Aviation Regulation (FAR) Appendix C to Part 25 [
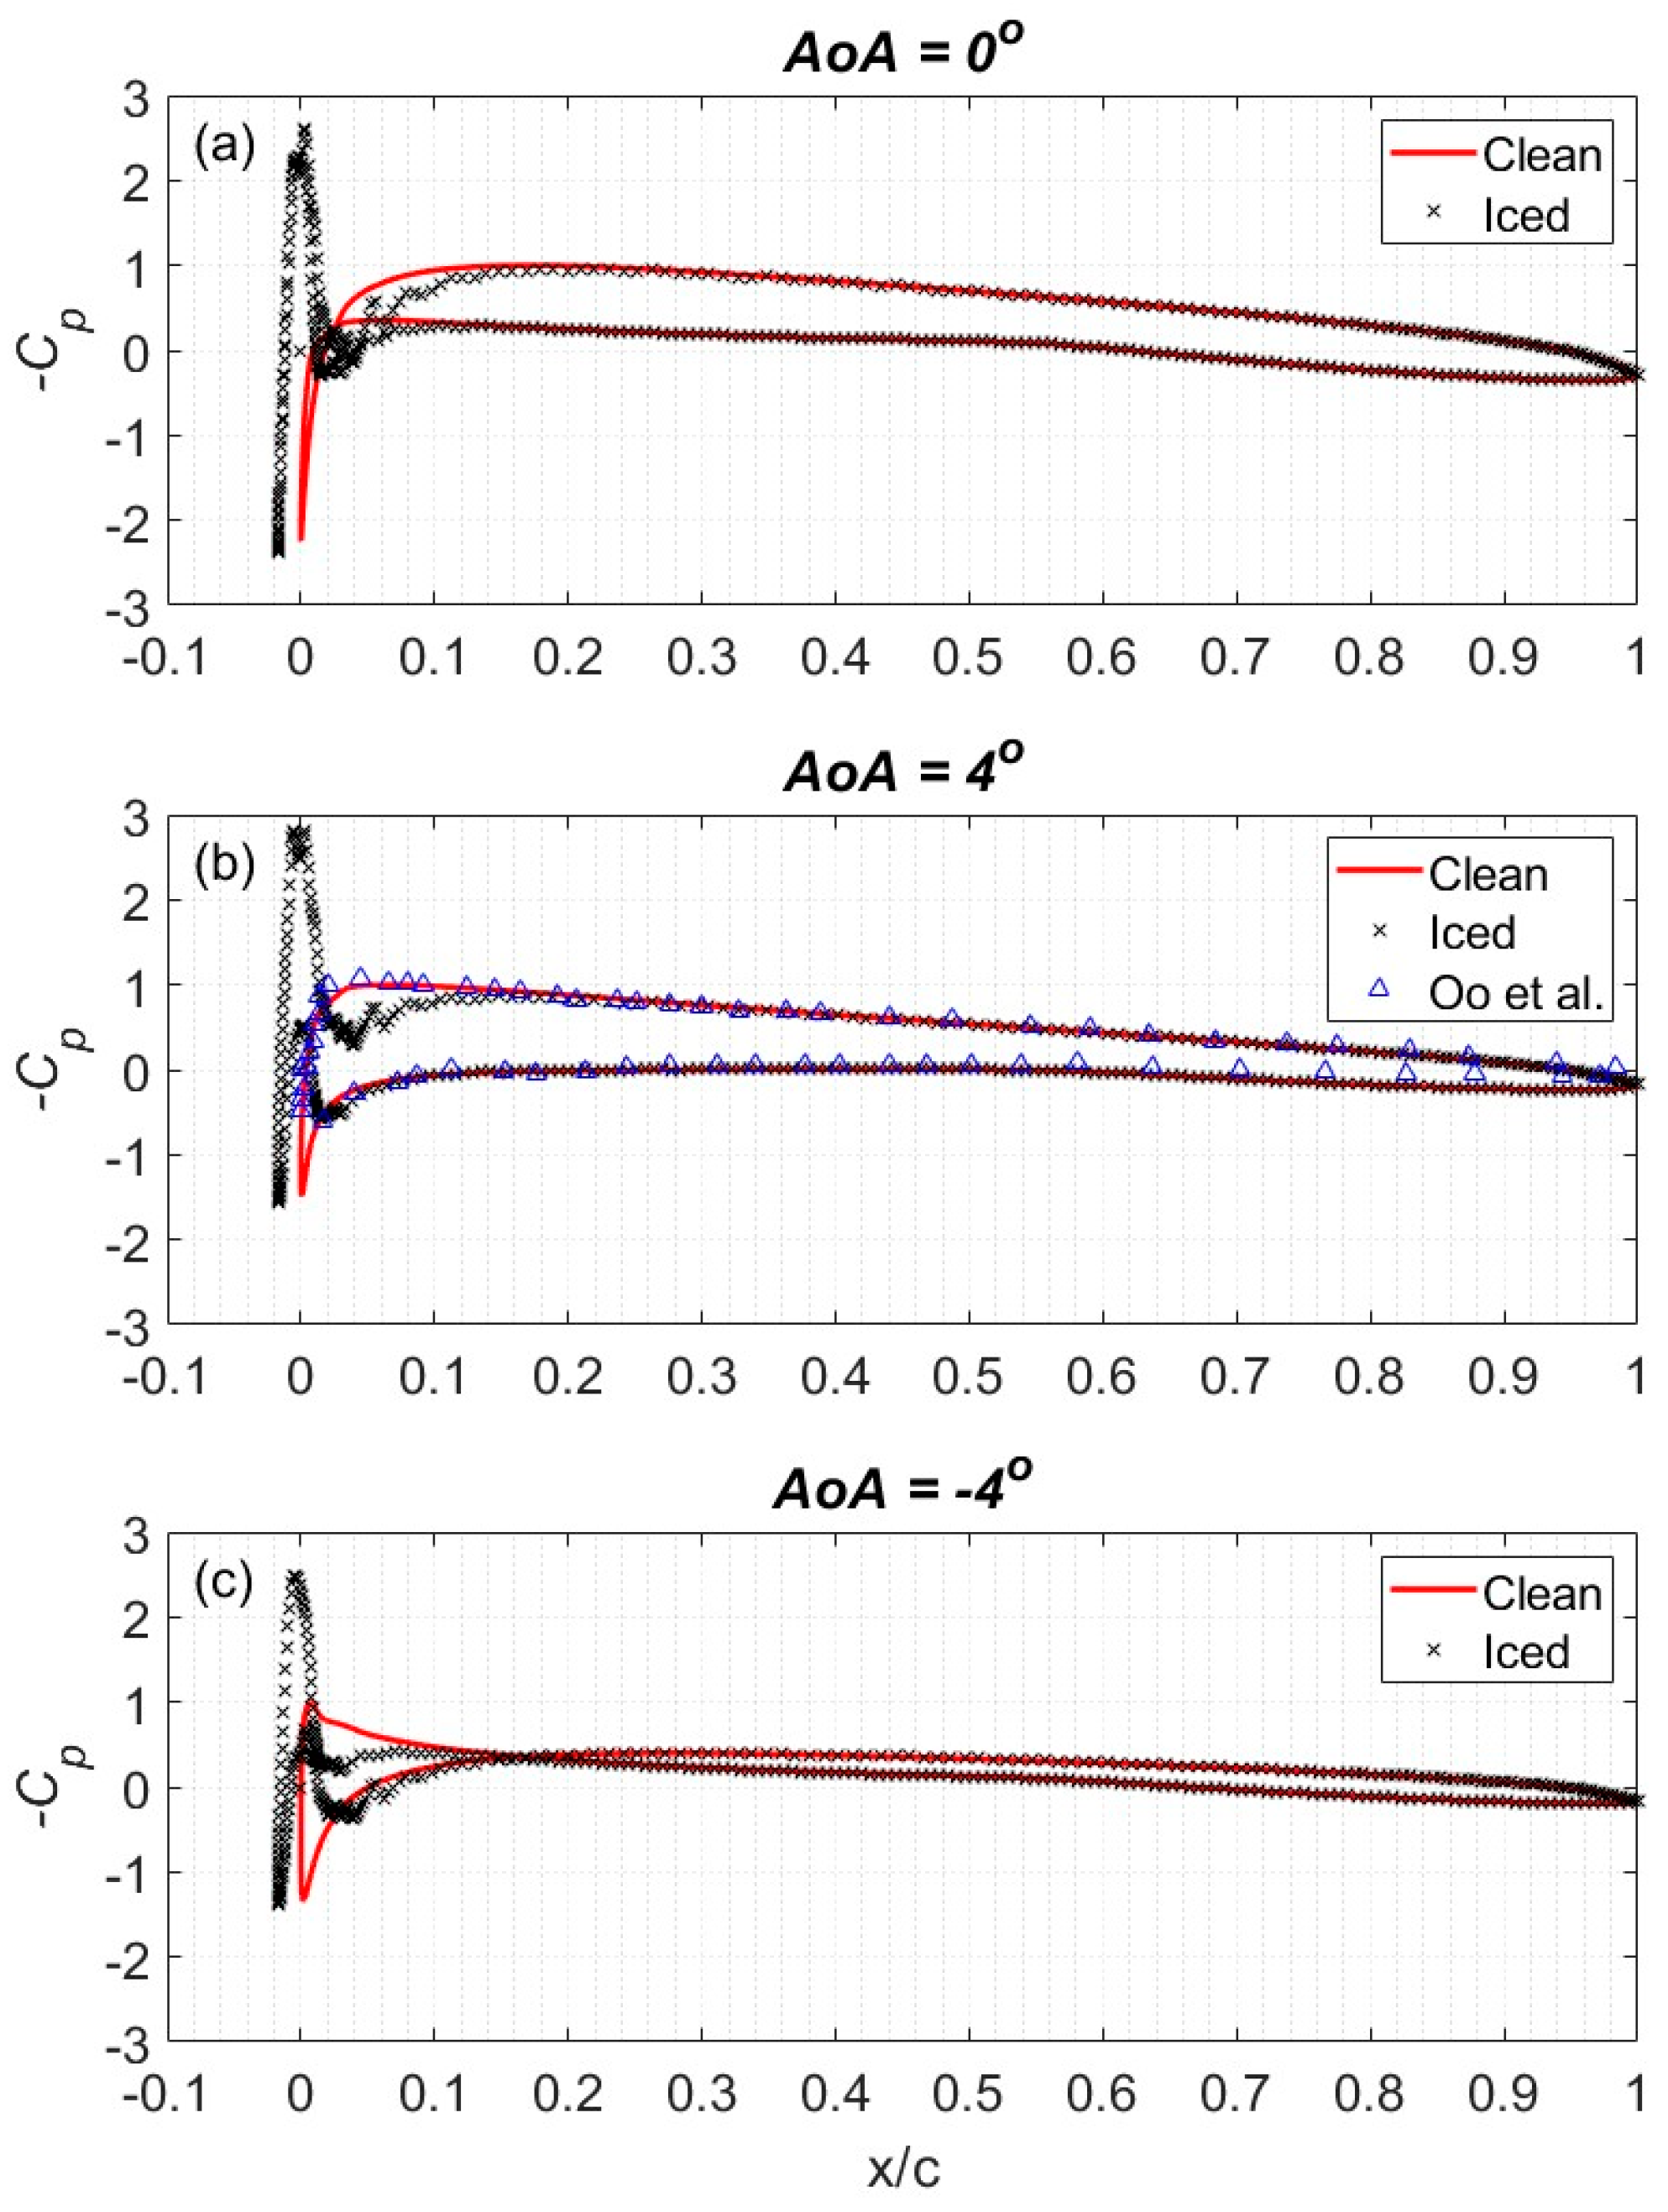
48]. This alignment was informed by the fact that the entirety of the investigated icing scenarios in this study were predicated upon assumed conditions conforming to the aforementioned standard. The contribution of this study is an extension of the previous research efforts. Oo et al. [24] conducted an examination of aerodynamic deterioration in the context of ice-accreted RG-15 aerofoil configurations, utilizing ice shapes sourced from Williams et al. [23], with investigations performed at −5 °C. In 2023, Lindner et al. [25] conducted an in-depth numerical inquiry that spanned a temperature spectrum ranging from −2 °C to −6 °C. This temperature interval is noteworthy due to its encapsulation of the critical phase transition from glaze ice to rime ice. The validation of these numerical outcomes was carried out by Hann et al. [
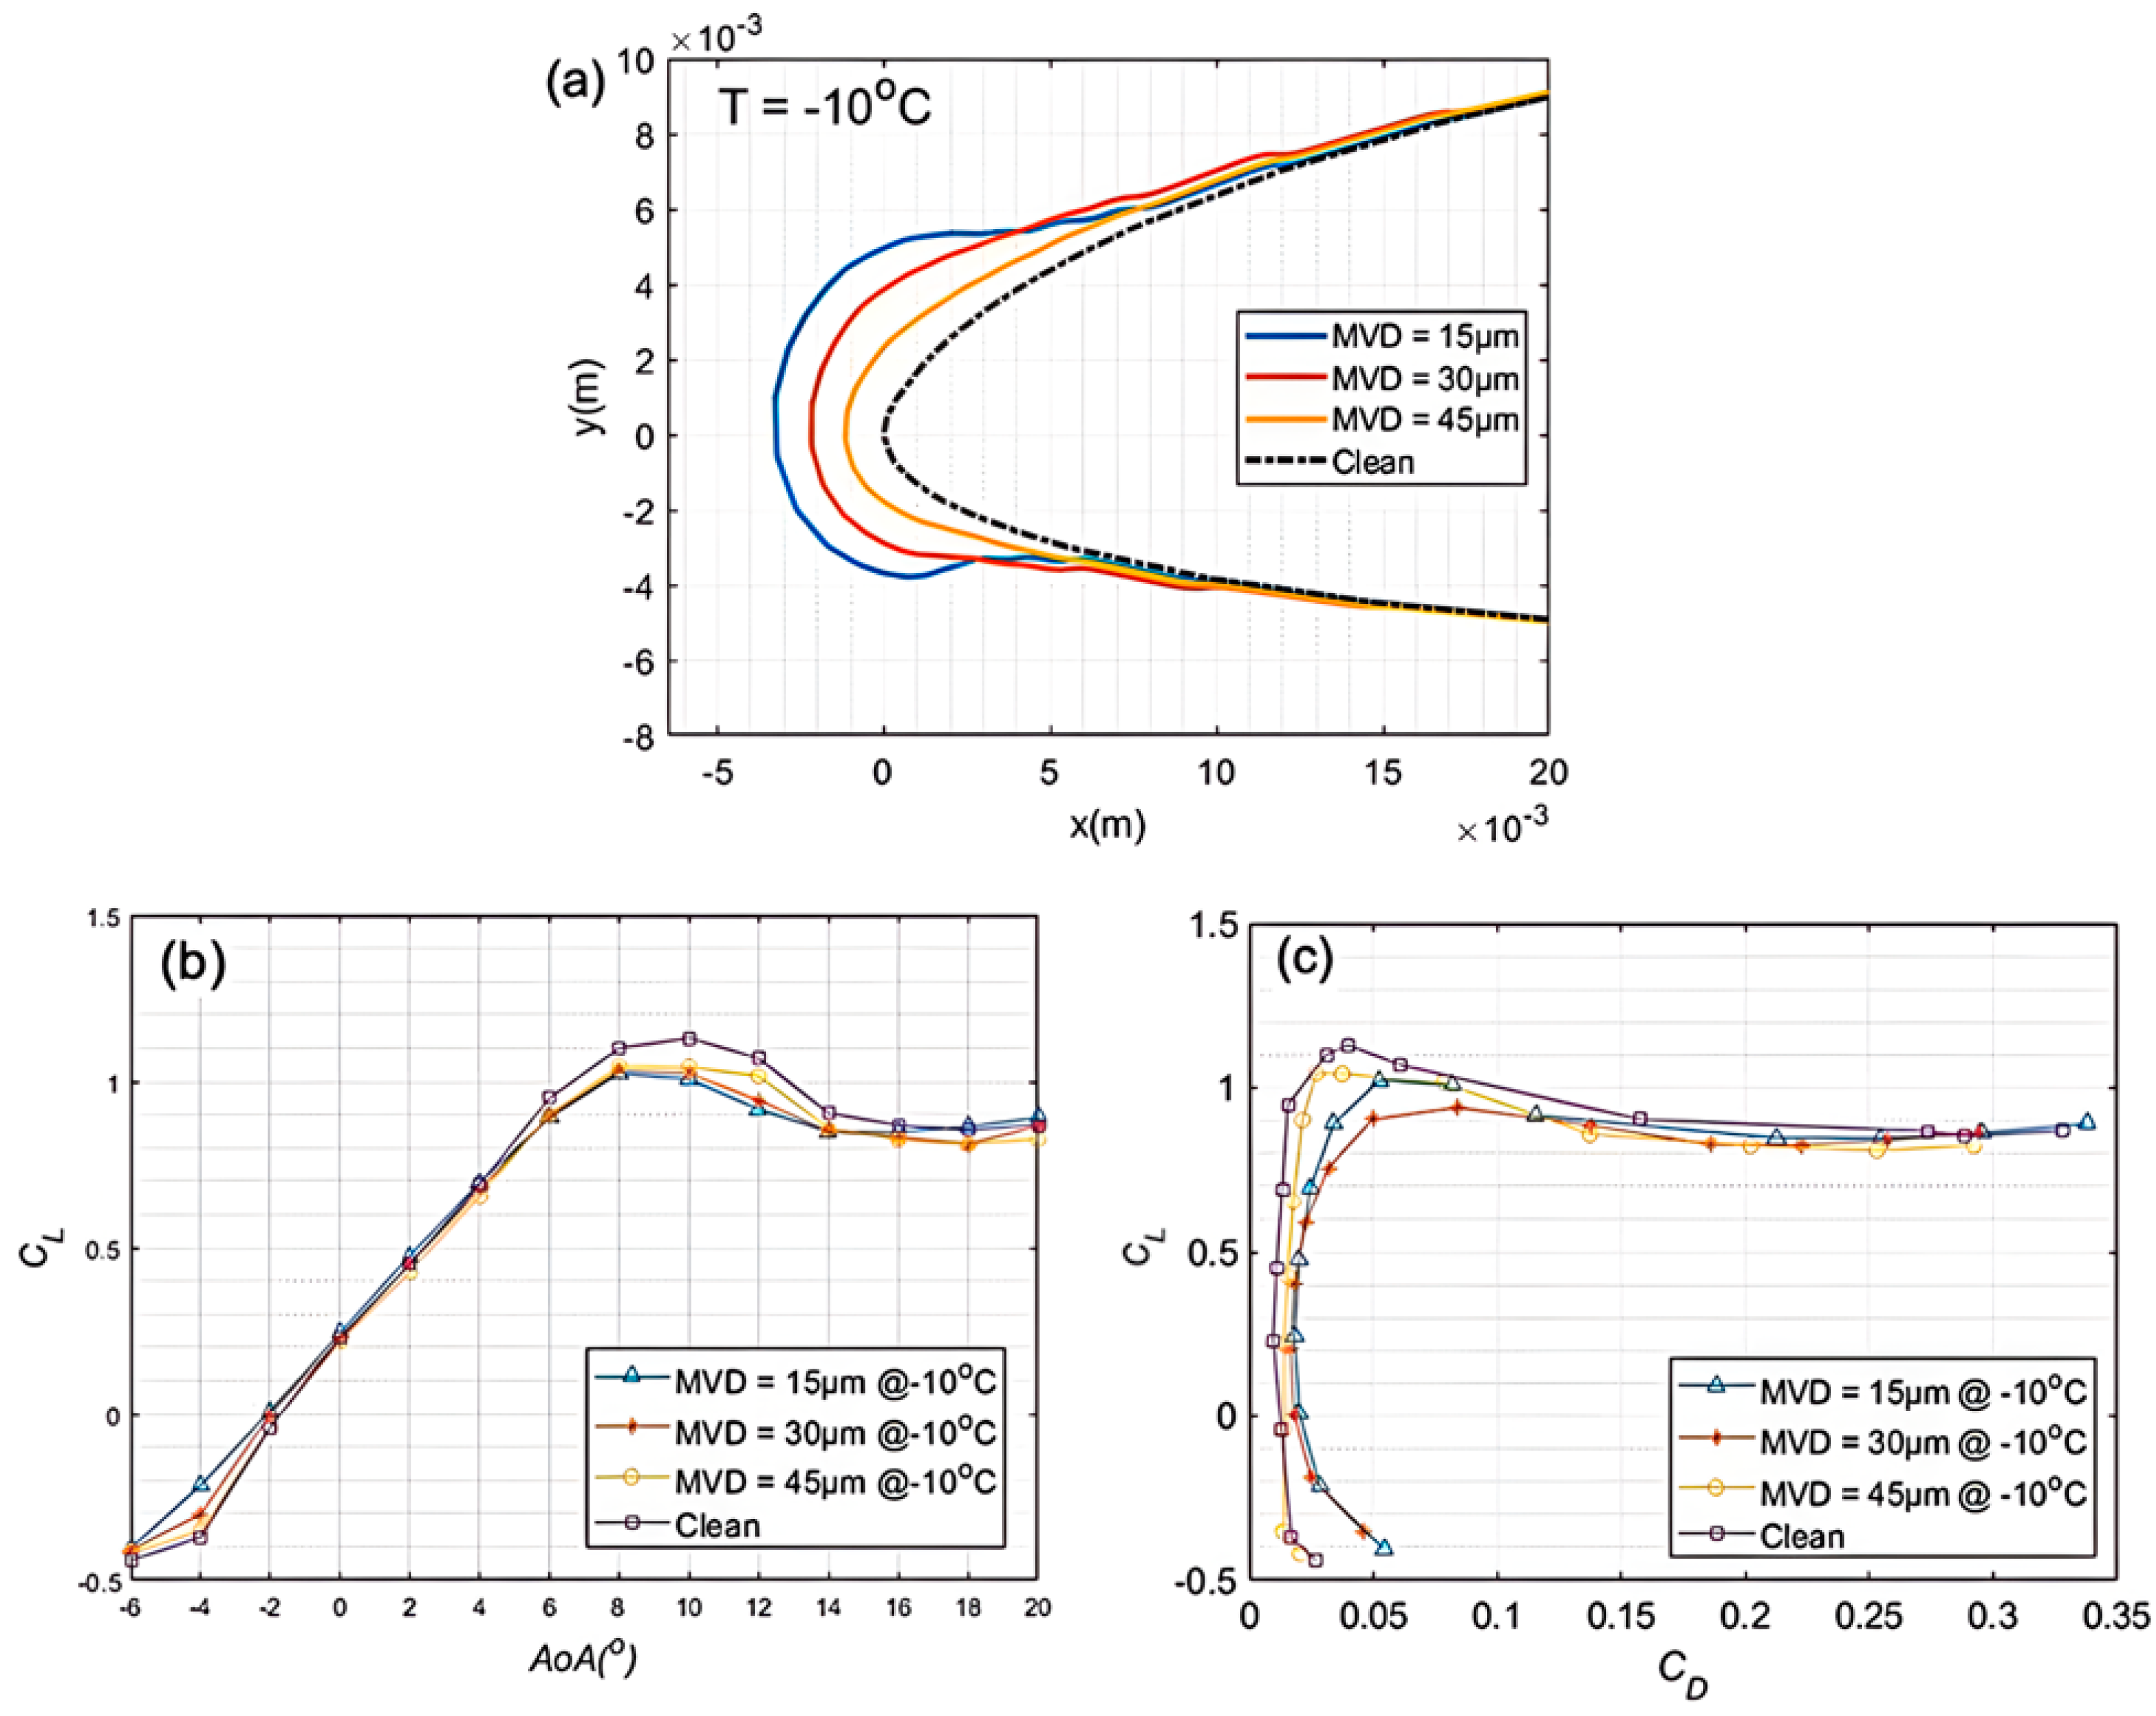
26]. Consequently, this study expands the scope of the investigation to encompass a temperature range spanning from −10 °C to −30 °C, a range pertinent to ceiling altitudes ranging from 1200 m to 6700 m [48]. This study fills the research gap within this range and underscores the significance of its role as a valuable contribution to the field.

2. Description of Numerical Methodologies

2.1. Numerical Approaches

In this study, the numerical flow field was calculated with a commercially available computational tool, ANSYS FLUENT 2020 R2. For all the cases of steady-state incompressible ideal gas, heat transfer, under the circumstance of ignoring the effect of body force, the governing equations could be described as follows:
(a)
The Continuity Equation [49]
· ρ v = 0
where  ρ  is the fluid density and  v  is the velocity vector.
(b)
Momentum Conservation Equations [49]
· ρ v v = p + · τ
τ = μ v + v T 2 3 · v I
where  p  is the static pressure,  τ  is the stress tensor,  μ  is the molecular viscosity, and  I  is the unit tensor. The second term on the right-hand side of Equation (3) describes the volume dilation.
(c)
The Energy Conservation Equation [49]
· v ρ E + p = · j h j J j
where  E  is the total energy,  T  is the temperature,  h j  is the sensible heat of species  j , and  J j  is the diffusion flux of species  j .
Shifting to ice shape prediction, the Drop3D and Ice3D modulus of FENSAP-Ice 2020 R2 were conducted to predict the ice shapes accreted on the aerofoil. Drop3D solves the particle flow as a continuum using the Eulerian formulation:
(d)
The Continuity and Momentum Equations [41]
· α V d = 0
α V d V d = C D R e d 24 K α V a V d
where  α  and  V d  are mean field values of the particle concentration and velocity, respectively. The right-hand side of Equation (6) describes the drag acting on particles of mean diameter  d C D  is the drag coefficient,  K  is the inertial parameter, and  R e d  is the droplet Reynolds number, which is calculated by:
R e d = ρ d V a , V a V d μ

2.2. Numerical Models

A comprehensive investigation was carried out on the clean RG-15 aerofoil employing CFD and a turbulence model while assuming of an infinite spanwise domain [23]. A C-grid mesh was employed, featuring enhanced mesh density near both the leading and trailing edges, as depicted in Figure 1a. To ensure precision and dependability in the predictions, a mesh independence study was developed to achieve a sufficiently fine mesh, wherein multiple meshes were generated, each exhibiting varying element densities and spatial resolutions, as shown in Table 2.
The aerofoil/domain mesh was generated in ANSYS ICEM-CFD 2020 R2. To facilitate an optimal comparison, the first layer thickness of the cell size  ( y + )  was set to 0.95 while maintaining a constant spanwise length of 0.005 m across all cases. To ensure a  y +  value of less than 1, the wall spacing  ( s )  was set to be  2.24 × 10 5   m  for M2, 3, and 4, considering a 1500 m ceiling altitude and a Reynolds number of 2 × 10⁵. The minimum streamwise mesh density  ( x + )  for each grid was varied from a coarse mesh of 50 to a fine mesh of 12. The total number of nodes was varied from  0.67 × 10 5  to  1.648 × 10 5 , respectively. Figure 1c illustrates the lift and drag coefficients for all the considered mesh configurations. Among them, M3 was selected for subsequent numerical analysis due to its balanced computational efficiency and superior accuracy compared to M4, which consumed more computational resources.
The boundary condition for the numerical simulation result is listed in Table 3. The freezing form of ice is influenced by numerous factors, including relative speed, liquid water content ( L W C ) in the air, droplet size in terms of mean volume diameter ( M V D ), angle of attack ( A o A ), the radius of the wing leading edge, and so on [50]. The shape of ice could be broadly classified into two types: glaze ice and rime ice. Glaze ice is created through the interaction of minute supercooled water droplets with surfaces exhibiting temperatures below the freezing point [51,52,53]. It tends to manifest within environments characterized by low atmospheric velocities, diminished temperatures, limited liquid water content, and minute droplet diameters [54]. Upon contact with the wing surface, supercooled droplets promptly freeze and adopt a semi-spherical configuration, consequently generating spear-shaped ice accretions along the leading edge [27]. In contrast, rime ice forms under relatively milder thermal circumstances. In environments featuring substantial water droplet sizes, heightened liquid water content, and elevated airspeeds, the immediate freezing of droplets upon wing surfaces is impeded [27,51]. Visually, glaze ice is translucent or fully transparent and adheres to the aerofoil surface, while rime ice is white in color and similar to everyday snow [55]. The rigid and slippery nature of glaze ice has a greater impact on the performance of the aerofoil, as glaze ice normally generates at conditions above −10 °C [55]. The physical ice shape introduced by William et al. [23] was used at −20 °C under intermittent maximum (IM) atmospheric icing conditions, which indicates a portion of convective, or cumuliform, clouds and icing conditions [48].

2.3. Model Validation

The numerical simulation was conducted employing ANSYS FLUENT 2020 R2, where the three-dimensional droplet model and corresponding ice accretion geometries were synthesized utilizing FENSAP-Ice 2020 R2 as previously stated. In the present steady-state investigation, a Courant–Friedrichs–Lewy (CFL) number of 20, conforming to the default setting, was employed. Regarding the DROP3D model, Appendix C was designated as the point of reference for conditions, and the characterization of droplet attributes was stipulated to adhere to the Langmuir D distribution. It is pertinent to mention that SLD conditions were intentionally included in the droplet size consideration in this investigation. A correlation-based critical Weber number was developed to describe the droplet break-up:
W e c r i t i c a l = 12 1 + 1.077 O h 1.6
where  O h  is the dimensionless Ohnesorge number calculated by:
O h = μ d ρ σ
where  σ  represents the droplets surface tension. The Weber number was used to define the break-up process, subsequently affecting the ice prediction. Table 4 is an overview of the droplet break-up types.
Shifting focus to the ANSYS FLUENT segment of the analysis, the choice of the SST k-omega turbulence model for the purpose of viscosity modeling was informed by its computational efficiency and relatively heightened precision under a low Reynolds number [56,57,58]. A boundary condition of symmetry was imposed on the spanwise cross-section of the computational grid, thereby aligning with the assumption of infinite spanwise extent. The iteration count was established at 2000 iterations, a level deemed sufficient for attaining precise averaged data within oscillatory convergence phenomena, particularly in proximity to stall.
Figure 2 shows the comparison of the present numerical and experiment results extracted from Williams et al. [23]. According to the standard of FAR Appendix C to part 25 [48], the general scope of the ice accreted on the aerofoil is well estimated even though a few insignificant details, such as the unevenness at the leading edge, are not captured accurately. From Figure 3, the coefficients of pressure ( C P ) were calculated to compare and contrast the effect on the pressure distribution of a clean aerofoil and an ice-accreted aerofoil. Pressure distributions among the surface of aerofoils were plotted for 0°, 4°, and −4°  A o A . Furthermore, there were good agreements between experimentally measured clean aerofoil  C P  by Oo et al. [24] and the current study, as shown in Figure 3. As listed in Table 5, a further validation was made by comparing the lift and drag coefficients, and it was observed that they are within 5% error of the published results. Table 6 illustrates the selected icing cases in this study; the data are extracted from the “Atmospheric icing conditions” figure for the intermittent maximum condition from FAR Appendix C to part 25 [48].

3. Results and Discussion

The primary objective of this numerical investigation was to assess the aerodynamic performance of the RG-15 aerofoil under various icing conditions. To achieve this goal, nine distinct icing conditions were selected, encompassing the ambient temperatures of  10 20 , and  30   ° C , with MVDs of  15   μ m 30   μ m , and  45   μ m  at each temperature level.

3.1. Icing Conditions at Different Mean Volume Diameters

As the temperature was set to be  10   ° C , the simulated ice accretion on the leading edge of the RG 15 aerofoil was investigated under three distinct  M V D  of icing conditions,  15   μ m 30   μ m , and  45   μ m , as depicted in Figure 4a. It was observed that the increase in  M V D  reduces the ice-accreted aerofoil chord length from 213.27 mm to 212.18 mm to 211.16 mm. Additionally, a noteworthy finding emerged, revealing that as the  M V D  decreases, the ice accretion exhibits a progressively narrower shape, with a reduction in the area over which ice adhered to the aerofoil. This observation underscores the influence of  M V D  on the spatial distribution and geometry of ice accumulation on the aerofoil surface. The aerodynamic performance of the aerofoil was evaluated using the coefficient of lift,  C L , and drag,  C D , which are essential non-dimensional parameters derived from the total lift force,  L , and total drag force,  D , acting on the aerofoil, as shown in Equations (10) and (12). These coefficients are linked to the freestream speed,  U , and the wing surface area,  A . Notably, the presence of ice accretion on the aerofoil introduces changes in the effective wing surface area,  A i c e , which can be calculated as the product of the spanwise length,  S , and the effective chord length described as  c c l e a n + t , where  t  represents the maximum ice thickness in the chordwise direction as shown in Equations (2) and (4). Consequently, the lift and drag coefficients are influenced by these variations in chord length, which occur in ice-accreted cases due to the size of the ice, as well as surface roughness and flow separation resulting from ice accretion [24,38]. To assess the impact of ice accretion on the aerodynamic performance of the aerofoil, the lift coefficients and lift-to-drag ratio were computed for both the clean and ice-accreted conditions at a temperature of −10 °C. The results are illustrated in Figure 4b,c, providing a visual representation of the aerodynamic response of the aerofoil under icing conditions.
C L , c l e a n = L 1 2 ρ U 2 A c l e a n = L 1 2 ρ U 2 c c l e a n S
C L , i c e = L 1 2 ρ U 2 A i c e = L 1 2 ρ U 2 ( c c l e a n + t ) S
C D , c l e a n = D 1 2 ρ U 2 A c l e a n = D 1 2 ρ U 2 c c l e a n S
C D , i c e = D 1 2 ρ U 2 A i c e = D 1 2 ρ U 2 ( c c l e a n + t ) S
In general, ice accretion on aerofoils tends to diminish aerodynamic performance, especially with regard to the lift coefficient [12]. As illustrated in Figure 4b, the variation in lift coefficient differentials is evident with differences in ice shapes, becoming particularly pronounced as the angle of attack approaches the conditions leading to stall, approximately around 10°. Notably, under the  M V D = 30   μ m  condition, the lift coefficient disparity between the iced aerofoil and the clean aerofoil is as high as 10.85% at an angle of attack of 10°. This represents the most significant observed difference in lift coefficients, primarily occurring under −10 °C conditions. In comparison to the clean aerofoil, the lift coefficients under the  30   μ m  and  45   μ m  conditions decrease by 9.56% and 7.65%, respectively. As the temperature reduces to −20 °C, a recurrence of the previously observed phenomena at −10 °C is evident. Specifically, it is noteworthy that as the  M V D  decreases, the ice accretion on the leading edge becomes thicker while concurrently assuming a narrower shape. For instance, with an increase in  M V D , the maximum ice thickness declines, showcasing values of 2.76 mm, 1.85 mm, and 0.83 mm, respectively. A similar trend to that observed at other temperatures emerges, where ice accretion on the aerofoil decreases its aerodynamic performance, especially concerning the lift coefficient. As depicted in Figure 5, the lift coefficient for ice accreted under  15   μ m 30   μ m , and  45   μ m   M V D  conditions experiences reductions of 10.33%, 9.29%, and 8.18%, respectively, at a 10°  A o A .
As the temperature further reduces to −30 °C, a similar pattern to that observed at both −10 °C and −20 °C becomes evident, wherein a decrease in  M V D  results in thicker and narrower ice accretion on the leading edge of the aerofoil. However, the magnitude of this effect is comparatively less pronounced due to the limitations of the ice shape analysis. Conversely, with an increase in  M V D  and decrease in  L W C , a reduction in the maximum ice thickness is observed, with respective values of 1.92 mm, 1.35 mm, and 0.58 mm. The comprehensive examination of these phenomena at varying temperatures and icing conditions enriches our understanding of ice accretion dynamics and its implications for aircraft aerodynamics. The influence of ice accretion on the leading edge of the aerofoil results in a less pronounced change in the lift coefficient, owing to the smaller size of the ice accretion formed under different  M V D  conditions at −30 °C. As depicted in Figure 6b, with an increase in  M V D , the lift coefficient at an  A o A  of 10° experiences a decline of 9.45%, 8.03%, and 7.96%, respectively. Conversely, the investigation also reveals that with ice accretion on the aerofoil, the drag coefficient experiences an increase at all  A o A , where the maximum drag coefficient, 0.0543, occurs at conditions of −10 °C,  M V D = 15   μ m . This observation is consistent across all ice test conditions examined in this study. The changes in drag coefficient further underscore the complex interplay between ice accretion and aerodynamic forces, which must be meticulously considered in the design and operation of aircraft in icing conditions.

3.2. Icing Conditions at Different Temperatures

In this section, a parallel comparison is presented, which was conducted to assess the impact of ice accretion under different temperature conditions while keeping the  M V D  constant at  15   μ m . Indeed, selecting the  M V D  of  15   μ m  for comparison is not only based on its significance in highlighting the differences between ice generated under different temperatures but also the fact that it has the advantage of aligning with the experimental data obtained by Williams et al. [23], which enhances the robustness and reliability of the findings.
Figure 7 illustrates the drag coefficient,  C D , and lift coefficient,  C L , across temperatures ranging from −10 °C to −40 °C at a  0 °   A o A . Strikingly, the results reveal a nearly linear decrease in both  C D  and  C L  as the temperature decreases, with reductions of up to 20.5% and 11.2%, respectively. The changes in these coefficients under different temperature conditions significantly influence the total mass of the aerial vehicle due to ice accretion and the consequent relocation of the mass center, leading to alterations in the inertial mass moment [17]. Figure 8 presents the moment coefficient ( C m ) and the power consumption factor ( P ), respectively.  C m  reveals the aerodynamic moment experienced by the aerofoil, while  P  is calculated as the ratio of power required for each ice-accreted sample to that required for the clear aerofoil. The findings reveal a notable 26.5% increase in power consumption with the  M V D   15   μ m  icing condition at −10 °C. As depicted in Figure 4a, Figure 5a and Figure 6a, the ice accretion primarily occurs at the leading edge of the aerofoil at the low Reynolds numbers that were examined in this study. This ice accretion leads to a forward shift in the mass center, as evidenced by the data presented in Table 7. The forward shift of the mass center in the presence of ice accretion signifies the redistribution of mass, potentially influencing the aircraft’s stability and control characteristics.

3.3. Comparison with Symmetric Aerofoil

This section presents a numerical investigation of the NACA0009 aerofoil to examine its aerodynamic performance under icing conditions. To ensure a fair and balanced comparison between symmetrical and cambered aerofoils, both aerofoils have a chord length of 210 mm. Additionally, they share the same maximum thickness of 9%, located at approximately 30% of the chord length, as shown in Figure 9. The study focuses on inducing ice accumulation under conditions of −20 °C and an  M V D  of  15   μ m . Figure 10 illustrates the resultant shape of the accreted ice under these specified conditions.
As depicted in Figure 11a,b, lift and drag coefficients are obtained for both the iced and clean aerofoil configurations. These results are then compared with those of the RG-15 aerofoil under similar icing conditions. This observation underscores the significance of aerofoil camber in influencing the ice accretion’s further degradation of aerofoil performance. Analysis of the lift coefficients for the NACA0009 aerofoil reveals a decrease in lift performance across different height ranges due to the presence of ice. The reduction in lift coefficients with icing for the NACA0009 aerofoil aligns with the trends observed in the RG-15 aerofoil study, reaffirming the adverse effects of ice accretion on lift for both aerofoil geometries. Similarly, the study of drag coefficients for the NACA0009 aerofoil indicates an increase in drag at all angles of attack with ice accretion. This result closely correlates with findings from the RG-15 aerofoil study, suggesting a consistent impact of ice accretion on drag performance for both aerofoil types. Comparing the NACA0009 and RG-15 aerofoils reveals a strikingly similar aerodynamic response to icing conditions despite their different aerodynamic shapes. However, certain differences may arise due to variations in aerofoil shapes, flow characteristics, and boundary layer interactions. Even with steady-state simulations, the immediate formation of deep blue separation regions is observed after ice formation, known as ice-induced separation bubbles [38]. In the current configuration, larger layer-wise separation bubbles appear beneath the RG-15 wing at  0 °   A o A , i.e., dominated by the ice accretion exhibited on the pressure side of the aerofoil (see Figure 12), while similar-sized separation bubbles are observed on both the upper and lower surfaces of the NACA0009 aerofoil (see Figure 13). Thus, it is evident that, under similar icing conditions, cambered aerofoils exhibit distinct flow patterns when the leading edge is ice accreted. Figure 11a highlights that the impact of leading edge icing on the maximum lift of the RG-15 aerofoil (average loss of 16.9%) is more significant than when using the NACA0009 aerofoil (average loss of 14.4%).
Figure 12 and Figure 13 present average velocity contour plots depicting the states of clean and ice-accreted RG-15 and NACA0009 aerofoil configurations. Upon scrutinizing these plots, distinct patterns emerge, revealing that both the RG-15 and NACA0009 aerofoils exhibit notable zones of reduced velocity proximate to their ice-accreted leading edges, a departure from the characteristics exhibited by their clean counterparts. A notable divergence is observed in the case of the NACA0009 aerofoil due to its inherent symmetry; specifically, the upper surface manifests a low-velocity region surrounding the leading edge that is symmetrical to a corresponding region on the lower surface. In contrast, the RG-15 aerofoil displays pronounced asymmetry in the size of the low-velocity regions between its upper and lower surfaces. This observed dissimilarity likely contributes to the disparate magnitudes of subsequent aerodynamic degradation. To attain a more comprehensive understanding of the impact of the aforementioned low-velocity regions on the velocity profile and pressure distribution encompassing the aerofoil, prospective research initiatives could investigate scenarios incorporating lower Reynolds numbers and a wider range of icing conditions.

4. Conclusions

This study is a numerical investigation of the ice accretion process on the RG-15 aerofoil, considering a temperature range from −10 °C to −30 °C and mean volumetric diameters of  15   μ m 30   μ m , and  45   μ m . The objective is to analyze the aerodynamic impact of ice accretion on the lift and drag coefficients of the aerofoil and explore the influences of temperature and liquid water content on the resulting ice shape characteristics. Additionally, the research reveals that lower temperatures and smaller liquid water content lead to a reduction in the maximum thickness of ice accretion on the aerofoil. Interestingly, despite this reduction in thickness, the ice shape exhibits a less pronounced narrowing effect. The study’s findings indicate that, under various icing conditions, the power consumption increases in the range of 0.46% to 26.5%, and this increase is synchronized with the rise in drag coefficient. To further understand icing on aerofoils, a comparative study is conducted using an NACA0009 symmetrical aerofoil under similar icing conditions as the RG-15. The ice shape on the NACA0009 remains nearly symmetrical at a 0° angle of attack, influencing the shape and distribution of separation bubbles. In comparison to a clean aerofoil, ice accretion on the RG-15 at −10 °C with a mean volumetric diameter of  15   μ m  results in an approximately 0.95% forward shift in the center of mass. Simultaneously, under this specific icing condition, the lift coefficient decreases by 10.85%, marking the most significant difference observed among all investigated icing conditions in this study. The current research focuses on a specific set of cloud conditions, and future studies can delve more comprehensively and deeply into various cloud conditions.

Author Contributions

Conceptualization, H.C., D.Z. and N.L.O.; methodology, H.C. and N.L.O.; software, H.C.; validation, H.C., N.L.O., X.L. and X.D.; formal analysis, H.C., N.L.O. and X.L.; investigation, H.C., D.Z. and N.L.O.; resources, H.C., D.Z. and N.L.O.; data curation, H.C., D.Z. and N.L.O.; writing—original draft preparation, H.C.; writing—review and editing, D.Z. and N.L.O.; visualization, H.C., D.Z. and N.L.O.; supervision, D.Z. and N.L.O.; funding acquisition, D.Z. All authors have read and agreed to the published version of the manuscript.

Funding

The research reported in this article was financially supported by the University of Canterbury, New Zealand (No. 452DISDZ).

Data Availability Statement

The data that support the findings of this study are available from the corresponding author upon reasonable request.

Acknowledgments

The first author would like to thank the project for funding him as a PhD student under the supervision of Zhao, D., and Oo, N.L.

Conflicts of Interest

The authors declare no conflict of interest.

References

  1. Hann, R.; Wenz, A.; Gryte, K.; Johansen, T.A. Impact of atmospheric icing on UAV aerodynamic performance. In Proceedings of the 2017 Workshop on Research, Education and Development of Unmanned Aerial Systems (RED-UAS), Linköping, Sweden, 3–5 October 2017; pp. 66–71. [Google Scholar]
  2. Naval Environmental Prediction Research Facility Report. Impact of Icing on Unmanned Aerial Vehicle (uav) Operations. 1990. Available online: https://apps.dtic.mil/sti/citations/ADA231191 (accessed on 18 December 2023).
  3. Muhammed, M.; Virk, M.S. Ice Accretion on Fixed-Wing Unmanned Aerial Vehicle—A Review Study. Drones 2022, 6, 86. [Google Scholar] [CrossRef]
  4. Keane, J.F.; Carr, S.S. A brief history of early unmanned aircraft. Johns Hopkins APL Tech. Dig. 2013, 32, 558–571. [Google Scholar]
  5. Carroll, T.; McAvoy, W. The Formation of Ice upon Airplanes in Flight. Airw. Age 1928, 58–59. Available online: https://ntrs.nasa.gov/citations/19930081134 (accessed on 18 December 2023).
  6. Jacobs, E.N. Airfoil section characteristics as affected by protuberances. NACA Rep. 1934, 446, 109–124. [Google Scholar]
  7. Jones, R.; Williams, D. Effect of Surface Roughness on Characteristics of Aerofoils NACA 0012 and RAF 34; HM Stationery Office: London, UK, 1936. [Google Scholar]
  8. Icing Research Tunnel; Program from the American Society of Mechanical Engineers dedication as an International Historic Mechanical Engineering Landmark: Cleveland, OH, USA, 1987.
  9. Gray, V.H. Effect of Ice and Frost Formations on Drag of NACA 651-212 Airfoil for Various Modes of Thermal Ice Protection; National Advisory Committee for Aeronautics: Washington, DC, USA, 1953. [Google Scholar]
  10. Gray, V.H. Correlations among Ice Measurements, Impingement Rates Icing Conditions, and Drag Coefficients for Unswept NACA 65A004 Airfoil; National Aeronautics and Space Administration: Cleveland, OH, USA, 1958. [Google Scholar]
  11. Gray, V.H.; vonGlahn, U.H. Aerodynamic Effects Caused by Icing of an Unswept NACA 65A004 Airfoil; National Aeronautics and Space Administration: Cleveland, OH, USA, 1958. [Google Scholar]
  12. Bragg, M.B.; Broeren, A.P.; Blumenthal, L.A. Iced-airfoil aerodynamics. Prog. Aerosp. Sci. 2005, 41, 323–362. [Google Scholar] [CrossRef]
  13. Potapczuk, M.; Gerhart, P. Progress in development of a Naviér-Stokes solver for evaluation of iced airfoil performance. In Proceedings of the 23rd Aerospace Sciences Meeting, Reno, NV, USA, 14–17 January 1985; p. 410. [Google Scholar]
  14. Aircraft Accident Report: In-Flight Icing Encounter and Loss of Control; National Transportation Safety Board: Washington, DC, USA, 1994.
  15. Koenig, G.; Ryerson, C.; Kmiec, R. UAV icing flight simulation. In Proceedings of the 40th AIAA Aerospace Sciences Meeting & Exhibit, Reno, NV, USA, 14–17 January 2002; p. 812. [Google Scholar]
  16. Hann, R.; Johansen, T.A. Unsettled Topics in Unmanned Aerial Vehicle Icing; SAE Technical Paper; SAE International: Warrendale, PA, USA, 2020. [Google Scholar]
  17. Kim, H.; Bragg, M. Effects of leading-edge ice accretion geometry on airfoil performance. In Proceedings of the 17th Applied Aerodynamics Conference, Las Vegas, NV, USA, 28 June–1 July 1999; p. 3150. [Google Scholar]
  18. Chung, J.; Addy, H., Jr. A numerical evaluation of icing effects on a natural laminar flow airfoil. In Proceedings of the 38th Aerospace Sciences Meeting and Exhibit, Reno, NV, USA, 10–13 January 2000; p. 96. [Google Scholar]
  19. Papadakis, M.; Yeong, H.W.; Vargas, M.; Potapczuk, M. Aerodynamic performance of a swept wing with ice accretions. In Proceedings of the 41st Aerospace Sciences Meeting and Exhibit, Reno, NV, USA, 6–9 January 2003; p. 731. [Google Scholar]
  20. Diebold, J.; Monastero, M.; Bragg, M. Aerodynamics of a swept wing with ice accretion at low Reynolds number. In Proceedings of the 30th AIAA Applied Aerodynamics Conference, New Orleans, LA, USA, 25–25 June 2012; p. 2795. [Google Scholar]
  21. Seifert, H.; Richert, F. Aerodynamics of iced airfoils and their influence on loads and power production. In Proceedings of the EWEC-Conference, Dublin Castle, Ireland, 6–9 October 1997; pp. 458–463. [Google Scholar]
  22. Hochart, C.; Fortin, G.; Perron, J.; Ilinca, A. Wind turbine performance under icing conditions. Wind. Energy Int. J. Prog. Appl. Wind. Power Convers. Technol. 2008, 11, 319–333. [Google Scholar] [CrossRef]
  23. Williams, N.; Benmeddour, A.; Brian, G.; Ol, M. The effect of icing on small unmanned aircraft low Reynolds number airfoils. In Proceedings of the 17th Australian International Aerospace Congress, Melbourne, Australia, 26 February–2 March 2017; pp. 19–25. [Google Scholar]
  24. Oo, N.L. Low Reynolds Number Aerodynamics of a UAV Wing under Icing Condition. ResearchSpace@ Auckland. Ph.D. Thesis, The University of Auckland, Auckland, New Zealand, 2020. [Google Scholar]
  25. Lindner, M.; Wallisch, J.; Hann, R. UAV Icing: Numerical Simulation of Icing Effects on Wing and Empennage; SAE Technical Paper; SAE International: Warrendale, PA, USA, 2023. [Google Scholar]
  26. Hann, R.; Müller, N.; Lindner, M.; Wallisch, J. UAV Icing: Experimental Validation Data for Predicting ice Shapes at Low Reynolds Numbers; SAE Technical Paper; SAE International: Warrendale, PA, USA, 2023. [Google Scholar]
  27. Cao, Y.; Tan, W.; Wu, Z. Aircraft icing: An ongoing threat to aviation safety. Aerosp. Sci. Technol. 2018, 75, 353–385. [Google Scholar] [CrossRef]
  28. Cao, Y.; Wu, Z.; Su, Y.; Xu, Z. Aircraft flight characteristics in icing conditions. Prog. Aerosp. Sci. 2015, 74, 62–80. [Google Scholar] [CrossRef]
  29. Raj, L.P.; Yee, K.; Myong, R. Sensitivity of ice accretion and aerodynamic performance degradation to critical physical and modeling parameters affecting airfoil icing. Aerosp. Sci. Technol. 2020, 98, 105659. [Google Scholar]
  30. Berengut, D. Statistics for Experimenters: Design, Innovation, and Discovery; Taylor & Francis: New York, NY, USA, 2006. [Google Scholar]
  31. Thomas, S.K.; Cassoni, R.P.; MacArthur, C.D. Aircraft anti-icing and de-icing techniques and modeling. J. Aircr. 1996, 33, 841–854. [Google Scholar] [CrossRef]
  32. Salisbury, J.T. Microwave Deicing and Anti-Icing System for Aircraft. U.S. Patent 5,615,849, 1 April 1997. [Google Scholar]
  33. Ferro, C.G.; Pietrangelo, F.; Maggiore, P. Heat Exchange Performance Evaluation Inside a Lattice Panel Using CFD Analysis for an Innovative Aerospace Anti-Icing System. Aerosp. Sci. Technol. 2023, 141, 108565. [Google Scholar] [CrossRef]
  34. Wallisch, J.; Hann, R. UAV Icing: Experimental Investigation of Ice Shedding Times with an Electrothermal De-Icing System. In Proceedings of the AIAA AVIATION 2022 Forum, Chicago, IL, USA, 27 June–1 July 2022; p. 3905. [Google Scholar]
  35. Mohseni, M.; Amirfazli, A. A novel electro-thermal anti-icing system for fiber-reinforced polymer composite airfoils. Cold Reg. Sci. Technol. 2013, 87, 47–58. [Google Scholar] [CrossRef]
  36. Karpen, N.; Diebald, S.; Dezitter, F.; Bonaccurso, E. Propeller-integrated airfoil heater system for small multirotor drones in icing environments: Anti-icing feasibility study. Cold Reg. Sci. Technol. 2022, 201, 103616. [Google Scholar] [CrossRef]
  37. Liu, H.H.; Hua, J. Three-dimensional integrated thermodynamic simulation for wing anti-icing system. J. Aircr. 2004, 41, 1291–1297. [Google Scholar] [CrossRef]
  38. Oo, N.L.; Richards, P.; Sharma, R. Influence of an ice-induced separation bubble on the laminar separation bubble on an RG-15 airfoil at low Reynolds numbers. In Proceedings of the AIAA Aviation 2020 Forum, Online, 15–19 June 2020; p. 3065. [Google Scholar]
  39. Hann, R. Hazards of In-Flight Icing on Unmanned Aircraft. In Proceedings of the Flight Testing of Unmanned Aerial Systems (UAS), Segovia, Spain, 12–13 May 2022. [Google Scholar]
  40. Szilder, K.; McIlwain, S. In-Flight Icing of UAVs-the Influence of Reynolds Number on the Ice Accretion Process; SAE International: Warrendale, PA, USA, 2011. [Google Scholar]
  41. Fajt, N.; Hann, R.; Lutz, T. The influence of meteorological conditions on the icing performance penalties on a UAV airfoil. In Proceedings of the 8th European Conference for Aeronautics and Space Sciences (EUCASS), Madrid, Spain, 1–4 July 2019. [Google Scholar]
  42. Szilder, K.; Yuan, W. In-flight icing on unmanned aerial vehicle and its aerodynamic penalties. Prog. Flight Phys. 2017, 9, 173–188. [Google Scholar]
  43. Ruff, G.A.; Berkowitz, B.M. Users Manual for the NASA Lewis Ice Accretion Prediction Code (LEWICE); National Aeronautics and Space Administration: Cleveland, OH, USA, 1990. [Google Scholar]
  44. Beaugendre, H.; Morency, F.; Habashi, W.G. FENSAP-ICE’s three-dimensional in-flight ice accretion module: ICE3D. J. Aircr. 2003, 40, 239–247. [Google Scholar] [CrossRef]
  45. Mingione, G.; Brandi, V. Ice accretion prediction on multielement airfoils. J. Aircr. 1998, 35, 240–246. [Google Scholar] [CrossRef]
  46. Gent, R. TRAJICE2—A combined water droplet trajectory and ice accretion prediction program for aerofoils. J. Mech. Sci. Technol. 1990, 26, 90054. [Google Scholar]
  47. Hedde, T.; Guffond, D. ONERA three-dimensional icing model. AIAA J. 1995, 33, 1038–1045. [Google Scholar] [CrossRef]
  48. Handbook, A.F. Federal Aviation Administration; Department of Transportation: Washington, DC, USA, 1972. [Google Scholar]
  49. Fluent, A. Ansys Fluent Theory Guide; Ansys Inc.: Canonsburg, PA, USA, 2011; Volume 15317, pp. 724–746. [Google Scholar]
  50. Oo, N.; Kay, N.; Brenkley, A.; Sharma, R. Investigation into the behaviour of an iced low Reynolds number aerofoil. In Proceedings of the Proceedings of the 10th International Micro-Air Vehicles Conference, Melbourne, Australia, 22–23 November 2018; pp. 22–23. [Google Scholar]
  51. Wright, W.B. User Manual for the NASA Glenn Ice Accretion Code LEWICE. Version 2.2.2; National Aeronautics and Space Administration: Cleveland, OH, USA, 2002. [Google Scholar]
  52. Mikkelsen, K.; Mcknight, R.; Ranaudo, R.; Perkins, J.P. Icing flight research-Aerodynamic effects of ice and ice shape documentation with stereo photography. In Proceedings of the 23rd Aerospace Sciences Meeting, Reno, NV, USA, 14–17 January 1985; p. 468. [Google Scholar]
  53. Cao, Y.; Huang, J. New method for direct numerical simulation of three-dimensional ice accretion. J. Aircr. 2015, 52, 650–659. [Google Scholar] [CrossRef]
  54. Kind, R.; Potapczuk, M.; Feo, A.; Golia, C.; Shah, A. Experimental and computational simulation of in-flight icing phenomena. Prog. Aerosp. Sci. 1998, 34, 257–345. [Google Scholar] [CrossRef]
  55. Liu, C.; Wang, Y. Numerical analysis of ice accretion effects at super-cooled large droplet conditions on airfoil aerodynamics. J. Mod. Transp. 2011, 19, 274–278. [Google Scholar] [CrossRef]
  56. Hann, R.; Hearst, R.J.; Sætran, L.R.; Bracchi, T. Experimental and numerical icing penalties of an S826 airfoil at low Reynolds numbers. Aerospace 2020, 7, 46. [Google Scholar] [CrossRef]
  57. Liu, D.; Nishino, T. Numerical analysis on the oscillation of stall cells over a NACA 0012 aerofoil. Comput. Fluids 2018, 175, 246–259. [Google Scholar] [CrossRef]
  58. Manni, L.; Nishino, T.; Delafin, P.-L. Numerical study of airfoil stall cells using a very wide computational domain. Comput. Fluids 2016, 140, 260–269. [Google Scholar] [CrossRef]
Figure 1. (a) The numerical simulation domain of RG-15 aerofoil, (b) the numerical domain for M3 mesh, (c) mesh independence study for lift and drag coefficient of clean RG-15 aerofoil at  A o A = 0 °  and  R e = 200,000 . Red highlighted circle stands for the selected mesh.
Aerospace 11 00007 g001
Figure 2. Ice shapes from present numerical simulation and Williams et al. [23] at 3 different  A o A : (a) 0°, (b) 4°, (c) −4°.
Aerospace 11 00007 g002
Figure 3. Comparison study of the variation in the pressure coefficients predicted from clean and iced aerofoils, and results from Oo et al. [38], as  A o A   is set to 3 different values: (a A o A = 0 ° , (b A o A = 4 ° , (c A o A = 4 ° .
Aerospace 11 00007 g003
Figure 4. (a) Generated ice shapes on RG-15 aerofoil at −10 °C, (b) lift coefficient, and (c) lift-to-drag ratio of the clean and ice-accreted RG-15 aerofoil at −10 °C.
Aerospace 11 00007 g004
Figure 5. (a) Generated ice shapes on RG-15 aerofoil at −20 °C, (b) lift coefficient, and (c) lift-to-drag ratio of the clean and ice-accreted RG-15 aerofoil at −20 °C.
Aerospace 11 00007 g005
Figure 6. (a) Generated ice shapes on RG-15 aerofoil at −30 °C, (b) lift coefficient, and (c) lift-to-drag ratio of the clean and ice-accreted RG-15 aerofoil at −30 °C.
Aerospace 11 00007 g006
Figure 7. Variation in the drag (a) and lift (b) with experiment results from William et al. [23] under different temperatures.
Aerospace 11 00007 g007
Figure 8. Variation in the moment (a) and relative power consumption coefficient (b) with experiment results from William et al. [23] under different temperatures.
Aerospace 11 00007 g008
Figure 9. Comparison of RG-15 and NACA0009 aerofoil geometries.
Aerospace 11 00007 g009
Figure 10. Comparison of RG-15 and NACA0009 ice-accreted leading edges.
Aerospace 11 00007 g010
Figure 11. (a) Lift coefficient and (b) lift-to-drag ratio of the clean and ice-accreted RG-15 and NACA0009 aerofoil at  T = 20   ° C ,   M V D = 15   μ m .
Aerospace 11 00007 g011
Figure 12. Average velocity contour maps for (a) clean and (b) ice-accreted RG-15 aerofoil with (c) detail.
Aerospace 11 00007 g012
Figure 13. Average velocity contour maps for (a) clean and (b) ice-accreted NACA0009 aerofoil with (c) detail.
Aerospace 11 00007 g013
Table 1. R&D on aerodynamics problems in icing at low Reynolds number.
Authors Re   ( × 1 0 6 ) Aerofoil ModelExperimental (EXP) or Numerical (NUM)Notes
Seifert and Richert [21], 19970.6NACA 4415EXPIce fragments from a small wind turbine used to create wind tunnel models to estimate energy loss.
Hochart et al. [22], 20080.3 to 0.7NACA 63-415NUMIcing simulations on wind turbine blades in Quebec reveal ice effects on lift, drag, and de-icing potential.
Williams et al. [23], 20170.2RG-15EXPPerformance data from water and wind experiment at 3 specific angles of attack.
Oo et al. [24], 20200.05 to 0.2RG-15NUMPerformance data from transient simulation on  5   ° C  icing and study on ice-induced separation bubble.
Lindner et al. [25], 20230.5RG-15NUM 2   ° C  to  6   ° C , where the transition from glaze ice to rime ice is located.
Hann et al. [26], 20230.56 to 0.6RG-15EXPPerformance data from wind experiment at  2 4  and  10   ° C .
This study0.2RG-15NUMPerformance data from steady-state simulation at  10 20 , and  30   ° C .
Table 2. Mesh independence study parameters.
Mesh No.   Streamwise   x +   Wall   Normal   y + Number   of   Nodes   ( × 10 5 )
M1   50 < x + < 90 0.950.67
M2   25.2 < x + < 50 0.950.74
M3   17.5 < x + < 25.2 0.951.158
M4   12 < x + < 17.5 0.951.648
Table 3. Geometric dimension and ambient flow, temperature, and boundary conditions.
No.ParameterValue
1Aerofoil TypeRG-15
2Chord Length ( c )   0.21   m
3Free Stream Velocity ( U )   14.5   m / s
4Reynolds Number   2 × 10 5
5Ceiling Altitude   1200   m   t o   6700   m
6Temperature   40   ° C   t o 10   ° C
7Exposure Time   360   s
8Angle of Attack ( A o A )   6 °   t o   20 °
9Liquid Water Content ( L W C )   0.16   g / m 3   t o   1.925   g / m 3
Table 4. Droplet break-up categories [41].
Weber NumberBreak-Up TypeComments
  W e < 13 Vibrational break-upConditions induce droplet splitting and longer break-up time, which are neglected in FENSAP-ICE.
  13 < W e < 50 Bag break-upDroplet deforms into a disk, forms a bag, and disintegrates into fragments.
  50 < W e < 100 Bag and stamen break-upSimilar to the bag mechanism, residual droplets are at the ring center.
  100 < W e < 350 Sheet stripping break-upWater sheds from oblate droplets, and a cloud of small droplets scatters.
  350 < W e -High Weber numbers create surface waves, erode, and break droplets again.
Table 5. Comparison study of the variation in the lift and drag coefficient validation with Oo et al. [24] and Williams et al. [23] for clean cases and ice-accreted cases at  A o A = 0 °   under −20 °C.
Oo et al. [23]—NUMWilliams et al. [22]—EXPCurrent Study
  C L   C D   C L   C D   C L   C D
Clean0.2110.0120.165-0.2090.016
Ice-accreted0.1850.0180.1410.0130.1810.017
Table 6. Selected icing conditions overlaid on the intermittent maximum atmospheric icing envelope from FAR Appendix C to part 25 [48].
Icing Cases Air   Temperature   ( ° C ) Mean Effective Drop
Diameter (μm)
Liquid   Water   Content   ( g / m 3 )
1   10   15   2.126
2   10   30   0.871
3   10   45   0.329
4   20   15   1.635
5   20   30   0.698
6   20   45   0.233
7   30   15   0.941
8   30   30   0.436
9   30   45   0.138
Table 7. Geometric alternations due to accreted ice.
Chordwise Maximum Ice Thickness
( × 1 0 6   m )
Mass Center along Chord Length
x / c c l e a n
Mass Center along Maximum Height
y / h c l e a n
Clean041.3716.52
  30   ° C 2.3941.1516.52
  20   ° C 3.9740.6116.46
  10   ° C 4.2240.5216.36
Disclaimer/Publisher’s Note: The statements, opinions and data contained in all publications are solely those of the individual author(s) and contributor(s) and not of MDPI and/or the editor(s). MDPI and/or the editor(s) disclaim responsibility for any injury to people or property resulting from any ideas, methods, instructions or products referred to in the content.

