1. Introduction
International certification bodies have the requirement to set up certification standards for civil supersonic transport. The DLR project ELTON SST (estimation of landing and take-off noise of supersonic transport) was initiated in Q1 of 2020 to support the European Aviation Safety Agency (EASA) and the German Federal Ministry of Transport and Digital Infrastructure (BMVI) with numerical assessment of noise at low-speeds of a supersonic aircraft prototype. At the AIAA Scitech 2020 Forum, Berton et al. [
1] from NASA Glenn Research Center discussed the environmental and economic issues of a supersonic business jet. A study of noise impact in the airport vicinity was presented which was intended to support the International Civil Aviation Organization (ICAO) on the subject of regulations for future supersonic transport. At the same time, Akatsuka and Ishii [
2] from JAXA investigated the take-off and landing noise for the Supersonic Technology Concept Aeroplane (STCA), the configuration of NASA. The impact of advanced noise abatement procedures was analysed, showing a slight benefit of a so-called “programmed-thrust lapse rate” (PLR) during a high-speed climbout. Based on these findings, the fan noise shielding of the DLR-designed prototype is computed for some identified flight points of interest with and without the application of PLR.
In the first phase of the landing and take-off (LTO) noise estimation study within ELTON SST, Nöding et al. [
3] applied a low- to mid-fidelity simulation workflow to assess the aircraft design and flight procedures. The authors acknowledge the importance of fan noise shielding and conclude that noise reduction could be achieved by using the advanced departure procedure, particularly for an over-wing engine installation case. However, it was stressed that the simulation core process, which was based on semi-empirical methods, was not validated against experimental data for such SST vehicles. This is one major shortcoming of both empirical and semi-empirical methods when it comes to highly integrated engine designs and unusual aircraft planforms. In spite of the fact that such methods give a good indication of an optimal flight trajectory for well-explored subsonic aircraft configurations, they will struggle to accurately predict noise radiation and sound pressure levels for problems with a high degree of shielding and strong acoustic wave diffraction. The reason for this is twofold: (1) oversimplified sources do not produce the true acoustic field. This specifically applies to acoustic sources originating in a high-Mach-number subsonic flow, and also, for highly integrated engines with a complicated forward and backward fan noise directivity. (2) Noise directivity can be heavily influenced by an inlet design and airframe, so much so that it becomes challenging to derive a representative “far-field” signature (e.g., for input to the fly-over PANAM code [
4]) without the proper “near-field”. In that case, the most physics-based approach is to accurately resolve the wave propagation around the aircraft, considering all reflection and refraction effects. Therefore, the high-fidelity tools of DLR were applied in the second phase of the ELTON SST project. The procedure is briefly described as follows.
Firstly, realistic fan sources are simulated with the analytical fan noise prediction tool PropNoise [
5] at the DLR’s Institute of Propulsion Technology and provided to the Institute of Aerodynamics and Flow Technology. Secondly, the sources are interpolated to the fan plane for the installed engine configuration and serve as the driver for the acoustic perturbation equations (APE) [
6] by being inserted into the right-hand side of the system. The acoustic waves are propagated out of the engine intake on top of a steady but highly non-uniform Reynolds-averaged Navier–Stokes (RANS) solution using the discontinuous Galerkin DISCO++ code of DLR [
7]. Then, the acoustic information is exchanged with the fast multipole boundary element method (FM-BEM) via a surface interface. The FM-BEM is implemented in the DLR’s FMCAS code [
8], which computes the acoustic response on the entire aircraft’s surface and provides feedback to the interface which is then used for correcting the initial DG solution (see Proskurov et al. [
9] for more details on the strongly coupled DG/FM-BEM method).
For some selected flight points, the velocity at the inlet approached Mach 1. If the effect is local, the acoustic propagation still takes place and the former DG step is essential in order to accurately predict the fan noise emitted by the engine. Such local acceleration should not be confused with the velocity in front of the fan which is maintained in the Mach number range of 0.6–0.75 at all times for optimal efficiency. The application of FM-BEM in the latter step adds a performance benefit when considering the actual scale and fully detailed aircraft geometry. To conclude the second phase of the ELTON SST project on installed fan noise simulations of a supersonic business aircraft, the resulting noise footprints are presented and discussed.
2. Geometry and Flow Simulations
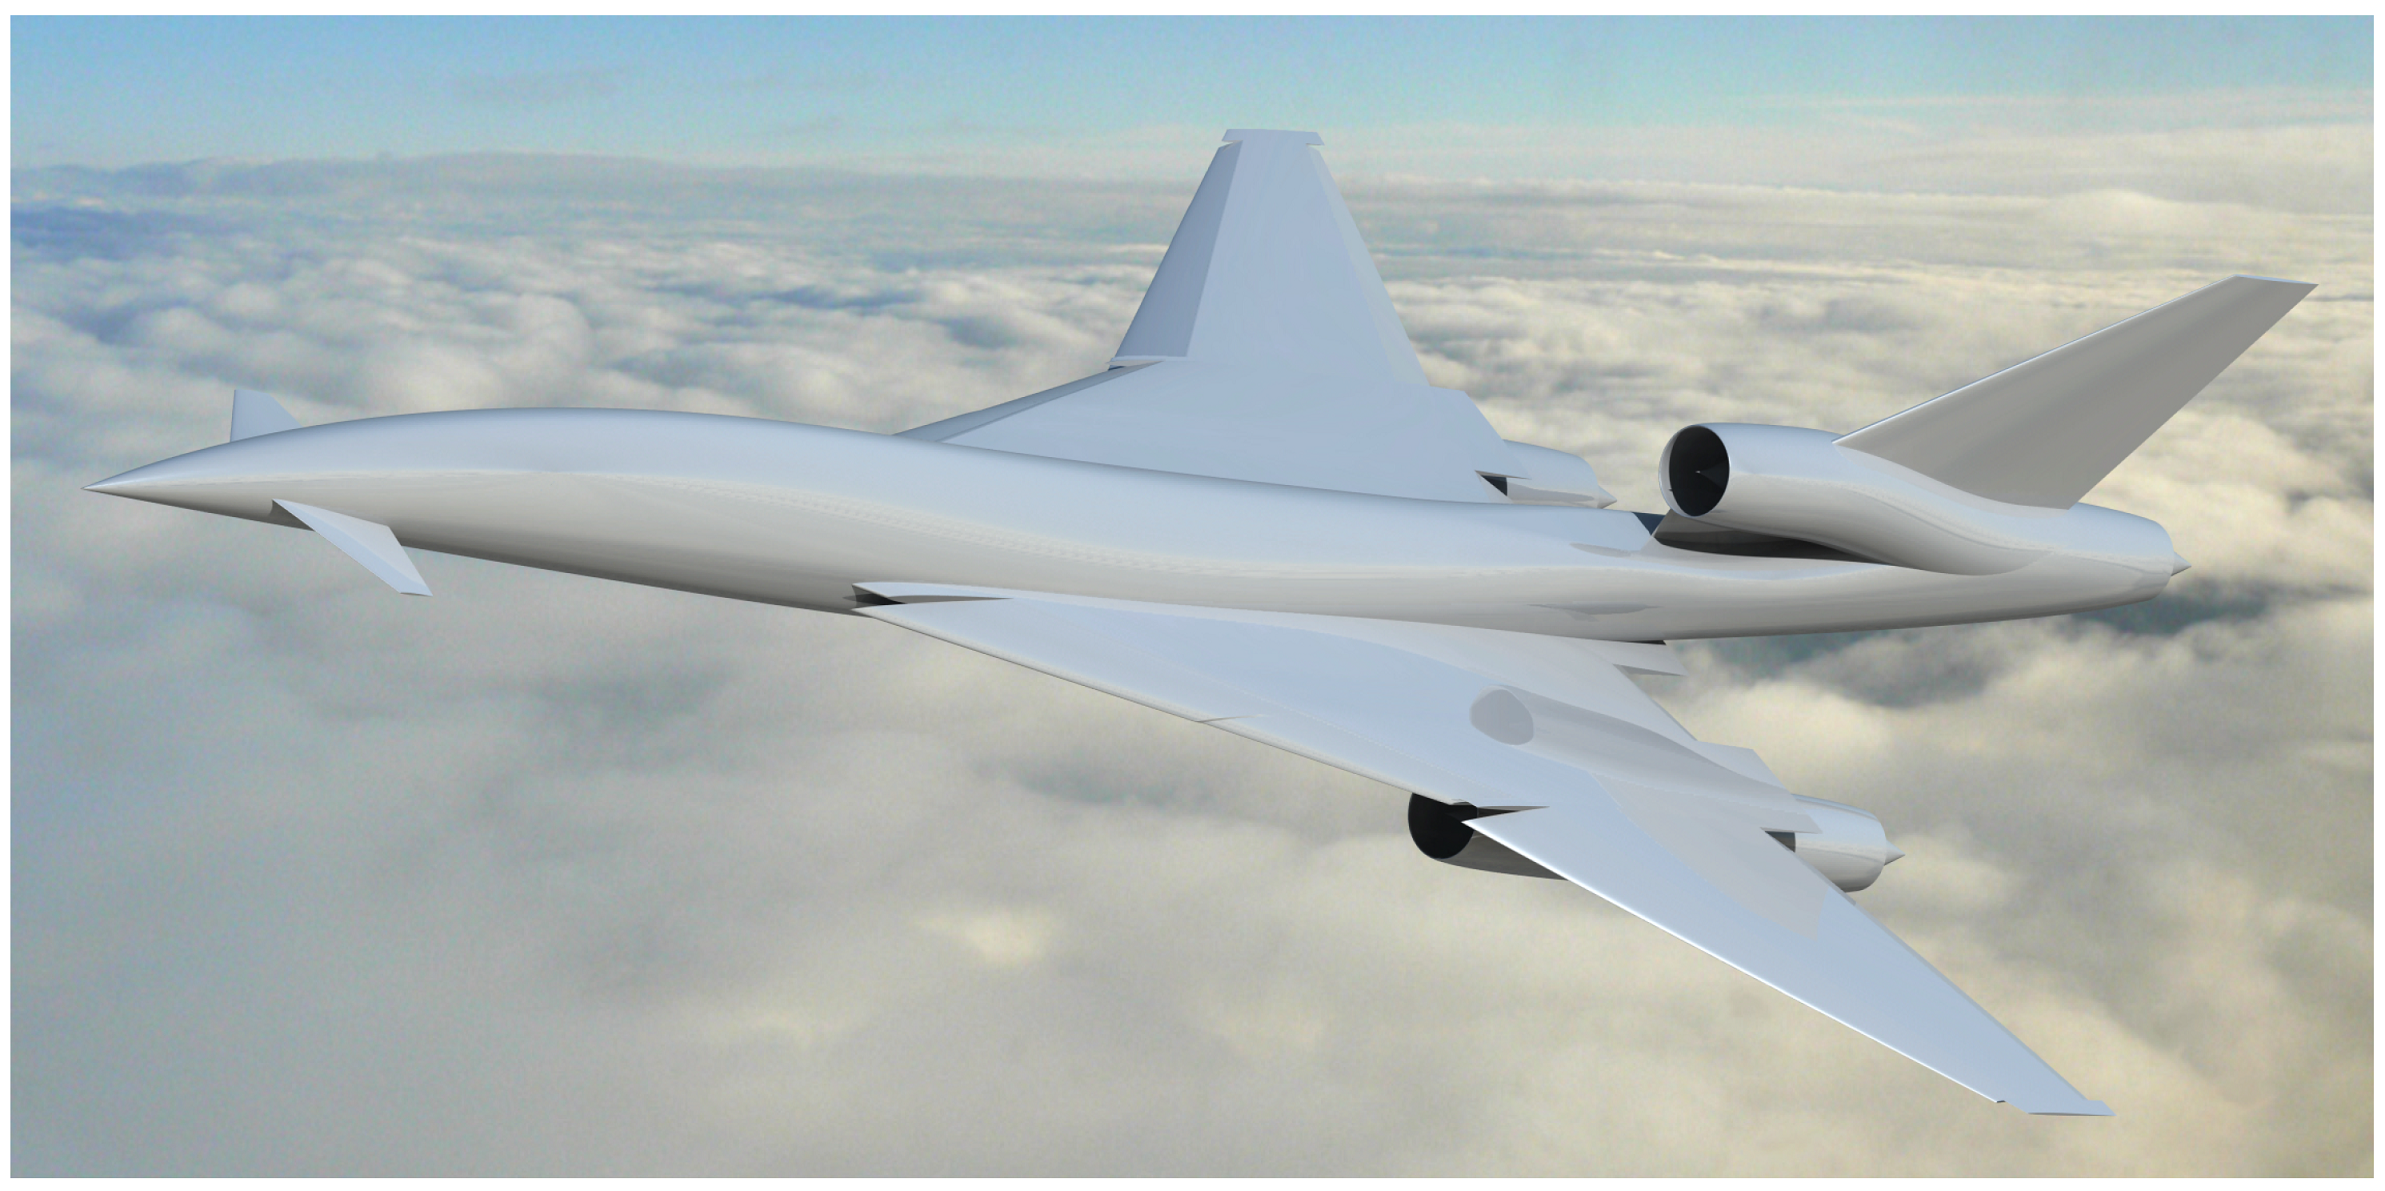
A medium-sized supersonic business aircraft which features three engines and is capable of transporting up to 10 passengers has been designed for Mach 1.4 cruise. The airframe corresponds to configuration THREE published by Nöding et al. [
10]. The rendered image in
Figure 1 represents a high-lift setup with 20
slat and 35
flap deployment angles, which is a meaningful setup where take-off and landing noise is concerned. The high-pressure compressor and turbines were based on components of an existing CFM56-7B engine, whereas the fan and low-pressure turbine were new designs. At the very beginning of the project, the DLR engine model was designed with DLR’s engine simulation and pre-design tool GTlab to match the thrust of the NASA STCA engine for the three published design points. In order to limit the number of design variables, an axisymmetric engine intake and nozzle geometry were selected. The DLR’s parametric optimisation model was extended to feature a variable geometry plug nozzle and a variable geometry inlet spike.
Overall, the parametric CAD model of the engine had more than 30 design parameters.
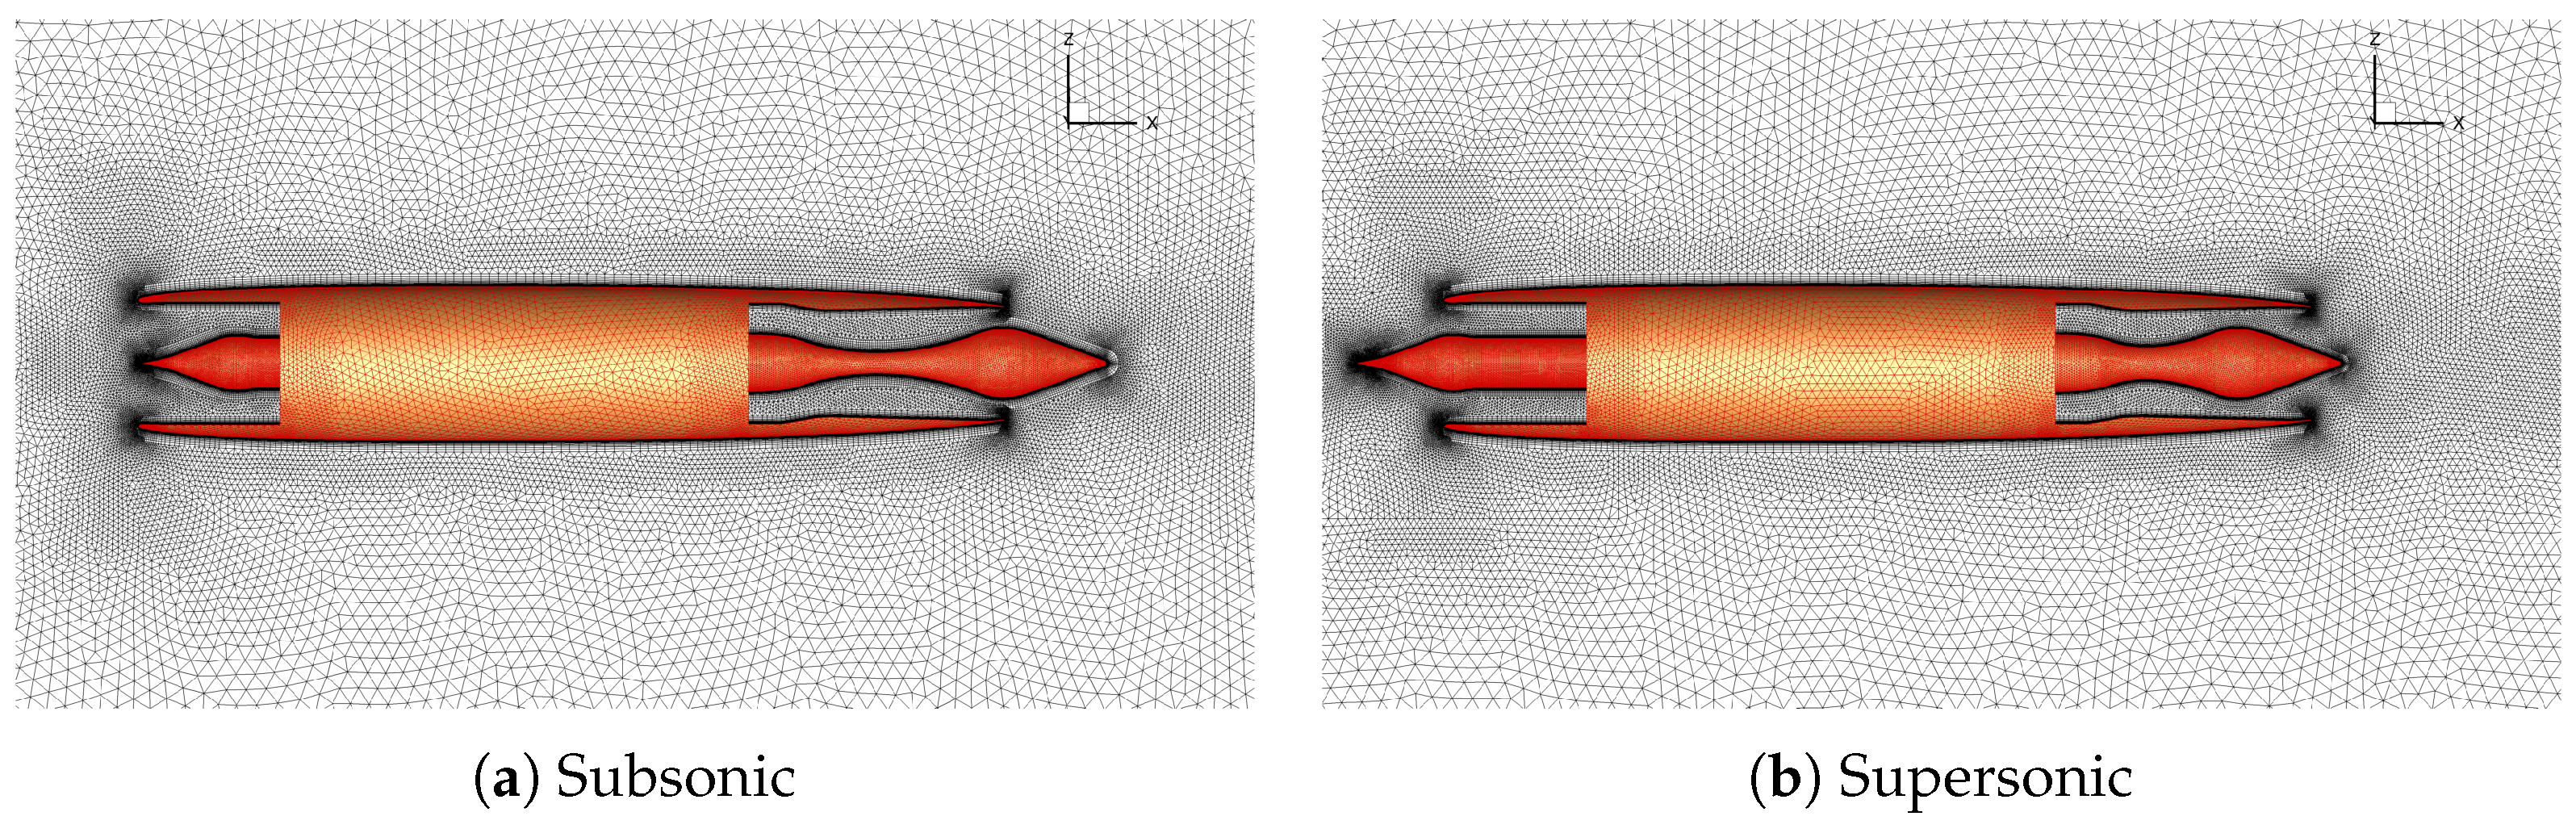
Figure 2 shows the fully unstructured hybrid grids for the isolated engine that were generated with the commercial software CENTAUR. A prismatic layer was used close to the surface for an improved near-wall quality in the RANS simulations. The jet plume region was further refined to enhance the resolution of the jet shear layers in order to meet the CAA requirements. The CFD simulations were performed with the TAU code [
11] which is based on an unstructured finite volume approach for solving the RANS equations on hybrid grids. The central scheme introduced by Jameson was applied for the spatial discretisation of the convective fluxes. An implicit lower/upper symmetric Gauss–Seidel scheme was used to advance the solution. The convergence was accelerated by applying a 3w multigrid cycle. The resulting RANS simulations are viscous, compressible, and use the “fully turbulent” assumption, computed with the Spalart–Allmaras one-equation turbulence model. For the robust startup of all simulations, the pressure at the fan inlet face was prescribed and iterated during the simulation until the mass flow rate at the fan inlet matched the mass flow rate at the engine outlet, for the given total pressure and temperature.
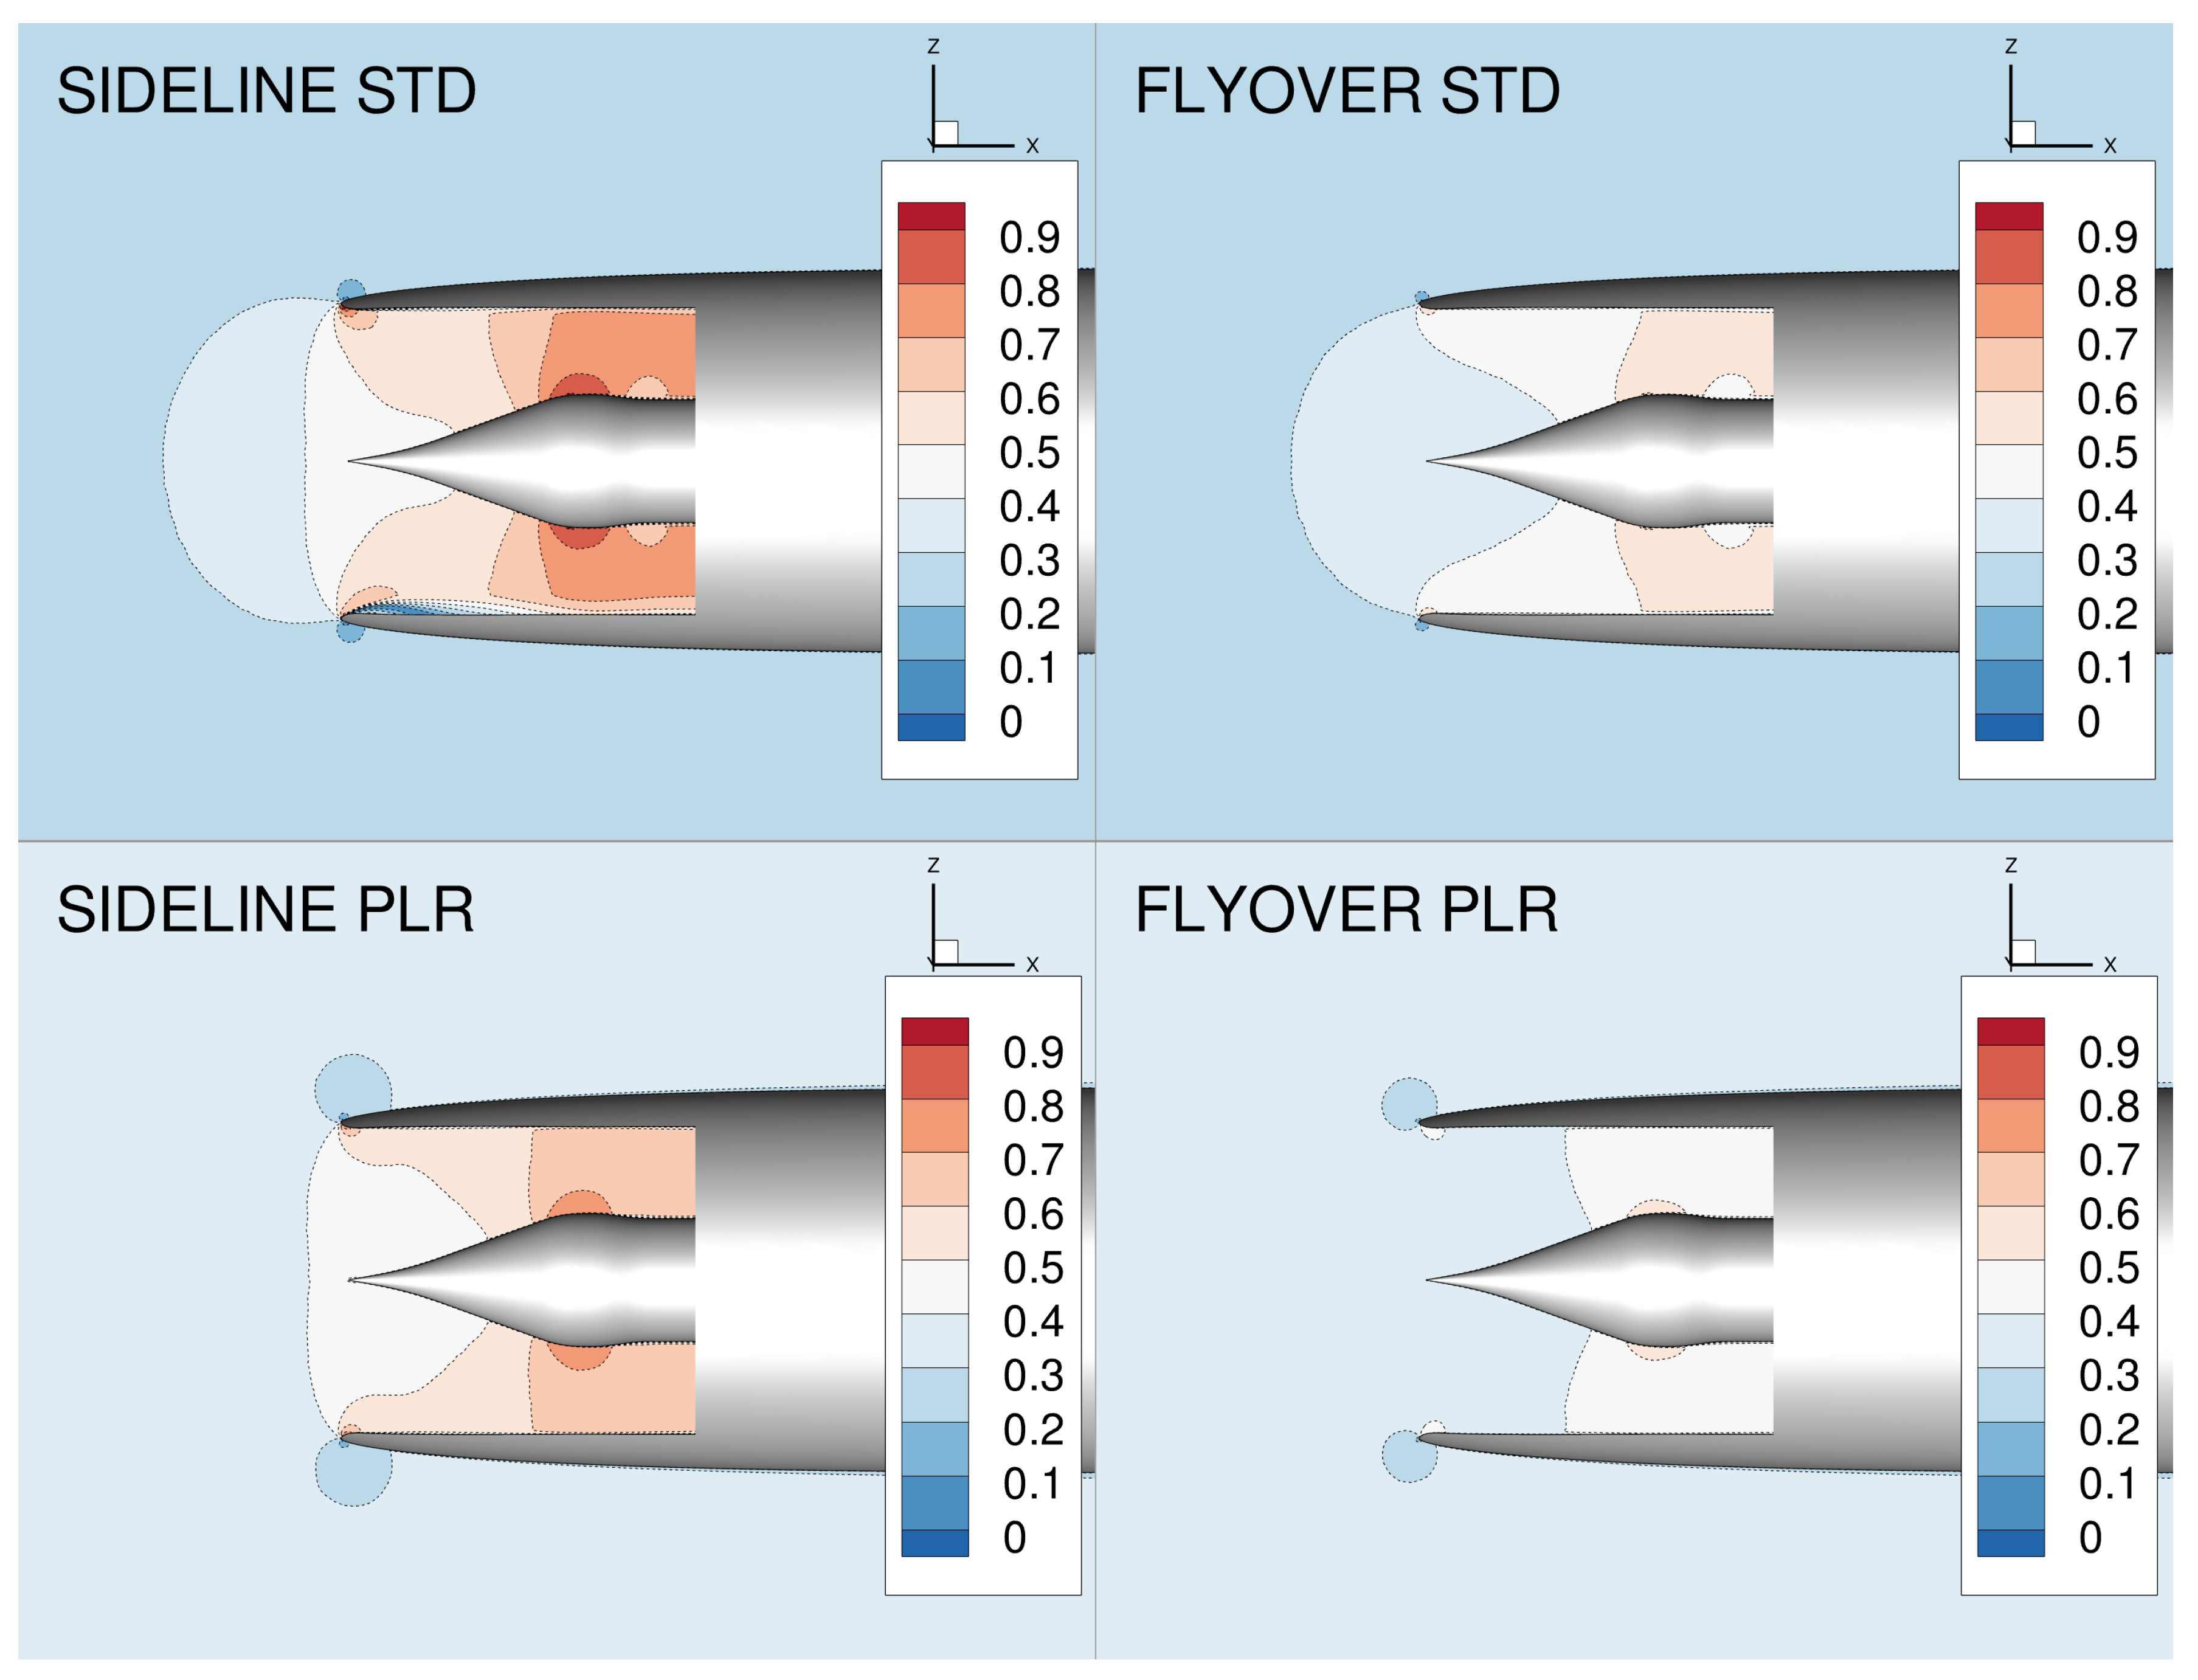
Figure 3 shows the Mach number contours for two design conditions which correspond to “sideline” and “flyover” test points. For the LTO noise investigation, only the subsonic configuration is relevant, which was then used in the CFD/CAA simulations for simulating standard and PLR flight paths. The flow separation visible at the lip for the standard sideline contour was only present locally in the vertical
x–z plane. On the opposite side, the Mach number at the lip reached the value of 1.0. This testing point had the highest velocity at the fan and the thickest boundary layer out of all four. However, the Mach number at the fan was always within the optimal operating range: 0.71 for (sideline) SL-STD, 0.64 for SL-PLR and 0.50 for (flyover) FO-STD, 0.45 for FO-PLR. It can be seen that the flow is more uniform for both PLR flight points with lower secondary deceleration at the inlet spike (upstream of the fan).
3. Volume-Resolving CAA
The contours in
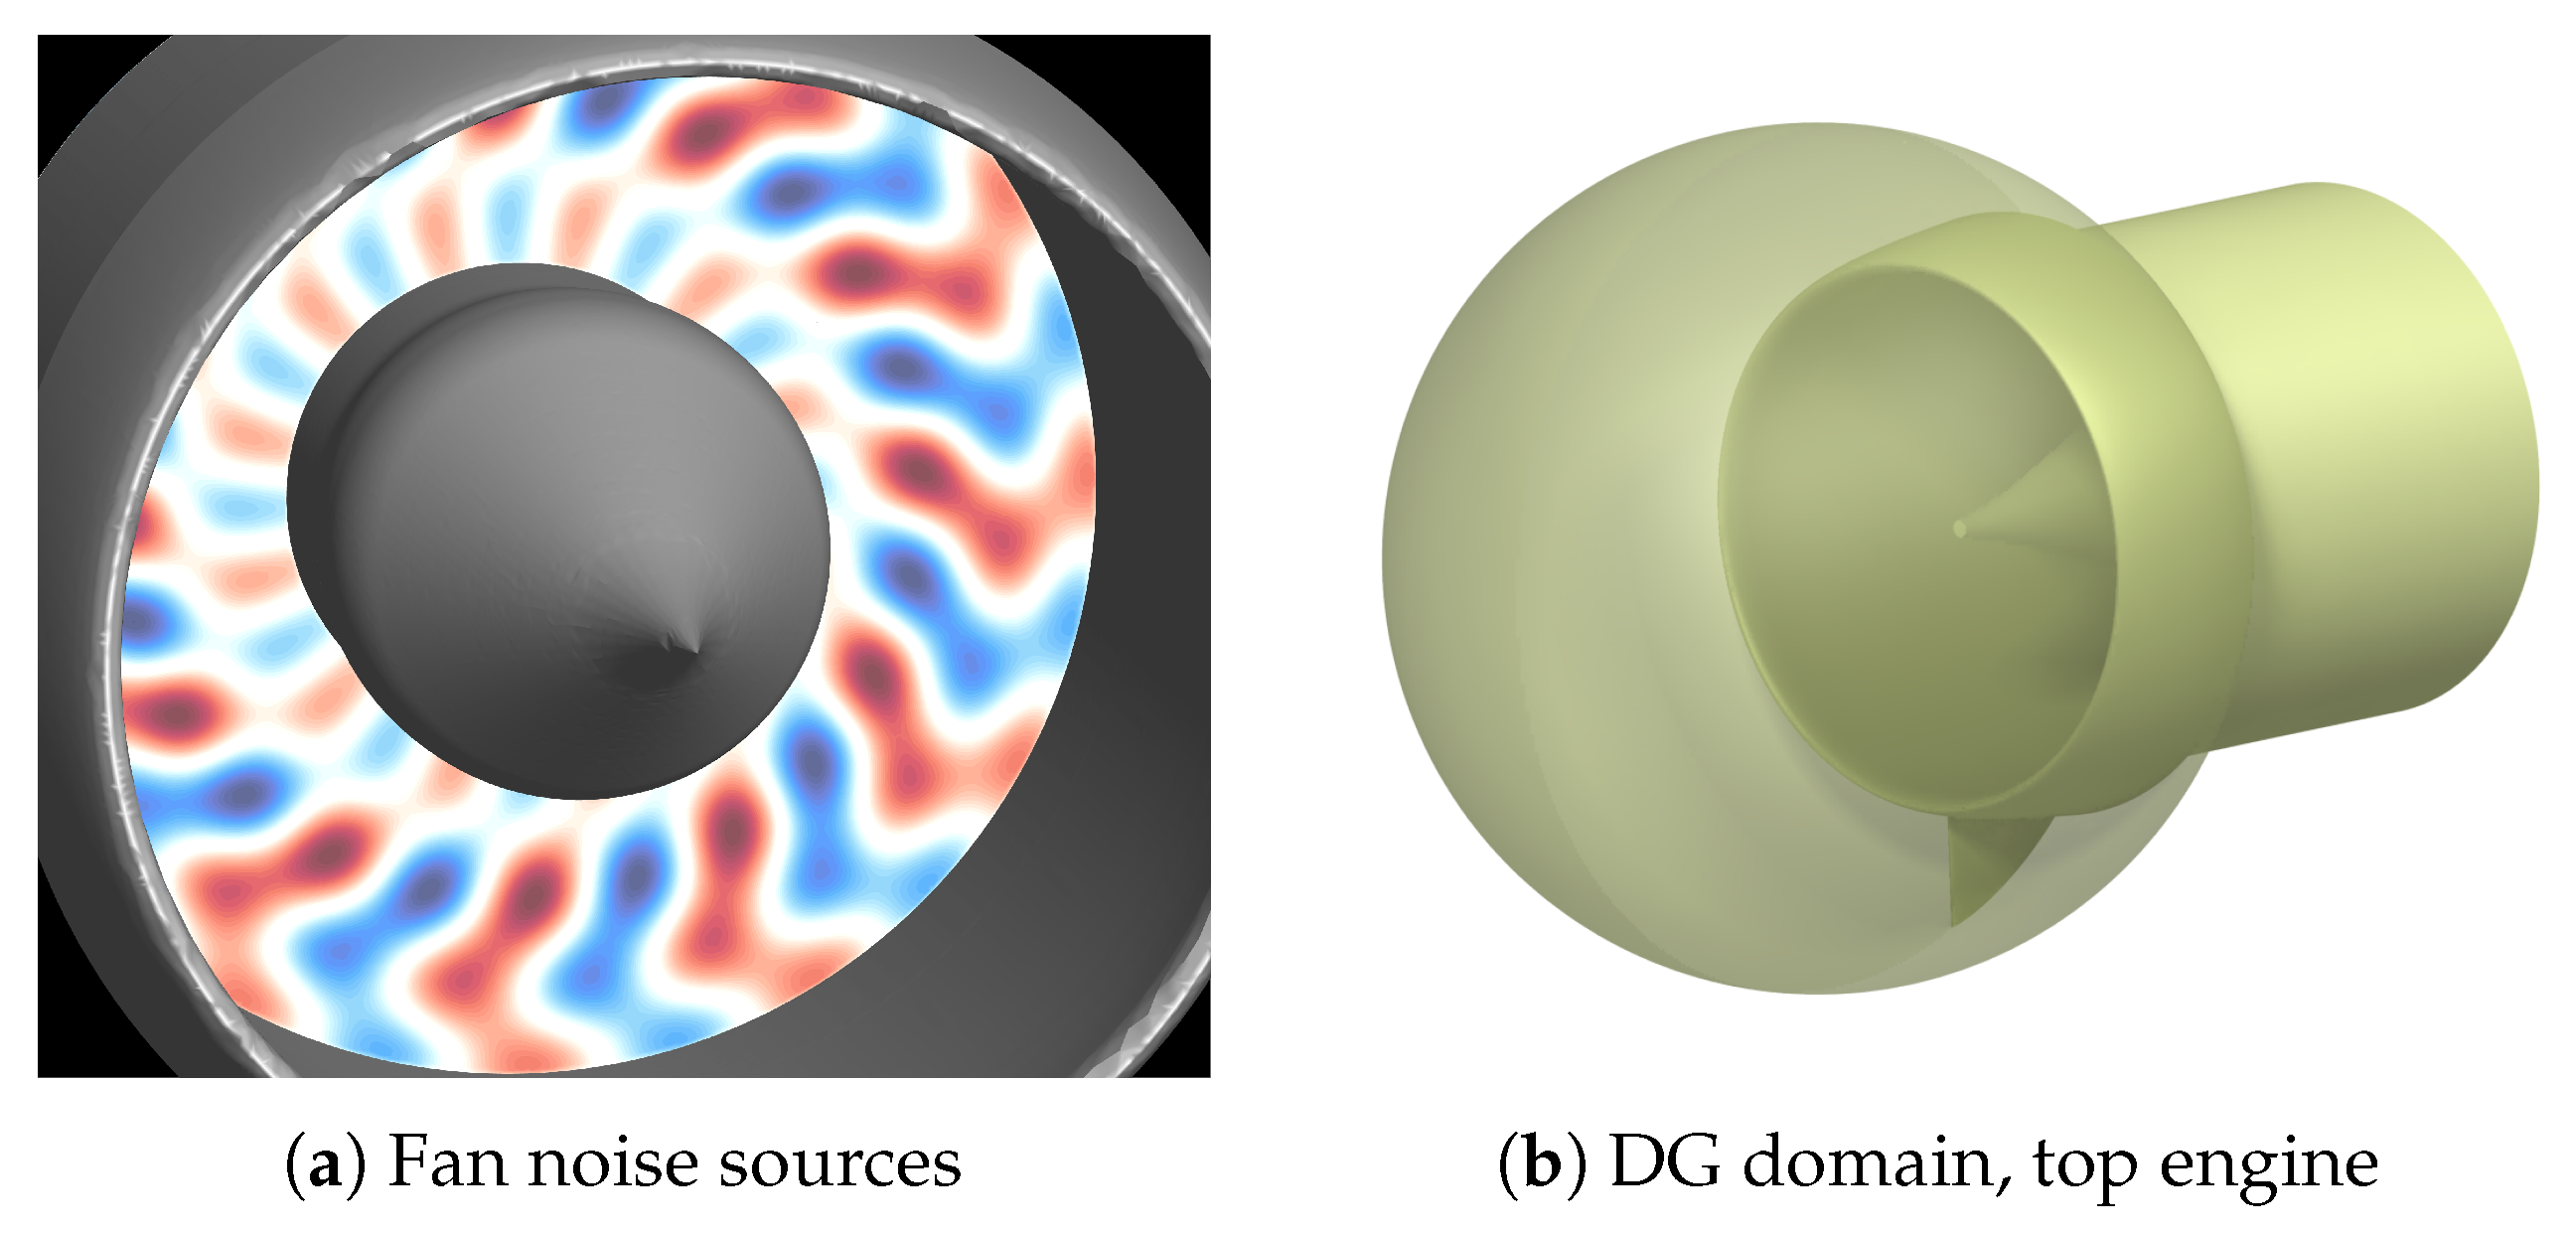
Figure 3 show that the external flow is uniform for all four flight conditions, and hence, a constant flow correction can be applied to the acoustic data in the far-field. However, a surface integral approach cannot be applied directly to sources at the fan plane since this will result in large errors. Here, a volume-resolving method which is capable of propagating realistic fan modes in a high Mach number environment, that can account for acoustic effects caused by the boundary layer and complicated curvature of the inlet, is required. However, volume-resolving methods are of high computational complexity and generally unaffordable when it comes to installed configurations. In this case, one major reduction in computational effort when computing acoustics for the SST aircraft will be achieved by applying the volume-resolving DG method only locally, that is, everywhere inside the engine and in the vicinity of the inlet where the Mach number is higher than ≈0.3. Then, outside of the inlet, in the region of nearly potential flow, the FM-BEM method based on surface integrals will take over from a coupling interface and the acoustic response will be computed for a complete airframe.
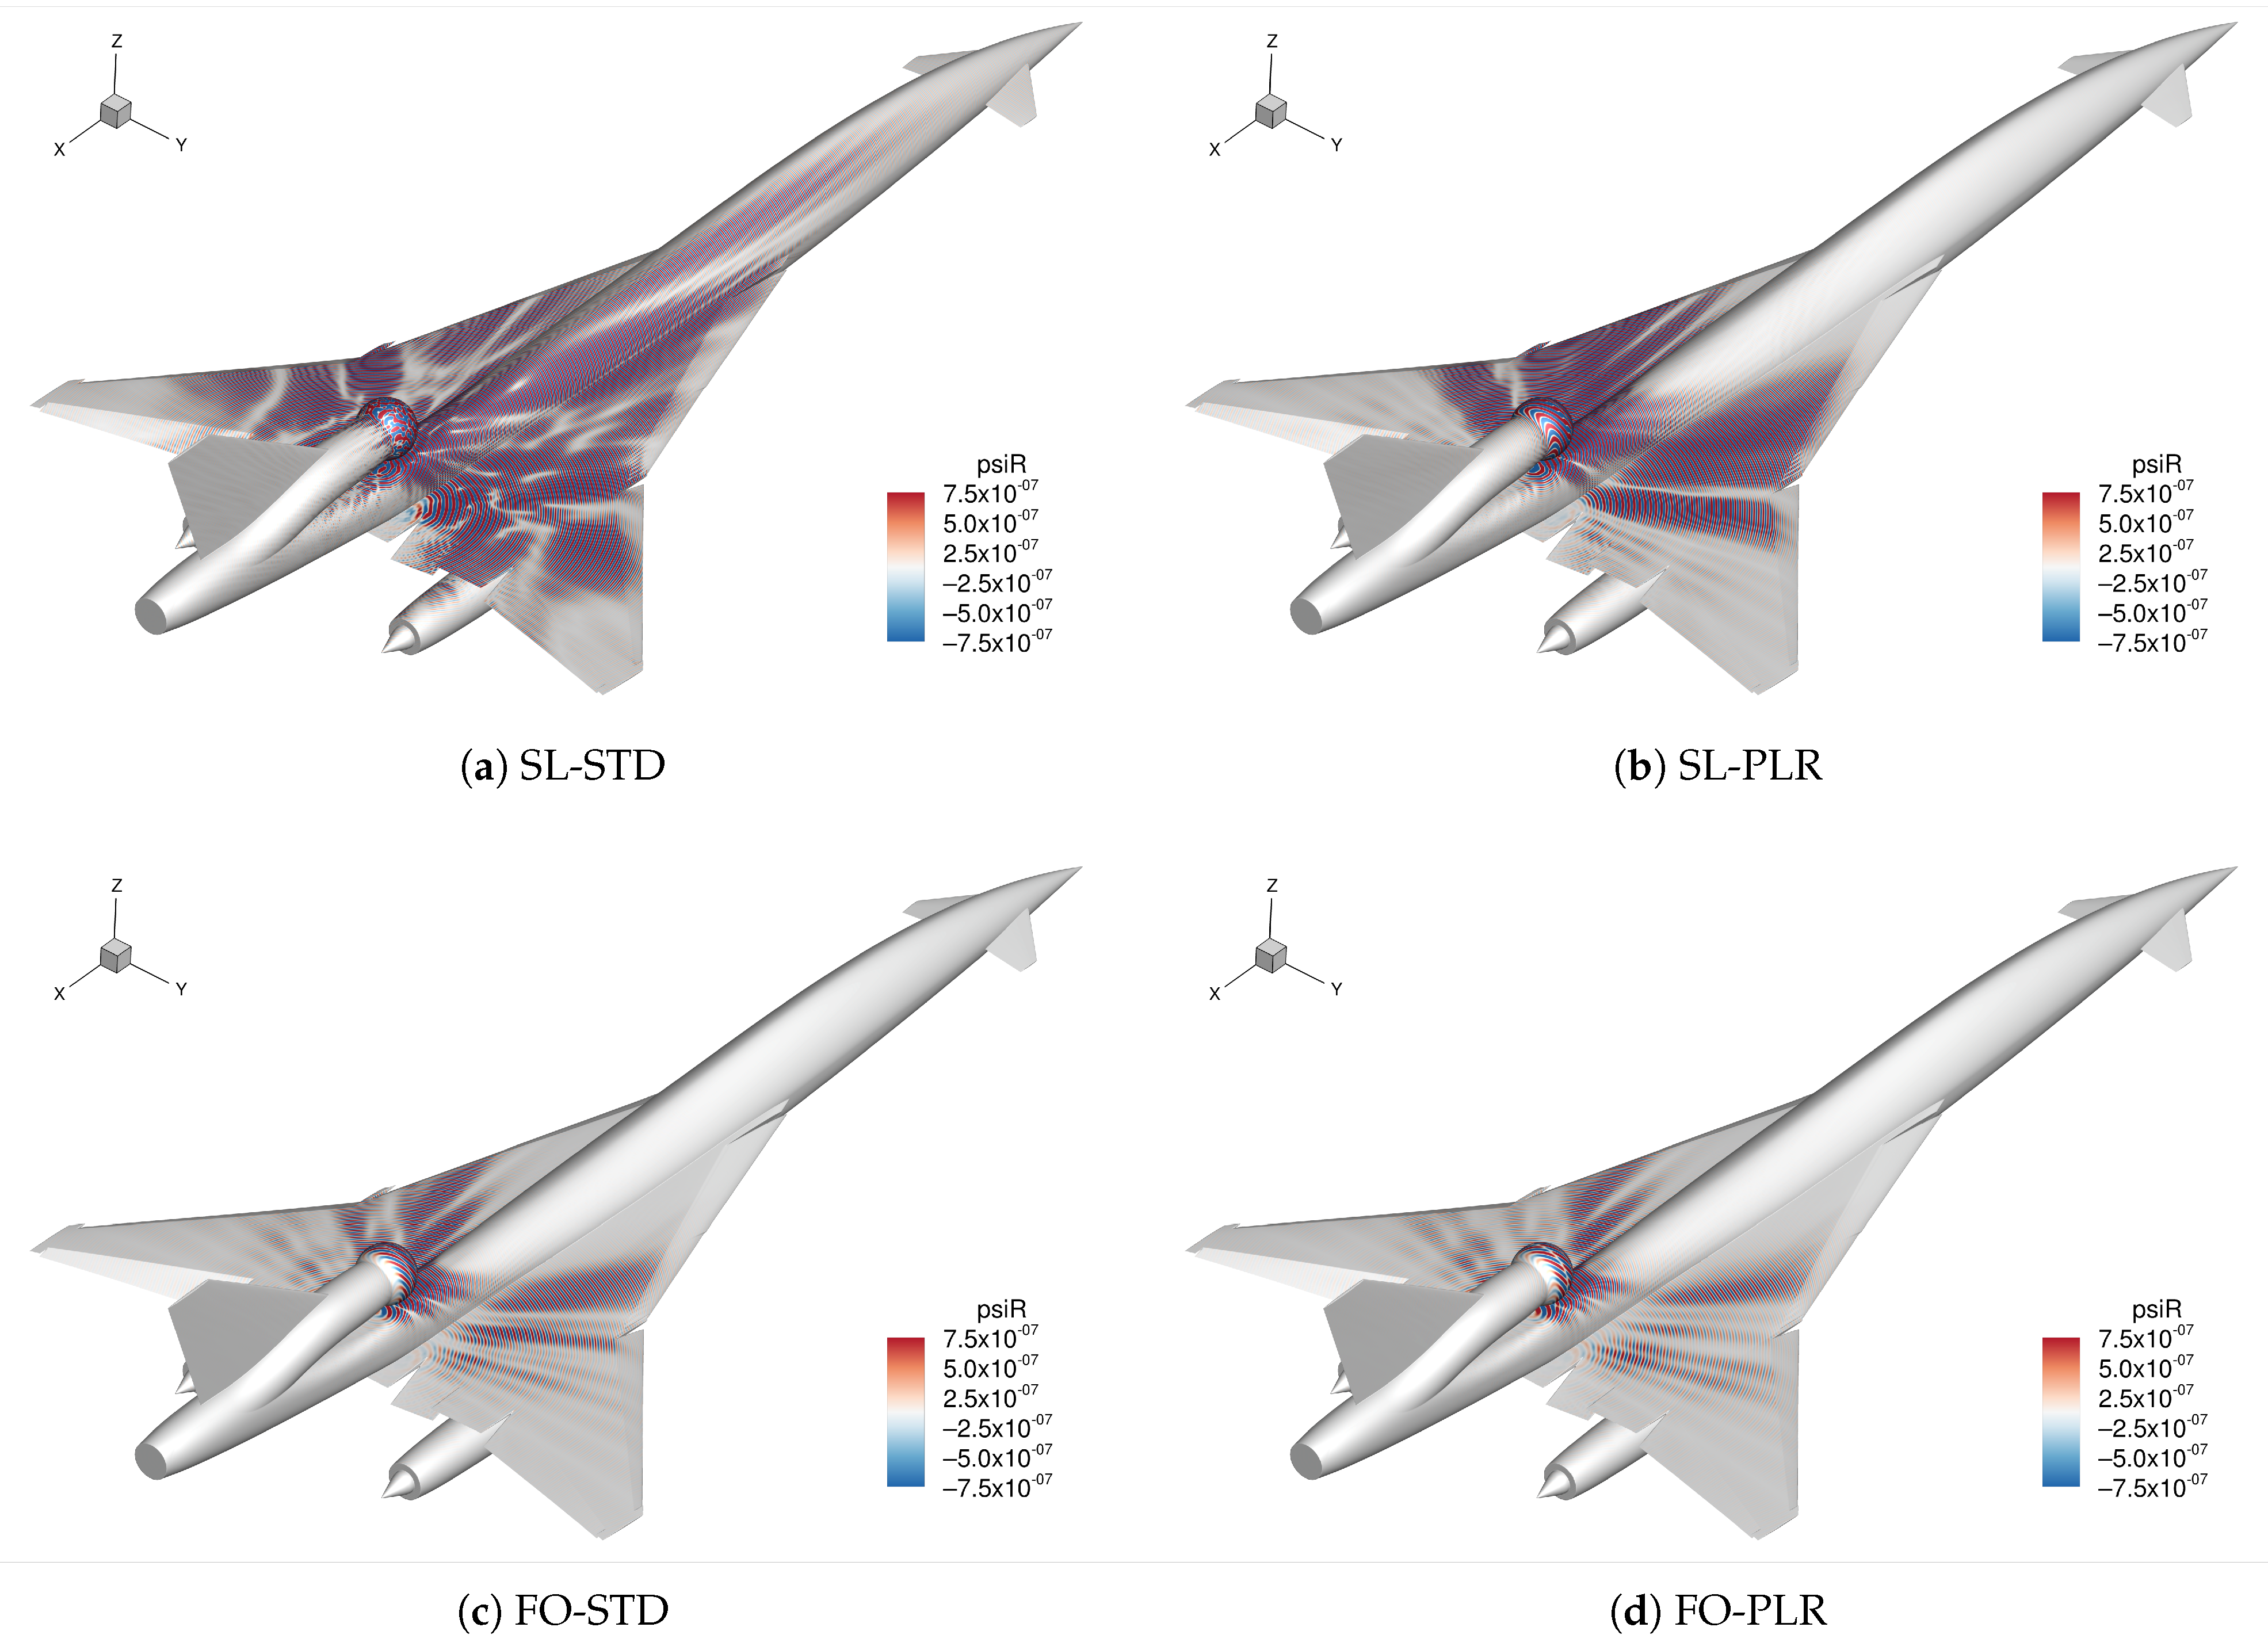
Figure 4 shows one of the forward-radiating noise source inputs prescribed at the fan plane. The permeable sphere is a characteristics boundary condition in DG and when coupled with the rest of the geometry will provide outgoing acoustics variables and later be updated with incoming characteristics derived from the FM-BEM.
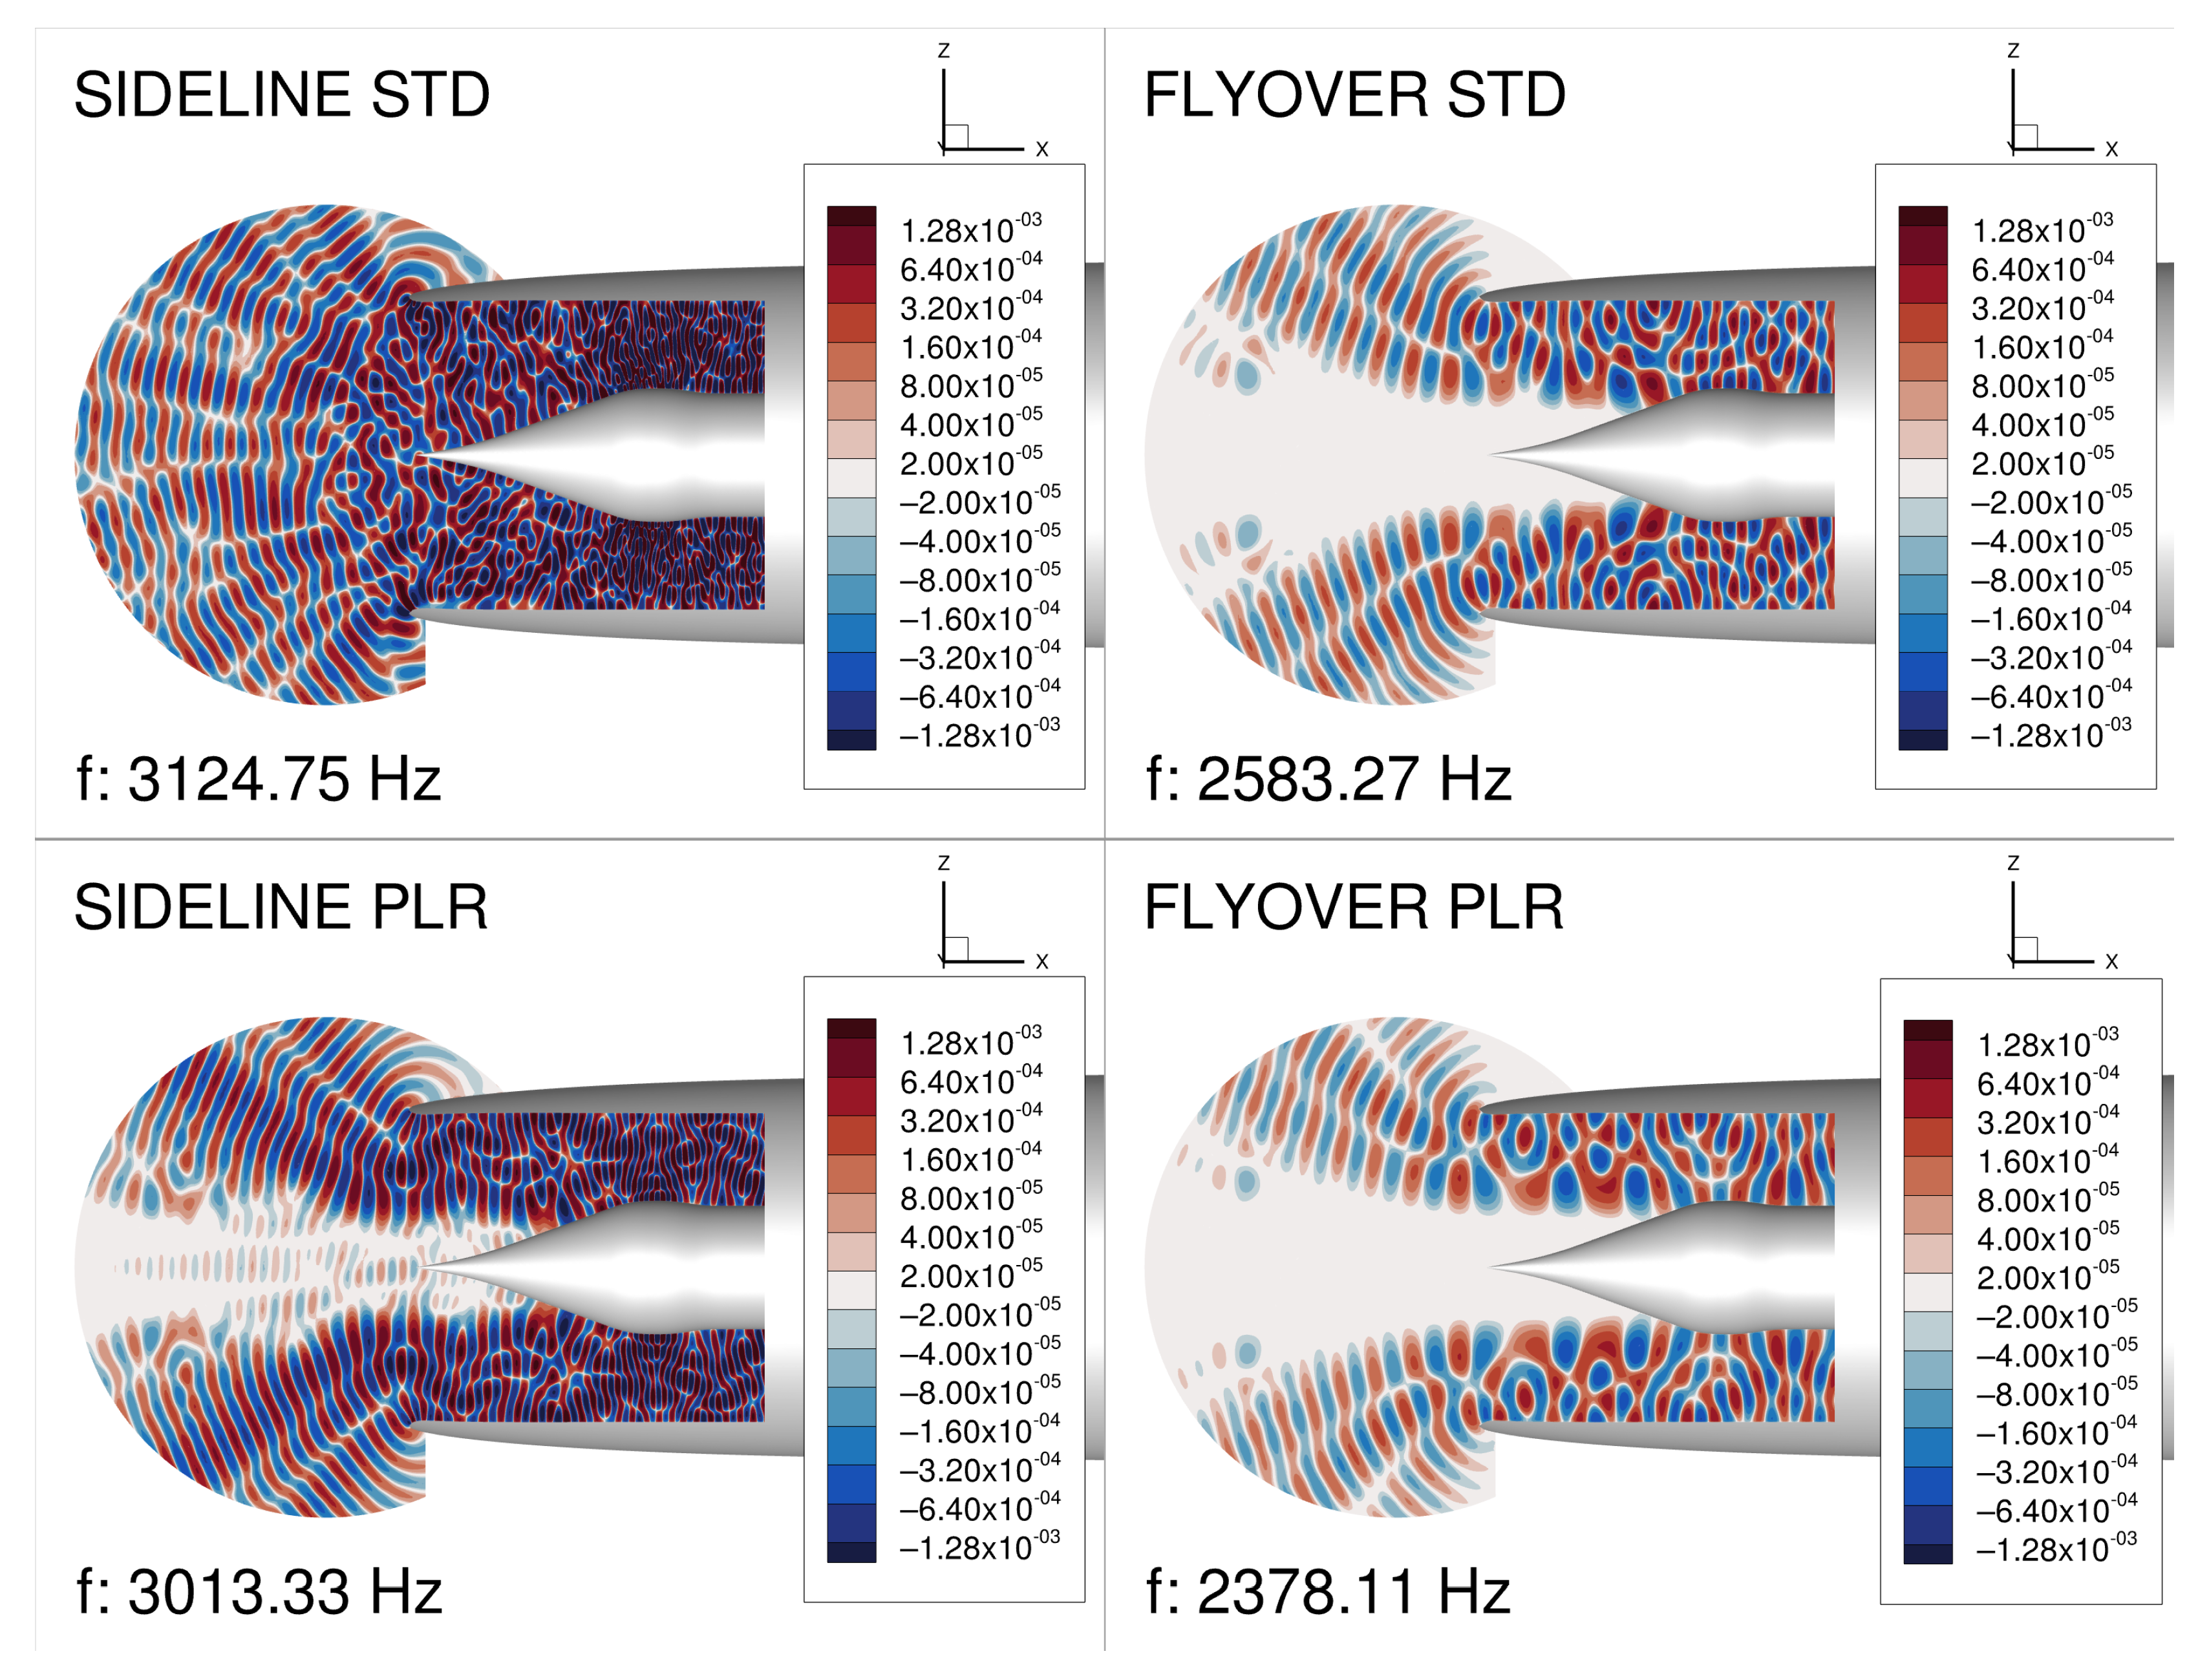
Figure 5 shows the converged frequency domain solutions for all four design testing points for the given operating conditions. The real part of dimensionless pressure is displayed on the exponential scale for the vertical (
x–z) contour slice. The mesh resolution could support ≈factor 4 in acoustic wave compression for the highest frequency used to properly account for the flow.
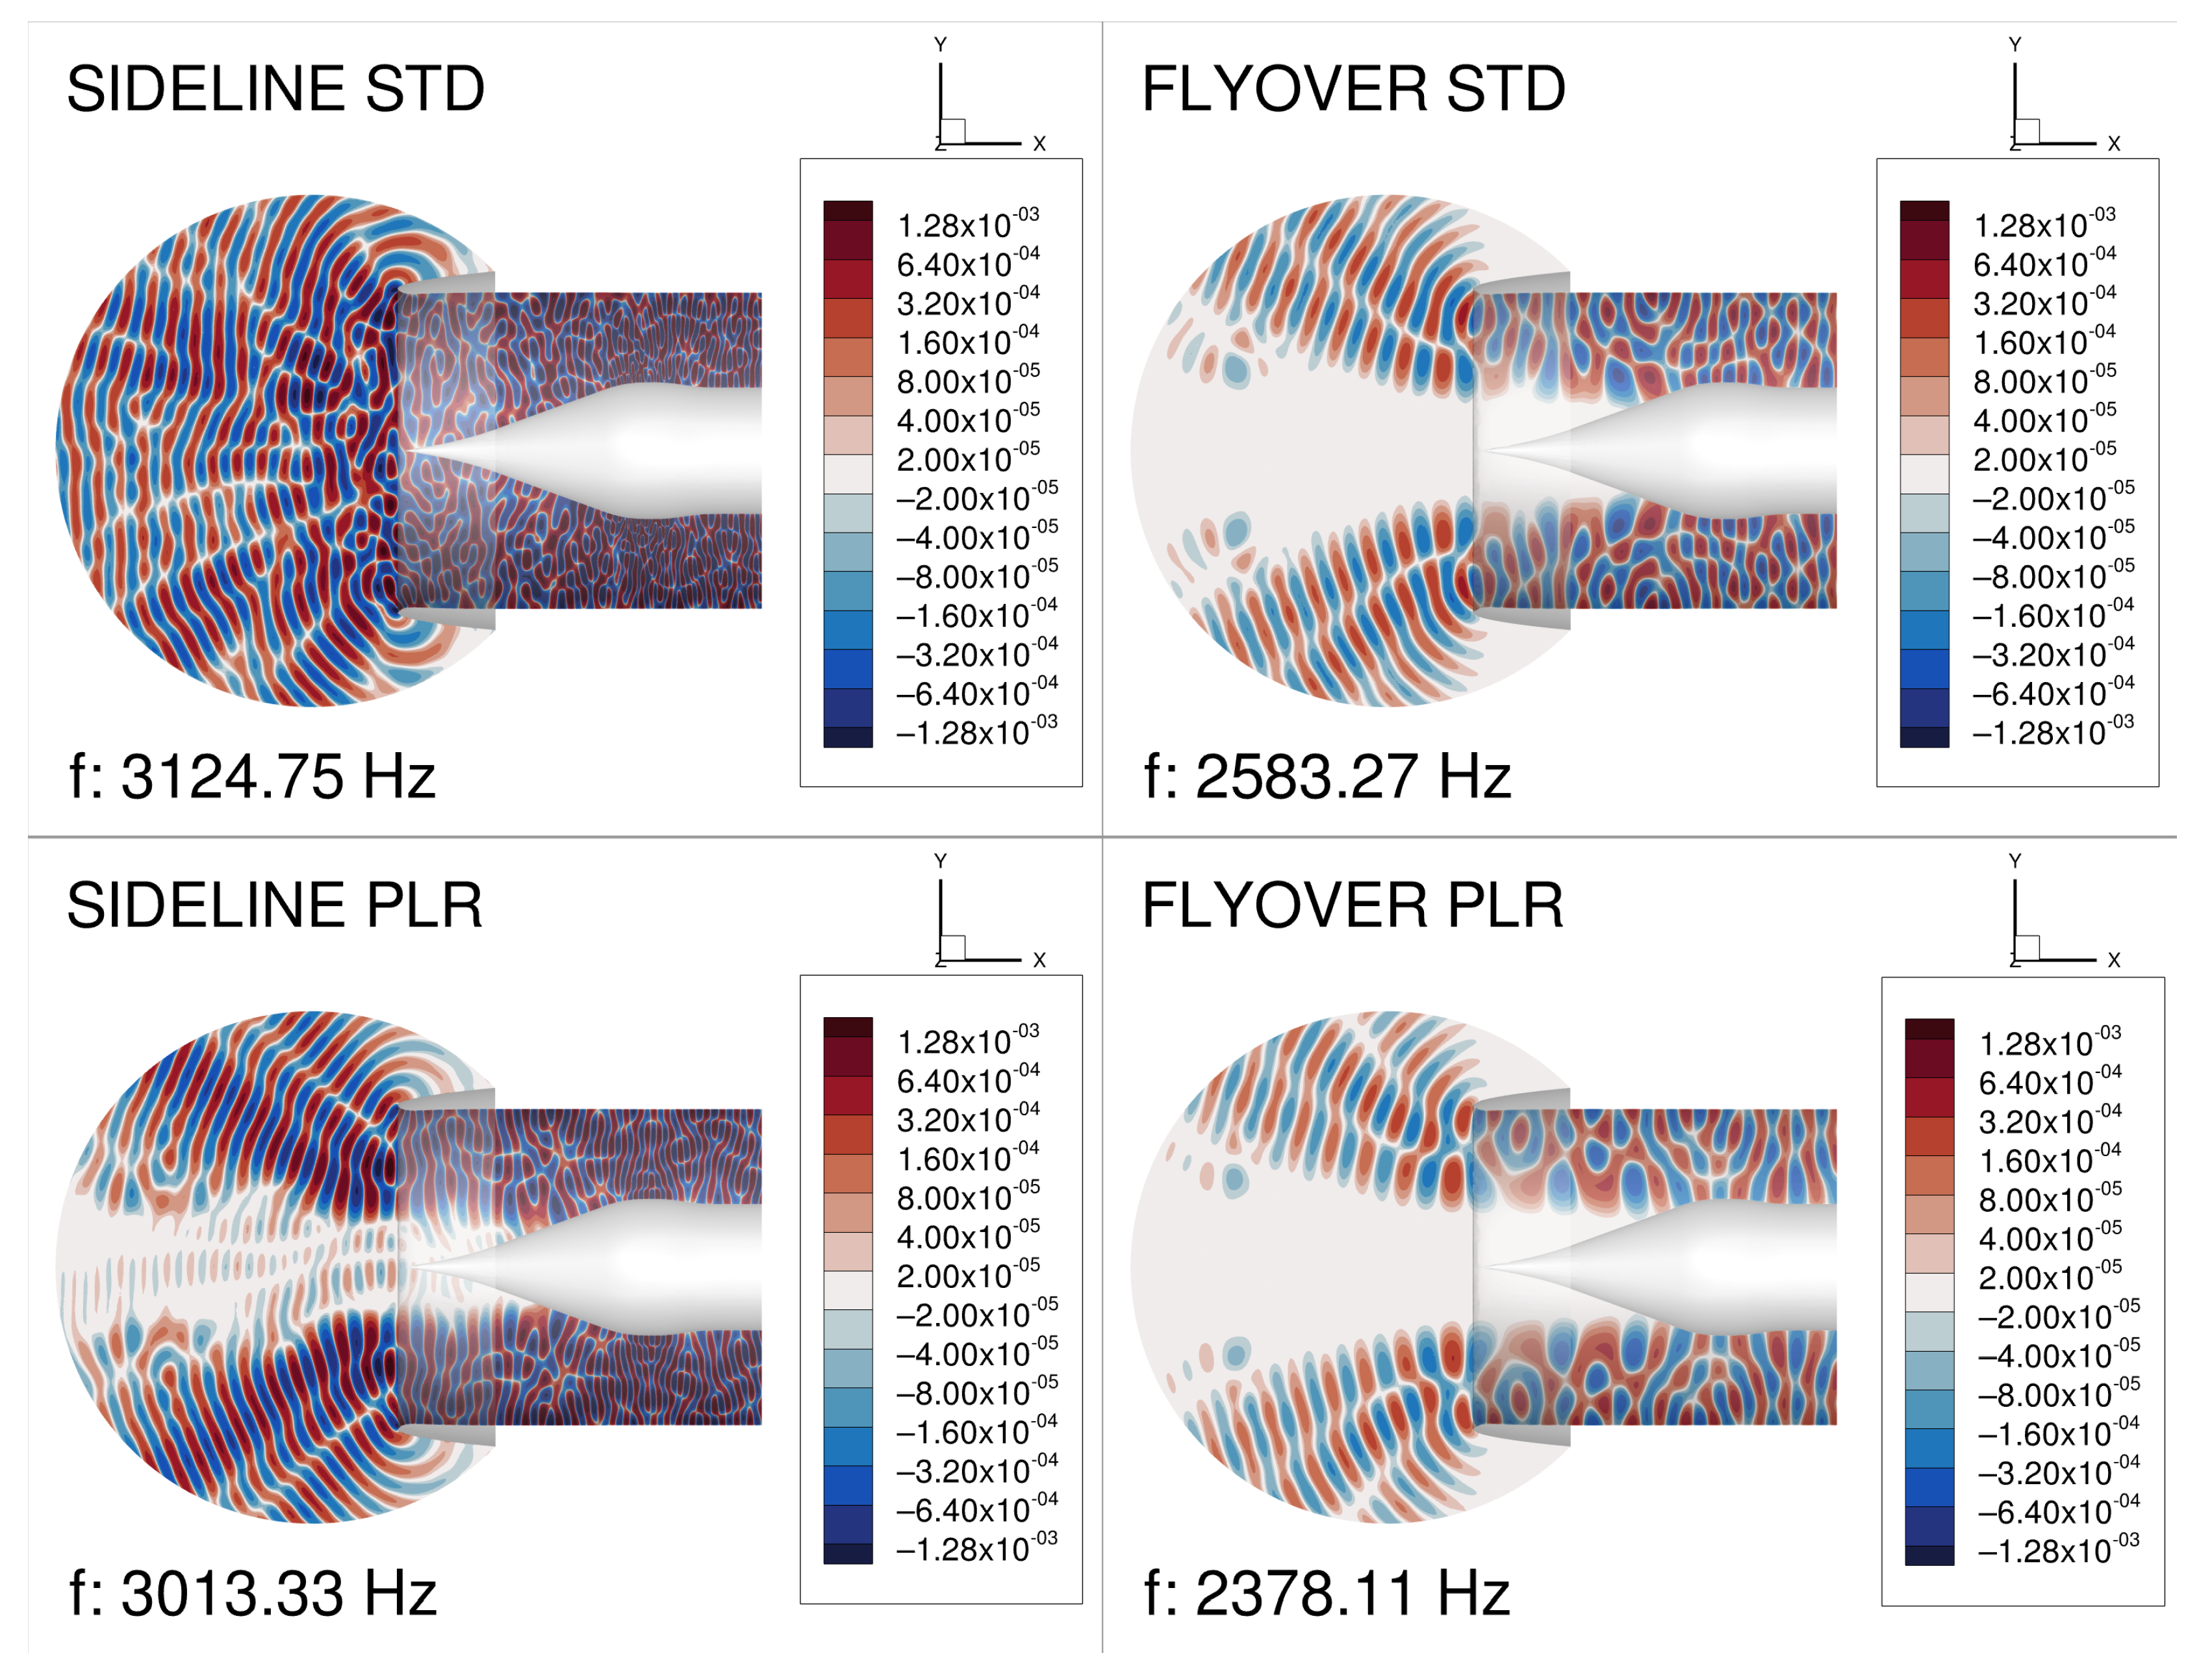
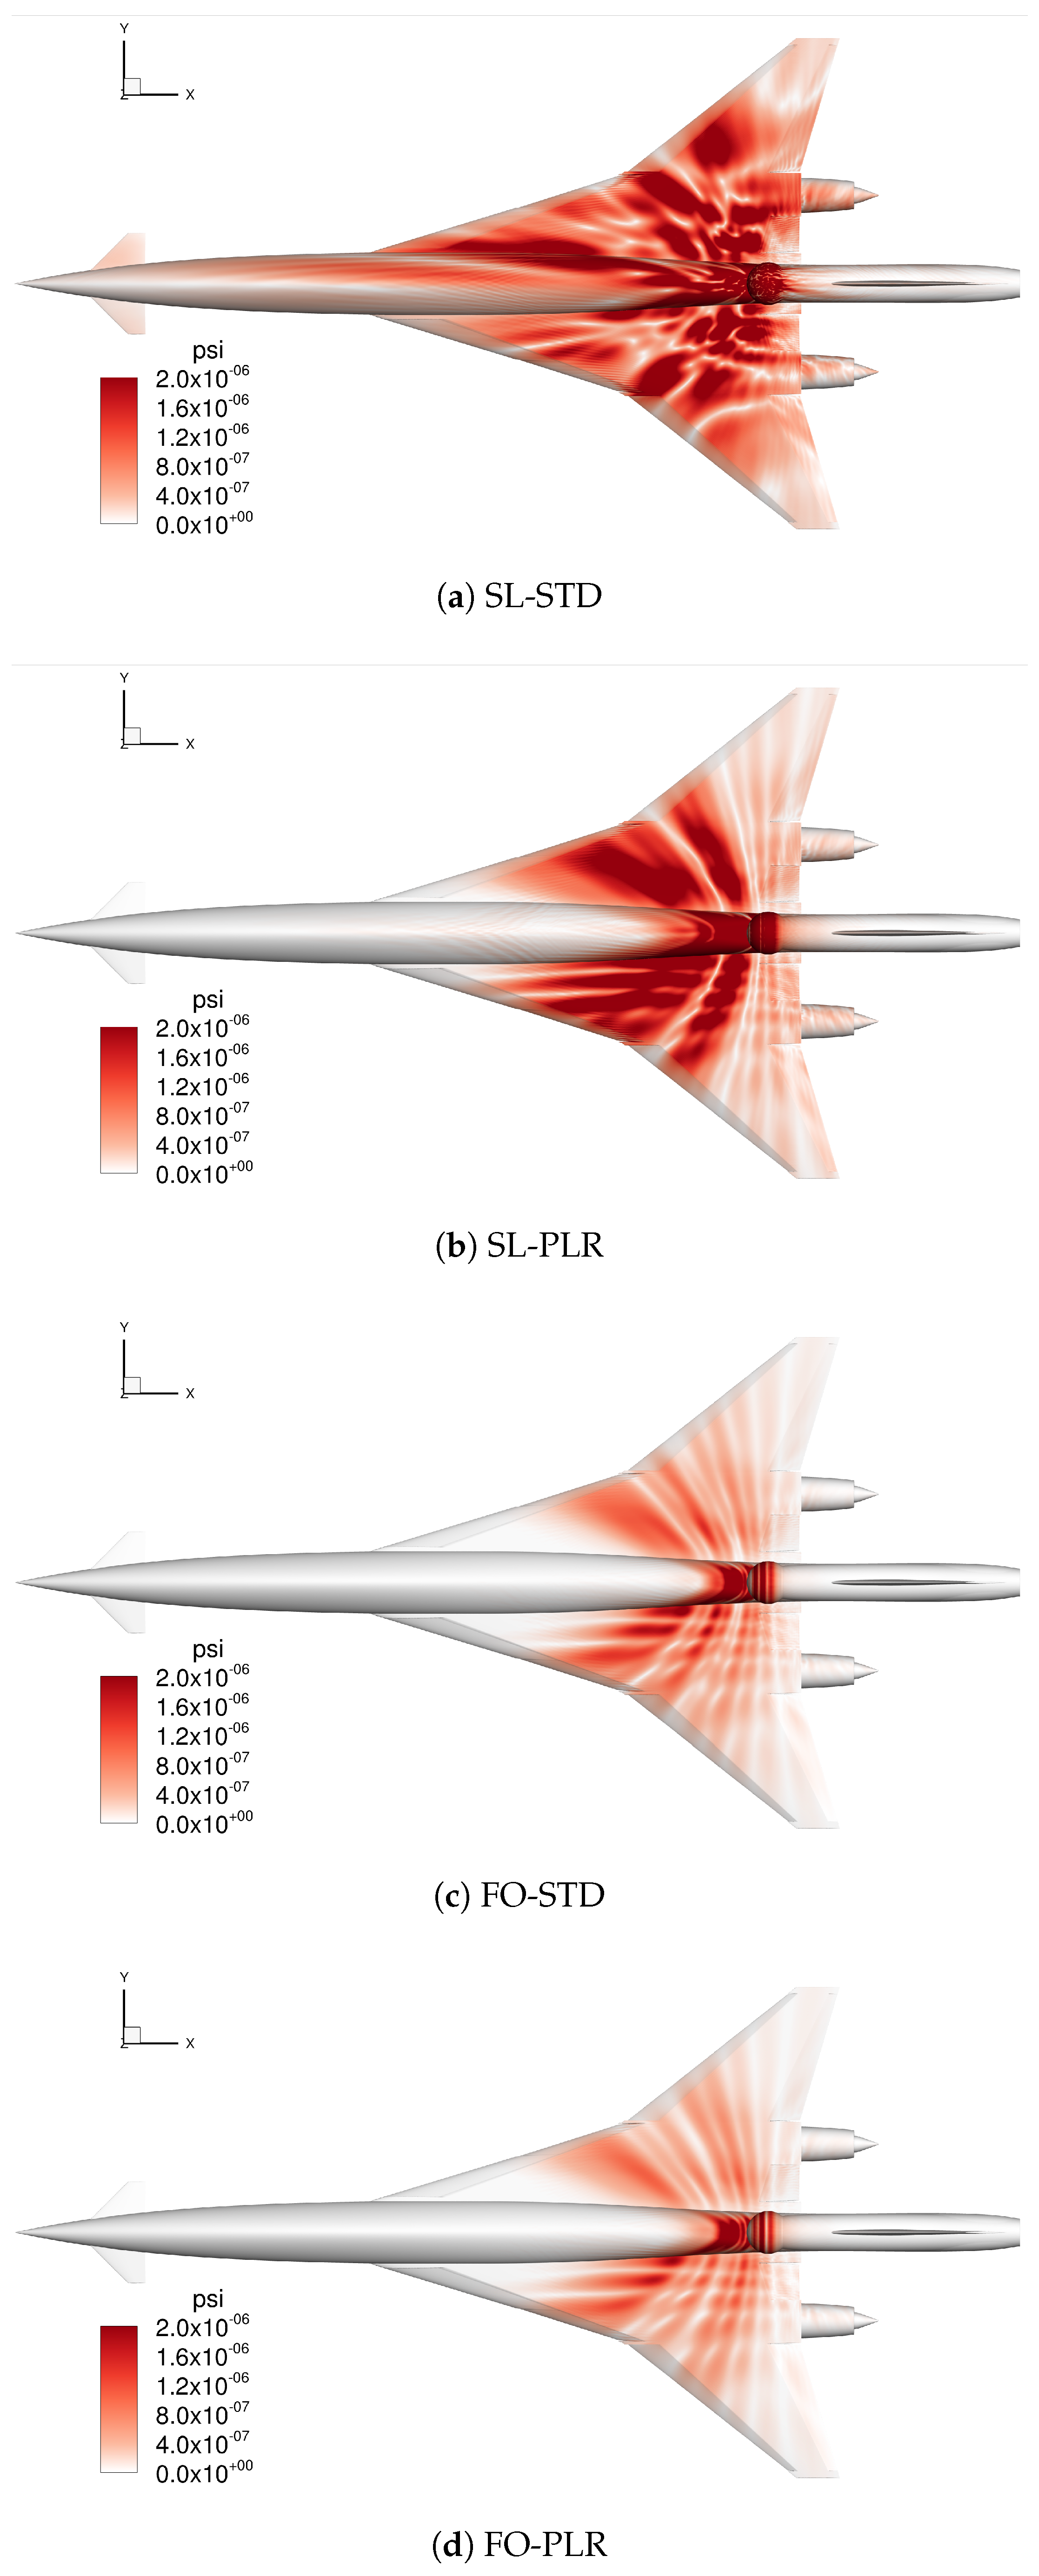
Figure 6 shows solutions for the horizontal
x–y plane. It can be seen that the pressure solution is not axisymmetric for the SL-STD case because of the partially separated boundary layer and local sonic velocity which is found on the inside of the lip, on the opposite side to where the separation occurred. In the CAA computations, the background flow velocity was limited to just below sonic for better stability of the APE equations used with the DG method. Our assumption was to neglect this local shock since the grid would have to be significantly refined which in turn imposes a constraint on the global explicit pseudo-time-step. The engines are designed to operate at full thrust for the sideline testing point which is representative of the early flight stage. The dominant fan noise frequency is noticeably higher for both sideline cases in comparison to the flyover cases. The sound intensity of the near-field is also higher and covers a larger area, which follows from the forward and side radiation contours.
4. Coupled Solutions and Acoustic Scattering
The volume-resolved near-field CAA solutions presented in
Section 3 were coupled with our FM-BEM surface integral method for computing acoustic scattering for the SST aircraft [
9]. The coupling interface, highlighted in
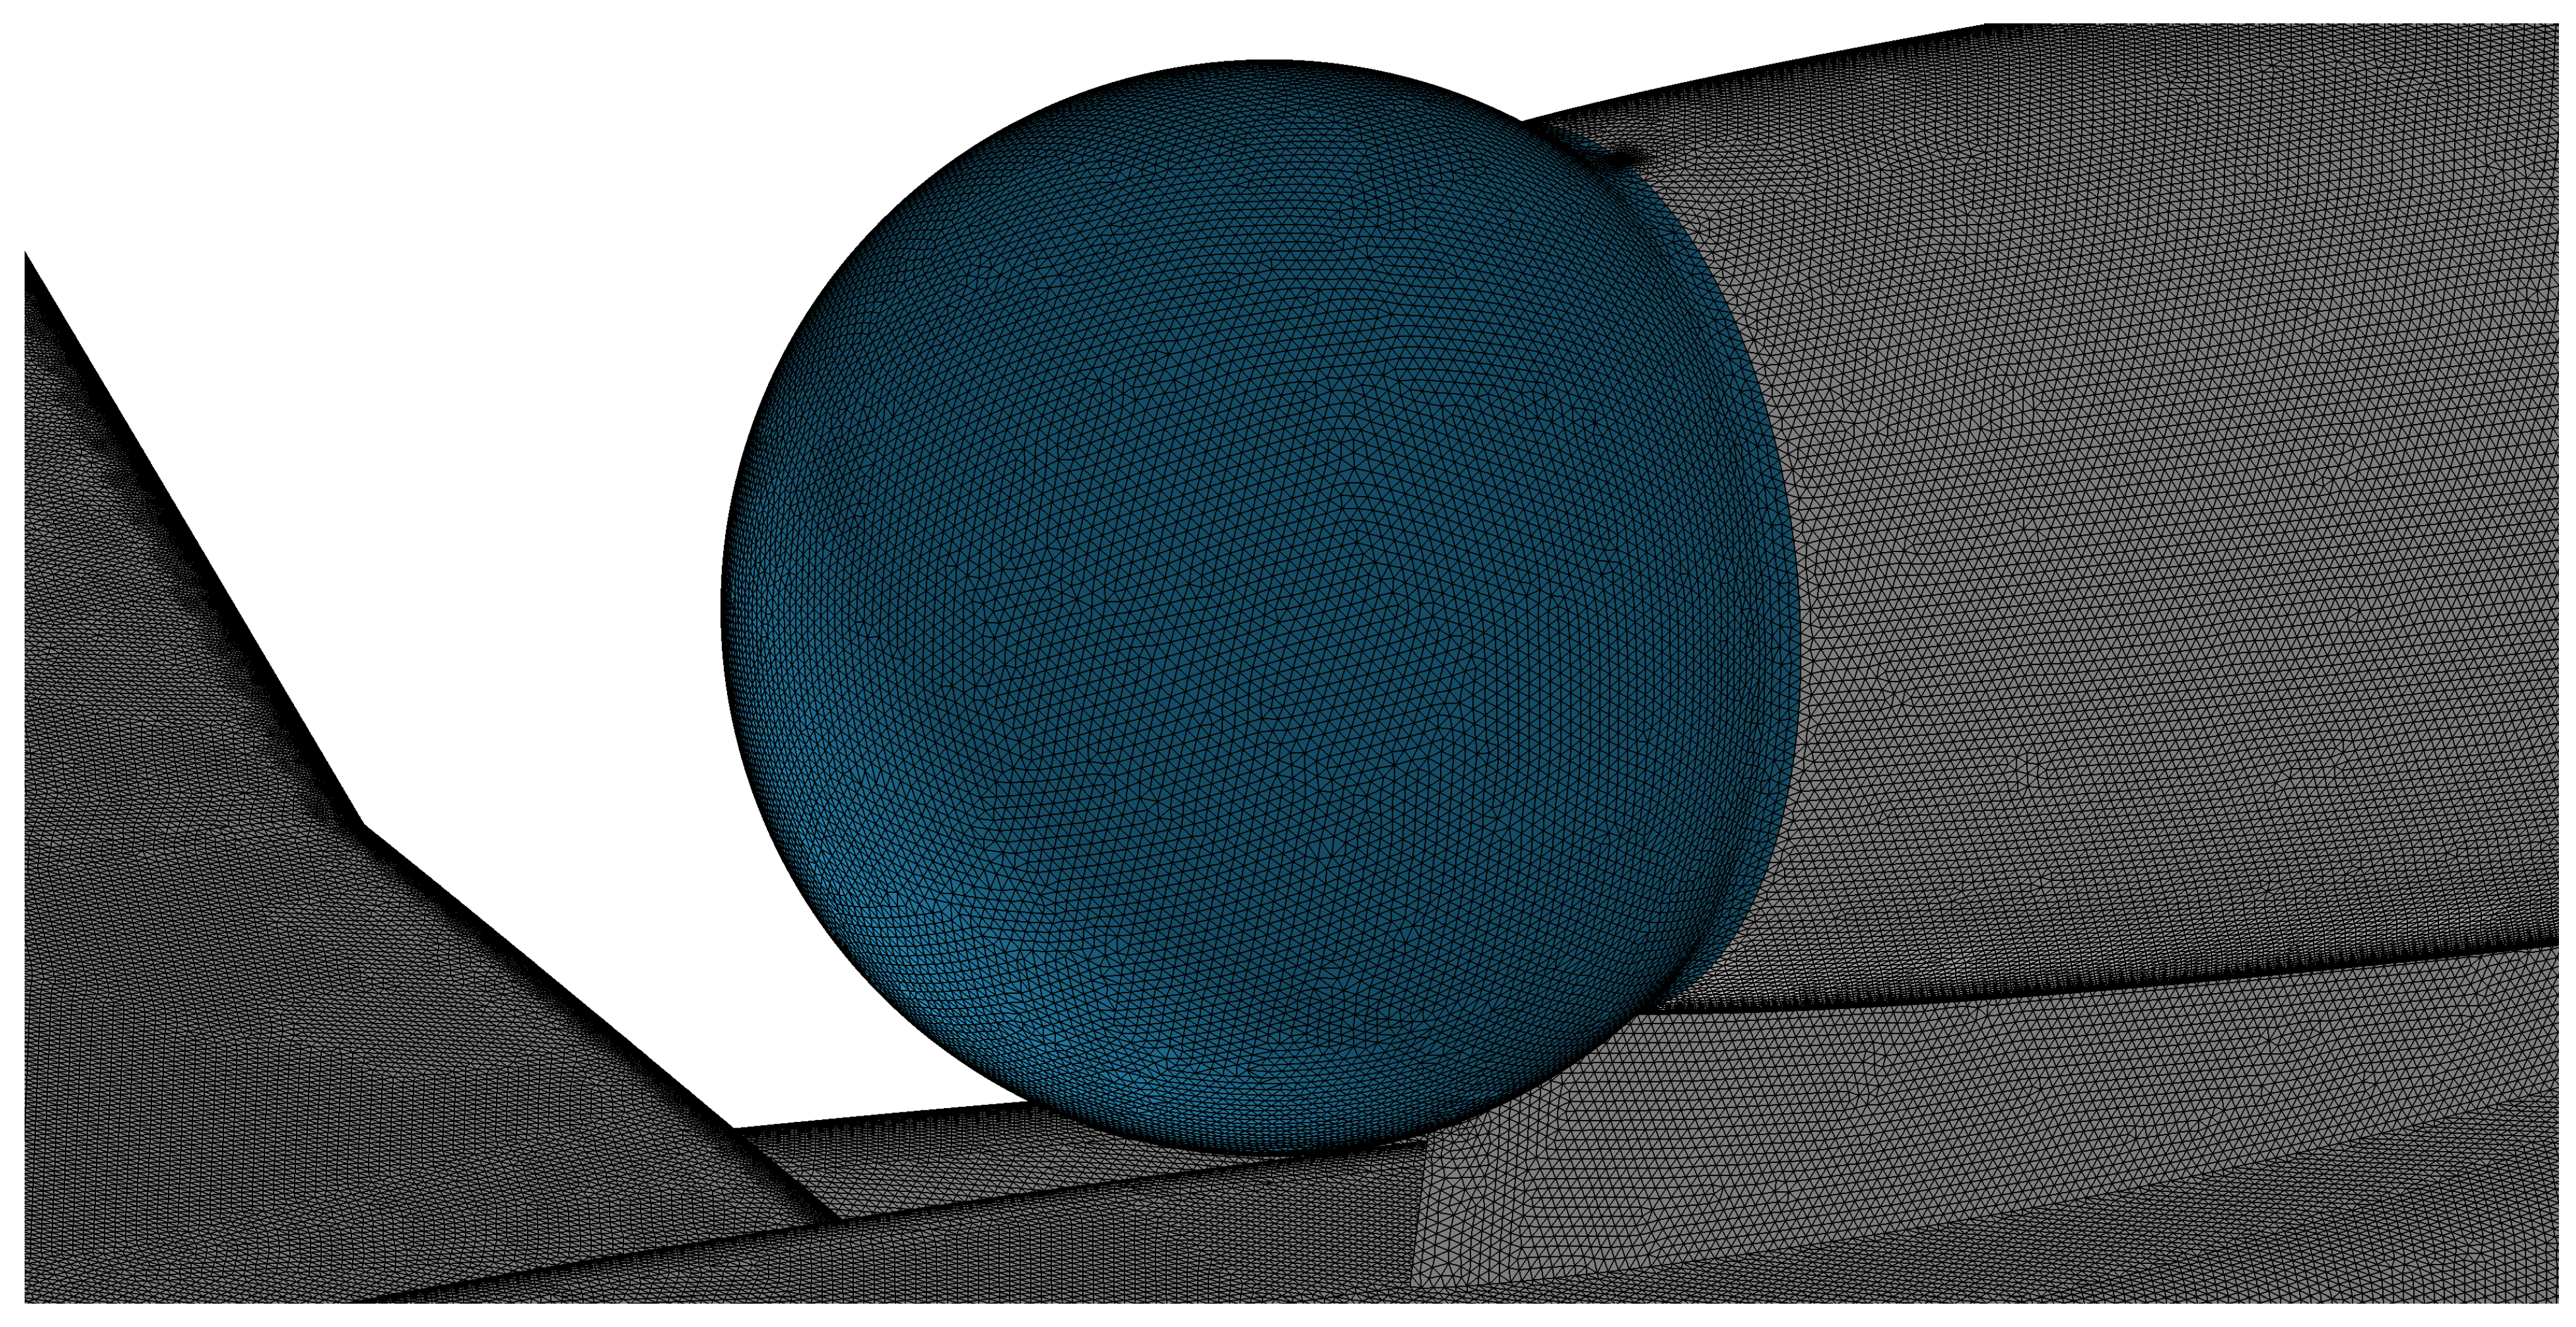
Figure 7, consisted of 37,000 faces, whereas the overall SST surface mesh came up to 4.83 million faces. For the efficiency of the FMM algorithm, it is desirable to keep the element ratio of source/scattering
1. Here, a large number of triangles is required to discretise the coupling surface to achieve a proper resolution of at least 5 ppw, which becomes demanding both on the memory and pre-computing tasks. Thus, the coupling interface (sphere) is made as compact as possible, which helps to minimise its surface area. The surfaces were joined using a fillet to avoid errors in gradient computations when transitioning from source to scattering surface.
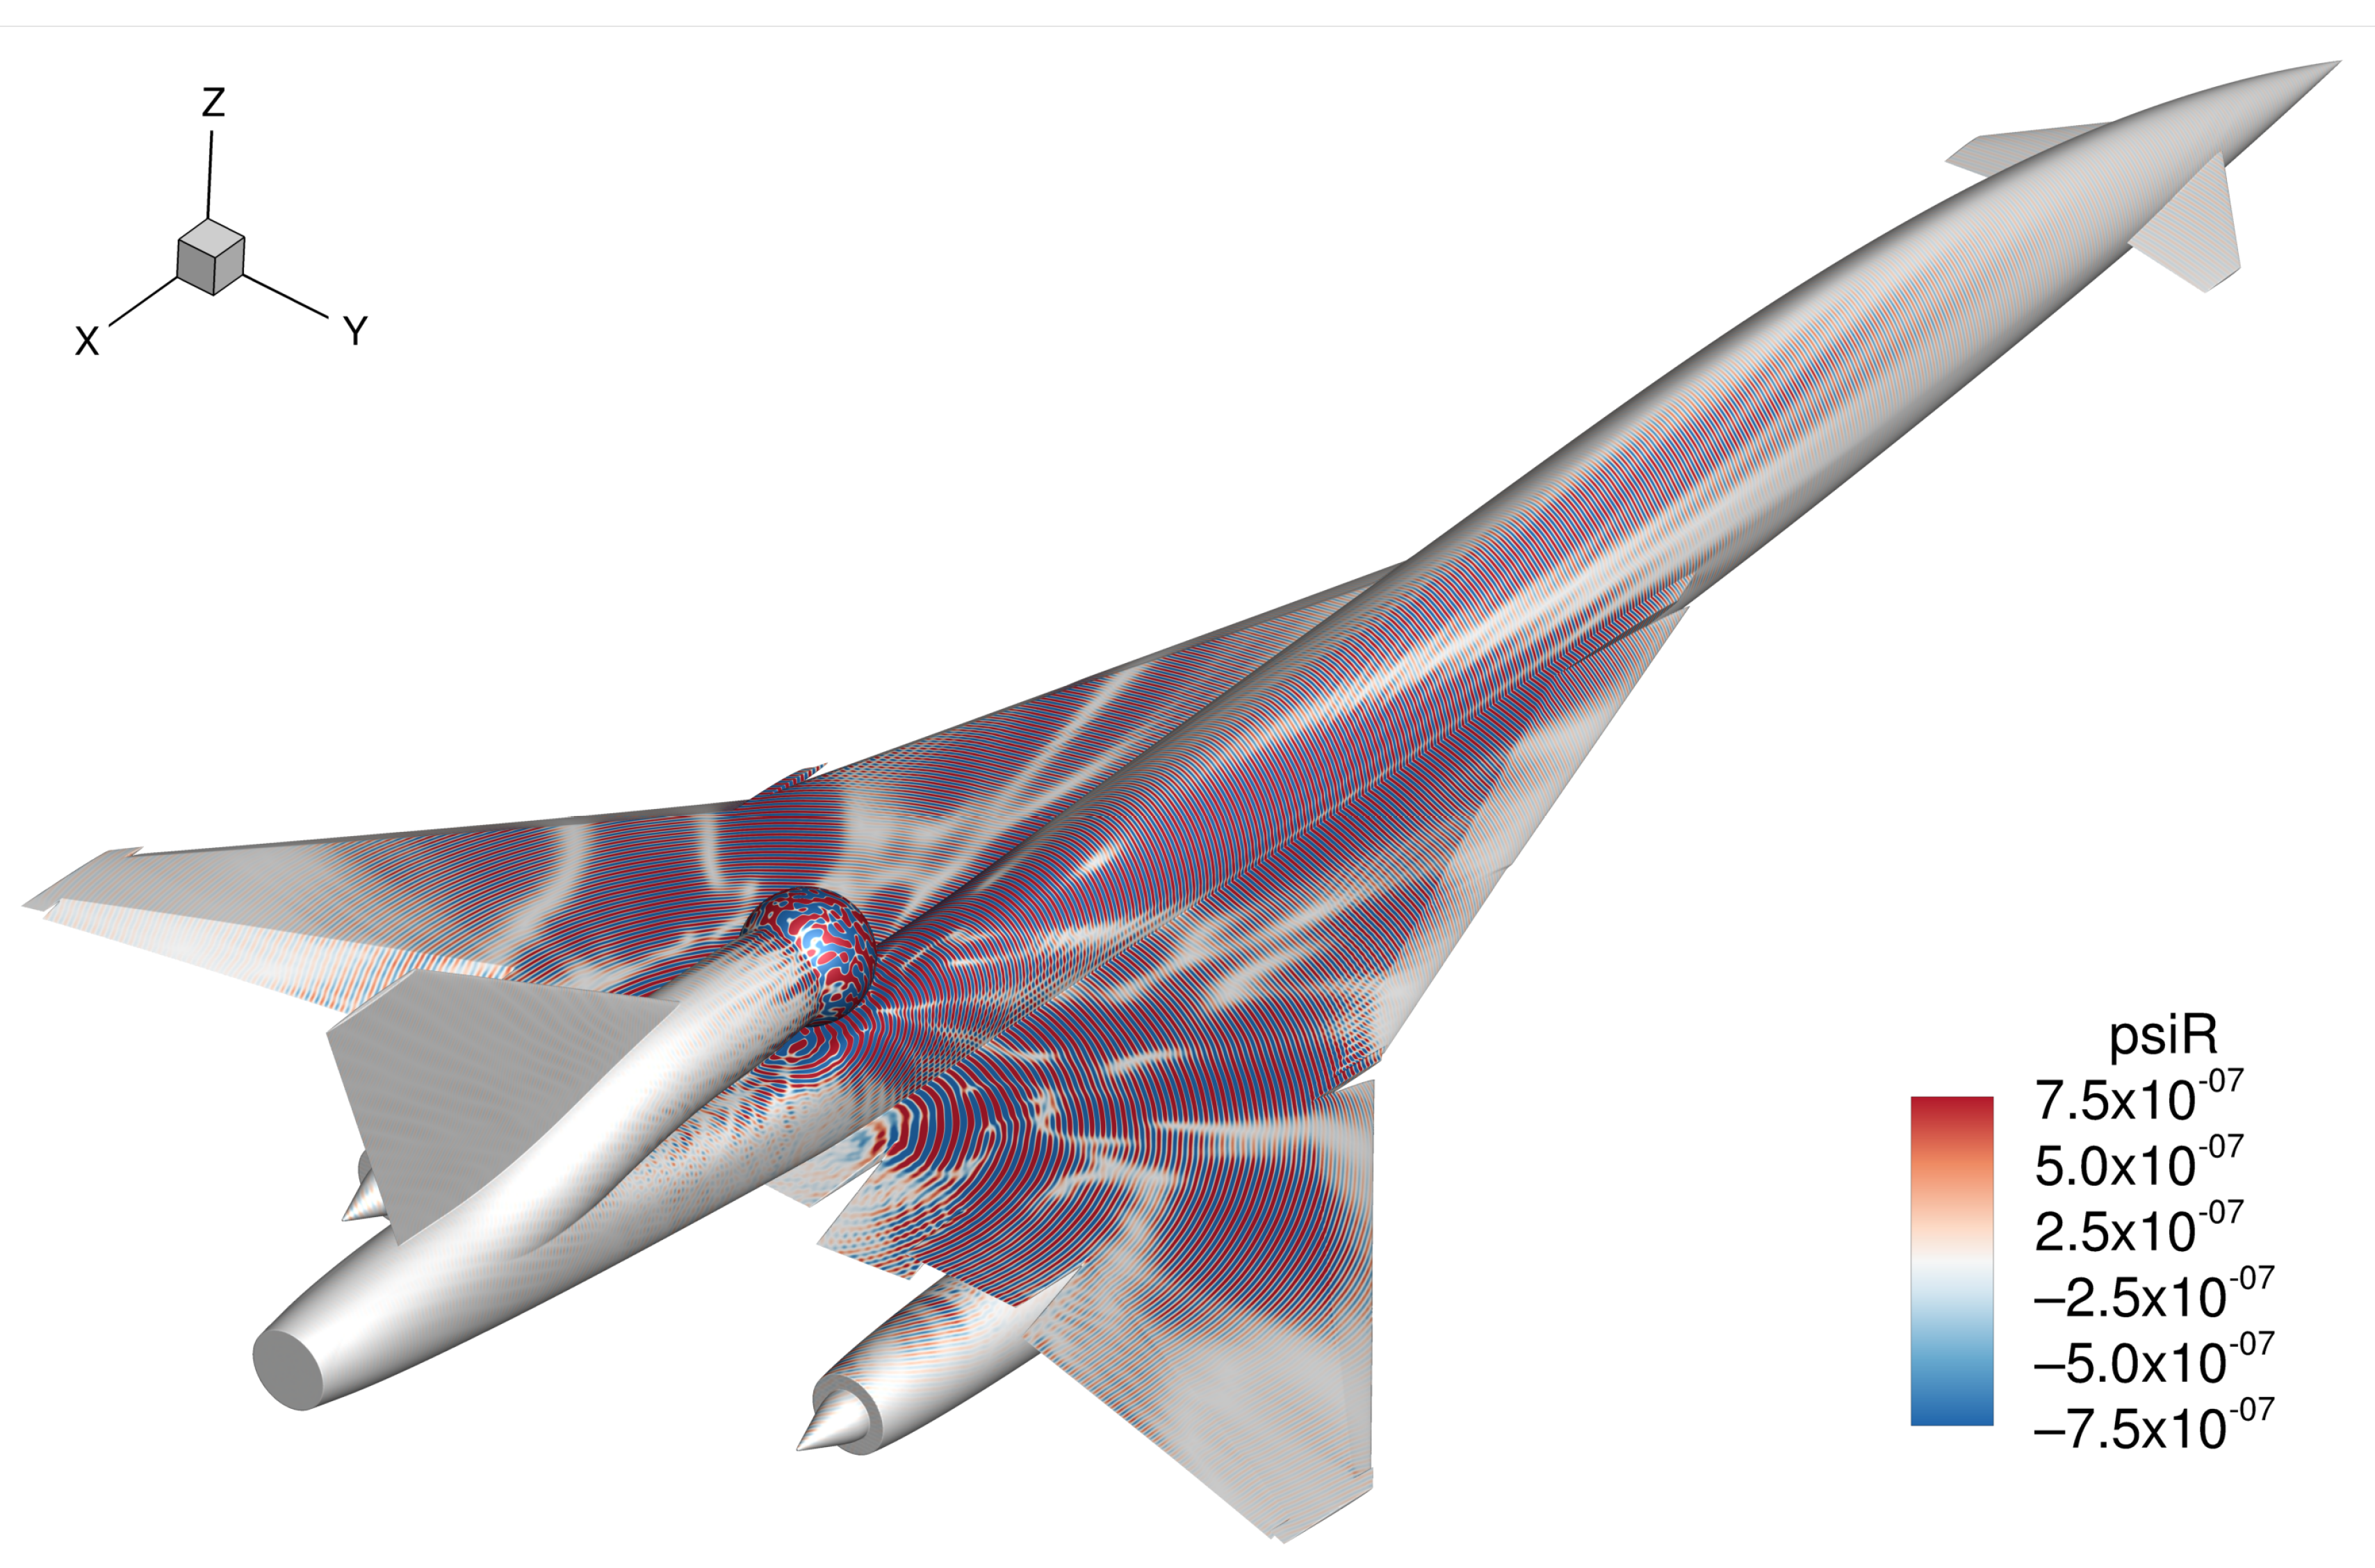
Figure 8 shows the real part of the dimensionless acoustic potential plotted on the aircraft’s surface for the SL-STD case. Notice how complicated the acoustic scattering appears for the fully shielded forward-radiating fan modes. In contrast, noise is radiated directly downwards and sideways for the flyover cases (see
Appendix A) where a weaker acoustic potential is observed. These results are consistent with the volume-resolved near-field in
Figure 5 and
Figure 6. The near-field signature is significantly affected by a high Mach number non-uniform flow at the inlet, which further emphasises that the resolved scattering and interference effects caused by complex fan modes cannot be reproduced with empirical methods.
5. Far-Field Signature
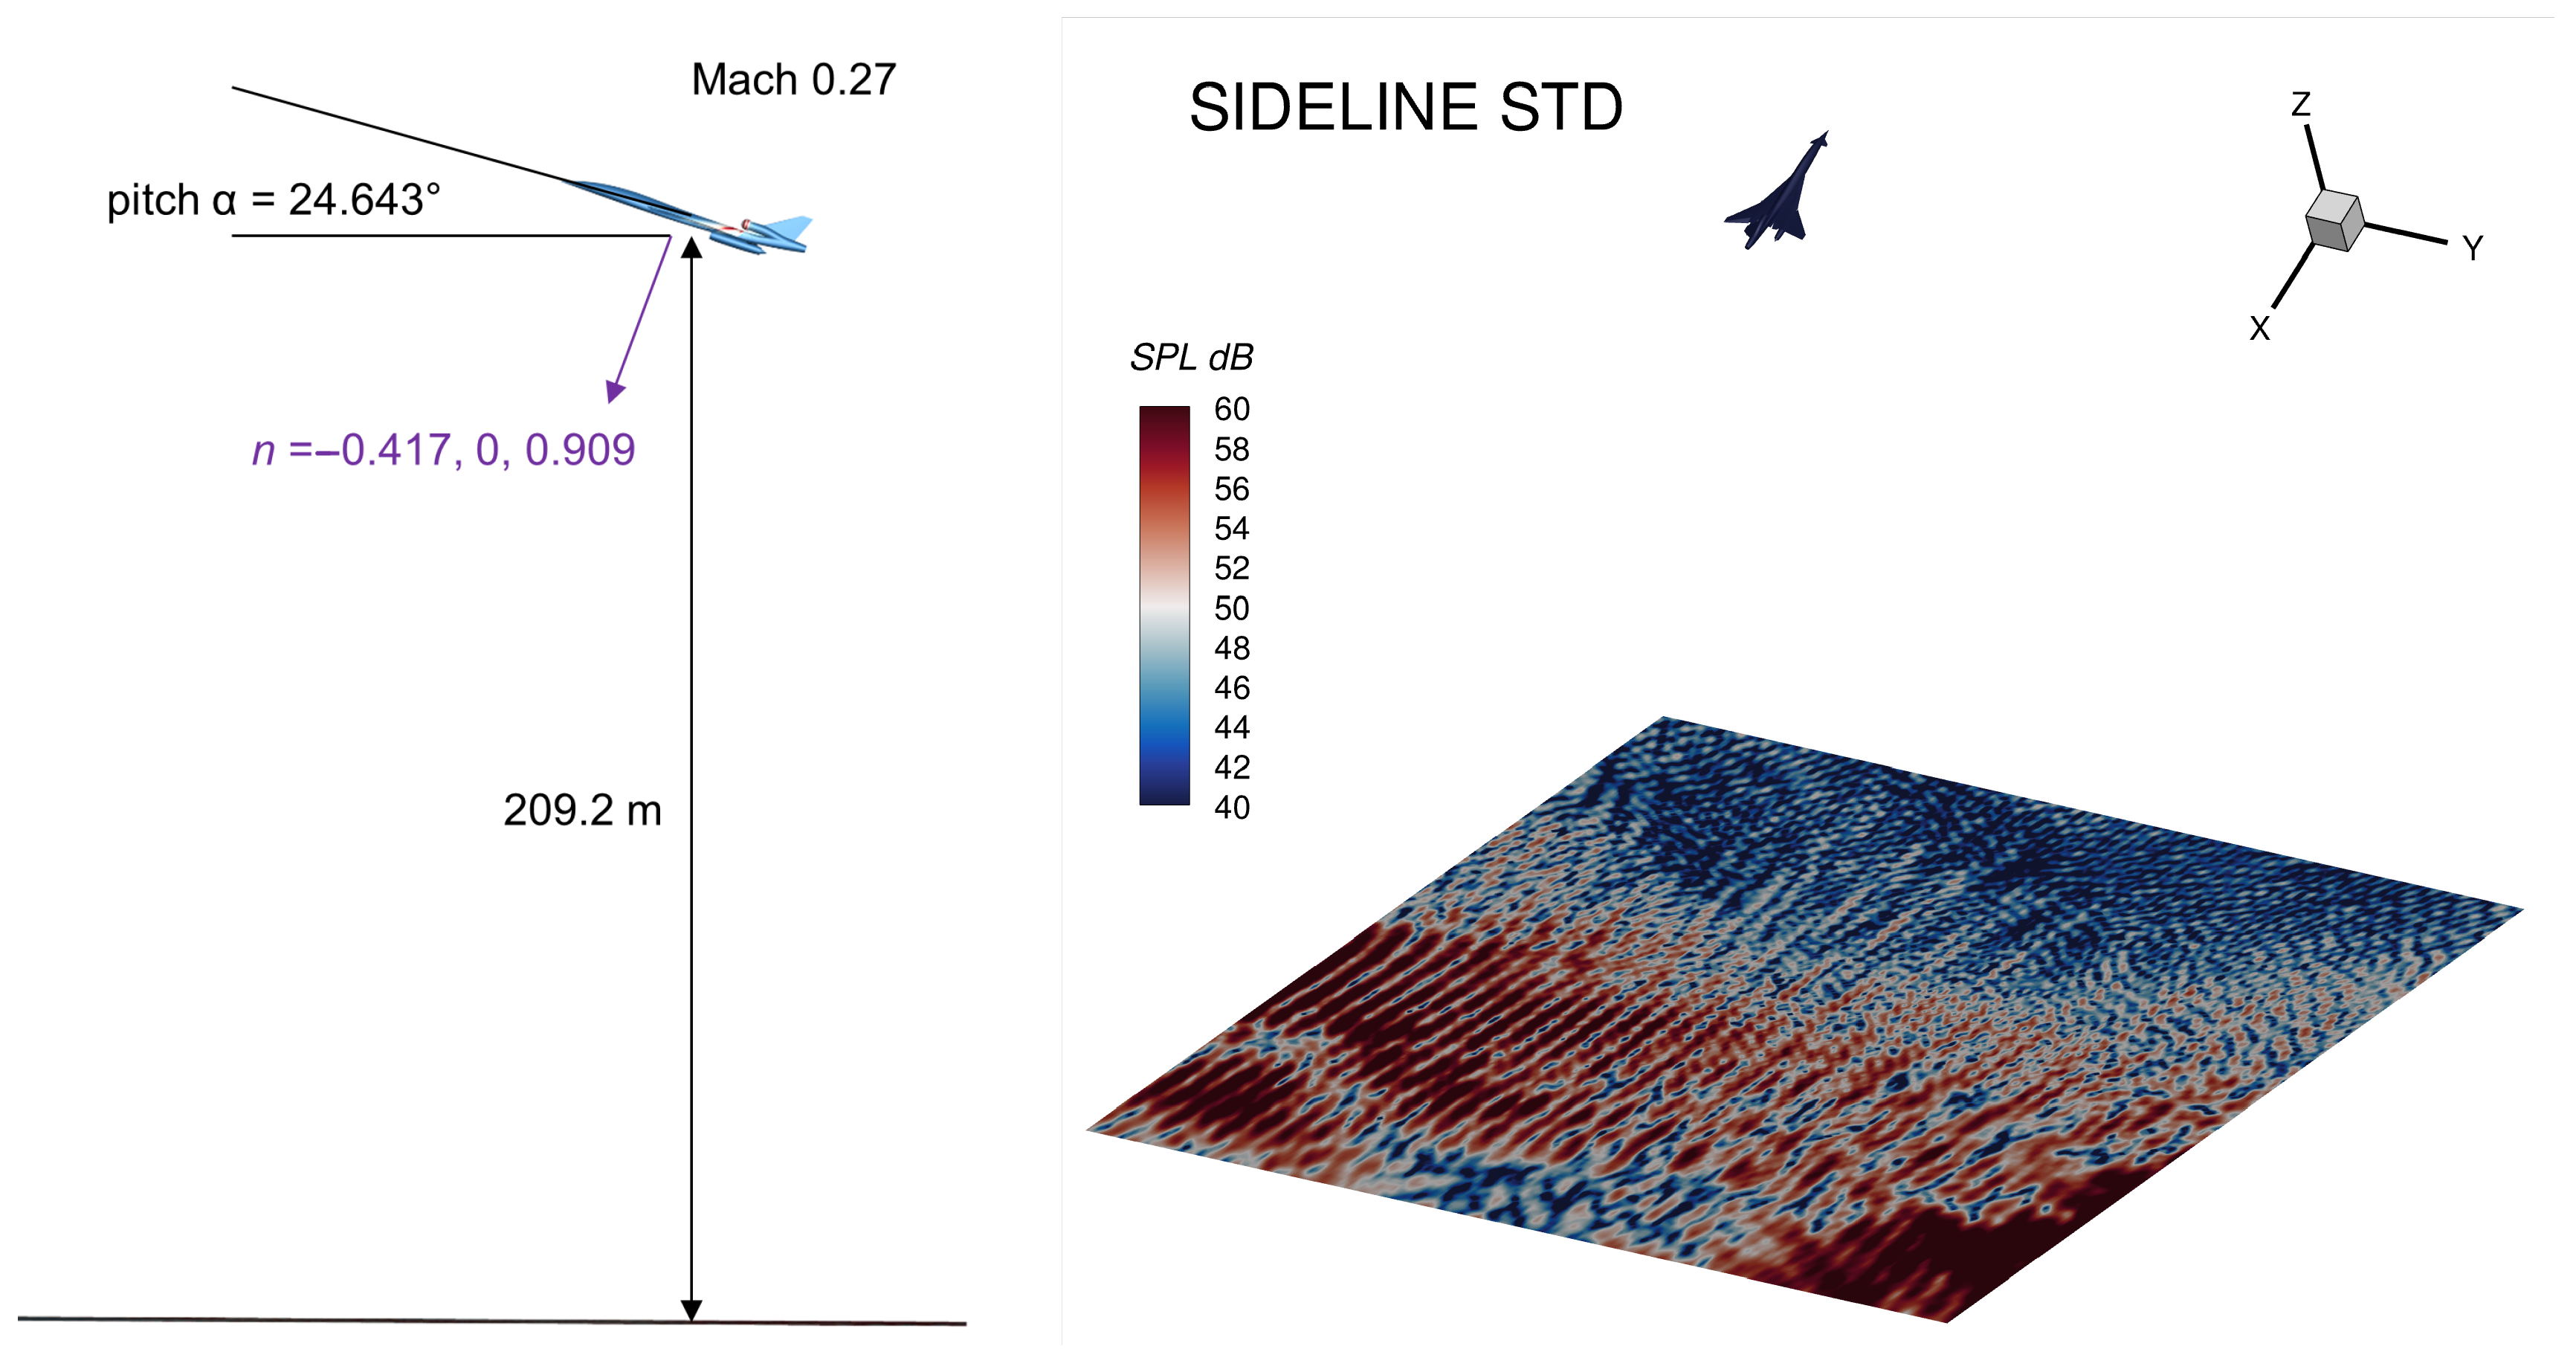
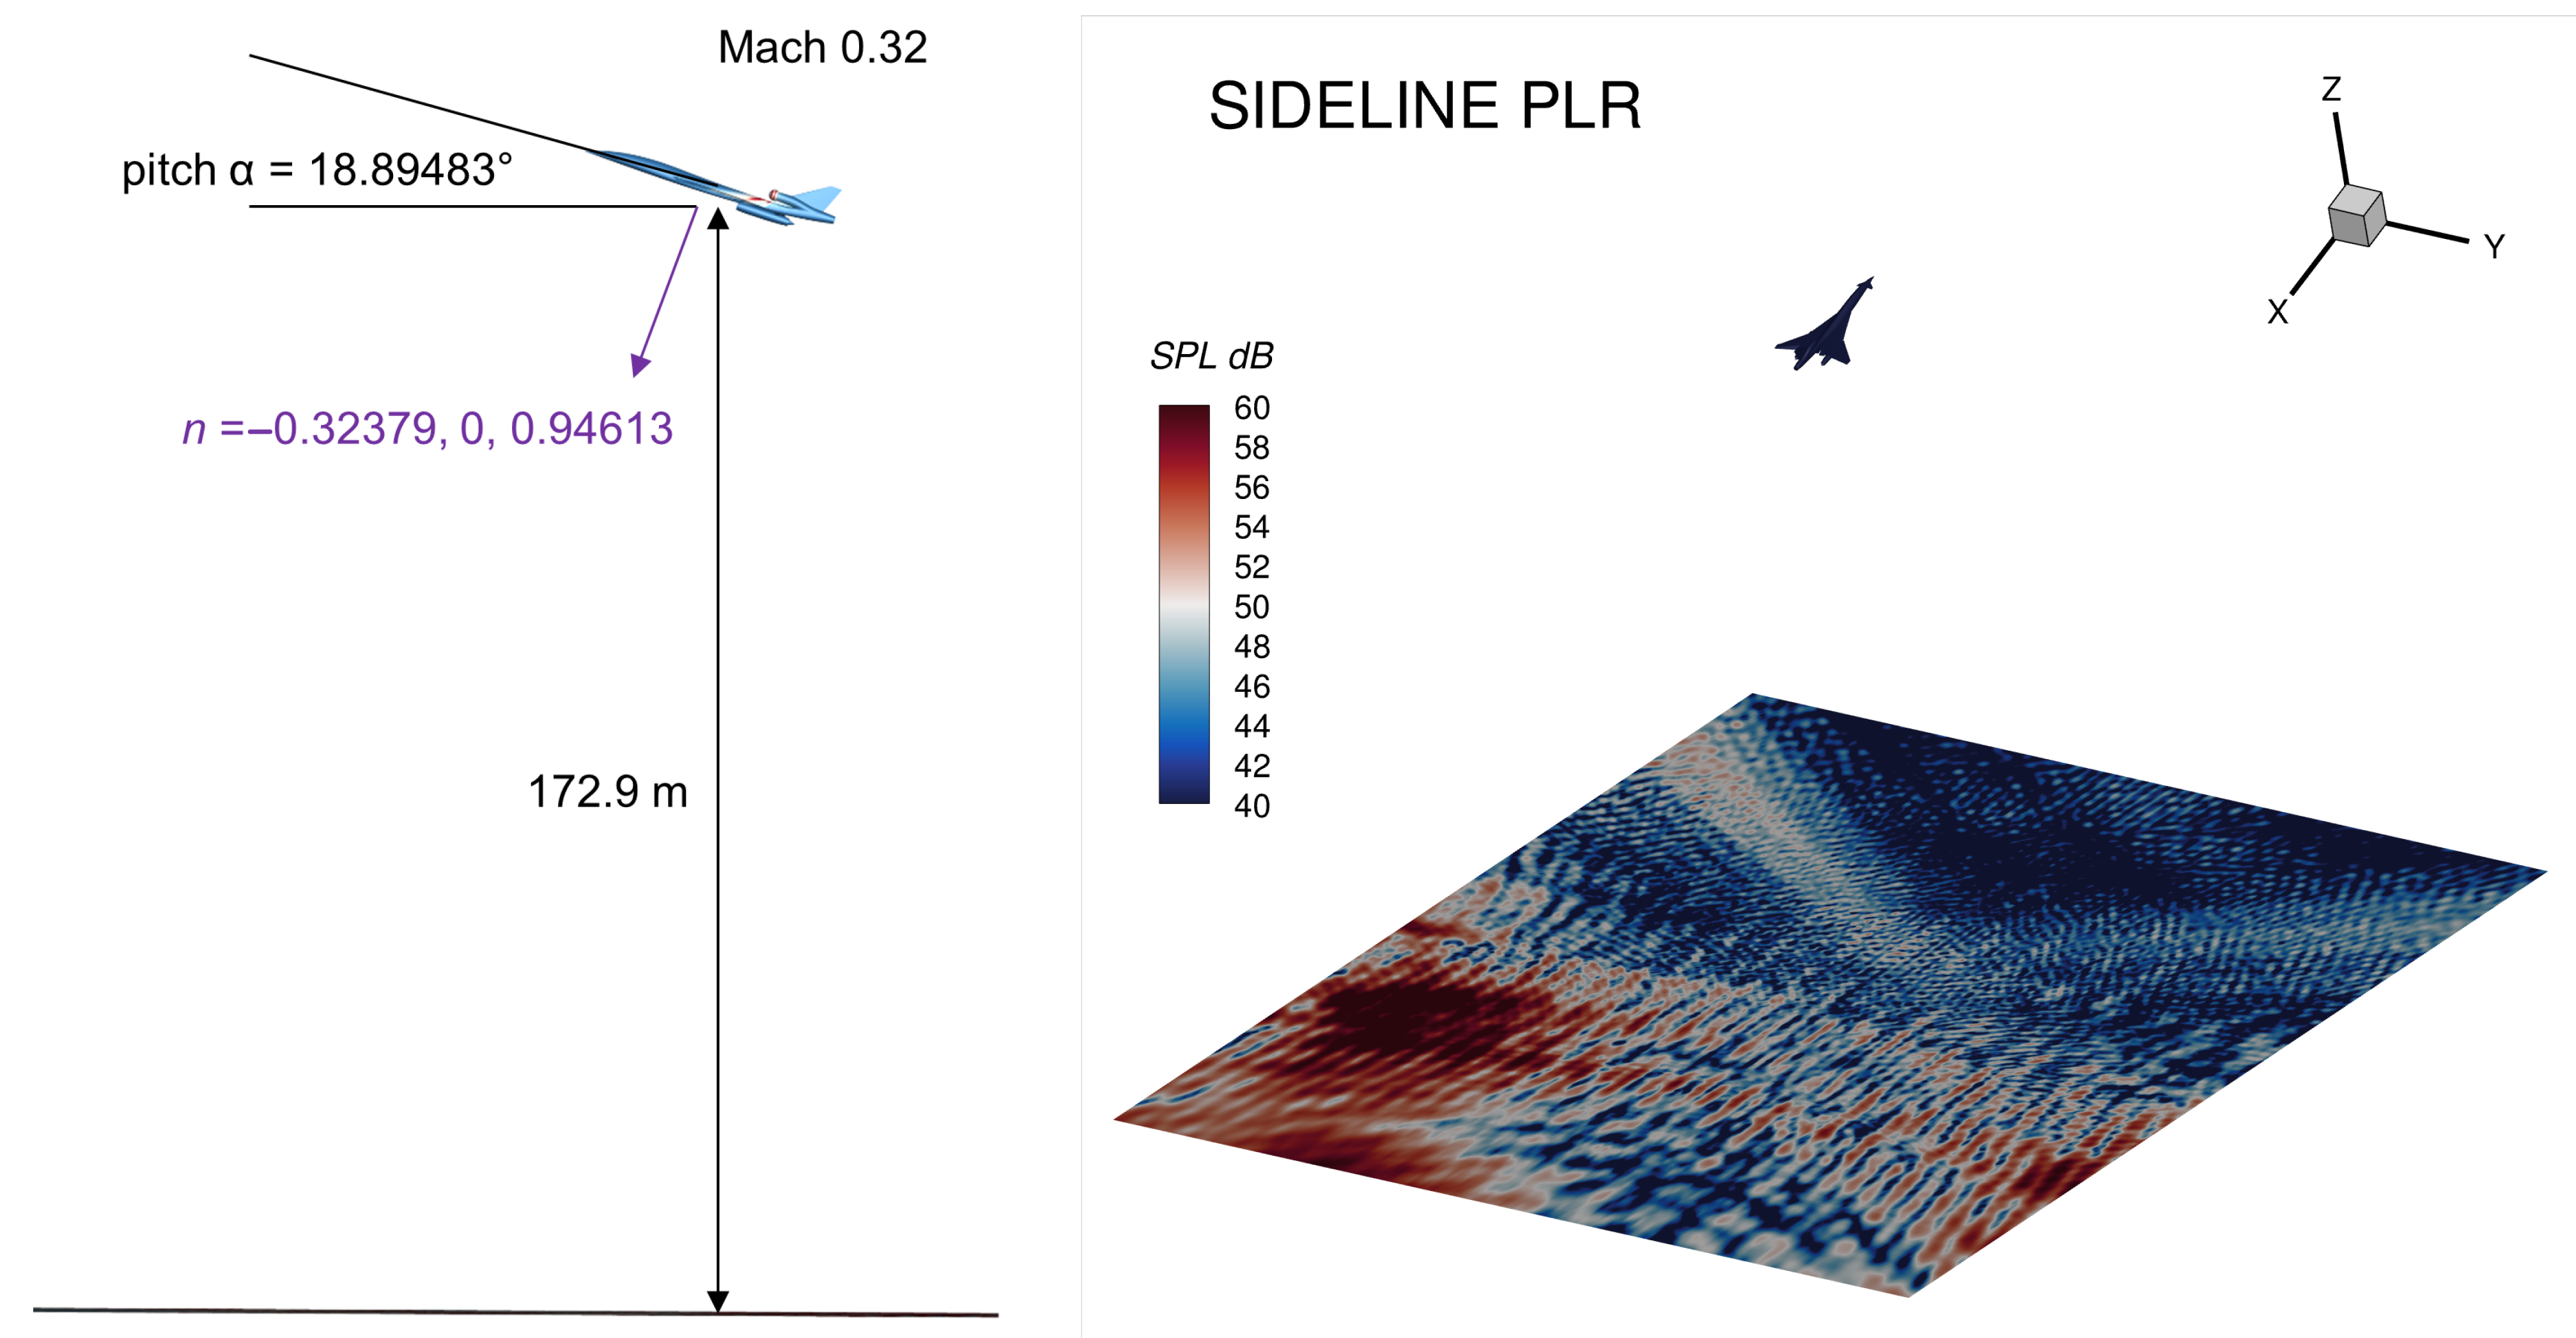
Table 1 contains far-field definitions for the sideline flight points with and without the programmed lapse rate. The sideline cases are prioritised because of higher noise emissions in comparison to flyover and the shielding effect should be most significant for the former. Moreover, the aircraft has a high pitch angle relative to the ground for the sideline cases which affects the noise signature.
Figure 9 shows the far-field SPL levels for the standard flight point at 209.2 m below the centre of mass point, plotted on a large (200 × 200 m) plane.
The peak SPL level for the fully shielded top engine amounted to just 65.6 dB, where most noise radiated downstream, and also to the sides. A more pronounced “V-shaped” side radiation is visible for the PLR flight point in
Figure 10. The peak noise level on the ground is 65.4 dB, obtained on the plane at 172.9 m below the aircraft.
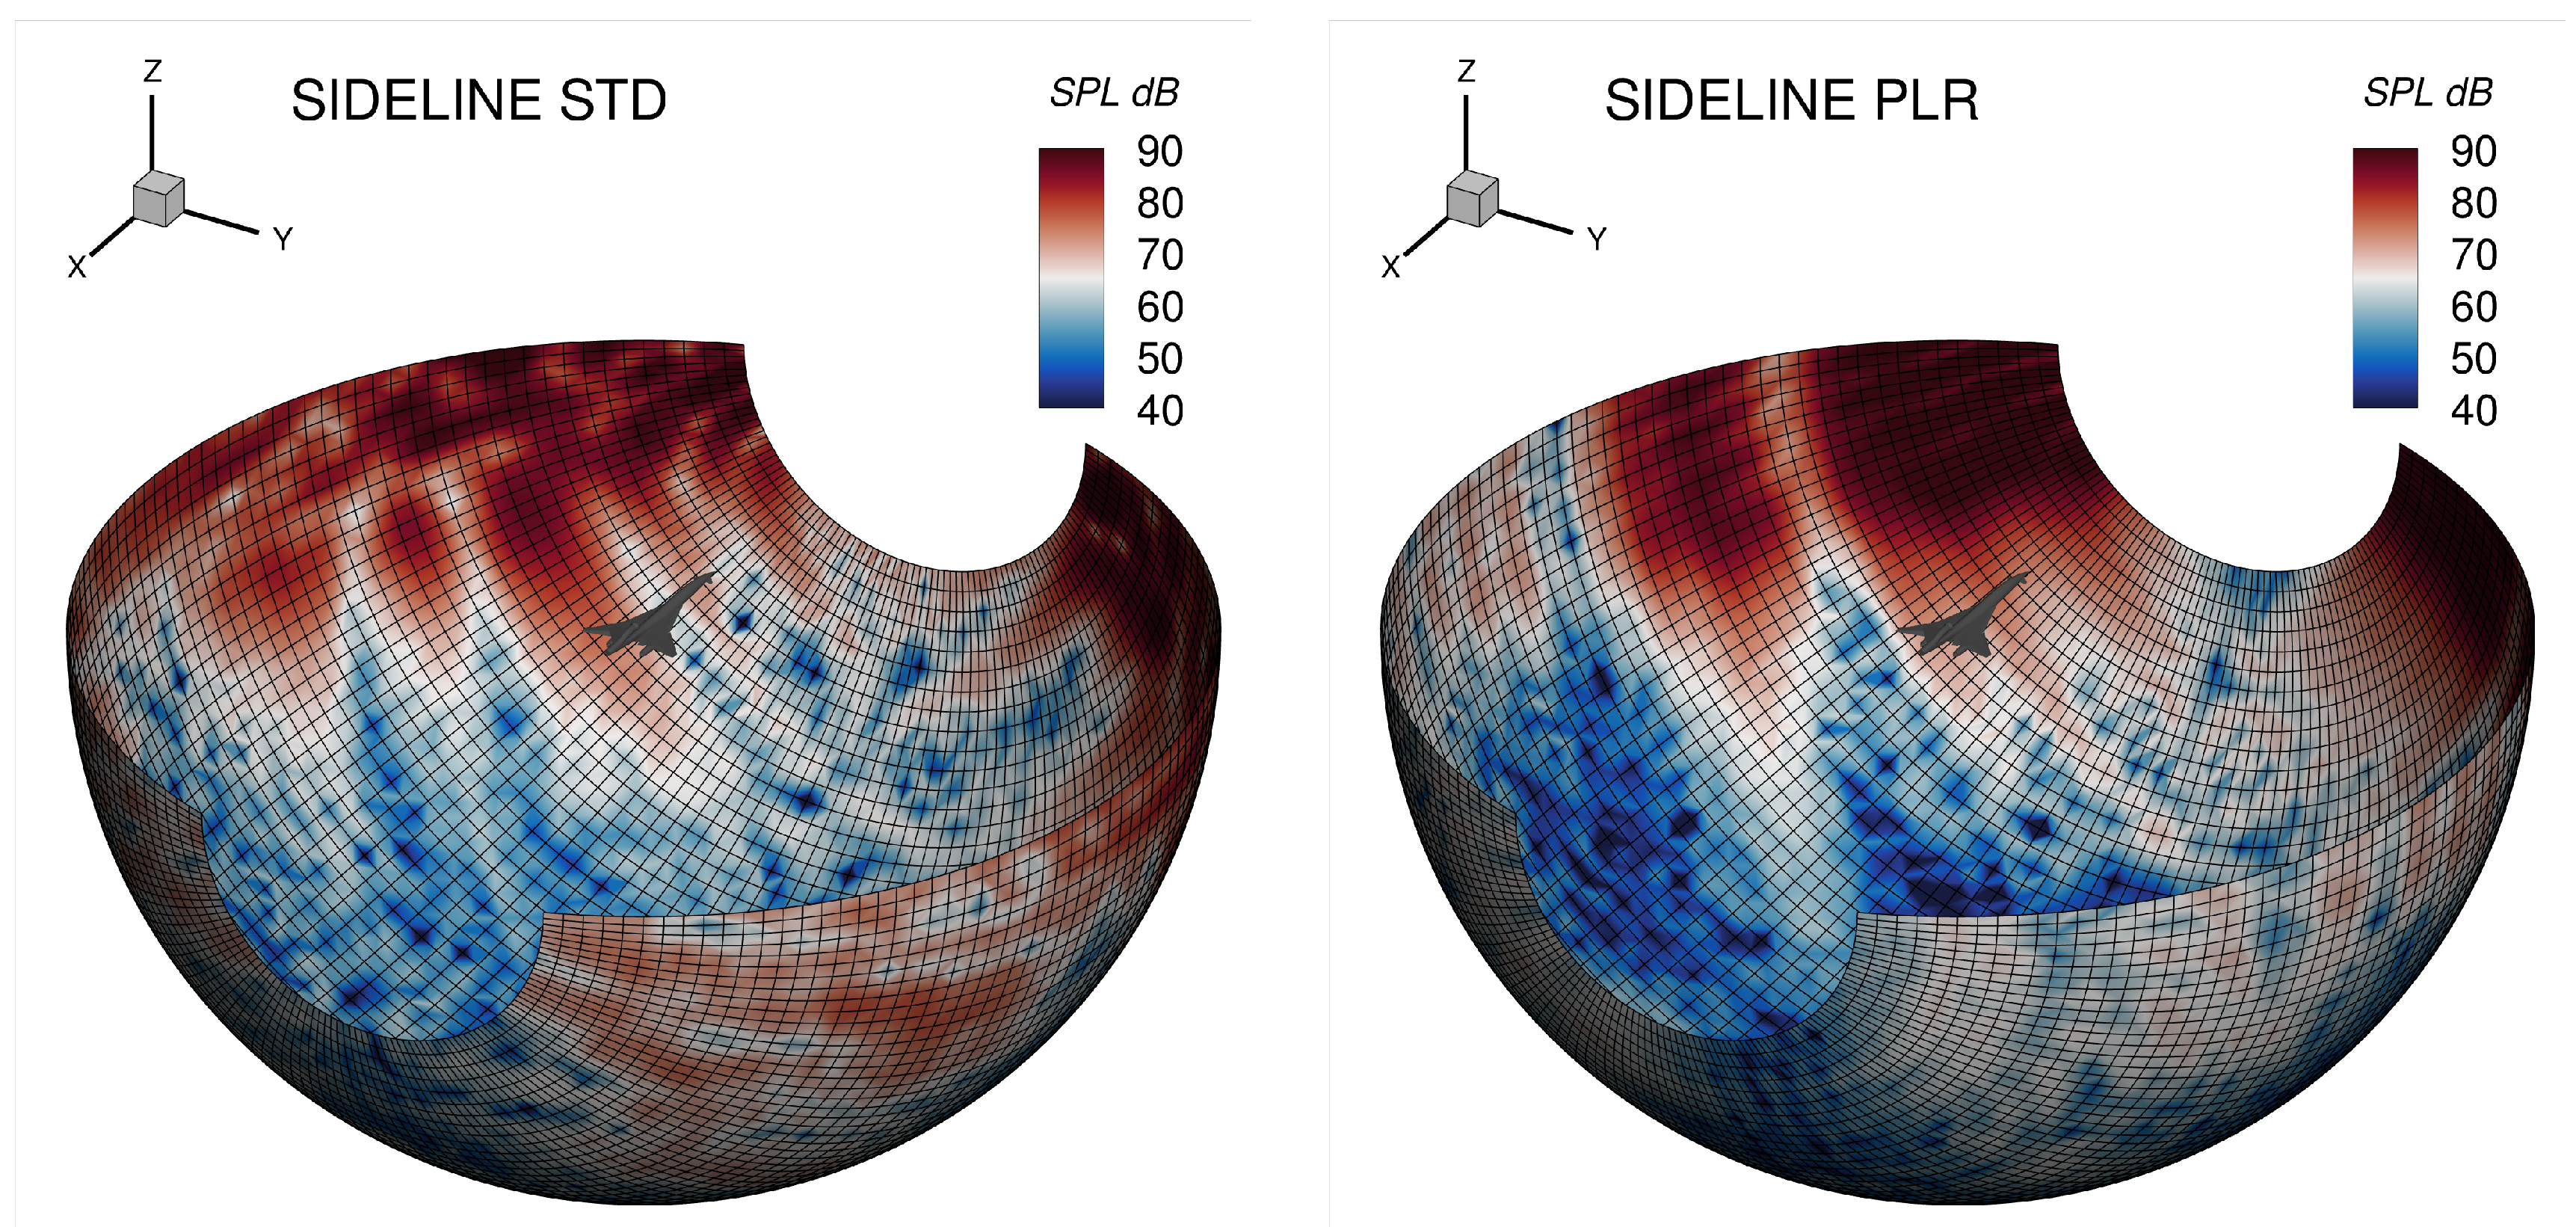
Figure 11 shows the SPL contours on a hemisphere with a radius of 100 m. The aircraft is aligned with the cut plane (no pitch) and the contours further highlight the importance of noise shielding. It turns out that only a fraction of the overall noise is emitted in the backward arc which is towards the ground for the sideline flight points. The peak levels of around 95 dB at 100 m are obtained. Since most high noise levels are found upstream on both sides of the fuselage, this results in a beneficial effect during climb.
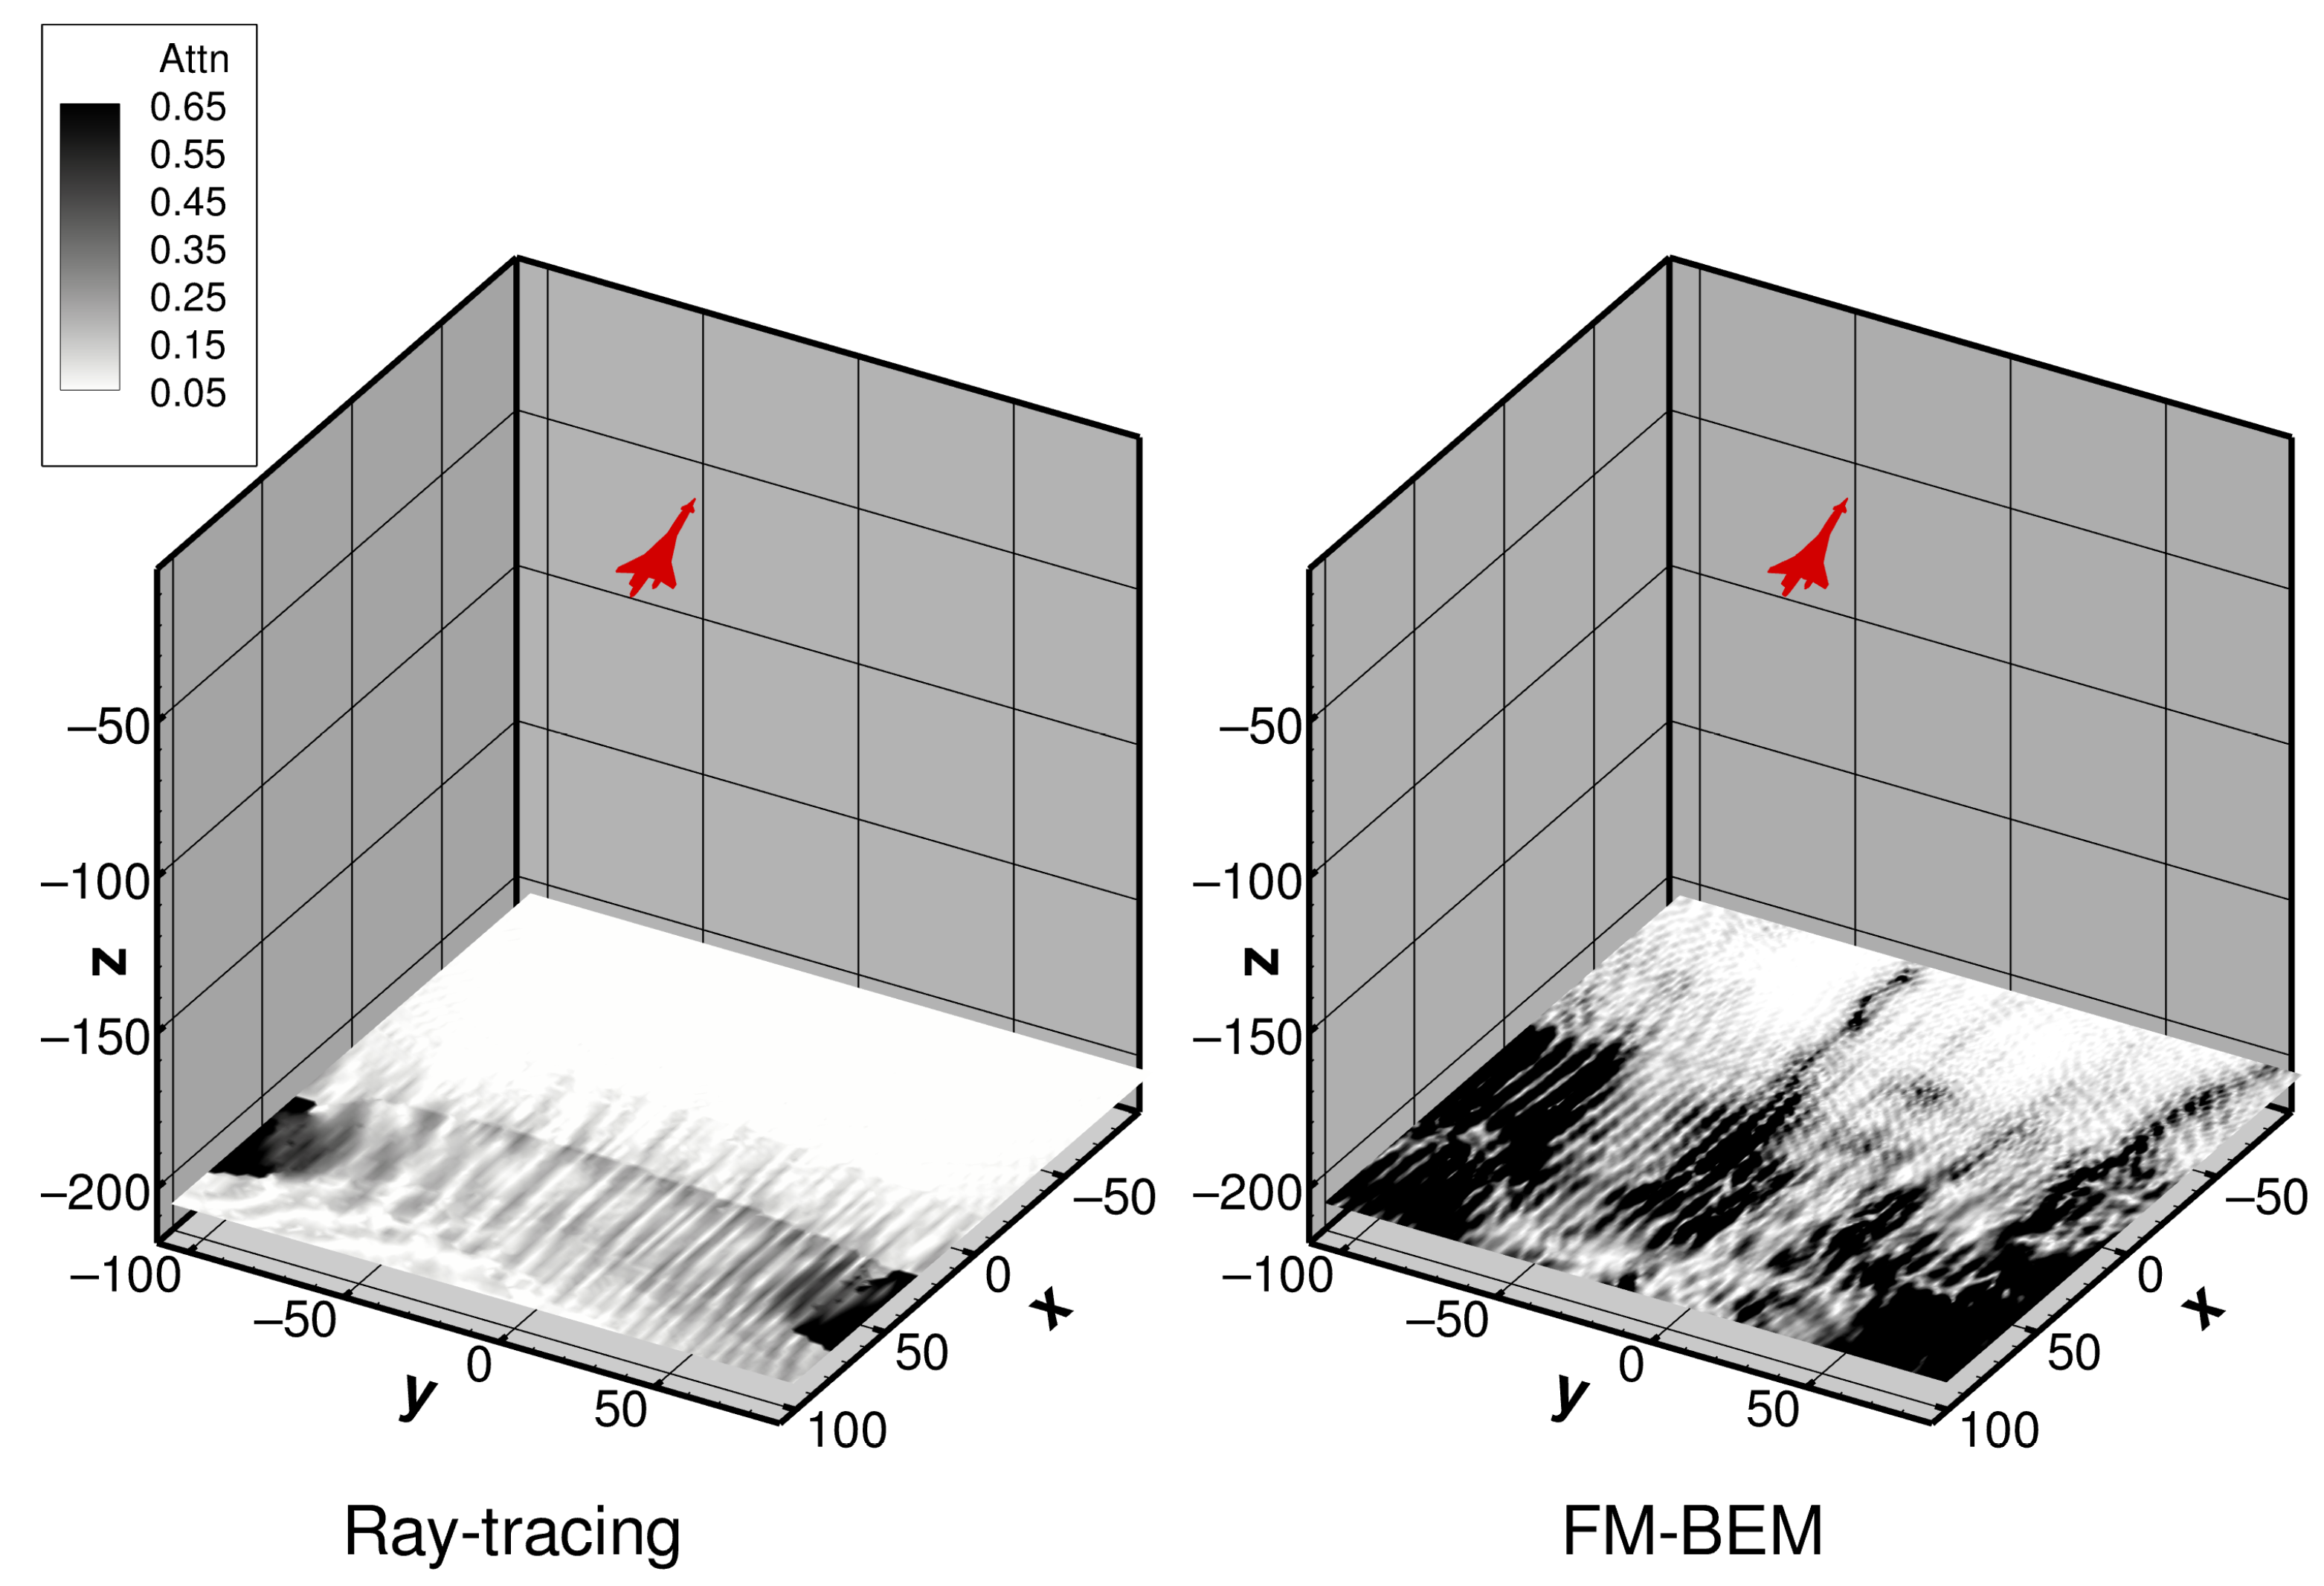
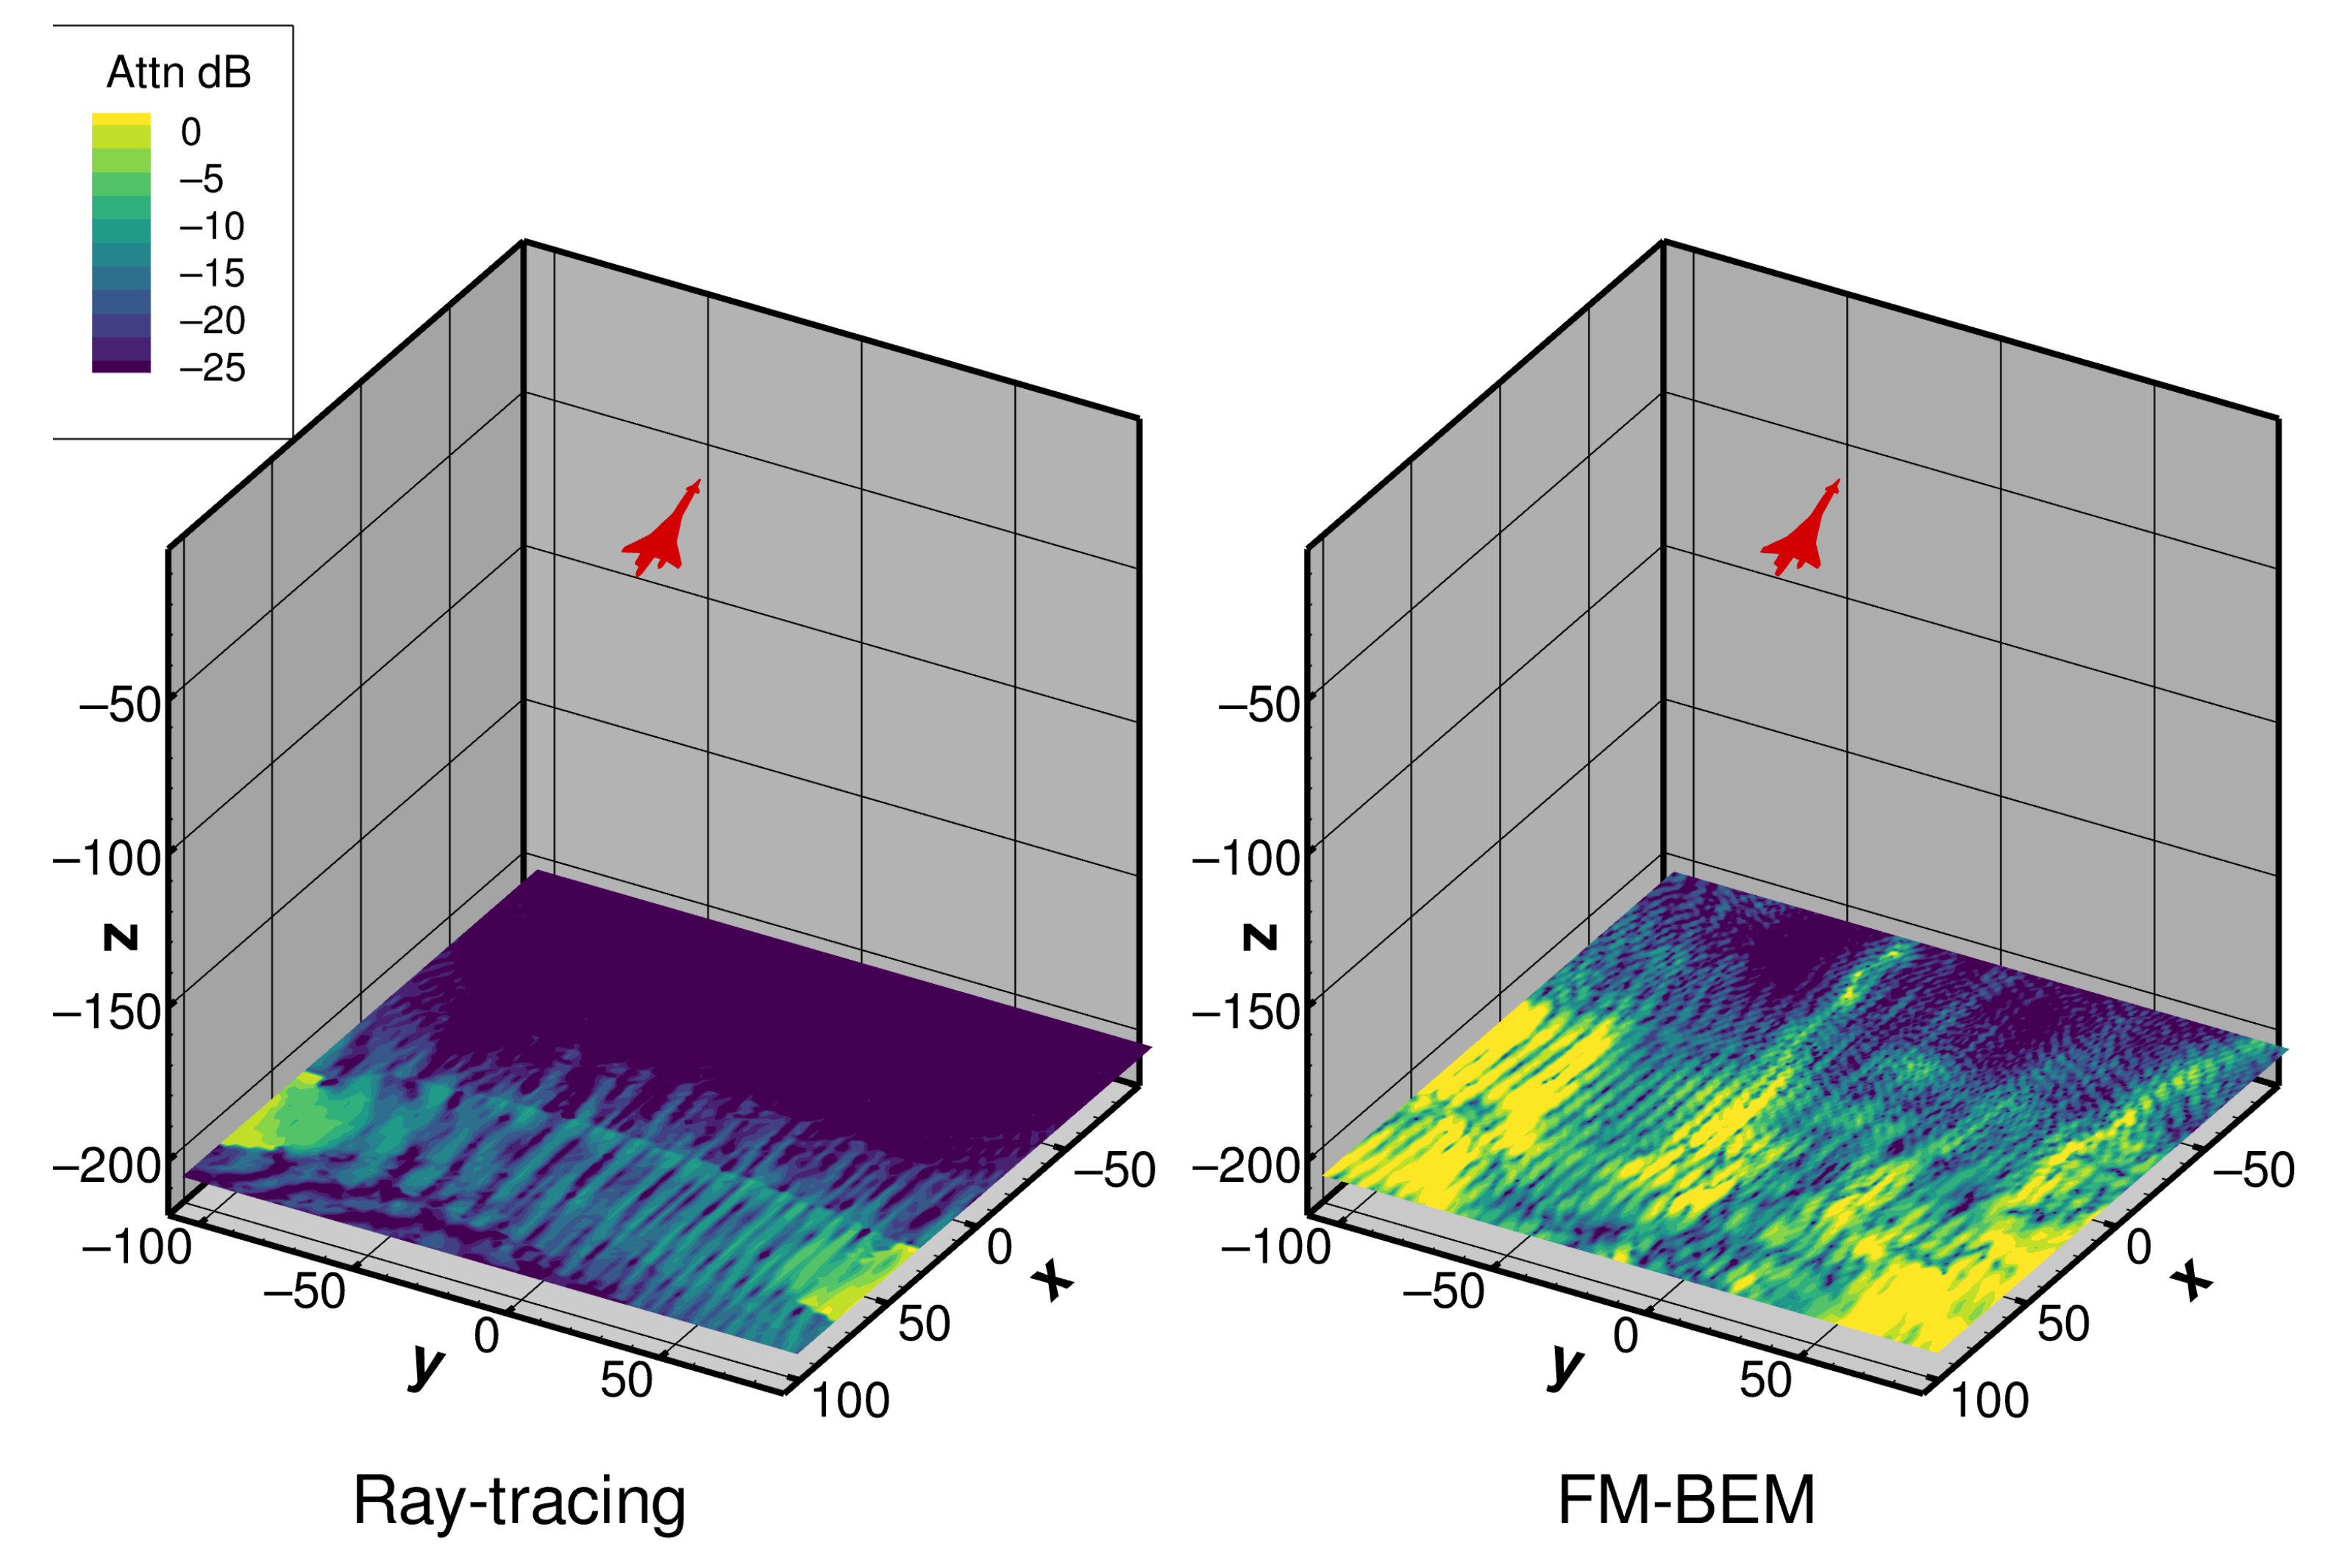
Ray-Tracing
Additionally, a ray-tracing simulation was performed for the SL-STD flight point for the purpose of testing the capability of a cheap alternative if used for predicting shielding and diffraction for such complicated problems. Since the noise sources are close to the surface (above the fuselage), any ray-tracing method is unsuitable for predicting noise below the aircraft without an appropriate diffraction correction. Our simulation used a generic monopole source at the same fan mode frequency, where the Maggi–Rubinowicz diffraction correction was applied around the edge of the geometry [
12].
Figure 12 shows the computed acoustic attenuation, where the black colour denotes high exposure to noise. The aircraft position is depicted in red. For the FM-BEM result, the maximum is a factor of ≈3 larger and goes way beyond 0.6 for the black areas of the contour plot.
Figure 13 shows the attenuated levels on the decibel scale. If the diffraction correction is switched off, nothing is visible below the aircraft for this configuration and so the ray-tracing result in
Figure 13 (computed with the Maggi–Rubinowicz correction) can be described as much improved. However, the shielding is still over-predicted by some margin in comparison to the FM-BEM benchmark. Nevertheless, some similarities are visible for the ray-tracing, especially when comparing to the SPL result in
Figure 9. These similarities are summarised as follows: most acoustics reaching the ground is found at the sides (
y-extremity) and downstream of the aircraft, and also, there is a large acoustic shadow visible upstream of the aircraft.
6. Discussion
In this work, installed fan noise simulations of a medium-sized supersonic business aircraft were performed for subsonic flight points. Naturally, high Mach numbers at the inlet in combination with fully shielded noise for the aircraft’s top engine made low fidelity methods unworthy of serious consideration. We have seen that ray-tracing simulations can be used as a starting point but have to be fine-tuned, because such “first shot” simulations cannot be relied upon for predicting the absolute noise levels. Perhaps, most of the differences in the attenuation pattern could be attributed to the source description and flow non-uniformity at a nacelle. Therefore, our DG/FM-BEM coupled approach with a fully resolved near-field was applied for obtaining noise signatures. For the sideline flight point, where the engine operates close to its maximum thrust, the peak ground noise level was calculated to be 65 dB at ≈200 m. The SPL levels appear to be relatively low (for a jet aircraft) but one has to bear in mind that the results were obtained for one fully shielded engine only. Furthermore,
Figure 11 showed the importance of noise shielding at the source where significant noise reduction was obtained towards the ground in comparison to unshielded parts. If this proves to be such an effective noise mitigation measure, the fully shielded top engine could be programmed for more thrust while the other two engines could operate in the acoustically optimal regime. The noise emissions for the programmed thrust lapse rate (PLR) were highly directional and, judging from the footprint in
Figure 10, also less noisy versus that point along the standard path.
So far, the backward fan noise radiation has been omitted on the basis of a conjecture of its low importance for a relatively low bypass engine followed by a flow mixer and a very long duct which has enough space to fit acoustic liners. Moreover, with the absence of shielding, the backward noise radiation can be estimated using simplified models. Therefore, the forward fan noise shielding of over-wing or top mounted engines is of high interest and relevance for such SST planforms. The authors anticipate that it may be necessary to deviate from a low Mach number assumption for the far-field propagation for certain flight points. This is not regarded as a fundamental restriction of the BEM method; as, for instance, the acoustic pressure and velocity fluctuations are known at the source and various methods exist to predict far-field acoustics using a high-subsonic uniform flow correction. Thus, an advanced alternative to Taylor’s transformation [
13] could be tested only if such a formulation is highly suitable for the FMM. For example, Liu et al. [
14] recently published their version of the FMBEM based on the plane wave expansion of Green’s function, which is generally applicable in a subsonic uniform flow.

 ,
, 


