Article

A Methodology for Allocating Incremental Resources in Single-Airport Time Slots

1
College of Civil Aviation, Nanjing University of Aeronautics and Astronautics, Jiangjun Road No. 29, Nanjing 211106, China
2
State Key Laboratory of Air Traffic Management System, Nanjing 210007, China
*
Author to whom correspondence should be addressed.
Aerospace 2023, 10(9), 772; https://doi.org/10.3390/aerospace10090772
Submission received: 24 July 2023 / Revised: 28 August 2023 / Accepted: 30 August 2023 / Published: 31 August 2023

Abstract

:
Air carriers shall not readily relinquish their held flight slots. In cases where the historical flight slot pool cannot be easily altered, a pressing need arises for an allocation method that can efficiently utilize the incremental resources of these time slots. This paper presents an integer planning model to address the efficient allocation of incremental airport time slot resources. The model considers the capacity of key resource nodes and flight waveforms as constraints to maximize the total incremental slots. Moreover, it considers the adaptation of strategic and tactical optimization. After conducting a case study using Beijing Capital International Airport for verification, the proposed model effectively reduces potential operational delays by 66.27% while adding 366 to 397-time slots. Notably, the model demonstrates remarkable delay reduction capabilities and can serve as a valuable decision-support tool for the incremental allocation of time slots.

1. Introduction

Presently, approximately 200 airports worldwide need a substantial shortfall in capacity to meet the demands of air carriers [1], with more than 20 of these airports in China. These airports serve as vital links in the global air transport system. The escalating demand for aircraft and passenger movements at these crucial junctures implies an impending and grave disparity between airport capacity supply and the burgeoning demand.
The imbalance between the supply of airport capacity and the soaring requirements of air carriers stands as a bottleneck to the efficient expansion of civil air transport. Annually, this incongruity exacts a significant toll, costing air carriers, passengers, airports, and other airspace users billions of dollars in delays. Consequently, the sole sustainable solution to fundamentally address the aforementioned supply-demand imbalance is undertaking capacity expansion projects on the supply side. This entails augmenting capacity at key resource nodes within airports, such as terminal area corridor entrances, runways, terminals, and parking positions, thereby bolstering capacity supply.
Slot incremental resources refer to the additional slot resources allocated by the airport following capacity adjustments made through capacity assessments. Recently, there has been a proposal for hardware capacity expansion programs, such as enhancing flight area capacity and optimizing airspace structure, targeting key resource nodes in the terminal areas of China’s airports. This proposal aims to meet the urgent need for an allocation method of flight slot resources to accommodate the ever-increasing demand for flight traffic at hub airports, considering the capacity enhancements.
In contrast, China’s current approach to slot coordination primarily relies on the published capacity of an airport as the sole reference for setting coordination parameters. This approach overlooks other instantaneous capacity flow imbalances resulting from typical flight traffic characteristics, leading to an inability to quantitatively assess the expected delays using slot coordination instruments completed at the strategic stage. Therefore, a more efficient allocation methodology for incremental slot resources is necessary to address the absence of changes to historical flight schedules (for which airlines do not waive their grandfather rights). Such a methodology should provide scientific decision support for managing and optimising slot resources.

2. Literature Review

Currently, the primary tool employed for airport demand management is moment-to-moment coordination, aimed at achieving an optimal equilibrium between demand and capacity. This coordination is carried out strategically, involving collaborative efforts between airports, control units, and air carriers [2,3,4]. As early as 1987, Odoni [5] systematically explained the significance of air traffic flow management and proposed a ground waiting strategy to mitigate air delays. Air traffic control units would implement a ground waiting strategy for scheduled departures that may experience congestion or long delays during the voyage to avoid congested periods. For such predictable congestion scenarios, the planned departure times of flights can be corrected by analysing and predicting the correspondence between traffic flow and time slots, evaluating the capacity of departure airports and key waypoints in the voyage and destination airports, and applying the allocation of reasonable flight times.
Over time, the flight schedule optimisation model has evolved from a single-objective optimisation problem, primarily focused on minimising time offsets or expected delays, into a multi-objective optimisation approach considering various factors simultaneously. Paola and others [6] designed a single-objective flight time optimisation model considering airport capacity and airspace sector constraints as limiting factors. The primary goal was to minimise the total flight time offset. They employed an iterative local search algorithm to allocate flight times for a single day. As guidelines for administrative steps in international flight time allocation were proposed, scholars introduced constraints that conform to priorities and administrative regulations based on the original flight time optimisation model. Zografos and others [7] utilised airport capacity, represented by time slots and days, and flight turnaround time as constraints. They introduced the concept of the priority of time application, following the global airport time allocation guidelines suggested by the International Air Transport Association (IATA) and the European Union’s time management rules. Their work established an integer linear programming model and employed a linear relaxation algorithm to allocate time slots for an entire navigation season for a single airport. Corolli and others [8] applied IATA’s rules to reduce deviations between requested and allocated slots while considering airport capacity constraints. Pyrgiotis and Odoni [9] proposed a demand smoothing (DS) model to minimise any flight’s maximum and total offsets. Their approach considered flight duration, passenger connectivity, and capacity and transit time constraints. Ribeiro and others [10] developed a model based on IATA slot allocation guidelines. The model demonstrated its ability to effectively utilise the announced capacity of airports, providing better satisfaction to air carriers when compared with actual allocation results. Androutsopoulos and others [11] formulated the airport slot allocation problem as a bi-objective resource-constrained project scheduling problem featuring partially renewable resources and a non-regular objective function. They proposed a novel hybrid heuristic algorithm to solve this problem. Zografos and others [12] devised two bi-objective flight slot coordination allocation models, aiming to minimise both the total scheduled offsets and the maximum acceptable offsets. Their findings indicated that slightly sacrificing slot coordination efficiency can significantly enhance the airline’s acceptance of slot coordination.
As research has delved deeper into the subject, scholars have turned their attention to the issue of fairness in allocating slots [13,14,15]. Jacquillat [16] improves on the previous model [17] by introducing a new airport scheduling intervention approach. This method minimises schedule shifts normalised by the number of requests from each airline, thereby considering airline fairness and on-time performance. Zografos and others [12] developed a bi-objective flight time allocation model for the single airport flight time optimisation problem that considers both fairness and operational efficiency. The model introduces a fairness measure for the allocation of slot resources, assumes a correlation between the total slot offsets and the number of slots requested by an air carrier, and solves the model using the ε -constraint method. Later, Jiang and others [15] construct a bi-objective flight time allocation model that considers schedule offsets and fairness, building on the research of Zografos and others. They discover that sacrificing a small amount of slot offsets can significantly enhance fairness. Fairbrother and others [18] propose a two-phase scheduling mechanism for congested airport slots. The mechanism encompasses both efficiency and fairness objectives. A fair schedule is constructed in the first phase, incorporating a novel fairness metric. The second stage involves adjusting the schedule to align with the airlines’ priorities. Tan and others [19] introduced a comprehensive three-objective airport cluster co-optimization model that encompasses the concerns of flight scheduling, airlines, and airports, while taking fairness into account. This model not only addresses the fundamental operational limitations of airports but also establishes distinct adjustment thresholds to fulfill the scheduling preferences outlined by IATA. The outcomes of this model demonstrate that enhanced flight scheduling can notably mitigate flight congestion. Moreover, by considering the equilibrium between airline and airport fairness, a more equitable scheduling outcome can be achieved. Zeng and others [20] introduced a data-driven single-airport flight schedule optimization model that emphasizes real operational efficiency and airline considerations. This model enhances flight regularity, diminishes real operational delays, and aligns with airlines’ scheduling preferences. Its primary objective is to minimize the disparity in total execution time within the airlines’ acceptable adjustment boundaries.
Most of the papers above focus on proposing optimization solutions for existing flight schedules or examining the fairness of flight schedule allocation primarily from the airlines’ perspective. However, a limited amount of research explores the allocation methods of incremental schedule resources from the viewpoint of air traffic managers. Given the direction of civil aviation development, there exists a need for more research on the utilization of existing incremental slot resources and a lack of slot allocation methods that cater to the practical operational aspect of the problem.
Considering the research gap, an integer planning model, that addresses the capacity assessment phase and the slot assessment increment for a single airport slot increment, was proposed. The model consists of a single-objective optimization approach for allocating airport slot increment resources, comprising resource and task models. To evaluate the efficiency of the allocation, two evaluation indexes, delay time and capacity satisfaction of key resource nodes, were established. To validate the effectiveness of the proposed method for a single airport increment, simulation experiments, using the single airport slot increment model, were conducted. Additionally, the effects under different increment methods were compared to gauge their respective performances.

3. Single Airport Slot Incremental Resource Allocation Model

3.1. Notion

This section introduces a comprehensive single-airport slot incremental resource allocation model that can be adapted to suit various types of master coordination airports. To facilitate clarity and comprehension, definitions for the sets, parameters, and variables that feature in the mathematical model were provided in Table 1.
Before building the relevant model, the following hypothesis statement is proposed concerning the relevant domestic industry specification in order to make the problem more realistic and easier to solve:
  • A flight time is not a free point in time, but a specific time slot usually of 5 min. Multiple take-off or landing flights can be scheduled within a single time slot [9].
  • Aircraft flight times and taxi times within the terminal area are derived from historical data of actual operations and do not take into account aircraft taxiing conflicts or conflicts within the terminal area airspace.
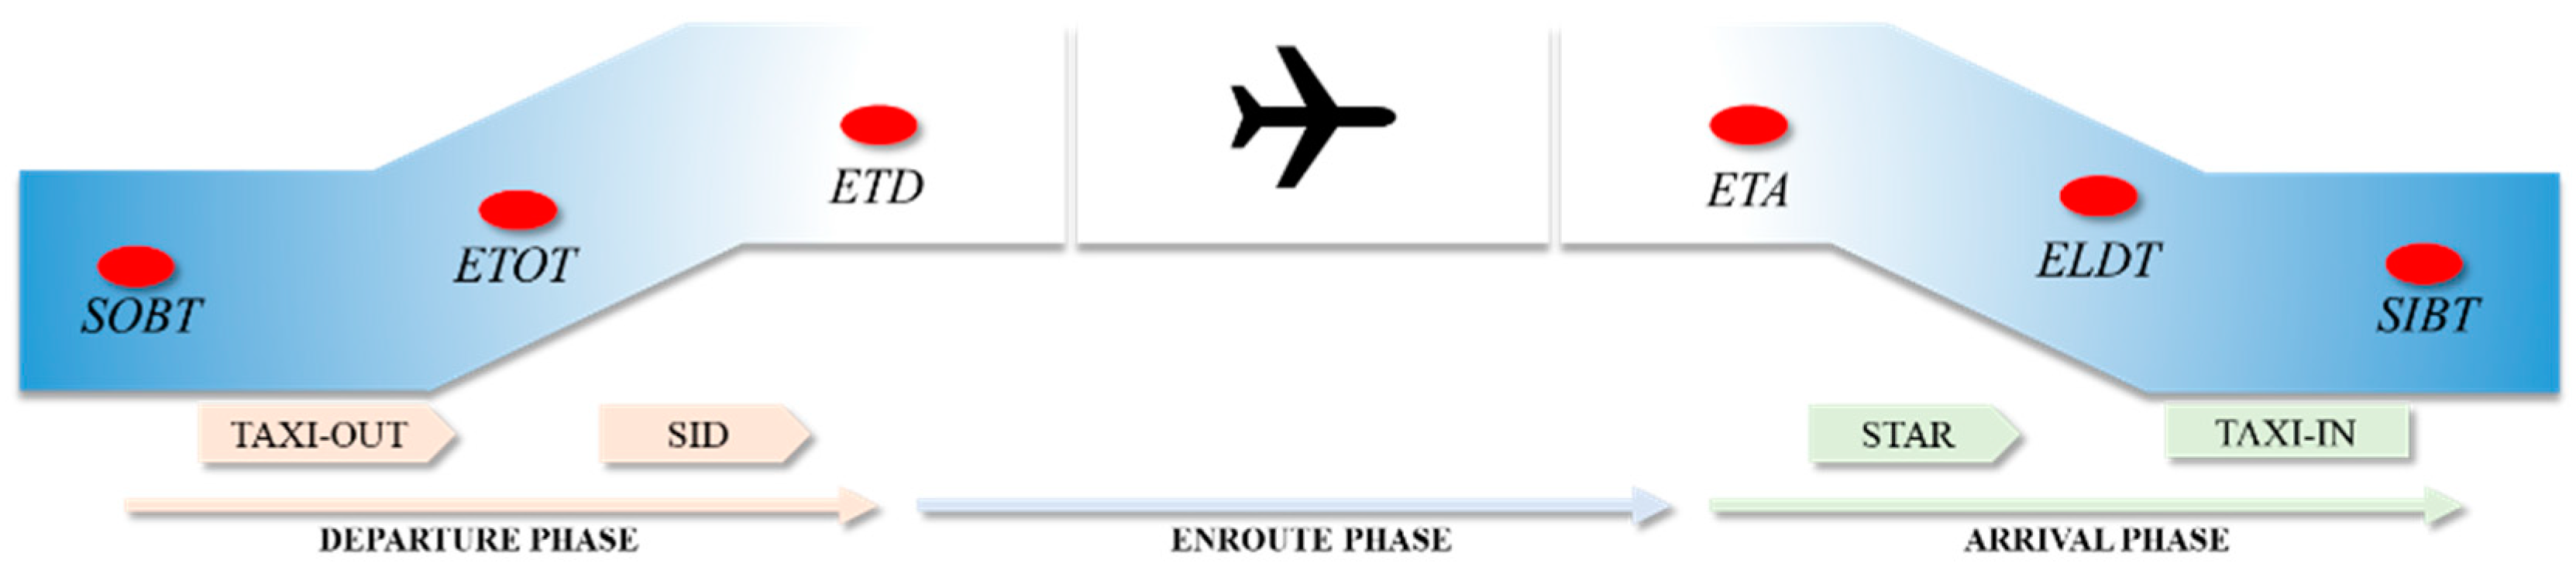
  • The time of day allocated to each flight is the slot time, for take-off flights it is the withdrawal block time and for landing flights it is the upper block time.
  • The time of an existing flight assignment cannot be adjusted.

3.2. Resource Model

In this section of the study, the primary focus is to analyze the distinct characteristics of critical resources at individual airports unaffected by the surrounding air route network. The scope of the study primarily encompasses critical resource nodal resources and key resources. In particular, key resources encompass slot, runway, and corridor resources.

3.2.1. Time Resources

Flight time resources refer to the available take-off and landing time slots that aircraft can utilize within a specific period. In this paper, time resources are categorized into two types: historical time resources and new time resources. Historical time resources are defined as the daily flight schedule formed by dismantling the flight schedule of the previous season. Please refer to Table 2 for a detailed representation of historical time resources. These historical time resources are a foundation for allocating slot resources in the current planning phase. The “Callsign” column provides the distinctive call sign assigned to each flight. In the “Aircraft” column, the aircraft type for each flight is indicated. For instance, the entry “737” in the first line corresponds to a Boeing 737 aircraft type. The “Date” column specifies the flight schedule period. In the first line, “.2....” indicates that the flight is scheduled exclusively on Tuesdays. Similarly, “.2345...” signifies that the flight operates on Tuesdays, Wednesdays, Thursdays, and Fridays. The “Terminal1” and “Terminal2” columns denote the departure and arrival airports of the flight, respectively. “Time1” and “Time2” represent the planned departure time at the take-off airport and the scheduled arrival time at the landing airport, respectively.
Since the flight slot is not a free point in time, but a specific time slot of typically 5 min, before building the model, to make the problem more realistic, define the time zone parameter τ :
τ = D a y , H o u r , M i n u t e ,   D a y 1 , 2 , .. , 7   ,     H o u r 0 , 1 , 2 , .. , 23 ,     M i n u t e 0 , 5 , 10 , .. , 55
For each historical flight slot s i , t at an airport, defined here as having S i historical flight slots at an airport, the set of historical flight slots is described as
S = s 1 , t , s 2 , t , , s i , t i = S i , t τ
where the set of departure slots is S D and the set of approach slots S A , which are related to the set of historical flight slots, is:
S = S A S D
Define the set of incremented flight times S by adding S j new flight times.
S = S s 1 , t , s 2 , t , , s j , t j = S j ,   t τ

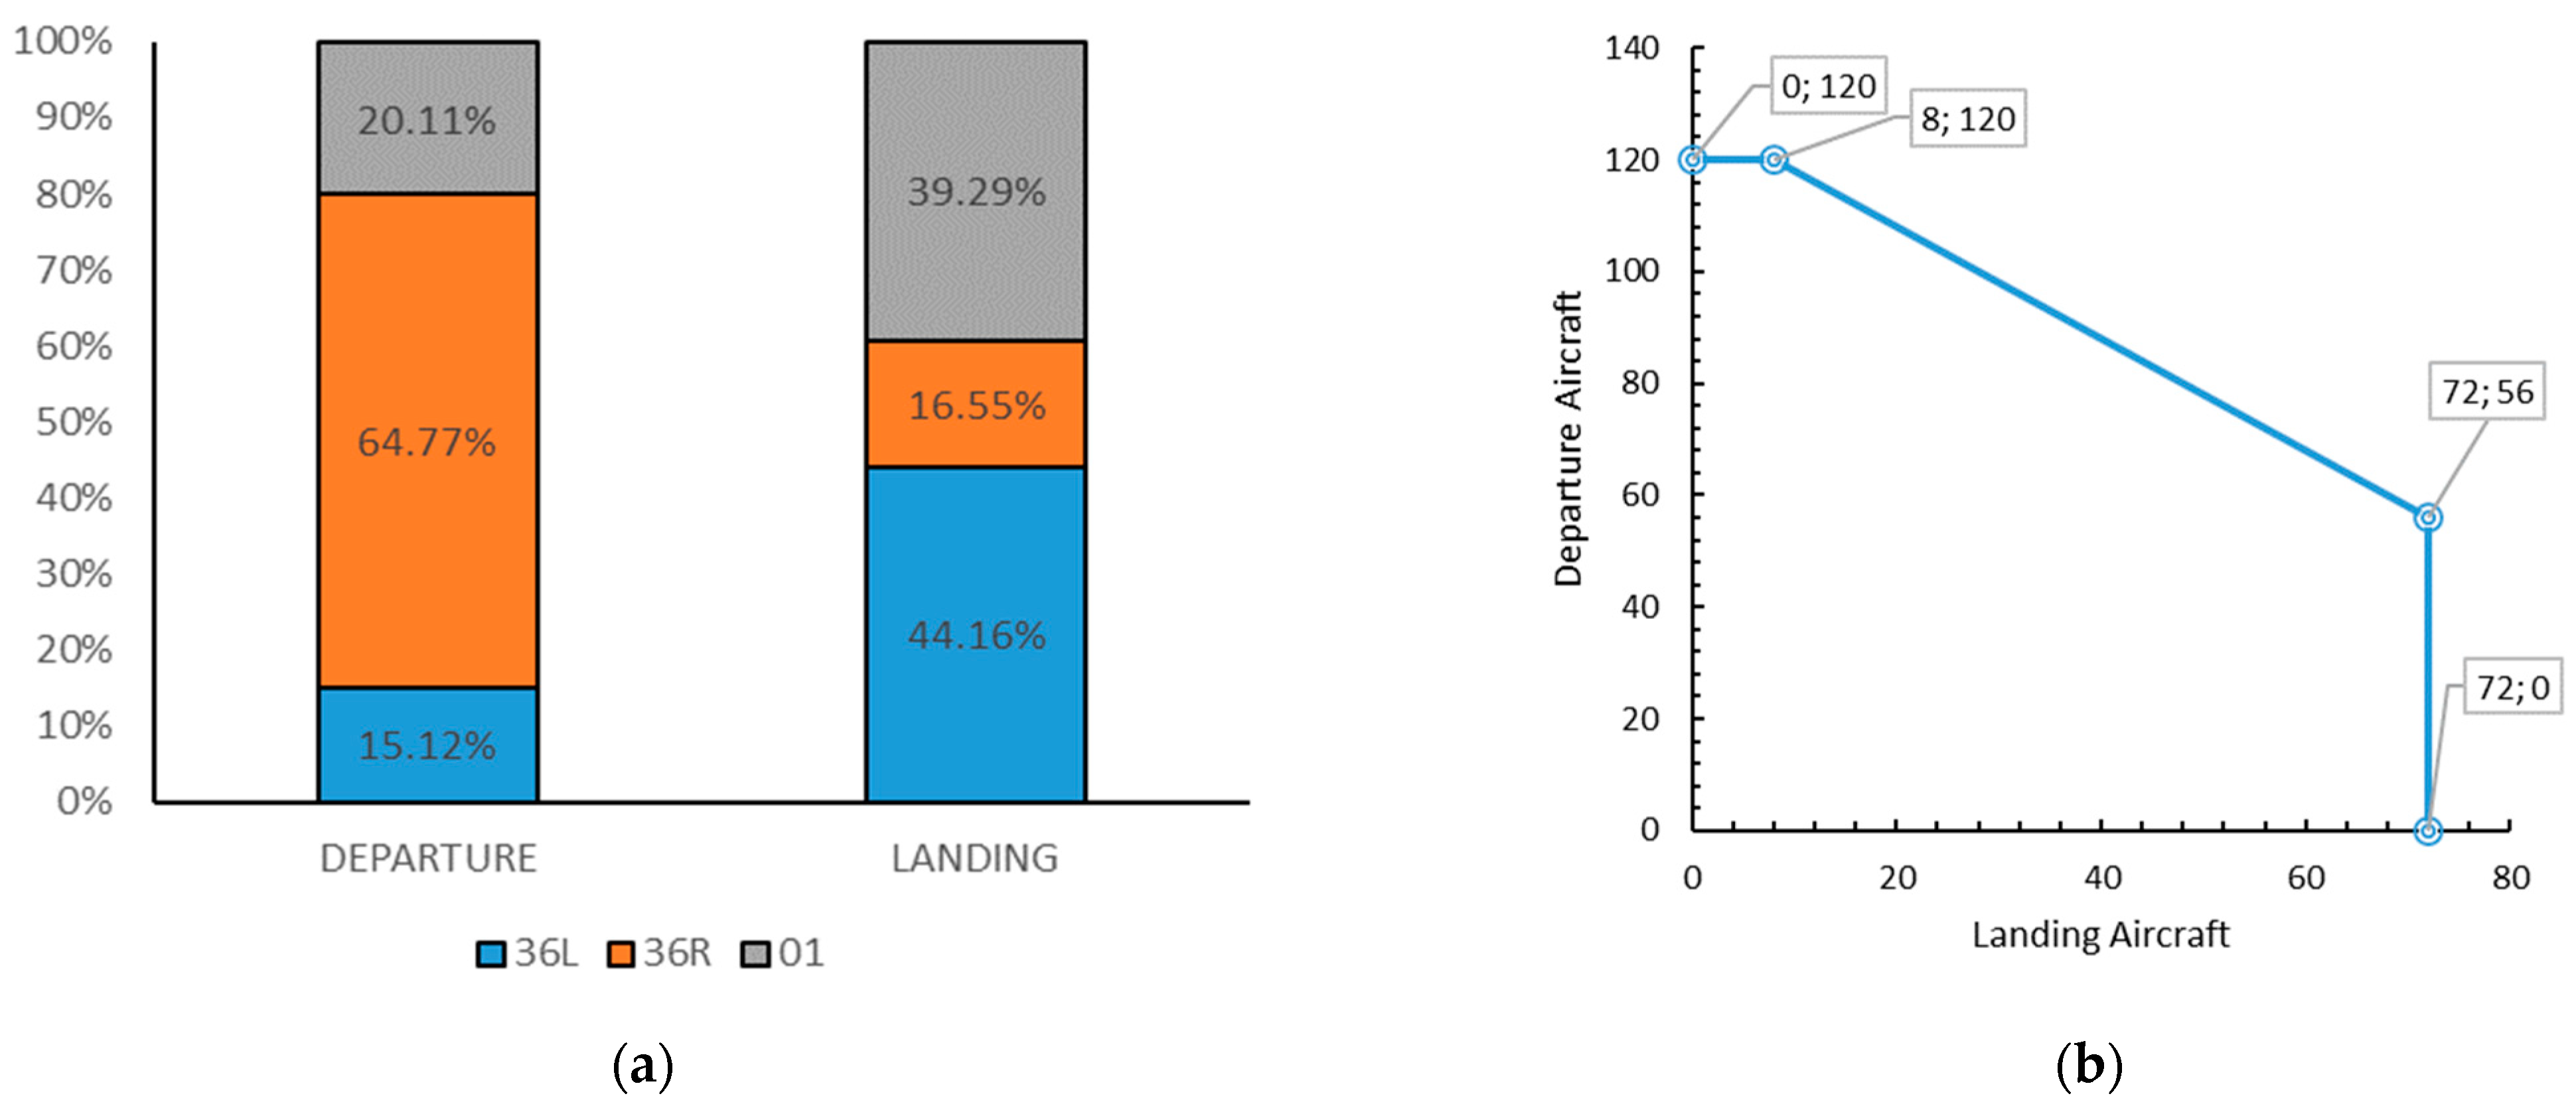
3.2.2. Runway Resource

Airport runways play a crucial role as essential facilities for aircraft take-off and landing operations. Often, they represent one of the critical bottleneck resources within the airport terminal area. The capacity of an airport’s runways significantly influences the overall capacity of the terminal area. By increasing the number and length of runways, the airport’s throughput capacity can be enhanced, leading to a reduction in airport congestion.
Primary medium to large airports worldwide commonly adopt either a single runway configuration or a multiple runway system (comprising two or more runways). The runway operation mode in single-runway airports is relatively straightforward, and the runway is notably affected by the prevailing local wind characteristics. The capacity of single-runway airports is primarily constrained by the runway’s operational direction and spacing standards. On the other hand, multi-runway systems involve various factors that influence runway capacity. These factors include the number of runways, configuration, spacing, operating patterns, and control spacing standards. These combined factors collectively determine the overall runway capacity in multi-runway airports. When preparing flight plans, it is crucial to consider the impact of runway resources fully. Proper consideration of runway capacity and operational constraints ensures efficient and safe airport flight operations, at single or multiple runways.
Classifying the runway systems in the country, a runway resource model can be constructed as follows:
It can be assumed that an airport has K runways and G runway operating modes, and the set of runways is described as
R = r k , k = 1 , , K
The running pattern of the runway is described as
M = M g g = 1 , , G
The mode of operation M g for each runway can be described as a triplet.
M g = D E P g , A R R g , M ¯ d g , M ¯ a g , M ¯ m g ,   g = 1 , , M n
where, for an airport A R R g is the set of approach runways corresponding to runway pattern M g , D E P g is the set of departure runways corresponding to runway pattern M g , and M ¯ d g , M ¯ a g , M ¯ m g is the upper limit of departure, approach and mixed runway capacity corresponding to runway pattern g . For example, if an airport has three parallel runways 01L/19R, 18L/36R and 18R/36L, the set of runways at this airport is
R = 01 L , 18 L , 18 R , 19 R , 36 L , 36 R
Example: A runway pattern at an airport is
M g = 01 L , 36 L , 36 R , 01 L , 36 L , 120 , 71 , 130
The equation describes runway operation mode M g , where runways 01L, 36L, and 36R are utilized for departures, and runways 01L and 36R are used for approaches. The hourly capacity of the runway under this operation mode is specified as 120 for approaches, 71 for departures, and 130 for mixed (both approach and departure) movements. Given that the instantaneous runway capacity may vary due to factors like other airspace user activities, it is necessary to represent the upper limit of runway capacity for different time periods using a segmented function with time as the variable. Therefore, define M ¯ d g ( t ) , M ¯ a g ( t ) , M ¯ m g ( t ) , respectively, where t T , M g can be defined as
M g = D E P g , A R R g , M ¯ d g t ( t ) , M ¯ a g ( t ) , M ¯ m g ( t ) t T ,   g = 1 , , M n

3.2.3. Corridor Resources

Corridor entrances (terminal area approach and departure points) are composed of an approach corridor entrance, which is a designated point based on the airport’s standard instrument approach procedure navigation facility, and a departure corridor entrance, which is a designated point based on the airport’s standard instrument departure procedure navigation facility. For single-runway airports, each approach and departure corridor entrance corresponds to a runway; for multi-runway airports, each corridor entrance may correspond to a different approach and departure runway.
Assuming that an airport has H corridor entrances, define the set of corridor entrances as
W = w h h = 1 , 2 , , H
The maximum capacity of aircraft that can pass through each corridor entrance per unit time is w ¯ h .
The approach flight time matrix EAFT and the departure flight time matrix EDFT can be defined from the established runway set and corridor entrance set:
E A F T h k = W h , R k ,       k = 1 , 2 , , R k ,       h = 1 , 2 , , H
E D F T k h = R k , W h ,       k = 1 , 2 , , R n ,       h = 1 , 2 , , H

3.2.4. Parking Position Resources

Assuming an airport has L parking positions, define the set of parking positions as
P = p p l l = 1 , 2 , , L
Based on the established set of runways and parking positions, the arrival taxi time matrix EXIT and the departure taxi time matrix EXOT can be defined as
E X I T l k = R k , p p l ,       k = 1 , 2 , , R k ,       l = 1 , 2 , , L
E X O T k l = p p l , R k ,       k = 1 , 2 , , R k ,       l = 1 , 2 , , L

3.3. Task Model

3.3.1. Historical Flight Assignments

The analysis examined all aircraft operations, breaking them down into a comprehensive seven-day flight schedule. Each flight was converted into a flight task, with inbound flights categorized as “ARR” (arrivals) and outbound flights categorized as “DEP” (departures).
For an inbound flight, the countable key resource points that the aircraft passes through are the approach corridor entrance, the runway, and the parking position, which correspond to ETA, ELDT, and SIBT. For a departing flight, the countable key resource nodes it passes through are the parking position, the runway, and the departure corridor entrance, whose corresponding times are SOBT, ETOT, and ETD, as shown in Figure 1. Expanding the analysis of a flight’s approach process, the time for an approaching aircraft to pass through the approach corridor entrance is ETA, the average flight time from corridor entrance A to landing runway r is derived from EAFT, the landing time of approaching aircraft i at runway r is ELDT, the average taxiing time from runway to target parking position is derived from EXIT, and the wheel blocking time of approaching aircraft i at parking position p is SIBT.
The relationship between them is
S I B T i E X I T l k = E L D T i E L D T i E A F T h k = E T A i
For the above equation, S I B T i can be considered as s i of historical flight slots, so for each incoming flight task t a s k i A R R can be described as
t a s k i , t , l , k , h A R R = 1 , At   time   t   there   is   a   mission   to   land   on   runway   k   at   parking   bay   l   via   corridor   entrance   h 0 , otherwise
Similarly, the departure process of a flight is analyzed, the time of departing aircraft i at the parking position to remove the wheel block is SOBT, the average taxiing time from parking position p p l to the target runway r k (EXOT) is derived from the analysis of historical data, the take-off time of departing aircraft i at runway r k is ETOT, the average flight time from departure runway r k to corridor entrance w h (EDFT) is derived from the analysis of historical data, and the time of departing aircraft i passing through departure corridor entrance D is ETD.
In mathematical expressions, this can be described as
S O B T i + E X O T l k = E T O T i E T O T i + E D F T h k = E T D i
For each departing flight task t a s k i D E P , the following key resource points and their corresponding times can be described as:
t a s k i , t , l , k , h D E P = 1 , At   time   t   there   is   a   mission   to   take   off   runway   k   through   the   entrance   to   corridor   h via   parking   bay   l 0 , otherwise
Defined Task Set T A R R for inbound flights and Task Set T D E P for outbound flights.
T D E P = t a s k i , t , l , k , h D E P i D E P
T A R R = t a s k i , t , l , k , h A R R i A R R

3.3.2. New Flight Assignment

The new flight assignment refers to a flight assignment that involves incremental time, meaning that there are changes or updates to the scheduled times for the flights. In this context, A R R * and D E P * are defined as sets of new inbound and outbound aircraft, respectively.
Determine the model decision variables N n , t D E P and N n , t A R R , which indicate the addition of an entry or exit task at time t , respectively, in other words an additional entry or exit slot at time t .
N n , t A R R = 1   ,   a dd   an   entry   task   at   time   t 0   , otherwise           n A R R * ,   t τ
N n , t D E P = 1   ,   a dd   a   departure   task   at   time   t 0   , otherwise           n D E P * ,   t τ
For the subsequent effective constraint and solution of the model it is therefore defined here:
New entry slot set T A R R .
T A R R = N n , t A R R n A R R * ,   t τ
New departure slot set T D E P .
T D E P = N n , t D E P n D E P * ,   t τ
General entry slot assembly T ¯ A R R .
T ¯ A R R = T A R R T A R R
General departure time set T ¯ D E P .
T ¯ D E P = T D P E T D E P
The runway time set is composed of two subsets: the approach task runway time set and the departure task runway time set.
= a r r d e p = E L D T 1 , , E L D T i E L D T 1 , , E L D T n E T O T 1 , , E T O T i E T O T 1 , , E T O T n
The corridor entrance time assembly is composed of two parts: the inbound task corridor entrance time assembly and the outbound task corridor entrance time assembly.
= a r r d e p = E T A 1 , , E T A i E T A 1 , , E T A n E T D 1 , , E T D i E T D 1 , , E T D n

3.4. Binding Condition

3.4.1. Time Uniqueness Constraint

For the incremental slot set S , each additional task can only be assigned to at most one aircraft at a given time. In other words, an aircraft can only be scheduled for either an approach or departure task at any specific slot.
n = 1 n A R R * N n , t A R R 1
n = 1 n D E P * N n , t D E P 1

3.4.2. Entry and Exit Balance Constraints

When allocating incremental time resources, it is essential to maintain a balance between inbound and outbound slots to ensure smooth and efficient air traffic operations. To achieve this, a parameter known as “acceptable inbound and outbound slot difference” ( δ ) is introduced, setting a reasonable limit on the discrepancy between the number of inbound and outbound flight slots.
t τ n A R R * N n , t A R R t τ n D E P * N n , t D E P δ

3.4.3. Constant Coordination of Parameter Constraints

The time coordination parameters refer to the number of available flight slots within an airport’s capacity criteria for a specific 1 h or 15 min period. The 1 h capacity, approach capacity and departure capacity limit parameters h , h A R R and h D E P and the 15 min capacity, approach capacity and departure capacity limit parameters m , m A R R and m D E P are agreed here.
The airport hourly capacity constraints are as follows:
t M i n u t e t + 11 t a s k i , t D E P + t a s k i , t A R R + N n , t D E P + N n , t A R R h t M i n u t e t + 11 t a s k i , t A R R + N n , t A R R h A R R t M i n u t e t + 11 t a s k i , t D E P + N n , t D E P h D E P       ,     i   A R R D E P ,   n A R R * D E P *   ,   h H o u r
Airport 15 min capacity constraint are as follows:
t M i n u t e t + 2 t a s k i , t D E P + t a s k i , t A R R + N n , t D E P + N n , t A R R m t M i n u t e t + 2 t a s k i , t A R R + N n , t A R R m A R R t M i n u t e t + 2 t a s k i , t D E P + N n , t D E P m D E P       ,     i   A R R D E P ,   n A R R * D E P *   ,   m M i n u t e

3.4.4. Runway Operating Capacity Constraints

To obtain the airport runway peak service capacity and establish the envelope constraints for runway capacity, an assessment of historical peak service levels at airports using quantile-based regression was conducted [21].
The time elements in the runway time set are sorted and split, and re-sorted in ascending order according to the hour time zone and minute time zone to which they belong, and the re-sorted runway time set is ¯ . It is stipulated that all the elements in the set ¯ are divided according to the hour to obtain the subset ¯ 1 , ¯ 2 , ¯ H per unit time, and the extension can obtain the runway departure time set ¯ D E P and the runway approach time set ¯ A R R and their subsets. Specify that A denotes the number of elements in the set. Example: 1 , 3 , 5 , 6 , 7 , 99 , 88 = 7 , then the number of aircraft in each unit of time can be obtained H .
The runway capacity envelope constraint is proposed for different runway operation modes, which can be considered as the number of incoming tasks A R R and the number of departing tasks D E P per unit time t satisfying the envelope function M g R = f ( a r r , d e p ) as shown in Figure 2.
The runway capacity envelope constraint can be expressed as
M g R = ( a r r , 67 ) ,   a r r 24 d e p = 67 ( a r r , 5 a r r 6 + 87 ) , 54 a r r > 24         67 > d e p > 42 ( 54 , d e p ) ,   d e p 42 a r r = 54
The runway capacity envelope constraint can be derived as follows
( H A R R , H D E P ) M g , H R

3.4.5. Corridor Entrance Capacity Constraints

Applying capacity constraints to corridor entrances can effectively reduce the number of conflicts between inbound and outbound aircraft within the terminal area and alleviate the workload of air traffic controllers. The capacity of corridor entrances, denoted as parameter w ¯ h , is typically calculated based on the control intervals specified in the “area-approach handover agreements”.
w ¯ h = ( d h d e p v h L e v e l h d e p + d h a r r v h L e v e l h a r r ) T 0
where d h d e p is the transfer interval from approach control to regional control. d h a r r is the transfer interval from regional control to approach control. L e v e l h d e p and L e v e l h a r r are the number of handover altitude levels that can be used for approach and departure respectively. v h is the speed limit for aircraft crossing the corridor entrance.
The time elements in the corridor entrance time set are sorted and split, re-sorted in ascending order according to the hour time zone and minute time zone to which they belong, and the re-sorted corridor entrance time set is ¯ , which provides for the division of all elements in the set ¯ according to the hour to obtain the subset ¯ 1 , ¯ 2 , ¯ H per unit of time, which can be extended to obtain the time set ¯ h of the corridor entrance h and its time subset.
Corridor entrance capacity constraints are as follows:
¯ h w ¯ h ,       ¯ h = ¯ 1 , ¯ 2 , ¯ H H H o u r

3.4.6. Flight Waveforms Constraints

Comparatively, the airport operating delays using the platform-based structure of flight time allocation method are observed to be greater than those resulting from the peak-and-valley structure. Implementing the platform-based structure leads to a continuous increase in flight operating delays over time. On the other hand, adopting the peak-and-valley structure of the flight time allocation method is more effective in strategically reducing inherent delays during flight scheduling. It helps alleviate primary congestion and delays more efficiently [22]. Therefore, when considering historical flight schedules and creating post-incremental flight schedules, it is essential to constrain the flight waveforms based on the peak-and-valley structure.
To ensure adequate air traffic management and to minimize congestion, the capacity limit of the momentary coordination parameter should be set with consideration for troughing periods lasting at least one hour during three consecutive hours. To achieve this, the introduction of the troughing parameter ϕ is necessary.
t M i n u t e t + 47 t a s k i , t + 35 D E P + t a s k i , t + 35 A R R + N n , t + 35 D E P + N n , t + 35 A R R ϕ h , t M i n u t e t + 35 t a s k i , t D E P + t a s k i , t A R R + N n , t D E P + N n , t A R R = 3 h   t M i n u t e t + 47 t a s k i , t + 35 D E P + t a s k i , t + 35 A R R + N n , t + 35 D E P + N n , t + 35 A R R h ,   o t h e r w i s e     ,    
where i   A R R D E P ,   n A R R * D E P *   ,   h H o u r .

3.4.7. Total Daily Flight Slots Constraints

This paper introduces a novel metric to quantify the activity level at an airport, known as Daily Equivalent Hours (DEH). DEH is calculated by dividing the total number of daily flights by the maximum hourly capacity of the airport.
D E H = D a i l y   F l i g h t s A i r p o r t   H o u r l y   C a p a c i t y
The maximum hourly capacity of the airport is equivalent to the hourly coordination parameter of the airport.
For a given airport, the Daily Equivalent Hours (DEH) should remain constant within the same season, even when adjusting the total number of flight hours during the strategic phase. The DEH value should remain unchanged after incorporating incremental flight hours. Therefore, the total number of flight hours should be carefully managed to satisfy the total constraint for airports with incremental flight hours. Ensuring the constancy of DEH during strategic planning and incremental adjustments allows for consistent and efficient utilization of airport resources, maintaining a stable and optimal level of activity throughout the season.
  t τ n A R R * N n , t A R R + n D E P * N n , t D E P + S D E H h

3.5. Objective Function

A single-airport flight time increment model is developed to maximise the allocation of incremental slots while adhering to the constraints imposed by historical flight slots.
M a x   t τ n A R R * N n , t A R R + n D E P * N n , t D E P

3.6. Solution Algorithm

The single-airport slot incremental resource allocation model proposed in this paper is formulated as a linear integer programming model. To solve this model, the Gurobi 9.1.1 solver is employed, taking the airport’s historical slot schedule as the input for the model.

4. Efficiency Evaluation Indicators

4.1. Flight Delay

Flight delay time refers to the time difference between a flight’s scheduled departure or arrival time and its actual departure or arrival time. It occurs when the departure or arrival time is later than the initially planned time. In-flight operations, a certain degree of delay is often considered in the flight plan to account for potential uncertainties or unforeseen circumstances.

4.2. Capacity Fulfillment of Key Resource Points

In increasing the number of flight slots, it is necessary to consider runway and corridor opening capacity. As the main area for aircraft take-off, landing and taxiing, the limited capacity of the runway needs to ensure that it can meet the take-off and landing needs of the additional flights to avoid congestion and potential safety hazards among flights. At the same time, corridor entrances (terminal area approach and departure points) are also critical considerations. Corridor entrances, which include approach and departure corridor entrances, are critical points for the transfer of aircraft from regional airspace to approaches and departures.

5. Simulation and Validation of a Single-Airport Slot Increment Model

5.1. Experimental Data

This study uses Beijing Capital International Airport (ICAO four-character code: ZBAA) as an example. The slot schedule for the S23 season at ZBAA is taken as the baseline for the analysis. Some of the evaluation findings are utilized as the primary parameters. The single-airport slot incremental allocation model, designed in this paper, is then applied to allocate slot increments at the airport.
The terminal area of ZBAA is depicted in the schematic diagram shown in Figure 3. ZBAA’s main Standard Instrument Departure (SID) and Standard Instrument Arrival Route (STAR) flight procedures utilize seven departure corridor entrances: IDKEX, DOTRA, MUGLO, IG-MOR, ELKUR, RUSDO, and BOTPU. Additionally, five approach corridor entrances are used for arrivals: OSUBA, DUMAP, AVBOX, DUGEB, and GUVBA.
At ZBAA, three runways are operational: 36L, 36R, and 01. Among these, runways 36L and 01 are primarily used for landings, while runway 36R is predominantly used for take-offs. The runway approach and departure ratios are illustrated in Figure 4a, indicating the distribution of landings and take-offs on each runway. Figure 4b displays the runway system envelope, representing the maximum capacity of the three runways combined.
ZBAA has a total of 1748 available slots for the S23 season. The breakdown of the schedule into daily flight plans is depicted in Figure 5. The graph’s horizontal coordinate represents the date, while the vertical coordinate represents the number of slots allocated for each day.
After analyzing the historical operational data, the percentage of use for the corridor entrances and runways was obtained, as depicted in Figure 6.

5.2. Computer Simulation and Validation

In this section, the effectiveness of the developed single-airport slot incremental resource allocation model was evaluated. To do so, the Gurobi solver in a computer environment running Windows 10 was utilized. The computer specifications include an Intel Core i7 10700 processor with a clock speed of 2.92 GHz and 16 GB of RAM. The implementation of the algorithms is carried out on Python 3.9.0.
The study employs the fast-time computer simulation software AirTOp to conduct computer simulation experiments. The experimental group is set to use the model incremental algorithm, while the control group utilizes the Monte Carlo random incremental algorithm. Additionally, a blank control group that serves as the benchmark was set.
To ensure robust results, 100 computer simulations for each example were conducted. During the simulations, the flight volume and average delay for the entire day under each scenario were monitored and recorded. The output of the computer simulation allows us to analyze the example based on crucial indicators such as flight flow, operational delay levels, and capacity constraints of key resources.

5.2.1. Arithmetic Example Based on a Single-Airport Slot Incremental Model

In the initial stage of the study, ZBAA’s S23 flight schedule was analysed and Thursday’s flight plan was selected as the basic situation. This particular flight plan comprised 1128 flights, with 556 inbound and 552 outbound flights, as shown in Figure 7a. Computer simulations were conducted to assess the airport’s performance using this base case as input. The results revealed an all-day average delay of 2 min and 54 s in the terminal area of ZBAA. Moreover, the average departure delay was 4 min and 9 s, while the average approach delay was 1 min and 40 s. Additionally, during the peak hour of 0600-0100(+1), the flight time utilization rate was calculated to be 67.52%.
Using the Gurobi solver, the single-airport slot incremental resource allocation model was successfully solved, resulting in a flight schedule after the increment. The allocation process generated 449 incremental slots, comprising 262 departure slots and 187 approach slots, as shown in Figure 7b. Following the increment, the slot utilization rate during the peak hour (0600-0100(+1)) reached an impressive 96.53%. The average delay experienced during this peak hour was 5 min and 46 s. The average departure delay was 7 min and 4 s, while the average approach delay was 4 and 50 s for the entire day in the terminal area. Overall, the average delay in the terminal area for the whole day after the increment was 5 min and 46 s, indicating a noticeable improvement in operational efficiency. The results also demonstrate reduced average departure and approach delays, reflecting the effectiveness of the incremental slot allocation in optimizing air traffic flow and resource utilization at ZBAA.

5.2.2. Monte Carlo Simulation Based Validation Algorithms

Monte Carlo simulation is a simulation count based on stochastic probabilistic statistics for modelling the behaviour and outcome of stochastic phenomena. In this example, all flights of the existing flight plan are randomly incremented by Gaussian stochastic process, the number of slot increments is 449, and the number of simulations is 11. Moreover, the computer simulation software is used to solve the flight plan after all the increments, and the output is analysed and shown in Table 3.

5.3. Results Analysis

The relationship between operating delay and flight volume for each case can be obtained, based on the above examples in Figure 8, from which it can be seen that the level of delay for the modelled incremental case is significantly smaller than that for the stochastic incremental case.
Through simulation, the base case corridor entrance flows and the post-incremental corridor entrance flows can be obtained. Figure 9a displays the base case corridor entrance flows, while Figure 9b shows the corridor entrance flows after applying the model increment. The simulation results indicate that the corridor entrance flows after the increment satisfies the capacity constraints of each key resource node. This suggests that the incremental slot allocation model effectively manages the allocation of flight time resources, ensuring that the capacity constraints of critical resources, such as corridor entrances, are met.
100 model increments for the initial 1128 flight volume, resulting in an average flight volume after an increment of 1509.84. To ensure a fair comparison, random increments were used to maintain the control group’s flight volume at the same level as the experimental group. Subsequently, the flight schedules were used as input for both groups into the simulation software to conduct the experiments and analyze the delay levels. The output results are presented in Table 4. The findings reveal that the average delay of the whole-day operation for the model incremental case was lower than that of the random incremental case. The model incremental approach significantly reduced potential delays by 66.27%.

6. Conclusions

This study commences by scrutinizing the resource nodes within hub airports and terminal regions. Subsequently, it formulates an incremental slot model tailored to single airports, derived from fundamental parameters of pivotal resources. This model primarily emphasizes the maximization of incremental slots, while concurrently taking into account the capacity of corridor entrances. The construction of constraints in the model also considers the balance between approach and departure, slot coordination parameters, and flight waveforms characteristics, all aimed at enhancing flight connectivity and reducing innate delays. To validate the effectiveness of the proposed model, simulations are carried out at Beijing Capital International Airport as a case study. The results demonstrate that the proposed model outperforms the stochastic incremental model significantly. Specifically, it can effectively reduce potential operational delays by an impressive 66.27% while adding 366~397 slots. The constraints introduced in the model exhibit sound reasoning, and the model itself falls under the category of mixed integer linear programming. This places it as a decision support tool offering substantial interpretability and a more economical solution compared to non-linear models.
In terms of limitations, as this article discusses the configuration method of incremental moments from a strategic perspective, the situations discussed in the paper do not include, but are not limited to, the decrease in the capacity of critical resource nodes in the terminal area due to activities of other airspace users, the increase in tactical-level flight conflicts caused by momentary flow imbalances within the terminal area, and the pre-tactical adjustments of pre-flight plans due to special weather conditions. All of the above-mentioned situations could potentially lead to discrepancies between the introduced taxi time parameters, flight time parameters, and actual operations in the article, thereby rendering the proposed model possibly ineffective.
Meanwhile, the incremental scheduling model proposed in this article assumes that the historical moments from the previous co-season remain unchanged. However, the varying strategic positioning of different hub airports due to their distinct characteristics may lead to shifts in the objectives of their future flight scheduling.
In this paper, the focus was primarily on the slot increment of a single hub airport. However, future work aims to expand the scope of this study to encompass multiple airports that have mutual effects on each other. By considering airspace coupling, the plan is to investigate and extend the proposed model to explore the coordinated incremental allocation of slots for multiple airports and airport clusters.

Author Contributions

Conceptualization, S.W. and M.H.; methodology, S.W.; software, Z.C.; validation, S.W. and X.Z.; formal analysis, X.Z.; data curation, S.W.; writing—original draft preparation, S.W. and X.Z.; writing—review and editing, S.W. and M.H.; visualization, S.W. All authors have read and agreed to the published version of the manuscript.

Funding

This research was funded by National Natural Science Foundation of China (No. 71971112).

Data Availability Statement

Not applicable.

Acknowledgments

We thank the State Key Laboratory of Air Traffic Management System for supporting this research.

Conflicts of Interest

The authors declare no conflict of interest.

References

  1. International Air Transport Association. Worldwide Slot Guidelines, 2022 ed.; International Air Transport Association: Geneva, Switzerland, 2022. [Google Scholar]
  2. Zografos, K.G.; Madas, M.A.; Androutsopoulos, K.N. Increasing Airport Capacity Utilisation through Optimum Slot Scheduling: Review of Current Developments and Identification of Future Needs. J. Sched. 2017, 20, 3–24. [Google Scholar] [CrossRef]
  3. Abeyratne, R.I.R. Management of Airport Congestion through Slot Allocation. J. Air Transp. Manag. 2000, 6, 29–41. [Google Scholar] [CrossRef]
  4. Wang, S.; Hu, M.; Zhao, Z.; Shu, J.; Zhu, X. Research on Flight Schedule Optimization Based on Different Runway Operation Modes. J. Phys. Conf. Ser. 2023, 2491, 012001. [Google Scholar] [CrossRef]
  5. Odoni, A.R. The Flow Management Problem in Air Traffic Control. In Flow Control of Congested Networks; Odoni, A.R., Bianco, L., Szegö, G., Eds.; Springer: Berlin/Heidelberg, Germany, 1987; pp. 269–288. ISBN 978-3-642-86728-6. [Google Scholar]
  6. Pellegrini, P.; Castelli, L.; Pesenti, R. Secondary Trading of Airport Slots as a Combinatorial Exchange. Transp. Res. Part E Logist. Transp. Rev. 2012, 48, 1009–1022. [Google Scholar] [CrossRef]
  7. Zografos, K.G.; Salouras, Y.; Madas, M.A. Dealing with the Efficient Allocation of Scarce Resources at Congested Airports. Transp. Res. Part C Emerg. Technol. 2012, 21, 244–256. [Google Scholar] [CrossRef]
  8. Corolli, L.; Lulli, G.; Ntaimo, L. The Time Slot Allocation Problem under Uncertain Capacity. Transp. Res. Part C Emerg. Technol. 2014, 46, 16–29. [Google Scholar] [CrossRef]
  9. Pyrgiotis, N.; Odoni, A. On the Impact of Scheduling Limits: A Case Study at Newark Liberty International Airport. Transp. Sci. 2016, 50, 150–165. [Google Scholar] [CrossRef]
  10. Ribeiro, N.A.; Jacquillat, A.; Antunes, A.P.; Odoni, A.R.; Pita, J.P. An Optimization Approach for Airport Slot Allocation under IATA Guidelines. Transp. Res. Part B Methodol. 2018, 112, 132–156. [Google Scholar] [CrossRef]
  11. Androutsopoulos, K.N.; Manousakis, E.G.; Madas, M.A. Modeling and Solving a Bi-Objective Airport Slot Scheduling Problem. Eur. J. Oper. Res. 2020, 284, 135–151. [Google Scholar] [CrossRef]
  12. Zografos, K.G.; Jiang, Y. A Bi-Objective Efficiency-Fairness Model for Scheduling Slots at Congested Airports. Transp. Res. Part C Emerg. Technol. 2019, 102, 336–350. [Google Scholar] [CrossRef]
  13. Katsigiannis, F.A.; Zografos, K.G.; Fairbrother, J. Modelling and Solving the Airport Slot-Scheduling Problem with Multi-Objective, Multi-Level Considerations. Transp. Res. Part C Emerg. Technol. 2021, 124, 102914. [Google Scholar] [CrossRef]
  14. Fairbrother, J.; Zografos, K.G. On the Development of A Fair And Efficient Slot Scheduling Mechanism at Congested Airports. In Proceedings of the 2018 Annual Meeting of the Transportation Research Board (TRB), Washington, DC, USA, 7–11 January 2018. [Google Scholar]
  15. Jiang, Y.; Zografos, K.G. A Decision Making Framework for Incorporating Fairness in Allocating Slots at Capacity-Constrained Airports. Transp. Res. Part C Emerg. Technol. 2021, 126, 103039. [Google Scholar] [CrossRef]
  16. Jacquillat, A.; Vaze, V. Interairline Equity in Airport Scheduling Interventions. Transp. Sci. 2018, 52, 941–964. [Google Scholar] [CrossRef]
  17. Jacquillat, A.; Odoni, A.R. An Integrated Scheduling and Operations Approach to Airport Congestion Mitigation. Oper. Res. 2015, 63, 1390–1410. [Google Scholar] [CrossRef]
  18. Fairbrother, J.; Zografos, K.G.; Glazebrook, K.D. A Slot-Scheduling Mechanism at Congested Airports That Incorporates Efficiency, Fairness, and Airline Preferences. Transp. Sci. 2020, 54, 115–138. [Google Scholar] [CrossRef]
  19. Tan, X.; Wang, S.; Zeng, W.; Quan, Z. A Collaborative Optimization Method of Flight Slots Considering Fairness Among Airports. Math. Probl. Eng. 2022, 2022, 1–18. [Google Scholar] [CrossRef]
  20. Zeng, W.; Ren, Y.; Wei, W.; Yang, Z. A Data-Driven Flight Schedule Optimization Model Considering the Uncertainty of Operational Displacement. Comput. Oper. Res. 2021, 133, 105328. [Google Scholar] [CrossRef]
  21. Zografos, K.G.; Androutsopoulos, K.N.; Madas, M.A. Minding the Gap: Optimizing Airport Schedule Displacement and Acceptability. Transp. Res. Part A Policy Pract. 2018, 114, 203–221. [Google Scholar] [CrossRef]
  22. Wang, S.; Yang, L.; Wang, Y.; Cong, W. A Data and Model-Driven Approach to Predict Congestion of Departure Traffic at Airport. In Proceedings of the 2022 Integrated Communication, Navigation and Surveillance Conference (ICNS), Virtual, 5–7 April 2022; IEEE: Dulles, VA, USA, 2022; pp. 1–15. [Google Scholar]
Figure 1. Aircraft operation flow chart.
Aerospace 10 00772 g001
Figure 2. Runway capacity envelope.
Aerospace 10 00772 g002
Figure 3. ZBAA Terminal Area and Runway Distribution.
Aerospace 10 00772 g003
Figure 4. (a) Approach and departure runway usage ratios and (b) runway system envelopes.
Aerospace 10 00772 g004
Figure 5. ZBAA Schedule Breakdown to Daily Flight Plan for S23 Season.
Aerospace 10 00772 g005
Figure 6. Proportion of corridor entrances and runways used.
Aerospace 10 00772 g006
Figure 7. (a) Flight Traffic Distribution of the Base Case and (b) Flight flow distribution after incremental modelling.
Aerospace 10 00772 g007
Figure 8. The relationship between operational delays and flight volume for each calculation case.
Aerospace 10 00772 g008
Figure 9. (a) Base case corridor flows and (b) Corridor flows after modelled increments.
Aerospace 10 00772 g009
Table 1. Main parameters and variables table.
Set
S Set of all original flight times
S Set after adding new slots
R n Set of runway operating modes
M g Set of runway running patterns
A R R g Set of approach runways corresponding to runway patterns M g
D E P g Set of departure runways corresponding to runway pattern M g
w Set of the entrance of the corridor
P Ste of parking position
T A R R Set of new entry slot
T D E P Set of new departure slot
T ¯ A R R Set of general entry time
T ¯ D E P Set of total departure time
Set of runway time
Set of corridor entrance time
Parameters
τ Time zone parameters
w ¯ h Maximum capacity of aircraft that can pass through each corridor entrance per unit time
E A F T Estimated arrival flight time
E X O T Estimated taxi-out time
E T A Estimated time of arrival
E L D T Estimated landing time
S I B T Scheduled in-block time
S O B T Scheduled off-block time
E T O T Estimated take off time
E T D Estimated time of departure
E T A Estimated time of arrival
E A F T Average flight time from corridor entrance A to landing strip r
E L D T Approach aircraft i landing time at runway r
E X I T Average taxi-in time from runway r to target stop p
S I B T Approach aircraft i in parking position p block wheel block time
E D F T Average flight time from take-off runway r k to corridor entrance w h
a r r Probability parameter for the use of parking positions by approaching aircraft per unit time
d e p Probability parameter for the use of parking positions by departing aircraft per unit of time
h 1 h capacity limit parameter
h A R R Approach capacity limit parameters
h D E P Off-site capacity limiting parameters
m 15 min capacity limit parameter
Variables
t a s k i A R R Every incoming flight task
t a s k i D E P Every departing flight assignment
N n , t D E P Model decision variables, adding an off-site task at hour t
N n , t A R R Model decision variable, adding an entry task at hour t
Table 2. Main parameters and variables table.
CallsignAircraftDateTerminal1Time1Time2Terminal2
CA1638737.2.....ZYTN08:4510:35ZBAA
CA108177F.2345..ZBAA02:0004:20ZSPD
CA11393211234567ZBAA17:0018:50ZBYC
CA12073191234567ZBAA09:5512:25ZLLL
CA13453301234567ZBAA15:3019:35ZJSY
Table 3. Results of validation algorithms based on Monte Carlo simulation.
Type of ResultAverage ValueStandard Deviation
Average delay throughout the day0:09:340:00:45
Average departure delay0:14:080:02:06
Average approach delays0:05:390:00:41
Table 4. Results of validation algorithms based on Monte Carlo simulation.
Arithmetic ExampleFlight VolumeAverage Delay throughout the Day
Base case11280:03:59
Model increment example1509.840:05:52
Random increment example1509.840:09:34
Disclaimer/Publisher’s Note: The statements, opinions and data contained in all publications are solely those of the individual author(s) and contributor(s) and not of MDPI and/or the editor(s). MDPI and/or the editor(s) disclaim responsibility for any injury to people or property resulting from any ideas, methods, instructions or products referred to in the content.

