Article

Airport Cluster Delay Prediction Based on TS-BiLSTM-Attention

1
College of Civil and Architectural Engineering, North China University of Science and Technology, Tangshan 063210, China
2
College of Civil Aviation, Nanjing University of Aeronautics and Astrnautics, Nanjing 211106, China
3
Air Traffic Control Center, China Civil Aviation Air Traffic Management Bureau in North China, Beijing 100621, China
*
Author to whom correspondence should be addressed.
Aerospace 2023, 10(7), 580; https://doi.org/10.3390/aerospace10070580
Submission received: 15 April 2023 / Revised: 16 June 2023 / Accepted: 19 June 2023 / Published: 22 June 2023
(This article belongs to the Special Issue Advances in Air Traffic and Airspace Control and Management)

Abstract

:
To conduct an accurate and reliable airport delay prediction will provide an important basis for the macro control of an airspace delay situation and the dynamic allocation of airspace system capacity balance. Accordingly, a method of delay prediction for target airports based on the spatio-temporal delay variables of adjacent airports is proposed in this paper. First, by combining the complex network theory, we first extract the topology of the airport network and create airport clusters with comparable network properties. Second, we develop the TS-BiLSTM-Attention mode to predict the delay per hour for airports in the cluster. As the spatio-temporal feature variables, the arrival delay of airport cluster-associated airports and the delay time series of landing airports are utilized to reach the conclusion. The experimental results indicate that the delay prediction predicated on clusters is superior to that based on data from a single airport. This demonstrates that the delay propagation law derived from cluster data based on spatio-temporal feature extraction can generalize the delay propagation characteristics of airports within clusters.

1. Introduction

A rise in air traffic has been observed in recent years, paralleling the expansion of both the national economy and the civil aviation transportation sector. For this reason, airport delays have become a major drain on the global economy and a challenging issue for the aviation industry to resolve. Due to the complexity of the air transportation network, flight regularity management is required. How to effectively explore the delay pattern of an airport network, precisely deduce the spatial and temporal evolution trend of a delay, and macroscopically control the propagation law of delay have thus become crucial subject matters to address.
Numerous studies have been conducted on the topic of airport delays, both domestically and abroad. Some researchers have utilized traditional machine learning algorithms such as Decision Tree, Random Forest, Bayesian networks, and Linear Regression to predict delays [1,2,3,4,5]. While conventional algorithms are simpler to interpret, they invariably lack accuracy and are not sufficiently effective at predicting delays. Due to the exponential growth of airline data, these algorithms are also confronted with massive flight data, resulting in computational bottlenecks. In addition to the extensive use of Big Data Mining Technology, neural network algorithms are also widely employed in the civil aviation industry. Through multiple models’ combination based on the deep learning paradigm, Reference [6] proposed a Long Short-Term Memory (LSTM) recursion neural network, and demonstrated that the prediction accuracy was improved with the deepened structure; to solve the coding issue in delay prediction, Reference [7] proposed a multiple layer artificial neural network to predict the airport delay of JFR Airport; Reference [8] designed and proposed a method combining a deep belief network and support vector regression to predict the airport delay of PEK-HGH; References [9,10,11] designed a Long Short-Term Memory (LSTM) network and its improved algorithm to achieve delay prediction, and achieved a satisfactory prediction result; Reference [12] applied the Graph Convolutional Neural Network (GCN) delay prediction method to explore the spatial interaction hidden in an airport network. The results show that deep learning based on graph structure input has a great potentiality in air traffic delay prediction; concerning the causality of flight delay propagation between airports, Reference [13] studied flight delay prediction standing at the perspective of an airport network, and established a DGLSTM depth learning framework based on 4-year historical data of 325 airports in the United States, and its accuracy and robustness is more competent than current popular methods; Reference [14] established a flight departure time prediction model based on deep learning with analyzing the influences of different factors on flight departure time; Reference [15] established the method of delay prediction for the whole process of transit flights, constructed an unbalanced data classification model, identified delayed flights at each prediction guarantee node, and achieved an accurate recognition rate of 96.5% for delayed flights; and Reference [16] established the airport delay prediction model based on the airport network method. Researchers established clustering models on the characteristics of multiple airports’ networks, and concluded that the model based on Betweenness Centrality realized a satisfactory prediction effect through experimental comparison and verification.
The above researchers have conducted certain research and achieved fruitful research achievements on the prediction of an airport delay, mainly involving the innovation of an algorithm and the application of an airport network for delay prediction. In terms of the algorithm, they propose to integrate the long- and short-time recursion memory network, multilayer artificial neural network, deep belief network, and support vector regression; apply an intelligent optimization algorithm to optimize the parameters of a traditional BP neural network; and adopt other advanced algorithm structures to analyze the airport delay prediction. In terms of the airport network, many scholars have demonstrated that the integration of the input of the graph structure and the network eigenvalues can improve the accuracy of the delay prediction based on theoretical innovation, of which the integration of the airport delay prediction and the network structure of the airport network is the latest research direction.
Generally speaking, the methods related to flight delay prediction in the past are mainly focused on the improvement of the algorithm itself. However, the complexity of flight delay propagation and the space correlation of adjacent airport delays failed to attract sufficient attention. For during the process of airport delay transmission, this paper proposes a method to capture the regularity of the delay propagation of adjacent airports based on the time and space correlation transmission of a delay in the aviation network. In addition, this paper also proposes a new data set construction method, which can not only build airport cluster data sets with similar delay patterns, but also increase the robustness of the prediction set and capture the inherent mechanism of delay propagation from high dimensions. This plays a key data support role in improving the prediction accuracy. Meanwhile, this paper proposes a bidirectional long-term and short-term memory network BiLSTM that integrates the Attention mechanism to distinguish the impact of different characteristic variables on the delay of the target airport, which can selectively capture the key features that influence the delay under multi-dimensional complex and disordered time and space variables, ignoring the interference of secondary factors on the prediction results. Finally, the structural stability of the data sets and the prediction accuracy of the method and the traditional algorithm are compared through establishing different prediction models under different data sets, which verifies the effectiveness of the method proposed by this paper.
The core content of this paper includes that of Section 2, the introduction on the concept and construction method of an airport cluster, as well as the time and space correlation analysis of delay in the airport network transmission; Section 3, the introduction of relevant algorithm concepts, the algorithm structure and the extraction and analysis process of characteristic variables, and how to build the TS-BiLSTM-Attention model and data processing process; Section 4, the stability of the airport cluster data set proposed in this paper and the prediction accuracy of the algorithm are verified by a case analysis; and 
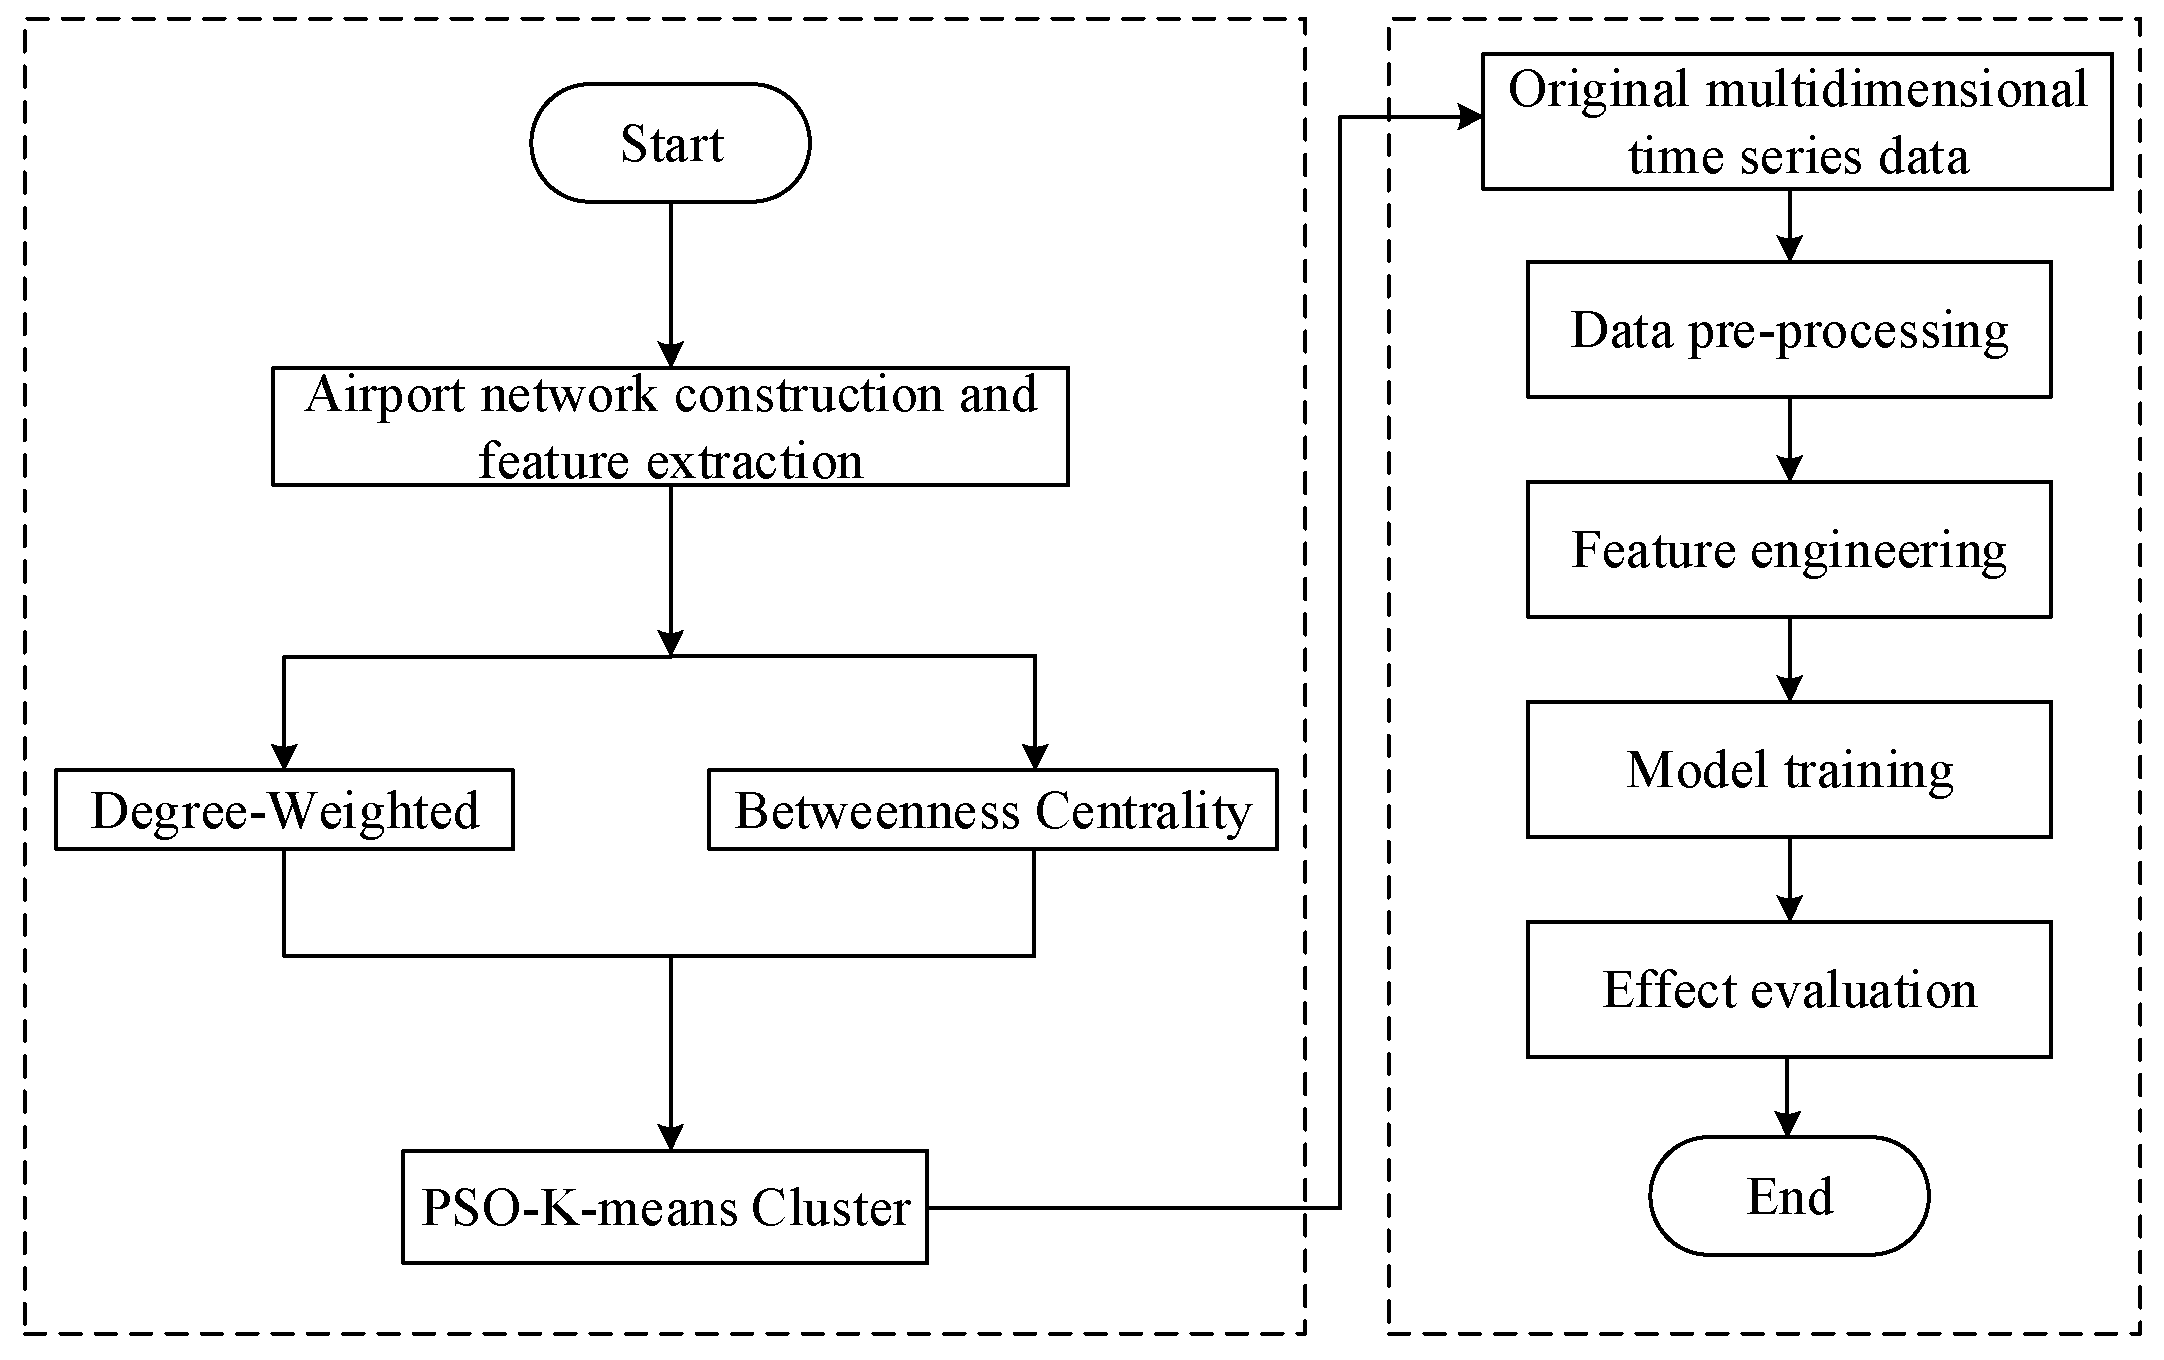
Section 5, the summary and discussion on our imagination of future work. The experimental flow chart of data processing is specified in Figure 1.

2. Airport Cluster Definition and Spatial and Temporal Correlation

2.1. Airport Cluster Definition

The definition of the airport cluster differs from that of airport groups, which is used to refer to a collection of multiple airports in a region and is a multi-airport system characterized by synergistic operation and differentiated development. Airport groups in Beijing–Tianjin–Hebei, Yangtze River Delta, Guangdong–Hong Kong–Macao, and Cheng-Yu are examples of economic aggregation [17]. In relation to the concept of airport groups, the functional characteristics and status roles of airports are not on the same scale. This paper defines airport clusters to fully integrate airports with similar functional attributes and “airport clusters” with a similar hub status in order to solve this problem.
This paper constructs a dynamic assignment network in order to investigate the mechanism of delay diffusion throughout the entire airport network. It is determined with the topological relationship between each airport within the entire airport network space and the flight connections between airports. In general, the greater the number of flight connections an airport performs throughout the entire airspace network, the more prominent its hub position. This paper introduces the Betweenness Centrality (BC) to characterize the traffic hub position of an airport in the topology of the airport network, which also represents the degree of influence on the propagation of delays, from the perspective of complex networks. The Betweenness Centrality is the number of times the shortest path between any two nodes traverses a node. It is used to determine the degree to which a node assumes the role of an “intermediary” in the network and can reflect the airport’s control over transmission along the shortest path between neighboring airport pairs. Multiple shortest paths exist in the constructed airport network between OD airport pairs, and the higher the number of shortest paths passing through an airport node vi, the more important this airport node is. σst denotes the total number of shortest paths from node s to node t and σst(vi) denotes the number of paths that pass through the node vi in these shortest paths, while the Betweenness Centrality of airport nodes vi is defined as in Equation (1) and BCi is the number of Betweenness Centrality of the node vi.
B C i = v s v i v t σ s t ( v i ) σ s t
Degree Centrality is the most direct metric representing node centrality in a network analysis. In this paper, we construct a Degree-Weighted metric based on the airport’s landings and takeoffs to characterize the frequencies of flight activities, which also affects the delay levels of the airports. The Degree-Weighted is defined as the sum of flight movements at that airport in a day. In the directed graph, the Degree-Weighted k(vi) of an airport node vi is equal to the sum of the Incoming degree kin(vi) and outgoing degree kout(vi) of that node, and the incoming degree kin(vi), outgoing degree kout(vi), and node degree-weighted k(vi) are expressed in the form of Equation (2) to Equation (4). wij denotes the value of the weights corresponding to OD to <vi, vj> in the adjacency matrix. That is, the number of flights between i and j at the airport.
k i n ( v i ) = v j w i , j
k o u t ( v i ) = v i w i , j
k ( v i ) = k i n ( v i ) + k o u t ( v i )
Using unsupervised algorithms (e.g., PSO-K-means), Betweenness Centrality, and Degree-Weighted metrics, airport clusters are constructed. Due to the fact that airport clusters share extremely similar delay characteristics, the study of airport clusters can generalize the delay characteristics of airports within a cluster to a great extent.

2.2. Space–Time Correlation of Airport Network and Flight Delay Definition

2.2.1. Space–Time Correlation of Airport Network

References [18,19,20] show that relevant academic research based on network analyses has achieved substantial results, especially in the Web field and social networks. Reference [21] shows that the complex network theory can capture the causality of events from time series, which has become an effective and intuitive method to study aviation delay propagation. Therefore, Reference [22] summarized that the airport network structure had attracted extensive attention from industry engagers in air transport research. The spatio-temporal correlation of the airport network means that the delay status propagates throughout the aviation network over time (see Figure 2). DT,N denotes the set of delay observations for each airport affected by its neighboring airports spatially and temporally in the time period T. In the spatial dimension, the delay status of DT,N in the same moment T(1, …, t, …, t + p) is expressed as the delay status of each airport affected by the delay status of the interconnecting neighboring airports N(1, …, j, …, n) in that time period; while in the temporal dimension, the delay level of DT,N will be affected by the historical time period. This effect is expressed as the propagation of flights with delay attributes across an airline’s network over time [23]. The primary challenge in predicting spatio-temporal data is capturing both the spatial correlation of the intensity of elements and their respective evolution patterns over time. In a time series, the airport networks of various time periods are arranged. Consequently, the delays in each airport network propagate dynamically according to the temporal sequence, forming an airport network topology with spatial and temporal correlation.

2.2.2. Flight DELAY Definition

Based on the existing flight plan data features, this paper uses the definition of a flight delay from the 2012 edition of the <<Normal flight statistics>> to determine flight delays. According to the 2012 edition, if any of the following conditions are met, the flight is considered normal:
  • For departing flights, the aircraft takes off within the specified ground taxi time after the planned door closing time, without abnormal situations such as flight returns or diversions. In other words, if the aircraft takes off before the planned door closing time plus the airport taxi time, it is considered a normal flight. The airport taxi time varies depending on the size of the airport.
  • For arriving flights, as long as the aircraft lands on the ground within 10 min after the planned door opening time, it is considered a normal flight.
This standard examines both the departure and arrival processes, and as long as one of the processes meets the criteria, the flight is considered normal. Flight delay time is a factor that affects and determines the efficiency of flight operations. The calculation of flight delay time is the actual departure time minus the sum of the planned door closing time and the specified airport taxi time.
In summary, the description of departure delay for a flight is when the actual departure time is later than the sum of the planned door closing time (approved by the flight schedule management department) and the airport taxi time. Therefore, the flight delay time is calculated, in minutes, as follows: Flight Delay Time (dep_delay) = Actual Departure Time (r_dep_time) − (Planned Door Closing Time (s_dep_time) + Airport Taxi Time (Taxi_Time)). The specific formula is as follows:
d e p _ d e l a y = r _ d e p _ t i m e ( s _ d e p _ t i m e + T a x i _ T i m e )
The taxi time may vary for different airports. The specific differences are listed in Table 1.

3. TS-BiLSTM-Attention Airport Delay Prediction Model

3.1. BiLSTM Neural Network

Bi-directional Long Short-Term Memory (BiLSTM) is an optimization over the traditional unidirectional LSTM [24]. In light of the fact that the LSTM can only predict the output of the next instant based on the sequence information of the previous moment, it is marginally insufficient for multidimensional temporal variables. The current output of multidimensional time-series data depends not only on the previous state but also on the future state. BiLSTM combines a forward LSTM layer and a reverse LSTM layer to capture “past” moment information from front to back and “future” moment information from back to front, respectively. BiLSTM is a combination of forward and reverse timing information input that can fully account for past and future information in the case of multidimensional timing data and can further improve the accuracy of the model prediction.
The structure of the BiLSTM cell is shown in Figure 3. x1, x2, …, xi …, xt denote the corresponding input data at each moment of ti(i∈[1~t]), and F1, F2, F3, …, Ft, B1, B2, B3, …, Bt denote the corresponding forward–forward and reverse–backward iterations of the LSTM hidden states, respectively.
The hidden layer update states of the forward LSTM, the inverse LSTM, and the final output process of the BiLSTM are depicted in Equations (6)–(8), respectively.
A i = f 1 ( ω 1 x i + ω 2 A i 1 )
B j = f 2 ( ω 3 x i + ω 5 B i + 1 )
Y i = f 3 ( ω 4 A i + ω 6 B i )
where f1, f2, f3 are the activation functions between different layers; ω1, ω2, ω3, …, ω6 represent the corresponding weights of each layer.

3.2. Attention Mechanism

The Attention mechanism was derived from the simulation of human brain attentional characteristics, which was initially applied to image processing. In the field of deep learning, the Attention mechanism assigns relative importance weights to various features. Key contents are assigned greater weights and other contents are assigned lower weights. Consequently, the efficiency of information processing can be enhanced through differential weight assignment, which highlights the most important temporal characteristics in order to obtain higher-quality multidimensional variables [25]. 
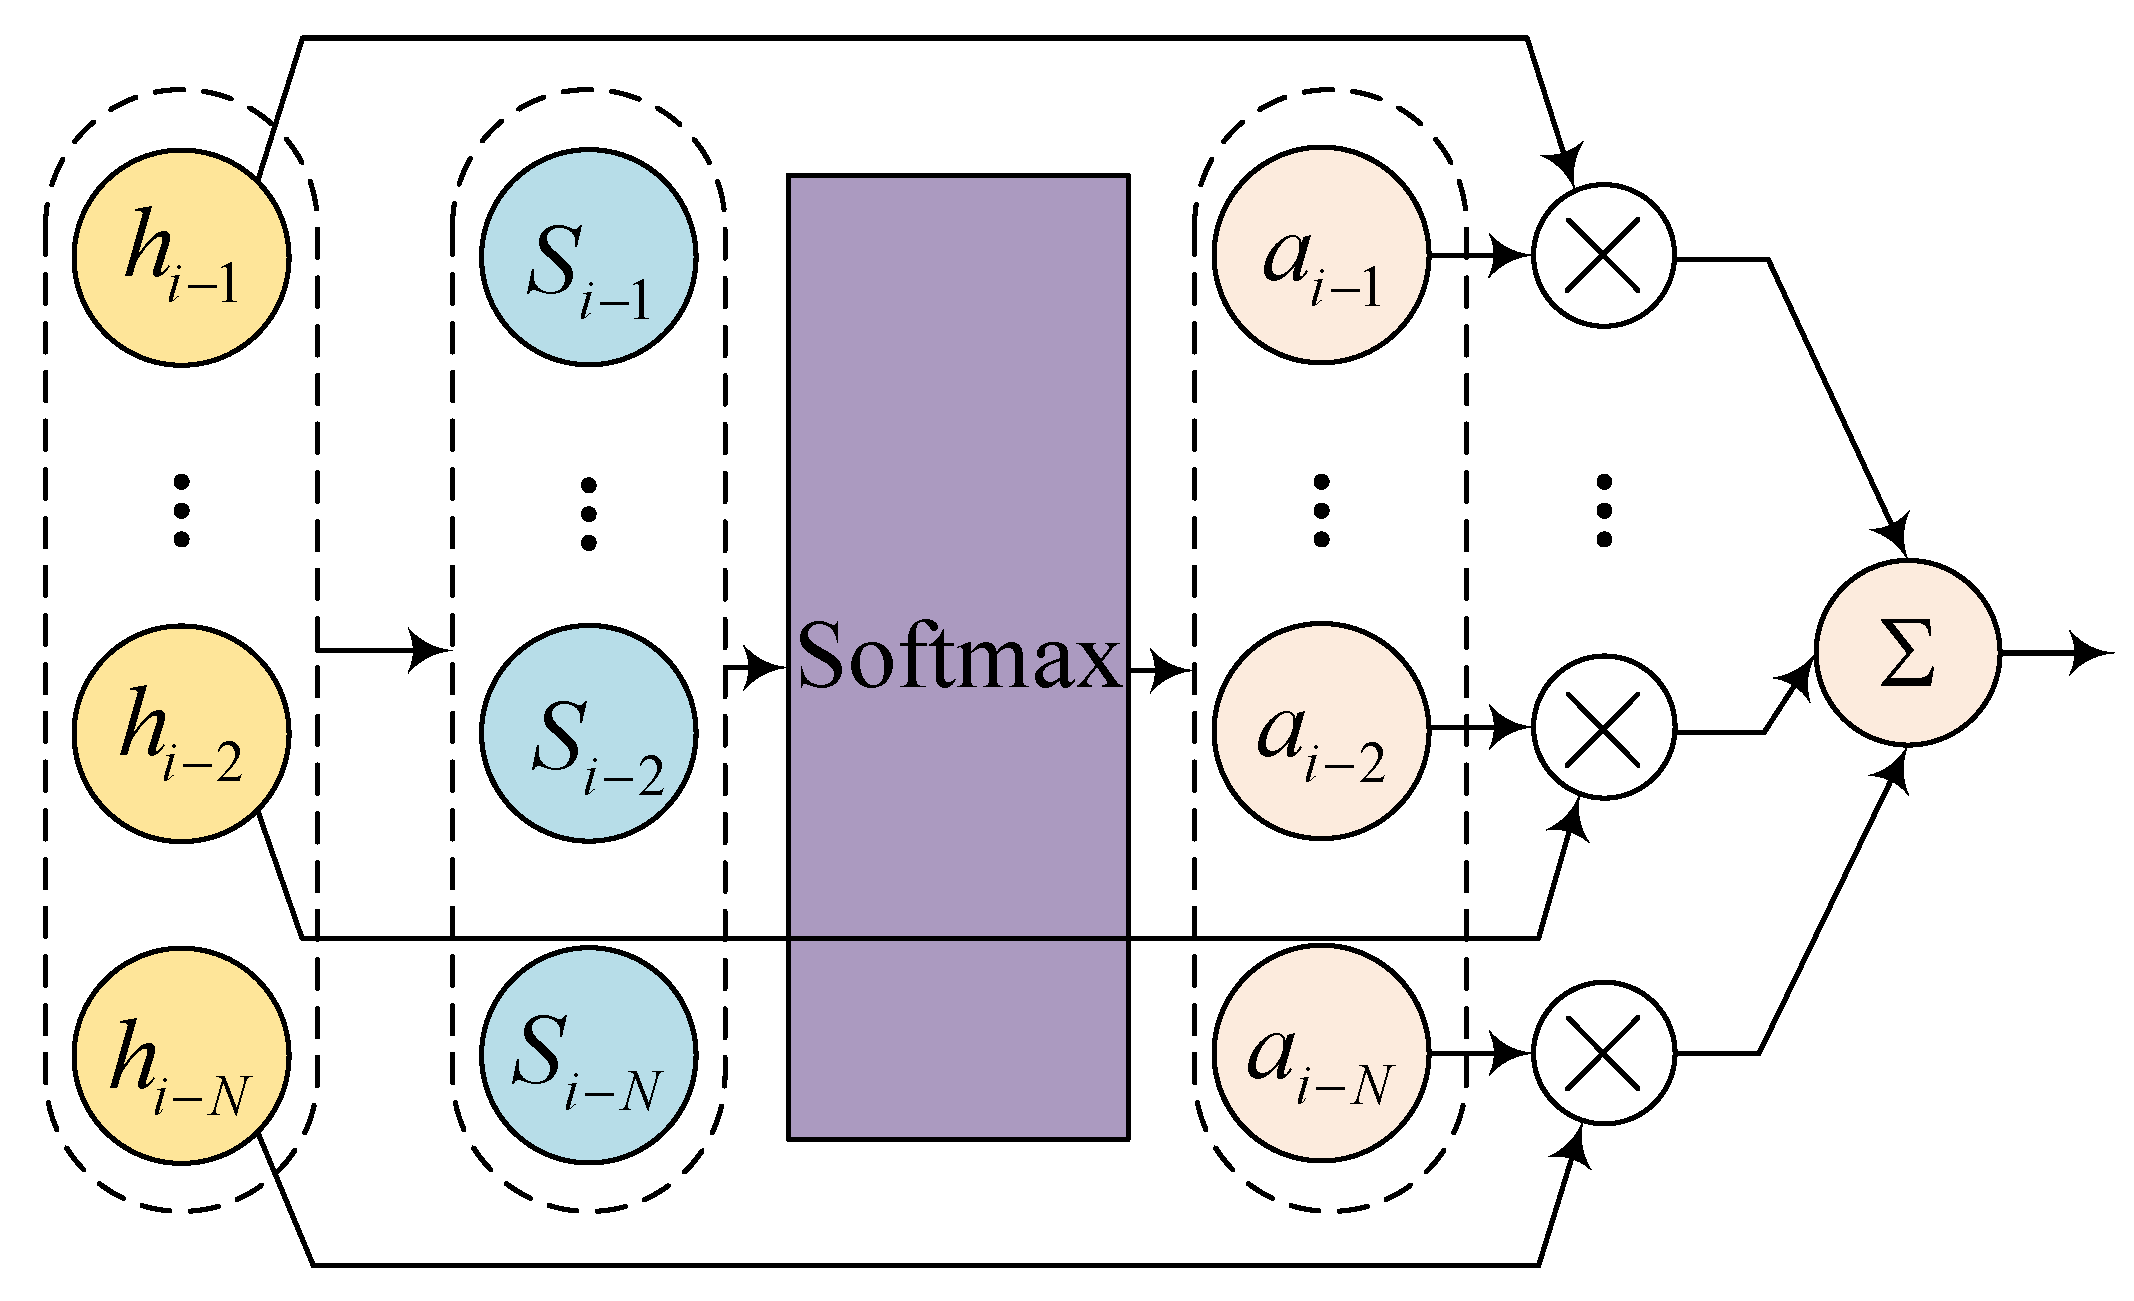
Figure 4 depicts the architecture of the Attention unit.
The essence of the attention mechanism is to assign a weighting factor to each value, as demonstrated by Equation (9).
Attention ( Query , Source ) = i = 1 L x   Similarity   ( Query ,   Key i ) ×   Value   i
where Source is a known element consisting of the data pair <Key, Value>; Query is the objective function.
During the training process, the attention model dynamically modifies the weights of each time step and calculates the weight coefficients of each variable feature—the calculation process for which the following equation can be utilized.
s i k = V s T tanh ( W s h i k + b s )
α i k = softmax ( s i k ) = exp ( s i k ) k = 1 N exp ( s i k )
h ¯ = k = 1 N α i k h i k
where hik is the output value of the BiLSTM hidden layer; αi is the attention weight coefficient of the current input; hi−1, hi-2, …, hiN is the input sequence; Si−1, Si−2, …, SiN is the hidden layer state value corresponding to the input sequence hi−1, hi−2, …, hiN; and VST, WS, bS represent the learning parameters of the model, which will continue to be optimized with the model training process.

3.3. TS-BiLSTM-Attention Prediction Model Construction

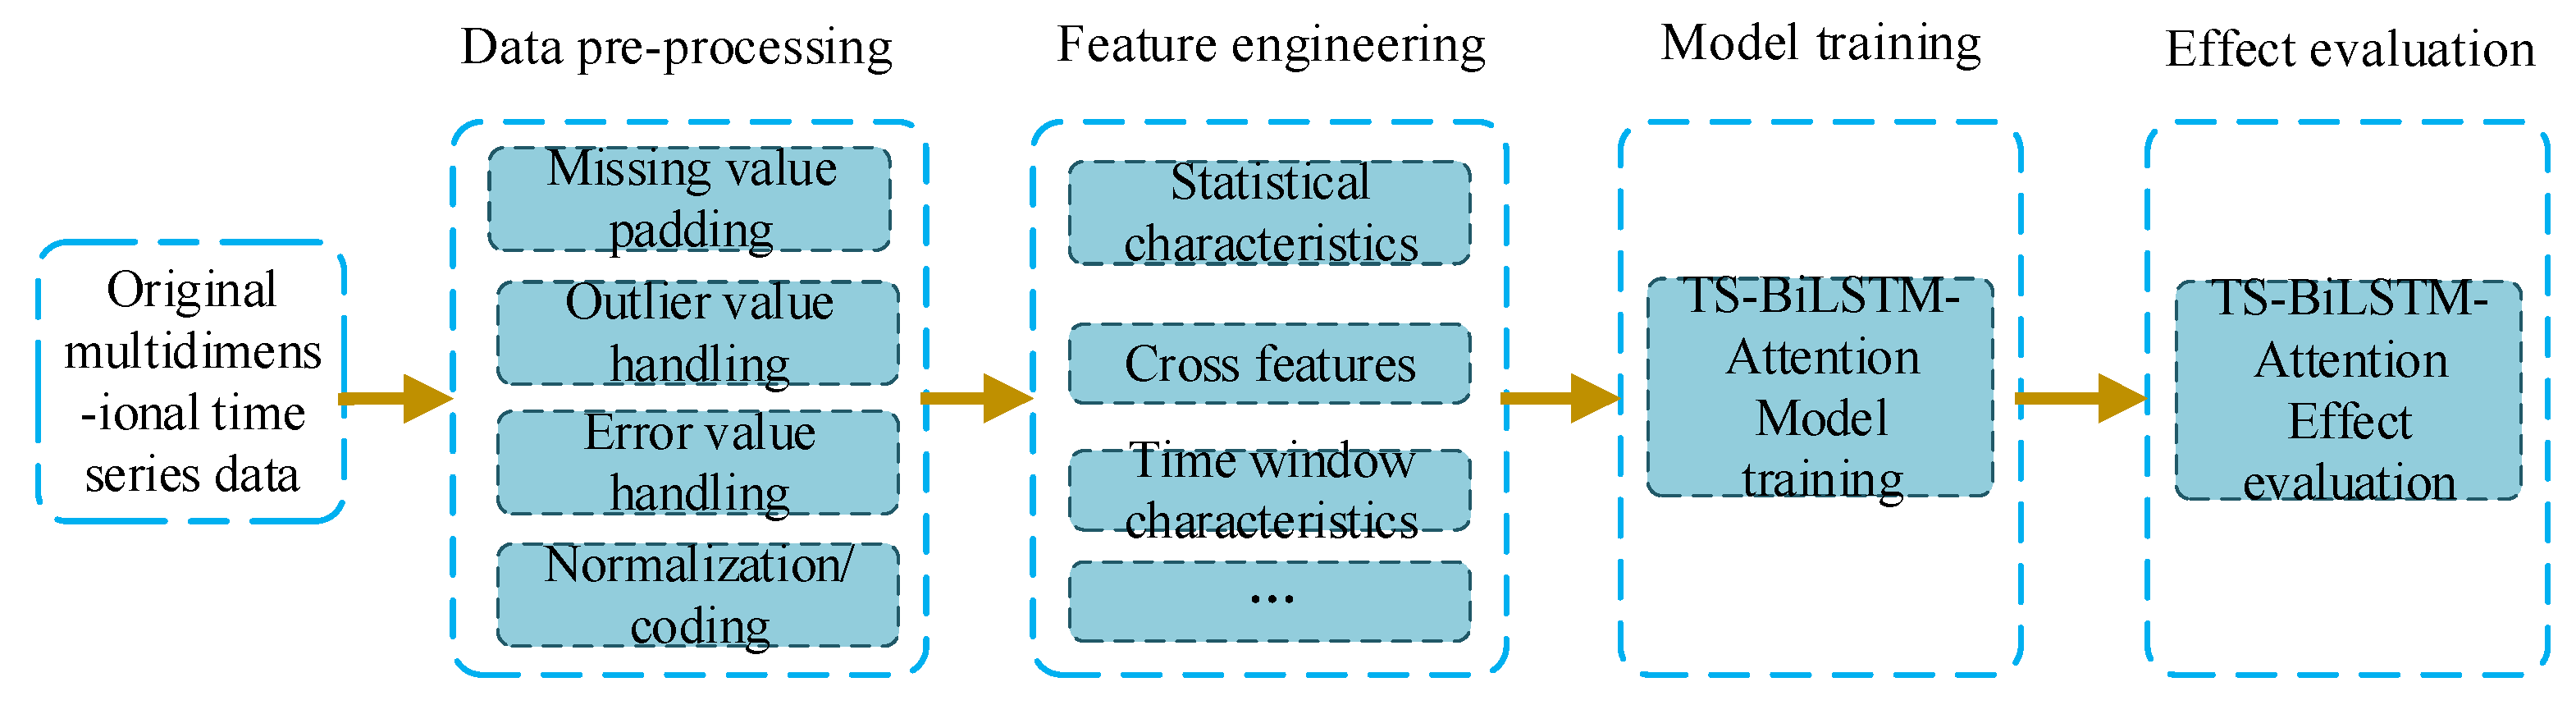
We propose a TS-BiLSTM-Attention delay prediction model based on spatio-temporal sequences that capture the spatial and temporal characteristics of airport delays from the overall airport cluster delays. Figure 5 depicts the four components of the model: data pre-processing, feature engineering, model training, and effect evaluation.
In the data pre-processing phase, because the historical flight data contain some missing values and outliers, the resulting prediction set has an unstable data structure and data noise interference. This affects the results of the experiment. This paper constructs airport clusters based on the similarity of airport network attribute values to reduce the impact of data anomalies and other factors on experimental results in order to address the aforementioned issue. The ability to accurately extract the feature variables affecting delays and construct a stable data set is related to the precision of delay prediction in terms of extracting feature variables. In the same airport, a previous flight delay will affect the departure of a subsequent flight, resulting in the rapid propagation of the delay throughout the airport. This would cause the flight departure to be delayed at that airport. Simultaneously, failure to land at the airport for a brief period of time due to inclement weather or other factors such as flow control at the landing airport will also impact the departure of all prescheduled flights from the associated airport during that period. As the incoming and outgoing flights with delay characteristics operate within the aviation network, delays will propagate in space. Using the inbound time series of this airport and the time series of the associated airports as the characteristic variables for delay prediction captures the inherent mechanism of delay propagation from the high-dimensional characteristic variables. In addition, the granularity of prediction time in this study is set to a 1 h delay per unit. The unit hour delay is defined as the ratio of the total delay time of all flights during a given time period to the total number of flights throughout that time period. Accordingly, the degree of delay at an airport can be accurately described within a given time frame.
We construct the TS-BiLSTM-Attention model and feed the Attention mechanism the features generated by the BiLSTM hidden layer. The Attention mechanism is utilized to automatically differentiate the importance of spatio-temporal information extracted from the hidden layer of BiLSTM utilizing weighting. This can effectively exploit the time-series properties of the multidimensional time-series features and exploit the profound spatio-temporal correlation. Attention can effectively reduce the loss of historical information and highlight the information of key historical nodes in order to reduce the impact of redundant information on prediction results per unit delay time. The output of the Attention layer is then used as the input for the Fully Connected layer, which outputs the final unit delay time. In the network parameter optimization phase, the Adam (Adaptive Moment Estimation) optimization algorithm is used to update the network parameters of each layer, while the Mean Squared Error (MSE) is employed as the loss function. The trained TS-BiLSTM-Attention model is then saved and the model’s validity is validated using the model test set.
Among them, the TS-BiLSTM-Attention prediction model is comprised primarily of BiLSTM-Attention, and the BiLSTM- Attention construction is illustrated in Figure 6. The inputs consist of T-extracted spatio-temporal feature variables from airport clusters. The features are incorporated into the output layer to ultimately output the delayed prediction values y.

3.4. Model Construction

The essence of training a deep learning model is the iterative adjustment of model parameters. Model training involves utilizing variations in parameters such as the batch size, time step, number of hidden layers, and neural network nodes on the training set to minimize the loss function formed by the prediction outputs and actual data. The objective is to continuously update the algorithmic model structure in order to minimize prediction errors.
Step 1: Obtain the experimental dataset after data pre-processing and feature engineering. Split the dataset into training data and testing data in a ratio of 7:3.
Step 2: Build the TS-BiLSTM-Attention model for delay prediction. Input the processed multidimensional temporal features into the BiLSTM model.
Step 3: The multidimensional temporal data are inputted into the BiLSTM unit structure, and the “forward” and “backward” temporal processing is achieved using Equations (6) and (7). This process effectively integrates the temporal information from the “past” and “future”. Finally, Equation (8) outputs the hidden layer features, which serve as input variables for the Attention model. The Attention mechanism utilizes its own structural Attention mechanism to capture the spatio-temporal information obtained by BiLSTM. Equations (10)–(12) are used to assign weights to the features, and the parameters are continuously optimized during the model training process. This enables the differentiation of time series with spatio-temporal delay characteristics and further explores the spatio-temporal delay features based on a network analysis.
Step 4: The output of the Attention layer is used as input to a fully connected layer, which outputs the final unit delay time. The optimization of network parameters in the model structure is performed using the Adam (Adaptive Moment Estimation) optimization algorithm for iterative updates of internal parameters. The Mean Squared Error (MSE) is used as the loss function.
Step 5: Save the trained TS-BiLSTM-Attention model and use the model to validate its effectiveness using the testing dataset.

4. Example Analysis

4.1. Experimental Environment and Model Parameter Settings

The experimentally relevant algorithm was written with Python 3.8.3. TensorFlow1.2.1 is the deep learning framework, the processor is an Intel(R) Core(TM) i5-7300HQ running at 2.50 GHz, and the memory is 24 GB. The maximum band iteration (epoch) was set to 300, the batch size was set to 128, and the number of BiLSTM neurons was set to 64. The learning rate is 0.001, the Attention vector dimension is 32, and the Adam algorithm is utilized by the deep learning optimizer. The computation formulas, as shown in Equations (13) and (14), define and relate to the actual context of this paper. This evaluation metric is expressed in minutes and represents the difference between the predicted output value and the true value to assess the quality of the prediction. A smaller RMSE and MAE value indicates better prediction performance. Therefore, this paper evaluates the prediction performance based on the RMSE and MAE metrics.
RMSE = 1 n k = 1 n ( y k y ^ k ) 2
MAE = 1 n k = 1 n | y ^ k y k |
where y ^ k represents the predicted delay value. y k represents the true delay value; n represents the total number of samples in the testing dataset.

4.2. Experimental Data

This paper examines flight information from October 2018 to January 2019, a total of 982,439 flights. Excluding data on international flights, the number of domestic airports was determined to be 229. The used data did not include Hong Kong, Macau, or Taiwan. The PSO-K-means clustering algorithm was used to construct the domestic airport clusters seen in Table 2 based on the concept of an airport cluster.
The results of this experiment differ from the traditional definition of busy airports mainly because the geographical location factor is introduced. The BC (Betweenness Centrality) values for Nanjing Lukou International Airport and Shanghai Hongqiao Airport are relatively low, indicating that traditional busy airports are located in the third airport cluster. This suggests that their role as aviation hubs is not prominent. Furthermore, the partitioning results may also be influenced by runway operational capacity and the daily flight operations at each airport.

4.3. Comparative Analysis of the Results of Different Prediction Models

The single-airport delay model (S-ADM) and the cluster-airport delay model (C-ADM) are the models developed for single and cluster airports, respectively. The C-ADM is ultimately utilized to predict a single airport within a cluster. C-ADM forecast results refer to the forecasts of individual airports within a cluster.
Take Capital Airport and its first airport cluster as an example to predict Capital Airport’s unit hour delays. First, we establish the cluster-airport delay model by averaging the total value of delays per hour for all airports in the cluster. The average delay value is then calculated for all airports over the same time period as the cluster delay time series. The neighboring airports of each airport in the cluster serve as the cluster’s neighboring airports. As feature variables for delay prediction, the inbound time series of the airport cluster and the time series of the associated airports are extracted. A multidimensional time series data setting is developed based on the airport cluster. Meanwhile, the inbound time series values of Capital Airport and the delay series of its surrounding airports are extracted to create a single-airport delay dataset. In the example analysis, TS-BiLSTM-Attention models are built for the cluster dataset and the single-airport dataset to predict departure delays at Capital Airport. Three traditional algorithms, BP, ARIMA, and LSTM, are chosen to forecast the multidimensional time-series data for the two distinct datasets. Table 3 displays the various prediction models applied to various datasets, along with their respective prediction results.
Figure 7 depicts a comparison demonstrating that the prediction model (C-ADM) based on clusters provides superior prediction results. Moreover, it is highly inclusive of data noise and outliers, and its prediction accuracy is superior to that of modeling on single airports. Analyzing the causes, it is clear that a single-airport data set with a large residual will have a direct impact on the stability and dependability of modeling. The established cluster model is capable of integrating the spatio-temporal sequence characteristics of airports that are similar. Consequently, this can compensate for missing data and data noise within a single airport and improve the overall robustness of the data. At the same time, it can be seen that the TS-BiLSTM-Attention model has better prediction performance.

4.4. Comparative Analysis of Forecast Results of Different Airport Clusters

The forecast results of various airport clusters were analyzed. In this paper, three airports from separate airport clusters are selected for comparative experimentation. They include Chengdu Shuangliu International Airport, Chongqing Jiangbei International Airport, and Xi’an Xianyang International Airport in the first airport cluster; Tianjin Binhai International Airport, Guangzhou Baiyun International Airport, and Shanghai Pudong International Airport in the second airport cluster; Shanghai Hongqiao International Airport, Nanjing Lukou International Airport, and Zhengzhou Xinzheng International Airport in the third airport cluster; and Quanzhou Jinjiang International Airport, Guilin Liangjiang International Airport, and Sunan Shuofang International Airport in the fourth airport cluster. Specifically, the TS-BiLSTM-Attention model is used to model the predictions under different airport clusters, and Figure 8 displays the experimental results. As depicted in the graph, TS-BiLSTM-Attention provides different prediction accuracies for datasets constructed under various airport clusters.
The airport delays in the first and second airport clusters have the greatest predictive power, with a mean MAE of less than 5.5. The fourth airport cluster has the worst prediction effect, worse than the third airport cluster’s mean MAE value of 7.31, and the MAE is 9.9. This is primarily attributable to the small number of airports in the first and second airport clusters, which allows for efficient extraction of the neighboring airport delay time series. Thus, the validity of the data structure and the feature variables is assured. The first and second clusters are superior at capturing the delay propagation characteristics of the airports within the clusters. For the most part, the overall delay level is stable, and the delay time series exhibits strong regularity, since these Chinese airports all feature high flight frequencies and experience significant delays. Whereas for the fourth airport cluster, which accounts for 80% of domestic airports and consists primarily of small- and medium-sized airports in China, small airports comprise the majority. They are connected by a large number of airports, which results in irregular delay propagation in the aviation network, rendering it impossible to precisely capture the key spatial and temporal characteristics’ variables for delay prediction at the target airports. High randomness characterizes the occurrence of delays at domestic small- and medium-sized airports. Thus, the poor data stability will directly impact the accuracy of predictions. The results indicate that the prediction accuracy of the TS-BiLSTM-Attention model is enhanced if the delay time series of neighboring airports can be precisely captured and a stable dataset is obtained. The accuracy of predictions decreases for small- and medium-sized airports with numerous neighboring airports and high volatility. However, the prediction curve of the fourth airport cluster in Figure 7 demonstrates that for small- and medium-sized airports with a large number of airports in close proximity, high volatility occurs. Nevertheless, the prediction curve of the fourth airport cluster in Figure 7 demonstrates that the trend of delay fluctuation can still be well fitted for small- and medium-sized airports with numerous neighboring airports and high volatility.

5. Conclusions

In this paper, airport clusters are constructed based on airport network attribute value similarities. In order to construct the TS-BiLSTM-Attention prediction model, the spatio-temporal correlation between airport clusters and nearby airports is extracted. The effectiveness of both the clustered data set and the model is demonstrated through comparative experiments. Experiments indicate many algorithms can be applied to build delay prediction models under different data sets, of which MAE and RMSE show great differences. The values of MAE evaluation indicators in the cluster-airport data set are 5.532, 5.556, 4.725, and 4.491, respectively, which are lower than those based on a single airport as 5.899, 6.041, 4.752, and 4.491, respectively, demonstrating that the delay prediction model (C-ADM) based on a cluster airport is more competent in predicting the departure delay of a single airport in the cluster. The delay prediction model (C-ADM) constructed using clustered airports can predict departure delays for individual airports within clusters more accurately. The model structure is more stable than the delay prediction model (S-ADM) constructed for single airports. The C-ADM model can reduce the effect of missing values and outliers on the accuracy of predictions. The clustered prediction set has a stable data structure and encompasses a significant amount of anomalous data. Compared with traditional BP, ARIMA, and LSTM neural network algorithms, the results show that the MAE of BP, ARIMA, and LSTM are 5.532, 5.556, and 4.725, respectively, under the model of C-ADM, which are greater than 4.494 under the model of TS-BiLSTM-Attention; the RMSE indicators are 7.633, 7.572, and 7.433, respectively, which are higher than 6.787 under the model of TS-BiLSTM-Attention. Therefore, the MAE and RMSE based on the TS-BiLSTM-Attention prediction model are smaller than the traditional model regardless of how the data set changes, which proves that the BiLSTM model integrated with the Attention mechanism can accurately extract multidimensional variables and complex time series characteristics and conduct regression prediction, while predictability, generalization, and universality are superior to traditional models.
Improvements of work: This paper only studies the transmission of an airport flight delay in the time and space network and the prediction of an airport delay, aiming at exploring the transmission mechanism of an airport delay and seeking prediction methods with higher and better performances. It is worth noting that there are still some topics deserving our further exploration. When conducting the cause analysis and data collection, weather, as one of the important factors influencing a flight delay, failed to be considered for the time being. In addition, the factors that influence an airport delay are mutually restricting and influence each other. Through collecting more complete data and extracting key factors influencing a delay, the prediction effect of an airport delay can be further improved.
This paper focuses on the dimension of airport networks and extracts the spatio-temporal correlations of delay propagation among adjacent airports. It aimed to capture the inherent mechanisms of delay propagation in high-dimensional space. Additionally, it constructs the TS-Attention-BiLSTM temporal prediction model to achieve more accurate predictions of departure delays at the target airport. In practical airport operations, by obtaining the delay status of adjacent airports, the dynamic prediction of departure delays at the target airport for the next moment is made possible. Any delay occurrence at an adjacent airport dynamically affects the departure time of flights at the target airport. Therefore, the proposed theoretical and algorithmic models in this paper enhance the real-time perception capability of the delay status at adjacent airports and provide real-time updates on the delay status at the target airport. This helps airports anticipate delays in advance and respond promptly with appropriate action plans.
The expansion and deepening directions of related research in the future can include that, when the airport encounters flight delays, delays often transmit rapidly through the airline network, and how to accurately construct the delay characteristic variables deserves further research in the future. Meanwhile, combining with reality, applying the latest deep learning algorithm to fit and model the multidimensional time and space data is of great significance for the delay prediction.

Author Contributions

Conceptualization, Y.L. and X.W.; methodology, X.W.; software, X.W.; validation, X.W., Y.L. and R.S.; formal analysis, Y.L.; investigation, Y.L.; resources, Y.L. and C.R.; data curation, X.W.; writing—original draft preparation, X.W. and J.X.; writing—review and editing, X.W. and J.X.; visualization, X.W.; supervision, Y.L.; project administration, Y.L.; funding acquisition, Y.L. and C.R. All authors have read and agreed to the published version of the manuscript.

Funding

This research was funded by the Youth Fund of the Natural Science Foundation of Jiangsu Province (grant number: BK20170157) and the Science and Technology Project of the China Civil Aviation Air Traffic Management Bureau in North China (grant number: 202002).

Data Availability Statement

The data presented in this study are available on request from the corresponding author.

Conflicts of Interest

The authors declare no conflict of interest.

References

  1. Cheng, H.; Li, Y.M.; Luo, Q.; Li, C. Study on flight delay with C4. 5 decision tree based prediction method. Syst. Eng. Theory 2014, 34, 239–247. [Google Scholar]
  2. Rebollo, J.J.; Balakrishnan, H. Characterization and prediction of air traffic delays. Transp. Res. Part C Emerg. Technol. 2014, 44, 231–241. [Google Scholar] [CrossRef]
  3. Chakrabarty, N. A data mining approach to flight arrival delay prediction for american airlines. In Proceedings of the 2019 9th Annual Information Technology, Electromechanical Engineering and Microelectronics Conference (IEMECON), Jaipur, India, 13–15 March 2019; pp. 102–107. [Google Scholar]
  4. Li, Q.; Jing, R. Characterization of delay propagation in the air traffic network. J. Air Transp. Manag. 2021, 94, 102075. [Google Scholar] [CrossRef]
  5. Rodríguez-Sanz, Á.; Comendador, F.G.; Valdés, R.A.; Pérez-Castán, J.; Montes, R.B.; Serrano, S.C. Assessment of airport arrival congestion and delay: Prediction and reliability. Transp. Res. Part C Emerg. Technol. 2019, 98, 255–283. [Google Scholar] [CrossRef]
  6. Kim, Y.J.; Choi, S.; Briceno, S.; Mavris, D. A deep learning approach to flight delay prediction. In Proceedings of the 2016 IEEE/AIAA 35th Digital Avionics Systems Conference (DASC), Sacramento, CA, USA, 25–29 September 2016; pp. 1–6. [Google Scholar]
  7. Khanmohammadi, S.; Tutun, S.; Kucuk, Y. A new multilevel input layer artificial neural network for predicting flight delays at JFK airport. Procedia Comput. Sci. 2016, 95, 237–244. [Google Scholar] [CrossRef] [Green Version]
  8. Yu, B.; Guo, Z.; Asian, S.; Wang, H.; Chen, G. Flight delay prediction for commercial air transport: A deep learning approach. Transp. Res. Part E Logist. Transp. Rev. 2019, 125, 203–221. [Google Scholar] [CrossRef]
  9. Ai, Y.; Pan, W.; Yang, C.; Wu, D.; Tang, J. A deep learning approach to predict the spatial and temporal distribution of flight delay in network. J. Intell. Fuzzy Syst. 2019, 37, 6029–6037. [Google Scholar] [CrossRef]
  10. Qu, J.; Ye, M.; Qu, X. Airport delay prediction model based on regional residual and LSTM network. J. Commun. 2019, 40, 149–159. [Google Scholar]
  11. Luo, C.; Li, X.; Ye, Y. PFST-LSTM: A spatiotemporal LSTM model with pseudoflow prediction for precipitation nowcasting. IEEE J. Sel. Top. Appl. Earth Obs. Remote Sens. 2020, 14, 843–857. [Google Scholar] [CrossRef]
  12. Cai, K.; Li, Y.; Fang, Y.-P.; Zhu, Y. A deep learning approach for flight delay prediction through time-evolving graphs. IEEE Trans. Intell. Transp. Syst. 2021, 23, 11397–11407. [Google Scholar] [CrossRef]
  13. Zeng, W.; Li, J.; Quan, Z.; Lu, X. A deep graph-embedded LSTM neural network approach for airport delay prediction. J. Adv. Transp. 2021, 2021, 6638130. [Google Scholar] [CrossRef]
  14. Zhou, H.; Li, W.; Jiang, Z.; Cai, F.; Xue, Y. Flight Departure Time Prediction Based on Deep Learning. Aerospace 2022, 9, 394. [Google Scholar] [CrossRef]
  15. Zhao, Z.; Feng, S.; Song, M.; Liang, Q. A Delay Prediction Method for the Whole Process of Transit Flight. Aerospace 2022, 9, 645. [Google Scholar] [CrossRef]
  16. Güvercin, M.; Ferhatosmanoglu, N.; Gedik, B. Forecasting flight delays using clustered models based on airport networks. IEEE Trans. Intell. Transp. Syst. 2020, 22, 3179–3189. [Google Scholar] [CrossRef]
  17. Li, Y.; Teng, M.; Feng, Y. Research on the Relationship between Beijing-Tianjin-Hebei Airport Group and Regional Coordinated Development. Math. Probl. Eng. 2022, 2022, 3974316. [Google Scholar] [CrossRef]
  18. Kleinberg, J.M. Authoritative sources in a hyperlinked environment. J. ACM (JACM) 1999, 46, 604–632. [Google Scholar] [CrossRef] [Green Version]
  19. Yang, J.; Leskovec, J. Defining and evaluating network communities based on ground-truth. In Proceedings of the ACM SIGKDD Workshop on Mining Data Semantics, Beijing, China, 12–16 August 2012; pp. 1–8. [Google Scholar]
  20. Hoppe, B.; Reinelt, C. Social network analysis and the evaluation of leadership networks. Leadersh. Q. 2010, 21, 600–619. [Google Scholar] [CrossRef]
  21. Pastorino, L.; Zanin, M. Local and Network-Wide Time Scales of Delay Propagation in Air Transport: A Granger Causality Approach. Aerospace 2023, 10, 36. [Google Scholar] [CrossRef]
  22. Zanin, M.; Lillo, F. Modelling the air transport with complex networks: A short review. Eur. Phys. J. Spec. Top. 2013, 215, 5–21. [Google Scholar] [CrossRef] [Green Version]
  23. Pyrgiotis, N.; Malone, K.M.; Odoni, A. Modelling delay propagation within an airport network. Transp. Res. Part C Emerg. Technol. 2013, 27, 60–75. [Google Scholar] [CrossRef]
  24. Cornegruta, S.; Bakewell, R.; Withey, S.; Montana, G. Modelling radiological language with bidirectional long short-term memory networks. arXiv 2016, arXiv:1609.08409. [Google Scholar]
  25. Ming, Y.; Qian, H.; Guangyuan, L. CNN-LSTM Facial Expression Recognition Method Fused with Two-Layer Attention Mechanism. Comput. Intell. Neurosci. 2022, 2022, 7450637. [Google Scholar] [CrossRef] [PubMed]
Figure 1. Data processing flow chart.
Aerospace 10 00580 g001
Figure 2. A spatio-temporal network of airports.
Aerospace 10 00580 g002
Figure 3. BiLSTM unit structure.
Aerospace 10 00580 g003
Figure 4. Structure of Attention unit.
Aerospace 10 00580 g004
Figure 5. Data processing flow of TS-BiLSTM-Attention prediction model.
Aerospace 10 00580 g005
Figure 6. TS-BiLSTM-Attention model.
Aerospace 10 00580 g006
Figure 7. Comparison of MAE–RMSE indexes among different models. (a) Comparison of MAE results of different models; (b) comparison of RMSE results of different models.
Aerospace 10 00580 g007
Figure 8. Prediction effect under different airport clusters. (a) First airport cluster; (b) second airport cluster; (c) third airport cluster; (d) fourth airport cluster.
Aerospace 10 00580 g008aAerospace 10 00580 g008b
Table 1. Ground taxi times at different airports.
Airport NameTaxi Time
Beijing Capital, Shanghai Hongqiao, Shanghai Pudong, Guangzhou Baiyun, Shenzhen Baoan, Chengdu Shuangliu, Kunming Changshui30 min
Hangzhou Xiaoshan, Chongqing Jiangbei, Xi’an Xianyang25 min
Tianjin Binhai20 min
Other airports15 min
Table 2. Classification of Chinese airport clusters.
Airport ClusterCluster Content
First airport clusterBeijing Capital, Xi’an Xianyang, Chongqing Jiangbei, Chengdu Shuangliu
Second airport clusterTianjin Binhai, Guangzhou Baiyun, Shenzhen Baoan, Kunming Changshui, Hangzhou Xiaoshan, Shanghai Pudong, Urumqi Diwopu, Harbin Taiping International
Third airport clusterHohhot Baita, Beijing Nanyuan, Shijiazhuang Zhengding, Taiyuan Wusu, Changsha Huanghua, Nanning Wuxu, Zhuhai Jinwan, Zhengzhou Xinzheng, Wuhan Tianhe, Haikou Meilan, Sanya Phoenix, Yinchuan Hedong, Lanzhou Zhongchuan, Xining Caojiapu, Xiamen Gaoqi, Nanchang Changbei, Fuzhou Changle, Jinan Yaoqiang, Ningbo Lishe, Nanjing Lukou, Hefei Xinqiao, Qingdao Liuting, Shanghai Hongqiao, Wenzhou Longwan, Yantai Penglai
Guiyang Longdongbao, Changchun Longjia, Dalian Zhoushuizi, Shenyang Taoxian
Fourth airport clusterAirports other than those mentioned above
Table 3. Predictions for different datasets.
ModelMAERMSE
S-ADMC-ADMS-ADMC-ADM
BP5.8995.5327.9917.633
ARIMA6.0415.5568.1017.572
LSTM4.7524.7257.4907.433
TS-BiLSTM-Attention4.9414.4947.4966.787
Disclaimer/Publisher’s Note: The statements, opinions and data contained in all publications are solely those of the individual author(s) and contributor(s) and not of MDPI and/or the editor(s). MDPI and/or the editor(s) disclaim responsibility for any injury to people or property resulting from any ideas, methods, instructions or products referred to in the content.

