Article

Cognitive Load Assessment of Air Traffic Controller Based on SCNN-TransE Network Using Speech Data

1
College of Computer Science, Sichuan University, Chengdu 610065, China
2
National Key Laboratory of Fundamental Science on Synthetic Vision, Sichuan University, Chengdu 610064, China
*
Author to whom correspondence should be addressed.
Aerospace 2023, 10(7), 584; https://doi.org/10.3390/aerospace10070584
Submission received: 4 April 2023 / Revised: 15 June 2023 / Accepted: 19 June 2023 / Published: 23 June 2023
(This article belongs to the Special Issue Advances in Air Traffic and Airspace Control and Management)

Abstract

:
Due to increased air traffic flow, air traffic controllers (ATCs) operate in a state of high load or even overload for long periods of time, which can seriously affect the reliability and efficiency of controllers’ commands. Thus, the early identification of ATCs who are overworked is crucial to the maintenance of flight safety while increasing overall flight efficiency. This study uses a comprehensive comparison of existing cognitive load assessment methods combined with the characteristics of the ATC as a basis from which a method for the utilization of speech parameters to assess cognitive load is proposed. This method is ultimately selected due to the minimal interference of the collection equipment and the abundance of speech signals. The speech signal is pre-processed to generate a Mel spectrogram, which contains temporal information in addition to energy, tone, and other spatial information. Therefore, a speech cognitive load evaluation model based on a stacked convolutional neural network (CNN) and the Transformer encoder (SCNN-TransE) is proposed. The use of a CNN and the Transformer encoder allows us to extract spatial features and temporal features, respectively, from contextual information from speech data and facilitates the fusion of spatial features and temporal features into spatio-temporal features, which improves our method’s ability to capture the depth features of speech. We conduct experiments on air traffic control communication data, which show that the detection accuracy and F1 score of SCNN-TransE are better than the results from the support-vector machine (SVM), k-nearest neighbors (KNN), random forest (RF), adaptive boosting (AdaBoost), and stacked CNN parallel long short-term memory with attention (SCNN-LSTM-Attention) models, reaching values of 97.48% and 97.07%, respectively. Thus, our proposed model can realize the effective evaluation of cognitive load levels.

1. Introduction

Air traffic control is a high-risk intellectual job requiring continuous information acquisition, timely analysis, dynamic evaluation, and accurate decision making. Human factor studies have shown that aviation accidents are usually caused by three main factors: human errors, mechanical failures, and weather conditions, with human error accounting for a high percentage of up to 80% of all accidents [1]. This corroborates that human factors have become a major threat to aviation safety. The air traffic controller (ATC) is critical to the safety of air traffic management (ATM). Maintaining an appropriate workload for controllers is essential to ensure that they can perform their duties accurately and efficiently, thereby reducing the risk of errors that could jeopardize aircraft safety. Therefore, it is imperative to prioritize the controller’s well-being and ensure that they are not overburdened with tasks and can remain focused and alert throughout their shift.
Air traffic flow is increasing, and airspace management has become increasingly complicated in recent years due to the fast expansion of civil aviation [2]. Long working hours, especially during night shifts, tend to have a significant impact on ATCs’ cognitive and attentional resources, resulting in inattentiveness, memory loss, slow responses, physical discomfort, drowsiness, and other phenomena, all of which seriously affect the reliability and efficiency of the whole human–machine system and thus affect flight safety [3,4]. Good attention, memory ability, spatial awareness, reaction speed, and alertness are all necessary qualities for ATCs. Moreover, the strength of these abilities is closely related to the state of the ATC. Therefore, a comprehensive, systematic analysis and understanding of controllers’ cognitive load are of significant practical importance for maintaining aviation safety and enhancing air transport efficiency.
The workload of ATCs can be divided into two categories. One is the objective load, which refers to the work performed by controllers in the process of routine control and conflict resolution that can be observed, recorded, and timed; the other is the subjective load or cognitive load, which refers to the level of psychological energy required by controllers to receive, maintain, and process aircraft information in a short period of time [5]. The cognitive load is reflected in the psychological activities undertaken by ATCs when monitoring flight dynamics, such as maintaining situational awareness, analyzing traffic dynamics, making conflict judgments, formulating operational plans, and monitoring the implementation of plans.
From this description of cognitive load, it can be seen that there is a very important relationship between cognitive load and cognitive resources [5,6,7,8]. If an individual wants to complete a task, the total load cannot exceed the available working memory resources. In a general sense, cognitive load can be described as the ratio of the mental resources required for the task to the remaining available resources of the operator; that is, it is the occupancy rate of mental resources [6,7]. In studies investigating cognitive load, the level of cognitive load can be altered by manipulating either the remaining mental resources or the mental resources required to complete the work. The main purpose of evaluating or predicting cognitive load is to be able to distribute tasks to avoid cognitive overload, the essence of which is rooted in the rational management and effective use of cognitive resources.
At present, methods used to assess the cognitive load of ATCs can be grouped into three categories: task evaluations, subjective evaluations, and physiological evaluations [6]. Firstly, task evaluation methods or task performance measurements evaluate the cognitive load imposed by the task on controllers through their job performance. The International Civil Aviation Organization (ICAO) has divided the workload faced by controllers into the visible load (measurable control time consumption) and the invisible load (controller thinking time). These categories were put forward by the task method named by the Directorate of Operation Research and Analysis (DORATASK) and the method named by Messerchmitt-Bökow-Blohm (MBB), and have both been widely used in the measurement of controllers’ loads [9,10,11,12]. Secondly, subjective evaluation methods utilize hierarchical systems to allow controllers to subjectively evaluate their psychological load, taking into account factors such as tension, pressure, and operational difficulty. The main current subjective evaluation methods include the Subjective Workload Assessment Technique (SWAT), the NASA Task Load Index (NASA-TLX), the Air Traffic Workload Input Technique (ATWIT), and the Pass method [13,14,15,16]. These approaches are carried out through the use of questionnaires filled in by the subjects. Lastly, physiological evaluation methods conduct an evaluation of a controller’s cognitive load by measuring the changes in physiological indicators produced by the controller during their work. The most commonly used indices are the cardiac activity index, eye movement analysis index, electroencephalogram (EEG) analysis index, and speech analysis index [17,18,19,20,21,22,23,24,25]. These methods use a variety of tools and equipment to measure the physiological indicators of ATCs to ensure the objective and real-time nature of the data collected. These data can then be analyzed to assess the cognitive load, taking into account changes in the controllers’ rhythm.
Both the subjective and task assessment methods have poor accuracy and cannot accurately reflect the cognitive load faced by controllers in real time. In contrast, physiological measures provide a continuous and objective reflection of cognitive load in real time, allowing detailed trends to be recorded. Therefore, in recent years, the use of physiological indicators to measure cognitive load has become a popular area of research [26,27,28,29,30,31]. However, there are two key issues that need to be addressed in this field.
The first issue involves determining which physiological parameters are best suited to the assessment of cognitive load with minimal interference and maximum practicality. This requires the careful consideration of various factors, such as the reliability, validity, intrusiveness, and sensitivity of each physiological measure. Bernhardt et al. [18] collected EEG and pupil diameter data from controllers in different regulatory scenarios and used statistical methods to verify the sensitivity of the EEG load index and pupil diameter to changes in cognitive load. Radüntz et al. [20] pioneered the dual-frequency head maps (DFHM) approach to assess workload using an instantaneous self-assessment questionnaire; these authors also constructed the DFHM-workload index based on their EEG data and validated the reliability and stability of the index. Subsequently, a study investigating cardiovascular indices showed that all cardiovascular biomarkers responded to changes in workload, though on different timelines [21]. Nevertheless, it should be noted that the aforementioned techniques have certain restrictions. It should be acknowledged that the collection of EEG and cardiovascular information necessitates the use of advanced measurement equipment, coupled with the need for proximal contact between the equipment and the operator. This inevitably has additional environmental implications that need to be considered.
The ATC requires access to several screens, including panoramic surveillance, radar, and meteorological screens, in order to gather video information during the ATM process. In addition to this, they need to use remote voice communication devices to collect audio information to form an overall awareness of the command scene [32]. This research opted to utilize speech parameters as an approach to assess the cognitive load of ATCs, while considering their current working environment. The selection of speech parameters was based on their cost-effectiveness and non-intrusiveness. A major advantage of this approach is that the communication channel required for air traffic control already exists, which eliminates the need for supplementary equipment to capture voice signals. Moreover, the process of recording speech parameters does not interfere with the controller’s work, ensuring that no additional cognitive load is imposed.
The second issue pertains to the selection and optimization of features for effective measurement of cognitive load. This involves identifying the most informative and relevant features and optimizing them to enhance their accuracy and sensitivity. Over the past decade, speech-based cognitive load assessment has gradually become a research topic due to the limited interference of speech signals and their information-rich nature. In this regard, researchers have explored the applicability of various speech parameters, including average energy, zero-crossing rate (ZCR), pitch frequency, speech speed, Mel spectrogram, Mel frequency cepstrum coefficient (MFCC), and Perceptual Linear Prediction (PLP) [33,34,35,36,37,38]. Among them, the MFCC and Mel spectrogram are the most popular in the field of speech recognition. A convolutional neural network (CNN) was used to derive the MFCC features and classify the different levels of cognitive load, and the results showed that the recognition accuracy was superior to the conventional support-vector machine (SVM) and k-nearest neighbors (KNN) methods [37]. In addition, a CNN architecture was also employed to estimate the workload of ATCs based on spectrograms, which were then used to evaluate team performance in real time [4]. The main difference between the feature extraction process of the MFCC and Mel-frequency spectrogram is the addition of a discrete cosine transform (DCT) step in MFCC, which serves to decorrelate the filter bank coefficients. As the DCT is a linear operation, it makes the MFCC less correlated, which benefits linear models such as the Gaussian mixed model [39]. However, in neural networks, the first layer usually also performs a linear mapping of the input features onto a set of intermediate features; thus, the DCT is somewhat redundant and will increase the computational complexity. Accordingly, the Mel spectrogram is more suitable as an evaluation feature in deep learning models.
Speech is a complex signal that varies with time and has long-term correlations across frames [40], but these traditional speech feature extraction models do not pay enough attention to temporal information. The potential space for sequential encoding has been profoundly temporalized in the last three decades with the introduction of recursive neural networks (RNN), long short-term memory (LSTM), bidirectional LSTM, and LSTM with attention mechanisms [41,42,43,44,45,46,47]. Gallardo et al. [42] used the Mel spectrogram as an input feature, using LSTM networks with different weighted pool strategies and external attention models to distinguish tasks with different levels of cognitive load in the “Cognitive Load with Speech and EGG” dataset [48]. The Transformer’s multi-head self-attention layer enables the system to analyze multiple previous time steps when predicting the next time step, giving the network an almost true global temporal representation of sequential data. This is in contrast to the LSTM network, which can just understand and forecast frequency changes depending on nearby time step data [49]. As a result, the experiment involved the use of the Transformer to extract time-based characteristics from the audio data. This method was chosen because of its ability to capture the temporal characteristics inherent in speech [50]. This decision was made considering the importance of accurately representing the time domain properties of speech in the results of the experiment.
The available literature on the cognitive load experienced by air traffic controllers suggests an urgent need to assess, identify, and quantify the cognitive load borne by air traffic controllers, especially in demanding scenarios characterized by complexity, dynamics, and increased intensity. And, there has been a lack of quantitative research on the level of cognitive load. However, correlation studies furnish a solid scientific rationale for the selection of evaluation metrics. In addition, it is essential to consider their practicality of the selected physiological metrics in the operational environments. Hence, the selection of physiological parameters must be grounded in objective and practical criteria. Also, extracting representative features from the complex physiological data is crucial to improving the accuracy of the assessment. This study proposes the use of a deep learning algorithm to analyze speech parameters for assessing cognitive load in controllers, which holds considerable theoretical importance and practical utility. In summary, the main contributions of this article are as follows:
Firstly, a dataset for the assessment of cognitive load in controllers, referred to as CCLD, was collected and developed by utilizing speech data to produce Mel spectrograms for the purpose of conducting this study. Secondly, we implemented stacked CNN and Transformer encoders (SCNN-TransE). By utilizing this model, we were able to extract both spatial and temporal features from the Mel spectrograms generated from the speech dataset. The combination of these features facilitates a comprehensive and exhaustive analysis of the gathered speech data. This improved analytical methodology enables us to acquire a more profound comprehension of the influence of workload on controller performance.
The structure of this paper is as follows. The second part describes the process framework of cognitive load assessment. The third part introduces the speech feature Mel-spectrogram generation method. The fourth part introduces the SCNN-TransE for the extraction of depth optimization features. The fifth part provides a brief description of the experimental data and parameters, sets up verification experiments, conducts a detailed analysis of the experimental results, and compares the performance of the algorithm with other methods. And, eventually, the full text is summarized, and the future direction of controller cognitive load assessment is discussed.

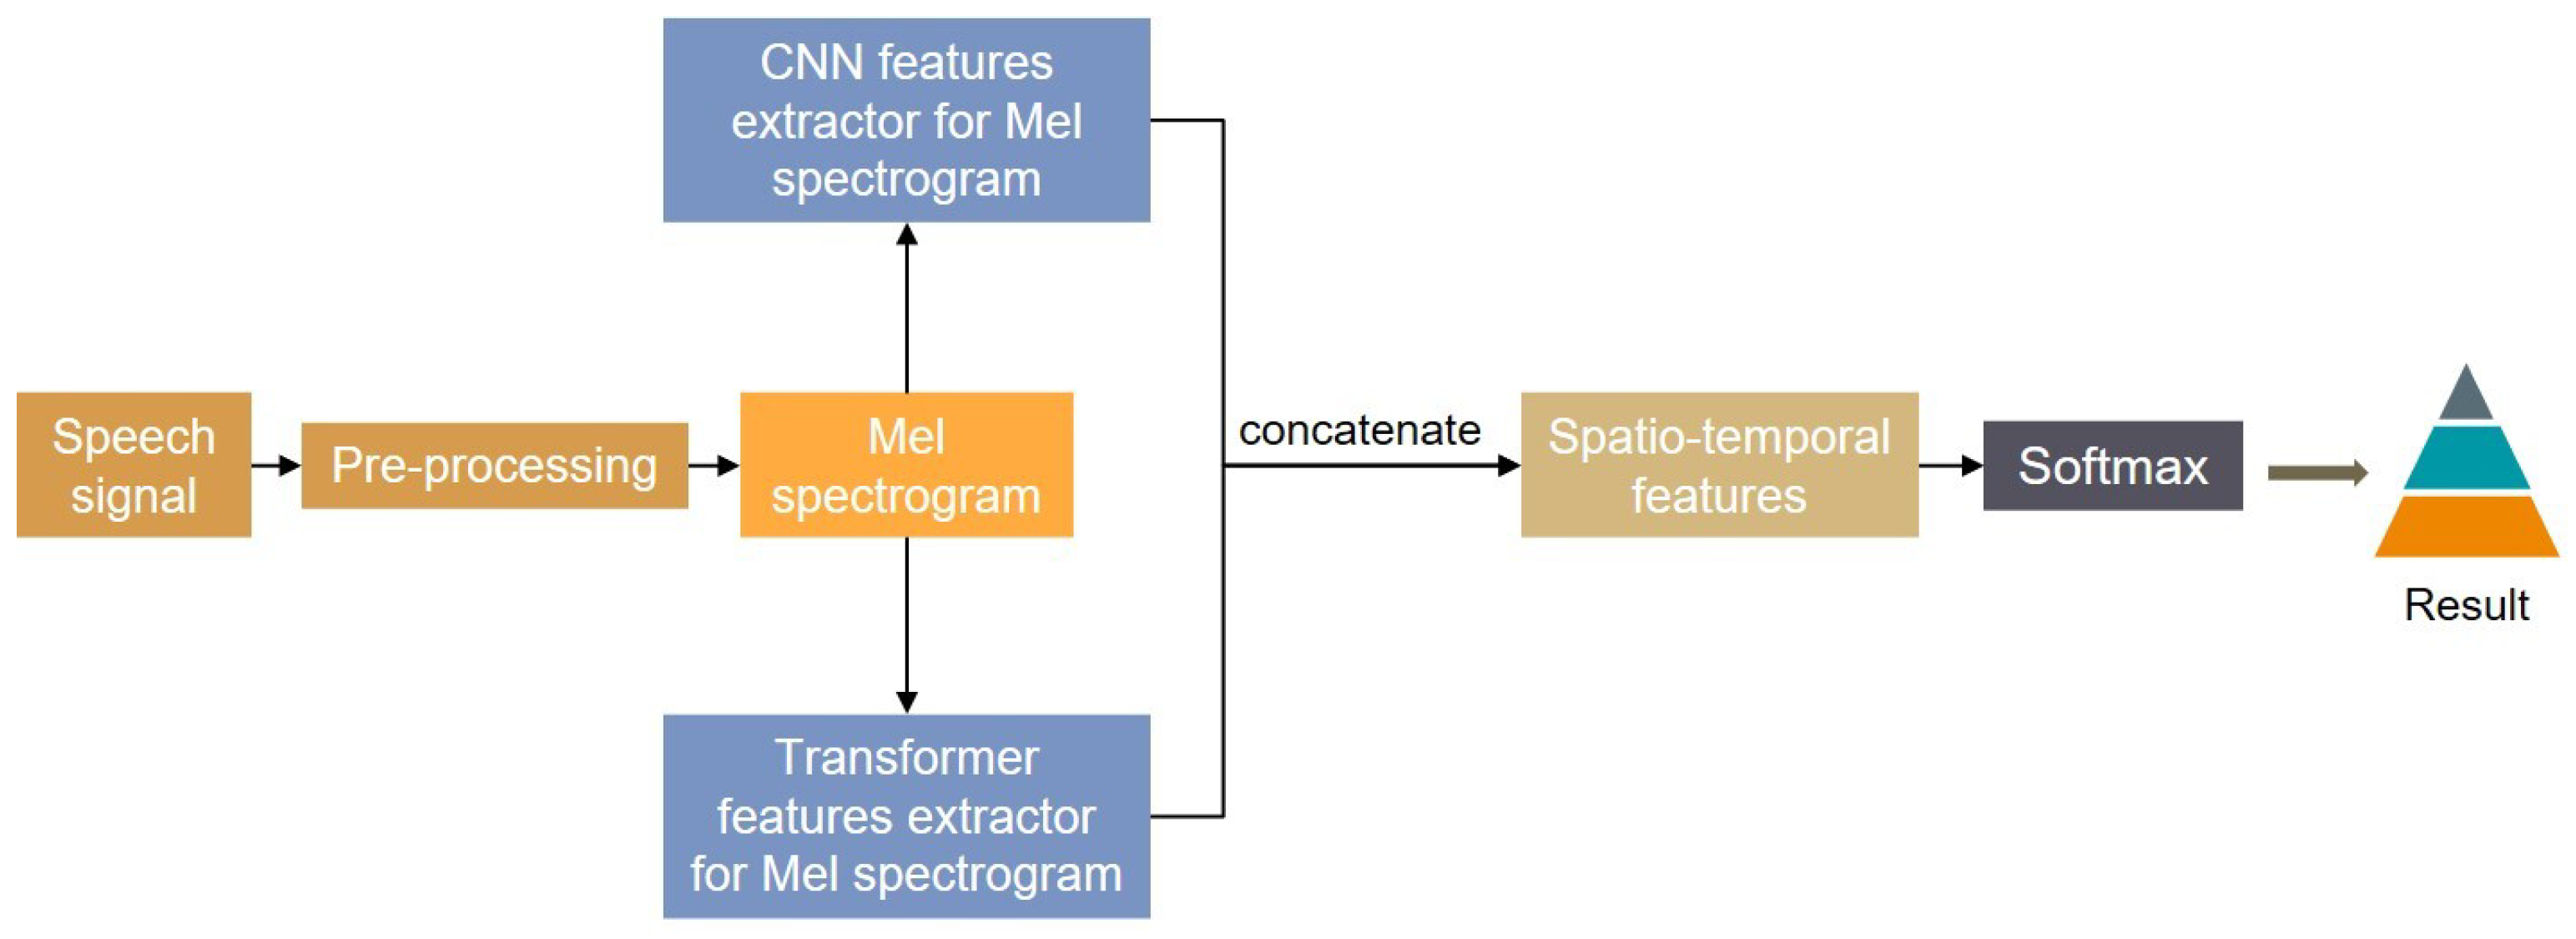
2. Architecture of Cognitive Load Assessment

As depicted in Figure 1, the entire evaluation procedure is primarily divided into four main stages: pre-processing of the speech recordings, generation of the Mel spectrogram, concatenation of the spatio-temporal features, and the classification stage.
(1)
Pre-processing of speech recordings: Endpoint recognition and segmentation are utilized to pre-process audio recordings.
(2)
Generation of Mel spectrogram: The dataset is obtained by further processing the audio signal, creating Mel spectrograms, and applying additive white Gaussian noise (AWGN) [51] enhanced data.
(3)
The CNN-TransE model is trained using the spatial features extracted by the CNN and the temporal features collected by the Transformers, which are concatenated into deep temporal features.
(4)
Classification: The stacked features are sent to the Softmax layer for identification.

3. Speech Data Processing

The first step of delving into speech-based cognitive load evaluation involves the creation of a database that focuses on cognitive load in speech. It has been observed that when ATCs operate under high workloads, their cognitive faculties, including attention, memory, and decision-making abilities, are all impaired [4,5]. A meticulous analysis of the gathered information reveals that ATC overload is often exhibited through symptoms such as stuttering (indicating faulty command memory), hesitation (suggesting an unclear comprehension of the air situation), and even the reversal of previously given instructions (leading to incorrect guidance).

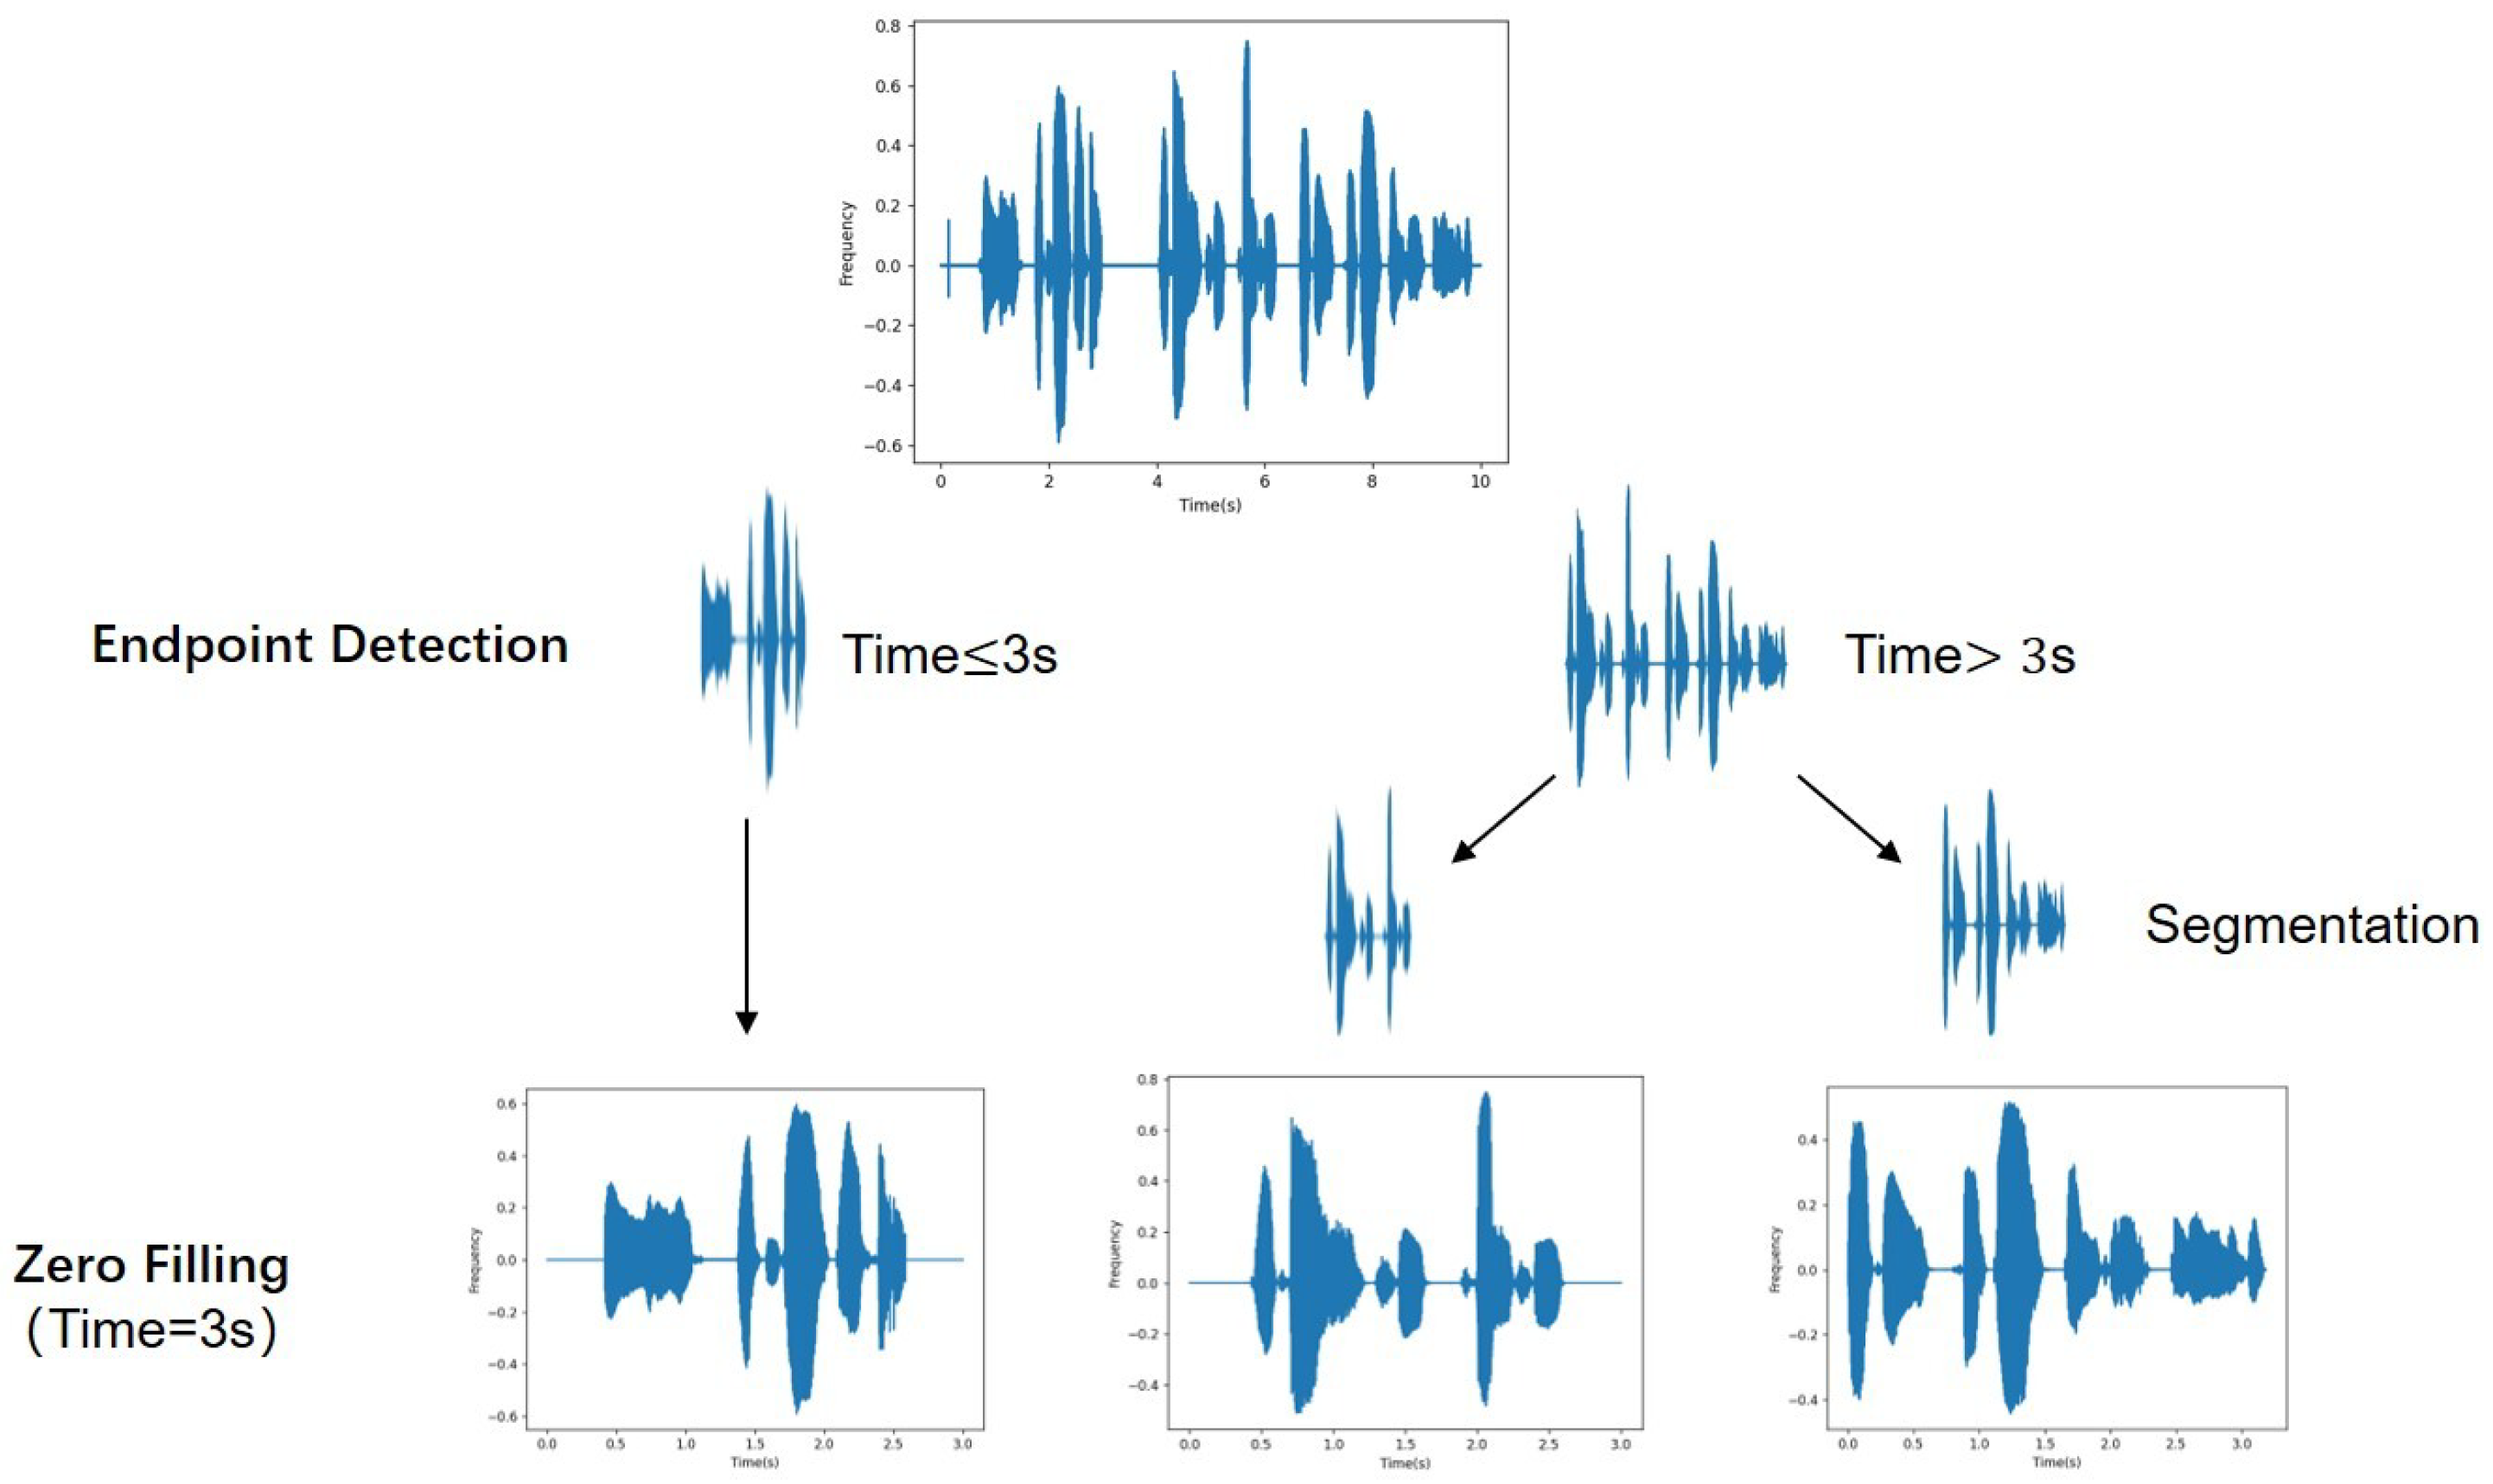
3.1. Endpoint Detection and Segmentation

Identifying the original speech data endpoints and separating the speech fragments containing instructions are required before creating the Mel spectrogram. Endpoint detection refers to the technology of identifying the start and end of a speech segment from signals, which can differentiate between speech and non-speech segments.
This paper uses a double-threshold method based on short-time energy and short-time zero-crossing rate to identify the endpoint of speech data. It has been observed to produce positive results in a high signal-to-noise ratio environment. The energy of the speech signal changes with time, and the short-time energy analysis of the signal reflects the amplitude change in the signal. On the other hand, the short-term zero-crossing rate refers to the number of times the signal passes through the zero value in each frame, and the short-term zero-crossing rate can reflect its spectral properties to some extent [52]. This threshold-based method is straightforward in principle and easy to implement [53]. The practical steps of this method mainly include comparing the eigenvalues with a predefined threshold. First of all, a high threshold (TH) and a low threshold (TL) for short-term energy and zero-crossing rate, respectively, need to be determined. If the value of the features exceeds the TL, it indicates that the speech signal is likely to enter the speech segment. However, it can be confirmed that the voice signal only enters the voice segment when the value exceeds TH. This means that the speech segment ends when the value is lower than TL.
The findings from the statistical analysis indicate that the majority of speech fragments obtained have a duration of 3 s or less. As shown in the segmentation process in Figure 2, a minority of speech segments longer than 3 s are subject to manual segmentation. Ultimately, the final speech segments are obtained by the zero-filling operation for the speech segments less than 3 s.

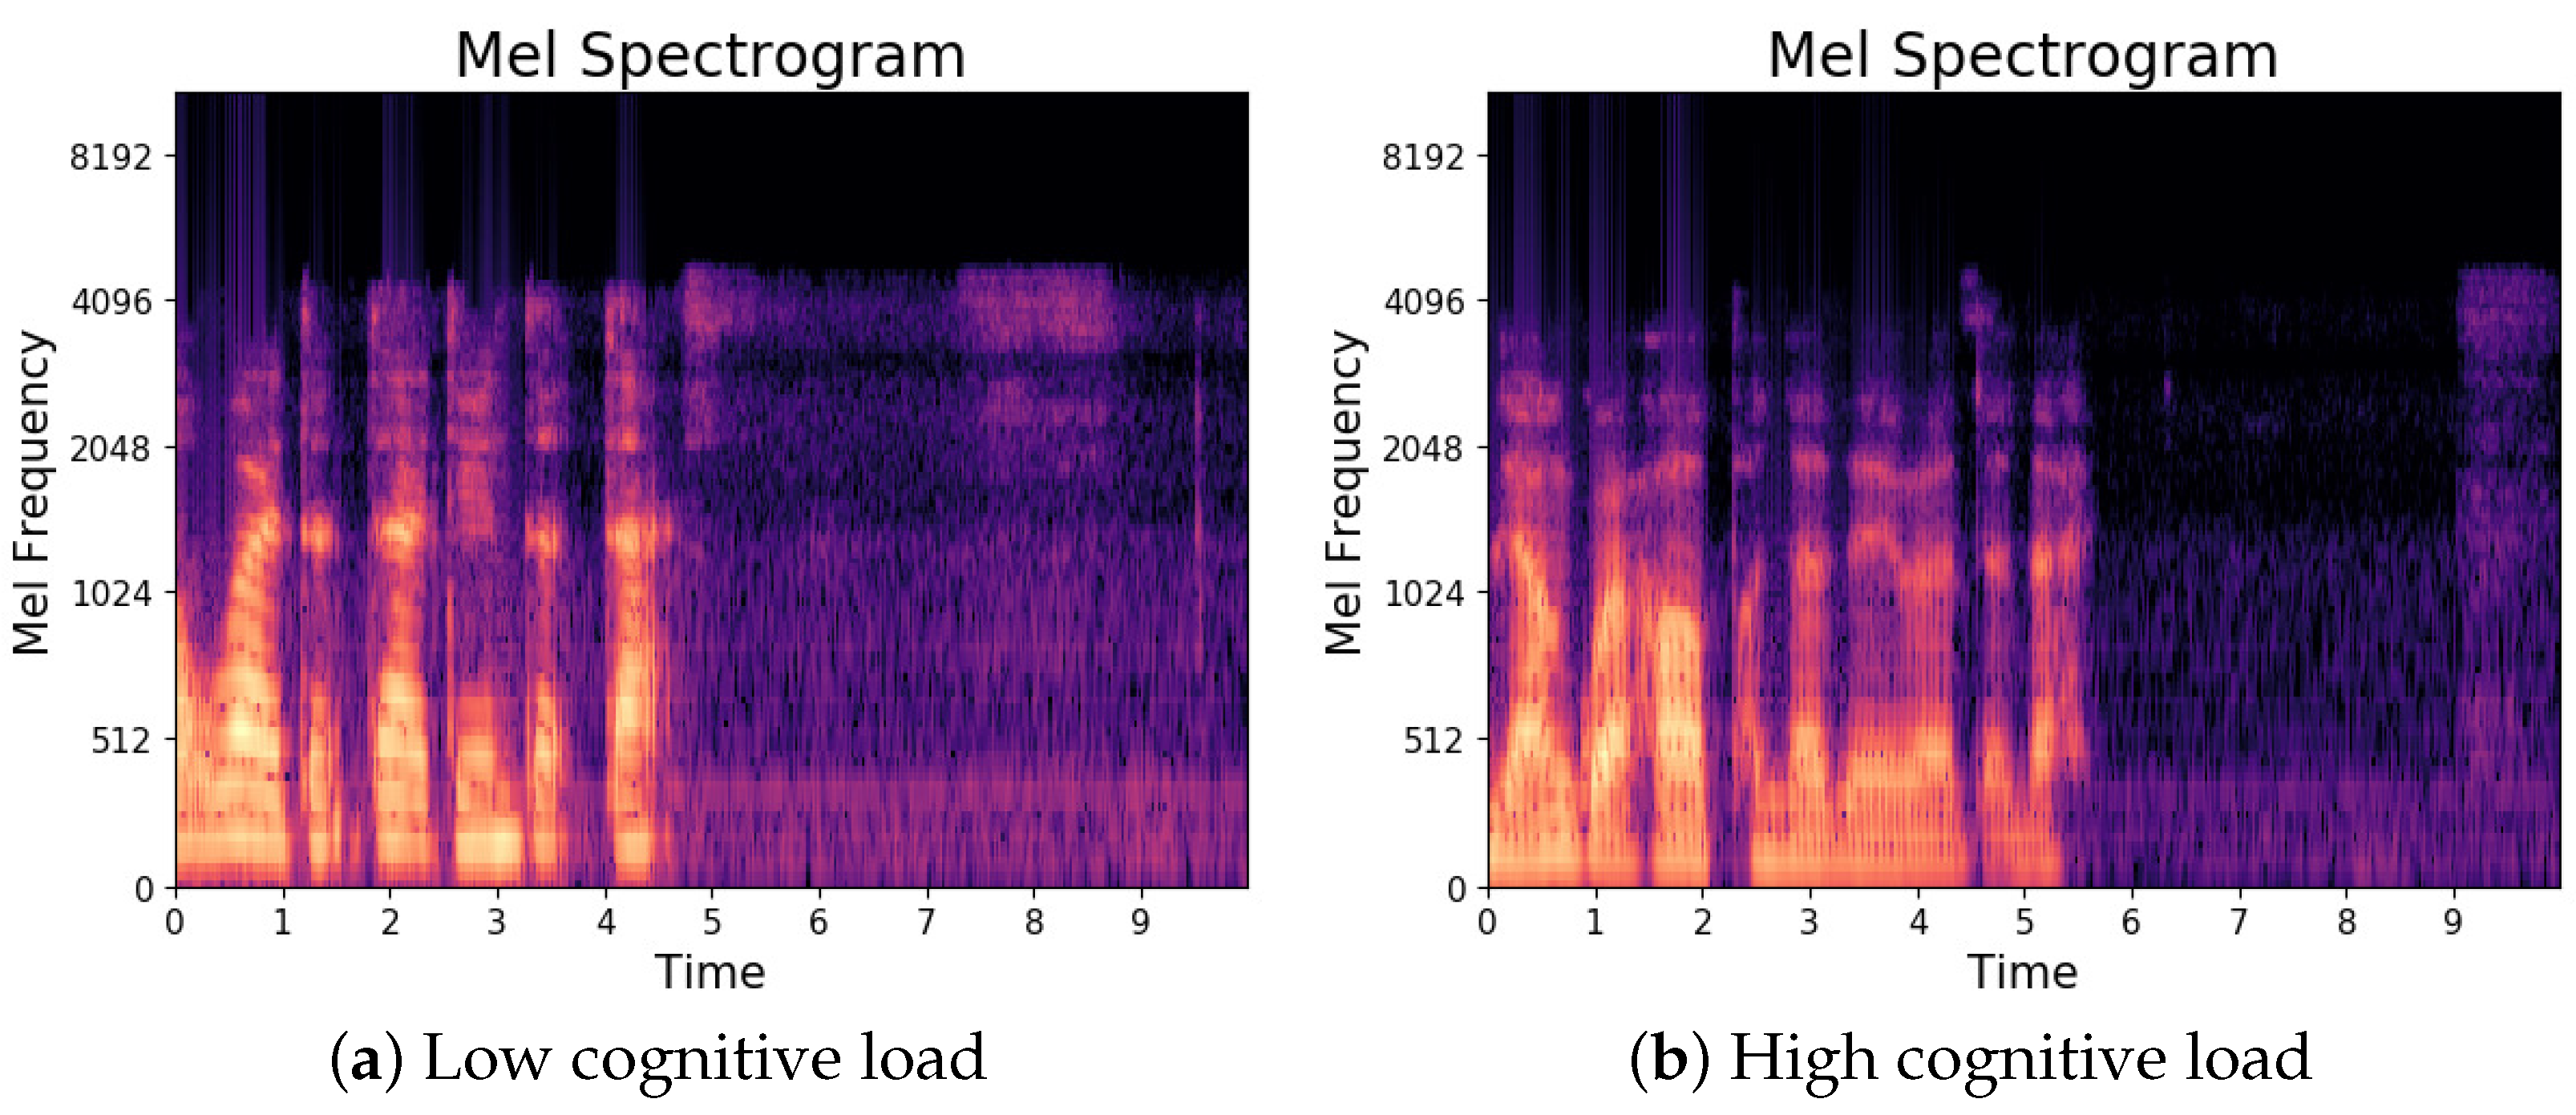
3.2. Generate Mel Spectrogram

The initial step in speech analysis, synthesis, and conversion involves the extraction of speech feature parameters. Extracting the Mel spectrogram from the audio signal requires pre-emphasis, framing, windowing, and Fast Fourier transform (FFT). Finally, the Mel spectrogram is obtained by the Mel filter bank.
  • Pre-emphasis: Generally, the intensity of the high-frequency components in an audio signal is lower than that of the low-frequency components [54]. The purpose of signal pre-emphasis is to pass the signal through a high-pass filter, which can prevent a large difference in the intensity between the high-frequency and low-frequency components of the signal. The pre-emphasis filter plays a role in balancing the spectrum and improving the signal-to-noise ratio (SNR). In the time domain, perform the following with the signal x ( t ) :
    y ( t ) = x ( t ) α x ( t 1 )
    where α represents the pre-weighted factor, usually in the range of 0.9∼1. x ( t ) and x ( t 1 ) indicate the speech signal at time t and t 1 , respectively.
  • Framing: After applying pre-emphasis, the signal needs to be segmented into short-term frames for the subsequent Fourier transform. The application of the Fourier transform necessitates input signal stability; however, the frequency of the speech signal varies with time. Consequently, the computation of the Fourier transform for the entire speech signal is meaningless. The speech signal is characterized as a short-time stationary signal where the frequency remains relatively stable over short time intervals. Therefore, it is essential to divide the speech signal into short-term frames and perform a Fourier transform on each frame individually to obtain a reliable estimation of the signal’s frequency distribution. The framing process is shown in Figure 3. An overlapping region should be established to reduce unnecessary changes in both the consecutive frames.
  • Add windows: After dividing the signal into frames, to strengthen the continuity of neighboring frames and to minimize spectrum leakage, each frame is multiplied by a window function. The Hamming window is used in this paper, as follows:
    W ( n ) = 1 a a × cos 2 π n N 1
    where n = 0 , 1 , , N 1 , N is the window length. The constant parameter a offers distinct hamming windows with variations observed across different a values typically set at 0.46.
  • FFT: Because it is often hard to figure out the properties of a signal in the time domain, the FFT of the signal can be used to convert it to the energy distribution in the frequency domain. Various energy distributions reflect various traits of speech [55]. Perform an N-point FFT to compute the frequency spectrum over each frame after windowing:
    S i ( k ) = n = 1 N s i ( n ) e j 2 π k n / N
    where s i ( n ) is the input speech signal; i symbolizes the number of time-domain frames; k = 0 , 1 , , N 1 , N represents the number of points of the Fourier transform, and the value of N is usually 256 or 512. The power spectrum can be obtained by taking the magnitude squared and divided by the corresponding number of FFT points.
  • Extract the Mel spectrogram by the Mel filter bank: Trigonometric filters can be employed to extract bands from the power spectrum using a predefined set of Mel scales. The combination of these frequency bands forms the Mel spectrogram. The Mel scale offers better discrimination at lower frequencies and is designed to imitate the non-linear sense of sound by the human ear [56]. Given the center frequency f ( m ) of each filter, the corresponding frequency response of each filter can be explicitly expressed as follows:
    H m ( k ) = 0 k f ( m 1 ) k f ( m 1 ) f ( m ) f ( m 1 ) f ( m 1 ) < k f ( m ) f ( m + 1 ) k f ( m + 1 ) f ( m ) f ( m ) < k < f ( m + 1 ) 0 k f ( m + 1 )
Figure 4 shows the Mel spectrograms with the same orders issued by ATCs under two load levels.

3.3. Additive White Gaussian Noise

Considering that our dataset is small and prone to overfitting, especially for the highly parameterized depth neural network model, adding white noise to the audio signal is expected to enhance the data. It has the ability to not only decrease the influence of random noise in the training process but also to generate fictitious new training samples and minimize the influence of inbuilt noise in the dataset.
The current study employs AWGN, a type of noise that is superimposed onto the signal. This noise is constantly present, regardless of whether a signal is present or not, and the power spectral density of white noise remains consistent across all frequencies. Gaussian white noise is a form of white noise that conforms to the Gaussian distribution in its probability distribution. The signal-to-noise ratio (SNR) is a critical metric for AWGN, as it measures the extent to which the amplitude of noise in the audio signal increases. Specifically, SNR is defined as the logarithm of the ratio of signal power to noise power:
S N R = 10 log 10 P s i g n a l P n o i s e = 10 log 10 x 2 n 2
P s i g n a l = 1 N k = 1 N x k 2
where x represents the original signal, n represents the noise signal, and N represents the original signal length.
If the signal-to-noise ratio of the sample is denoted by S N R after adding noise, then the signal power is obtained, and the noise signal formula is derived as follows:
P n o i s e = P s i g n a l 10 S N R 10 = x 2 N 10 S N R 10
Finally, the noise signal is amplified according to the Gaussian distribution, and the final noise signal can be obtained as follows:
n o i s e = r a n d o m ( N ) P n o i s e
where r a n d o m ( N ) is used to generate noise sequences as long as the signal length that obey standard Gaussian distribution.
In this paper, two generated AWGN-enhanced waveforms are added to the original dataset as new samples, resulting in a training set with three times the original number of samples.

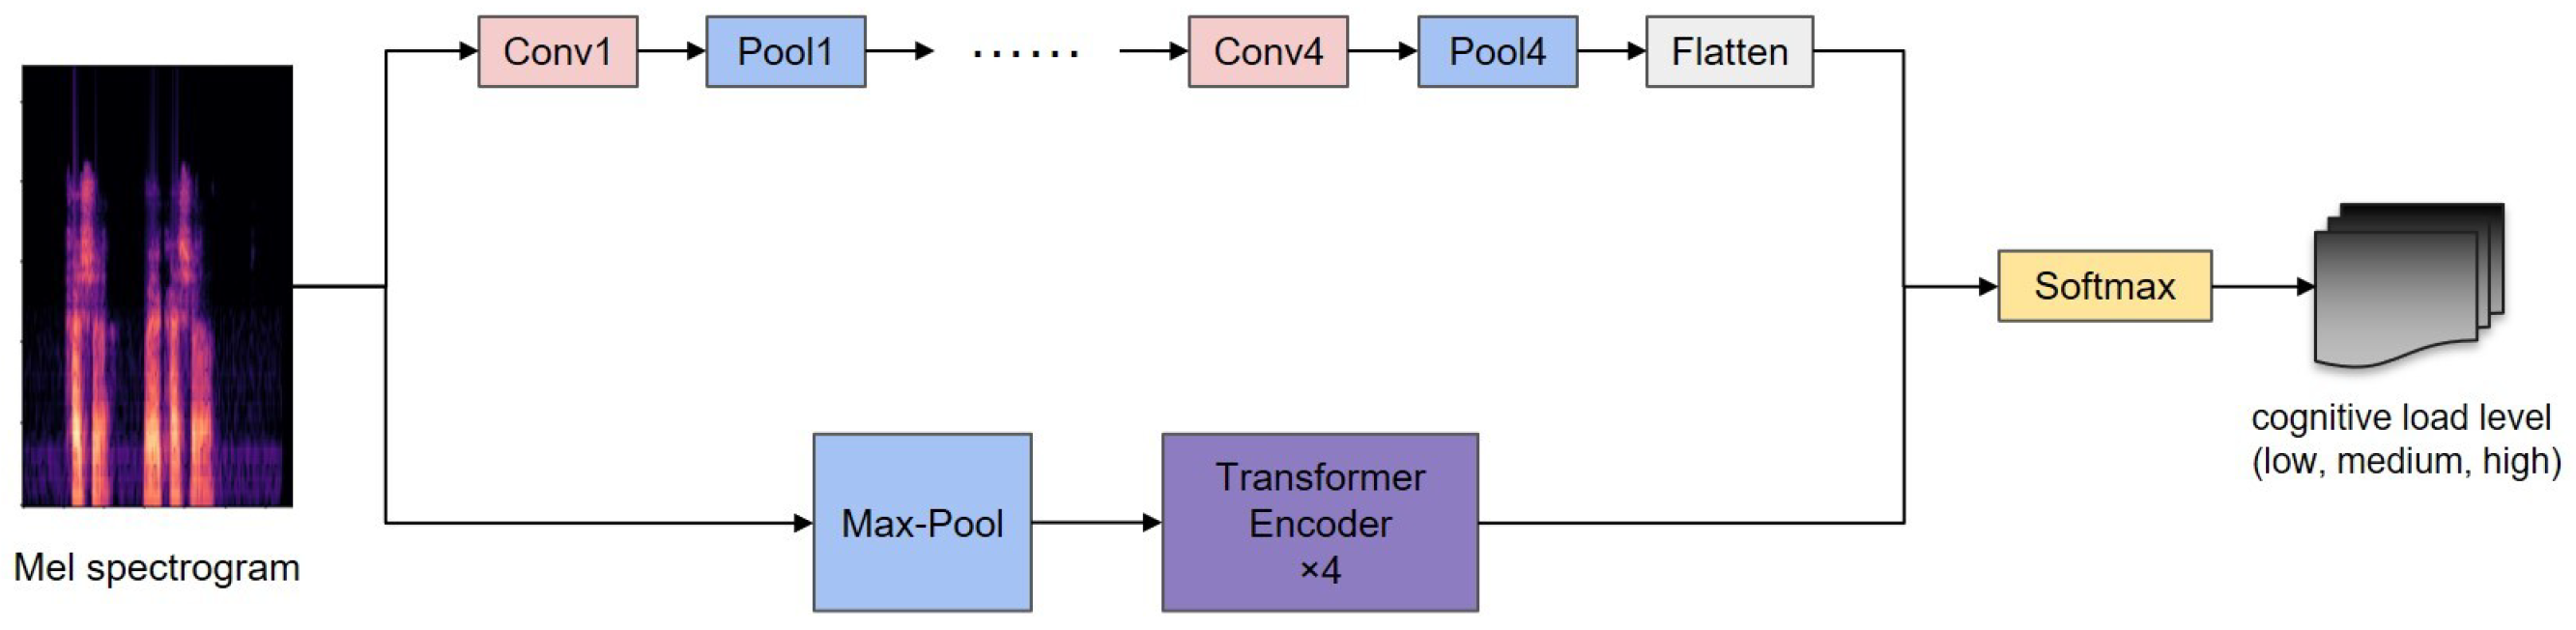
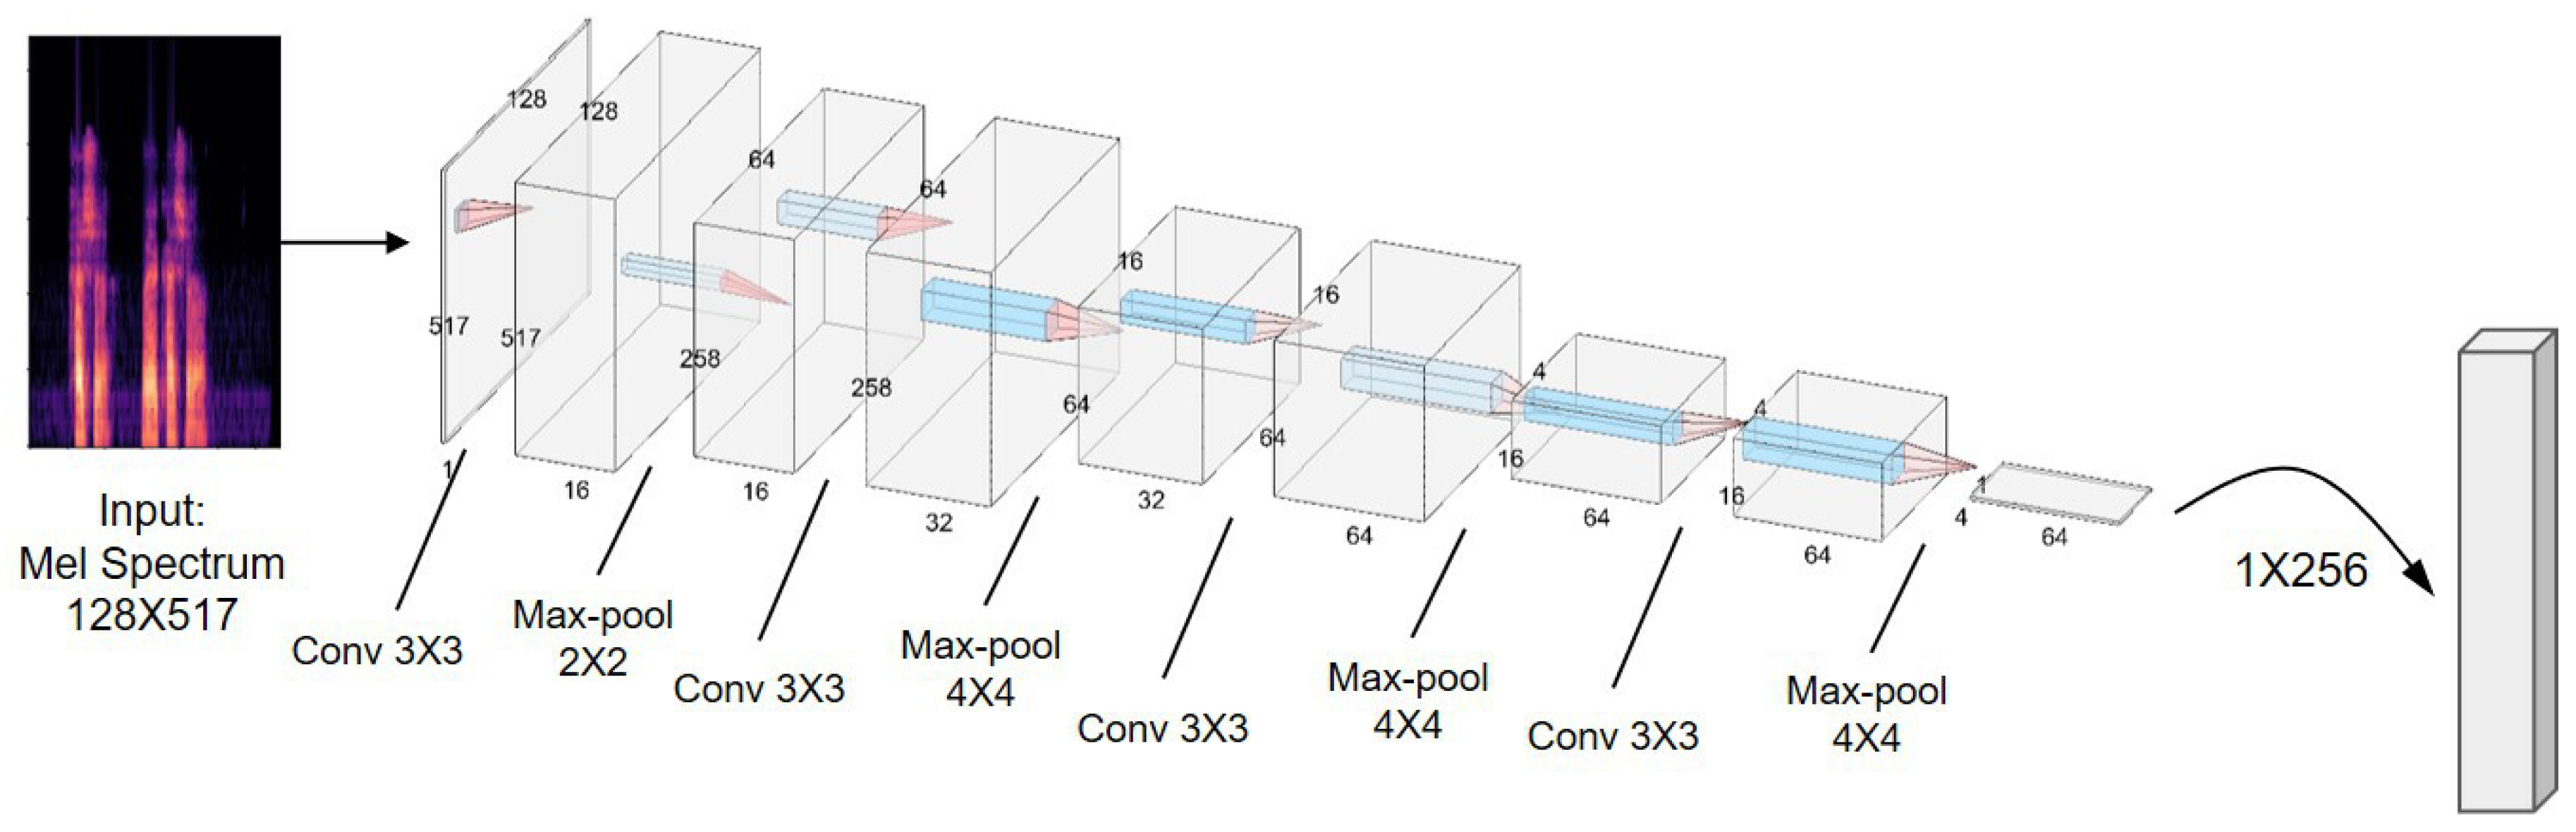
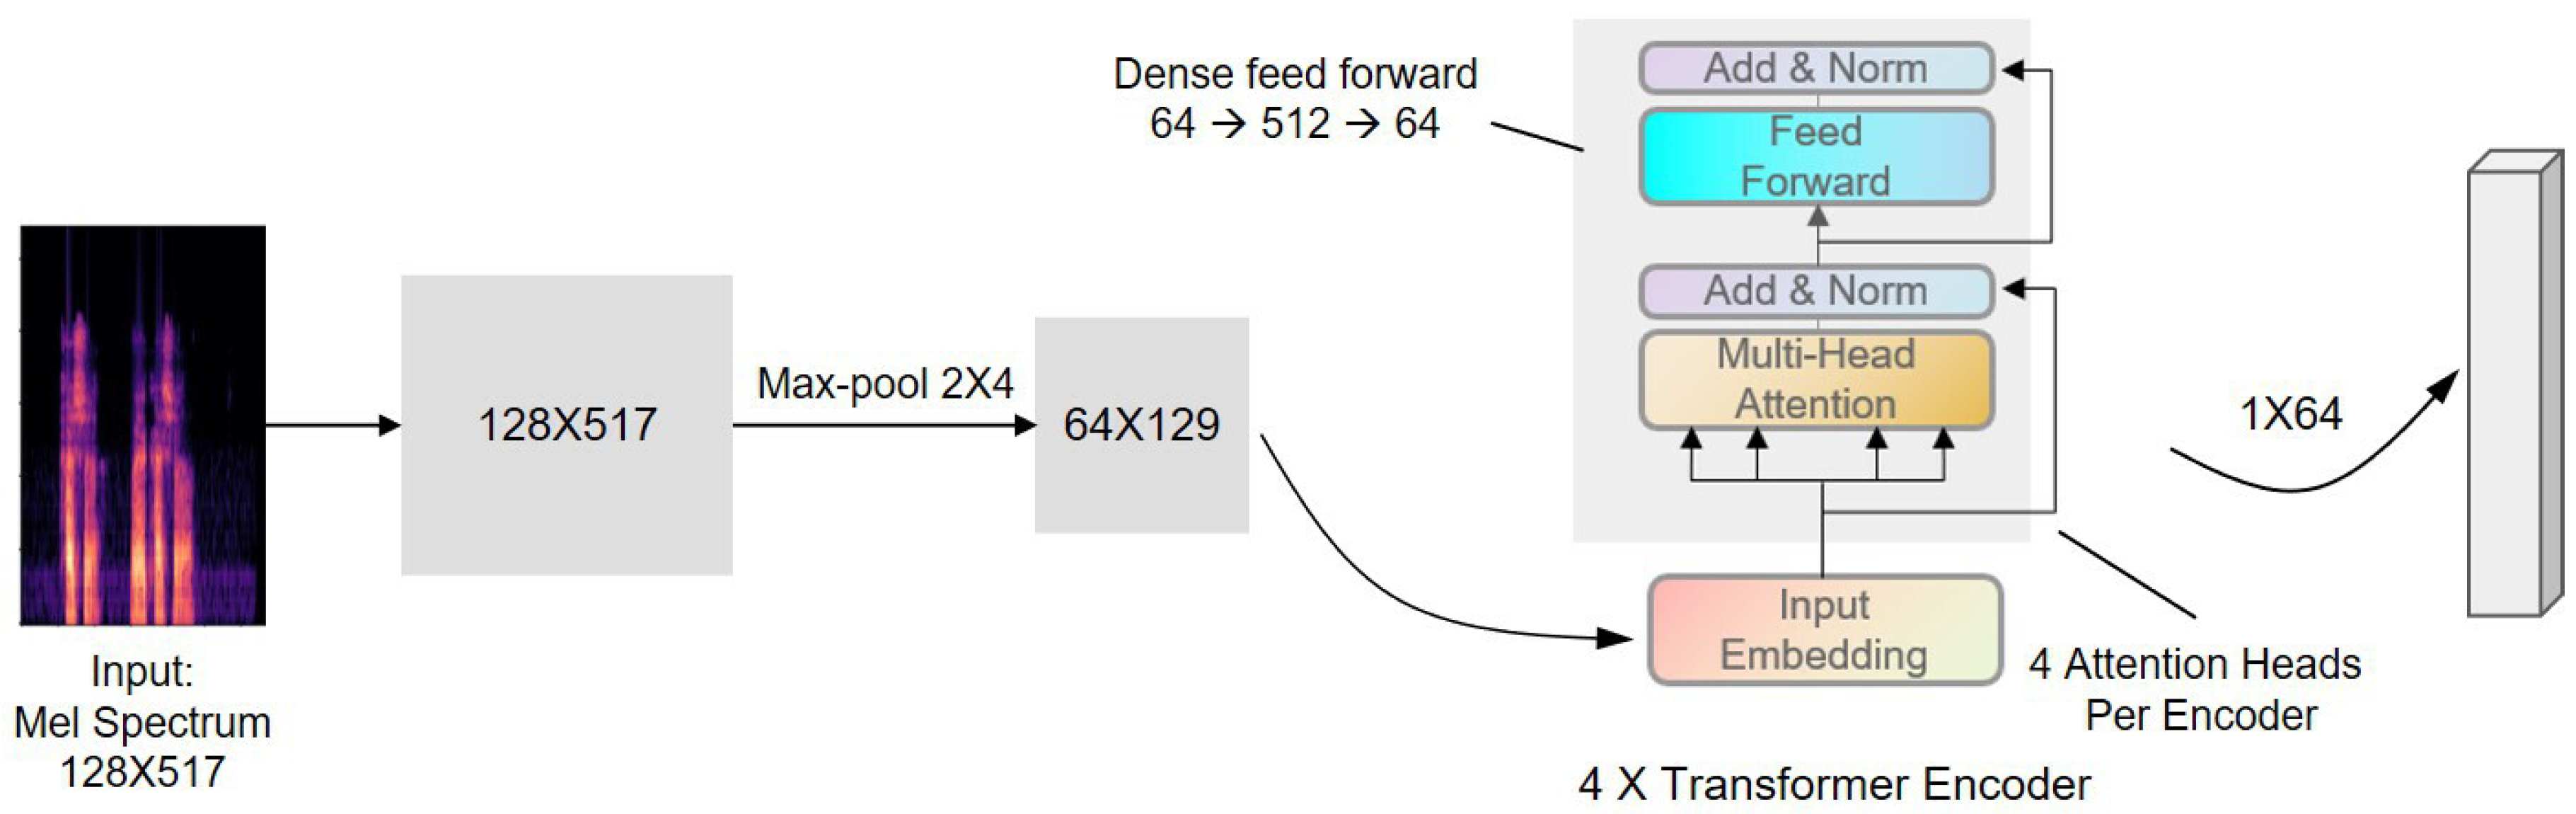
4. SCNN-TransE Network

The SCNN-TransE network presented in this study takes the form of a stacked CNN and Transformer encoder, which is apparent in Figure 5. Firstly, the Mel spectrogram is used as the initial input. Secondly, the CNN extracts the spatial characteristics. At the same time, the Transformer is used to extract the temporal features. Lastly, the Softmax layer is then used to classify the detection results.

4.1. Stacked Convolutional Neural Network

The CNN module’s structure and dimension transformation are displayed in Figure 6.
The 4-layer deep 2D convolution block is extremely comparable to the traditional LeNet [57] architecture: Conv, Pool, Conv, Pool, FC. AlexNet [58] laid the foundation for increasing the complexity of feature graphs by stacking CNN layer extensions. The inspiration for the parallel CNN layer is Inception and GoogLeNet [59], hoping to diversify the functions of network learning. VGGNet [60] greatly improved AlexNet by replacing the larger kernel with the smaller kernel of 3x3 stride1, which also applies to this task. In the four stacked CNNs with 3x3 cores, there are fewer parameters than in a large filter, and the nonlinearity between each small layer also conveys a more complex feature representation.
Max-pooling can be thought of as a dimensionality reduction or down-sampling technique for feature spaces. In this way, the max-pool layer lowers the dimension of the feature map on which convolution operates. Ultimately, the use of max-pooling significantly reduces the number of parameters required for a network to learn, resulting in a much lower number of connections between successive layers than would be present without max-pooling. Therefore, max-pooling is precisely what makes CNNs practical.

4.2. Transformer Encoder

As CNNs rely on convolution kernels to scan images, their ability to perceive information is limited by the size of the kernel. This means that they can only process elements that are within a certain range of the current element. In contrast, Transformers are able to perform long-range modeling, allowing them to establish global connections between elements and expand their visual field beyond the limitations of CNNs [61].
The self-attention module, which is an indispensable role of the Transformer, serves to find the similarity between different elements. Query–Key–Value ( Q , K , V ) are employed to calculate the attention mechanism, with the Q vector representing the sample feature, the K vector representing the information feature, and the V vector representing the information content. The following formula is available to calculate the attention value:
A t t e n t i o n Q , K , V = s o f t m a x Q K T D k V = s o f t m a x A V
A = Q K T D k is called the attention weight matrix. The attention weight matrix is converted into a standard distribution by the Softmax function, and then distributed to the specified Key elements, thus generating the final output vector. The gradient is smoothed by calculating the dot product of Q and K and dividing it by D k to prevent the gradient from disappearing.
The single-head self-attention mechanism restricts the model from focusing only on several elements so that other important elements are ignored. However, the multi-head self-attention mechanism allows the model to be expressed more powerfully due to its potential to portray from several perspectives. The unit of the multi-head self-attention mechanism is the core of the Transformer. The multi-head mechanism can be thought of as performing multiple independent attention calculations, as shown in Equations (10) and (11).
M u l t i - H e a d ( Q , K , V ) = h e a d 1 ; ; h e a d h W O
h e a d i = A t t e n t i o n Q W i Q , K W i K , V W i V
where W i Q , W i K , W i V , and W O are linear projection matrices. h shows the number of attention heads, but more heads do not mean a better model [62]. The proposed model includes four attention heads for the Transformer encoder.
The Transformer is a typical encoder–decoder architecture, and only encoders are used in this model. As depicted in Figure 7, before defining the Transformer encoder layer, the input feature map is max-pooled with a rectangular kernel. The Transformer encoder block is composed of four instead of the originally used six identical stacked encoder layers. Each of the encoders consists of a self-attention module and a location-based forward input network, and the outputs of the two modules are processed by residual connection and layer normalization.

5. Experiments and Results

5.1. Experiments Data

In this work, it is expected that by controlling the duration of the continuous work, the remaining mental resources of the subjects will be altered, thus affecting their cognitive load. The heart rate, systolic pressure, and diastolic pressure of the subjects were measured before performing the tasks to ensure their physical health. The physiological data of the controllers were collected during the control simulation tasks under the radar control of the airport tower in a laboratory environment, while the subjective scale scores of each subject before and after the task were recorded to create the CCLD dataset. And, the speech data were divided into three cognitive load levels: low, medium, and high. In the experiment, the voice data of eight subjects with air traffic control experience were collected during the control task using the same headset as the actual operation environment for about 5.5 hours, and the recorded voice was played through the equipment to check the recorded voice data. Furthermore, according to the “Air Traffic Control Post Training Outline”, the number of aircraft set by the simulator training institute was 8∼16 and the control instructors or control trainees were responsible for operating the aircraft after receiving instructions. Excluding the abnormal voice caused by external factors, such as the microphone being too far away from the subject, mistakenly recording blank voice files and other problems, a total of 1181 valid voice recordings lasting 3 seconds each were acquired after endpoint detection and segmentation.
This dataset stands out in that it was specifically constructed for the purpose of evaluating controller workload. Through the collection and construction of this dataset, we aim to provide a more comprehensive and accurate understanding of the impact of workload on controller performance. The dataset is not limited to speech data alone; it also encompasses some eye-tracking data collected using a contactless eye-tracker device and heart rate data collected using a fitness bracelet. The additional information provides researchers with extensive insights into the subjects’ physiological responses during the data collection process. With these supplementary measurements, the dataset is a more comprehensive and robust source of information for future research.

5.2. Parameter Setting

In order to effectively reserve more details of the speech signal and take into account the size of the input of the model, a Hamming window with a length of 512 is used to window the audio signal. Further, the length of the FFT and the number of Mel frequency bands are set to 1024 and 128, respectively, which enables the generation of the Mel spectrogram with a time step of 517. In the training process of the SCNN-TransE model, the training set ratio, epoch, batch size, learning rate, and dropout rate were set to 0.8, 200, 32, 0.01, and 0.3∼0.4, respectively. These parameter settings yielded positive results, as evidenced by the findings of the experiment.

5.3. Evaluation Indexes

Accuracy, Macro-F1 score, and area under curve (AUC) are used as model evaluation metrics in this paper. The accuracy is calculated as shown in Equations (12) and (13), where A c c i is the classification accuracy for category i ( i = 1 ; ; N ) . T P i is the amount of samples that predict category i as category i; F P i is the number of samples that predict other categories as category i; T N i is the amount of sampling that predicts other categories for other classes; F N i is the amount of sampler that prediction category i for other categories.
A c c i = T P i + T N i T P i + T N i + F P i + F N i
A c c u r a c y = 1 N i = 1 N A c c i
The F1-score is a statistical index that measures the accuracy of a binary classification model by taking into account both its precision and recall rate. F1-score can be seen as a weighted average of precision and recall, with a maximum value of 1 and a minimum value of 0. In a multi-label classification task, F1-score can be calculated for each class, and it is obvious that the F1-score of all classes need to be combined. The macro-average method is used to obtain the M a c r o _ F 1 score in this paper, that is, after calculating the precision and recall of each category, finding the F1-score of each category, and finally calculating the M a c r o _ F 1 :
F 1 i = 2 P r e c i s i o n i R e c a l l i P r e c i s i o n i + R e c a l l i
M a c r o _ F 1 = 1 N i = 1 N F 1 i
where F 1 i is the F1-score for category i. P r e c i s i o n i and R e c a l l i are the precision and recall for category i, which are calculated using Equation (16) and Equation (17), respectively.
P r e c i s i o n i = T P i T P i + F P i
R e c a l l i = T P i T P i + F N i
The AUC metric represents the area under the receiver operating characteristic (ROC) curve. The True Positive Rate (TPR) and False Positive Rate (FPR) are shown on an ROC curve to visualize their trade-off and make considerations for further tuning. Typically, ROC curves are used for binary classification, but in this paper, ROC curves are plotted for each category, the AUC value of each category is calculated, and finally, the average value is taken. This allows for a more detailed evaluation of the classification performance across multiple categories.

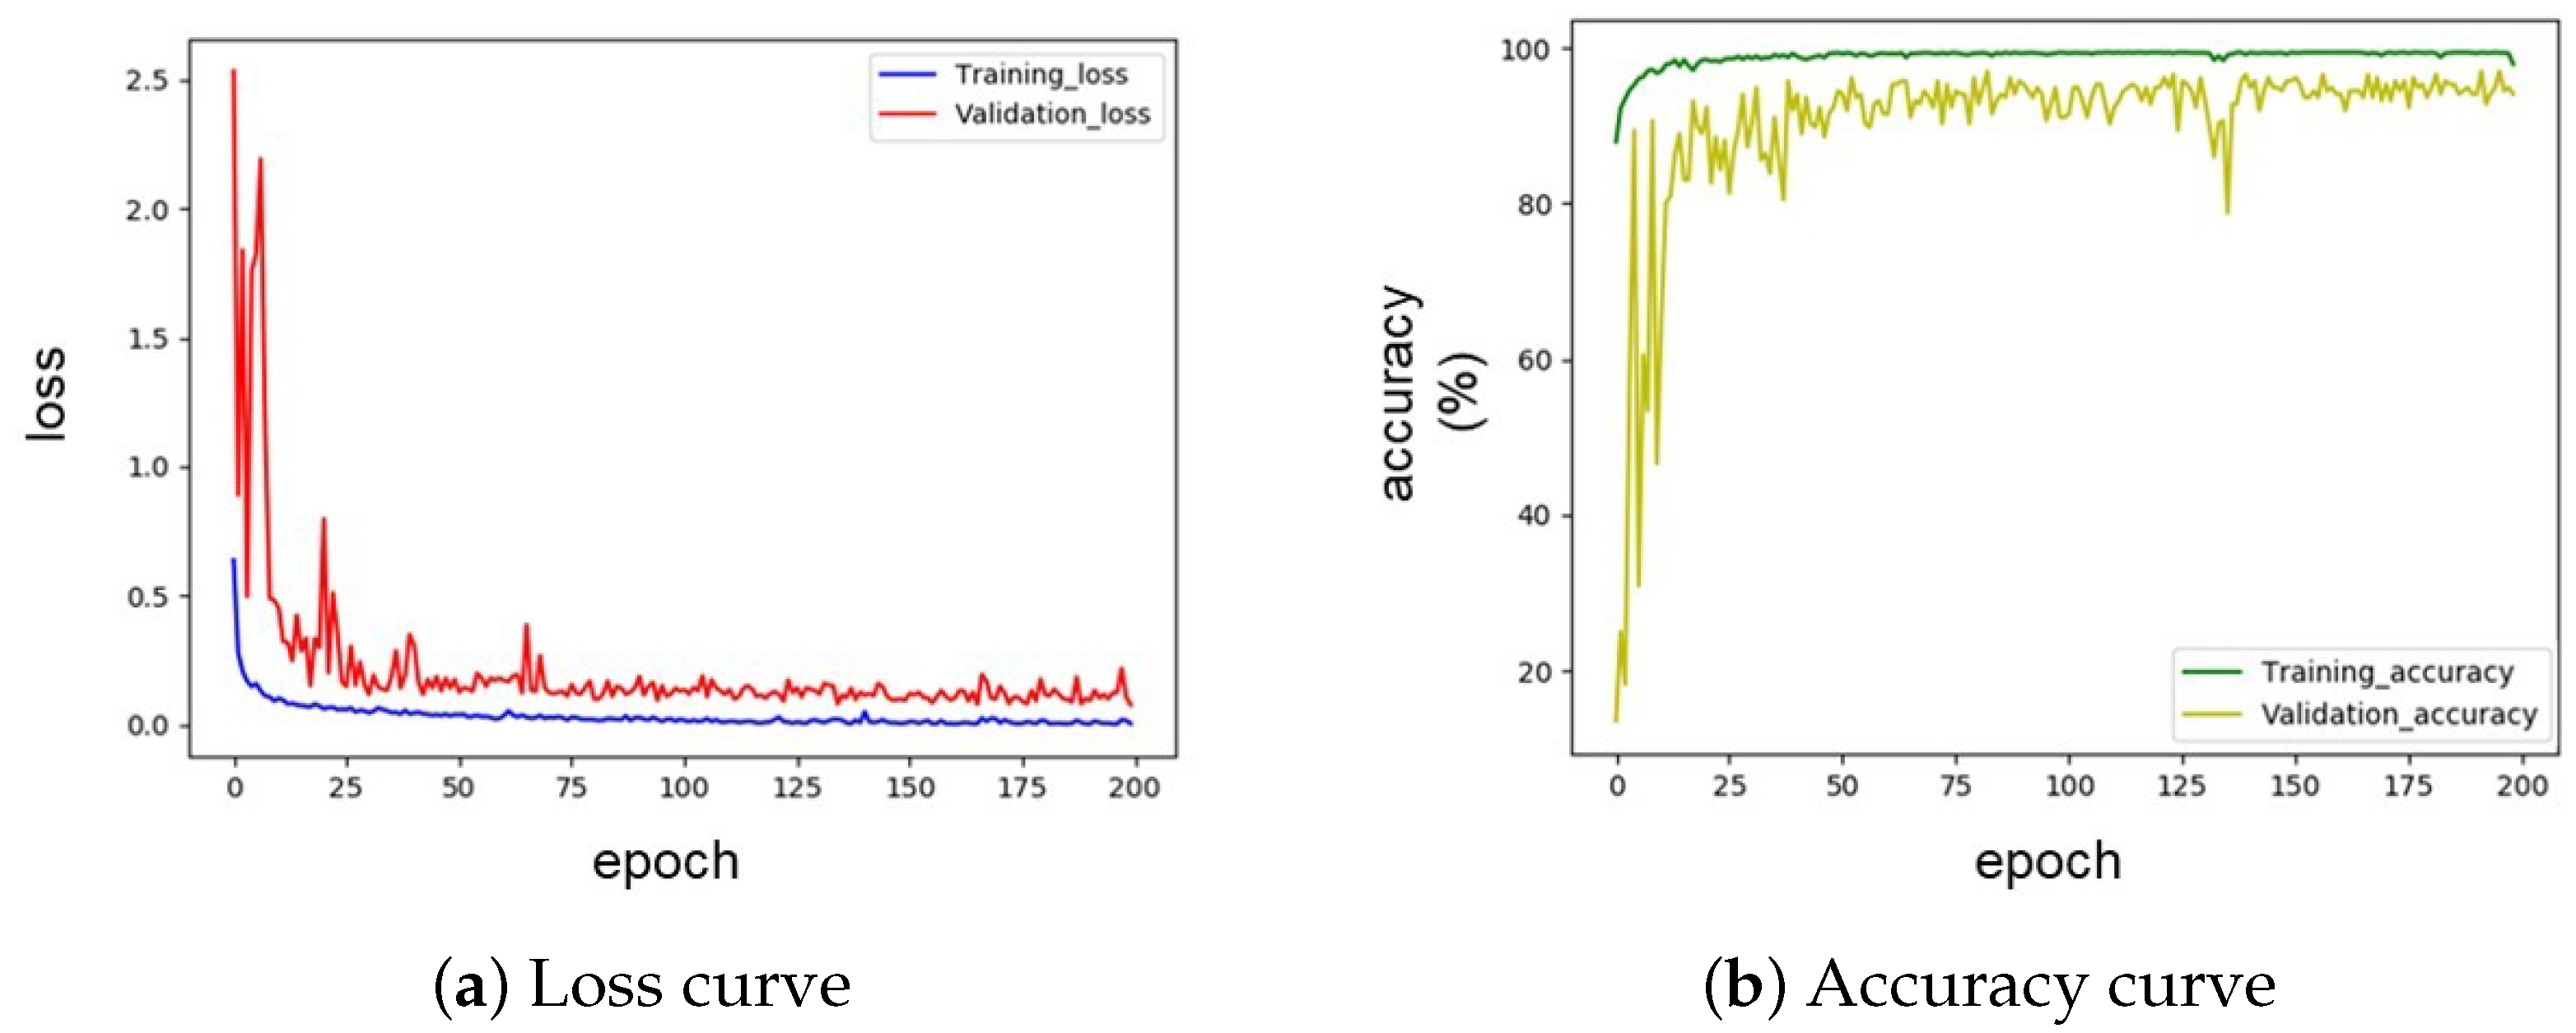
5.4. Result and Analysis

5.4.1. Algorithm Verification

In fact, it is not difficult to find that changes in an individual’s emotional and cognitive state have an impact on their phonetic expression. Specifically, when an individual experiences negative emotions, there is a marked change in their pronunciation rhythm, resulting in a tendency to repeatedly correct and reiterate their statements, and frequently show abnormal phenomena such as hesitation and pauses. In other words, it is reasonable to assume that if the proposed method performs well in the task of speech emotion recognition (SER), it should also be competent in the task of speech cognitive load assessment. Here, in order to verify the effectiveness of SCNN-TransE, three general speech emotion datasets, Ravdess [63], URDU [64], and TESS [65], are chosen for the verification experiment.
Table 1 shows the accuracy of SCNN-TransE in identifying different types of emotion across three datasets. The effect of the SCNN-TransE on the Ravdess dataset is not as good as that on the URDU dataset and the TESS dataset, because the Ravdess dataset contains two kinds of emotion data of normal and strong, but the recognition rate of emotion with less influence by emotional intensity such as disgust and calm, is still relatively high, at 89.47% and 84.21%, respectively. On the URDU dataset, the model more easily identifies the negative emotions of sadness and anger. Anger is often accompanied by an intense tone, while sadness is often accompanied by a low voice, which is obviously different from happy and neutral emotions. Finally, SCNN-TransE displays excellent performance on the TESS dataset. The recognition of the four emotions of happy, neutral, sad, fearful is at 100%, and the recognition of anger, disgust, and surprise is at over 95%.
Table 2 shows the comparison of the SCNN-TransE proposed with those of recent years on the TESS dataset. It presents the efficient performance of the SCNN-TransE with only one speech feature. As depicted in Table 2, the most efficient approach [66] involved using the MFCC, Mel spectrogram, ZCR, and chromagram as input features, while the model was also not simple. Comparatively, our proposed method achieves an accuracy that is only 0.23% lower, despite using only the Mel spectrogram as input, significantly reducing the amount of computation required. Thus, this analysis emphasizes the potential of the SCNN-TransE technique in producing noteworthy outcomes with minimal features. In addition, the duration of the TESS dataset is approximately 2 hours, with a total of 2800 pieces of data. According to the definition of the size of the dataset by [36], the TESS dataset belongs to a small sample dataset. Consequently, SCNN-TransE does not require a large amount of data training and is suitable for the case of small samples.
Figure 8 shows the ROC curve of the SCNN-TransE for the classification of each type of emotion on three datasets, and the solid black line is the average ROC curve of emotion classification. In Figure 8, the AUC values of the three average ROC curves are all up to 0.95, indicating that the capability of SCNN-TransE is better than that of random guesses, and its prediction effect is very accurate, which also means that the model can accurately identify positive and negative cases, and there is a good trade-off between the true case rate and the false case rate.

5.4.2. Assessment of Cognitive Load

From the results of the preceding experiments, it can be verified that the SCNN-TransE proposed achieves superior accuracy when handling the issue of multi-classification of small samples. In this section, SCNN-TransE is used to assess the cognitive load of controllers and is compared with KNN, RF, AdaBoost, SVM, and SCNN-LSTM-Attention, which uses LSTM-Attention to replace the Transformer block in the proposed network.
The original dataset includes 1181 speech samples, and the data are divided into the training set, validation set, and test set according to the proportion of 8:1:1, among which the proportion of low-load samples, medium-load samples, and high-load samples is about 17:4:3. Figure 9 displays the loss curve and accuracy curve during the training model, with epoch as the abscissa and loss and accuracy as the ordinate. In the process of training, the loss of the training set and verification set continues to decline, the correct rate continues to rise as the epoch progresses, and finally tends to be stable, reflecting the better generalization ability and classification ability of the model.
Table 3 provides an overview of the performance of various machine learning algorithms on the cognitive load assessment task. It is apparent from the table that the SCNN-TransE performs the best in both accuracy and Macro-F1, reaching 97.48% and 97.07% respectively. The high accuracy of SCNN-LSTM-Attention and SCNN-TransE highlights the significance of incorporating temporal information in Mel spectrograms. This also confirms the viewpoint mentioned in the first section that the Transformer method can better capture temporal relationships in speech data. The Macro-F1 value refers to the average F1 value of each class as the final evaluation index, which takes into account the contribution of each class and is suitable for unbalanced class situations. Therefore, this result indicates that the classification performance of SCNN-TransE is excellent in different classes, able to distinguish between positive and negative samples, and also keeps good generalization ability, making it adaptable to new datasets or classification tasks.
Figure 10 shows the average ROC curves of KNN, RF, AdaBoost, SVM, SCNN-LSTM-Attention, and the method proposed in this article. As is apparent from the figure, the developed method has better efficiency. In general, the closer the ROC curve is to the upper left corner, the better the model performs. On the whole, the ROC curve of the SCNN-TransE is generally more slanted to the upper left corner, and the AUC value is the highest, up to 0.99.
Figure 11 depicts the classification accuracy of different classifiers for the three load levels in the form of a bar chart. It can be intuitively seen that the SCNN-TransE has a commendable recognition rate under different cognitive load levels, indicating that the method has an excellent generalization performance. However, traditional machine learning methods such as KNN, RF, AdaBoost, and SVM exhibit limited performance at medium and high load levels, indicating that these methods are difficult for complex data models and feature extraction. The comparative analysis suggests that the CNN-LSTM and the SCNN-TransE are more suitable for dealing with complex time series data and can better capture the key features of the data, so they perform better at medium and high load levels.
To sum up, the results obtained from the experiment provide evidence to substantiate the effectiveness and superiority of the SCNN-TransE and highlight the potential of applying machine learning techniques to the identification of cognitive load levels.

6. Conclusions

A novel approach is introduced in this article for assessing cognitive load through analyzing controller voice call records, utilizing a combination of CNN and Transformer architecture. In the proposed method, the speech signals are processed into spectrograms, and the model for processing images is successfully transferred to the task of assessing the cognitive load of speech. By using CNN and Transformer to extract the spatial information of the speech spectrograms and the temporal features, including context information, and fusing the spatial and temporal features into spatio-temporal features, the accuracy of cognitive load classification for speech analysis can be effectively improved. The experimental results show that the proposed model achieves better results than other existing machine learning models, and its accuracy reaches 97.48%. The field of civil aviation relies heavily on land-to-air communication, which covers the entire process of flight take-off and landing. As such, this method provides convenience in the practical application of ATC cognitive load assessment and aids in the detection of controller overload and early warning to prevent the incidence of vulnerability events. Furthermore, the study can provide data-driven decision support for intelligent scheduling system optimization, dynamically adjust the working time of ATCs, and provide scientific decision support for controller training work and selection systems, thereby improving control efficiency and ensuring safe operation.

7. Future Works

As part of our ongoing research in the field of ATM, we are committed to improving our study by progressively gathering more speech data for validation. On the one hand, we will recruit more controllers with different levels of control experience to participate in our experiment to enrich the data samples. On the other hand, we expect to set experimental tasks with different levels of difficulty based on sector complexity to conduct more comprehensive comparative experiments.
We understand that changes in cognitive load can affect numerous physiological indicators, and to account for this, we will continue to collect eye-tracking and heart rate data to ensure that our analysis is multimodal. With a view to the future, the next plan is to determine the most suitable physiological parameters, such as eye-tracking parameters, that are scientifically sound. Another issue to be considered is the miniaturization and comfort of the necessary physiological measurements. This can be achieved by using miniature sensors or non-contact sensors, which can collect information with minimal contact with the subject’s skin. For this purpose, we selected the Tobii Pro Fusion, a screen-based eye tracker that collects eye movement data with high precision and no contact. Similarly, we chose the wrist electrocardiogram and blood pressure recorder provided by the Huawei Watch D for collecting heart rate data. This device is ideal for the purpose due to its small size and the ease of use it provides, making the process of data collection both efficient and comfortable for the participant. Our feature extraction network will also be refined to accurately assess and weigh different physiological parameters, leading to a better evaluation of cognitive load in air traffic control.
This paper aims to quantify the cognitive load level through offline analysis. Finally, we expect to design and implement a real-time system to collect physiological data, including speech and eye movement, and use the trained model to assess the cognitive load of controllers, which can actually be applied to the accurate online identification of controllers’ states and early warning of high loads. Additionally, the proposed system will incorporate an airspace complexity assessment module, which is an ongoing research topic in our laboratory. This integration will enable a human–machine cooperative safety monitoring mechanism for air traffic control commands. The expected outcome of the proposed work is an accurate and efficient approach to air traffic monitoring, which will have positive implications for aviation safety.

Author Contributions

Conceptualization, J.Y. and Z.W.; methodology, X.W. and J.Y.; software, J.Y.; validation, J.Y.; formal analysis, X.W. and H.Y.; investigation, Z.W. and J.Y.; resources, Z.W. and J.Y.; data curation, Z.W. and J.Y.; writing—original draft preparation, J.Y.; writing—review and editing, H.Y., Z.W. and X.W.; visualization, J.Y.; supervision, X.W. and Z.W.; project administration, H.Y.; funding acquisition, H.Y. All authors have read and agreed to the published version of the manuscript.

Funding

This study was supported by the National Natural Science Foundation of China (grant numbers U20A20161 and 62101363).

Data Availability Statement

The data that support the findings of this study are available from the corresponding author upon reasonable request.

Conflicts of Interest

The authors declare no conflict of interest.

References

  1. de Sant, D.A.L.M.; de Hilal, A.V.G. The impact of human factors on pilots’ safety behavior in offshore aviation companies: A brazilian case. Saf. Sci. 2021, 140, 105272. [Google Scholar]
  2. Wu, Q.K.; Yao, D.K.; Zhao, G.H.; Zhu, T.T. Safety Analysis of Lateral Interval between Military Training Airspace and Civil Route. In Proceedings of the 2016 4th International Conference on Machinery, Materials and Information Technology Applications, Xi’an, China, 10–11 December 2016; pp. 1021–1028. [Google Scholar]
  3. Leso, V.; Fontana, L.; Caturano, A.; Vetrani, I.; Fedele, M.; Iavicoli, I. Impact of shift work and long working hours on worker cognitive functions: Current evidence and future research needs. Int. J. Environ. Res. Public Health 2021, 18, 6540. [Google Scholar] [CrossRef] [PubMed]
  4. Sandoval, C.; Stolar, M.N.; Hosking, S.G.; Jia, D.; Lech, M. Real-Time Team Performance and Workload Prediction from Voice Communications. IEEE Access 2022, 10, 78484–78492. [Google Scholar] [CrossRef]
  5. Sweller, J. Cognitive load theory, learning difficulty, and instructional design. Learn. Instr. 1994, 4, 295–312. [Google Scholar] [CrossRef]
  6. O’Donnell, R.D. Workload assessment methodology. Cogn. Process. Perform. 1986, 2, 1–49. [Google Scholar]
  7. Cain, B. A Review of the Mental Workload Literature; Defense Technical Information Center: Toronto, ON, Canada, 2007. [Google Scholar]
  8. Galy, E.; Cariou, M.; Mélan, C. What is the relationship between mental workload factors and cognitive load types? Int. J. Psychophysiol. 2012, 83, 269–275. [Google Scholar] [CrossRef]
  9. Icao, D. 9426-AN/924 Air Traffic Services Planning Manual. Int. Civ. Aviat. Organ. 1984, 2, 126–128. [Google Scholar]
  10. Pawlak, W.; Goel, V.; Rothenberg, D.; Brinton, C. Comparison of algorithms for the dynamic resectorization of airspace. In Proceedings of the Guidance, Navigation, and Control Conference and Exhibit, Boston, MA, USA, 10–12 August 1998; p. 4106. [Google Scholar]
  11. Laudeman, I.V.; Shelden, S.G.; Branstrom, R.; Brasil, C. Dynamic Density: An Air Traffic Management Metric; Technical Report; NASA: Washington, DC, USA, 1998. [Google Scholar]
  12. Zrnic, D.S. Estimation of spectral moments for weather echoes. IEEE Trans. Geosci. Electron. 1979, 17, 113–128. [Google Scholar] [CrossRef]
  13. Reid, G.B.; Nygren, T.E. The subjective workload assessment technique: A scaling procedure for measuring mental workload. In Advances in Psychology; Elsevier: Amsterdam, The Netherlands, 1988; Volume 52, pp. 185–218. [Google Scholar]
  14. Manning, C.A.; Mills, S.H.; Fox, C.; Pfleider, E.; Mogilka, H.J. Investigating the Validity of Performance and Objective Workload Evaluation Research (POWER); Technical Report; FAA: Oklahoma, OK, USA, 2001. [Google Scholar]
  15. Manning, C.A.; Mills, S.H.; Fox, C.M.; Pfleiderer, E.M.; Mogilka, H.J. Using Air Traffic Control Taskload Measures and Communication Events to Predict Subjective Workload; Technical Report; FAA: Oklahoma, OK, USA, 2002. [Google Scholar]
  16. Paas, F.; Renkl, A.; Sweller, J. Cognitive load theory and instructional design: Recent developments. Educ. Psychol. 2003, 38, 1–4. [Google Scholar] [CrossRef]
  17. Tsai, Y.F.; Viirre, E.; Strychacz, C.; Chase, B.; Jung, T.P. Task performance and eye activity: Predicting behavior relating to cognitive workload. Aviat. Space Environ. Med. 2007, 78, B176–B185. [Google Scholar]
  18. Bernhardt, K.A.; Poltavski, D.; Petros, T.; Ferraro, F.R.; Jorgenson, T.; Carlson, C.; Drechsel, P.; Iseminger, C. The effects of dynamic workload and experience on commercially available EEG cognitive state metrics in a high-fidelity air traffic control environment. Appl. Ergon. 2019, 77, 83–91. [Google Scholar] [CrossRef]
  19. Vukovic, M.; Sethu, V.; Parker, J.; Cavedon, L.; Lech, M.; Thangarajah, J. Estimating cognitive load from speech gathered in a complex real-life training exercise. Int. J. Hum. Comput. Stud. 2019, 124, 116–133. [Google Scholar] [CrossRef]
  20. Radüntz, T.; Fürstenau, N.; Mühlhausen, T.; Meffert, B. Indexing mental workload during simulated air traffic control tasks by means of dual frequency head maps. Front. Physiol. 2020, 11, 300. [Google Scholar] [CrossRef] [Green Version]
  21. Radüntz, T.; Mühlhausen, T.; Freyer, M.; Fürstenau, N.; Meffert, B. Cardiovascular biomarkers’ inherent timescales in mental workload assessment during simulated air traffic control tasks. Appl. Psychophysiol. Biofeedback 2021, 46, 43–59. [Google Scholar] [CrossRef]
  22. Abur, D.; MacPherson, M.K.; Shembel, A.C.; Stepp, C.E. Acoustic measures of voice and physiologic measures of autonomic arousal during speech as a function of cognitive load in older adults. J. Voice 2021, 31, 504-e1. [Google Scholar] [CrossRef]
  23. Zhang, J.; Hua, Y.; Gu, J.; Chen, Y.; Yin, Z. Dynamic hierarchical learning of temporal-spatial-spectral EEG features with transformers for cognitive workload estimation. In Proceedings of the 2022 41st Chinese Control Conference (CCC), Heifei, China, 25–27 July 2022; pp. 7112–7117. [Google Scholar]
  24. Magnusdottir, E.H.; Johannsdottir, K.R.; Majumdar, A.; Gudnason, J. Assessing Cognitive Workload Using Cardiovascular Measures and Voice. Sensors 2022, 22, 6894. [Google Scholar] [CrossRef]
  25. Wu, N.; Sun, J. Fatigue Detection of Air Traffic Controllers Based on Radiotelephony Communications and Self-Adaption Quantum Genetic Algorithm Optimization Ensemble Learning. Appl. Sci. 2022, 12, 10252. [Google Scholar] [CrossRef]
  26. Gallardo Antolín, A.; Montero Martínez, J.M. A saliency-based attention LSTM model for cognitive load classification from speech. In Proceedings of the 20th Annual Conference of the International Speech Communication Association (ISCA 2019), Graz, Austria, 15–19 September 2019; pp. 216–220. [Google Scholar]
  27. Mijić, I.; Šarlija, M.; Petrinović, D. MMOD-COG: A database for multimodal cognitive load classification. In Proceedings of the 2019 11th International Symposium on Image and Signal Processing and Analysis (ISPA), Dubrovnik, Croatia, 23–25 September 2019; pp. 15–20. [Google Scholar]
  28. Lee, J. Task complexity, cognitive load, and L1 speech. Appl. Linguist. 2019, 40, 506–539. [Google Scholar] [CrossRef]
  29. Larmuseau, C.; Cornelis, J.; Lancieri, L.; Desmet, P.; Depaepe, F. Multimodal learning analytics to investigate cognitive load during online problem solving. Br. J. Educ. Technol. 2020, 51, 1548–1562. [Google Scholar] [CrossRef]
  30. Ramakrishnan, P.; Balasingam, B.; Biondi, F. Cognitive load estimation for adaptive human–machine system automation. In Learning Control; Elsevier: Amsterdam, The Netherlands, 2021; pp. 35–58. [Google Scholar]
  31. Biondi, F.N.; Saberi, B.; Graf, F.; Cort, J.; Pillai, P.; Balasingam, B. Distracted worker: Using pupil size and blink rate to detect cognitive load during manufacturing tasks. Appl. Ergon. 2023, 106, 103867. [Google Scholar] [CrossRef]
  32. Miller, M.; Holley, S.; Mrusek, B.; Weiland, L. Assessing cognitive processing and human factors challenges in NextGen air traffic control tower team operations. In Proceedings of the Advances in Human Factors and Systems Interaction: AHFE 2020 Virtual Conference on Human Factors and Systems Interaction, San Diego, CA, USA, 16–20 July 2020; Springer: Berlin/Heidelberg, Germany, 2020; pp. 289–295. [Google Scholar]
  33. Sloboda, J.; Lammert, A.; Williamson, J.; Smalt, C.; Mehta, D.D.; Curry, C.; Quatieri, T. Vocal biomarkers for cognitive performance estimation in a working memory task. Proc. Interspeech 2018, 5, 1756–1760. [Google Scholar]
  34. Herms, D.I.R. Effective Speech Features for Cognitive Load Assessment: Classification and Regression; Technische Universität: Chemnitz, Germany, 2019. [Google Scholar]
  35. Zhao, Z.; Li, Q.; Cummins, N.; Liu, B.; Wang, H.; Tao, J.; Schuller, B. Hybrid Network Feature Extraction for Depression Assessment from Speech. In Proceedings of the Interspeech 2020, ISCA-INST Speech Communication Association, Shanghai, China, 25–29 October 2020; pp. 4956–4960. [Google Scholar]
  36. Bhattacharjee, M.; Prasanna, S.M.; Guha, P. Speech/music classification using features from spectral peaks. IEEE/ACM Trans. Audio Speech Lang. Process. 2020, 28, 1549–1559. [Google Scholar] [CrossRef]
  37. Vukovic, M.; Stolar, M.; Lech, M. Cognitive load estimation from speech commands to simulated aircraft. IEEE/ACM Trans. Audio Speech Lang. Process. 2021, 29, 1011–1022. [Google Scholar] [CrossRef]
  38. Li, J.; Zhang, X.; Huang, L.; Li, F.; Duan, S.; Sun, Y. Speech Emotion Recognition Using a Dual-Channel Complementary Spectrogram and the CNN-SSAE Neutral Network. Appl. Sci. 2022, 12, 9518. [Google Scholar] [CrossRef]
  39. Borwankar, S.; Verma, J.P.; Jain, R.; Nayyar, A. Improvise approach for respiratory pathologies classification with multilayer convolutional neural networks. Multimed. Tools Appl. 2022, 81, 39185–39205. [Google Scholar] [CrossRef]
  40. Liu, H.; Wang, X.; Wei, Y.; Shao, W.; Liono, J.; Salim, F.D.; Deng, B.; Du, J. ProMETheus: An intelligent mobile voice meeting minutes system. In Proceedings of the 15th EAI International Conference on Mobile and Ubiquitous Systems: Computing, Networking and Services, New York, NY, USA, 5–7 November 2018; pp. 392–401. [Google Scholar]
  41. Shewalkar, A.; Nyavanandi, D.; Ludwig, S.A. Performance evaluation of deep neural networks applied to speech recognition: RNN, LSTM and GRU. J. Artif. Intell. Soft Comput. Res. 2019, 9, 235–245. [Google Scholar] [CrossRef] [Green Version]
  42. Gallardo-Antolín, A.; Montero, J.M. External attention LSTM models for cognitive load classification from speech. In Proceedings of the Statistical Language and Speech Processing: 7th International Conference, SLSP 2019, Ljubljana, Slovenia, 14–16 October 2019; pp. 139–150. [Google Scholar]
  43. Zhao, J.; Mao, X.; Chen, L. Speech emotion recognition using deep 1D & 2D CNN LSTM networks. Biomed. Signal Process. Control. 2019, 47, 312–323. [Google Scholar]
  44. Yu, Y.; Kim, Y.J. Attention-LSTM-attention model for speech emotion recognition and analysis of IEMOCAP database. Electronics 2020, 9, 713. [Google Scholar] [CrossRef]
  45. Beddiar, D.R.; Jahan, M.S.; Oussalah, M. Data expansion using back translation and paraphrasing for hate speech detection. Online Soc. Netw. Media 2021, 24, 100153. [Google Scholar] [CrossRef]
  46. Gaballah, A.; Tiwari, A.; Narayanan, S.; Falk, T.H. Context-aware speech stress detection in hospital workers using Bi-LSTM classifiers. In Proceedings of the ICASSP 2021-2021 IEEE International Conference on Acoustics, Speech and Signal Processing (ICASSP), Toronto, ON, Canada, 6–11 June 2021; pp. 8348–8352. [Google Scholar]
  47. Sharma, Y.; Singh, B.K. One-dimensional convolutional neural network and hybrid deep-learning paradigm for classification of specific language impaired children using their speech. Comput. Methods Programs Biomed. 2022, 213, 106487. [Google Scholar] [CrossRef]
  48. Schuller, B.; Steidl, S.; Batliner, A.; Epps, J.; Eyben, F.; Ringeval, F.; Marchi, E.; Zhang, Y. The interspeech 2014 computational paralinguistics challenge: Cognitive & physical load, multitasking. In Proceedings of the INTERSPEECH 2014, 15th Annual Conference of the International Speech Communication Association, Singapore, 14–18 September 2014. [Google Scholar]
  49. Liao, J.; Li, H.; Feng, A.; Wu, X.; Luo, Y.; Duan, X.; Ni, M.; Li, J. Domestic pig sound classification based on TransformerCNN. Appl. Intell. 2022, 53, 4907–4923. [Google Scholar] [CrossRef]
  50. Wang, Y.; Shen, G.; Xu, Y.; Li, J.; Zhao, Z. Learning Mutual Correlation in Multimodal Transformer for Speech Emotion Recognition. In Proceedings of the Interspeech, Brno, Czechia, 30 August–3 September 2021; pp. 4518–4522. [Google Scholar]
  51. Delon, J.; Desolneux, A. A patch-based approach for removing impulse or mixed Gaussian-impulse noise. SIAM J. Imaging Sci. 2013, 6, 1140–1174. [Google Scholar] [CrossRef]
  52. Jalil, M.; Butt, F.A.; Malik, A. Short-time energy, magnitude, zero crossing rate and autocorrelation measurement for discriminating voiced and unvoiced segments of speech signals. In Proceedings of the 2013 The International Conference on Technological Advances in Electrical, Electronics and Computer Engineering (TAEECE), Konya, Turkey, 9–11 May 2013; pp. 208–212. [Google Scholar]
  53. Guo, Q.; Li, N.; Ji, G. A improved dual-threshold speech endpoint detection algorithm. In Proceedings of the 2nd International Conference on Computer and Automation Engineering (ICCAE), Singapore, 26–28 February 2010; Volume 2, pp. 123–126. [Google Scholar]
  54. Von Helversen, D.; Von Helversen, O. Recognition of sex in the acoustic communication of the grasshopper Chorthippus biguttulus (Orthoptera, Acrididae). J. Comp. Physiol. A 1997, 180, 373–386. [Google Scholar] [CrossRef]
  55. Kamiloğlu, R.G.; Fischer, A.H.; Sauter, D.A. Good vibrations: A review of vocal expressions of positive emotions. Psychon. Bull. Rev. 2020, 27, 237–265. [Google Scholar] [CrossRef] [Green Version]
  56. Hidaka, S.; Lee, Y.; Wakamiya, K.; Nakagawa, T.; Kaburagi, T. Automatic Estimation of Pathological Voice Quality Based on Recurrent Neural Network Using Amplitude and Phase Spectrogram. In Proceedings of the INTERSPEECH, 2020, Shanghai, China, 25–29 October 2020; pp. 3880–3884. [Google Scholar]
  57. LeCun, Y.; Bottou, L.; Bengio, Y.; Haffner, P. Gradient-based learning applied to document recognition. Proc. IEEE 1998, 86, 2278–2324. [Google Scholar] [CrossRef] [Green Version]
  58. Krizhevsky, A.; Sutskever, I.; Hinton, G.E. Imagenet classification with deep convolutional neural networks. Commun. ACM 2017, 60, 84–90. [Google Scholar] [CrossRef] [Green Version]
  59. Szegedy, C.; Liu, W.; Jia, Y.; Sermanet, P.; Reed, S.; Anguelov, D.; Erhan, D.; Vanhoucke, V.; Rabinovich, A. Going deeper with convolutions. In Proceedings of the IEEE Conference on Computer Vision and Pattern Recognition, Boston, MA, USA, 7–12 June 2015; pp. 1–9. [Google Scholar]
  60. Simonyan, K.; Zisserman, A. Very deep convolutional networks for large-scale image recognition. arXiv 2014, arXiv:1409.1556. [Google Scholar]
  61. Vaswani, A.; Shazeer, N.; Parmar, N.; Uszkoreit, J.; Jones, L.; Gomez, A.N.; Kaiser, Ł.; Polosukhin, I. Attention is all you need. Adv. Neural Inf. Process. Syst. 2017, 30, 6000–6010. [Google Scholar]
  62. Michel, P.; Levy, O.; Neubig, G. Are sixteen heads really better than one? Adv. Neural Inf. Process. Syst. 2019, 32, 14037–14047. [Google Scholar]
  63. Livingstone, S.R.; Russo, F.A. The Ryerson Audio-Visual Database of Emotional Speech and Song (RAVDESS): A dynamic, multimodal set of facial and vocal expressions in North American English. PLoS ONE 2018, 13, e0196391. [Google Scholar] [CrossRef] [Green Version]
  64. Latif, S.; Qayyum, A.; Usman, M.; Qadir, J. Cross lingual speech emotion recognition: Urdu vs. western languages. In Proceedings of the 2018 International Conference on Frontiers of Information Technology (FIT), Islamabad, Pakistan, 17–19 December 2018; pp. 88–93. [Google Scholar]
  65. Pichora-Fuller, M.K.; Dupuis, K. Toronto emotional speech set (TESS). Sch. Portal Dataverse 2020, 1, 2020. [Google Scholar]
  66. Ahmed, M.R.; Islam, S.; Islam, A.M.; Shatabda, S. An ensemble 1D-CNN-LSTM-GRU model with data augmentation for speech emotion recognition. Expert Syst. Appl. 2023, 218, 119633. [Google Scholar]
  67. Krishnan, P.T.; Joseph Raj, A.N.; Rajangam, V. Emotion classification from speech signal based on empirical mode decomposition and non-linear features: Speech emotion recognition. Complex Intell. Syst. 2021, 7, 1919–1934. [Google Scholar] [CrossRef]
  68. Chatterjee, R.; Mazumdar, S.; Sherratt, R.S.; Halder, R.; Maitra, T.; Giri, D. Real-time speech emotion analysis for smart home assistants. IEEE Trans. Consum. Electron. 2021, 67, 68–76. [Google Scholar] [CrossRef]
  69. Patel, N.; Patel, S.; Mankad, S.H. Impact of autoencoder based compact representation on emotion detection from audio. J. Ambient. Intell. Humaniz. Comput. 2022, 13, 1–19. [Google Scholar] [CrossRef]
Figure 1. The structure of cognitive load assessment.
Aerospace 10 00584 g001
Figure 2. The process of segmentation.
Aerospace 10 00584 g002
Figure 3. The framing process.
Aerospace 10 00584 g003
Figure 4. (a) The Mel spectrograms of ATC with low cognitive load level; (b) the Mel spectrograms of ATC with high cognitive load level.
Aerospace 10 00584 g004
Figure 5. The structure of the SCNN-TransE network.
Aerospace 10 00584 g005
Figure 6. The architecture schematic of the stacked CNN.
Aerospace 10 00584 g006
Figure 7. The architecture schematic of the Transformer block.
Aerospace 10 00584 g007
Figure 8. (a) ROC curve of SCNN-TransE for Ravdess dataset; (b) ROC curve of SCNN-TransE for URDU dataset; and (c) ROC curve of SCNN-TransE for TESS dataset.
Aerospace 10 00584 g008
Figure 9. (a) Loss curve of the model; (b) accuracy curve of the model.
Aerospace 10 00584 g009
Figure 10. Average ROC curves of different methods.
Aerospace 10 00584 g010
Figure 11. Detection accuracy under three cognitive load levels.
Aerospace 10 00584 g011
Table 1. Recognition accuracy of various emotions (%).
EmotionAngerHappyNeutralSadDisgustSurpriseFearfulCalmAverage
Ravdess73.6884.2180.0068.4289.4778.9563.1684.2177.62
URDU90.0080.0080.00100.00----87.50
TESS100.00100.00100.00100.0097.5097.50100.00-99.29
Table 2. Comparison of different methods on TESS dataset.
LiteratureYearsFeaturesClassifierAccuracy
Krishnan et al. [67]2021entropy featureSVM81.67%
Krishnan et al. [67]2021entropy featureLDA93.30%
Chatterjee et al. [68]2021MFCCCNN95.79%
Patel et al. [69]2022MFCCAutoencoder + CNN96.00%
Ahmed et al. [66]2023MFCC, Mel spectrogram, ZCR and chromagramCNN + LSTM + Gated recurrent unit99.46%
Our Method-Mel spectrogramCNN + Transformer encoder99.29%
Table 3. Comparison of different methods on TESS dataset.
MethodKNNAdaBoostRFSVMSCNN-LSTM-AttentionSCNN-TransE
Accuracy (%)73.1175.6384.0391.6094.9697.48
Macro-F1 (%)55.8267.6275.0088.3293.81097.07
Disclaimer/Publisher’s Note: The statements, opinions and data contained in all publications are solely those of the individual author(s) and contributor(s) and not of MDPI and/or the editor(s). MDPI and/or the editor(s) disclaim responsibility for any injury to people or property resulting from any ideas, methods, instructions or products referred to in the content.

