Article

Quantitative Bird Activity Characterization and Prediction Using Multivariable Weather Parameters and Avian Radar Datasets

1
Research Institute of Civil Aviation Law, Regulation and Standardization, China Academy of Civil Aviation Science and Technology, Beijing 100028, China
2
Research Institute for Frontier Science, Beihang University, Beijing 100191, China
3
School of Electronic and Information Engineering, Guangxi Normal University, Guilin 541004, China
4
Airport Research Institute, China Academy of Civil Aviation Science and Technology, Beijing 100028, China
*
Author to whom correspondence should be addressed.
Aerospace 2023, 10(5), 462; https://doi.org/10.3390/aerospace10050462
Submission received: 11 February 2023 / Revised: 5 May 2023 / Accepted: 9 May 2023 / Published: 16 May 2023
(This article belongs to the Special Issue Advances in Air Traffic and Airspace Control and Management)

Abstract

:
Bird strikes are a predominant threat to aviation safety, especially in airport airspace. Effective wildlife surveillance methods are required for the harmonious coexistence of airport management and friendly ecology. Existing works indicate the close relationship between bird activities and weather. The relevance of bird activity and weather is favorable for intuitive understanding of ecological environments and providing constructive wildlife management references. This paper introduces a bird activity characterization and forecasting method based on weather information. Bird activities are modeled and quantified into different activity grades. Their relevance with weather parameters is first explored independently to support the multivariable relevance study. Two groups of machine learning strategies are adopted to test their feasibility for bird activity prediction. Radar datasets from diurnal and nocturnal activity study areas are constructed from an avian radar system deployed at the airport. Experimental results verify that both machine learning strategies could achieve bird activity forecasting based on weather information with acceptable accuracy. The random forest model is a better choice for its robustness and adjustability to feature inconsistencies. Weather information deviation between bird activity airspace and ground measurement is a predominant factor limiting the prediction accuracy. The data sufficiency dependency of the prediction model is discussed. Existing works indicate the reasonability and feasibility of the proposed activity modeling and prediction method; more improvements on weather information accuracy and data sufficiency are necessary to further elevate the application significance of the prediction model.

1. Introduction

Wildlife interferences such as flying birds are major threats to aviation safety [1,2]. Coexistence with wildlife interference is inevitable, and ecological management needs effective surveillance support. Avian radar systems have achieved prominent development in recent years. Their capabilities in bird detection and tracking have proven to be effective [3,4,5,6]. However, existing systems mainly provide short-term functionality, and their application significance is biased toward spatial domain analysis [7,8]. Data mining over historical radar datasets is promising to provide long-term functional capabilities, but solutions in this area are insufficient [9,10]. Existing experiments and analyses have explored the relationship between bird activities and weather conditions. Diurnal and nocturnal birds present distinctive dependences on weather conditions [11,12]. Since weather information is predictable, if the relevance between bird activity and weather conditions could be established, there is a possibility to predict bird activities and provide references to airport management. Existing works contain some preliminary discussions and modeling results, but they are mostly qualitative or confined to a single weather parameter, so the accuracy of activity character prediction capability is limited.
The booming of machine learning techniques in recent years provides confidence in bird activity prediction based on reasonable modeling and machine learning technique selection. This paper introduces the bird activity degree as a reasonable quantitative descriptor to model bird activity. The dataset is constructed through data filtering with conditional parameters. Relevance between bird activity degrees and single weather parameters is analyzed, respectively, to support the multivariable relevance study. The weather feature vector is formulated to construct the input feature space. Due to the special property of the activity degree descriptor, its regression using machine learning techniques is transformed into a classification problem by developing a particular categorization method. This strategy is more plausible for engineering applications with higher prediction accuracy. The proposed method is applied to radar datasets from four years of an avian radar system. Experiment results demonstrate acceptable classification accuracy to validate the reasonability and possibility of bird activity forecasting using weather information.
This paper is organized as follows. Section 2 introduces the modeling method to interpret bird activities in a quantitative manner. Preliminary studies about the relevance between single weather factors and bird activities are presented. Two sets of machine learning strategies are presented for bird activity prediction using a multi-dimensional weather factor vector. Prediction performance is presented and discussed in Section 3. Section 4 draws the conclusion.

2. Materials and Methods

2.1. Bird Activity Modelling and Characterization

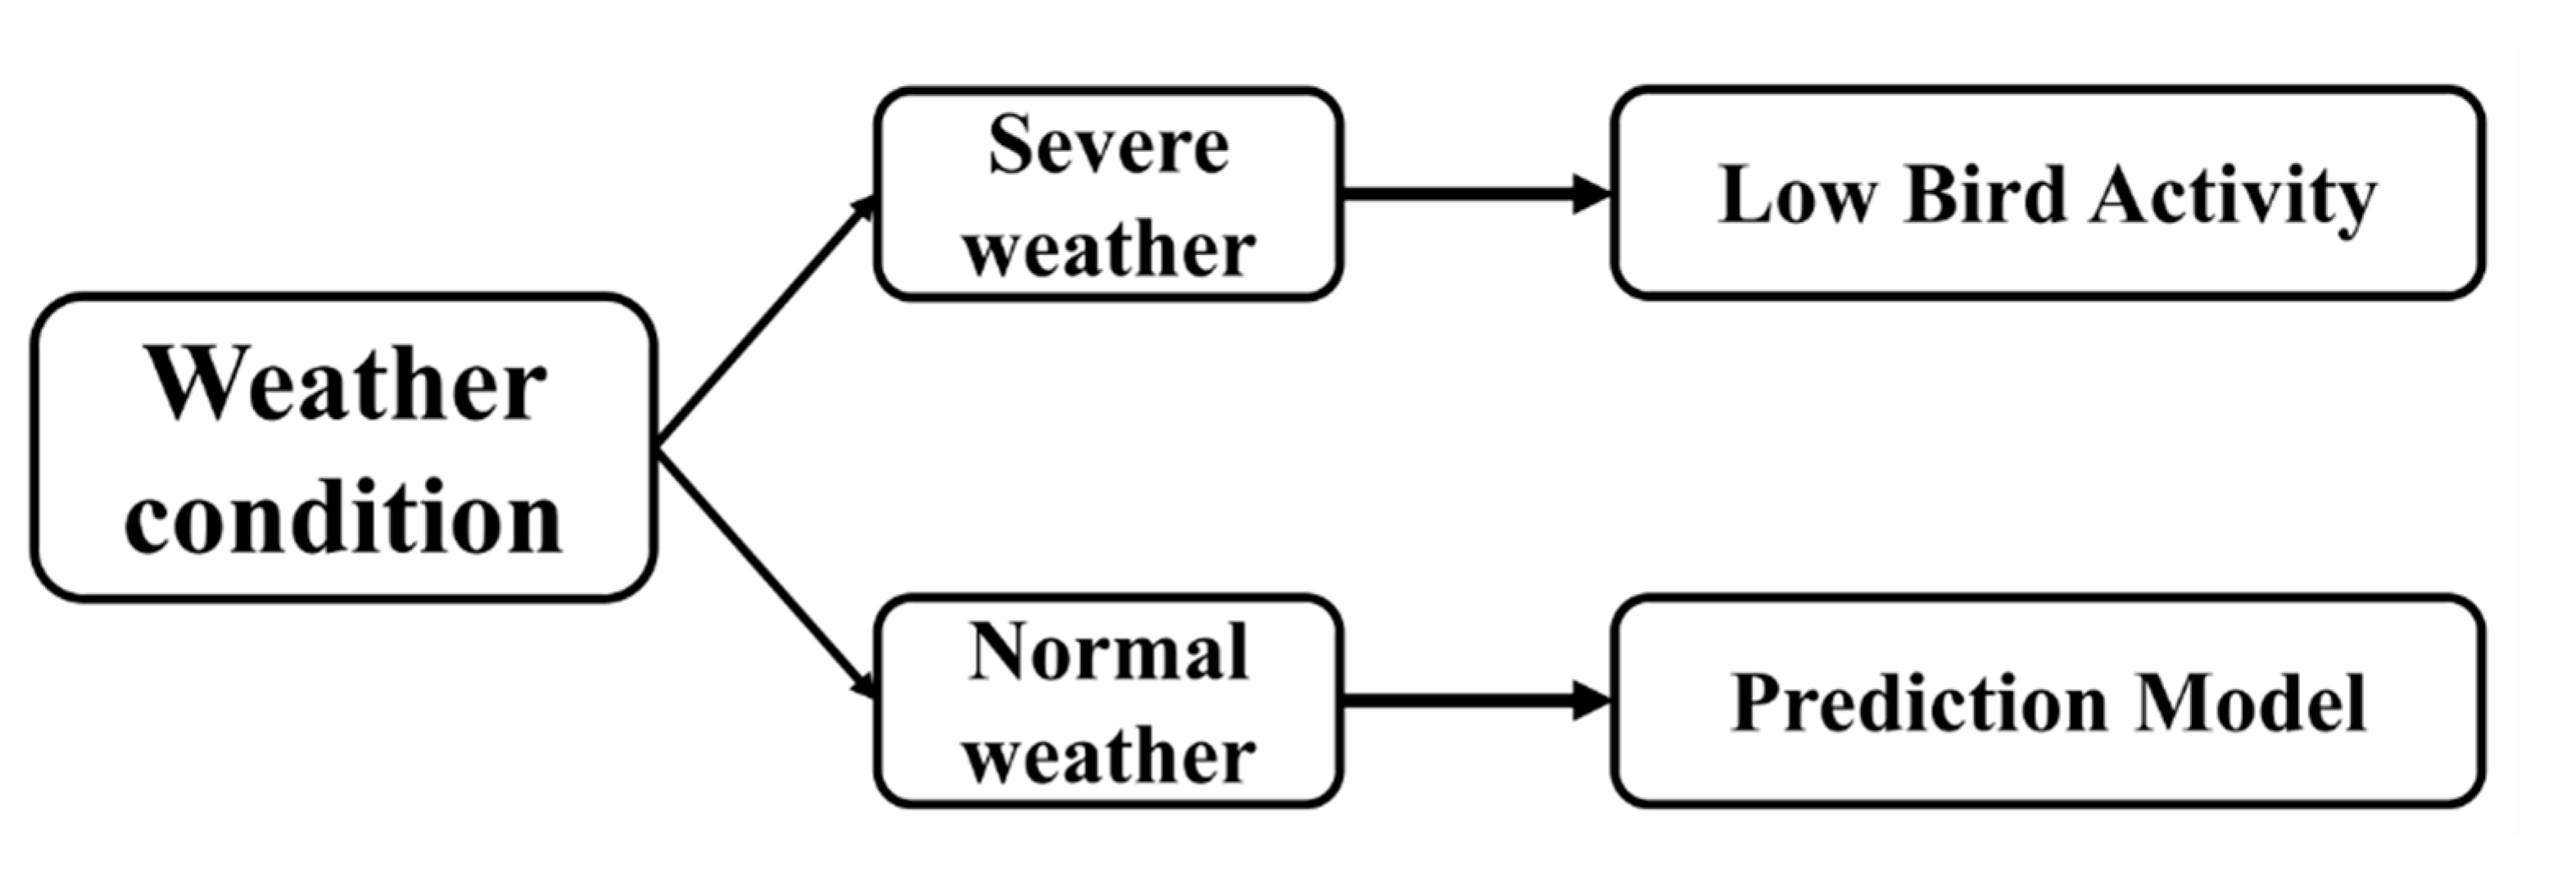
This paper presents a bird activity forecasting method using weather information based on machine learning techniques. The method is composed of two components. The first one is data selection. Existing experiments and analysis revealed a highly complicated relevance between bird activity and weather, and bird activity characters demonstrate remarkable differences in special weather conditions such as precipitation, gusts, fog, and hail. These could be denoted as adverse weather conditions since birds are usually inactive in these conditions. Therefore, it is more reasonable to exclude these adverse weather conditions and study bird activity relevance with normal and adverse weather conditions independently. According to this principle, there is a necessity to conduct a data filter by confining the weather information. Normal and adverse weather conditions are categorized through artificial or other simple methods automatically. A conditional parameter is defined as σ including weather and radar working conditions for data filtering. The dataset after filtering is denoted as N = N d 1 σ , N d 2 σ , , N d K σ . The symbol N d k σ represents a track count at the date dk with the parameter σ.
The quantitative bird activity modeling is another fundamental component of the predicting method. The bird track count is the most straightforward and intuitive descriptor to interpret bird activity. The larger track count usually indicates more active bird behavior. However, the adoption of track count as an activity descriptor confronts many limitations: (1) Ground surveillance radar systems have inevitable blind zones, which make track counts inconsistent with real bird quantities. The ambiguity of a single or a flock in the radar viewpoint also constrains the track count accuracy. (2) The track count is a highly time-variable descriptor, which makes it suitable for short-term interpretation, and its numerical property also limits its integration with other track count information. (3) The relevance between bird track count and bird strike threats does not present a definite positive correlation. The reasonability of modeling the positive correlation between bird strike threats and track count is still controversial.
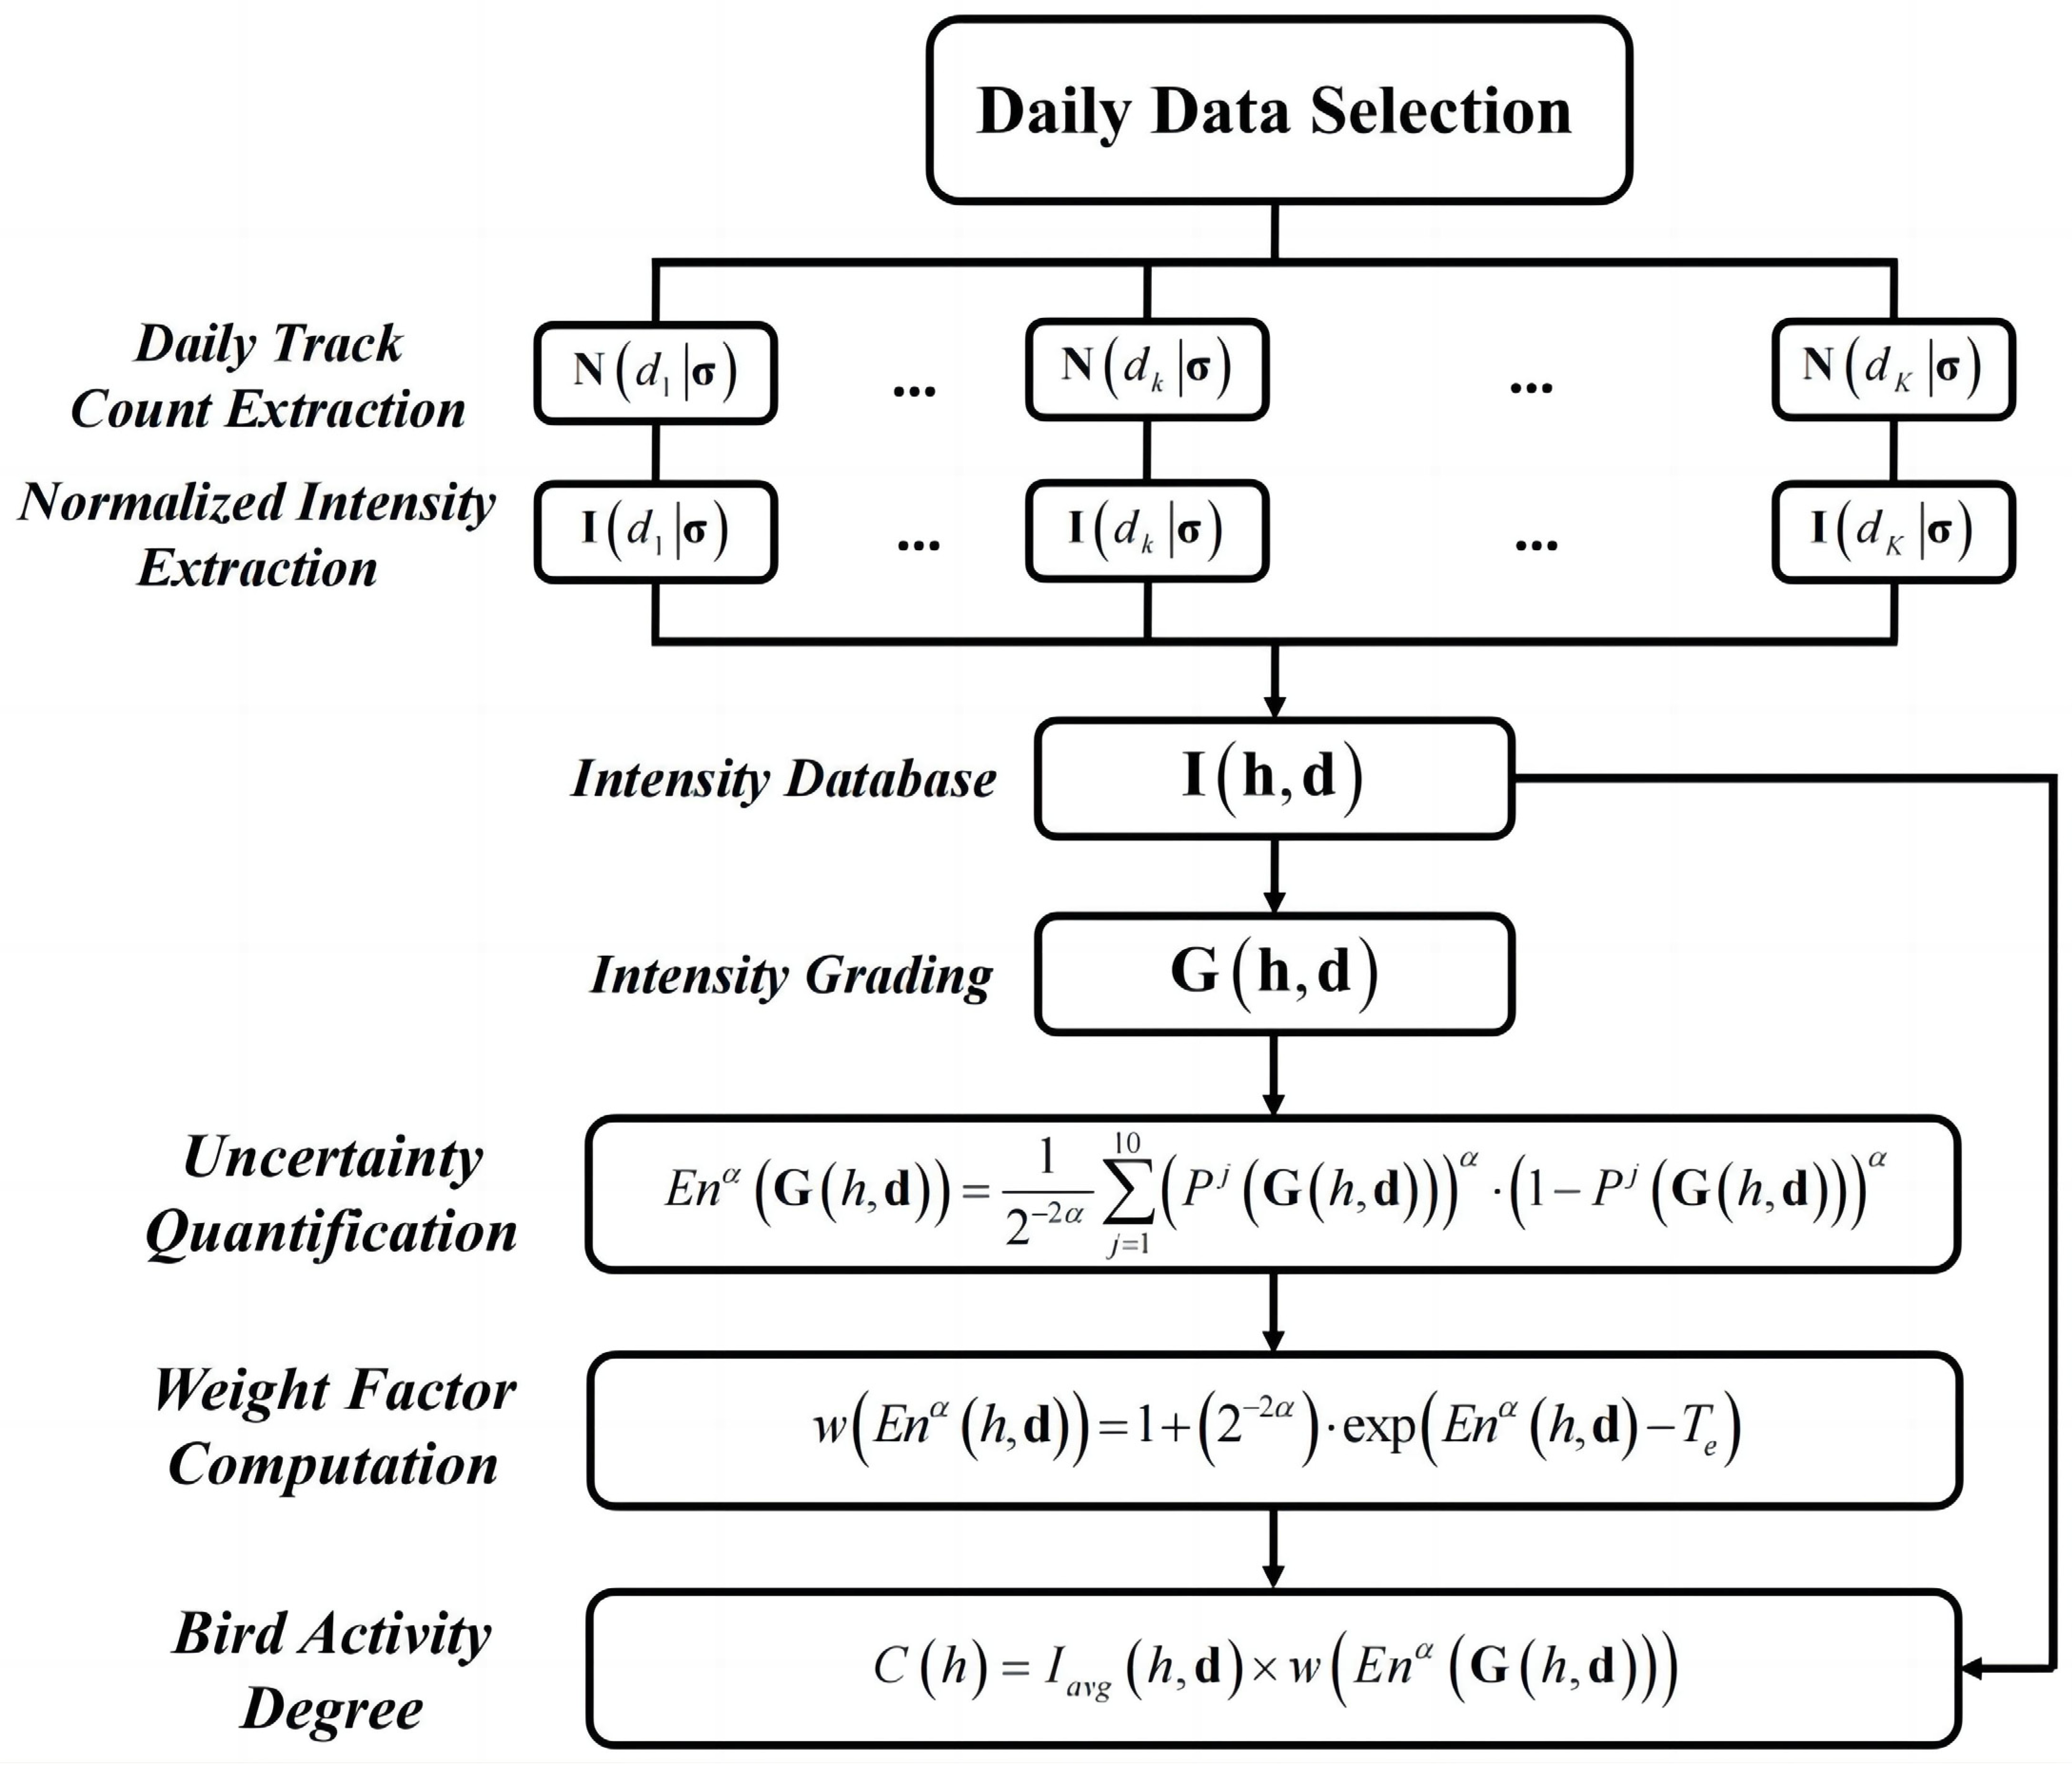
Due to the above limitations, a plausible and flexible quantitative descriptor is required for bird activity prediction. This paper introduces the activity degree as the solution. It is derived from the track count information and assumes the activity degree is an integration of intensity and uncertainty characters. The corresponding extraction procedure is composed of four steps:
STEP 1: Normalized intensity calculation. The normalized intensity is calculated from the hourly track counts. For date dk, the normalized intensity is denoted as I = I 1 d k , I 2 d k , , I 24 d k . The term I i d k represents the intensity at the hourly interval between hours i-1 and i. The normalization range is between 20 and 100. The lower boundary is 20 instead of 0, as it is unreasonable to define the minimum track count as no bird activity.
STEP 2: Intensity grading. Normalized intensities compose the dataset N. A normalized intensity array at hour hk is formulated as I(hk,d), with d as all selected dates. Intensity fluctuations from track count variations might be misleading in activity modeling. To overcome this insufficiency, the intensity is transformed into 10 grades through a mapping in Table 1. The new dataset after mapping is denoted as G(hk,d).
STEP 3: Uncertainty quantification. The grade mapping reduces the intensity fluctuations to facilitate uncertainty evaluation. A large grade variation usually represents greater uncertainty, which elevates the difficulty of activity prediction. This mechanism is realized by the entropy concept. The α-quadratic entropy is taken to quantify activity uncertainty [13]:
E n α G h , d = 1 2 2 α j = 1 10 P j G h , d α 1 P j G h , d α
The term P j G h , d indicates the probability of G(h,d) at grade j. The uncertainty enlargement parameter α indicates entropy sensitivity to uncertainty [14,15]. The parameter α is selected as 0.7, but it is flexible to accommodate various scenarios with different bird activity complexity.
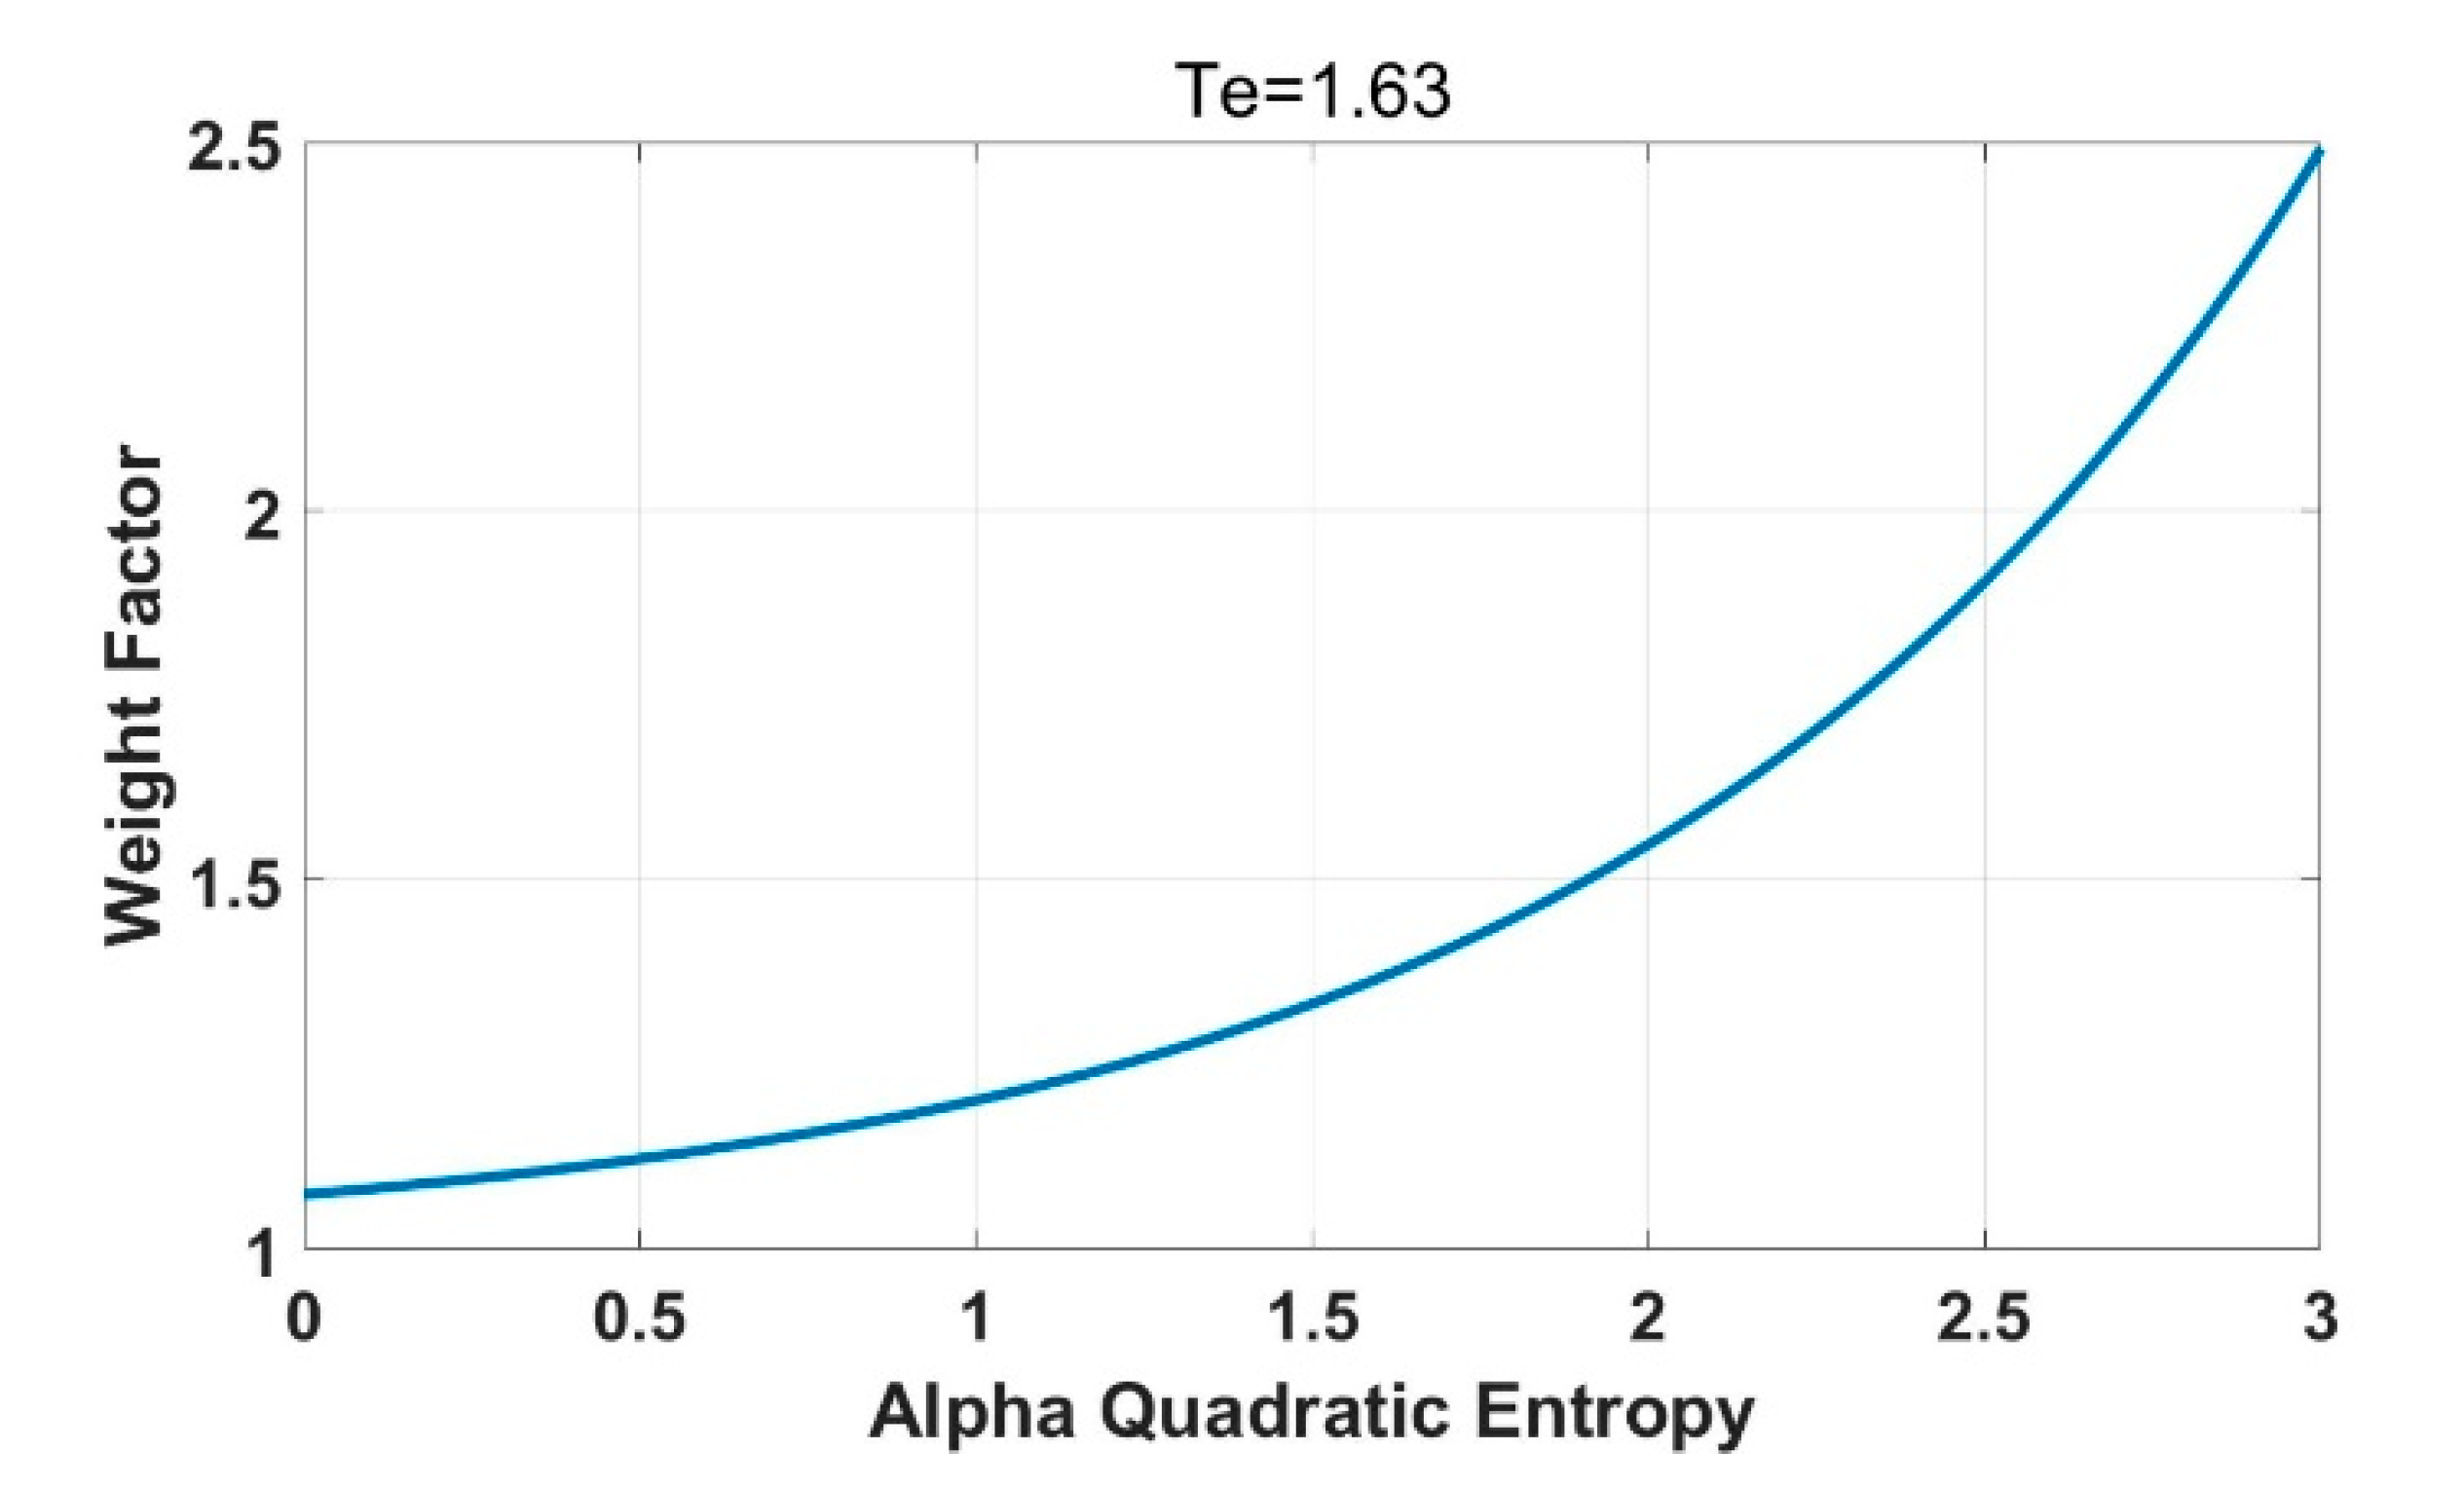
STEP 4: Activity degree calculation. Intensity and uncertainty information are integrated to model bird activities. Direct numerical integration is improper due to their independent physical meaning and dimensions. This paper develops a weighing strategy for uncertainty characters and applies it to intensity. An uncertainty weighing factor based on α-quadratic entropy is defined as [16]:
w E n α h , d = 1 + 2 2 α exp E n α h , d T e
The weighing factor is larger than one to characterize its extra enlargement of intensity. The parameter Te is the entropy threshold. When the entropy is smaller than Te, the weighing factor provides a limited intensity enlargement. The weighing factor reflects a nonlinear increment to increase uncertainty contributions when the entropy is larger than the threshold.
Bird activities are manually categorized into large and small variations, and their entropy values are characterized in histogram forms for threshold determination. The selected threshold is a value minimizing overlapping probabilities between large and small variation histograms. The extracted threshold in this paper is 1.63. Figure 1 demonstrates the weight factor distribution with entropy values in a remarkable exponential increment pattern.
The bird activity degree is the multiplication of intensity and weighing factor at hour h:
C h = I a v g h , d × w E n α G h , d
The term I a v g h , d is the average value of I. Figure 2 presents the overall framework of activity degree extraction.
The proposed method is applicable for arbitrary hour spans to accommodate different problems. In this paper, the hour span indicates a time window with a specified start and end time, such as 05:00–08:00. The numerical and normalization properties of activity degree make it suitable for direct comparison and mutual verification. However, if the activity degree is taken as the prediction result, the system requires a robust regression capability, and its necessity is worthy of further discussion. The exact quantity of activity degree does not indicate a definite, accurate bird activity modeling due to its high fluctuation character. From the viewpoint and requirements of airport management, exact activity degree values possess little significance for wildlife management. A more reasonable activity categorization strategy might be more useful to facilitate bird strike risk evaluation and air traffic control. Therefore, modeling bird activity prediction as a regression problem would elevate the problem’s complexity and difficulty. This also deviates from the engineering application requirements. The solution proposed in this paper is mapping activity degrees into activity grades, as presented in Table 2. This mapping transforms the prediction from a regression problem into a classification problem, which reduces the complexity while maintaining its application significance.
There is another concern that motivates the transformation from regression to classification. As the information source, the track count descriptor possesses inevitable uncertainty. Existing avian radar systems could not guarantee 100% detection accuracy; false alarms as well as clutter brought extra track count uncertainties. These factors have non-negligible impacts on data credibility. Even though the regression system could be well built to provide high accuracy, the predicted activity degree has a credibility problem as the data source is “polluted”. The transformation into a classification problem alleviates this adverse impact and simplifies the model to suit more complicated scenarios. Therefore, an activity prediction system with better robustness and intuitive feedback is preferred.

2.2. Bird Activity Relevance Study with Single Weather Parameter

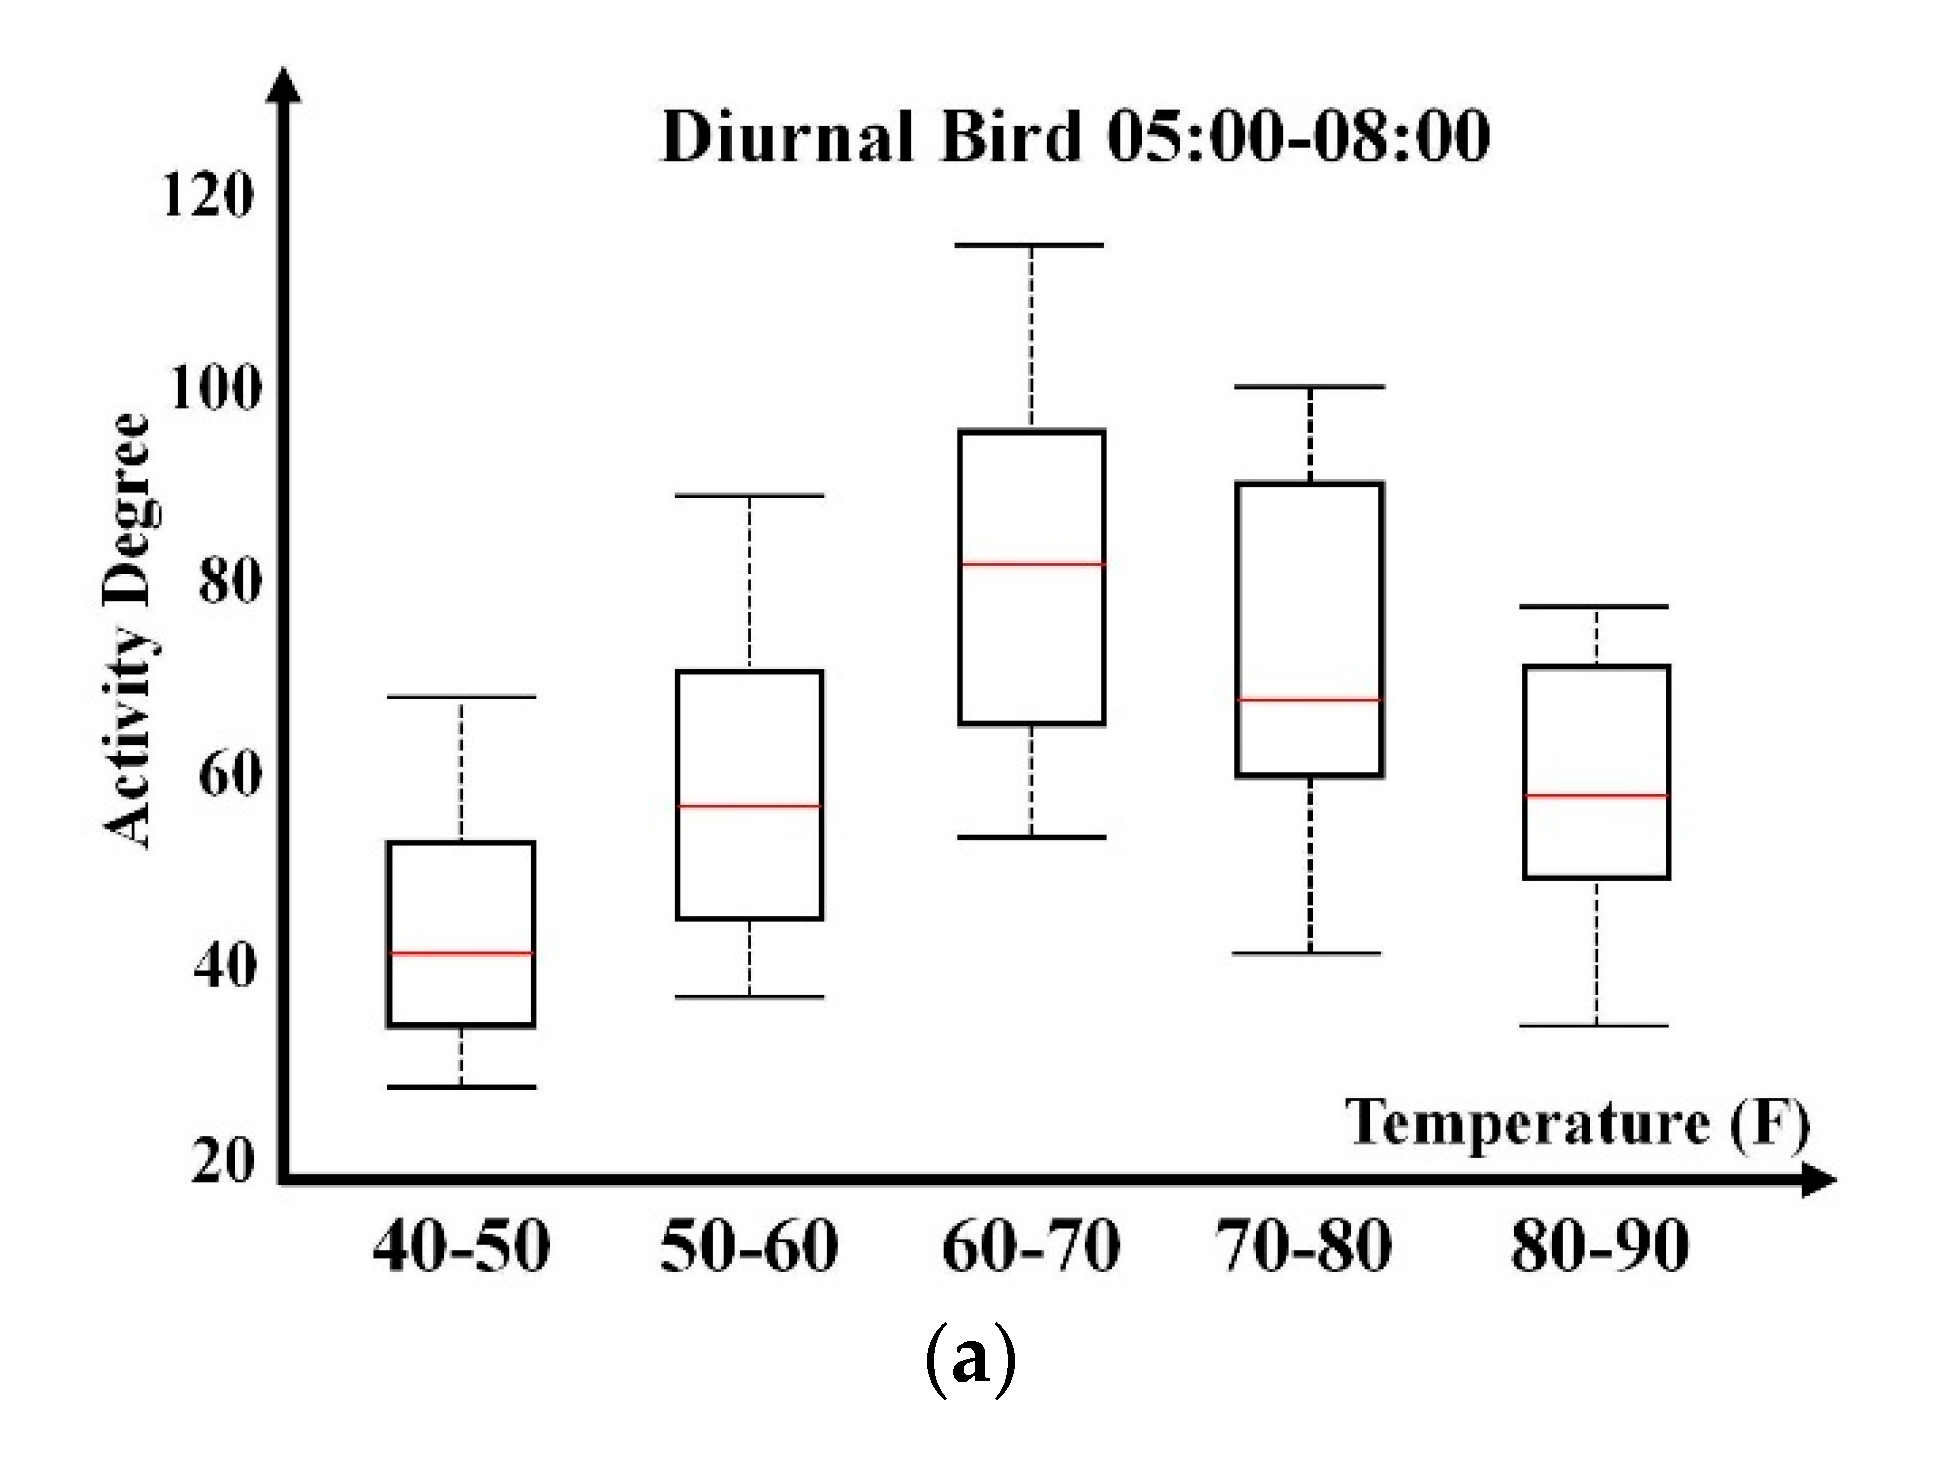
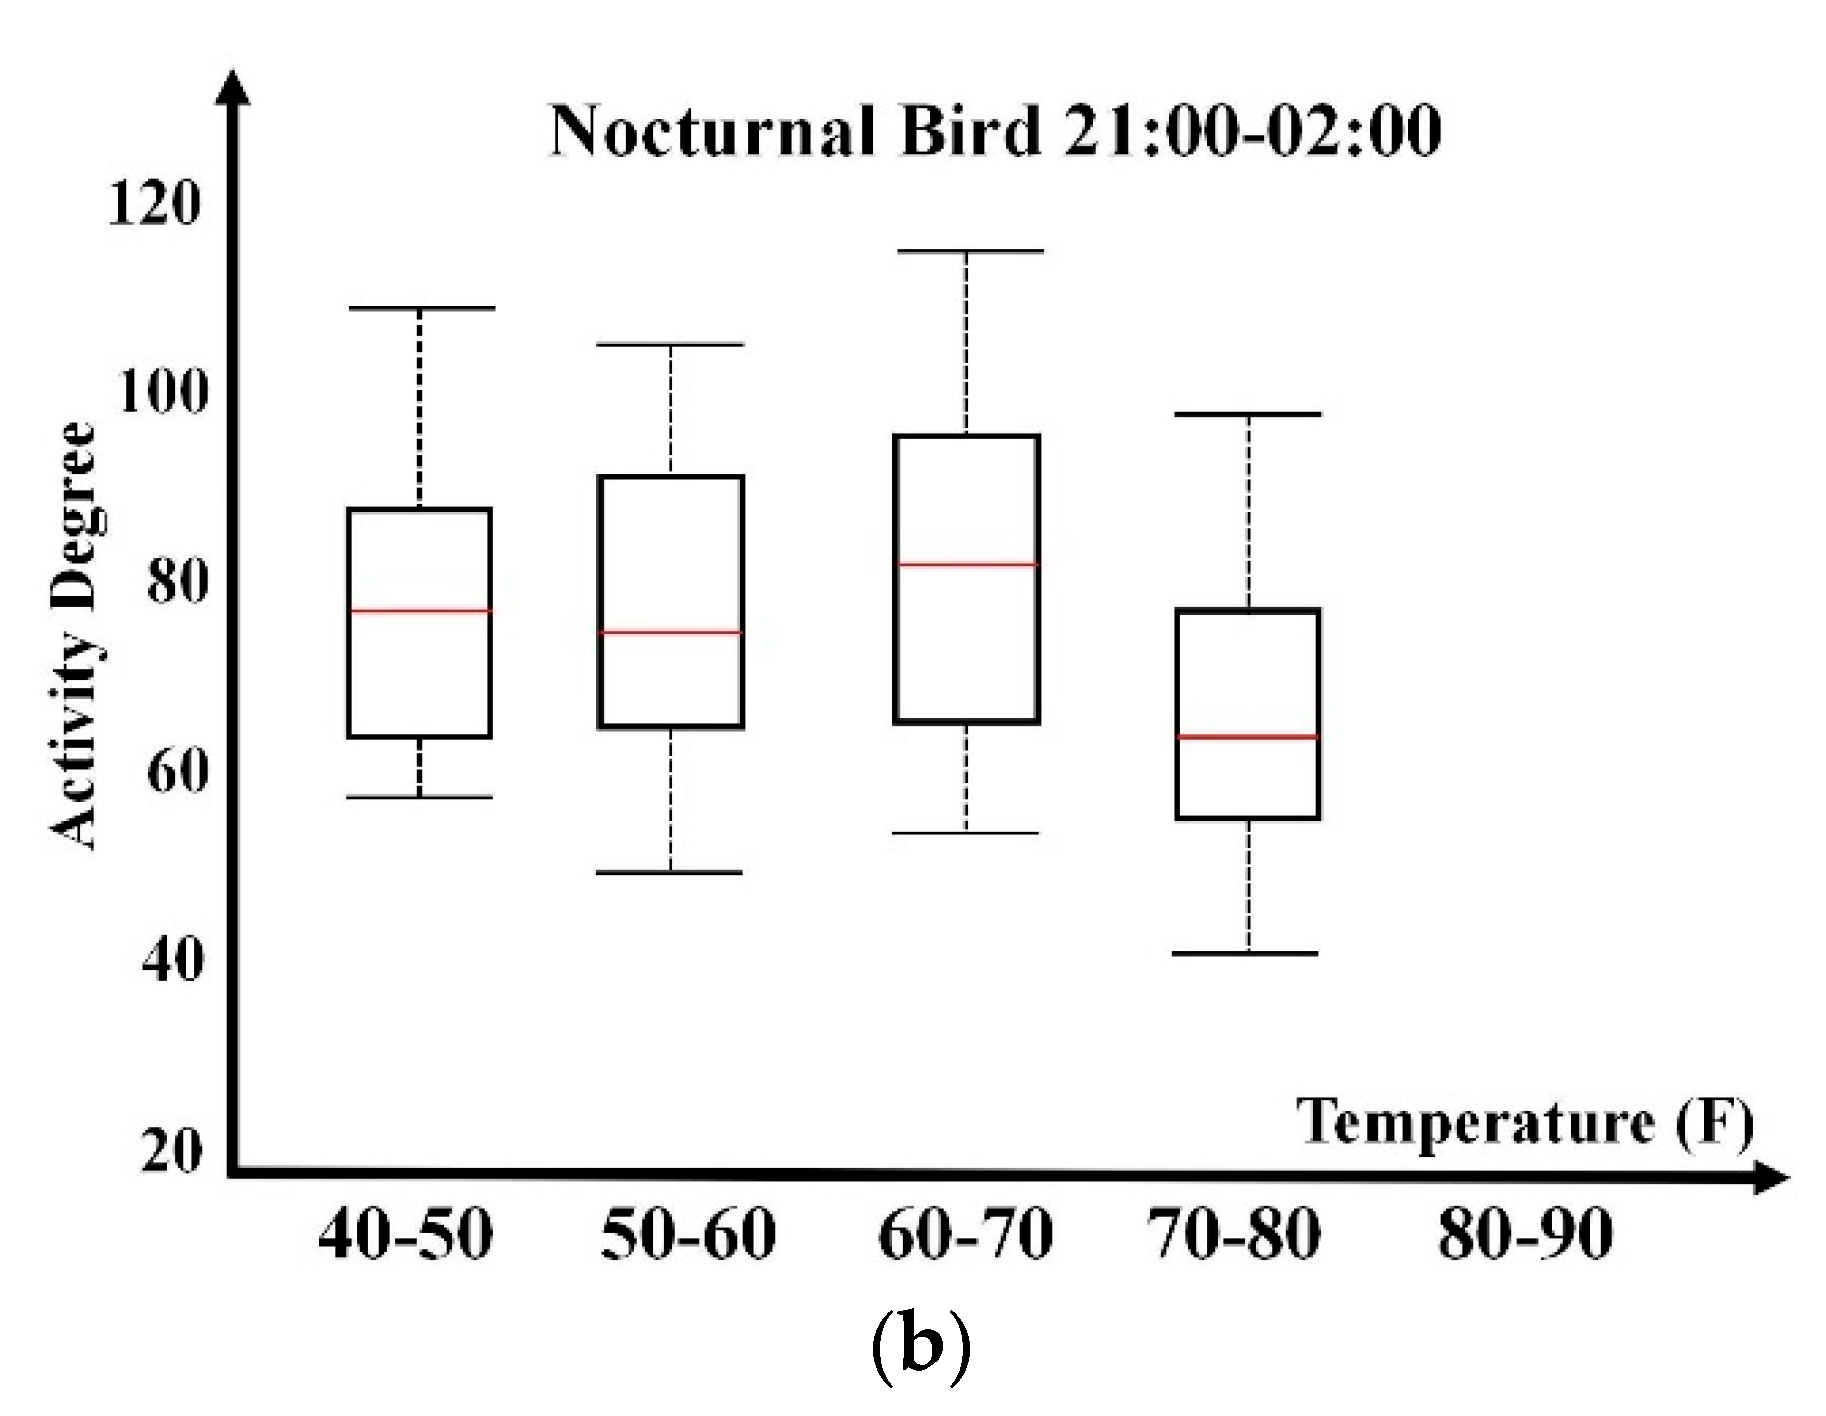
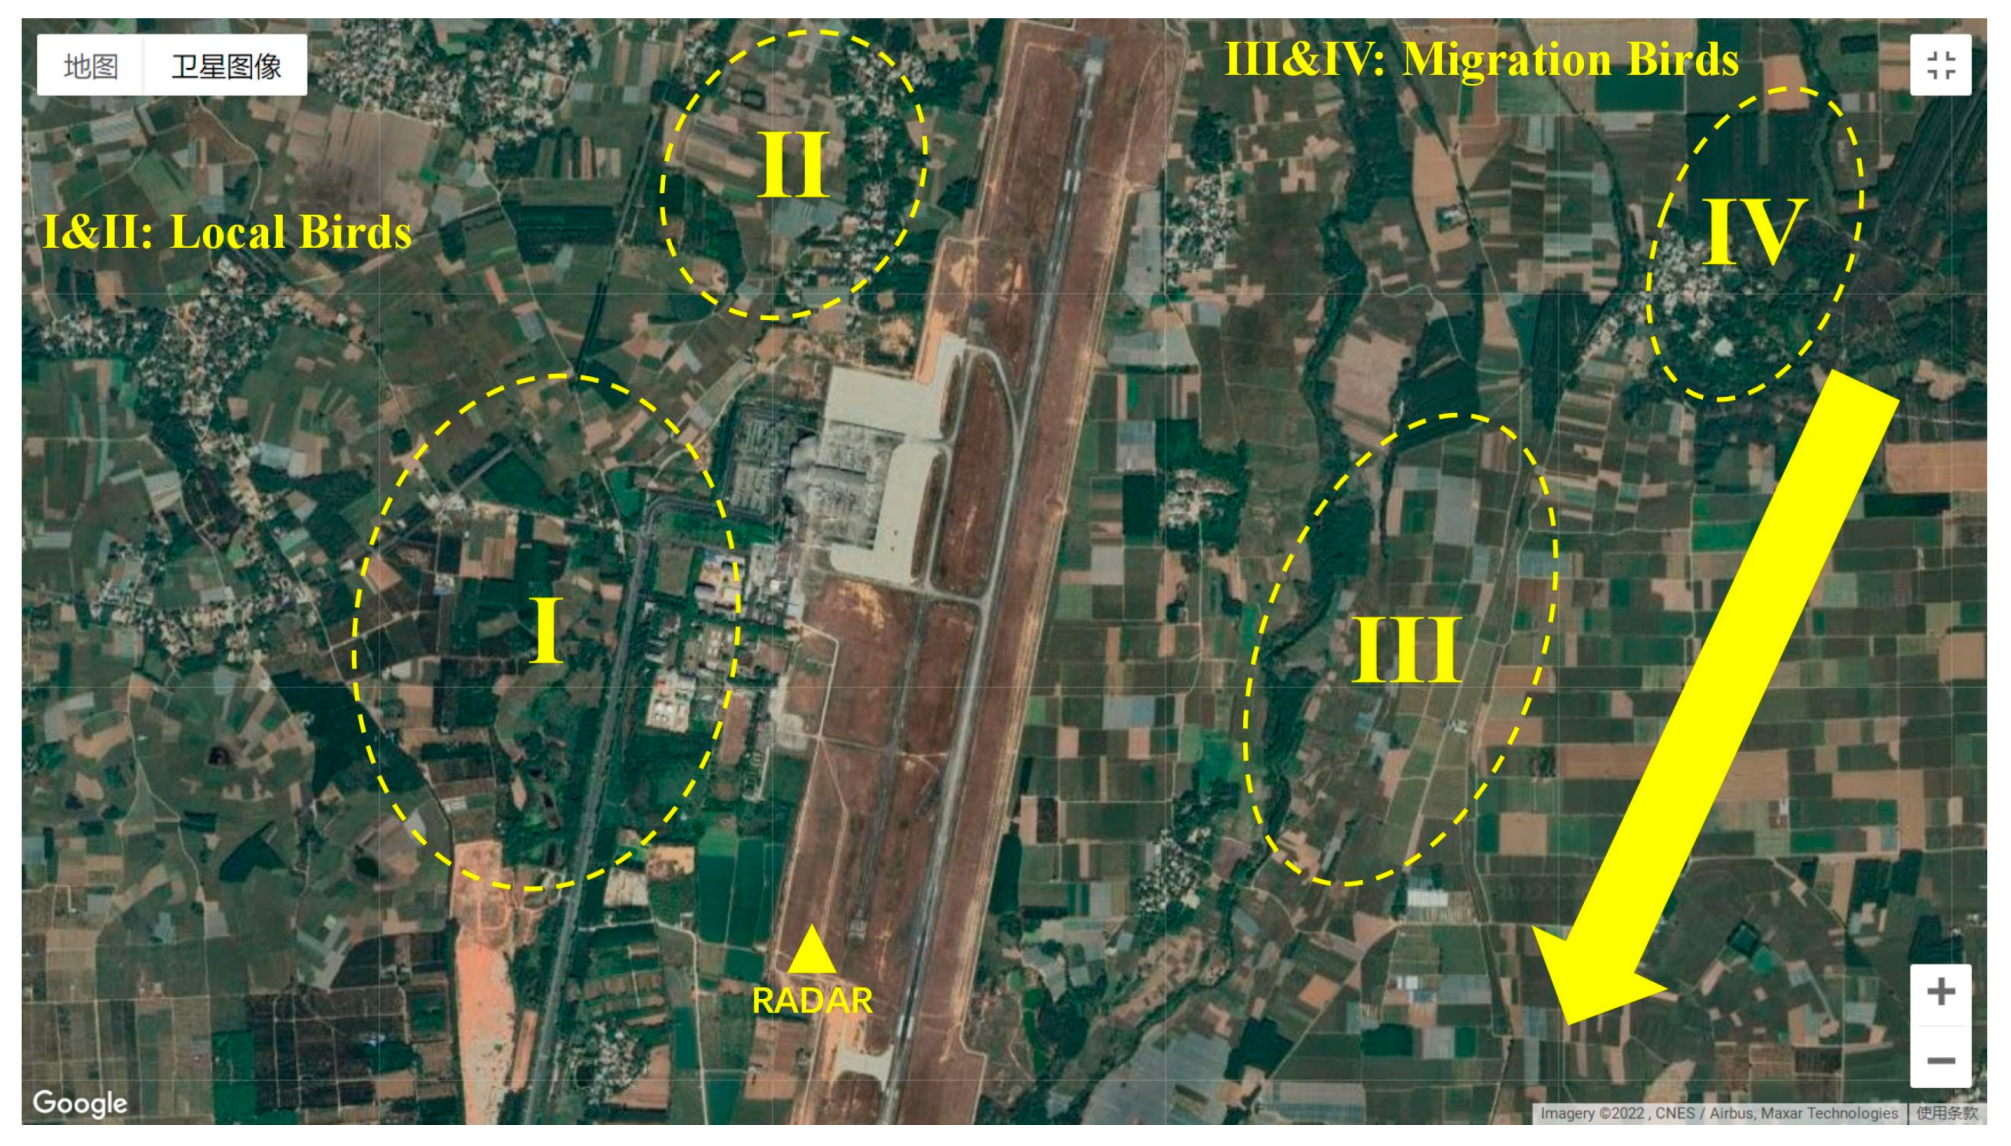
According to historical radar data analysis and artificial field observation records, the avian radar systems adopted in this paper are categorized into two datasets. The first dataset consists of diurnal birds within the west side of the airport; most observed birds within this area present daily commuting or roosting activities. Their activity pattern and relevance to weather could be roughly estimated through artificial field observations. The source of the other dataset comes from the nocturnal birds in the southeast region of the airport. Existing observation records with both avian radar and optical equipment indicate most birds are engaged in migratory activities. Therefore, the nocturnal bird dataset mostly consists of migratory birds whose activity patterns reflect different weather relevance compared with diurnal residents. In the following analysis, weather relevance exploration and modeling are conducted on two datasets, respectively.
The preliminary study of bird activity relevance with a single weather parameter is presented in this section to support the necessity of bird activity association with weather parameters. Based on existing analysis and understandings, temperature, humidity, wind speed, and wind direction are selected to construct a multivariable weather feature vector. For a specific hour, such as 08:00–09:00, weather information and bird activity degree information are collected from local weather records and radar observation data. This paper adopts the box plot to present activity dependence on a single weather parameter in a statistical manner. Temperature, humidity, and wind speed parameters possess numerical properties; their value spans are constructed for box plot generation. The wind direction possesses discrete property by categorizing it into eight directions (north, northeast, east, southeast, south, southwest, west, and northwest). Box plots are generated for each direction.
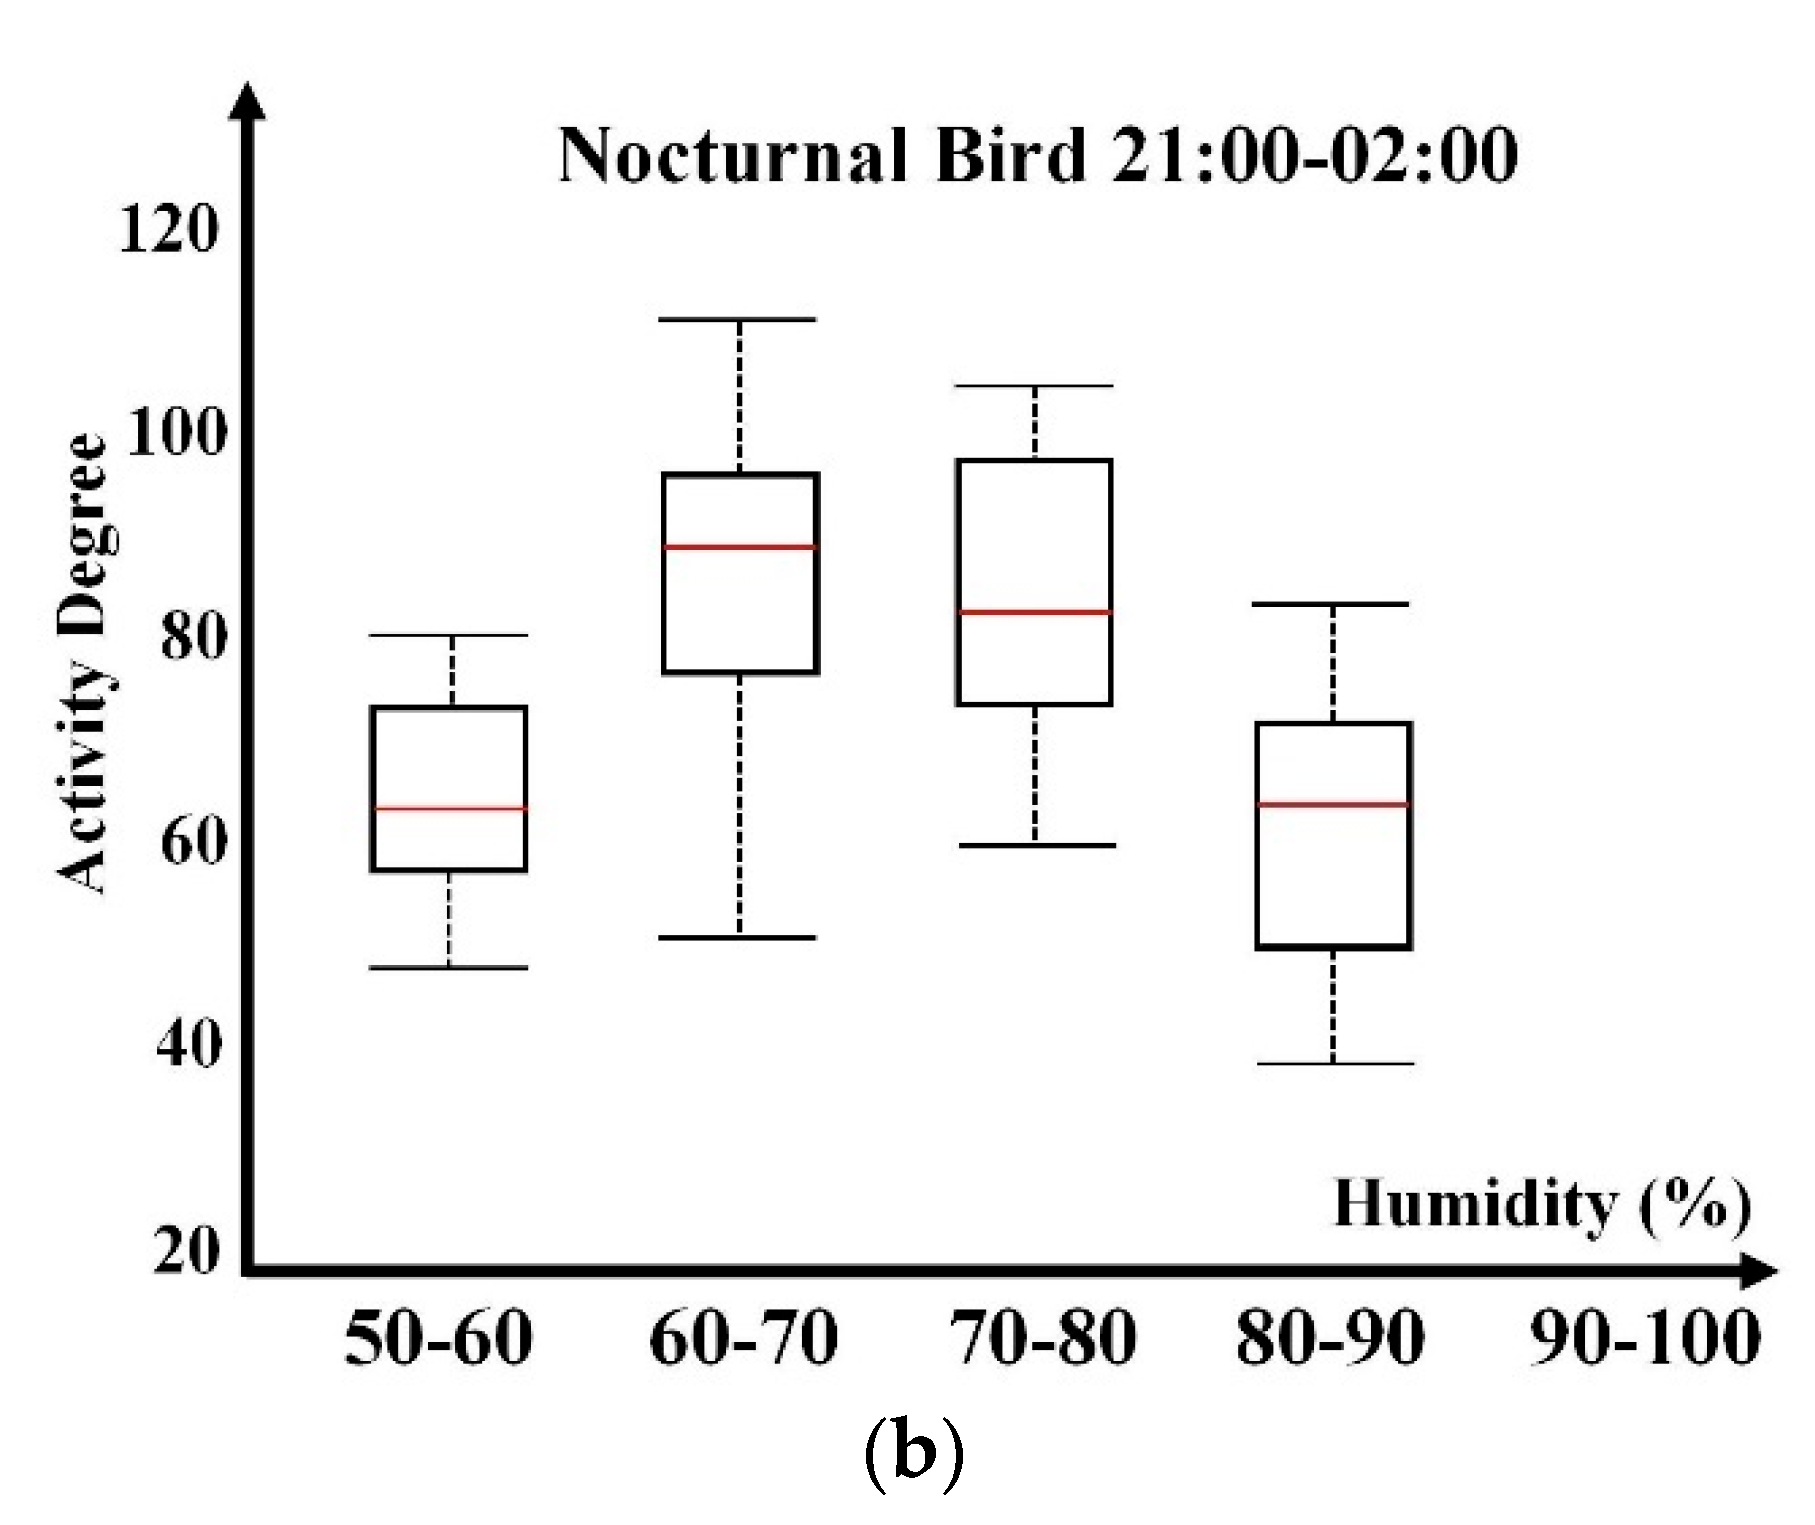
2.3. Temperature

Temperature has a dominant impact on bird activity. Similar to humans, birds are more active at their comfortable temperature ranges. Figure 3 demonstrates the activity degree box plot for diurnal and nocturnal birds within their active hours; the temperature unit is Fahrenheit. The data comes from four years of data collection from August to October. Activity dependence could be clearly presented in the box plot. For diurnal birds in the morning hours, their most proper temperature span is [60, 70] Fahrenheit. Other temperature spans are not suitable for birds, which is consistent with conventional understandings from artificial field observation and records.
Nocturnal birds present a different temperature relevance compared with diurnal birds, as illustrated in Figure 3b. As nighttime temperatures are lower than daytime ones, there is no temperature record for [80, 90] Fahrenheit. Night temperature values are clustered within [40, 60] Fahrenheit. Box plots at night do not present a clear activity dependence on temperature. According to ornithologists’ feedback, migratory birds in this area are not sensitive to temperature. The prominent activity reduction only exists in extreme temperature conditions. Another explanation for this ambiguous relevance is the temperature measurement deviation. Compared with diurnal birds, which are mostly active in low-altitude airspace, the average altitude for nocturnal birds is usually higher. Artificial analysis of historical nocturnal migratory bird tracks from the radar system indicates that most birds fly within the altitude range between 400 and 1700 m. The airspace within this altitude range presents prominently different temperature characteristics compared with ground measurements. Currently, it is impractical to obtain temperature information from higher airspace, and this deviation makes a non-negligible contribution to temperature relevance ambiguity.

2.4. Humidity

Humidity is another comfort indicator of bird activity. Figure 4 presents box plots for diurnal and nocturnal birds under different humidity spans in the unit of %. Diurnal bird activities are remarkable within [70, 80]%. The longer box within this span indicates greater activity variability. Excessively dry or wet environments are not favored by birds, and corresponding box lengths are shorter with less sample support. The humidity within [90, 100]% is usually accompanied by fog, which obviously restrains bird activity.
Nocturnal bird activities present weaker relevance with humidity. The principal active span is [60, 70]%. There is no humidity record within [90, 100]%. Compared with diurnal birds, the box length of nocturnal birds is shorter, indicating smaller variability. This is reasonable, as nocturnal bird activities usually present more prominent regularity and periodicity. Similar to the temperature study, the relevance credibility is also influenced by the humidity information deviation, as in the temperature case.
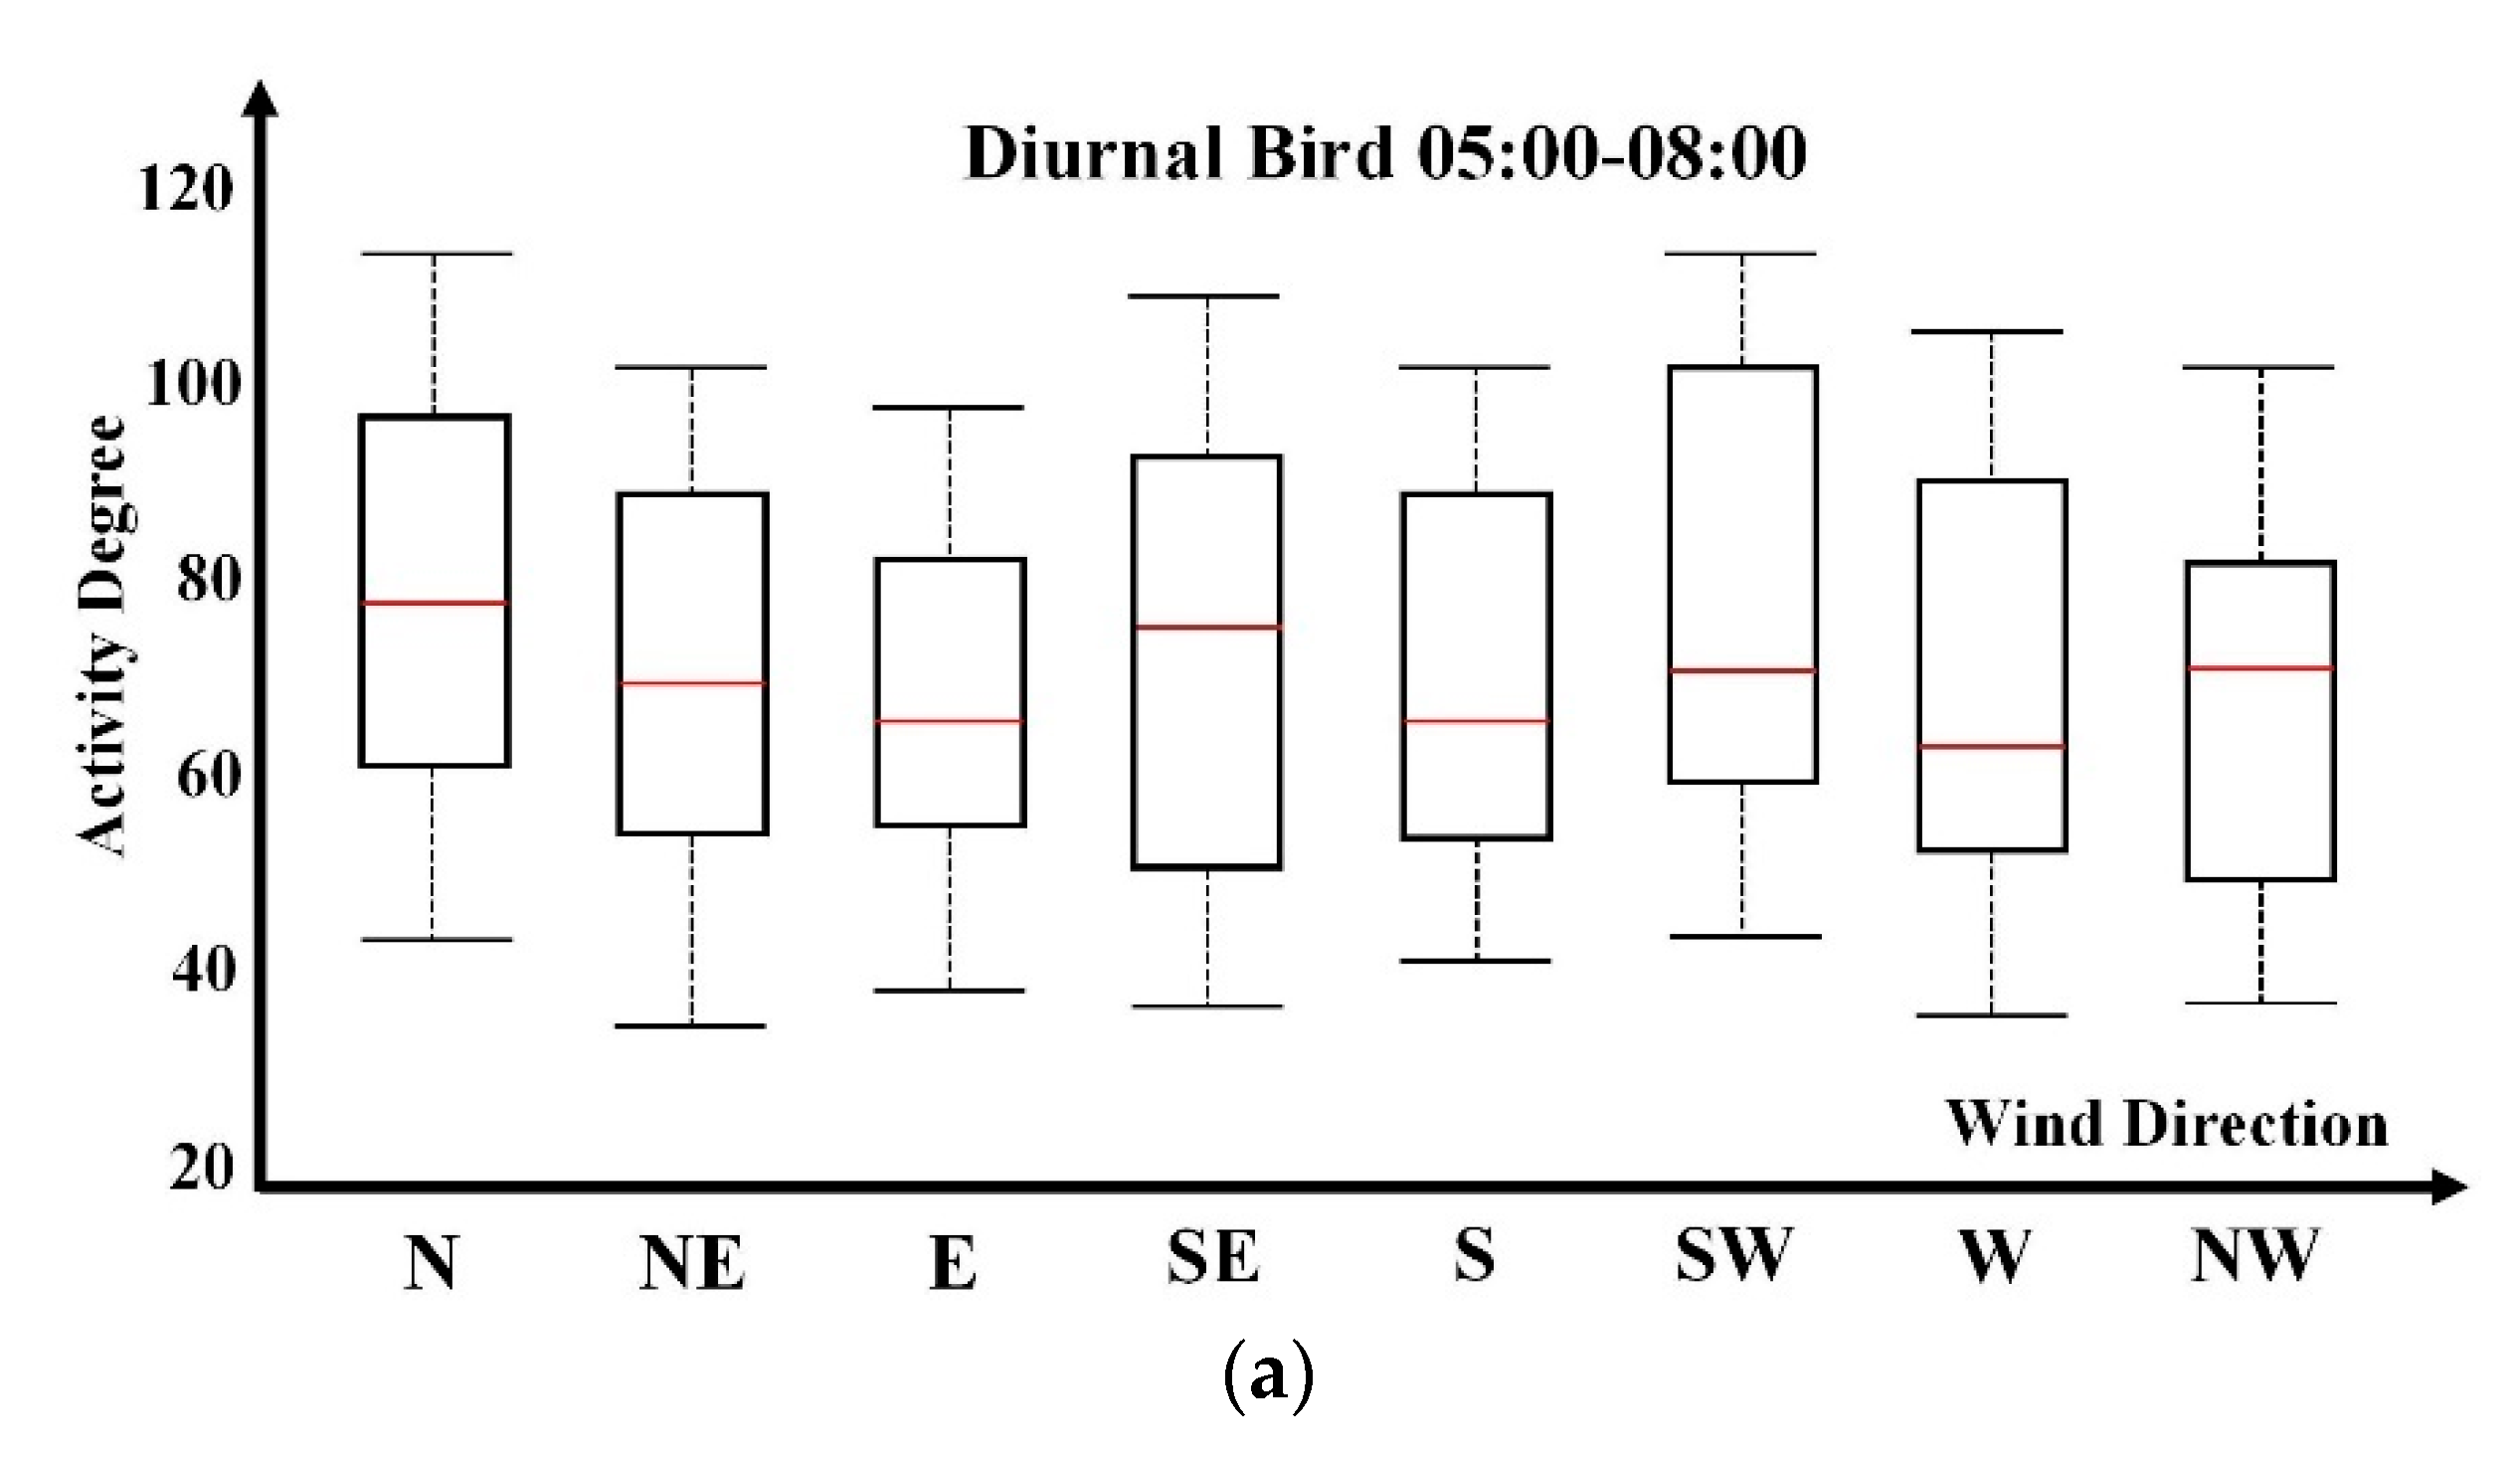
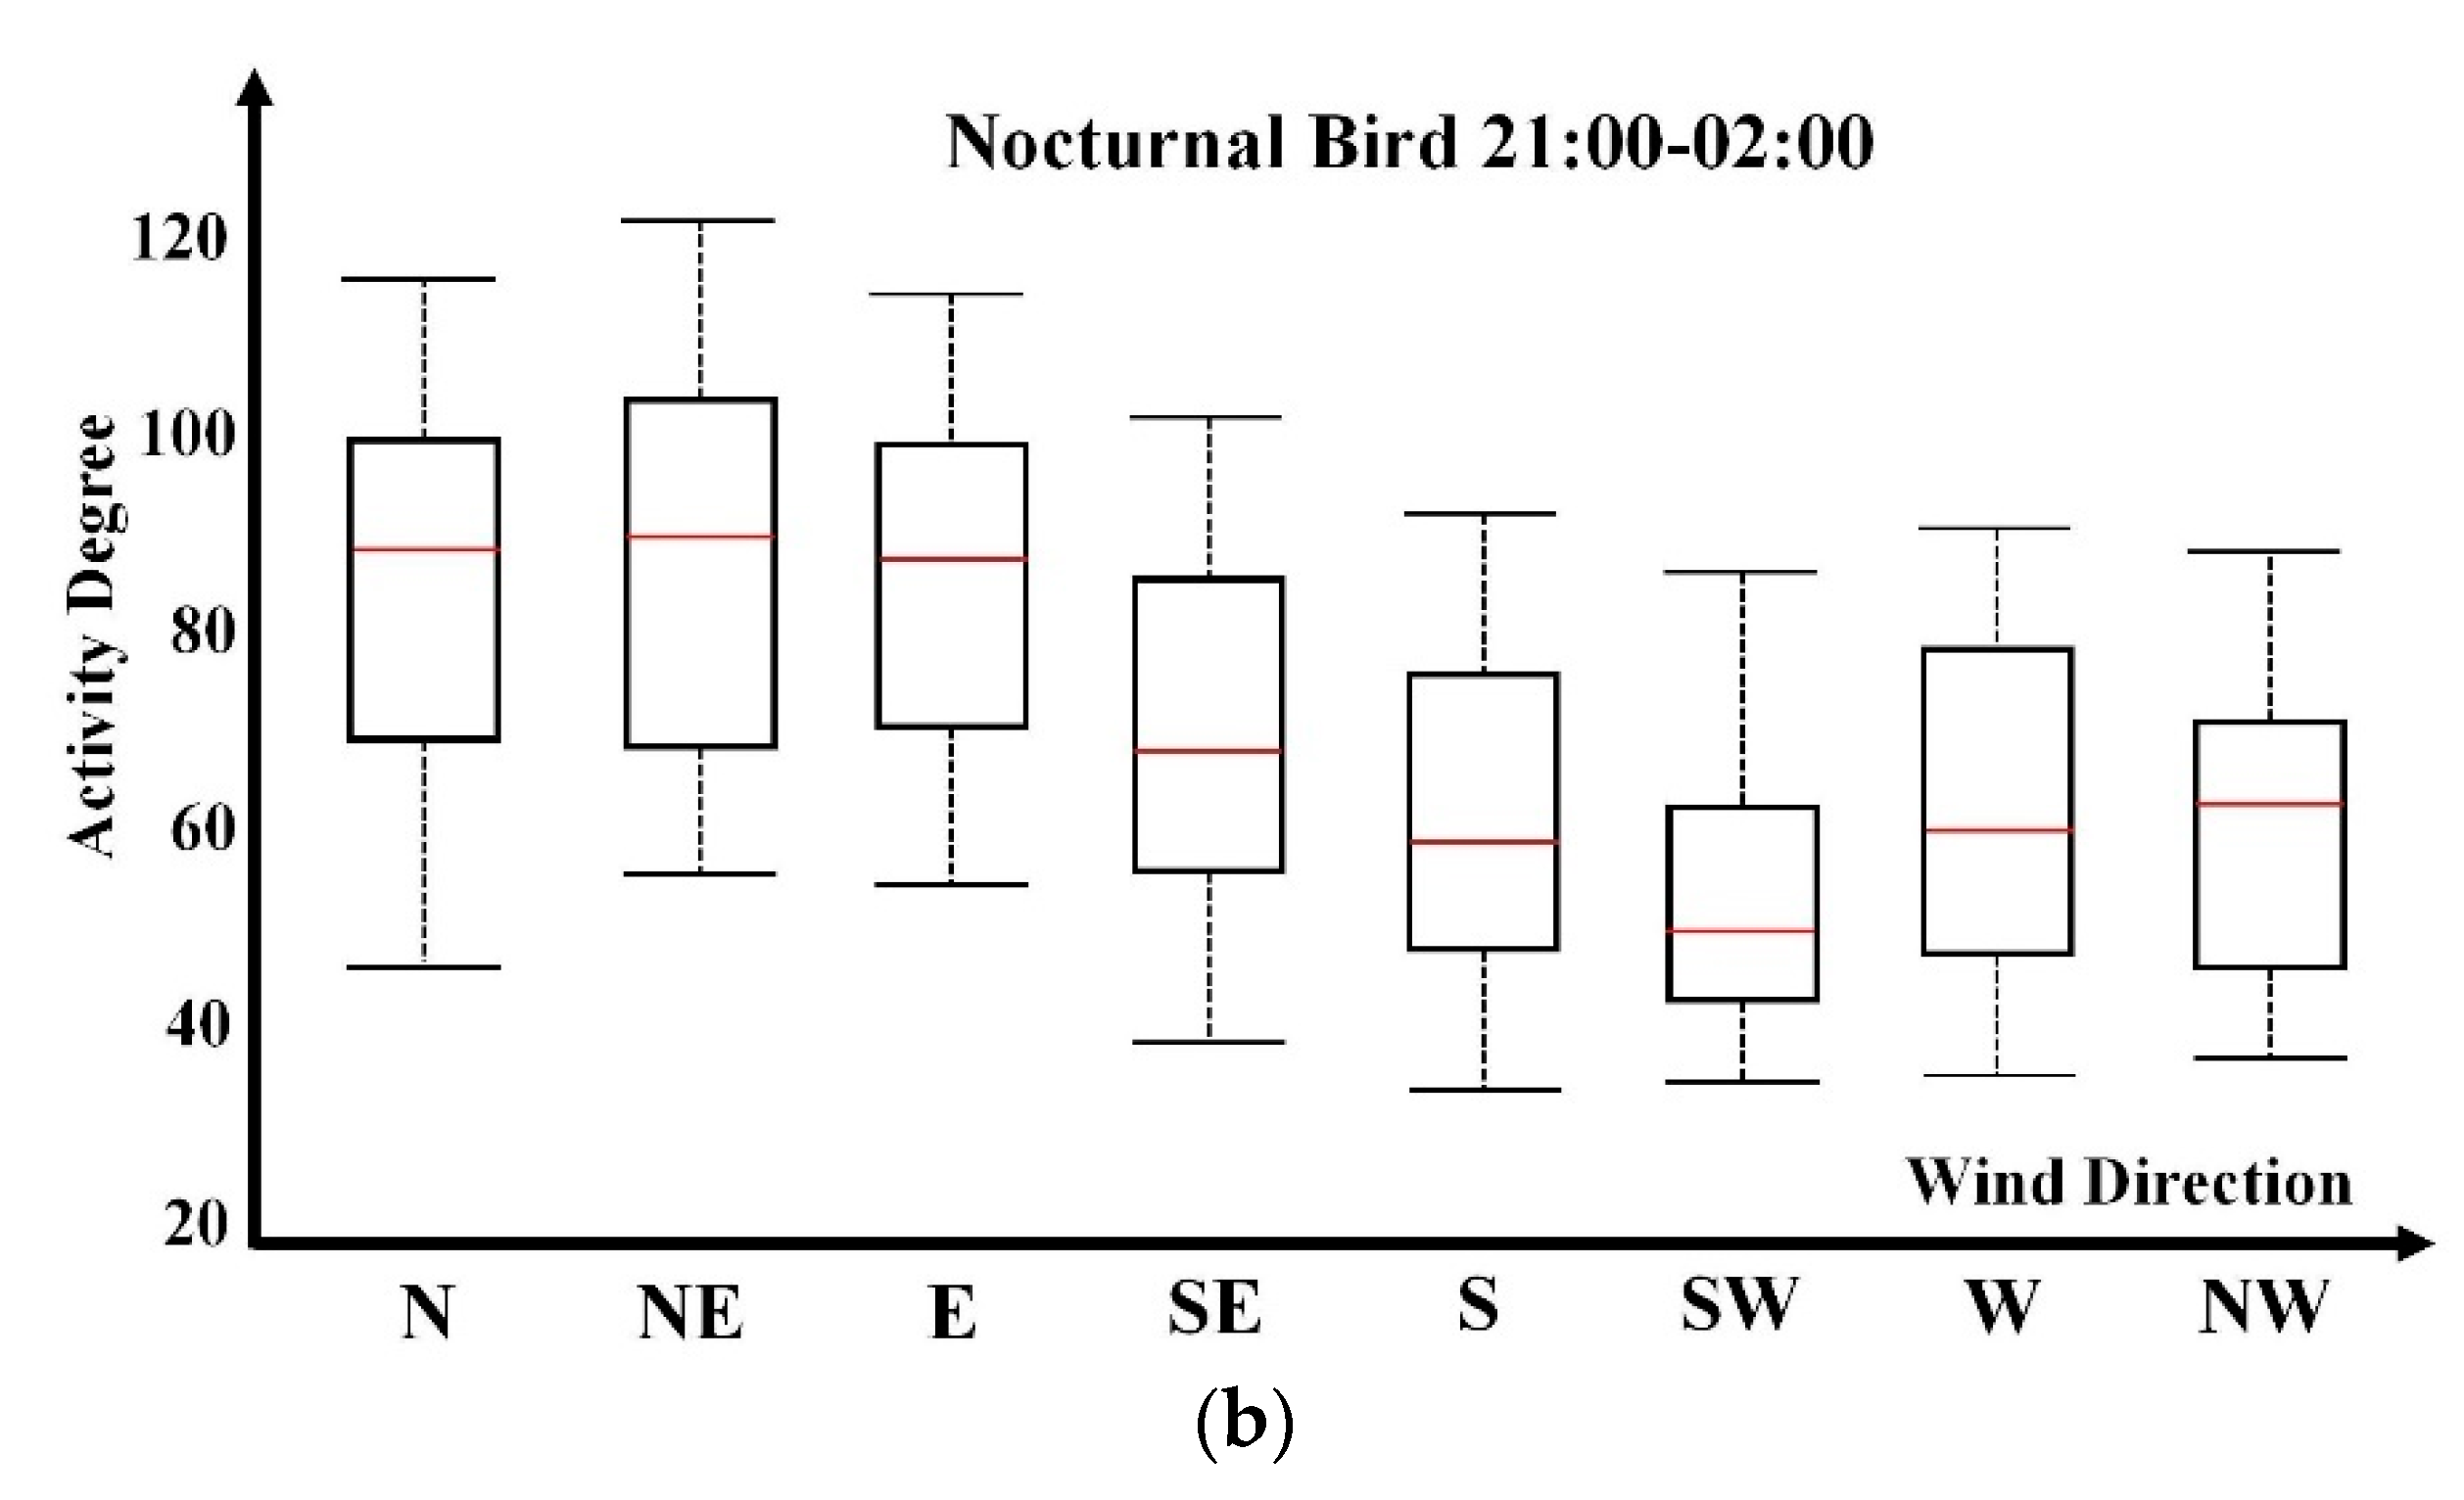
2.5. Wind Speed

Wind plays a dominant role in bird activities for both speed and direction. Figure 5 demonstrates the activity degree box plot under different wind speed spans in m/s. Box plots are longer than other weather relevance studies. This large activity variability indicates that the activity relevance of wind speed is minor, and other flexible weather parameters lead to wide activity degree distributions.
Nocturnal birds present obvious activity reduction and greater variability when the wind speed is greater than 15 m/s, which is considered a strong wind. Wind speed’s relevance for nocturnal birds presents a negative correlation pattern. Existing works indicate that migratory activities have closer relevance to wind speed and direction for energy savings. Box plots within low wind speed spans also reflect a larger degree of activity and variability. The wind speed information deviation also results in a credibility problem, which is difficult for quantitative evaluation with existing data sources.

2.6. Wind Direction

Diurnal bird activities are usually not sensitive to wind directions. As illustrated in 
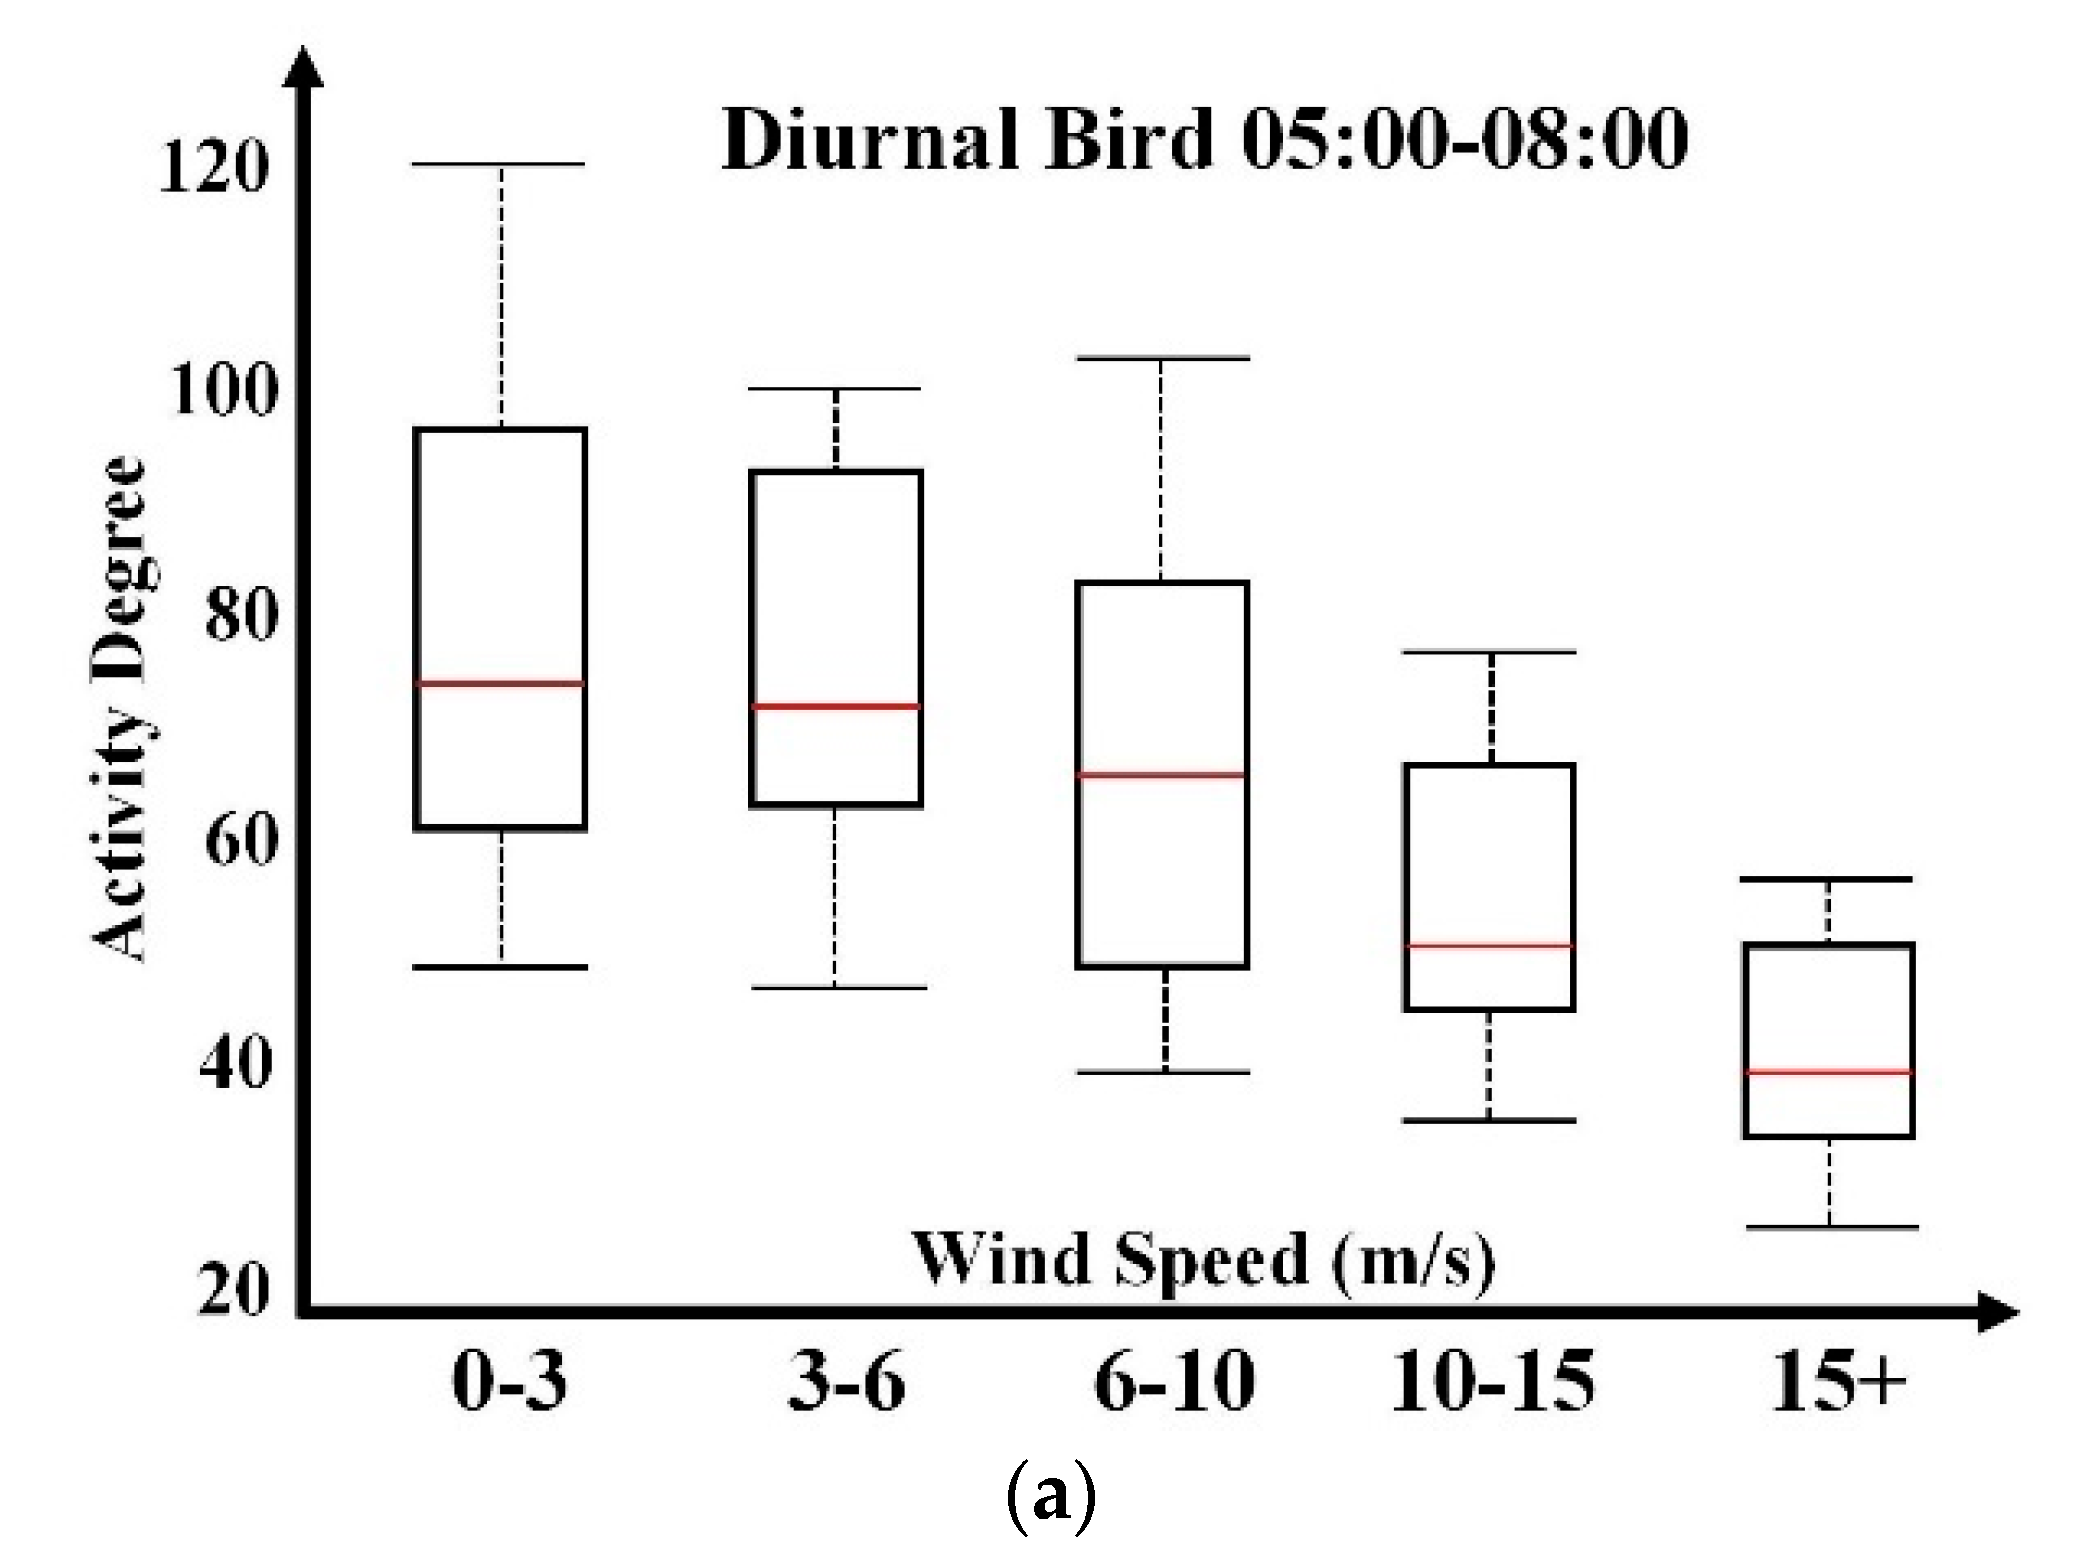
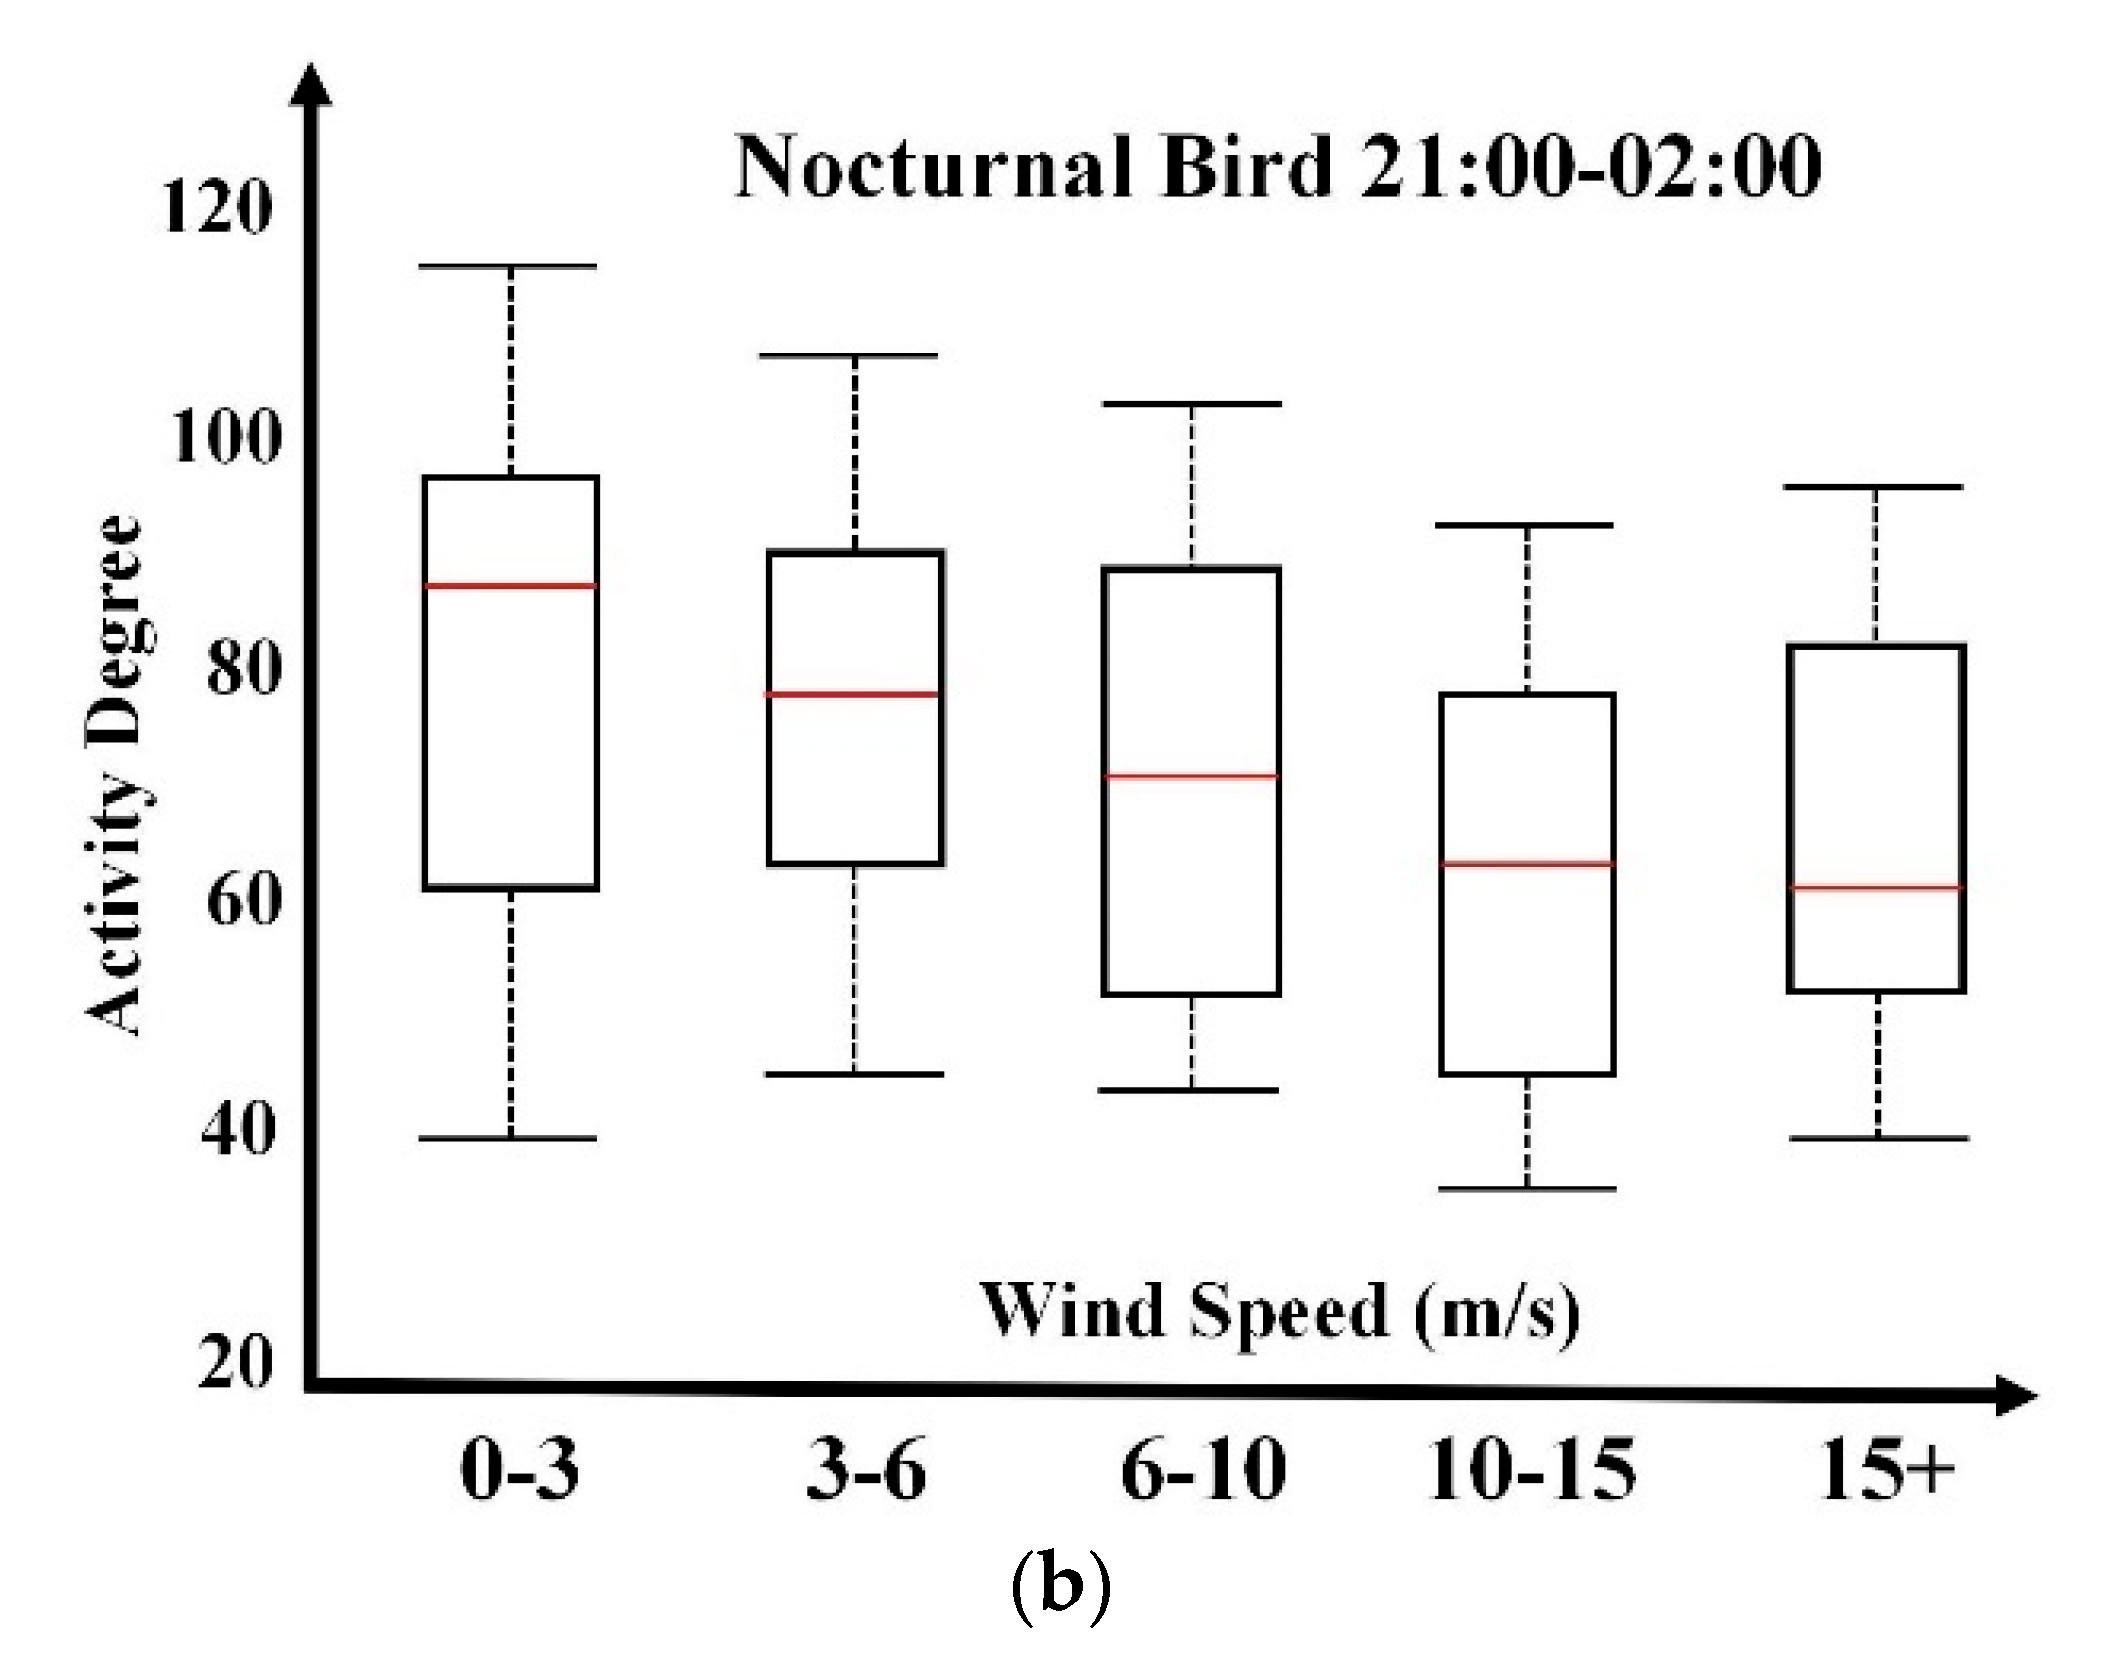
Figure 6a, box plot distribution on wind directions does not reflect clear and interpretable relevance. This is consistent with ornithologists’ understandings. Compared with Figure 5, wind speed has a more remarkable influence on diurnal bird activity degrees. In contrast, nocturnal bird activity’s dependence on wind direction is more distinctive, as presented in Figure 6b. North, northeast, and east directions are preferable. Track flight direction analysis over historical data indicates the principal nocturnal migration direction in the fall season is the southwest direction. Therefore, the wind direction dependency analysis indicates that birds in this area are inclined to fly along the wind’s blowing direction for energy savings. Predominant bird activities reflect longer box plots, indicating greater variability. According to discussions with ornithologists, the box plot length has the potential to deduce bird species composition within a specific spatial and temporal window according to prior knowledge.
Preliminary experiments presented in this section indicate the reasonability of associating bird activities with weather parameters. It is observed that weather parameters present their respective relevance patterns. Even with measurement deviations, it is still plausible to predict bird activities with weather information. Since bird activities are influenced by multiple weather parameters in a joint manner, the extension of the multivariable weather dependence study is necessary.

2.7. Multivariable Weather Relevance Modelling and Analysis

The mapping in Table 2 categorizes bird activities into labels A, B, C, and D, which models bird activity prediction as a supervised learning problem. The multivariable weather feature vector is constructed as F = [t,h,s,w], which represents temperature, humidity, wind speed, and wind direction, respectively. Weather parameters have different dimensions and value ranges; a normalization procedure is necessary to reduce feather space distortion. Wind directions do not possess numerical properties; eight wind directions are labeled from 1 to 8. To guarantee numerical consistency, other weather parameters are normalized within the numerical range of [1, 8]. The feature vector F is the input of the classification model. The output is the labeled activity grade {A,B,C,D}. This paper chooses two sets of machine learning techniques to verify the feasibility of the prediction model.
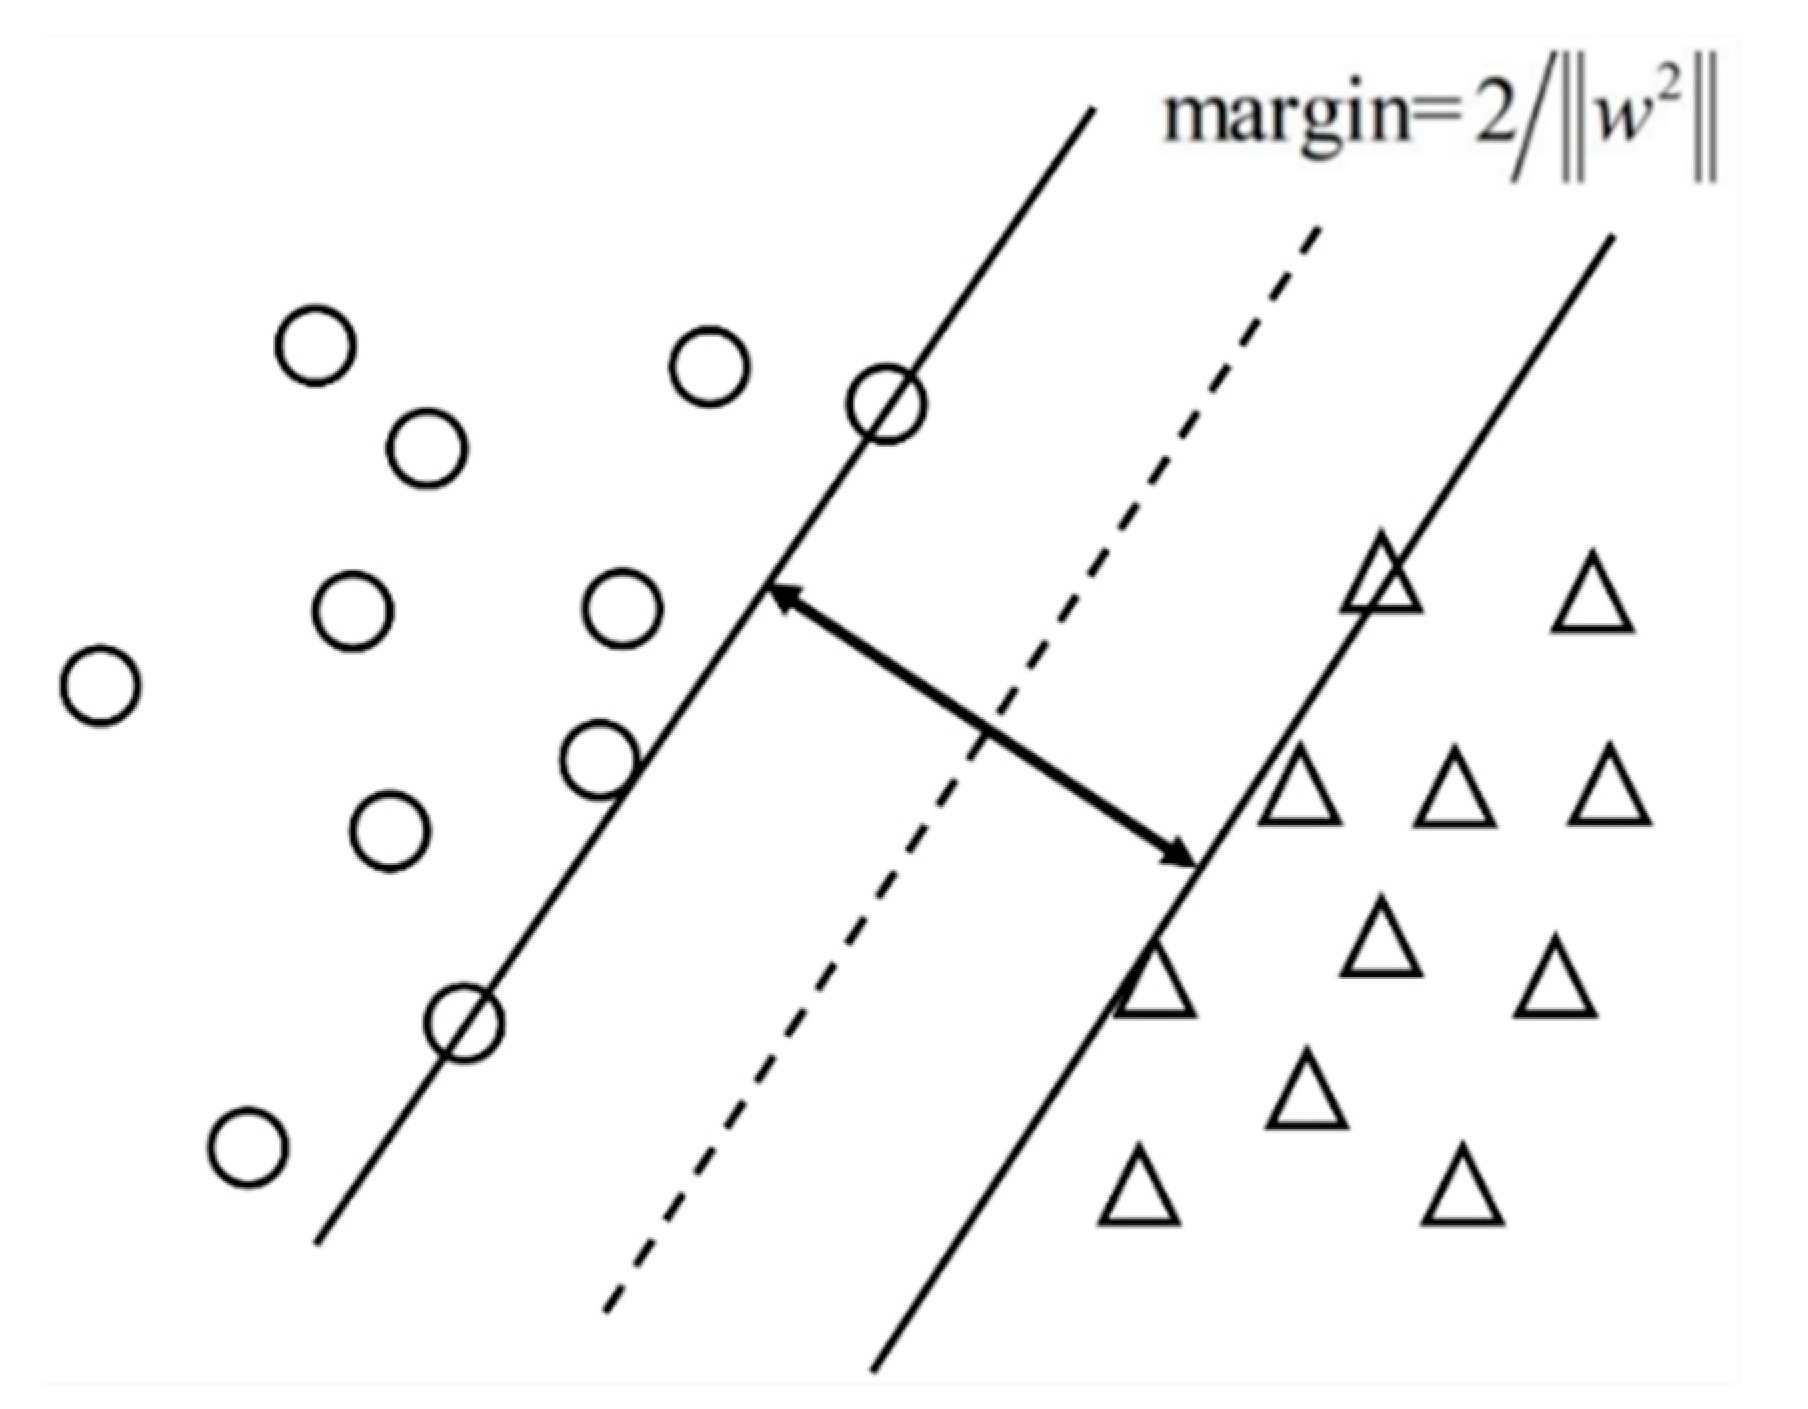
The first technique routine is the Support Vector Machine (SVM) [17,18,
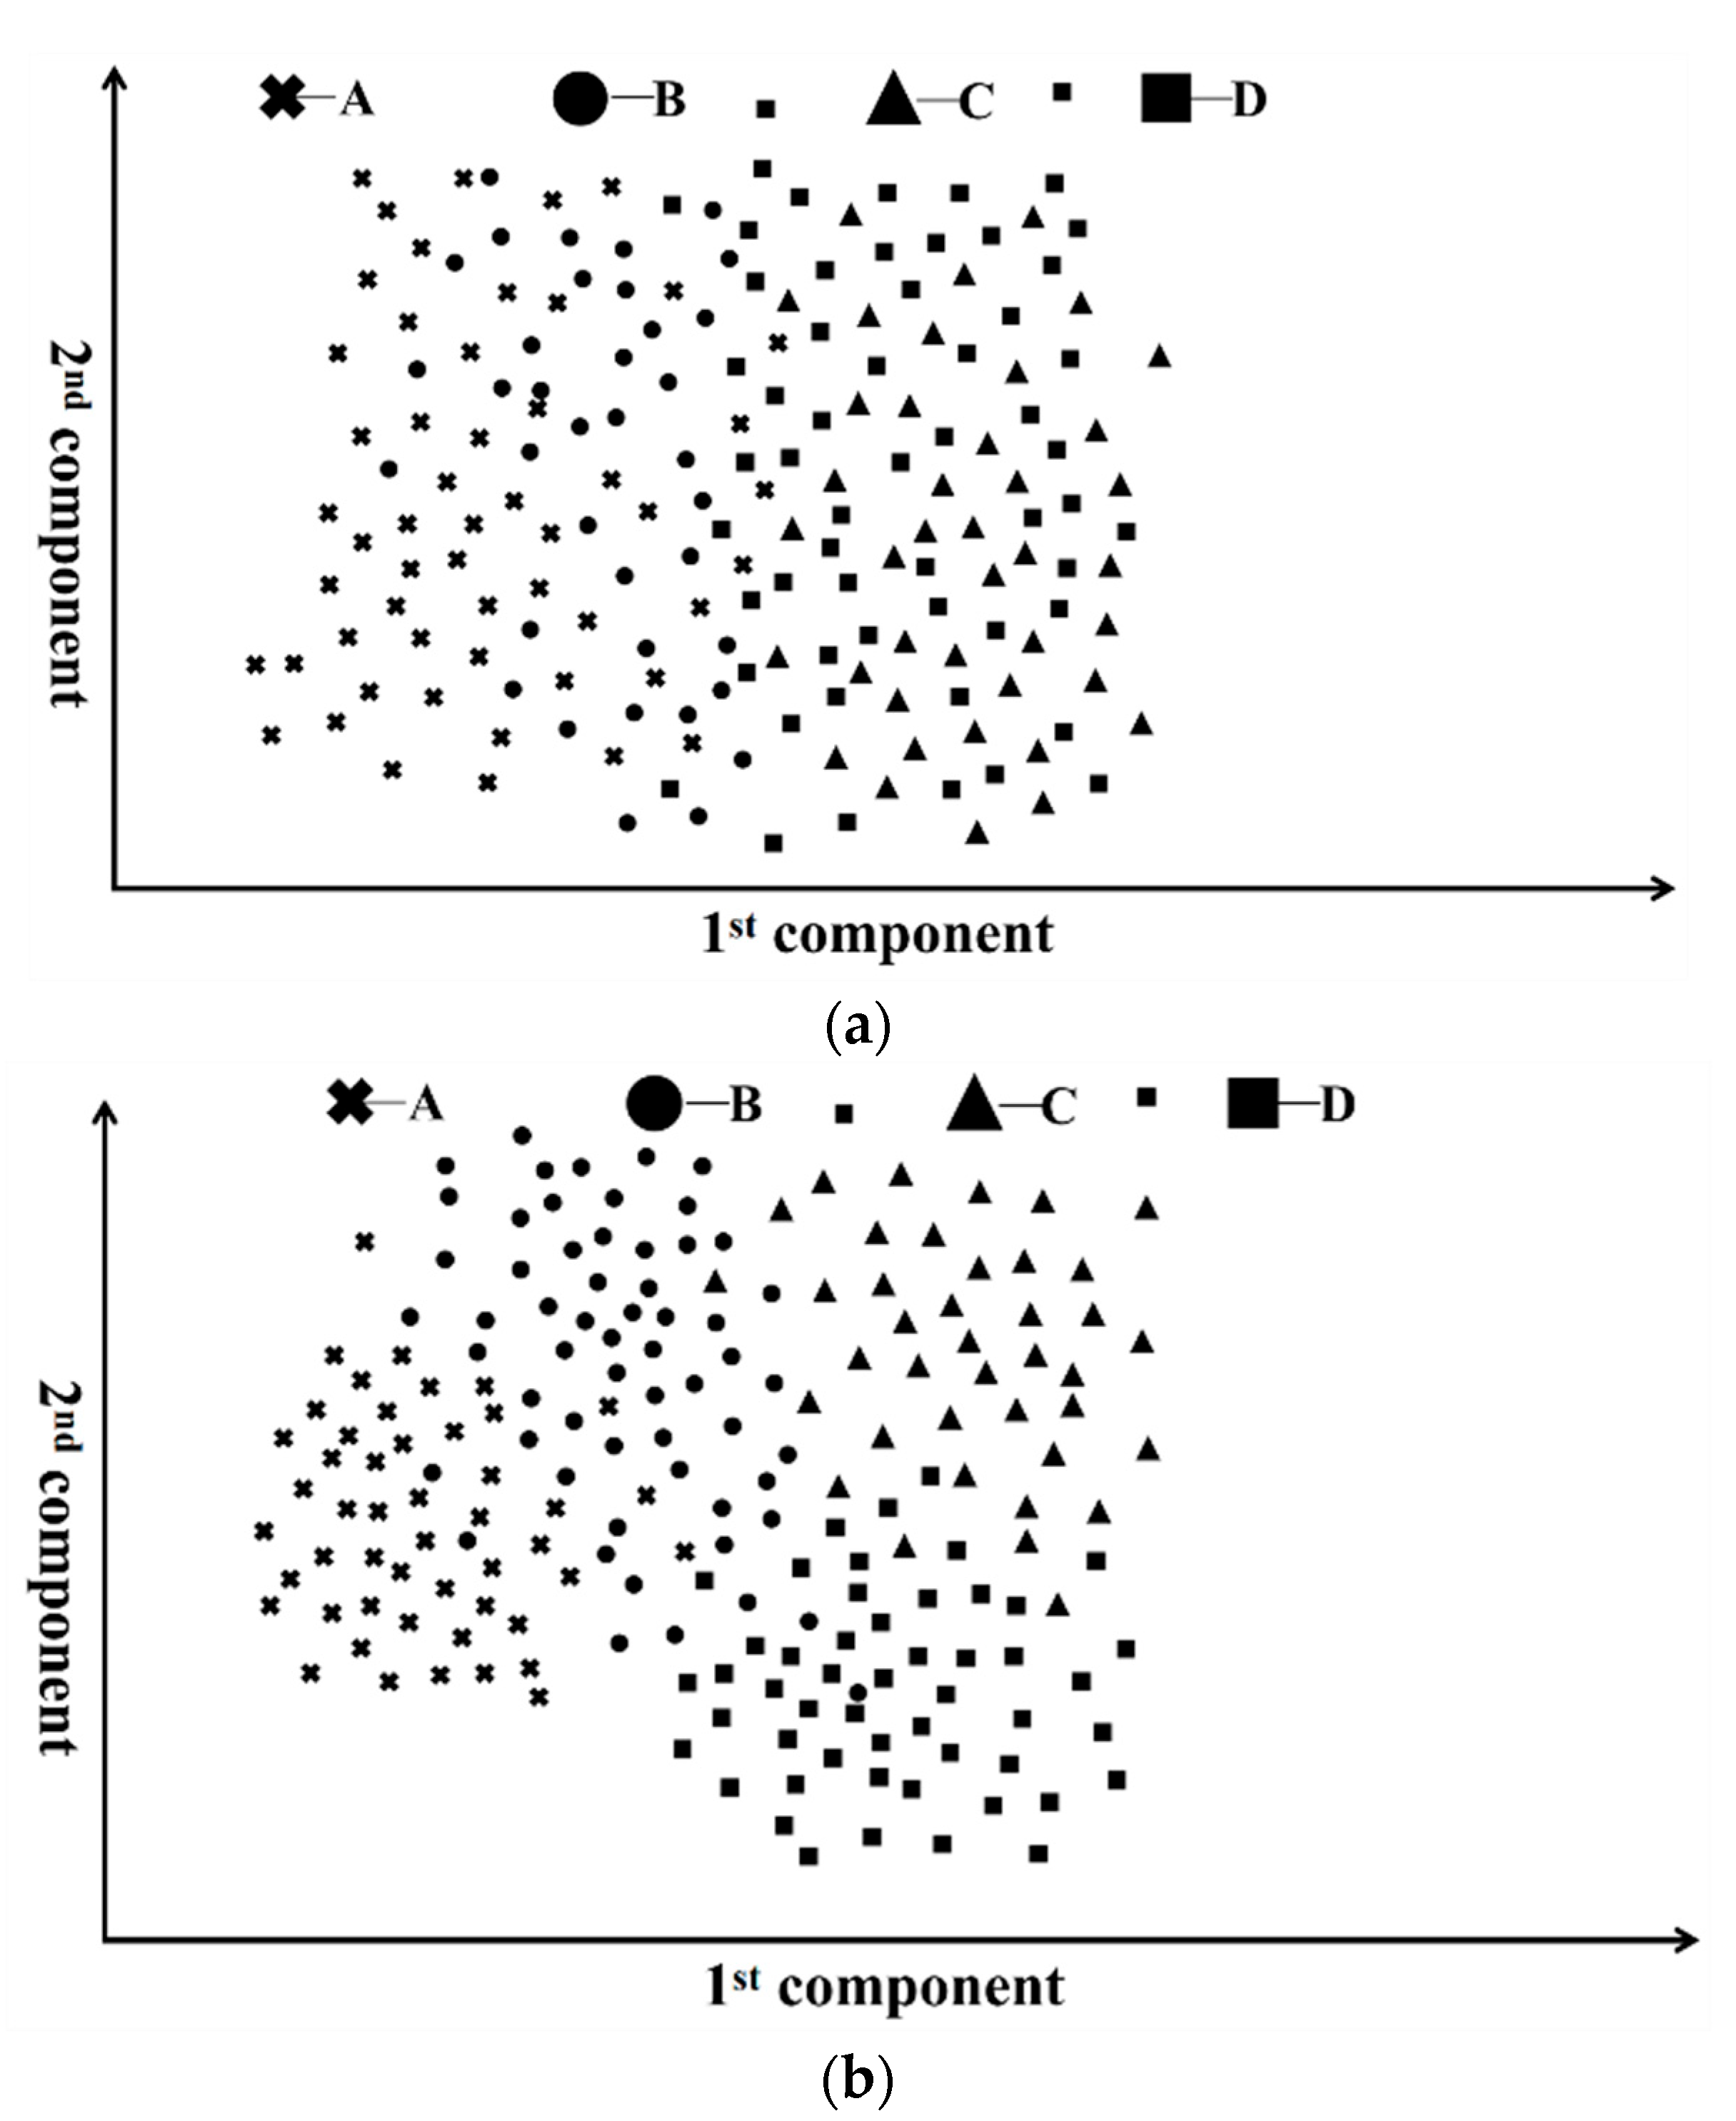
19] classifier with the Linear Discrimination Algorithm (LDA) [20,21,22] for feature extraction. SVM is a representative learning machine based on the risk minimization criteria in statistical learning theory. It is widely adopted in various machine learning problems due to its solid theoretical support and robustness in sample variations. SVM usually constructs the optimal hyperplane in a kernel-projected higher-dimensional feature space according to the maximum margin strategy. Its principle is graphically demonstrated in Figure 7. This paper adopts the Gaussian kernel function to project the feature space into higher-dimensional space. SVM has demonstrated its outstanding performance in many supervised classification and regression problems with the assistance of feature extraction techniques. Feature extraction methods are usually adopted as a preprocessing block to reduce feature dimension or enhance sample separability. LDA is a representative feature extraction technique to reshape sample distribution patterns for separability enhancement. It constructs the projection matrix by maximizing the ratio of between-class and within-class scatterers. Projected samples are applied to the learning machine for training and unknown sample classification. The composition of SVM and LDA reflects good performances in many problems, such as radar target recognition using target range profiles [23]. For the problem in this paper, this integration is challenged by inconsistent feature dimensions and numerical properties, which generate a highly distorted feature space. Moreover, due to the non-numerical property of wind direction, its numerical formulation results in feature space inconsistency in the wind direction dimension. This inconsistency might lead to non-negligible adverse impacts on the classification’s performance.
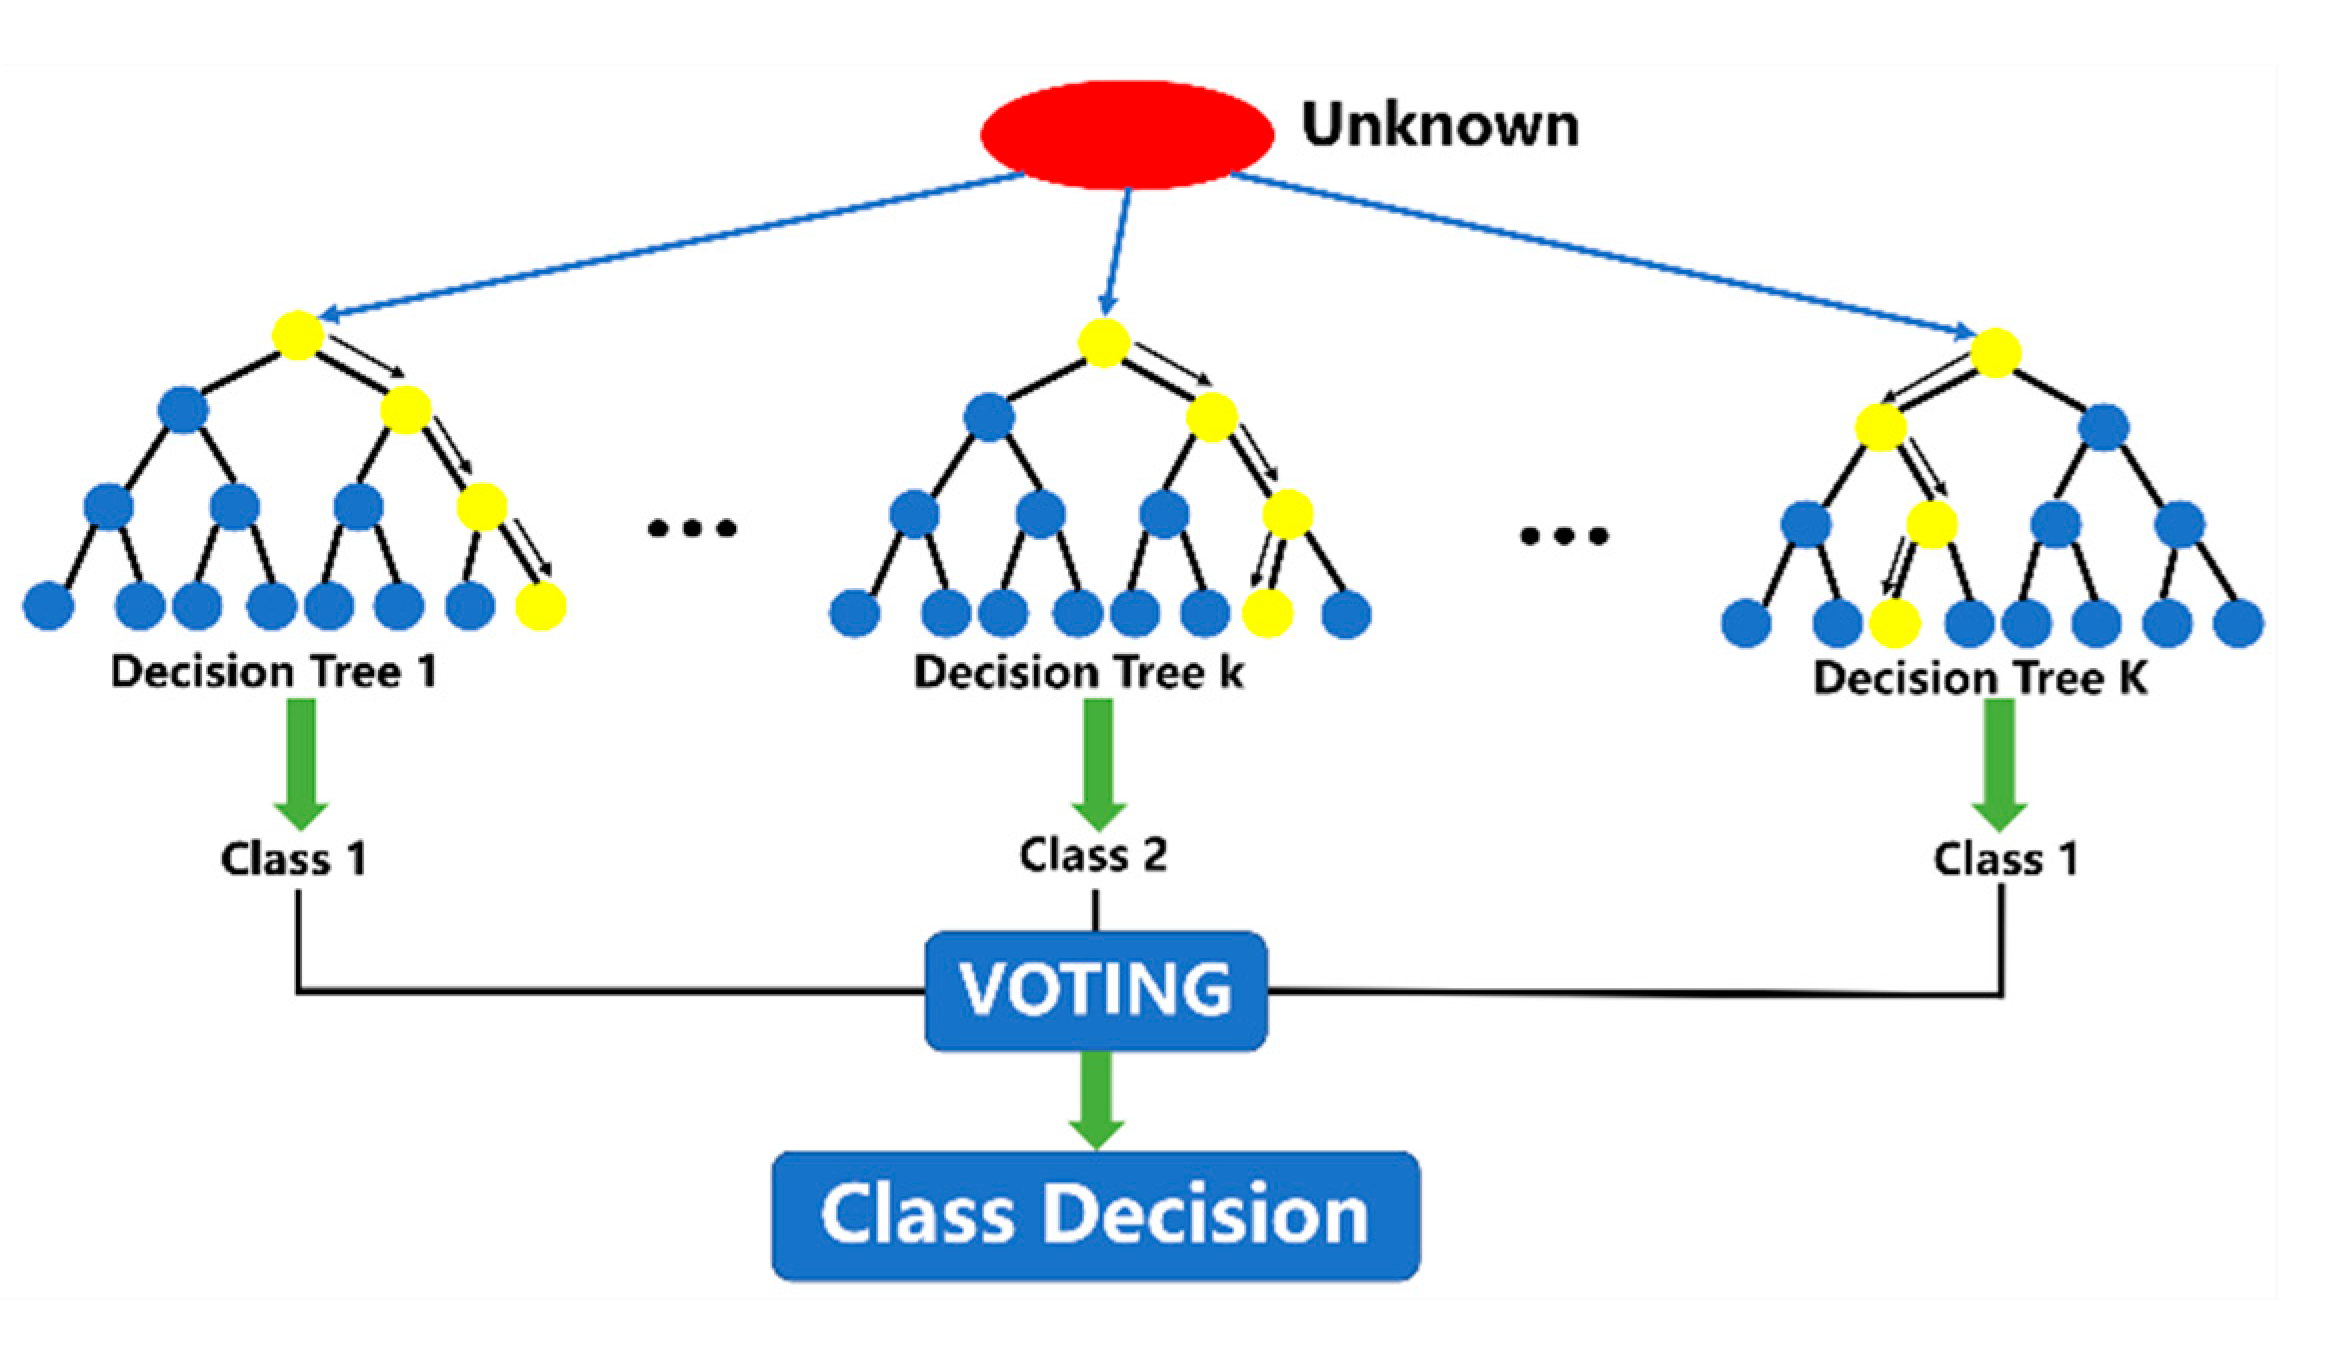
The other technique is utilizing the random forest model for classification. Random forest is an ensemble classification model [24,25] that models multiple decision trees. The basic principle of a random forest is to build multiple decision trees by randomly selecting partial features from the feature space. The decision procedures of trees are independent, and the final decision is made through the weighted integration of all trees. Its principle is graphically demonstrated in Figure 8.
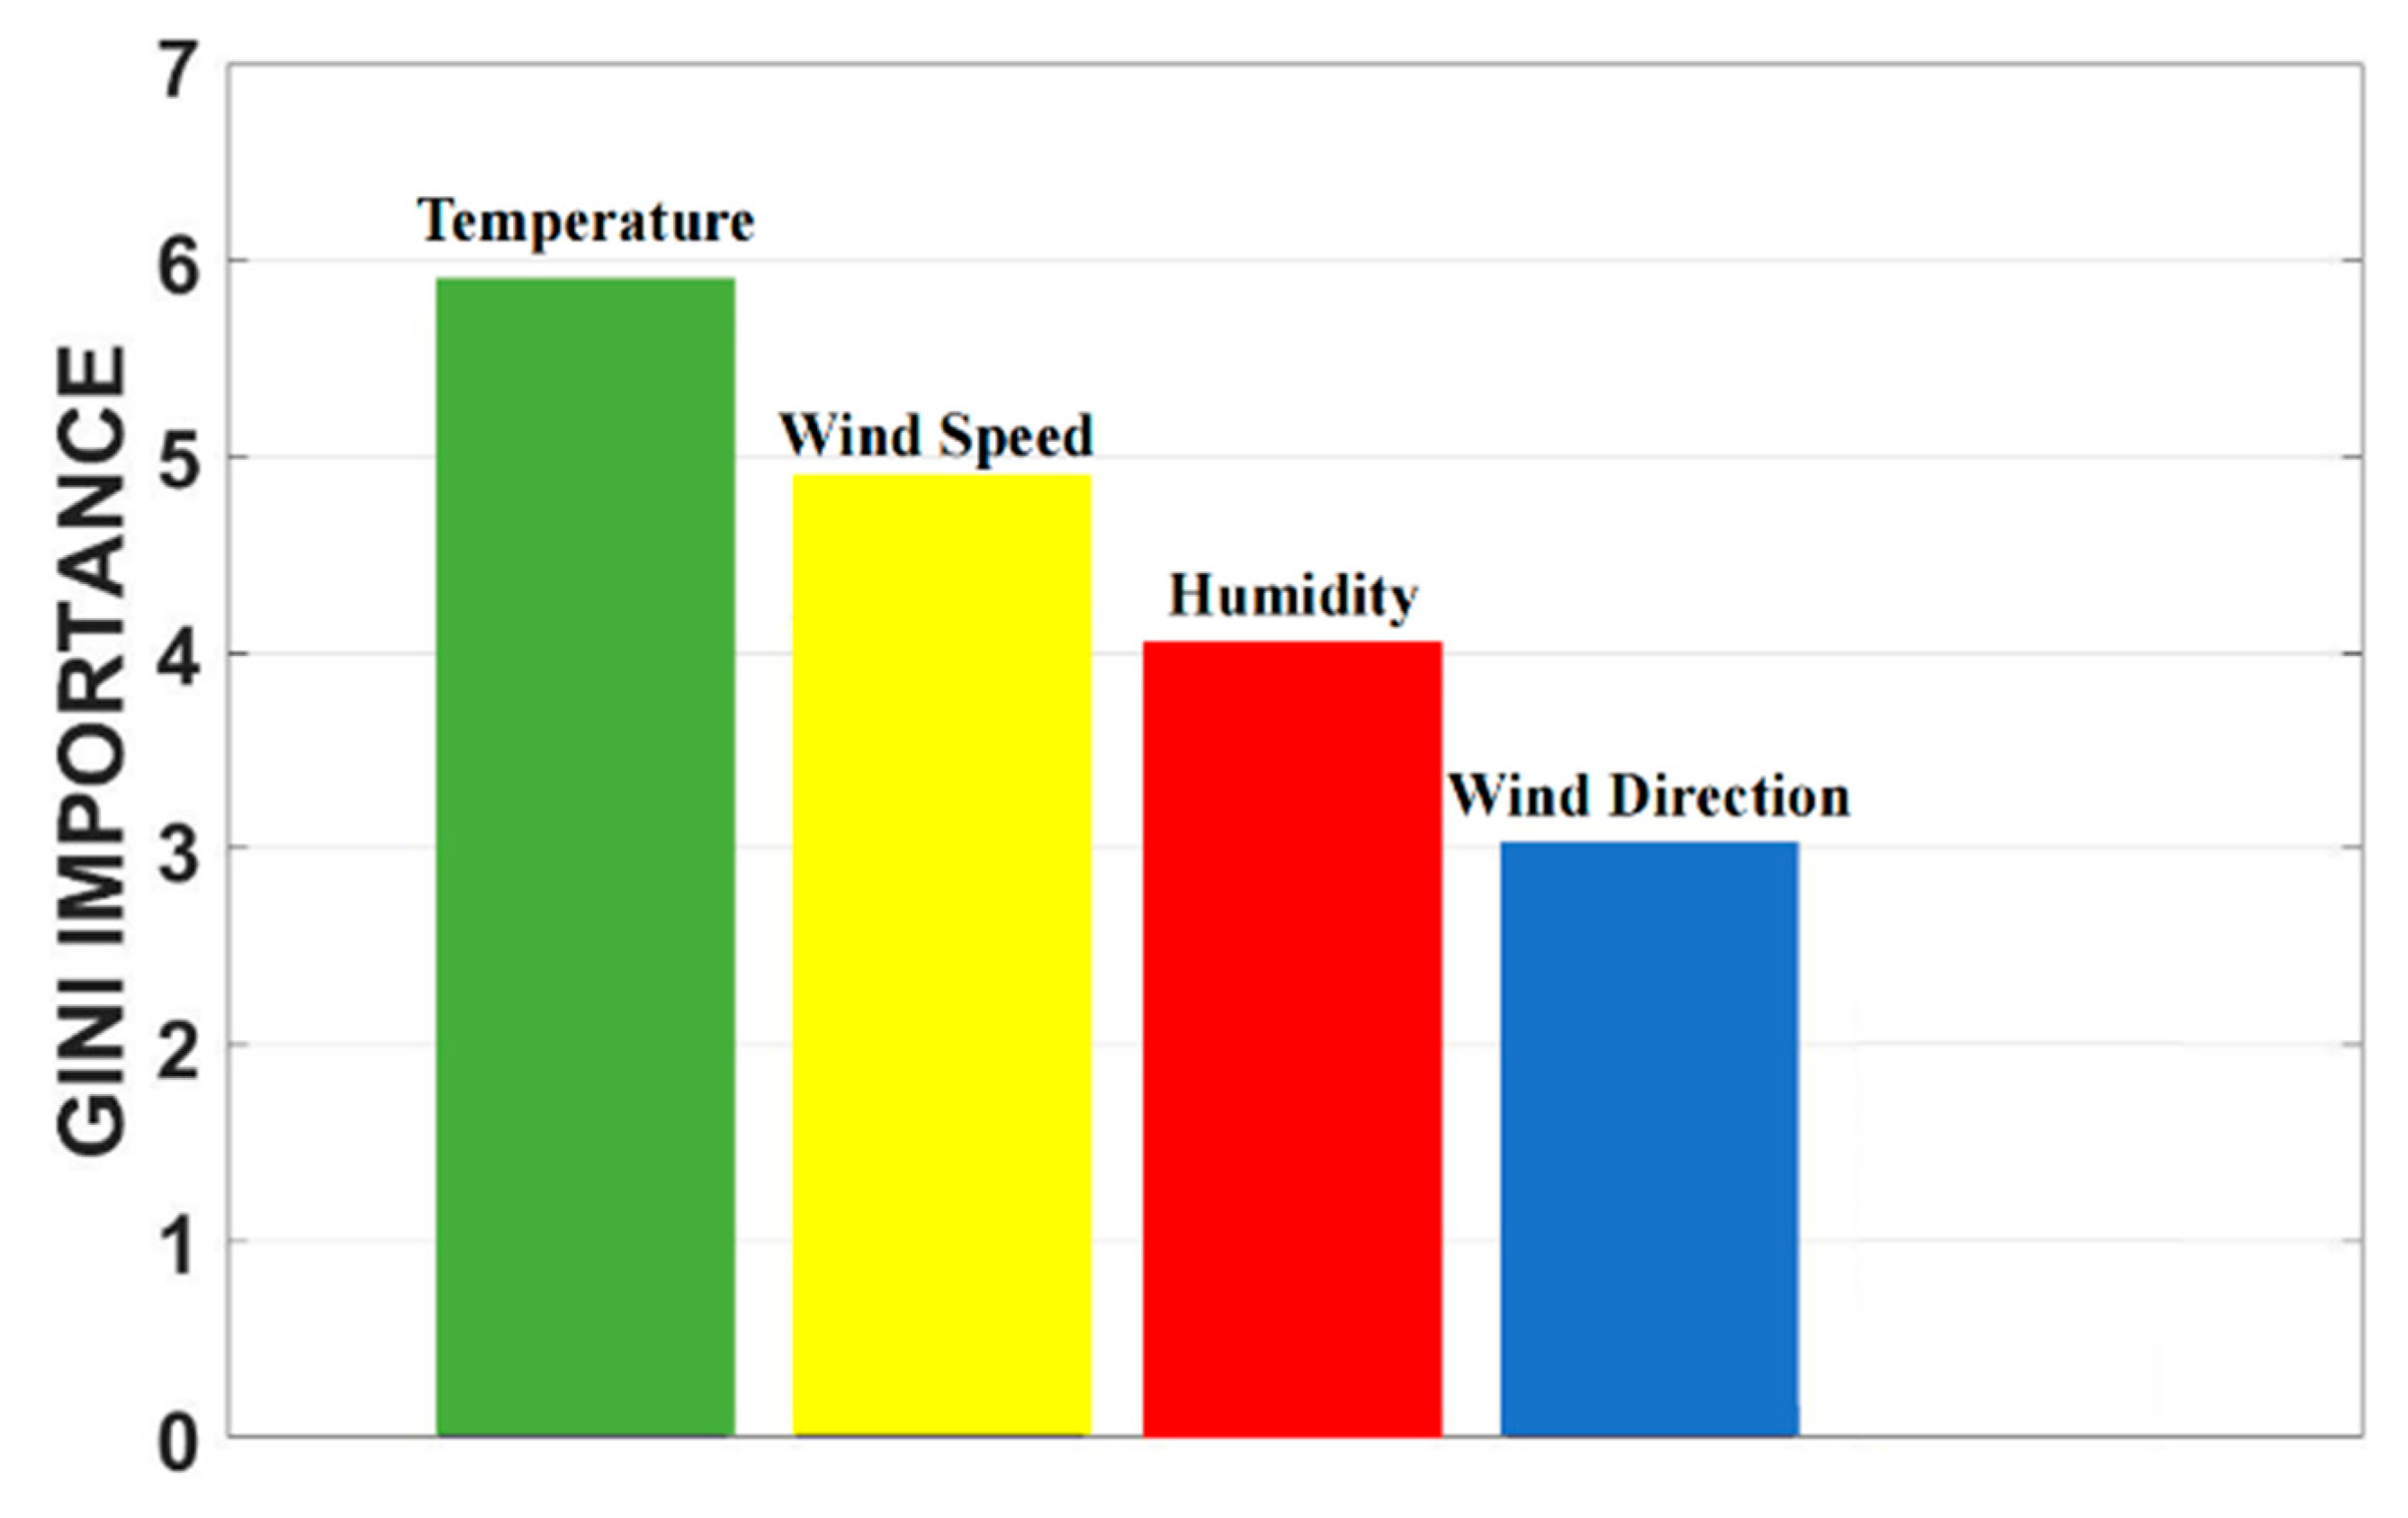
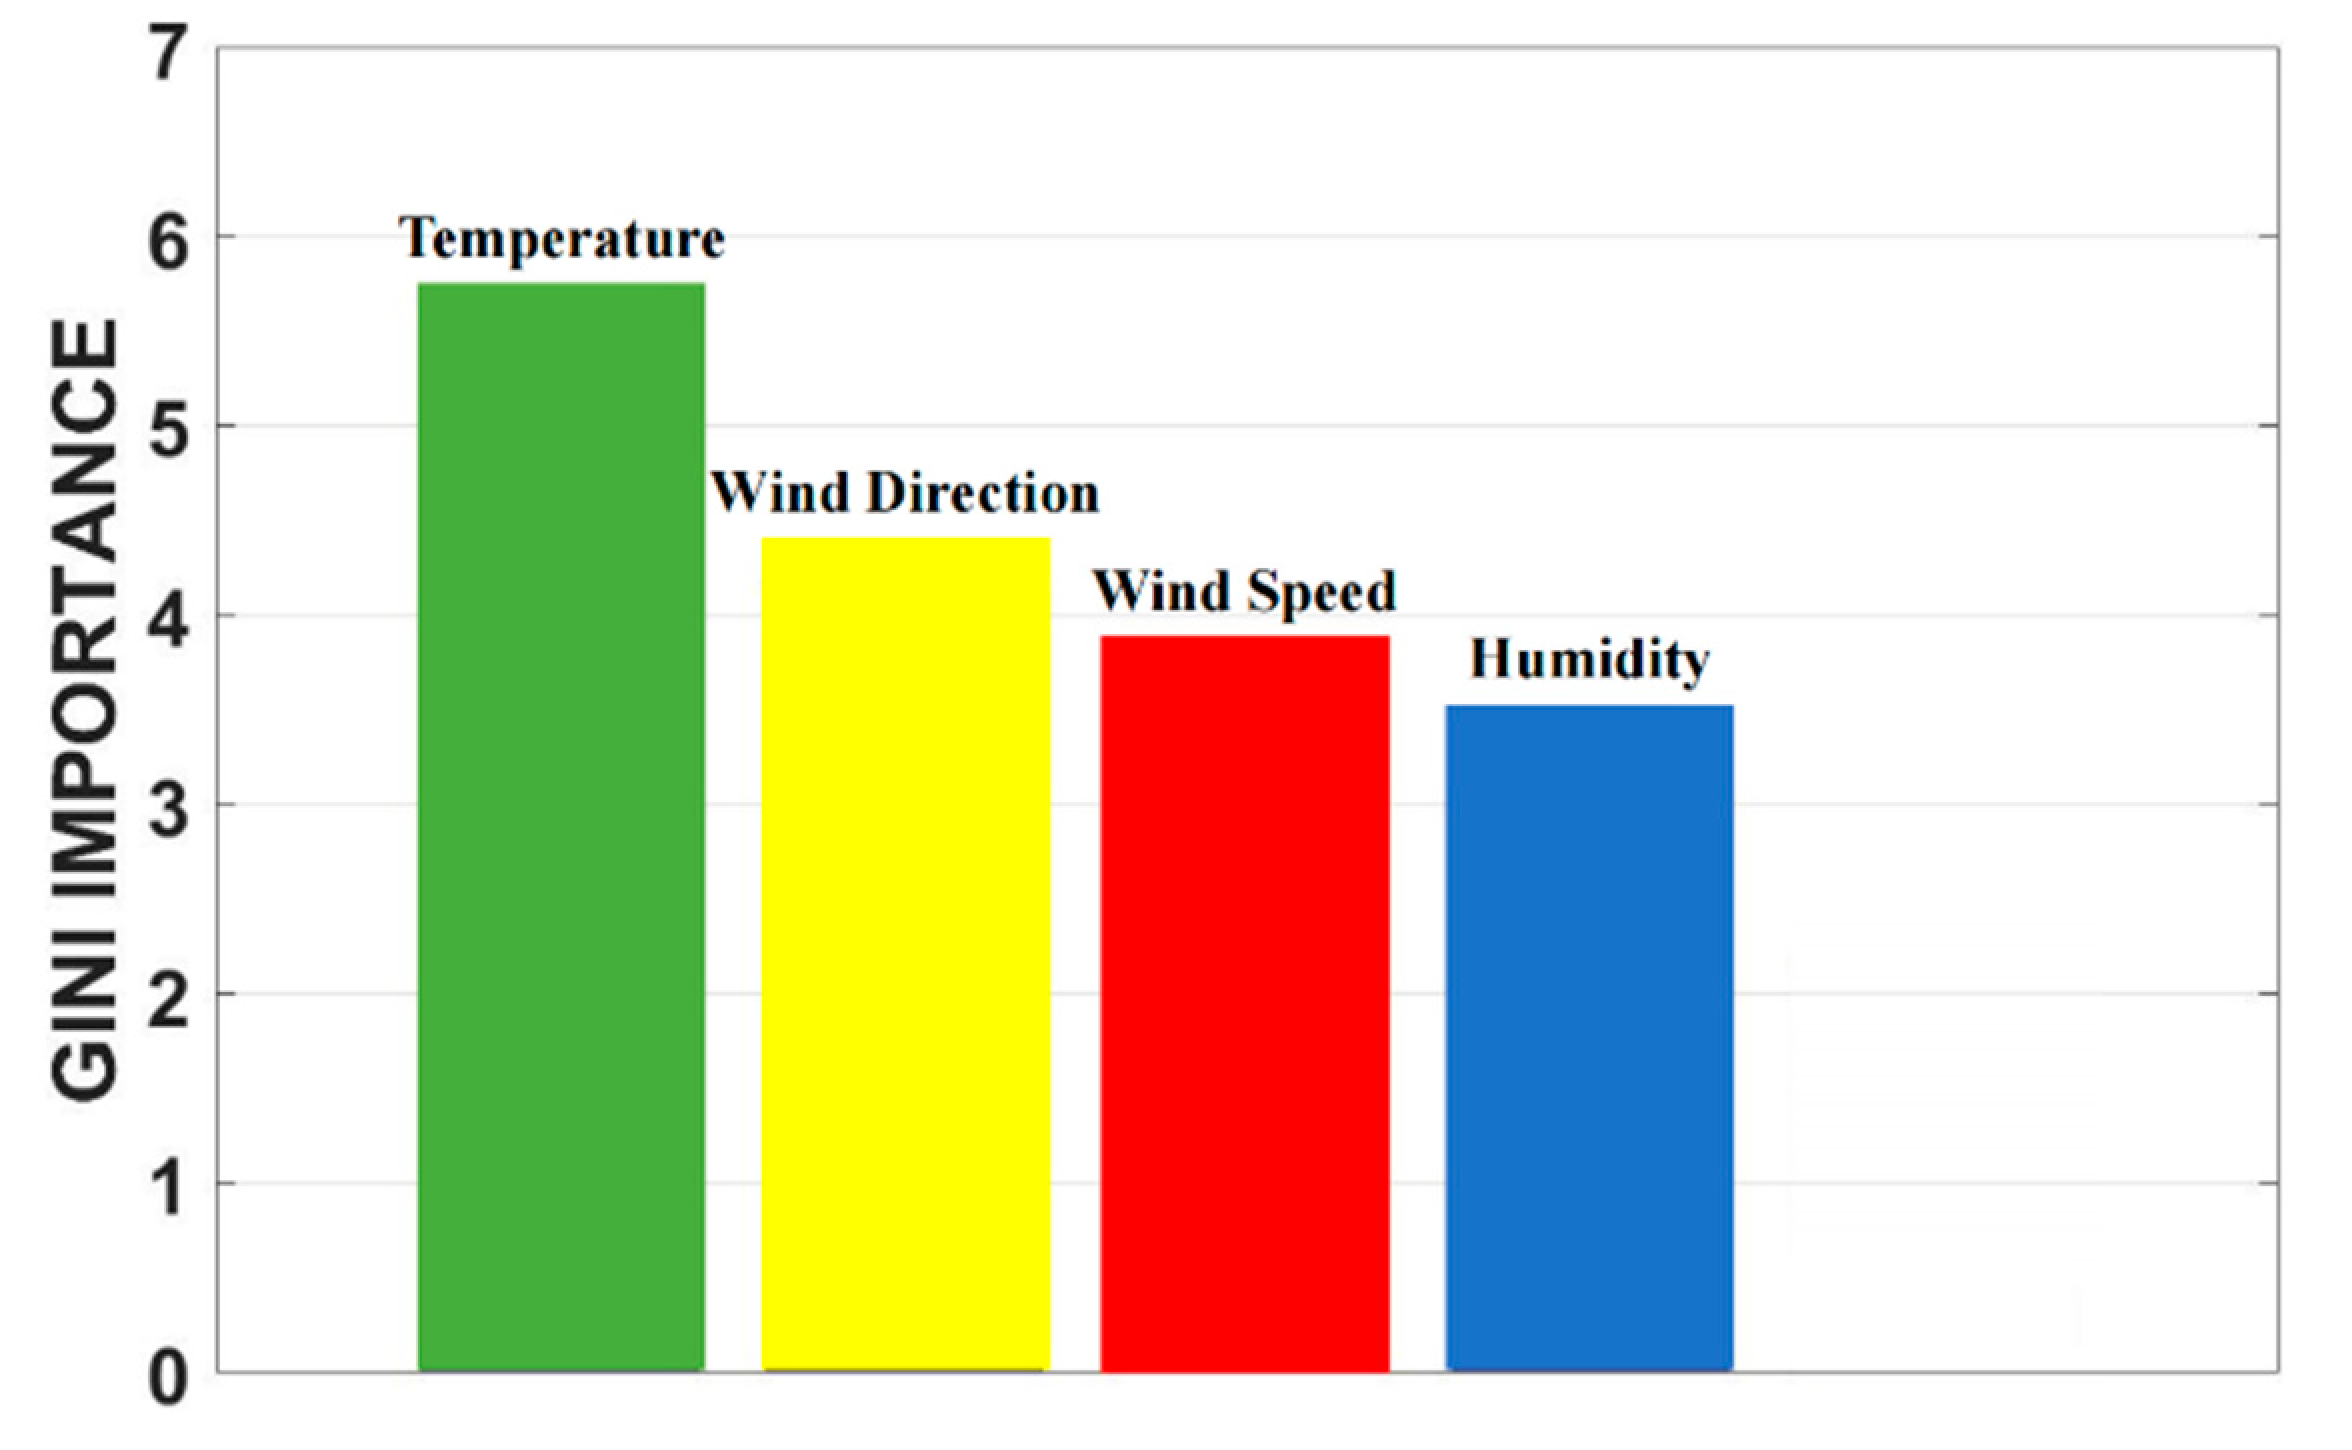
One benefit of the decision tree and random forest models is their adaptability to both numerical and non-numerical features. The dimension inconsistency is not problematic for the random forest classifier. Feature extraction techniques such as LDA are not applicable for random forests since their projected feature space does not have a clear physical meaning. The other advantage of random forests is their feature importance evaluation capability using the Gini index [26]. This property is helpful for feature selection in the case of ambiguous features in a specific classification or regression problem. The ensemble classification structure of the random forest model makes it possess intrinsic sampling and feature robustness in many complicated classification problems.

3. Results

3.1. Experiment Setup and Data Collection

The radar data comes from an avian radar system developed by the China Academy of Civil Aviation Science and Technology (CAST), as illustrated in Figure 9. The system is composed of a climate-controlled cabin housing the computer systems, data processors, wireless data transmitters, and two towers mounting the dual-scanning array antennas with vertical and horizontal scanning modes. The radar works in the S band. The horizontal scanning antenna is mounted on a tower with adjustable heights. Solid-state amplifiers are adopted with a peak power of 0.4 KW. The rotational speed is 25 revolutions per minute. Bird detection and tracking algorithms are developed to provide real-time visualization functions [27].
The observation data were collected in August, September, and October from 2016 to 2019. The diurnal bird dataset is constructed within [05:00, 09:00], and the nocturnal bird dataset is extracted from [22:00, 02:00]. The radar is deployed at FuCheng airport, BeiHai City, and GuanXi Province in China. Figure 10 demonstrates a geographical description of the airport. The triangle marks the radar deployment position. Regions I and II are considered diurnal activity study areas. Historical observation records indicate frequent resident bird activities in this area. In contrast, regions III and IV are considered bird nocturnal activity study areas. A large amount of nocturnal activity is recorded in these two regions, according to historical records. The principal bird movement direction is marked by the arrow according to the statistical estimation of bird tracks within this area.
The conditional parameter σ is applied for data filtering under normal weather conditions. Normal days are selected by excluding days with strong gusts, precipitation, fog, and radar hardware problems, and corresponding weather records construct a parameter dataset. Each weather parameter is denoted by a sub-dataset. For a weather parameter such as temperature, its lower and upper bounds are 20% and 80% percentile values extracted from the corresponding sub-dataset. In this paper, the temperature (unit: degree), air pressure (unit: hPa), humidity (unit: %), and wind speed (unit: m/s) are adopted to compose the conditional parameter σ. Their numerical ranges are [15, 28], [980, 1030], [67, 81], and [3.2, 9.1], respectively. Due to differences in weather conditions between diurnal and nocturnal times, conditional parameters σ are constructed for the diurnal and nocturnal datasets, respectively.
Training datasets for diurnal and nocturnal birds are constructed, respectively. Data from 2016 to 2018 are adopted for training datasets. The data in 2019 are used to build testing datasets. The bird activity grade and weather information at each hour construct a complete sample. The quantities of training samples for diurnal and nocturnal birds are 544 and 628, and the quantities of testing samples are 108 and 136.

3.2. Diurnal Bird Activity Prediction

LDA is applied to training datasets to build the projection matrix. Relative work in radar target recognition [28,29,30] proves the effectiveness of LDA. The intuitive verification of high-dimensional separability optimization is challenging; this paper adopts Principal Component Analysis (PCA) [31,32] to illustrate sample distribution differences in a two-dimensional plane. The PCA principle is to reduce the feature dimension by removing features with little significance while maintaining principal feature separability. The first two principal component distributions are demonstrated before and after LDA projection in Figure 11 using a diurnal bird dataset. Four activity grades are marked with different symbols. A prominent separability enhancement is observed after the LDA projection, which is beneficial for the classification accuracy elevation. The LDA projection matrix is applied to all feature vectors before SVM training. In the classification procedure, the projection matrix is first applied to the test feature vector, and then the SVM classifier determines its activity grade.
The five-fold cross validation is used for classifier performance evaluation. The rate of classification is presented in a confusion matrix, as illustrated in Table 3. Diagonal elements represent the correct classification rate, while off-diagonal elements indicate the misclassification rate. The contents of Table 3 indicate an acceptable performance. The lower rate of correct classification might be due to the numerical inconsistency of wind direction, which challenges both LDA and SVM operations.
The confusion matrix for random forest is presented in Table 4, with a better overall performance compared with SVM. Theoretically, SVM possesses better classification performance than the random forest model due to its consolidated mathematical foundation. The numerical inconsistency in the wind direction dimension generates gaps within the feature space and elevates the complexity of SVM. This inconsistency is not problematic for random forests. Its higher adjustability and flexibility better suit the problem in this paper, which results in a better classification performance expectation. The rate of correct classification (Rc) is calculated from testing datasets. The Rc for SVM and random forest are 77% and 86%, which are consistent with self-validation results.
Figure 12 demonstrates the descriptor importance ranking using the Gini index. The temperature dominance could be observed in diurnal bird activities. The wind speed has higher significance than the wind directions. This is reasonable for diurnal birds, as most of them have a short flight period and are more sensitive to wind intensity than direction. The humidity is ranked as the third-most important factor. The wind direction has the least significance due to the minor sensitivity of diurnal bird activities to wind directions. This indicates that the importance of ranking functionality of the random forest model makes it more suitable for feature selection in the modeling stage.

3.3. Nocturnal Bird Activity Predictions

Self-validation procedures are also applied to nocturnal bird datasets. Confusion matrices for SVM and random forest are presented in Table 5 and Table 6. Compared with diurnal birds, nocturnal bird activities usually present lower complexity. This reduces hyperplane construction difficulty and should provide higher accuracy. However, the contents of Table 5 and Table 6 are inconsistent with this expectation. The correct classification rates are 74% and 81%, which are lower than diurnal bird prediction cases. One reasonable explanation is the deviation in weather information between ground measurement and higher-altitude airspace. This issue was addressed in the previous single weather parameter relevance case. The impact of this deviation is magnified in multivariable analysis. Weather information from ground equipment provides a better approximation of diurnal bird analysis within low-altitude airspaces, but for nocturnal birds, the approximation accuracy is doubtful due to their higher altitude distribution. This problem currently cannot be solved.
The parameter importance ranking for nocturnal birds is illustrated in Figure 13. Temperature is still the dominant influencing factor. Compared with diurnal birds, the distinctive difference is the higher importance of wind direction. This is consistent with conventional understandings, as diurnal birds need proper wind direction for energy preservation. One reasonable explanation for the lowest ranking of humidity might be the large information deviation caused by measurement limitations.

3.4. More Discussions on Prediction Model

Existing results partially verify the reasonability of the proposed method. In addition to weather information deviations, two other issues also influence bird activity predictions.
The first one is data sufficiency to support learning machines. Existing works integrate datasets from August, September, and October for training and classification. This strategy is controversial, as bird activity depends on weather differently among months. A more reasonable strategy is to build prediction models for each month, but it requires sufficient data support, which is currently not implementable. This thought is verified by building two new diurnal bird datasets. One collects data from 1 August to 15 September and the other extracts data from 16 September to 31 October. New datasets are trained using the random forest model. Confusion matrices with five-fold cross-validation are presented in Table 7. Compared with Table 6, classifier quality is enhanced with a higher rate of correct classification. This indicates the monthly dataset construction is more suitable for activity prediction, and higher accuracy is expected with increased data sufficiency.
The other issue is the inclusion of severe weather in bird activity predictions. Existing results are based on the exclusion of severe weather data due to its distinctive weather dependence compared with normal weather. This exclusion guarantees activity pattern consistency and reduces prediction model complexity, but also limits the model’s comprehensiveness. As a complement, an ensembled classification system with a tree structure is proposed in Figure 14. Bird activities under normal and severe weather conditions are predicted independently. This tree-structure-based model is a preliminary thought, and more work is required.

4. Discussion

Avian radar systems provide effective bird target detection and tracking with real-time collision risk evaluation and warnings. This short-term functionality is still controversial and incomprehensible for practical application. The extension to long-term functionality through historical radar dataset mining is more promising as a complement. Due to the close relevance between bird activity and weather, it is possible to predict bird activity with weather information and proper modeling techniques. This paper introduces a characterization and modeling method for bird activity quantification. Activity dependency on a single weather parameter is studied independently to support the reasonability of bird activity prediction using weather information. Multivariable feature vectors composed of four weather parameters are applied to two sets of machine learning models. Datasets from an avian radar system deployed in the airport are adopted for the validation experiment. Results indicate both machine learning models could predict activity grades with acceptable accuracy for diurnal and nocturnal birds. The random forest model outperforms the SVM for its better robustness against feature inconsistency from wind direction. However, the weather information deviation between bird flying airspace and ground measurement leads to an inevitable accuracy loss, especially for nocturnal birds. The importance of data sufficiency in prediction models is also discussed. An elementary tree-structured classification model is constructed to cover both normal and severe weather conditions for comprehensiveness. Existing experiments verify the feasibility and reasonability of the proposed activity modeling and forecasting methods. Optimization works on weather information accuracy and data sufficiency could further elevate the performance and application significance. Existing works are confined within a specific hour span to guarantee data sufficiency. Predictions at finer temporal scales would be another branch of future work.

Author Contributions

Conceptualization, J.L. and W.C.; methodology, Q.X.; software, M.S.; validation, Q.X., J.L.; formal analysis, J.L.; investigation, J.L. and W.C.; resources, W.C.; data curation, W.C.; writing—original draft preparation, Q.X.; writing—review and editing, J.L.; visualization, Q.X.; supervision, W.C.; project administration, J.L.; funding acquisition, M.S. and W.C. All authors have read and agreed to the published version of the manuscript.

Funding

This research was funded by Beihang Zhuobai Program under Grants KG21000501, Civil Aviation safety capability building project from Civil Aviation Administration of China under grant x232146903443, the Guangxi Natural Science Foundation under Grant 2020GXNSFBA297119, the Guangxi Science and Technology Plan Project under Grant GuiKe-AD20238025, the National Natural Science Foundation of China (NSFC) and the Civil Aviation Administration of China (CAAC) (U2133216). The APC was funded by Beihang Zhuobai Program under Grants KG21000501.

Informed Consent Statement

Not applicable.

Data Availability Statement

3rd Party Data Restrictions apply to the availability of these data. Data was obtained from China Academy of Civil Aviation Science and Technology (CAST) and are available from Wei Shi Chen] with the permission of CAST.

Acknowledgments

This paper is supported by the Beihang Zhuobai Program under Grants KG21000501, the Guangxi Natural Science Foundation under Grant 2020GXNSFBA297119, Civil Aviation safety capability building project from Civil Aviation Administration of China under grant x232146903443, the Guangxi Science and Technology Plan Project under Grant GuiKe-AD20238025, the National Natural Science Foundation of China (NSFC) and the Civil Aviation Administration of China (CAAC) (U2133216).

Conflicts of Interest

The authors declare no conflict of interest.

References

  1. Chilson, P.B.; Bridge, E.; Frick, W.F.; Chapman, J.W.; Kelly, J.F. Radar aeroecology: Exploring the movements of aerial fauna through radio-wave remote sensing. Biol. Lett. 2012, 8, 698–701. [Google Scholar] [CrossRef] [PubMed]
  2. Sheridan, E.; Randolet, J.; DeVault, T.L.; Seamans, T.W.; Blackwell, B.F.; Fernández-Juricic, E. The effects of radar on avian behavior: Implications for wildlife management at airports. Appl. Anim. Behav. Sci. 2015, 171, 241–252. [Google Scholar] [CrossRef]
  3. Flock, W.L. Radar Echoes from Birds and their Effects on Radar Performance. In Atmospheric Effects on Radar Target Identification and Imaging; NATO Advanced Study Institutes Series; Springer: Dordrecht, The Netherlands, 1976; Volume 27. [Google Scholar]
  4. Moon, J.R. Effects of birds on radar tracking systems. In Proceedings of the 2002 International Radar Conference, Edinburgh, UK, 15–17 October 2002; pp. 300–304. [Google Scholar]
  5. Cullinan, V.I.; Matzner, S.; Duberstein, C.A. Classification of birds and bats using flight tracks. Ecol. Inform. 2015, 27, 55–63. [Google Scholar] [CrossRef]
  6. Chen, W.S.; Liu, J.; Li, J. Classification of UAV and bird target in low-altitude airspace with surveillance radar data. Aeronaut. J. 2019, 123, 191–211. [Google Scholar] [CrossRef]
  7. Gerringer, M.B.; Lima, S.L.; DeVault, T.L. Evaluation of an avian radar system in a midwestern landscape. Wildl. Soc. Bull. 2016, 40, 150–159. [Google Scholar] [CrossRef]
  8. Dokter, A.M.; Baptist, M.J.; Ens, B.J.; Krijgsveld, K.L.; van Loon, E.E. Bird Radar Validation in the Field by Time-Referencing Line-Transect Surveys. PLoS ONE 2013, 8, e74129. [Google Scholar] [CrossRef]
  9. Nilsson, C.; Dokter, A.M.; Schmid, B.; Scacco, M.; Verlinden, L.; Backman, J.; Haase, G.; Dell’Omo, G.; Chapman, J.W.; Lejinse, H.; et al. Field validation of radar systems for monitoring bird migration. J. Appl. Ecol. 2018, 55, 2552–2564. [Google Scholar] [CrossRef]
  10. Schmaljohann, H.; Liechti, F.; Bachler, E.; Steuri, T.; Bruderer, B. Quantification of bird migration by radar—A detection probability problem. Ibis 2008, 150, 342–355. [Google Scholar] [CrossRef]
  11. Coates, P.S.; Casazza, M.L.; Halstead, B.J.; Fleskes, J.P.; Laughlin, J.A. Using avian radar to examine relationships among avian activity, bird strikes, and meteorological factors. Hum.–Wildl. Interact. 2011, 5, 249–268. [Google Scholar]
  12. Abraham, M. Bird forecasting by radar. Nature 2018, 561, 314. [Google Scholar] [CrossRef]
  13. Fauvel, M.; Chanussot, J.; Benediktsson, J.A. Decision Fusion for the Classification of Urban Remote Sensing Images. IEEE Trans. Geosci. Remote Sens. 2006, 44, 2828–2838. [Google Scholar] [CrossRef]
  14. Bezdek, P. Measuring fuzzy uncertainty. IEEE Trans. Fuzzy Syst. 1994, 2, 107–118. [Google Scholar]
  15. Dai, W. Quadratic entropy of uncertain variables. Soft Comput. 2018, 22, 5699–5706. [Google Scholar] [CrossRef]
  16. Liu, J.; Fang, N.; Xie, Y.J.; Wang, B.F. Multi-scale feature-based fuzzy-support vector machine classification using radar range profiles. IET Radar Sonar Navig. 2016, 10, 370–378. [Google Scholar] [CrossRef]
  17. Liu, J.; Fang, N.; Xie, Y.J.; Wang, B.F. Radar target classification using support vector machine and subspace methods. IET Radar Sonar Navig. 2015, 9, 632–640. [Google Scholar] [CrossRef]
  18. Tan, X.; Yu, F.; Zhao, X. Support vector machine algorithm for artificial intelligence optimization. Clust. Comput. 2019, 22 (Suppl. 6), 15015–15021. [Google Scholar] [CrossRef]
  19. Tang, J.; Tian, Y.; Zhang, P.; Liu, X. Multiview Privileged Support Vector Machines. IEEE Trans. Neural Netw. Learn. Syst. 2018, 29, 3463–3477. [Google Scholar]
  20. Fu, J.S.; Liao, K.; Yang, W. Radar HRRP target recognition using multi-KFD-based LDA algorithm. Prog. Electromagn. Res. 2012, 30, 15–26. [Google Scholar] [CrossRef]
  21. He, L.; Chen, X.; Xu, C.; Liu, J.; Johnson, M.T. Local Pairwise Linear Discriminant Analysis for Speaker Verification. IEEE Signal Process. Lett. 2018, 25, 1575–1579. [Google Scholar] [CrossRef]
  22. Cıhan, M.; Ceylan, M. Comparison of Linear Discriminant Analysis, Support Vector Machines and Naive Bayes Methods in the Classification of Neonatal Hyperspectral Signatures. In Proceedings of the 2021 29th Signal Processing and Communications Applications Conference, Istanbul, Turkey, 9–11 June 2021; pp. 1–4. [Google Scholar]
  23. Liu, J.; Su, M.; Xu, Q.; Fang, N.; Wang, B.F. Multi-scale feature vector reconstruction for aircraft classification using high range resolution radar signatures. J. Electromagn. Waves Appl. 2021, 35, 1843–1862. [Google Scholar] [CrossRef]
  24. Sagayaraj, M.J.; Jithesh, V.; Roshani, D. Comparative Study Between Deep Learning Techniques and Random Forest Approach for HRRP Based Radar Target Classification. In Proceedings of the 2021 International Conference on Artificial Intelligence and Smart Systems (ICAIS), Coimbatore, India, 25–27 March 2021; pp. 385–388. [Google Scholar]
  25. Genuer, R.; Poggi, J.-M.; Tuleau-Malot, C. Variable selection using Random Forests. Pattern Recognit. Lett. 2010, 31, 2225–2236. [Google Scholar] [CrossRef]
  26. Menze, B.H.; Kelm, B.M.; Masuch, R.; Himmelreich, U.; Bachert, P.; Petrich, W.; Hamprecht, F.A. A comparison of random forest and its Gini importance with standard chemometric methods for the feature selection and classification of spectral data. BMC Bioinform. 2009, 10, 213. [Google Scholar] [CrossRef]
  27. Chen, W.S. Interactive processing of radar target detection and tracking. Aircr. Eng. Aerosp. Technol. 2018, 90, 1337–1345. [Google Scholar] [CrossRef]
  28. Pan, M.; Jiang, J.; Kong, Q.; Shi, J.; Sheng, Q.; Zhou, T. Radar HRRP target recognition based on t-SNE segmentation and discriminant deep belief network. IEEE Geosci. Remote Sens. Lett. 2017, 14, 1609–1613. [Google Scholar] [CrossRef]
  29. Liu, J.; Fang, N.; Xie, Y.J.; Wang, B.F. Scale-space theory based multi-scale features for aircraft classification using HRRP. Electron Lett. 2016, 52, 475–477. [Google Scholar] [CrossRef]
  30. Lee, K.-C.; Ou, J.-S. Radar Target Recognition by Using Linear Discriminant Algorithm on Angular-Diversity RCS. J. Electromagn. Waves Appl. 2007, 21, 2033–2048. [Google Scholar] [CrossRef]
  31. Prasad, S.; Bruce, L.M. Limitations of Principal Components Analysis for Hyperspectral Target Recognition. IEEE Geosci. Remote Sens. Lett. 2008, 5, 625–629. [Google Scholar] [CrossRef]
  32. Jolliffe, I.T.; Cadima, J. Principal component analysis: A review and recent developments. Philos. Trans. R. Soc. A 2016, 374, 20150202. [Google Scholar] [CrossRef]
Figure 1. Weight factor distribution pattern with quadratic entropy values.
Aerospace 10 00462 g001
Figure 2. Framework of the bird activity degree extraction method.
Aerospace 10 00462 g002
Figure 3. Boxplot for activity relevance with temperature: (a) diurnal birds and (b) nocturnal birds.
Aerospace 10 00462 g003aAerospace 10 00462 g003b
Figure 4. Boxplot for activity relevance with humidity: (a) diurnal birds and (b) nocturnal birds.
Aerospace 10 00462 g004aAerospace 10 00462 g004b
Figure 5. Boxplot for activity relevance with wind speed: (a) diurnal birds and (b) nocturnal birds.
Aerospace 10 00462 g005aAerospace 10 00462 g005b
Figure 6. Boxplot for activity relevance with wind directions: (a) diurnal birds and (b) nocturnal birds.
Aerospace 10 00462 g006aAerospace 10 00462 g006b
Figure 7. Graphical presentation of the support vector machine principle.
Aerospace 10 00462 g007
Figure 8. Graphical description of the random forest principle.
Aerospace 10 00462 g008
Figure 9. Avian radar systems developed by CAST.
Aerospace 10 00462 g009
Figure 10. Airport layout and bird distribution pattern at FuCheng airport.
Aerospace 10 00462 g010
Figure 11. LDA impact on principal component distribution pattern (a) before LDA projection and (b) after LDA projection.
Aerospace 10 00462 g011
Figure 12. Weather parameter importance ranking-diurnal birds.
Aerospace 10 00462 g012
Figure 13. Weather parameter importance for ranking nocturnal birds.
Aerospace 10 00462 g013
Figure 14. Diagram of a more comprehensive bird activity prediction system.
Aerospace 10 00462 g014
Table 1. Mapping relationship between normalized activity intensity and grades.
GradeActivity Intensity
120–28
229–36
337–44
445–52
553–60
661–68
769–76
877–84
985–92
1093–100
Table 2. Mapping relationship between the activity degree and grade.
Activity GradeABCD
Activity Degree20–3940–6970–8990+
Table 3. Confusion matrix of SVM self-validation for the diurnal bird dataset.
ABCD
A749710
B775108
C94816
D511876
Table 4. Confusion matrix of random forest self-validation for the diurnal bird dataset.
ABCD
A86437
B48952
C45847
D33490
Table 5. Confusion matrix of SVM self-validation for nocturnal birds.
ABCD
A751186
B107398
C68797
D69976
Table 6. Confusion matrix of random forest self-validation for nocturnal birds.
ABCD
A83665
B98263
C26857
D25588
Table 7. Confusion matrices of new datasets: (a) Group 1 and (b) Group 2.
(a)
ABCD
A90523
B49240
C34885
D05491
(b)
ABCD
A89452
B59041
C26893
D12493
Disclaimer/Publisher’s Note: The statements, opinions and data contained in all publications are solely those of the individual author(s) and contributor(s) and not of MDPI and/or the editor(s). MDPI and/or the editor(s) disclaim responsibility for any injury to people or property resulting from any ideas, methods, instructions or products referred to in the content.

