1. Introduction
During the latest years of air transport aircraft development, the Achilles’ heel of many aircraft manufacturers was the changing nature of the market demand. Two examples of this phenomenon that stand out are the Aérospatiale-BAC (British Aircraft Corporation) Concorde and the Airbus A380. The Concorde was designed as a response to the ever-increasing need for speed in air travel in the late 1960s. One of the main reasons for its retirement in 2003, however, was the fact that first-class passengers preferred the comfort of a subsonic aircraft cabin over the possibility of shaving a few hours off their travel time [
1]. The market research for the A380 development dates to the early 1990s when air travel was booming, and the market showed an unanswered demand for a high-capacity subsonic aircraft [
2]. However, during its development and production, the demand shifted towards relatively smaller aircraft, which can achieve a higher load factor on a point-to-point, rather than a hub-and-spoke, system. This fact sealed the fate of the A380, and its potential successors, with the end of production in 2021 [
3].
In comparison with the challenges stated above, today’s development of air transport aircraft has one big advantage—the undoubted need for a carbon-neutral airliner. Climate change is slowly moving from being only a threat into a full-blown emergency, taking human lives daily and showing a clear link with possible widespread famine, the worldwide migration crisis, biodiversity collapse, and much more in the future [
4]. According to carbon emissions data provided by Emission Database for Global Atmospheric Research (EDGAR), international aviation will account for approximately 1% of total global emissions in 2020. The IEA states that between 2013 and 2019, prior to the COVID-19 epidemic, global carbon emissions from air transport already exceeded 70% of the ICAO’s projected values. By 2050, aviation will be responsible for 25% of global carbon emissions if current trends continue [
5]. One can easily conclude that the demand for carbon-neutral air travel will only grow. The research and development of carbon emissions in aviation for the period from 1992 to 2021 is outlined in the article A Bibliometric Analysis and Visualization of Aviation Carbon Emissions Studies [
5]. The use of sustainable aviation fuels (SAFs) can also play a key role in achieving future emission targets; bio and synthetic fuels are currently the most viable option, but hydrogen is also being considered as a long-term solution [
6]. It is hydrogen that proves to be a suitable fuel for industries that pollute the environment, such as aviation. It is abundant, clean, and produces no carbon emissions, only water after use, which has the potential to cool the environment. However, other issues such as storage, costs, and the entire production chain require significant efforts to implement hydrogen [
7].
Propulsion systems powered by proton exchange membrane fuel cells (PEMFCs) emit only water vapor and would reduce the climate impact of aviation. Research into the feasibility of hydrogen-powered PEMFC propulsion systems for applications in various aircraft categories was carried out by Schmelcher and Häßy [
8]. The authors Trainelli et al. [
9] focused on the sizing methodology of the hybrid electric drive of the aircraft based on fuel cells. The method is based on an accurate physical model of the fuel cell module, integrated within a procedure that, given aircraft and mission parameters, estimates the corresponding sizing and performance.
The possibility of using liquid hydrogen and fuel cells was also addressed by Nicolay et al. [
10]. The research focused on finding an efficient configuration of the aircraft and suitable components related to propulsion, such as a hydrogen tank, fuel cells, and electric motors.
A clear goal was set during the 2021 United Nations Climate Change Conference (COP26): securing global net-zero emissions by midcentury while keeping 1.5 °C of temperature rise within reach. Hydrogen (H
2) propulsion technology provides one of the most promising opportunities to meet this target and decarbonize global aviation. Challenges and recommendations for future research for hydrogen-powered aircraft and fuel cells are provided by research by Gao et al. [
11].
In order to design fuel cell systems for passenger aircraft, it is necessary to specify the requirements that the system has to fulfill. A statistical approach to the analysis of such requirements was elaborated in their research by Kadyk et al. [
12]. By using Monte Carlo-based sampling of flight mission profiles, the range of necessary component sizes, as well as optimal degrees of hybridization with a battery, is explored, and design options are evaluated.
Electric and hybrid aircraft drives may initially find use in light-sport aircraft and regional aircraft. The feasibility of an electrified drive for light-sport aircraft is confirmed by the authors McQueen et al. [
13]. The simulations performed in this research theoretically confirm that hybrid-electric aircraft could achieve 44% of the range of conventionally powered aircraft. Therefore, it is still necessary to improve the power-to-weight ratio of the existing battery technology before electrified propulsion becomes a contender in the light-sport aircraft segment.
The authors Palaia and Salem [
14] deal with the possible application of hybrid-electric drives in regional aircraft, whose research results show that the hybrid-electric drive integrated into regional aircraft provides direct fuel savings, which have a positive impact on environmental protection.
Over recent years, many prototypes of hybrid aircraft have been proposed. In 2017, Frosina et al. [
15] developed a simple model to evaluate the performance of a light aircraft equipped with a hybrid-electric propulsion system. Marinaro et al. [
16], in their article, present a numerical study of a light electric aircraft whose architecture based on batteries is converted to an architecture based on fuel cells with the contribution of a battery pack that essentially intervenes in the take-off phase and, in addition, of a pack of ultracapacitors to prevent a high discharge rate of the battery. The final intent is to explore the range extension without an increase in maximum take-off weight.
The authors Staack et al. [
17] deal with the analysis of system components and possible construction concepts of a fully electric aircraft. These limitations are illustrated with a conceptual study of a full-electric FAR/CS-23 commuter aircraft and realistic estimations of its performance.
This article focuses on better understanding the relationships between different dimensions and parameters of modern commercial aircraft. It uses a large database of nearly all commercial aircraft in service today. This database is enriched and corrected to create a unique collection of information that has not yet been accessible. The development of a code that draws links and trends from the database is then described, and the initial results serve to picture a technological barrier of different new propulsion technologies. As we focused on battery and hydrogen technologies, we dedicated the theoretical description to these two, focusing on the key numerical values that may serve as their comparison.
2. Theoretical Description of Aircraft Propulsion Technologies
Of all the technologies proposed to supply and produce a thrust of a future air transport aircraft, two of them show the best potential to be used in the future: battery and hydrogen technology. Batteries are widely used nowadays in road vehicles, and their capacities are growing with leap improvements linked to discoveries of new chemistries every couple of years. This improvement makes the overall long-term curve of their energy capacity show an exponential improvement. Hydrogen, which is mostly used as a fuel cell, is still finding its way into road vehicles and aircraft alike [
18]. However, its recent improvements and experimentations show some advantages of this technology.
2.1. Liquified Hydrogen
The liquified hydrogen technology seems to be the best choice out of all hydrogen storage technologies due to its high natural energy density, 120 MJ/kg, and its potential to reach relatively high gravimetric and volumetric efficiency [
19].
Gravimetric efficiency, also called gravimetric capacity, refers to the ratio of the mass of the propellant alone versus the mass of the entire storage system, including the propellant [
20], and is commonly presented as the percentage of hydrogen by weight. As we concluded from many articles, the current values of gravimetric efficiencies of this technology vary greatly. The state-of-the-art value is in the range of 8–25% [
21], but values up to 30% can be expected by 2035 [
22,
23]. In the work of Marciello et al. [
24], it was assumed that by 2050, hydrogen fuel cells would be advanced enough to completely replace kerosene-based engines.
Volumetric efficiency is typically represented in absolute values of grams per liter, and we will use a numerically equivalent SI unit of kilograms per cubic meter. The volumetric density of liquid hydrogen is 71 kg/m³ (at −252.87 °C and 1.013 bar) [
25]. As for the volumetric density of the entire system, the same as gravimetric efficiency, this measure also shows large variations in different studies. The state-of-the-art value is around 40–50 kg/m³ (56–70%) [
22,
26], and we may anticipate an increase up to 60 kg/m³ (85%) in the upcoming decade, which is the value used in this calculation.
2.2. Gaseous Hydrogen
Nowadays, gaseous hydrogen is widely used in the automotive industry. Its tanks are usually compressed to 700 bar, which gives a gravimetric efficiency of 5.7% for the Toyota Mirai tank [
26]. This value is rounded up to 6% for future calculations and expects an increase to 10% in the upcoming decade. The volumetric density of gaseous hydrogen is 42 kg/m³ (at 25 °C and 700 bar). In the same case of Toyota Mirai, the volumetric energy density is up to 4.9 MJ/dm³, which gives us a very high volumetric density of the entire tank system of 40 kg/m³ (95%). Therefore, this value is used to represent the current practice. As for the values in the upcoming decade, Rivard et al. [
27] set the ultimate value to 6.1 MJ/dm³ (considering tanks with higher pressure), so the rough mean value between the present and the ultimate one is taken, namely 5.5 MJ/dm³. An illustration of a hydrogen tank can be seen in the following
Figure 1, where total fuel is represented by the blue area and the mass of the rest counts as the delta system mass.
2.3. Battery
We know about two types of battery technology that show an improvement strong enough to be considered potential energy vectors of a future commercial electric aircraft:
This type promises substantial improvements when compared to lithium-ion batteries. It was used, for example, in the Airbus Zephyr solar aircraft [
29]. Lithium–sulfur (Li–S) battery is identified as one of the most promising next-generation energy storage systems due to its ultra-high theoretical energy density up to 2600 Wh/kg (which is approx. 9 MJ/kg) [
30]. A disadvantage of this type is that the batteries can experience rapid loss in capacity over multiple cycles due to changes in electrode volume. This phenomenon is currently being tackled by the use of binders within the cathode of the battery cell [
31]. The current applications of lithium–sulfur batteries have relatively low volumetric mass density. However, there is a technology of compressed graphene/carbon nanotubes (G/CNT) aerogels, which allows for a high volumetric mass capacity, namely 1640 kg/m³ [
32].
This type typically uses a sodium/potassium hydroxide or sodium chloride solution as the electrolyte with a metal anode and an ambient air cathode. It is being considered for the Alice electric business aircraft of the Eviation company [
33]. These battery cells’ theoretical maximum energy density is 46 MJ/kg. The proposed technologies for putting this theory into practice are met with many drawbacks, such as the need for flammable organic electrolytes or noble metal nanomaterials to use as electrocatalysts. It is also important to mention the fact that recharging these batteries is still very problematic. Therefore, the solution to this could be a concept of battery packs, which would be quickly and easily removable [
34]. For the purpose of further calculations, a hypothesis of achieving an energy density of these battery cells of 20 MJ/kg is proposed. As for the volumetric mass density, a reference value of 1500 kg/m³ is used, similar to the one achievable today.
2.4. Conventional Kerosene (Jet A-1)
Given the fact that virtually all modern airliners use the concept of a wet wing, the added weight of the tank system is very low. A 10% decrease in energy density is used to account for fuel pumps, ventilation parts, sealant, and other parts needed in such a structure. The values of the volumetric mass density of Jet A-1 were computed on the whole scale of its possible values, varying with temperature.
All the hypotheses above led to a comparison of the resulting values in
Table 1.
In conclusion, can be said that the only technology that has a chance of matching the energy density of kerosene is liquid H2. Regarding volumetric energy density, the only technology matching kerosene values is a battery. Both of those technologies have their specific characteristics, and they should be seen as partners rather than competitors.
3. Presentation of the Stakes, Tools, and Objectives
When planning a new concept of an aircraft, the first task we must do is to define the design space. The design space of conception can be defined through three directions, also known as the 3 main axes:
Technologies: hydrogen, electric, etc.
Service: payload vs. range, altitude, speed, cost, etc.
Aircraft category: VTOL/STOL (vertical/short take-off and landing), Cargo/PAX (passenger), etc.
The question is, therefore: how do we proceed when exploring this 3-dimensional space? Our proposition is to start by defining tools that will enable us to rank the solutions in the design space.
3.1. Evaluation Tools
The first step of a database analysis is to define the evaluation criteria. We start by stating 3 typical evaluation criteria from the service quality point of view of a certain transport service:
Next, we have criteria from the point of view of the physical cost of a transport service. We can divide those according to two domains, with the first being the domain of energies:
DE: direct energy consumption (e.g., the amount of fuel burnt);
PE: primary energy consumed (e.g., if the fuel is Hydrogen that has been produced by electrolysis;
RE: recycling energy (spread over lifetime).
The second is the domain of materials:
MTOW: the maximum weight of the device;
OEW: the empty weight of the device;
MSIJ: the mass of the various materials used to build the device times the “scarcity index” of the materials;
EE: embodied energy (spread over a lifetime).
We can then combine these criteria to evaluate the efficiency of an aircraft. These combined criteria can be, for example:
Energetic transport criteria: PK/MTOW, PK/DE, PK/PE, PK.LT/(PE + EE), PK.LT/(PE + EE + RE), etc.
Mass transport criteria: MK/MTOW, MK/OEW, MK.LT/Σ MSI, etc.
With these evaluations, we can define limits for new aircraft (battery or hydrogen-powered) to find out if the aircraft concept is viable or not. Among all the criteria we determined, we chose to focus on the PK/MTOW.
3.2. Completion of the Database
At the beginning of our research, we worked on an incomplete database of 324 civil aircraft. The given database contained errors and blank spaces for some data. It was also divided into two separate files (commercial aircraft and business plus general aviation), where sometimes one or both of the files entirely lacked the required parameters. Our first task was, therefore, to fill in the missing data and check the existing ones.
To find the data, we used both the literature and the Internet. From the literature, we used the following two encyclopedias:
Jane’s: All the World’s Aircraft—In Service [
35];
Élodie Roux: Avions civils à réaction [
36].
On the Internet, the most complex data we found came from the following websites (both accessed on 13 March 2023):
However, certain data were untraceable in any of these sources. It was mostly the case of more detailed dimensions, such as the HTP (horizontal taiplane), VTP (vertical tailplane) area, or propeller diameter. Therefore, we had to measure these dimensions directly from the aircraft blueprints. The blueprints we used usually came from websites the-blueprints.com or drawingdatabase.com.
To measure the needed dimensions, we used ImageJ software, in which we always set the scale first on a horizontal dimension (for example, fuselage length) and then checked it on a vertical one (for example, wingspan) or vice versa in order to check for the correctness of the blueprint or potential distortion due to non-linear zooming of the image. Finally, to find the area of the HTP, we used a simple method of extending the leading and the trailing edges. In the case of the VTP of smaller GA aircraft, the area was approached by connecting the root of the fin with the lower inboard corner of the rudder, as shown in
Figure 2.
4. Method for the Identification of the Masses
Having established our main criterion and introduced the database, let us now analyze the database on the performance aspects to set up hard and soft limits for our future calculations. First of all, we have to specify that we are interested in “small” aircraft of the CS-23 category—aircraft whose mass is less than 5700 kg.
4.1. PK/MTOW vs. Range
As we can see in
Figure 3, if we plot the PK/MTOW (marked vs. nominal range of the aircraft in our database), we see that the aircraft is well dispersed around the regression line and that their relative errors are increasing with higher nominal range and higher PK/MTOW. We can therefore define a lower limit of a minimal PK/MTOW regarding range, which will accept 100% of the database’s aircraft. In other words, we set up a maximum weight of an aircraft carrying a given number of passengers over a given distance. The formula for this limit is very simple:
In
Figure 3, we marked this function by a red hatched line. Let us stress the fact that we will consider this a limit for any new aircraft concepts, i.e., we will not build an aircraft below this line because it would be simply too heavy for its mission.
4.2. Npax vs. Range
Having defined a lower limit in terms of the range of our conceptual aircraft, let us now set up an upper limit. For this, we chose the number of passengers as the defing factor. If we plot the number of passengers on the range (
Figure 4), we can see that an upper constraint can almost exclusively limit the existing aircraft. This constraint gives us the minimum distance that can be accepted for a given passenger capacity. Note that we are not discussing a limit here, but only a constraint that shows us the contemporary practice among airplane manufacturers. Once again, its formula is very simple, and one can see that it corresponds to 19 passengers over 1300 km:
4.3. OEW Estimation
If we plot the OEW vs. MTOW of our database (
Figure 5), we can see a fairly linear regression.
This regression can be expressed mathematically as:
We notice 2 points about the regression:
That the regression is quite robust, i.e., it remains valid whether the aircraft has a turboprop or a piston engine. We know that the power density of an electric engine is similar to the density of a turbine of a turboprop (considering that the propeller remains the same).
That the regression is independent of an aircraft’s design capacity and range. In other words, the regression is valid, whatever the mass we add to the OEW.
We will therefore develop a model of calculation of the OEW. This model is explained by the two schemes in
Figure 6. We assume that we have this relationship between the OEW and the MTOW of a conventional aircraft, and we will keep these relations, but we will adjust the masses of the components inside (add the new engine, the mass of the new system, etc.). We assume that the regression is still valid to link MTOW with the basic part of the new OEW.
To put into practice the principle in
Figure 6, we remove the propulsion of a piston engine and add the mass of an electric motor and the mass of the batteries. This process is shown step by step in
Figure 7 below:
4.4. Installed Power Estimation
In order to scale the new engines, we need to approximate the necessary power of an aircraft. We find that the total power (power multiplied by the number of engines) of our database’s aircraft is strongly associated with their MTOW. Therefore, we can proceed with a similar approach to the OEW estimation. In
Figure 8 below, we see that the regression is quadratic.
The following equation can be used to express this regression mathematically:
Our model will use this equation to scale the selected power plant and its required systems.
4.5. Breguet–Leduc Demonstration
In order to calculate OEW, we first need to calculate the fuel required for a certain mission. We perform this by using a few aircraft parameters, such as speed, SFC (specific fuel consumption), lift-over-drag ratio, or engine efficiencies; we are going to derive the Breguet–Leduc formula. We will first introduce some general equations needed to build the fundamental principle of these formulas. Then, we will divide the calculations into six groups, according to the required propulsion system, and express the range of an exemplary aircraft of each group. Those expressions will then help us to calculate the total fuel, including all the different types of reserve fuel.
4.5.1. General Equations
Firstly, we will take the basic fuel flow formula:
Then we will divide it by speed expressed in a similar manner:
It will give us an expression that will become useful in the next calculations:
Now, let us take the two basic flight formulas. The lift and the drag formulas, respectively, are:
By dividing the lift formula by the drag formula, we obtain an expression of lift to drag ratio:
For the purpose of the following calculations, we will express the thrust from the last equation:
4.5.2. Range Calculation
Knowing that each combination of engine type and energy source type requires its own equation, we divided them in the following way:
Jet/fan engine
Propeller engine
Conventional Turbojet/Turbofan
From the definition of thrust-specific fuel consumption (TSFC), we know that it corresponds to the fuel consumption (fuel flow) of an engine per unit of thrust. Therefore, if we take Equation (7) and replace the fuel flow with the TSFC multiplied by thrust from Equation (11), we will obtain the following equation:
The development of this equation will lead us to the following expression of dx:
As we will use this formula only for turbofan aircraft, we can replace the speed by a product of the Mach number and a speed of sound at 35,000 ft ISA (International Standard Atmosphere):
The integration of this equation will give us a final Breguet-Leduc formula for turbofan aircraft:
where m
i stands for the initial mass of the aircraft (take-off mass) and m
f stands for its final mass (landing mass).
Conventional Propeller Engine
The final Breguet-Leduc formula for propeller-powered combustion engine aircraft is:
Battery-Powered Electrofan
In the case of electric motors, we need to split the power variable into two separate variables, the electric power W
e and the motor power W
m. The electric power represents the power coming from the batteries, and the motor power is the one on the shaft of the engine and thus equivalent to the shaft power of a turboprop engine. The ratio between W
e and W
m is expressed simply by the efficiency of the electric power train including power electronics and the motor η
m:
The final formula for expressing the battery-powered electrofan range is:
Fuel-Cell-Powered Electrofan
In the case of a hydrogen fuel cell system, we will use a method similar to the one for conventional fuel since, in both cases, we are reducing the amount—and therefore the weight—of the remaining fuel.
The required expression of the range is:
Battery-Powered Electroprop
This system is, by its principle, identical to a battery-powered electrofan, with the only difference of using a propeller instead of a fan. Its range formula will therefore be the same as the one for an electrofan, with the only difference being the use of propeller efficiency η
p instead of fan efficiency η
f:
Fuel-Cell-Powered Electroprop
This system is once again identical to a fuel-cell-powered electrofan, with the only difference of using a propeller instead of a fan. To obtain its range formula will once again use the one for an electrofan and substitute fan efficiency η
f instead of propeller efficiency η
p:
4.6. OEW Calculation
We are going to try to find a formula that would give an aircraft’s operating empty weight (OEW) as a function of the aircraft’s maximum take-off weight (MTOW) and its type on the basis of its mission. First, we need to identify the MTOW as follows:
As the MTOW will be considered known and the OEW will be the result of the final formula, we will now concentrate on the other members of the sum.
4.6.1. Payload
The payload will be simply the number of passengers N
pax multiplied by a selected average mass of a passenger, including their baggage M
pax:
4.6.2. Leg Fuel
Leg fuel equals the fuel used during a flight leg. It refers to the distance between the two waypoints divided by groundspeed and multiplied by the fuel burn rate for the leg type.
Conventional Turbojet/Turbofan
In this part, we will calculate the trip fuel, that is, the fuel needed for a particular route, excluding all reserves. First, we will calculate it for the case of turbofan aircraft. Let us start where we left off—with the Breguet–Leduc formula:
If we simplify the speed into v and approximate the initial and final masses as MTOW and (MTOW-leg fuel) respectively, we obtain:
The development of this equation will lead us to:
thus:
and finally:
Battery-Powered Electrofan
The leg fuel is represented by the electric energy in the battery, E
battery, which is easily expressed from the range Formula (18) as:
Fuel-Cell-Powered Electrofan
If we take the range expression (19) and express the weights in the same manner as before, we obtain:
A similar development as the one used above leads us to:
thus:
and finally:
Conventional Propeller Engine
By developing (16) in a similar manner as for the conventional turbofan, we obtain:
Battery-Powered Electroprop
Same as for the range formula, the electroprop leg fuel formula is equivalent to the electrofan one, only with the propeller efficiency:
Fuel-Cell-Powered Electroprop
Once again, we obtain the electroprop formula by using the same method:
4.6.3. Reserve Fuel
The reserve fuel of most commercial flights of turbofan aircraft consists of three main parts: diversion fuel, contingency fuel, and holding fuel.
Diversion Fuel
We will count with an average diversion distance R
div (e.g., a route from the destination to the alternate airport) of 200 NM. To approximate the necessary fuel, we will use the same reasoning as for the trip fuel. The only difference is the range substituted by R
div:
Contingency Fuel
Contingency fuel is calculated simply by adding 3% or 5% to the trip fuel; therefore:
where k
r is a factor of 0.03 or 0.05.
Holding Fuel
The final reserve is calculated in terms of time and usually equals to 30 min of flight time in a holding configuration. We will, therefore, derive it by using a combination of Equations (5) and (11) and the definition of the TSFC, which will give us the following:
This, after integration, equals to:
At this point, we can write the final mass as the initial mass minus Δm, where Δm corresponds to the fuel burned in the final holding phase. After developing the logarithm, we find the following:
We realize that the resulting formula is, in fact, a variation of the leg fuel formula, with two differences:
We can therefore obtain the formulas for all the other propulsion systems by following only these two steps. For the fuel-cell-powered electrofan, battery-powered electrofan, conventional propeller engine, fuel-cell-powered electroprop, and battery-powered electroprop, respectively, we obtain the following formulas:
With the newly acquired relations, we can update Formula (22) for a conventional fuel turbofan as follows:
5. Construction of a Model for Estimating the Masses of Aircraft Components
Once the criteria are defined, we need to calculate the parameters of the new concepts. We will simplify the calculation with the following assumptions:
We focus only on the cruise leg, which we extend from the departure airport all the way to the destination airport.
We consider climb energy as the potential energy acquired by the aircraft.
As we use the Breguet–Leduc formula, we consider the trajectory to be static for the entire duration of the flight.
As stated before, we will consider only small aircraft of the CS-23 category, meaning aircraft with MTOW < 5700 kg.
The aircraft will therefore have a range of approximately 2000 km and lift to drag ratio of around 10.
Regarding the mass, we make a small hypothesis that the hydrogen-powered aircraft is so light that even on long missions, we will not have more than 5% mass variation. This hypothesis is explained mathematically by the formula below:
where
is the efficiency in transforming fuel heat flow into propulsive power, and we approximate it as 0.3. Finally, if we consider a battery-powered aircraft, the mass is rigorously constant. Therefore, we can consider that the mass of our concept aircraft is constant.
5.1. Software Implementation
The python software created to build models prepares the raw data for and then executes the calculation of the abovementioned formulas. We are going to describe its calculation process step by step.
5.1.1. Coefficient Setup
In this part, we will set up all the coefficients required for future calculations. First, the software allows us to set a temperature deviation from the International Standard Atmosphere.
Next, we set the heating value of the combustion of kerosene to 43 MJ/kg and the one of hydrogen to 121 MJ/kg.
We can now set all the efficiencies of propulsion system components (
Table 2). We set the propeller efficiency η
p to 0.8 and the fan efficiency η
f to 0.82. Regarding the electric motor, we set its motor efficiency to 0.93, as it is the minimal value of the efficiency of electric aviation motors of the Magnix company. This company is one of the most successful in developing electric motors for aviation, as their motor Magni500 powered the first-ever electrified commercial airplane, the De Havilland Beaver seaplane of Harbour Air, in 2019 [
37]. The last required efficiency is one of the fuel cells. The maximum theoretical conversion efficiency of fuel cells is 82.7% [
38]. One of the leading companies in fuel cell solutions, Horizon, proposes fuel cells with efficiencies of 40% and has shown a peak efficiency of 59% during tests of its newer products [
39].
Let us now move on to setting the power densities of different propulsion solutions. The power density, also known as the power-to-weight ratio, expresses the nominal power of a certain propulsion system divided by its weight. We will use these densities as a simple way of calculating a transformation from one propulsion system to another. We set the turbofan power density to 7 kW/kg [
41], the turboprop to 5 kW/kg [
42,
43], and the piston to 1 kW/kg, which is the order of magnitude for a typical Lycoming used in a Cessna 172 [
44]. As for electric motors, for the purpose of further calculations, we are going to split the power densities into one value for the electric motor itself, one for a propeller installed on an electric motor (electroprop), and one for a fan installed in the same way (electrofan). For the electric motor itself, we will use the Magni500 once more as an example, with its power density of 4.2 kW/kg [
45]. For the propeller, we take an example of the Bombardier Q400 with its 6-bladed all-composite Dowty R408, which weighs around 251.7 kg [
46]. Given the fact that the engine’s nominal power is 3781 kW, the ratio is 15 kW/kg. As for the fan, we took the approximation performed by Periklis Lolis [
47], which gives the mass of the fan of a CFM56-7B27 engine, including its frames, as 1226.6 kg. This engine is used on 737–900 W, for which we calculated a power of 10,146 kW. The ratio will therefore be 8.3 kW/kg.
To be able to compare the use of battery-powered motors with conventional engines, we will also need the battery energy density and volumetric density. We will use projected values for two commonly used chemistries, Lithium-ion and Lithium–Sulfur [
48]. The best-performing Lithium-ion chemistry, Li-NMC441, has a gravimetric density of around 250 Wh/kg and a volumetric density of around 400 Wh/dm³, which translates to 1600 kg/m³. The Lithium–Sulfur also shows values of around 400 Wh/kg for the gravimetric density, but the volumetric density is projected to be as high as 400 Wh/dm³, which translates to 1000 kg/m³. We will pre-set the coefficient to the values of the Lithium-ion, but they can be easily rewritten to Lithium–Sulfur or any other chemistry as required.
Finally, to be able to compare the use of fuel-cell-powered motors with conventional engines, we will add gravimetric and volumetric densities for each of the fuel cell components, which are the fuel cell itself, its cooling unit, and, finally, the liquid or gas hydrogen tank. For the gravimetric density of a fuel cell, we will use, once again, the Horizon fuel cell, which shows a density of 5 kW/kg [
49]. For its cooling unit, we will make an approximation of 6 kW/kg, which corresponds to the data mentioned by Canders et al. [
50]. To represent the gravimetric and volumetric densities of hydrogen tanks, we will use the gravimetric and volumetric index. As stated in
Section 1, for liquified hydrogen, the state-of-the-art value for the gravimetric index is around 10% and around 45 kg/m³ for the volumetric index. In the case of compressed gas hydrogen, the values are about half of those for liquified, that is, 6% for the gravimetric and 40 kg/m³ for the volumetric index.
5.1.2. PAX Allowance
For the purpose of further calculations, we need to set the average weight of a passenger, including their luggage for different types of flights. We label this variable as the PAX allowance and pre-set it with the following values in
Table 3.
5.1.3. L/D
To calculate the lift-over-drag ratio, the software at first sets L/D limit values. These values are also coupled with MTOW limit values. The aircraft’s MTOW is then compared with these limits. If the MTOW is found to be outside of the limits, its L/D is automatically assigned as the limit L/D value. If it is found to be between the limits, the L/D is calculated as:
5.1.4. PSFC and TSFC
In the case of PSFC (propeller-specific fuel consumption) and TSFC, the calculation is the same, with the only difference of using the shaft power as an input for the PSFC and the equivalent shaft power developed during take-off for TSFC, as defined in the database. We will describe the case of PSFC: The pre-set limit values of PSFC are coupled with limit values of shaft power. In the case of hydrogen-powered aircraft, the PSFC limit values are multiplied by the ratio of the fuel heating value of kerosene divided by the one of hydrogen. The reason is the formula for SFC itself:
where η
th and η
pr stand for the thermal and propulsive efficiency, respectively, and V
0 is the air speed upstream of the engine.
Once the limit values are established, the aircraft’s max shaft power (P) is then compared with the limits (P
max and P
min). If it is found to be between the limits, then it is calculated as:
5.1.5. ref_power and ref_OEW
In this part, we set up the regression curves for the required total power for an airplane with a given MTOW and the averaged OEW for an airplane with a given MTOW, respectively. It is, in both cases, a least square linear regression, which forms the following:
where a, b, and c are the coefficients that are calculated by the software but have to be reset manually into the code whenever the database changes. For our calculations, we chose a polynomial equation of a second degree, but it is possible to change the degree should we require the function to follow any database trend more closely.
5.1.6. Cruise, Diversion, and Holding Altitudes
We assign cruise, diversion, and holding altitudes to each aircraft according to their type in the following order in
Table 4:
5.1.7. Reserve Data
This part specifies the reserve fuel parameters for each airplane type. It assigns contingency fuel percentage, diversion leg length, and holding time in the following manner in
Table 5:
5.1.8. Leg Fuel
We now finally calculate the leg fuel (also referred to as trip fuel) required for a given distance.
We take the aforementioned Equation (28) and adjust it to suit the input data. We replace MTOW with a variable called start_mass, which corresponds to the mass at the beginning of a flight segment, so in this case, it would be the actual TOW. We also replace speed with the TAS (true airspeed) and range by the given distance.
where η
f stands for fan efficiency, η
m for motor efficiency, and η
fc for fuel cell efficiency.
With this type of technology, the calculated value will be energy expressed in Joules as opposed to fuel mass expressed in kilograms.
Finally, we add 5% of the calculated leg fuel (or battery energy required for a leg) on top in order to take into account the climb phase of each flight.
5.1.9. Holding Fuel
Same as for the leg fuel, we take the appropriate Equation (42) and replace (MTOW—leg fuel) by start_mass, which in this case corresponds to the mass at the beginning of the holding phase.
We follow the same logic for all the remaining propulsion setups, mostly updating the leg fuel formulas with the relevant variables:
5.1.10. Total Fuel
Having performed all the calculations above, we can now calculate the total fuel required for a certain mission. The software adds all the different parts of reserve fuel to the leg fuel according to the formula below:
At this stage, we also calculate the weight of the fuel tanks. In the case of gas and liquid hydrogen storage, we use the corresponding gravimetric index as follows:
In the case of battery storage, we simply divide total fuel by the battery energy density. Finally, in the case of conventional fuel, we do not take the weight of the fuel tanks into account, as their weight tends to be negligible compared to OEW.
5.1.11. OEW Structure
Here, we calculate the change in aircraft’s mass in case of a theoretical propulsion system change. We use the predefined power densities each time to calculate the mass of the engine using its nominal power. Then, we save this initial mass as a variable. We follow the same process for the target propulsion system, making sure to add all required weights. This means the electric motor plus fan or propeller mass in the case of a battery-powered aircraft. In the case of a hydrogen fuel-cell-powered aircraft, we add the calculated mass of the fuel cell and its cooling system on top. Once again, we save the newly calculated target mass as a variable. We now set up a new variable called delta_engine_mass, which will be simply the difference between the target engine mass and the initial engine mass, and its result is finally added or subtracted from the OEW.
5.1.12. Design
Along with basic information about an aircraft’s design, this function allows for the calculation of four following evaluation criteria:
Mass Efficiency Factor
This criterion is calculated simply as:
It represents the transport service as compared to the mass to be invested. In other words, it tells us how much mass we need to invest in order to provide a certain service. We can, therefore, think of it as of a dimensionless EROI ratio (energy return on investment).
Energy Efficiency Factor
This criterion is very similar to the previous one but uses the total energy as a comparing factor.
The total energy represents the energy of the total fuel required for a certain mission (including reserves), which is either calculated by multiplying the fuel mass by its heating value or taken directly as the necessary energy in the case of battery-powered aircraft.
System Energy Density
The energy density of a certain energy stockage system is calculated as the total energy potentially exploitable from the fuel or battery divided by the mass of the latter.
In the case of kerosene, we take the mass of the fuel solely and neglect the relatively small mass of the tanks. In the case of all other systems, we calculate the added mass and then add it as delta system mass to the total fuel mass. The delta system mass can be the mass of the tank holding the liquid or gas hydrogen or the mass of the so-called battery pack, which surrounds the battery itself.
6. Application to the Concept of Battery-Powered Aircraft and Its Limits (Research of the Technological Frontier according to the Energy Density)
To put our model in the trial, we decided to focus on the general aviation domain, as there are already multiple electric aircraft in service or in development that we can use as a clear indicator of whether our model is precise. Therefore, we wanted to see whether we can use it for further exploration of the domain of battery-powered aircraft.
6.1. Chosen Aircraft Examples
We chose to compare our model with two real aircraft, the Socata TB20 Trinidad and the H55-Bristell Energic. Let us now introduce the two with their specifications.
6.1.1. Socata TB20
The Socata TB20 is one of the most common light single-engine piston aircraft developed and manufactured in France. The TB within the designation stands for “Tarbes”, which is the city where the aircraft is manufactured. It was introduced in 1975, and until 2007, there were 2150 units produced [
51].
6.1.2. H55-Bristell Energic
The H55-Bristell Energic is one of the first light single-engine electric aircraft proposed for serial production. It is developed by a consortium of a Czech aircraft manufacturer, BRM Aero, based in Kunovice, and a Swiss company, H55. BRM Aero supplies the aircraft itself, as it is a derivative of their own Bristell B23. H55 supplies the propulsion system, including its batteries, as it is the company behind the Solar Impulse project. The aircraft is currently undergoing testing and it should be certified under CS-23 by 2024.
Specifications of H55-Bristell Energic are an engine power of 100 kW [
52] and the range, which was calculated by taking its endurance of 90 min and making a hypothesis of a cruise speed of 130 km/h. To be compliant with the regulations, we need to have a 30 min reserve and, therefore, only 60 min of trip time, which gives us a range of 130 km.
6.2. Model Validation
Let us now assemble the key aircraft specifications, which we will use as inputs for our software. As one can see in
Table 6 below, for the TB20, we interpolated the number of passengers as four and a half, as the aircraft max occupancy is four to five passengers.
If we run the calculation with this input, we obtain the output of a conventional propeller engine-powered aircraft and a battery-powered electroprop, respectively, in
Table 7 and
Table 8:
We can now compare the highlighted data with the real ones from the manufacturer, as stated in
Table 9.
We can see that for these specific aircraft and in those specifications, our model overestimates the real values slightly, but its deviations stay lower than 10%.
6.3. Technological Frontier Exploration
Using the limits defined in
Section 4 and our battery aircraft model, we can depict the space of possible designs on a Npax vs. Range in
Figure 9 below:
In
Figure 9, the color field shows
, and the yellow line highlights the case when PK/M = PK/M
min. As established in
Section 4, this line will be considered a lower limit of a possible design, meaning that we will not build an aircraft below this line.
The grey line shows the previously developed P/kmax = 0.0146. This line represents an upper limit of a possible design, and the design space that does not satisfy the constraint is once again covered by hashes. As stated before, this limit is not a hard one. It just shows the current practice among aircraft manufacturers.
The designs producing the highest level of service (PK maximum) should be in the white ellipse of
Figure 10. As we can see, this area is mostly considered unusable due to the upper limit. We will, therefore, divide it into two points, A and B, which will represent the maximal level of service possible with the limits chosen and the maximal range with 19 passengers if we disregard the soft limit, respectively.
As we established earlier, the most important factor in battery-powered aircraft development is the battery power density. It will, therefore, also change the field and the
position of the PK/M = PK/M
min line. In the following, we will follow the trajectories of points A and B when the battery energy density varies from 200 Wh/kg to 600 Wh/kg (
Figure 11).
In
Figure 12, we can see a comparison of points A, which is the maximal constrained level of service, and point B, the maximal absolute level of service for 19 passengers, for battery energy densities varying from 200 to 600 Wh/kg.
It is important to mention that these results focus on the small aircraft domain, the CS23. We could continue to have a higher number of passengers and a higher range with a commuter aircraft category, for example, but we can conclude that, according to our model, this technology is interesting mostly for shorter distances than the usual practice among aircraft manufacturers.
7. Application to the Concept of Hydrogen-Powered Aircraft and Its Limits (Research of the Technological Frontier according to the Energy Density)
Due to a lack of complete information about flying hydrogen-powered aircraft (the Boeing fuel cell demonstrator, for example, was using batteries along with a fuel cell and therefore was not powered solely by hydrogen [
53]), we had to skip the model validation part and concentrate on the technological frontier research, which is, in this case, more complex. As we are concentrating on the small aircraft domain of the CS-23 category, we are going to consider fuel cell technology powered by hydrogen in the form of gas. The reason for this hypothesis is that the fuel cell technology with gas hydrogen seems to be the best one, as it was proven, for example, by the Boeing demonstrator mentioned above or the Zero Avia’s modified Piper Malibu [
54].
Technological Frontier Exploration
We are going to use the same Npax vs. Range figure as in the previous section and we add one more limitation, which is simply the weight limitation to keep the MTOW of the aircraft to less than 5700 kg in order to stay in the CS-23 category. This limitation is marked by the purple line in the figures below.
Unlike battery technology, hydrogen has not one but three defining parameters. It is the fuel cell system power density, the cooling power density, and the fuel cell efficiency. The first two of the three are given in kW/kg, and the efficiency is a unitless variable. The power densities of a fuel cell and its cooling are in the order of 5 and 6 kW/kg, respectively. However, in this case, we are considering a fully integrated system designed for affordable production and safe service. We are, therefore, going to downgrade the aforementioned values to 2 and 3 kW/kg, respectively, in the first instance. As for the fuel cell efficiency, we are going to start with the value of 0.4 declared by the Horizon fuel cell company. We can see the results for this first instance with the lowest values in
Figure 13 below:
If we ignore the holes in both the PK/M and maximal MTOW limitations, which are caused by the software not being adapted for these low values, we can see that the point with the highest level of service is situated roughly at 6 passengers and 400 km of range.
We will now increase each of the parameters (the fuel cell system power density, the cooling power density, and the fuel cell efficiency) one by one to demonstrate their effect on the overall concept (
Figure 14). Let us start by increasing the fuel cell efficiency to 0.7 while keeping the other parameters constant.
We can see that we are no longer limited by the PK/M, and the mass limitation puts us at 12 passengers and a little bit over 800 km of range.
If we bring the fuel cell efficiency back to its default value of 0.4 and increase the fuel cell system power density to 5 kW/kg while keeping the cooling system power density at 3 kW/kg, we obtain the following
Figure 15.
In this case, all three limitations intersect roughly at the same point of 9 passengers and a bit over 600 km of range.
Let us now increase the cooling system power density to 5 kW/kg while holding the remaining parameters at their minimum values (
Figure 16).
We notice that we obtain a very similar, albeit slightly lower, level of service than when solely increasing the fuel cell system power density.
Finally, we increase all the parameters at once, that is, 5 kW/kg for both the fuel cell and the cooling system power density and 0.7 for the fuel cell efficiency. Notice in
Figure 17 below that we increased the maximal range to 2400 km.
We marked the point of highest service (17 passengers over around 1200 km) as point A and the point of highest range, which is around 2250 km, with 8 passengers on board, as point B. Let us now look at a comparison of points A in all the abovementioned cases (
Figure 18):
As we can see, the fuel cell efficiency increase from 0.4 to 0.7 clearly outperforms both the fuel cell and the cooling system power density increases from 2 to 5 and 3 to 5 kW/kg, respectively. Out of these two, the fuel cell power density shows better improvement. However, this is mostly because we kept the initial cooling power density higher than one of the fuel cells. If they were kept at the same values, these two variables would have a very similar effect.
In conclusion, we would like to stress the hypothesis that we proposed. The study focuses on the mass aspect of commercial aircraft. Nothing says a priori that the fuel cell aircraft is feasible. The problems with feasibility may arise mainly because of thermal evacuation problems. Moreover, we did not take into account this technology’s need for volume. Large tanks of compressed hydrogen could radically change the fuselage of such an aircraft concept. However, we assumed that we could always obtain a lift to drag ratio of 14, whatever the embarked technology.
8. Discussion
The scope of this research is to provide a comprehensive analysis of the potential of battery- and hydrogen-fuel-powered aircraft as alternatives to traditional fossil-fuel-powered aviation systems. As a part of the research work, a program to calculate mathematical models that estimate the weight of aircraft components has been developed, with a specific focus on batteries and fuel cells. The study has identified the technological barriers to the development of these technologies and has created a database and software for exploring and comparing them.
The results of the study have shown that both battery- and hydrogen fuel-cell-powered aircraft have the potential to replace traditional engines, with power density and efficiency improvements making them viable alternatives. However, there are limitations to the adoption of these technologies, particularly in terms of the difficulty of putting hydrogen propulsion technology into place.
One of the main limitations of this research is that it primarily focuses on the power density and efficiency trade-offs of various advanced engines, electrolytic batteries, fuel cells, and cooling technologies. While this is an essential aspect of understanding the potential of these technologies, there are other factors to consider, such as the economics of implementation and the regulatory framework. For example, the cost of hydrogen fuel cells is currently high, and this could be a significant barrier to their adoption. Additionally, the regulatory framework will need to be adapted to accommodate these new technologies, which may take time and require significant investment.
Another limitation is that the research focuses on general aviation, and there may be differences in the application of these technologies in other areas, such as commercial aviation. The study does not explore the potential for hybrid systems, which could combine the benefits of both battery and fuel cell technologies.
Ideas for further work could include an exploration of the economics of implementing these technologies, including the cost of production, maintenance, and infrastructure. Additionally, further research could explore the regulatory framework and policy changes required to support the adoption of these technologies. Another area of research could be the development of hybrid systems that combine the benefits of both battery and fuel cell technologies.
In conclusion, this research provides a valuable contribution to the understanding of the potential of battery and hydrogen-fuel-powered aircraft. It highlights the need for interdisciplinary research and collaboration to find sustainable solutions to contemporary challenges. While there are limitations to this study, the results demonstrate the potential of these technologies and provide a foundation for further research. Ultimately, the adoption of these technologies will require significant investment, innovation, and collaboration between industry, policymakers, and researchers.
9. Conclusions
This article presents a program for calculating mathematical models to estimate the weight of aircraft components, focusing on battery- and hydrogen fuel-cell-powered aircraft concepts. The research aimed to add missing dimensions and parameters to the aircraft database, create an effective program for creating mathematical models, and identify technological barriers. This article showed a new possibility of comparing new technologies by using data from conventional ones. It introduced the two most important propulsion technologies, showed their past and current development, and compared their core values critically. It then described the creation of the database and its exploiting software. Finally, it presented a model validation for battery technology and a search of the technological frontier of both technologies. The results showed overall better values of the level of service of the hydrogen technology, defining the fuel cell efficiency as its most important parameter. However, this lead over battery technology is the difficulty of putting the hydrogen propulsion technology in place. It is best demonstrated by the fact that small battery-powered aircraft have already reached serial production (such as the Alpha Electro of the Pipistrel company [
55]), whereas purely hydrogen-powered aircraft are still waiting for their first pioneering model. Nevertheless, batteries and hydrogen should be regarded as partners, completing rather than competing with each other.
The research primarily focuses on calculating power density and efficiency trade-offs for various advanced engines and turbines, electrolytic batteries, fuel cells, and cooling technologies. One of the critical aspects of this work is to evaluate the potential of hydrogen- and battery-powered aircraft to replace traditional fossil-fuel-powered aviation systems, which contribute significantly to the carbon footprint and air pollution. The analysis results indicate that the power density and efficiency of electric motors and fuel cells have been improving with advancements in technology, making them viable alternatives to traditional engines. The authors also highlight the importance of cooling technologies for high-power density electrical machines in aviation applications.
Apart from the technical insights, the article demonstrates the importance of collaborative and interdisciplinary research in finding sustainable solutions to contemporary challenges, such as reducing carbon emissions in aviation. The authors have integrated findings from various sources to provide a comprehensive overview of the current and potential technology for hydrogen- and battery-powered aircraft, which can benefit designers, engineers, policymakers, and regulators.
Overall, this work presents valuable contributions to the ongoing discourse about sustainable aviation and provides a starting point for further research and development of hydrogen- and battery-powered aircraft concepts.
Author Contributions
Conceptualization, M.J. and V.B.; Methodology, M.J., V.B. and B.K.; Software, V.B.; Validation, V.B. and M.J.; Formal Analysis, F.Š. and K.Š.; Investigation, M.J. and K.Š.; Resources, M.J. and Ľ.H.; Data Curation, V.B.; Writing—Original Draft Preparation, M.J., V.B. and B.K.; Writing—Review and Editing, M.J., K.Š., F.Š. and Ľ.H.; Visualization, M.J. and V.B.; Supervision, K.Š. and B.K.; Project Administration, M.J., F.Š. and Ľ.H. All authors have read and agreed to the published version of the manuscript.
Funding
This work was supported under the project of Operational Programme Integrated Infrastructure: Research and development of contactless methods for obtaining geospatial data for forest monitoring to improve forest management and enhance forest protection, ITMS code 313011V465. The project is co-funded by the European Regional Development Fund.
Data Availability Statement
The article includes the original contributions presented in the study. Further inquiries can be directed to the corresponding author.
Conflicts of Interest
The authors declare no conflict of interest.
Nomenclature
| Abbreviations |
| BAC | British Aircraft Corporation |
| CS-23 | European Aviation Safety Agency Certification Specification for Normal, Utility, Aerobatic, and Commuter Category Aeroplanes |
| DE | Direct energy consumption |
| EE | Embodied energy |
| EROI | Energy return on investment |
| G/CNT | Graphene/carbon nanotubes |
| HHV | Hydrogen heating value |
| HTP | Horizontal tailplane |
| ISA | International Standard Atmosphere |
| LT | Lifetime |
| MK | “Mass-kilometer” (Payload times Distance) |
| MSIJ | Mass of the various materials used to build the device times the “scarcity index” of the materials |
| MTOW | Maximum take-off weight |
| Npax | Number of passengers |
| OP equipment | Operational equipment |
| OEW | Operating empty weight |
| PAX | Passenger |
| PE | Primary energy consumed |
| PK | “Passenger-kilometer” (Npax times Distance) |
| PK/M | PK/MTOW = (Passenger capacity times Range) divided by Maximum take-off weight |
| PSFC | Propeller-Specific Fuel Consumption |
| RE | Recycling energy |
| SFC | Specific Fuel Consumption |
| SI | International System of Units |
| TAS | True airspeed |
| TOW | Take-off weight |
| TSFC | Thrust-Specific Fuel Consumption |
| VTOL/STOL | Vertical/Short take-off and landing |
| VTP | Vertical tailplane |
| List of Symbols |
| a | Speed of sound |
| CO2 | Carbon dioxide |
| Cx | Drag coefficient |
| Cz | Lift coefficient |
| D | Drag |
| E | Energy |
| F | Force; Engine thrust |
| ff | Fuel flow |
| g | Gravitational constant |
| H2 | Hydrogen |
| kr | Contingency fuel factor |
| L | Lift |
| m | Mass |
| M | Mach number |
| Mpax | Average mass of a passenger and their baggage |
| ρ | Density |
| pw | Power |
| Rdiv | Average diversion distance |
| S | Wing area |
| t | Time |
| v | Speed |
| We | Electric power; Energy flow |
| Wfuel | Fuel energy |
| Wm | Motor power |
| Wshaft; P | Shaft power |
| x | Distance |
| ηf | Fan efficiency |
| ηfc | Efficiency of a fuel cell |
| ηm | Motor efficiency |
| ηp | Propeller efficiency |
| ηthpr | Thermopropulsive efficiency |
References
- Supersonic Flight: Will It Ever Rise Out of the Ashes of Concorde? Available online: http://www.theguardian.com/technology/2018/jun/05/supersonic-flight-concorde-crash (accessed on 25 June 2022).
- Airbus Hits the Road with A3xx. (Airbus Industrie). Available online: https://web.archive.org/web/20121106060040/http://www.highbeam.com/doc/1G1-16444324.html (accessed on 25 June 2022).
- Zhang, B. An American Airlines VP Reveals Why the Airbus A380 doesn’t Work for the World’s Biggest Airline. Available online: https://www.businessinsider.com/american-airlines-exec-reveals-why-company-doesnt-use-airbus-a380-2019-4 (accessed on 18 February 2022).
- Vermeulen, S.; Zougmoré, R.; Wollenberg, E.; Thornton, P.; Nelson, G.; Kristjanson, P.; Kinyangi, J.; Jarvis, A.; Hansen, J.; Challinor, A.; et al. Climate change, agriculture and Food Security: A global partnership to link research and action for low-income agricultural producers and consumers. Curr. Opin. Environ. Sustain. 2012, 4, 128–133. [Google Scholar] [CrossRef]
- Li, X.; Tang, J.; Li, W.; Si, Q.; Guo, X.; Niu, L. A bibliometric analysis and visualization of aviation carbon emissions studies. Sustainability 2023, 15, 4644. [Google Scholar] [CrossRef]
- Cabrera, E.; de Sousa, J.M. Use of sustainable fuels in aviation—A Review. Energies 2022, 15, 2440. [Google Scholar] [CrossRef]
- Yusaf, T.; Fernandes, L.; Abu Talib, A.R.; Altarazi, Y.S.; Alrefae, W.; Kadirgama, K.; Ramasamy, D.; Jayasuriya, A.; Brown, G.; Mamat, R.; et al. Sustainable aviation—Hydrogen is the future. Sustainability 2022, 14, 548. [Google Scholar] [CrossRef]
- Schmelcher, M.; Häßy, J. Hydrogen Fuel Cells for Aviation? Available online: https://elib.dlr.de/188835/1/ISABE_2022_291_full.pdf (accessed on 13 March 2023).
- Trainelli, L.; Saluci, F.; Comincini, D.; Riboldi, C.E.D.; Rolando, A. Sizing and Performance of Hydrogen-Driven Airplanes. Available online: https://mahepa.eu/wp-content/uploads/2020/06/Sizing-and-Performance-of-Hydrogen-Driven-Airplanes.pdf (accessed on 13 March 2023).
- Nicolay, S.; Karpuk, S.; Liu, Y.; Elham, A. Conceptual Design and optimization of a general aviation aircraft with fuel cells and hydrogen. Int. J. Hydrog. Energy 2021, 46, 32676–32694. [Google Scholar] [CrossRef]
- Gao, Y.; Jausseme, C.; Huang, Z.; Yang, T. Hydrogen-powered aircraft: Hydrogen–electric hybrid propulsion for aviation. IEEE Electrif. Mag. 2022, 10, 17–26. [Google Scholar] [CrossRef]
- Kadyk, T.; Schenkendorf, R.; Hawner, S.; Yildiz, B.; Römer, U. Design of Fuel Cell Systems for Aviation: Representative Mission Profiles and Sensitivity Analyses. Front. Energy Res. 2019, 7. [Google Scholar] [CrossRef]
- McQueen, M.; Karataş, A.E.; Bramesfeld, G.; Demir, E.; Arenas, O. Feasibility Study of electrified light-sport aircraft powertrains. Aerospace 2022, 9, 224. [Google Scholar] [CrossRef]
- Palaia, G.; Abu Salem, K. Mission Performance Analysis of hybrid-electric regional aircraft. Aerospace 2023, 10, 246. [Google Scholar] [CrossRef]
- Frosina, E.; Caputo, C.; Marinaro, G.; Senatore, A.; Pascarella, C.; Di Lorenzo, G. Modelling of a hybrid-electric light aircraft. Energy Procedia 2017, 126, 1155–1162. [Google Scholar] [CrossRef]
- Marinaro, G.; Di Lorenzo, G.; Pagano, A. From a battery-based to a PEM fuel cell-based propulsion architecture on a lightweight full electric aircraft: A Comparative Numerical Study. Aerospace 2022, 9, 408. [Google Scholar] [CrossRef]
- Staack, I.; Sobron, A.; Krus, P. The potential of full-electric aircraft for civil transportation: From the breguet range equation to operational aspects. CEAS Aeronaut. J. 2021, 12, 803–819. [Google Scholar] [CrossRef]
- Hoff, T.; Becker, F.; Dadashi, A.; Wicke, K.; Wende, G. Implementation of fuel cells in aviation from a maintenance, repair and overhaul perspective. Aerospace 2022, 10, 23. [Google Scholar] [CrossRef]
- Ferretto, D.; Viola, N. Preliminary design and simulation of a thermal management system with integrated secondary power generation capability for a Mach 8 aircraft concept exploiting liquid hydrogen. Aerospace 2023, 10, 180. [Google Scholar] [CrossRef]
- Broom, D.P.; Webb, C.J.; Fanourgakis, G.S.; Froudakis, G.E.; Trikalitis, P.N.; Hirscher, M. Concepts for improving hydrogen storage in nanoporous materials. Int. J. Hydrog. Energy 2019, 44, 7768–7779. [Google Scholar] [CrossRef]
- Ni, M. An overview of hydrogen storage technologies. Energy Explor. Exploit. 2006, 24, 197–209. [Google Scholar] [CrossRef]
- Preuster, P.; Alekseev, A.; Wasserscheid, P. Hydrogen Storage Technologies for Future Energy Systems. Annu. Rev. Chem. Biomol. Eng. 2017, 8, 445–471. [Google Scholar] [CrossRef]
- Tzimas, E.; Filiou, C.; Peteves, S.; Veyret, J. Hydrogen Storage: State-of-the-Art and Future Perspective. EUR 20995 EN. cat. No. LD-NA-20995-EN-C; 2003. JRC26493. Available online: https://publications.jrc.ec.europa.eu/repository/handle/JRC26493 (accessed on 20 February 2022).
- Marciello, V.; Di Stasio, M.; Ruocco, M.; Trifari, V.; Nicolosi, F.; Meindl, M.; Lemoine, B.; Caliandro, P. Design exploration for sustainable regional hybrid-electric aircraft: A study based on technology forecasts. Aerospace 2023, 10, 165. [Google Scholar] [CrossRef]
- NIST Chemistry Webbook, SRD 69. Available online: https://webbook.nist.gov/cgi/fluid.cgi?Action=Load&ID=C1333740&Type=SatT&Digits=5&PLow=.5&PHigh=1.5&PInc=.1&RefState=DEF&TUnit=K&PUnit=atm&DUnit=kg%2Fm3&HUnit=kJ%2Fmol&WUnit=m%2Fs&VisUnit=uPa%2As&STUnit=N%2Fm (accessed on 15 May 2022).
- Hwang, H.T.; Varma, A. Hydrogen storage for fuel cell vehicles. Curr. Opin. Chem. Eng. 2014, 5, 42–48. [Google Scholar] [CrossRef]
- Rivard, E.; Trudeau, M.; Zaghib, K. Hydrogen storage for mobility: A Review. Materials 2019, 12, 1973. [Google Scholar] [CrossRef]
- Hydrogen Tank: Doosan Mobility Innovation. Available online: http://www.doosanmobility.com/en/products/hydrogen-tank/ (accessed on 16 January 2023).
- Airbus. Airbus Partners with Amprius, Leader in High Energy Density Battery Technology. Available online: https://www.airbus.com/en/newsroom/press-releases/2019-10-airbus-partners-with-amprius-leader-in-high-energy-density-battery (accessed on 27 February 2023).
- Bi, C.X.; Zhao, M.; Hou, L.P.; Chen, Z.X.; Zhang, X.Q.; Li, B.Q.; Yuan, H.; Huang, J.Q. Anode material options toward 500 wh kg−1lithium–sulfur batteries. Adv. Sci. 2021, 9, 2103910. [Google Scholar] [CrossRef]
- Kim, S.; Oguchi, H.; Toyama, N.; Sato, T.; Takagi, S.; Otomo, T.; Arunkumar, D.; Kuwata, N.; Kawamura, J.; Orimo, S.-I. A complex hydride lithium superionic conductor for high-energy-density all-solid-state lithium metal batteries. Nat. Commun. 2019, 10, 1081. [Google Scholar] [CrossRef]
- Shi, H.; Zhao, X.; Wu, Z.-S.; Dong, Y.; Lu, P.; Chen, J.; Ren, W.; Cheng, H.-M.; Bao, X. Free-standing integrated cathode derived from 3D graphene/carbon nanotube aerogels serving as binder-free sulfur host and interlayer for ultrahigh volumetric-energy-density lithium sulfur batteries. Nano Energy 2019, 60, 743–751. [Google Scholar] [CrossRef]
- Randall, A.C.; Moeini, H. Eviation Aircraft Sets Sights on Kokam Batteries. Available online: https://www.electrive.com/2018/02/15/eviation-aircraft-sets-sights-kokam-batteries/ (accessed on 11 May 2022).
- Liu, X.; Iocozzia, J.; Wang, Y.; Cui, X.; Chen, Y.; Zhao, S.; Li, Z.; Lin, Z. Noble metal–metal oxide nanohybrids with tailored nanostructures for efficient solar energy conversion, photocatalysis and environmental remediation. Energy Environ. Sci. 2017, 10, 402–434. [Google Scholar] [CrossRef]
- All the World’s Aircraft: In Service Yearbook 20/21. Available online: https://shop.janes.com/all-the-world-s-aircraft-in-service-yearbook-20-21-6541-3000008244 (accessed on 11 April 2022).
- Les Editions Elodie Roux-Avions Civils Raction: Plan 3 Vues et Donnes Caractristiques. Available online: http://elodieroux.com/EditionsElodieRouxAvions.html (accessed on 25 July 2022).
- Roux Élodie Avions Civils À Réaction: Plan 3 Vues et Données Caractéristiques; Editions Elodie Roux: Blagnac, France, 2007.
- Haseli, Y. Maximum conversion efficiency of hydrogen fuelcells. Int. J. Hydrog. Energy 2018, 43, 9015–9021. [Google Scholar] [CrossRef]
- Horizon 5000W PEM Fuel Cell SKU: FCS-C5000. Category: 1000W to <5000W Fuel Cell Stacks. Brands: Horizon. Available online: https://www.fuelcellearth.com/fuel-cell-products/horizon-5000w-pem-fuel-cell/ (accessed on 15 December 2022).
- Comparison of Fuel Cell Technologies. Available online: https://www.energy.gov/eere/fuelcells/comparison-fuel-cell-technologies (accessed on 13 March 2023).
- Luongo, C.A.; Masson, P.J.; Nam, T.; Mavris, D.; Kim, H.D.; Brown, G.V.; Waters, M.; Hall, D. Next generation more-electric aircraft: A potential application for HTS superconductors. IEEE Trans. Appl. Supercond. 2009, 19, 1055–1068. [Google Scholar] [CrossRef]
- Picard, B.; L.-Blais, A.; Picard, M.; Rancourt, D. Power-Density vs Efficiency Trade-Off for a Recuperated Inside-Out Ceramic Turbine (ICT); Microturbines, Turbochargers, and Small Turbomachines; Steam Turbines: Phoenix, AZ, USA, 2019; Volume 8. [Google Scholar] [CrossRef]
- GE Turbines and Small Engines Overview. deBock-Arpa-e INTEGRATE Meeting. Available online: https://arpa-e.energy.gov/sites/default/files/14_deBock_GE%20Turbines%20and%20small%20engines%20overview%20-%20ARPA-e%20INTEGRATE%20V2.pdf (accessed on 17 April 2022).
- Lycoming IO-390. Available online: http://all-aero.com/index.php/contactus/64-engines-power/13224-lycoming-io-390 (accessed on 6 January 2022).
- H3X. H3X Claims It’s Tripled the Power Density of Electric Aircraft Motors, New Atlas. Available online: https://newatlas.com/aircraft/h3x-electric-aircraft-motor-power-density/ (accessed on 19 May 2022).
- FlyRadius. Available online: https://www.flyradius.com/bombardier-q400/propeller-dowty-r408 (accessed on 27 September 2022).
- Lolis, P. Development of a Preliminary Weight Estimation Method for Advanced Turbofan Engines, CERES Home. Cranfield University. Available online: http://dspace.lib.cranfield.ac.uk/handle/1826/9244 (accessed on 24 February 2022).
- Cheng, L.; Curtiss, L.A.; Zavadil, K.R.; Gewirth, A.A.; Shao, Y.; Gallagher, K.G. Sparingly solvating electrolytes for high energy density lithium–sulfur batteries. ACS Energy Lett. 2016, 1, 503–509. [Google Scholar] [CrossRef]
- Horizon to deliver 370 kW PEMFC stacks for heavy-duty vehicles. Fuel Cells Bull. 2019, 2019, 3. [CrossRef]
- Canders, W.-R.; Hoffmann, J.; Henke, M. Cooling Technologies for high power density electrical machines for aviation applications. Energies 2019, 12, 4579. [Google Scholar] [CrossRef]
- SOCATA TB20, SKYbrary Aviation Safety. Available online: https://skybrary.aero/aircraft/tb20 (accessed on 27 February 2023).
- H55. Available online: https://www.h55.ch/ (accessed on 15 July 2022).
- Lapeña-Rey, N.; Mosquera, J.; Bataller, E.; Ortí, F. The Boeing Fuel Cell Demonstrator Airplane; SAE Technical Paper Series; SAE International: Warrendale, PA, USA, 2007. [Google Scholar] [CrossRef]
- Redactoramexico. Powercell Sweden Receives New Follow-on Order for Aircraft Fuel Cell Systems from Zeroavia Worth Msek 7.4, Hydrogen Central. Available online: https://hydrogen-central.com/powercell-sweden-aircraft-fuel-cell-systems-zeroavia/ (accessed on 15 July 2022).
- Pipistrel Aircraft. Why Alpha Electro? Available online: https://www.pipistrel-aircraft.com/aircraft/electric-flight/alpha-electro/ (accessed on 25 July 2022).
Figure 1.
Hydrogen tank. Adapted with permission from Ref. [
28]. 2023, Doosanmobility.
Figure 1.
Hydrogen tank. Adapted with permission from Ref. [
28]. 2023, Doosanmobility.
Figure 2.
Methods of measuring HTP and VTP surfaces.
Figure 2.
Methods of measuring HTP and VTP surfaces.
Figure 3.
Minimal PK/MTOW.
Figure 3.
Minimal PK/MTOW.
Figure 4.
Maximal number of PAX per range.
Figure 4.
Maximal number of PAX per range.
Figure 6.
Comparison of OEW/MTOW regression for conventional and hydrogen/battery-powered aircraft.
Figure 6.
Comparison of OEW/MTOW regression for conventional and hydrogen/battery-powered aircraft.
Figure 7.
Example of OEW estimation in case of replacement of a piston engine by an electroprop with batteries.
Figure 7.
Example of OEW estimation in case of replacement of a piston engine by an electroprop with batteries.
Figure 8.
Total power vs. MTOW.
Figure 8.
Total power vs. MTOW.
Figure 9.
Design space, Npax vs. Range.
Figure 9.
Design space, Npax vs. Range.
Figure 10.
Points of the maximum level of service in the design space.
Figure 10.
Points of the maximum level of service in the design space.
Figure 11.
Design space with a 200 Wh/kg technology—case of H55-Bristell Energic.
Figure 11.
Design space with a 200 Wh/kg technology—case of H55-Bristell Energic.
Figure 12.
Comparison of points A and B for battery energy densities of 200–600 Wh/kg.
Figure 12.
Comparison of points A and B for battery energy densities of 200–600 Wh/kg.
Figure 13.
Design space with the lowest fuel cell technology.
Figure 13.
Design space with the lowest fuel cell technology.
Figure 14.
Design space with fuel cell efficiency of 0.7.
Figure 14.
Design space with fuel cell efficiency of 0.7.
Figure 15.
Design space with the fuel cell system power density of 5 kW/kg.
Figure 15.
Design space with the fuel cell system power density of 5 kW/kg.
Figure 16.
Design space with cooling system power density of 5 kW/kg.
Figure 16.
Design space with cooling system power density of 5 kW/kg.
Figure 17.
Design space with the highest fuel cell technology.
Figure 17.
Design space with the highest fuel cell technology.
Figure 18.
Comparison of points A for different hydrogen technologies.
Figure 18.
Comparison of points A for different hydrogen technologies.
Table 1.
Comparison of alternative energy vectors.
Table 1.
Comparison of alternative energy vectors.
| | Jet
A-1 | Near Future | 2035 |
|---|
| Gaseous H2 | Liquid H2 | Battery | Gaseous
H2 | Liquid H2 | Battery |
|---|
| Energy Density (fuel alone) (MJ/kg) | 42.8 | 120 | 120 | 9 | 120 | 120 | 20 |
| Gravimetric efficiency | 90% | 6% | 10% | 60% | 10% | 30% | 75% |
| Energy Density (fuel + tank system) (MJ/kg) | 38.52 | 7.2 | 12 | 5.4 | 12 | 35.7 | 15 |
| Vol. Mass Density (fuel alone) (kg/m³) | 775–840 | 42 | 71 | N/A | N/A | 71 | |
| Vol. Mass Density (fuel and tank system) (kg/m³) | ~775–840 | 40 | 45 | 1640 | N/A | 60 | 1500 |
| Vol. Energy Density (fuel and tank system) (MJ/dm³) | ~33.17–35.95 | 4.9 | 5.4 | 14.76 | 5.5 | 7.2 | 30 |
Table 2.
Comparison of Fuel Cell Technologies. Adapted with permission from Ref. [
40]. 2023, Energy.gov.
Table 2.
Comparison of Fuel Cell Technologies. Adapted with permission from Ref. [
40]. 2023, Energy.gov.
| Fuel Cell Type | Common Electrolyte | Operating
Temperature | Typical Stack Size | Electrical Efficiency (LHV) |
|---|
Polymer
Electrolyte
Membrane
(PEM) | Perfluorosulfonic acid | <120 °C | <1 kW–100 kW | 60% direct H2;
40%
reformed fuel |
Alkaline
(AFC) | Aqueous potassium
hydroxide soaked
in a porous matrix
or alkaline polymer
membrane | <100 °C | 1–100 kW | 60% |
Phosphoric
Acid
(PAFC) | Phosphoric acid soaked in a porous matrix or imbibed in a polymer membrane | 150–200 °C | 5–400 kW,
100 kW module
(liquid PAFC);
<10 kW (polymer
membrane) | 40% |
Molten
Carbonate
(MCFC) | Molten lithium, sodium,
and/or potassium
carbonates, soaked in a
porous matrix | 600–700 °C | 300 kW–3 MW,
300 kW module | 50% |
Solid
Oxide
(SOFC) | Yttria stabilized
zirconia | 500–1000 °C | 1 kW–2 MW | 60% |
Table 3.
Cruise, diversion, and holding altitudes as per aircraft type.
Table 3.
Cruise, diversion, and holding altitudes as per aircraft type.
| Range (km) | <1000 | 1000–8000 | >8000 |
|---|
| PAX allowance (kg) | 90 | 110 | 150 |
Table 4.
Cruise, diversion, and holding altitudes as per aircraft type.
Table 4.
Cruise, diversion, and holding altitudes as per aircraft type.
| Aeroplane Type | Cruise Altitude (ft) | Diversion Altitude (ft) | Holding Altitude (ft) |
|---|
| General aviation | 5000 | 5000 | 1500 |
| Commuter | 20,000 | 10,000 | 1500 |
| Business, Narrow body, Widebody | 35,000 | 25,000 | 1500 |
Table 5.
Percentage of contingency fuel, length of diversion, and holding time as per aircraft type.
Table 5.
Percentage of contingency fuel, length of diversion, and holding time as per aircraft type.
| Airplane Type | Contingency Fuel (%) | Diversion Length (NM) | Holding Time (min) |
|---|
| General aviation | 0 | 0 | 30 |
| Commuter | 0 | 0 | 30 |
| Business, Narrow body | 5 | 200 | 30 |
| Widebody | 3 | 200 | 30 |
Table 6.
Model validation software inputs.
Table 6.
Model validation software inputs.
| Airplane Type | Nb PAX | Cruise Speed (km/h) | Range (km) |
|---|
| Socata TB20 | 4.5 | 280 | 1300 |
| H55-Bristell Energic | 2 | 130 | 130 |
Table 7.
Model validation software outputs for a conventional propeller engine-powered aircraft with Socata TB20 specifications.
Table 7.
Model validation software outputs for a conventional propeller engine-powered aircraft with Socata TB20 specifications.
| Parameter | Value |
|---|
| Max. power | 192 kW |
| Mission fuel | 161 kg |
| Reserve fuel | 16 kg |
| Total fuel | 177 kg |
| Mission energy | 1924 kWh |
| Reserve energy | 194 kWh |
| MTOW | 1478 kg |
| OWE | 896 kg |
| Payload | 405 kg |
| PK/MTOW minimum | 2.6 pk/kg |
| PK/MTOW | 3.96 pk/kg |
| PK/Energy | 2.76 pk/kWh |
| Max. distance vs. PK/M | 2573 km |
Table 8.
Model validation software outputs for a battery-powered electroprop with H55-Bristell Energic specifications.
Table 8.
Model validation software outputs for a battery-powered electroprop with H55-Bristell Energic specifications.
| Parameter | Value |
|---|
| Max. power | 102 kW |
| Cruise power | 29 kW |
| Battery mass | 230 kg |
| Mission energy | 32 kWh |
| Reserve energy | 14 kWh |
| MTOW | 866 kg |
| OEW | 686 kg |
| Payload | 180 kg |
| PK/MTOW minimum | 0.26 pk/kg |
| PK/MTOW | 0.30 pk/kg |
| PK/Energy | 5.64 pk/kWh |
| Max. distance vs. PK/M | 153 km |
Table 9.
Specifications comparison of selected airplanes with manufacturer data.
Table 9.
Specifications comparison of selected airplanes with manufacturer data.
| Airplane Type | Max. Power (kW) | MTOW (kg) | OEW (kg) |
|---|
| Real: Socata TB20 | 186 | 1400 | 900 |
Model: Socata TB20
(deviation from real) | 192 (+3%) | 1478 (+6%) | 896 (−1%) |
| Real: H55-Bristell Energic | 100 | 850 | 660 |
Model: H55-Bristell Energic
(deviation from real) | 102 (+2%) | 866 (+2%) | 686 (+4%) |
| Disclaimer/Publisher’s Note: The statements, opinions and data contained in all publications are solely those of the individual author(s) and contributor(s) and not of MDPI and/or the editor(s). MDPI and/or the editor(s) disclaim responsibility for any injury to people or property resulting from any ideas, methods, instructions or products referred to in the content. |
© 2023 by the authors. Licensee MDPI, Basel, Switzerland. This article is an open access article distributed under the terms and conditions of the Creative Commons Attribution (CC BY) license (https://creativecommons.org/licenses/by/4.0/).

 ,
, 


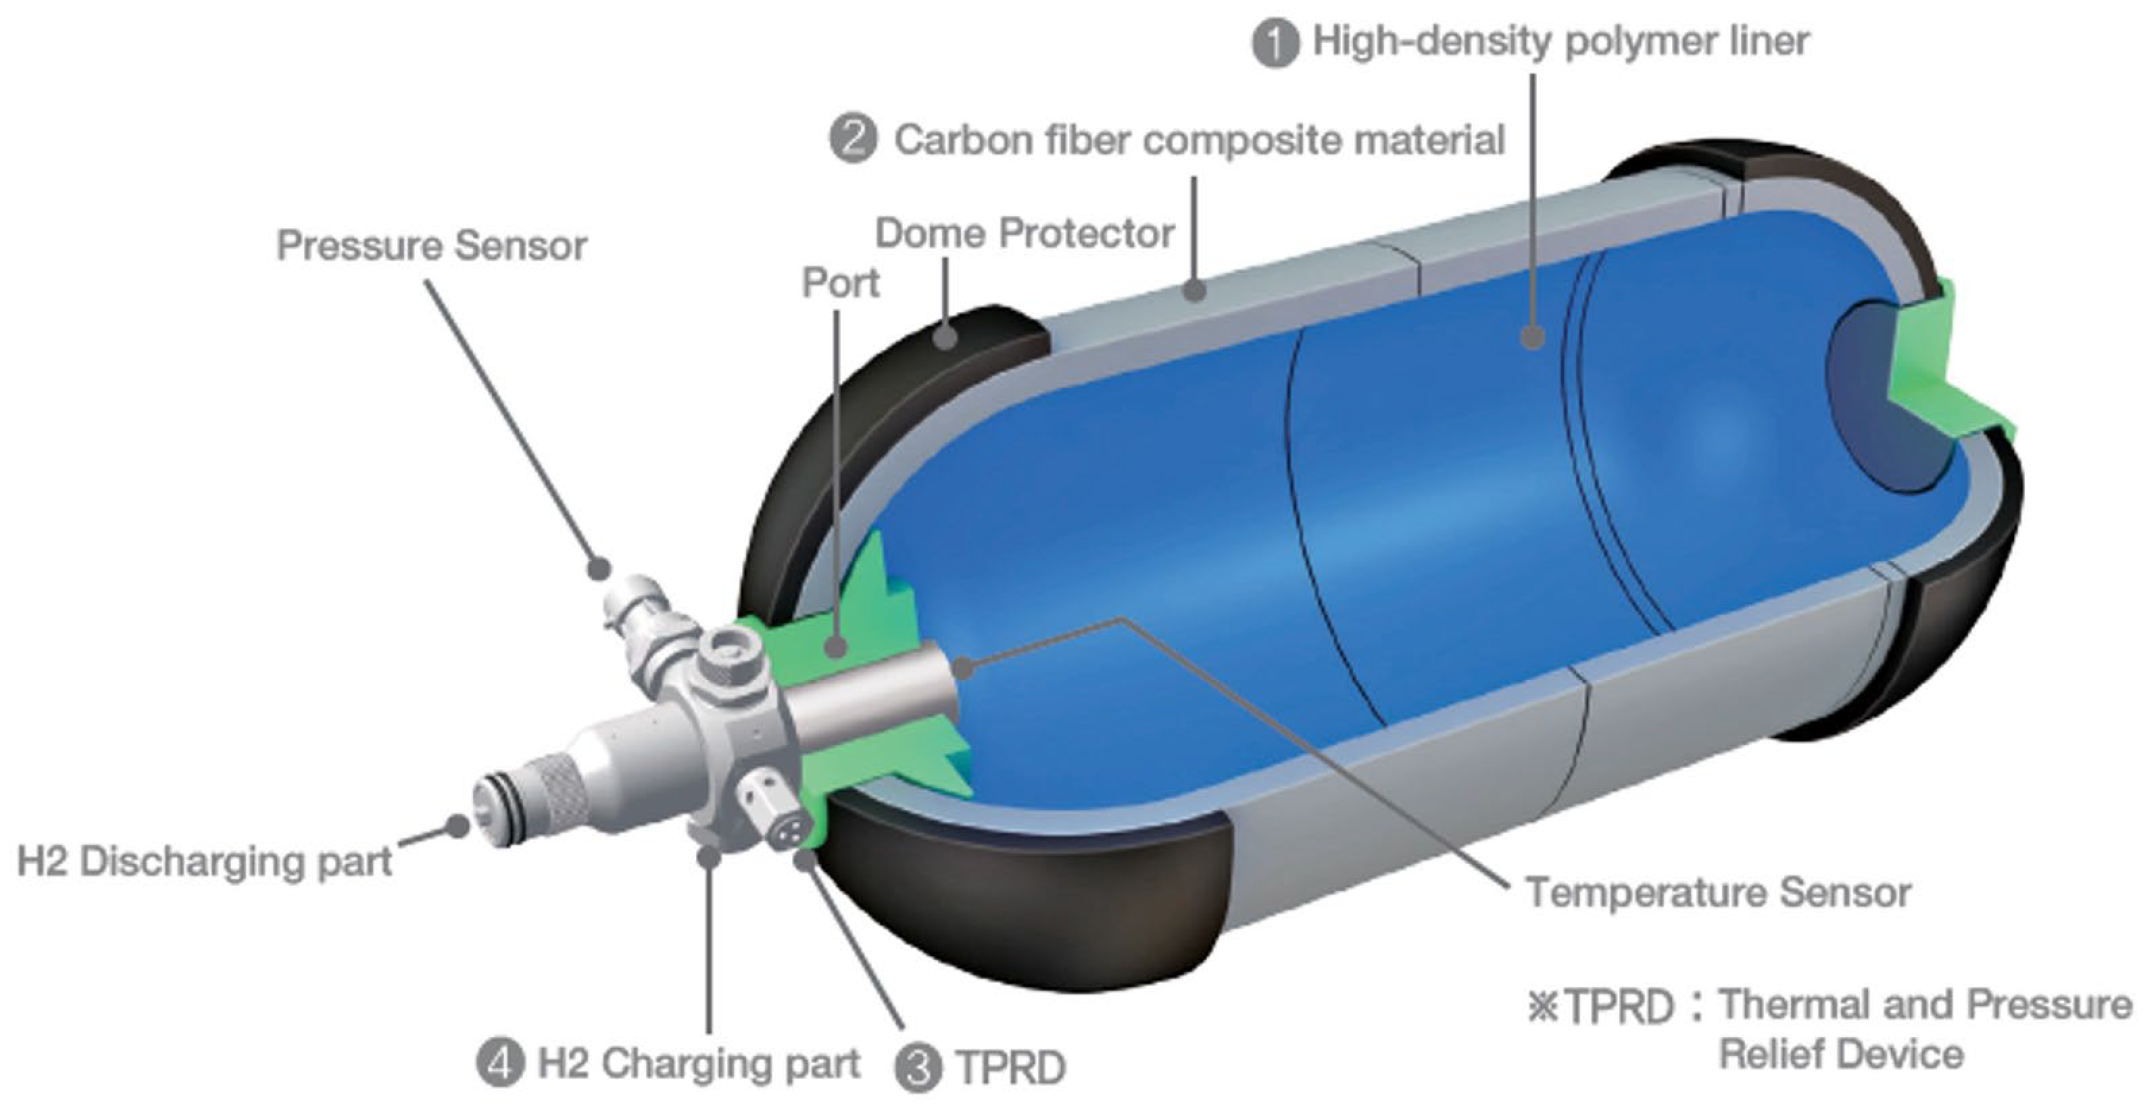
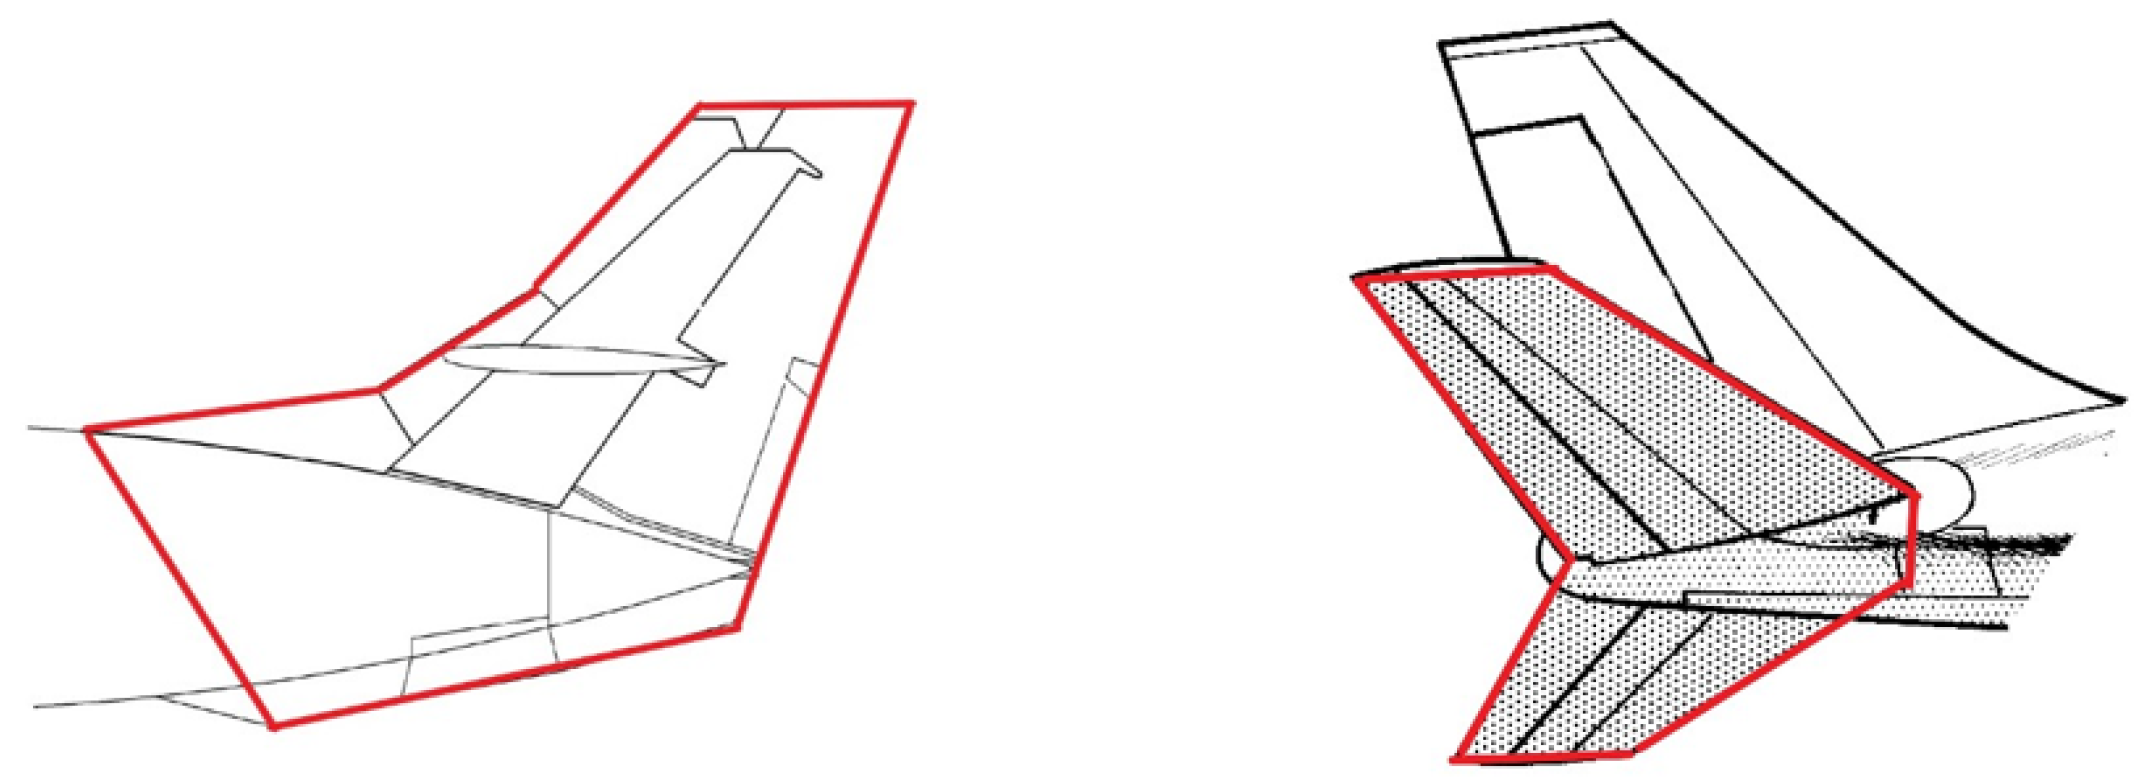
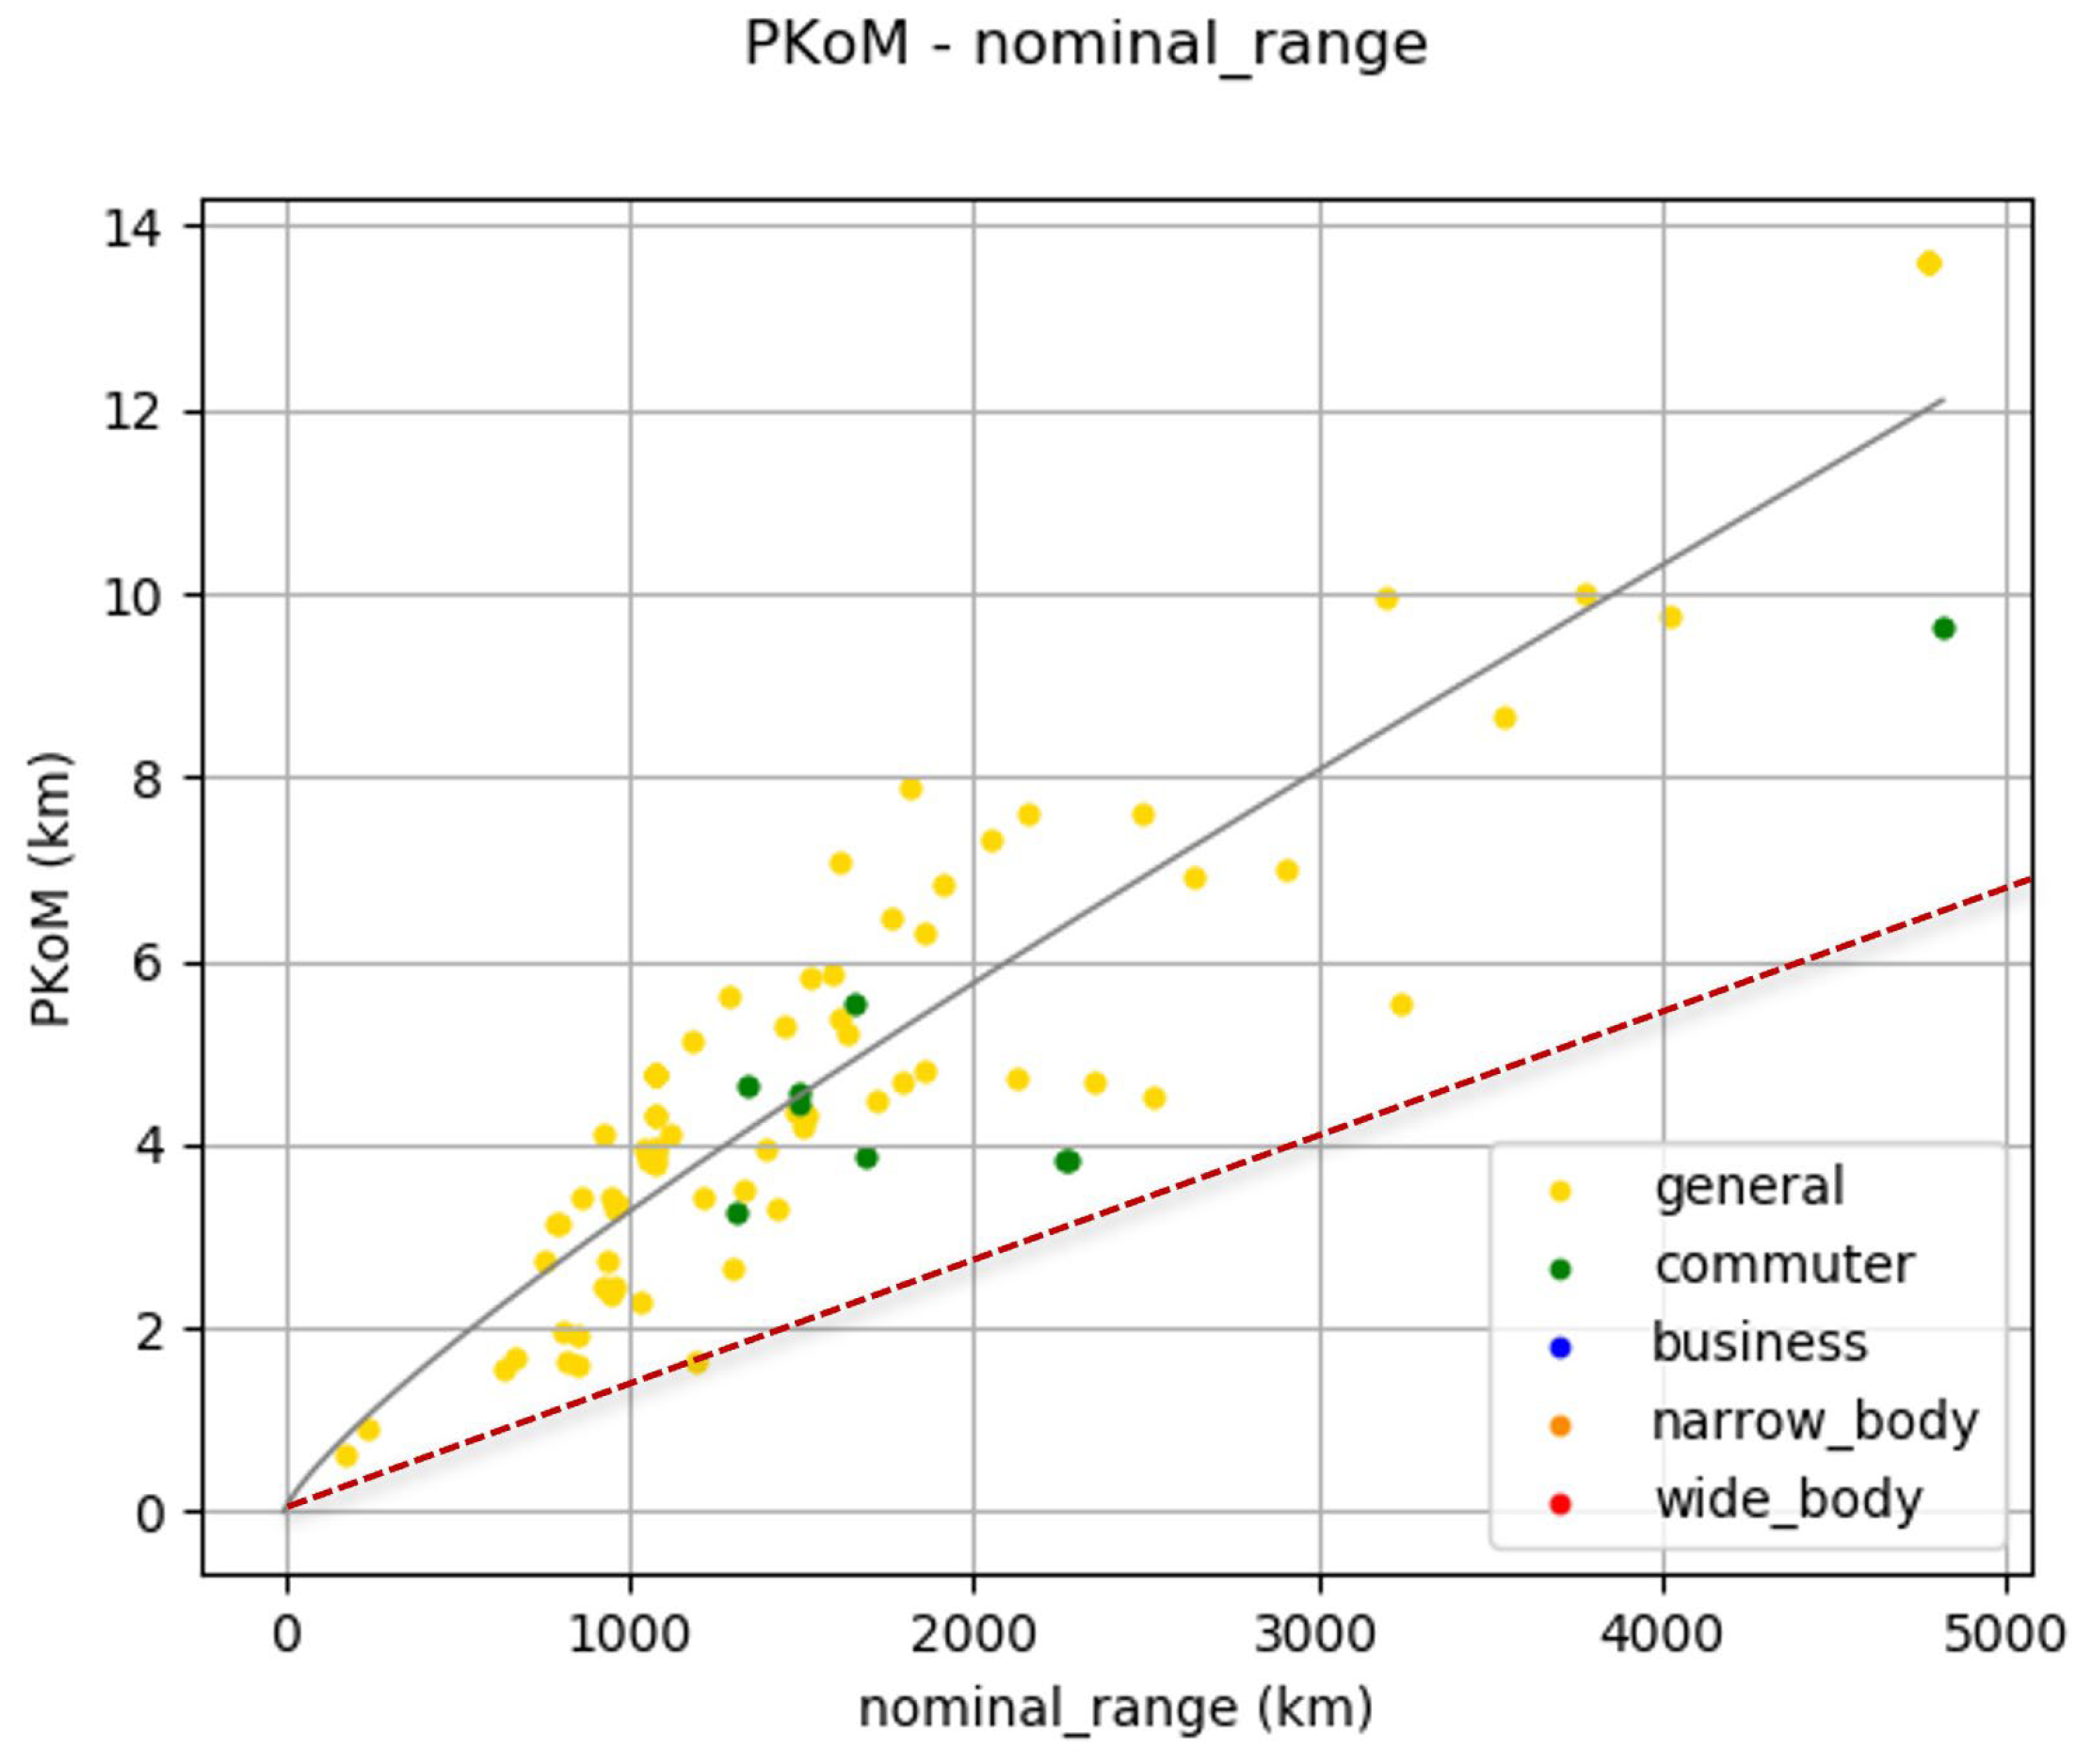
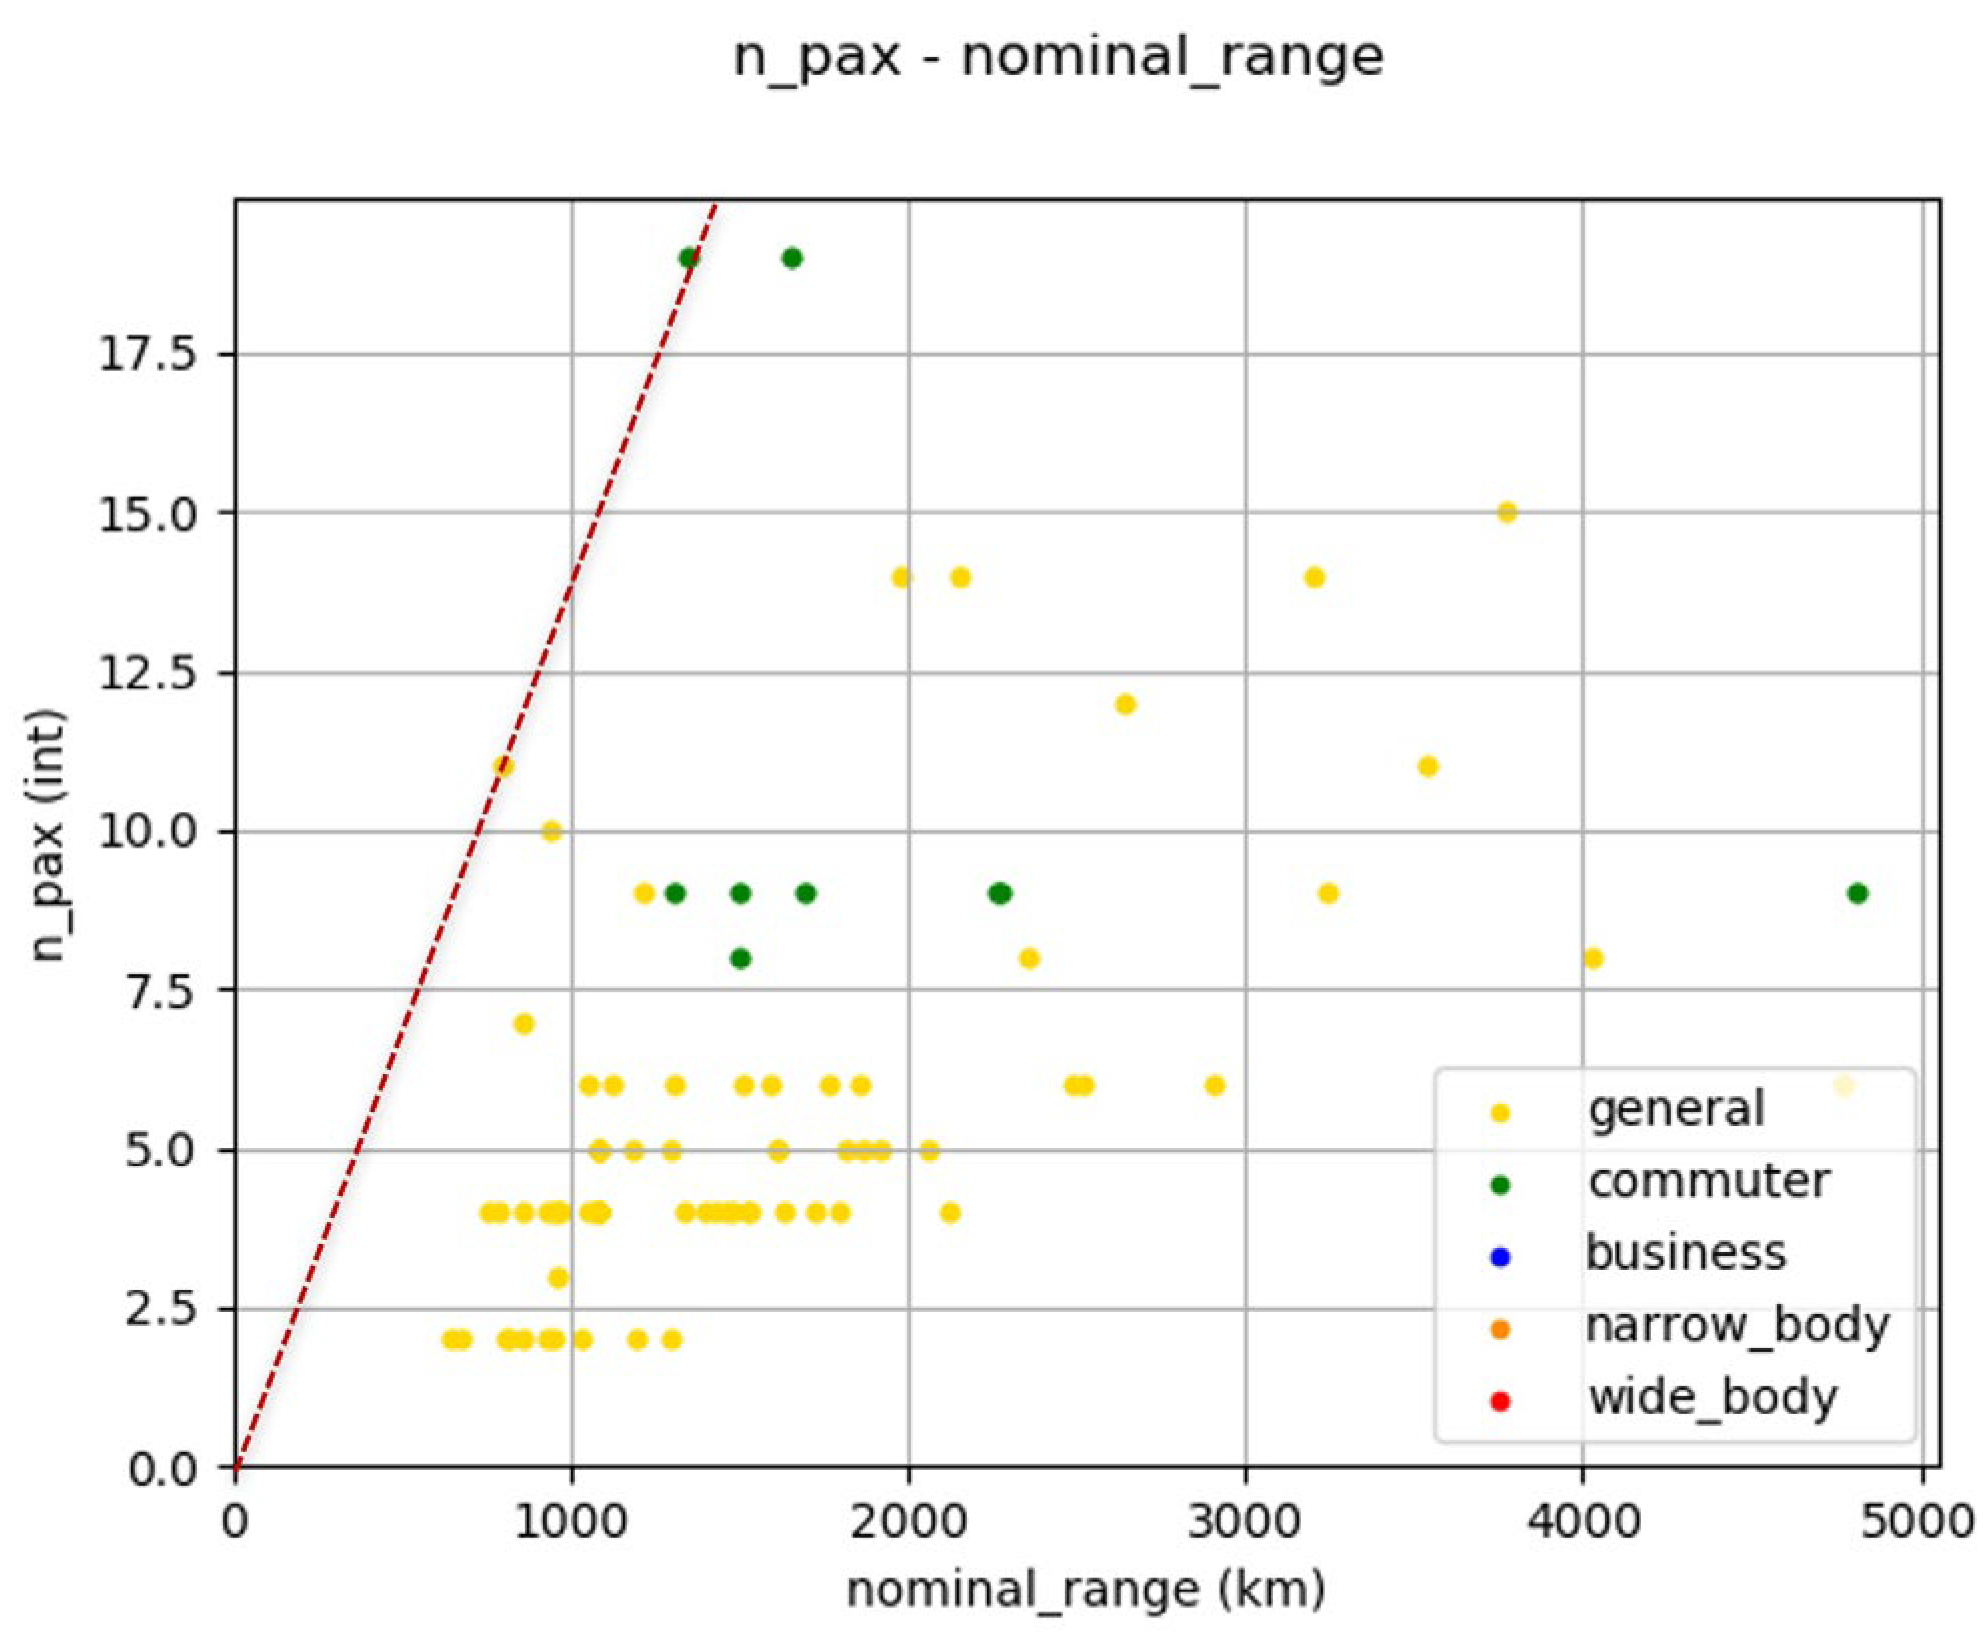
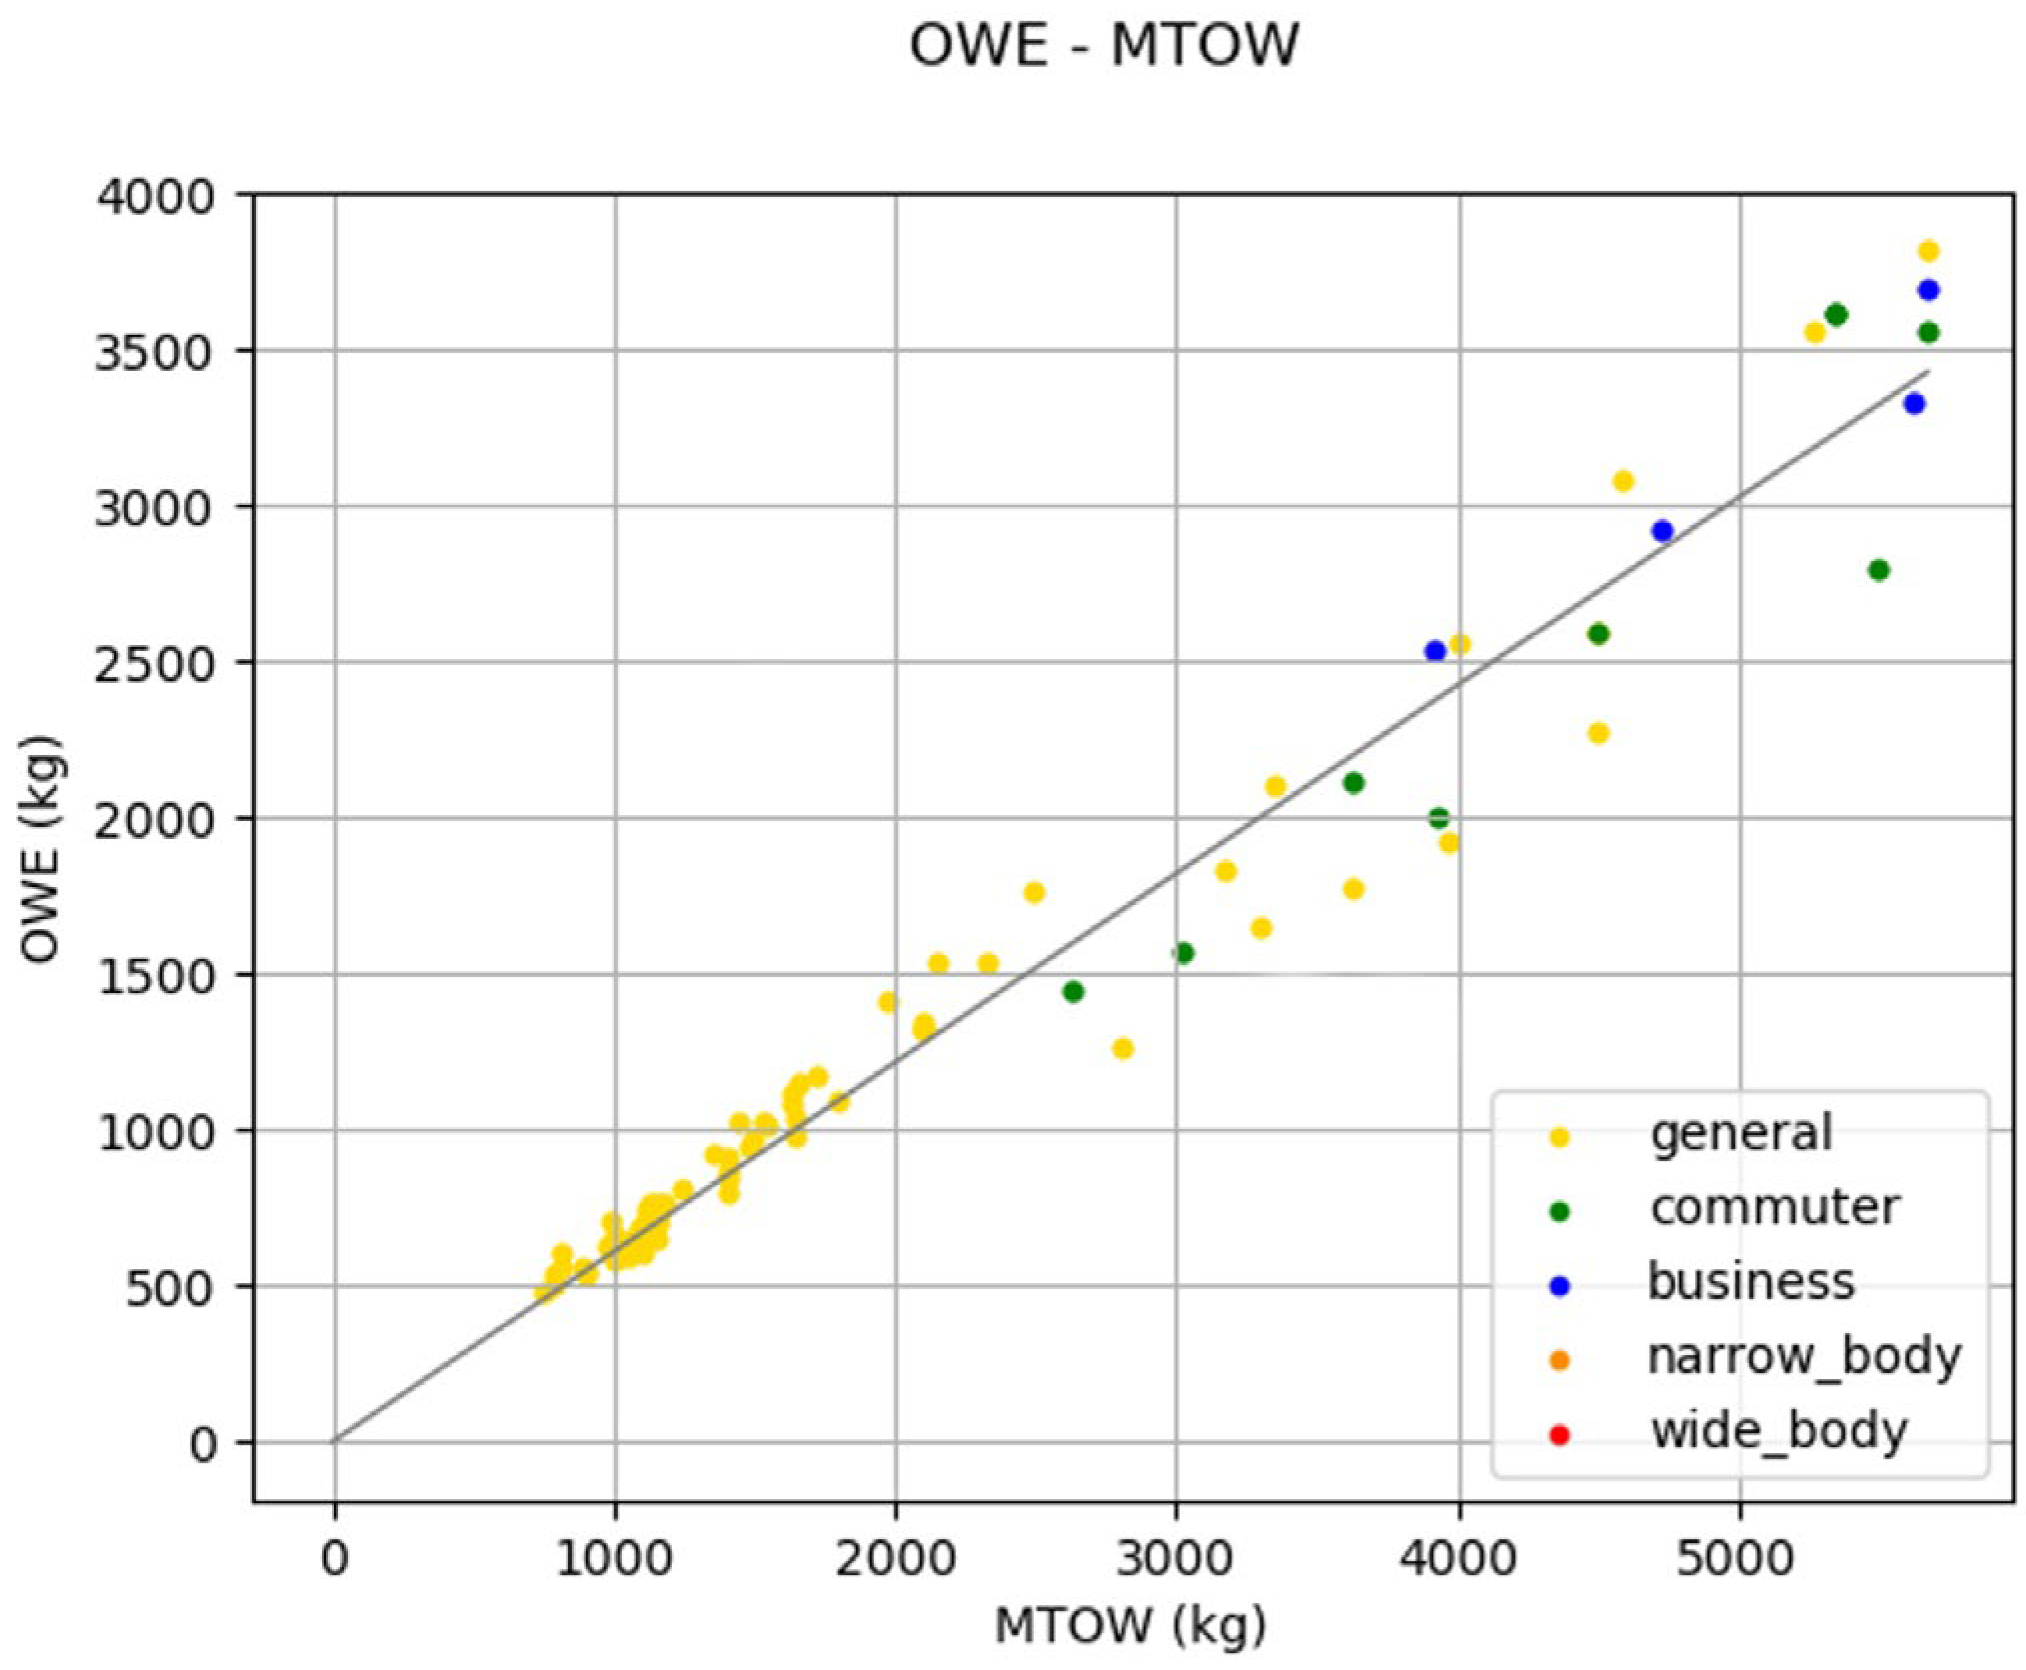
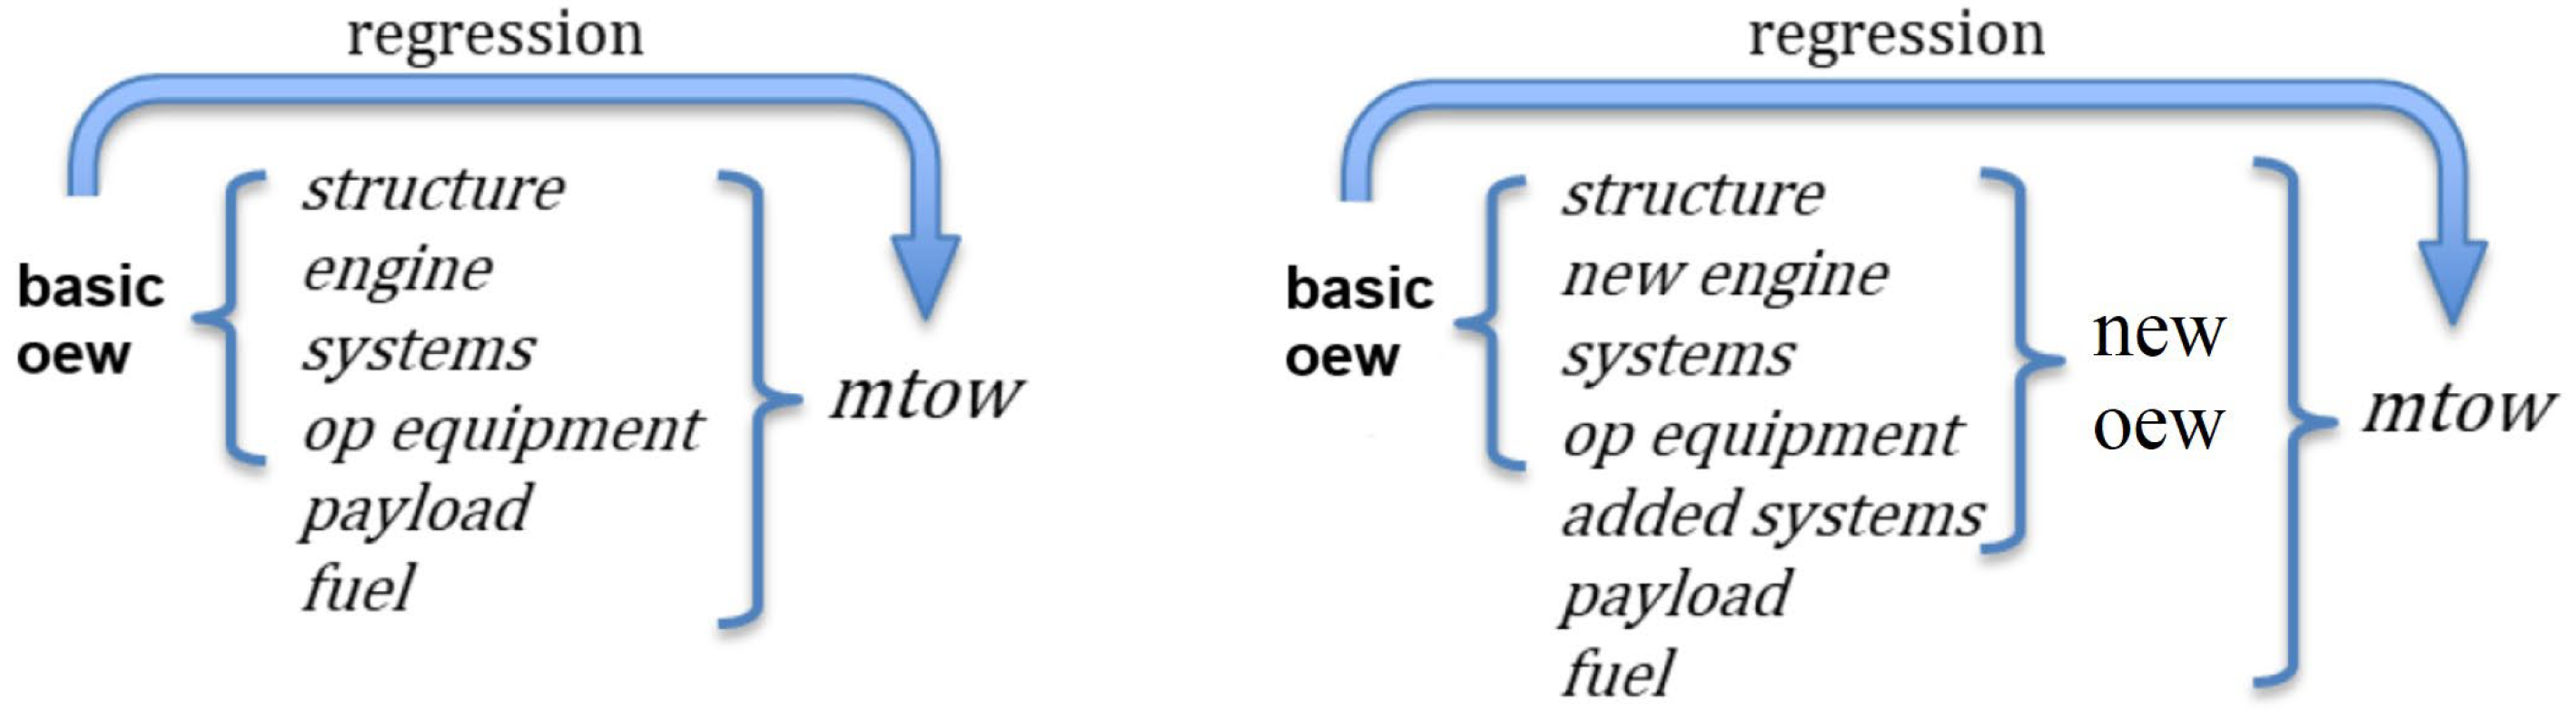
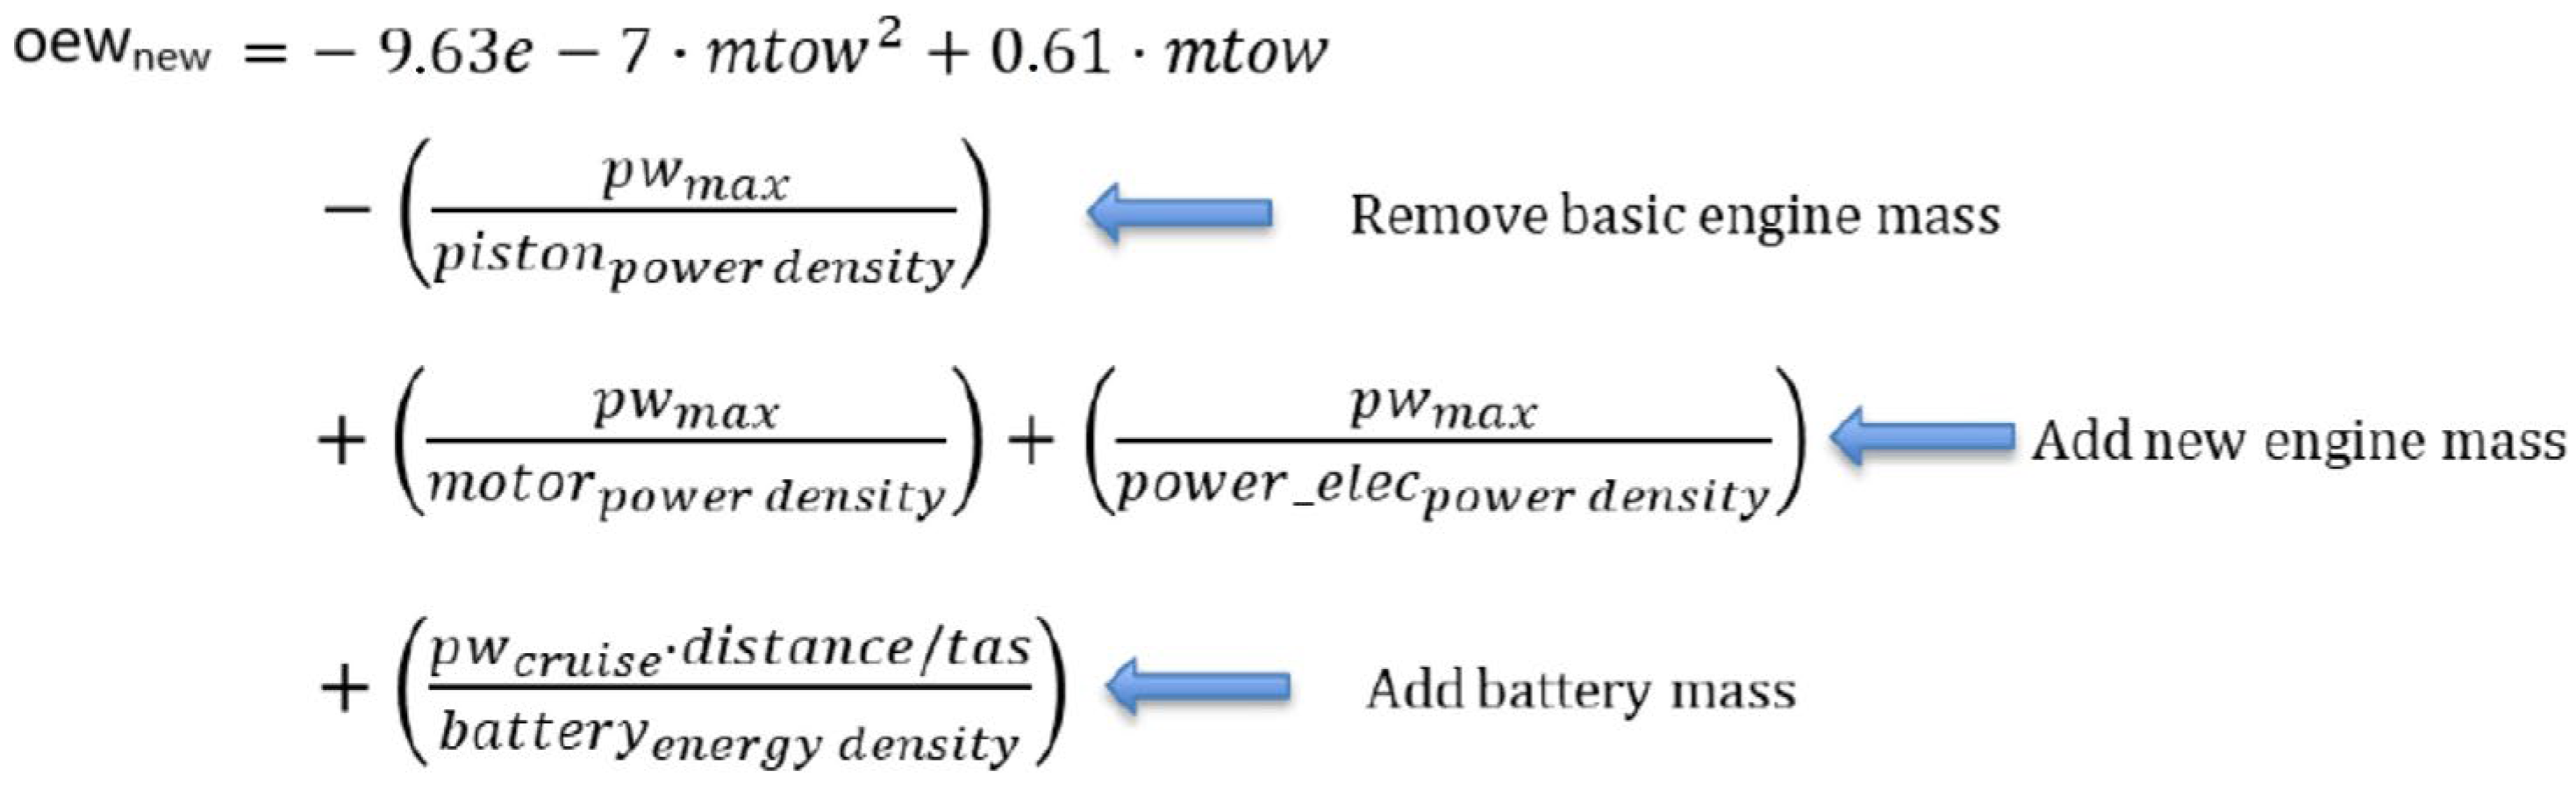
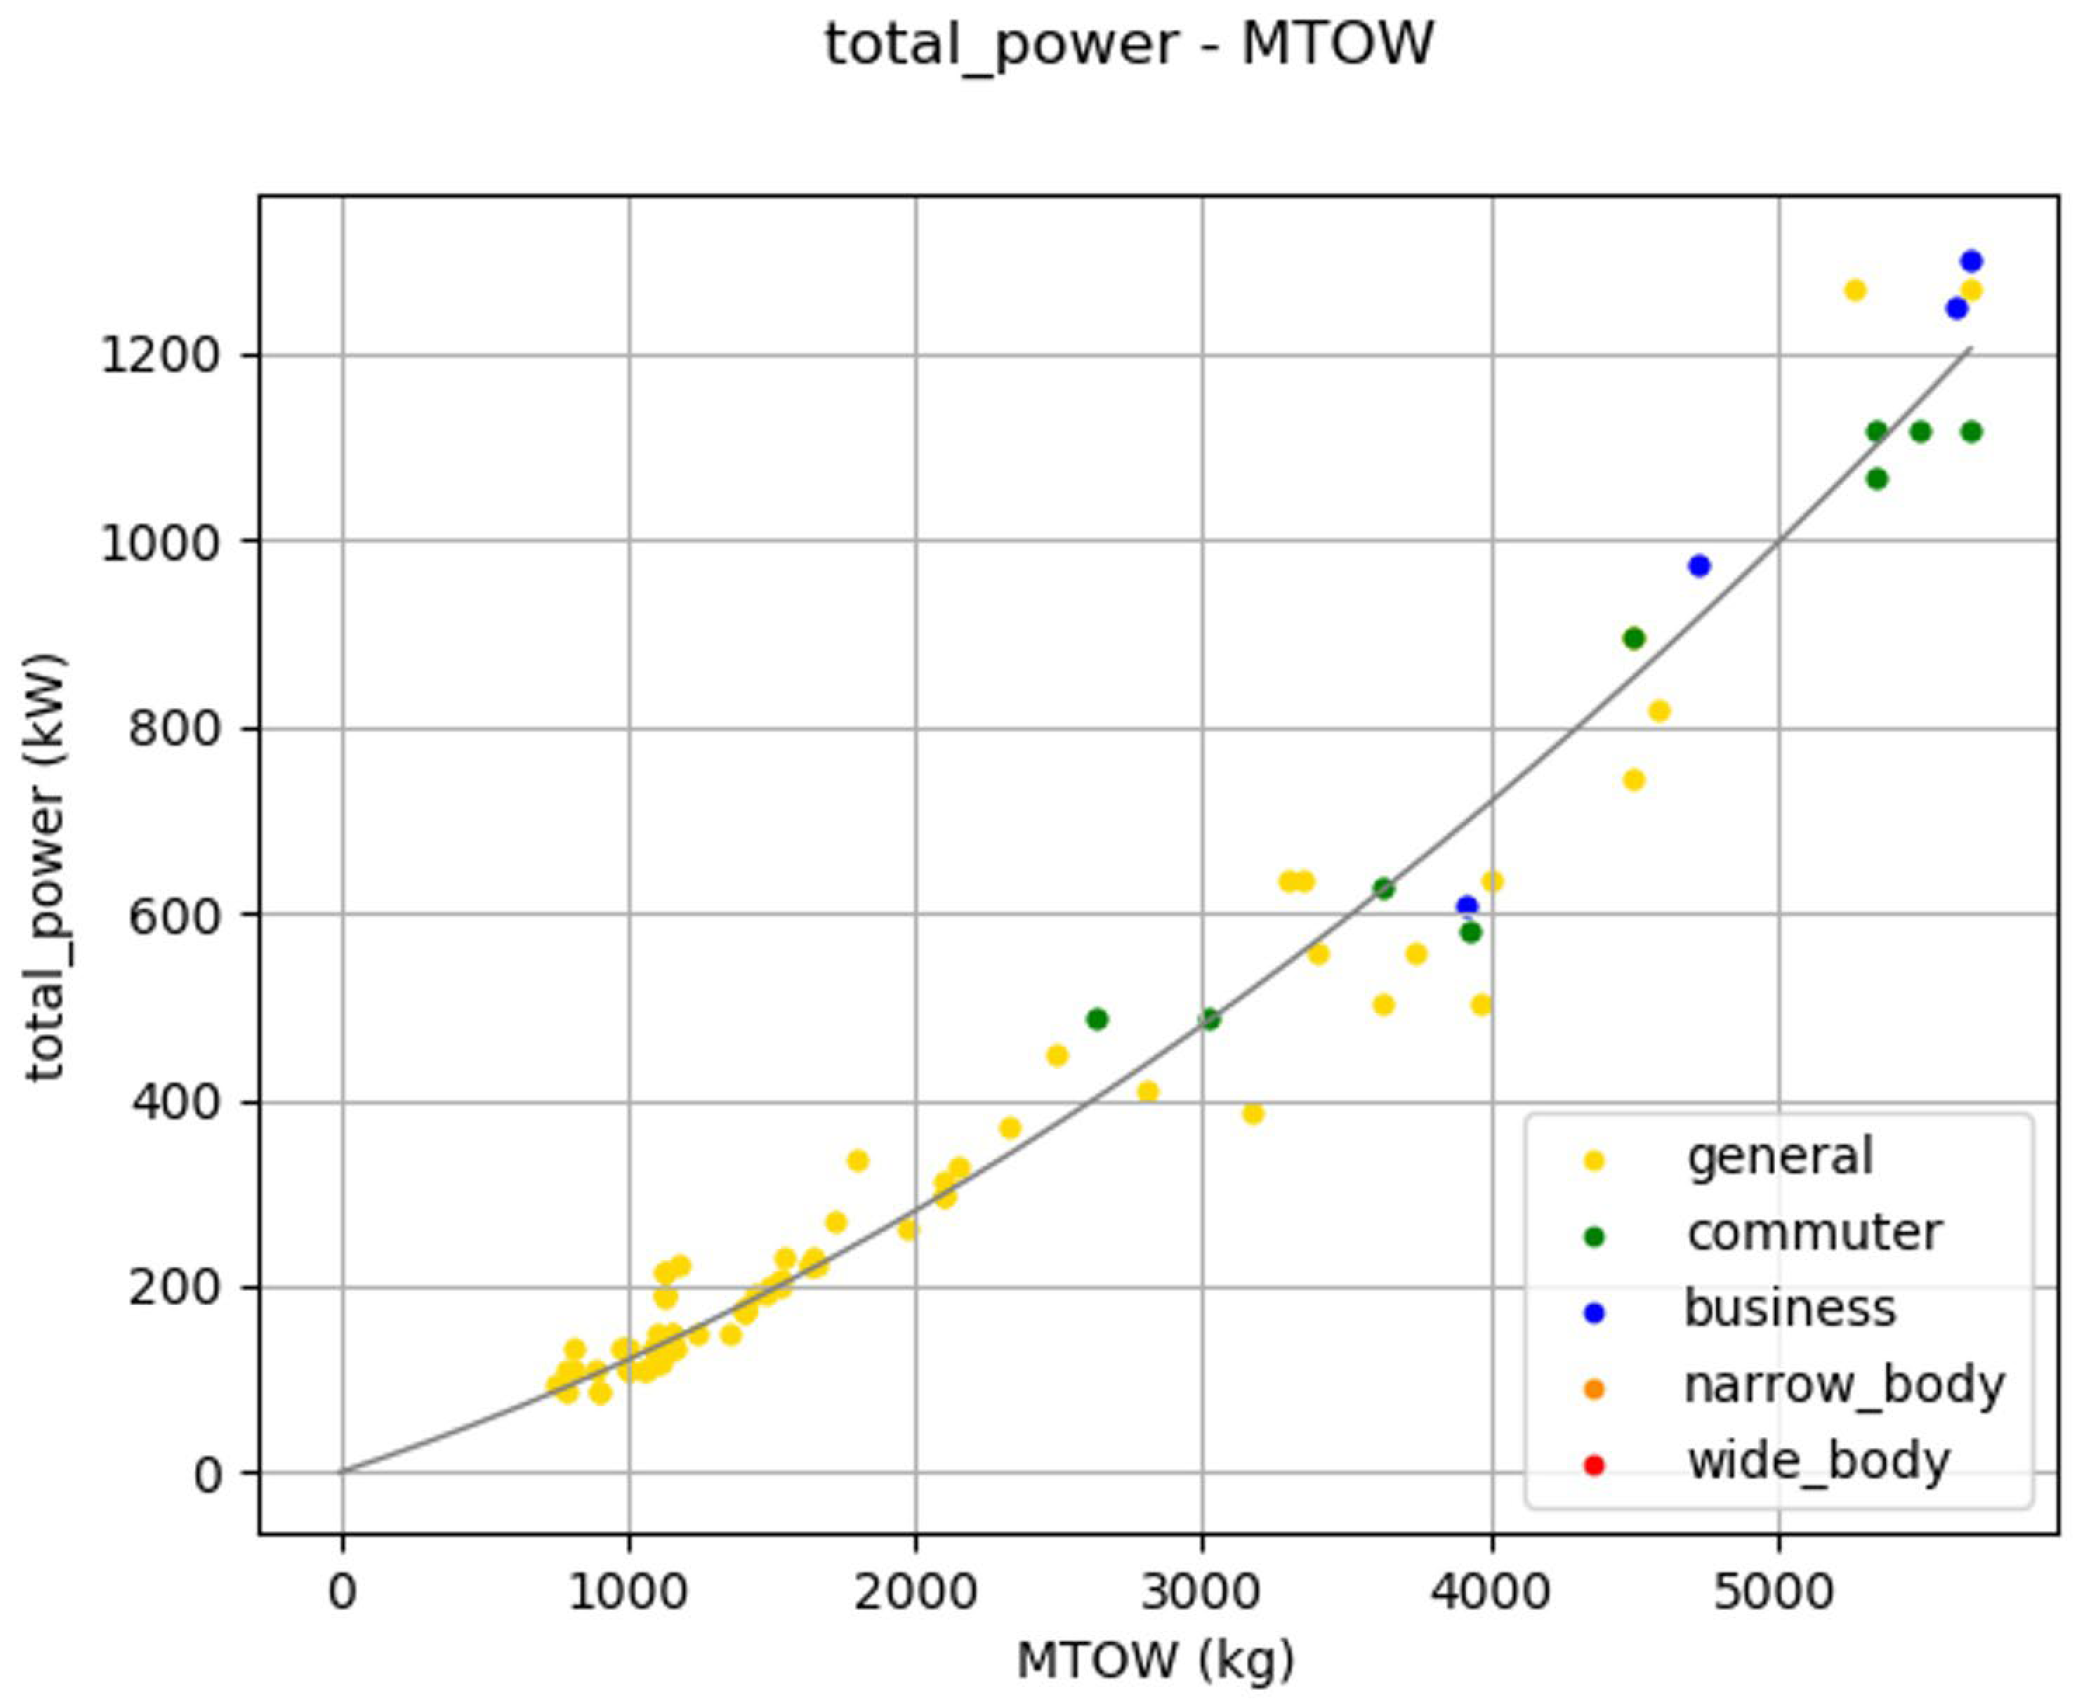
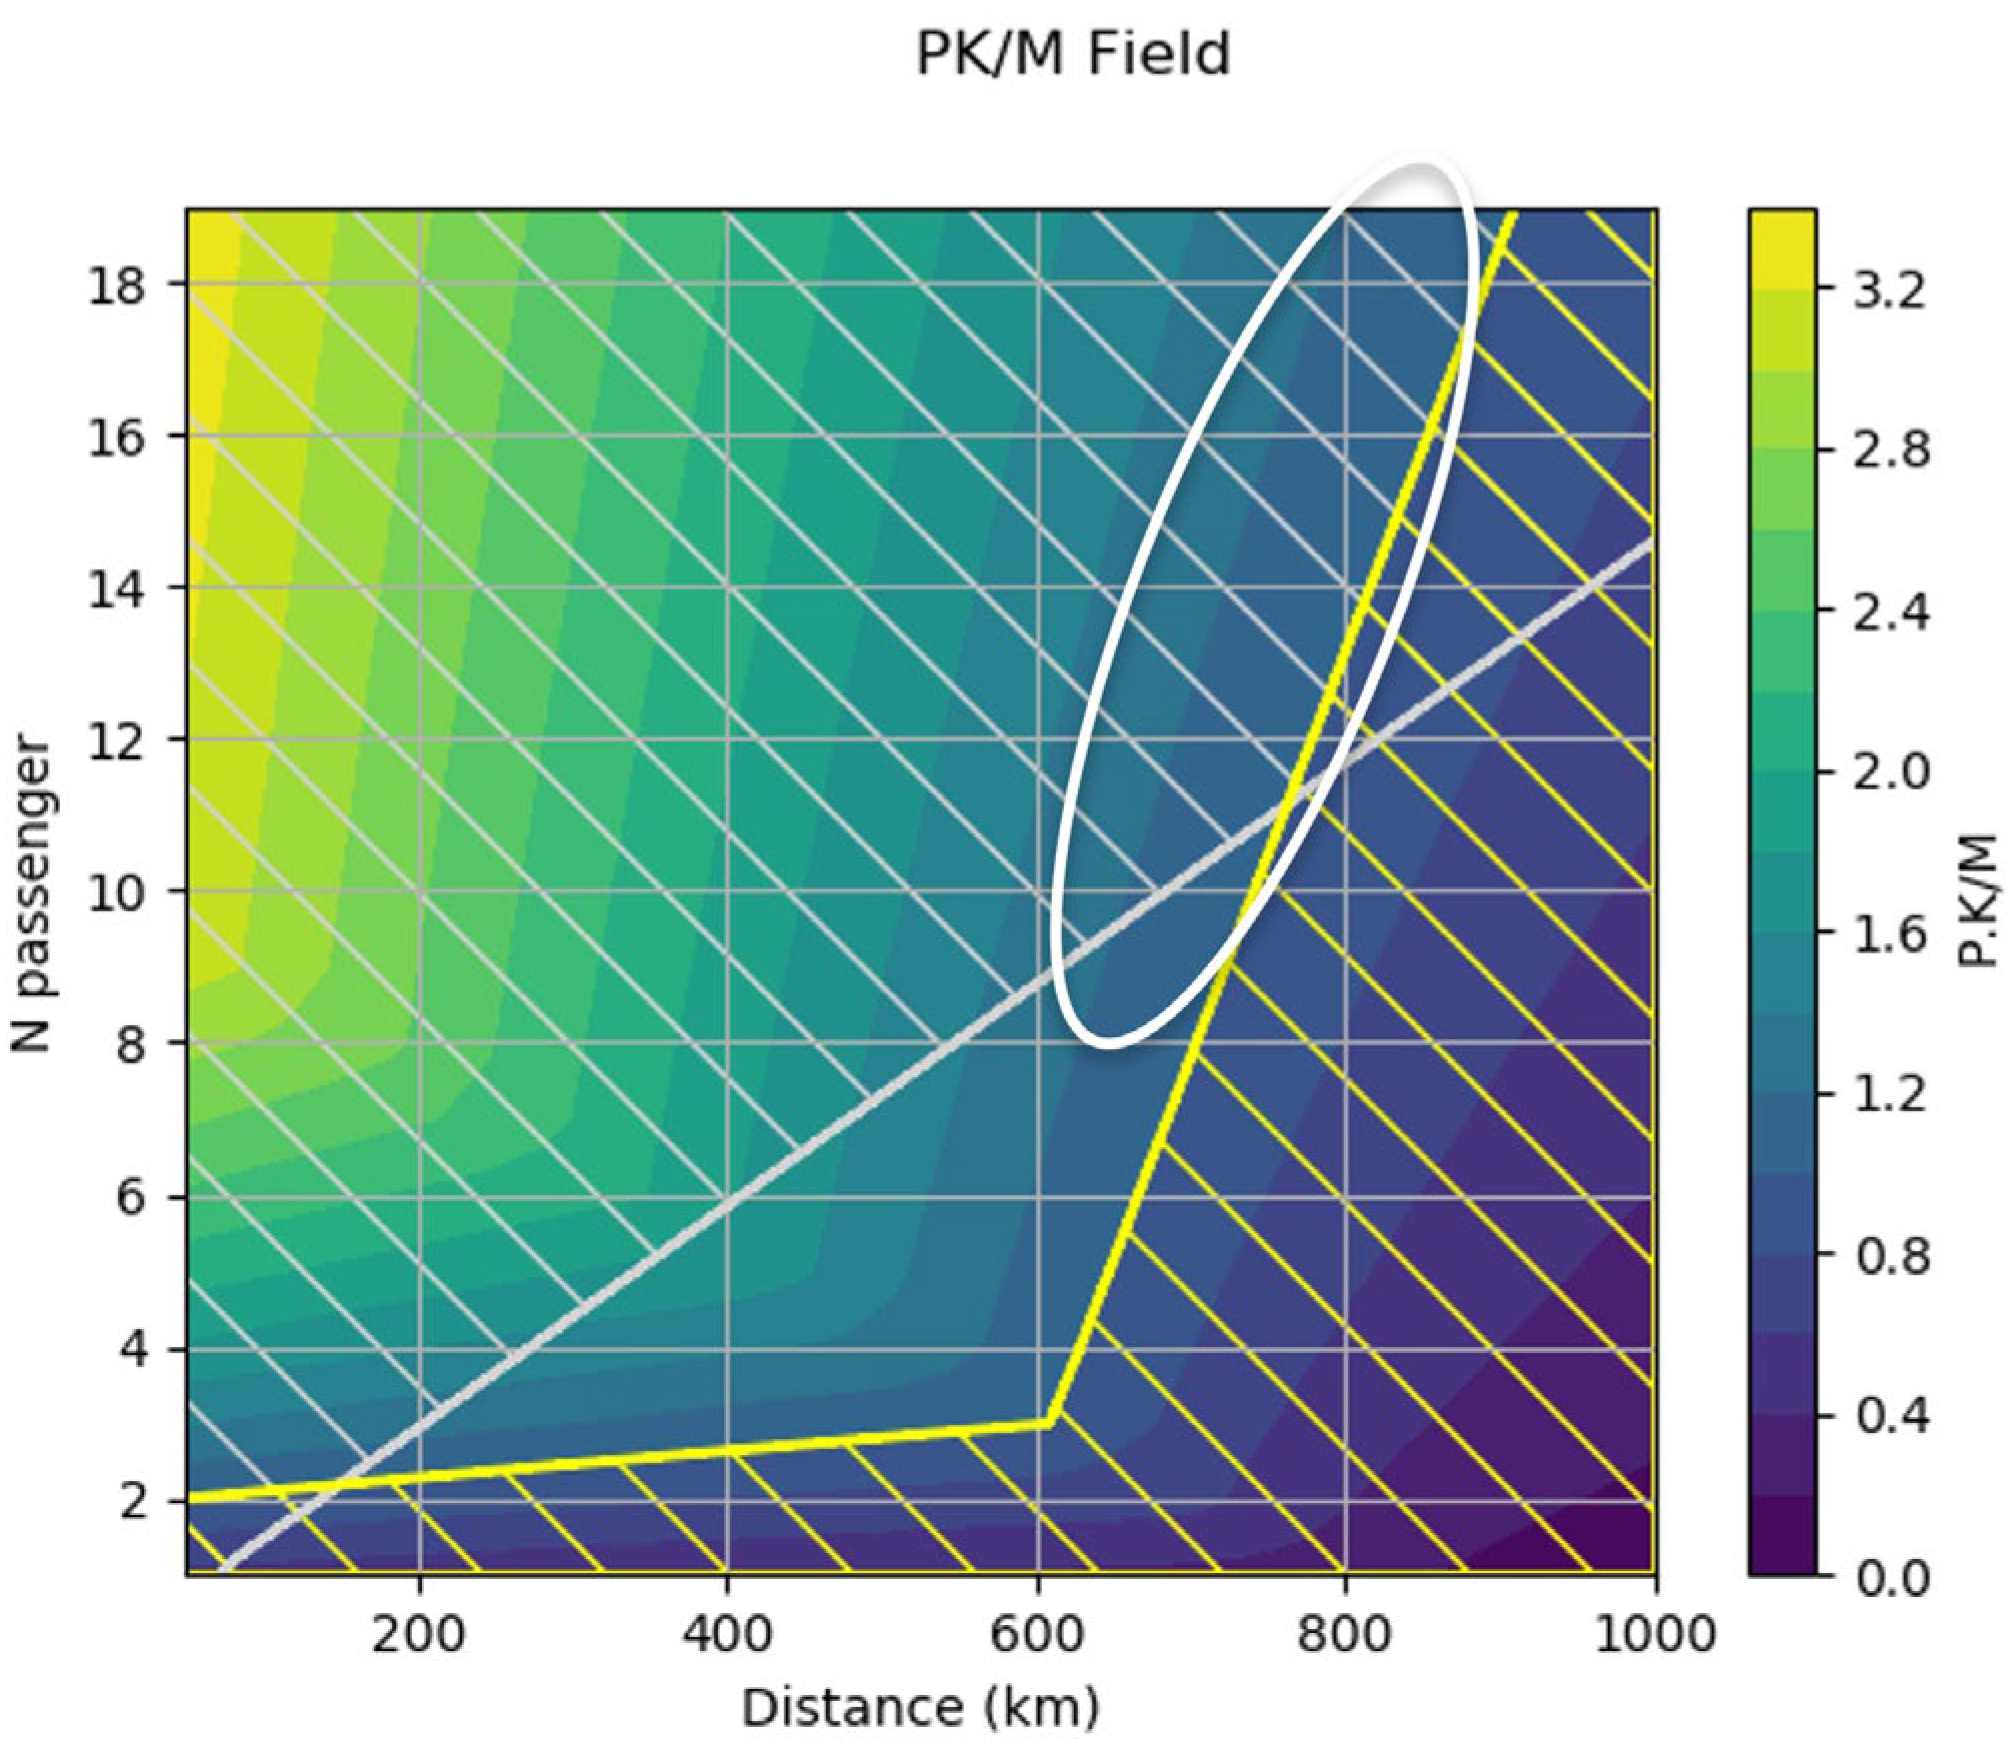
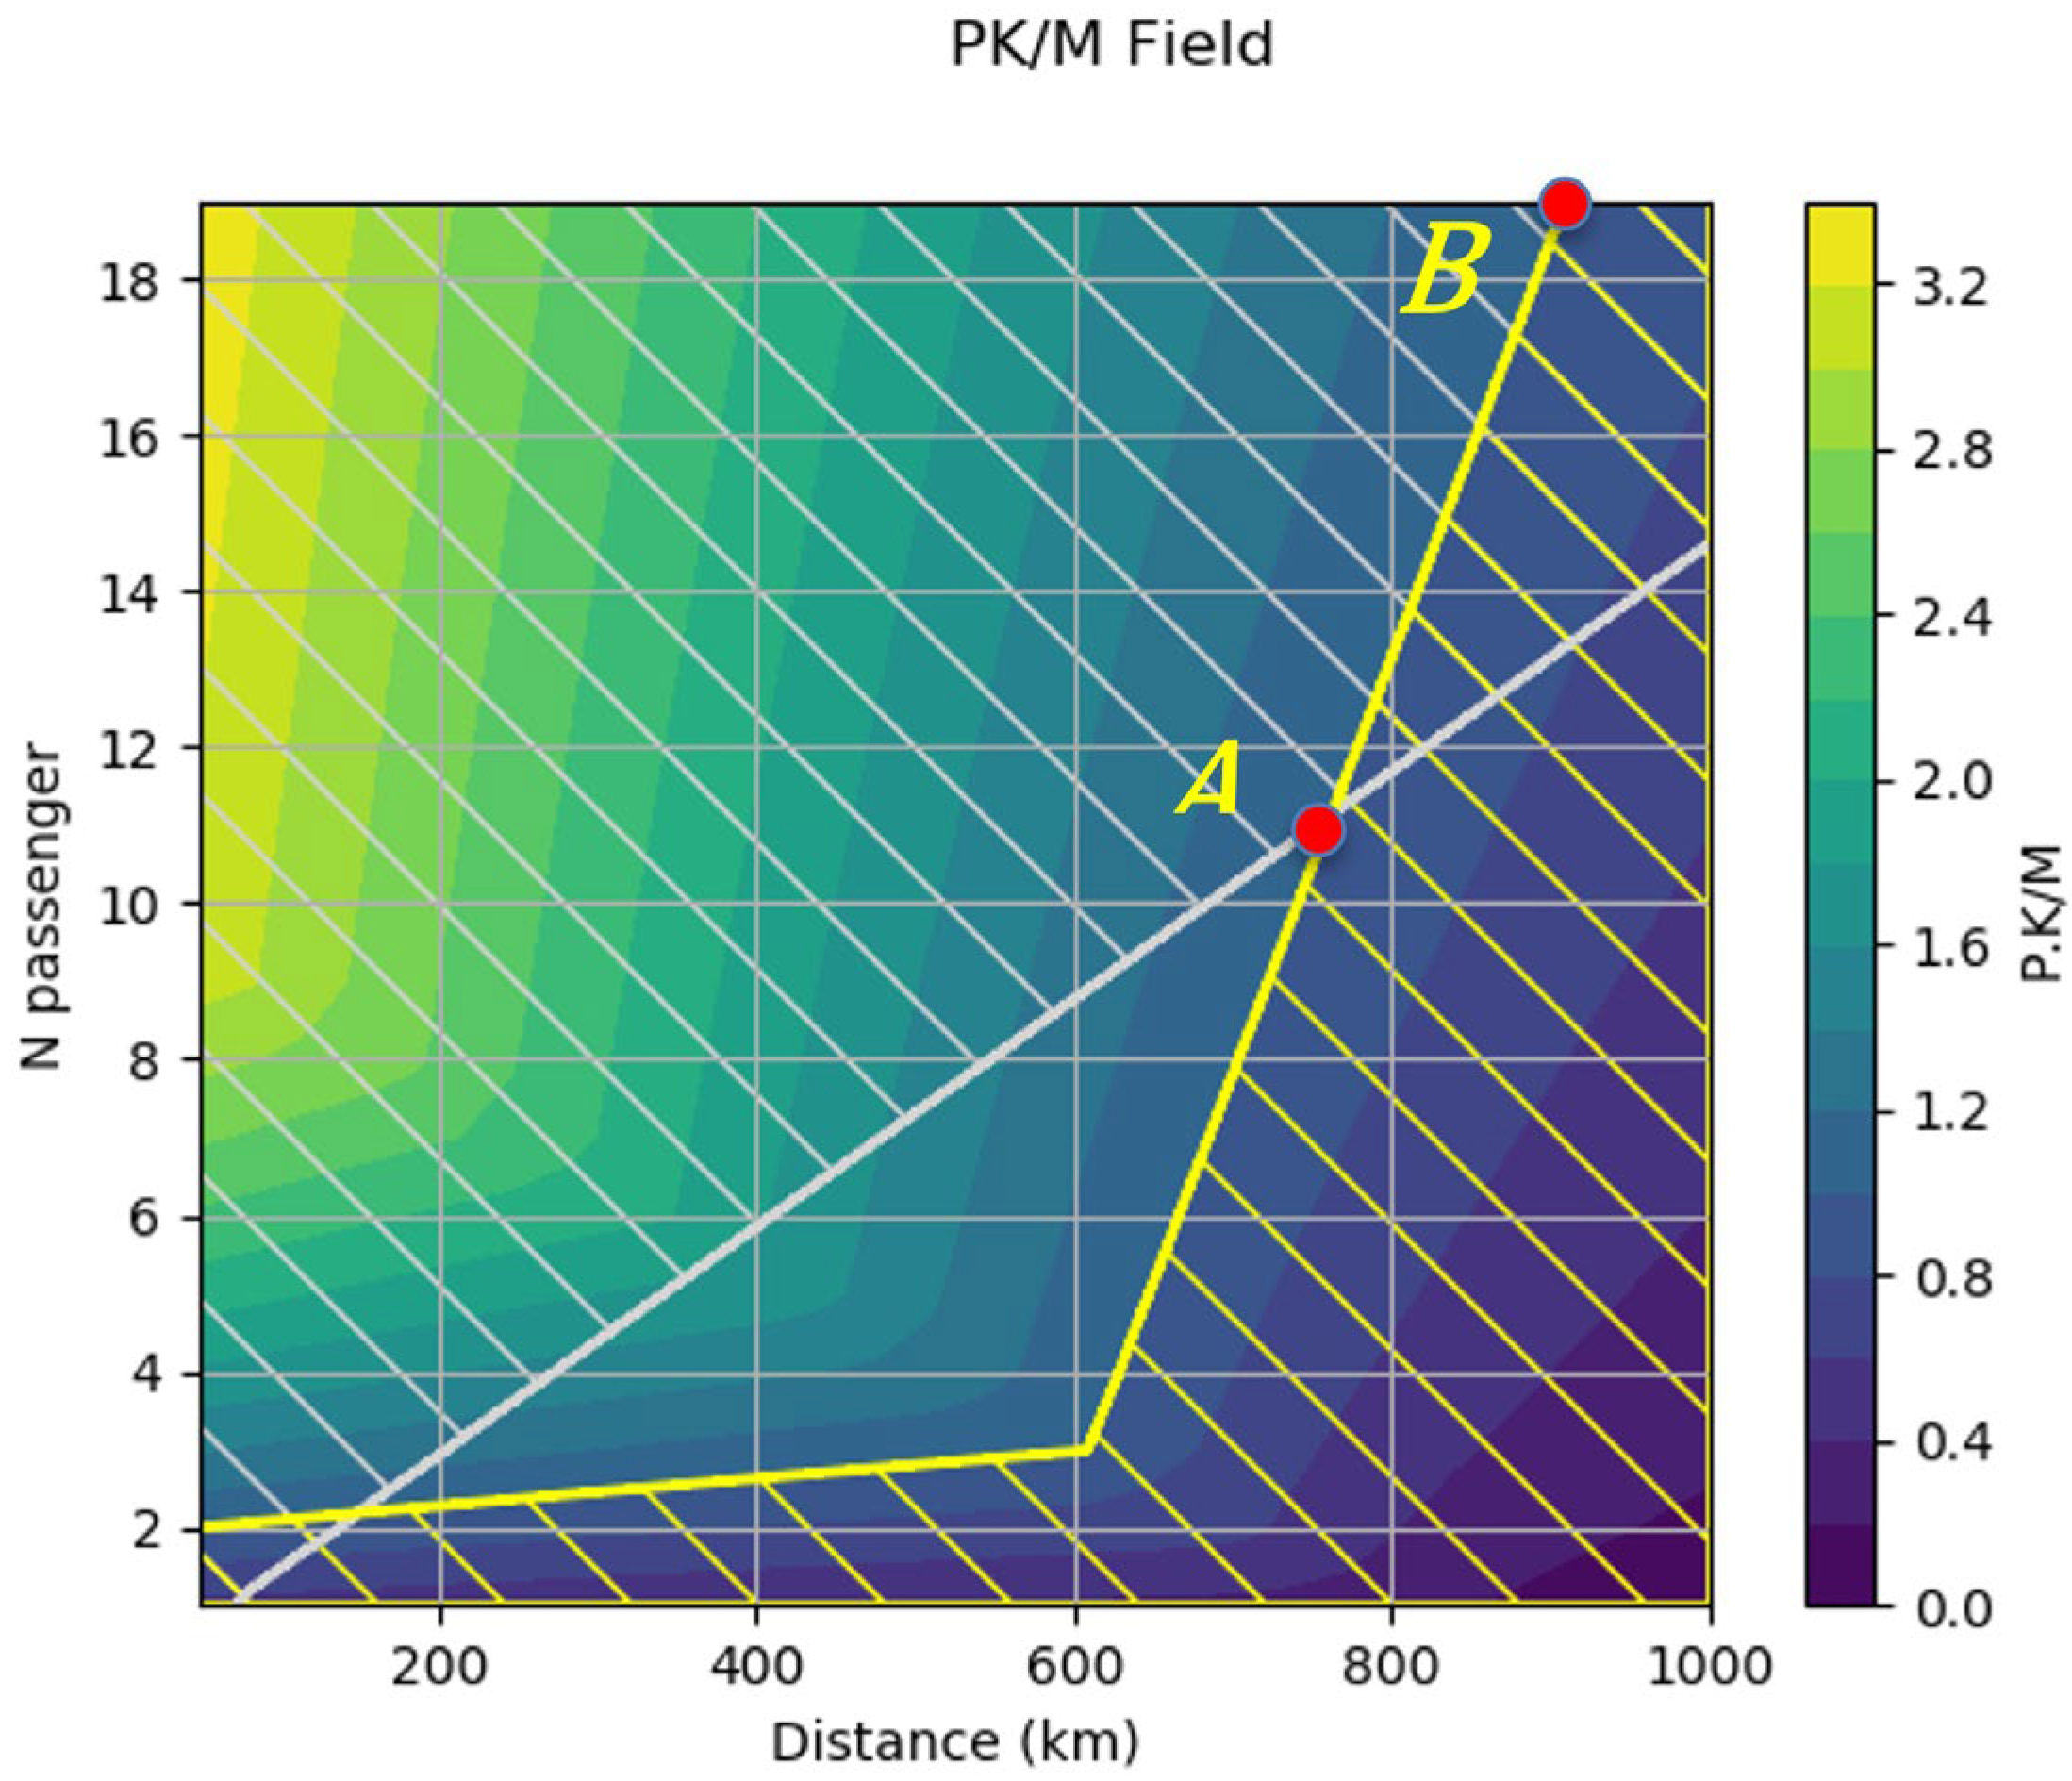
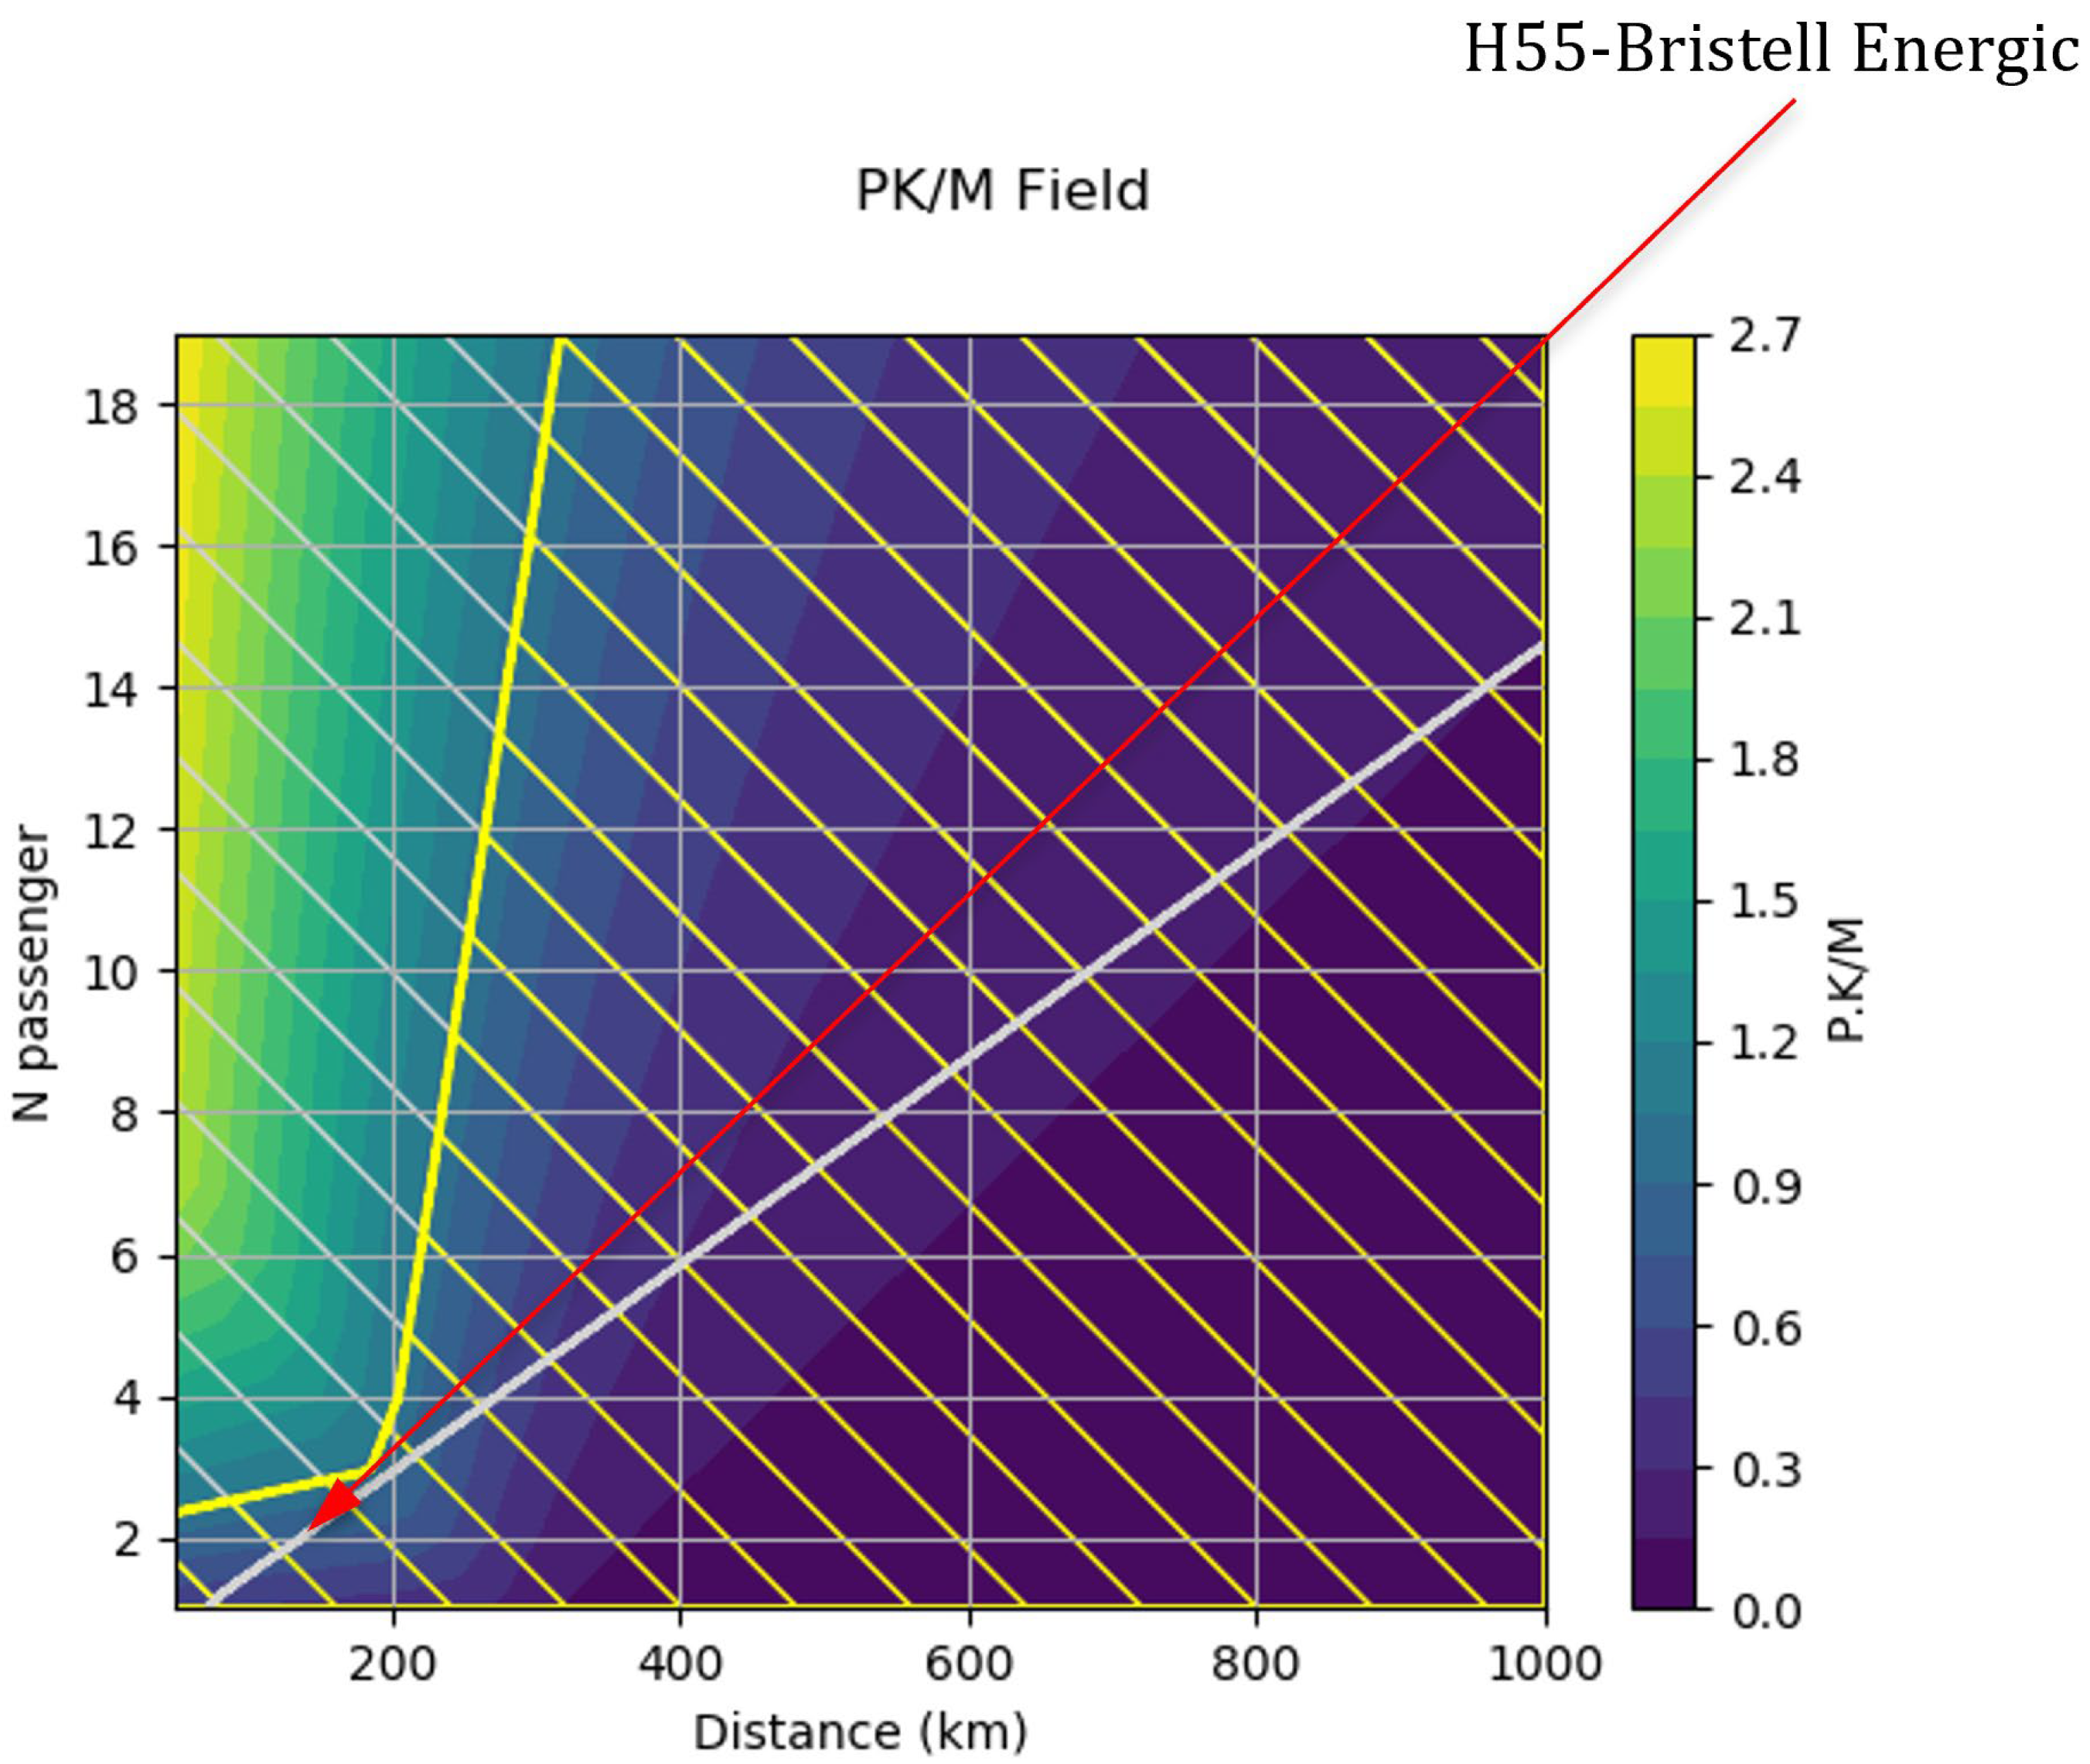
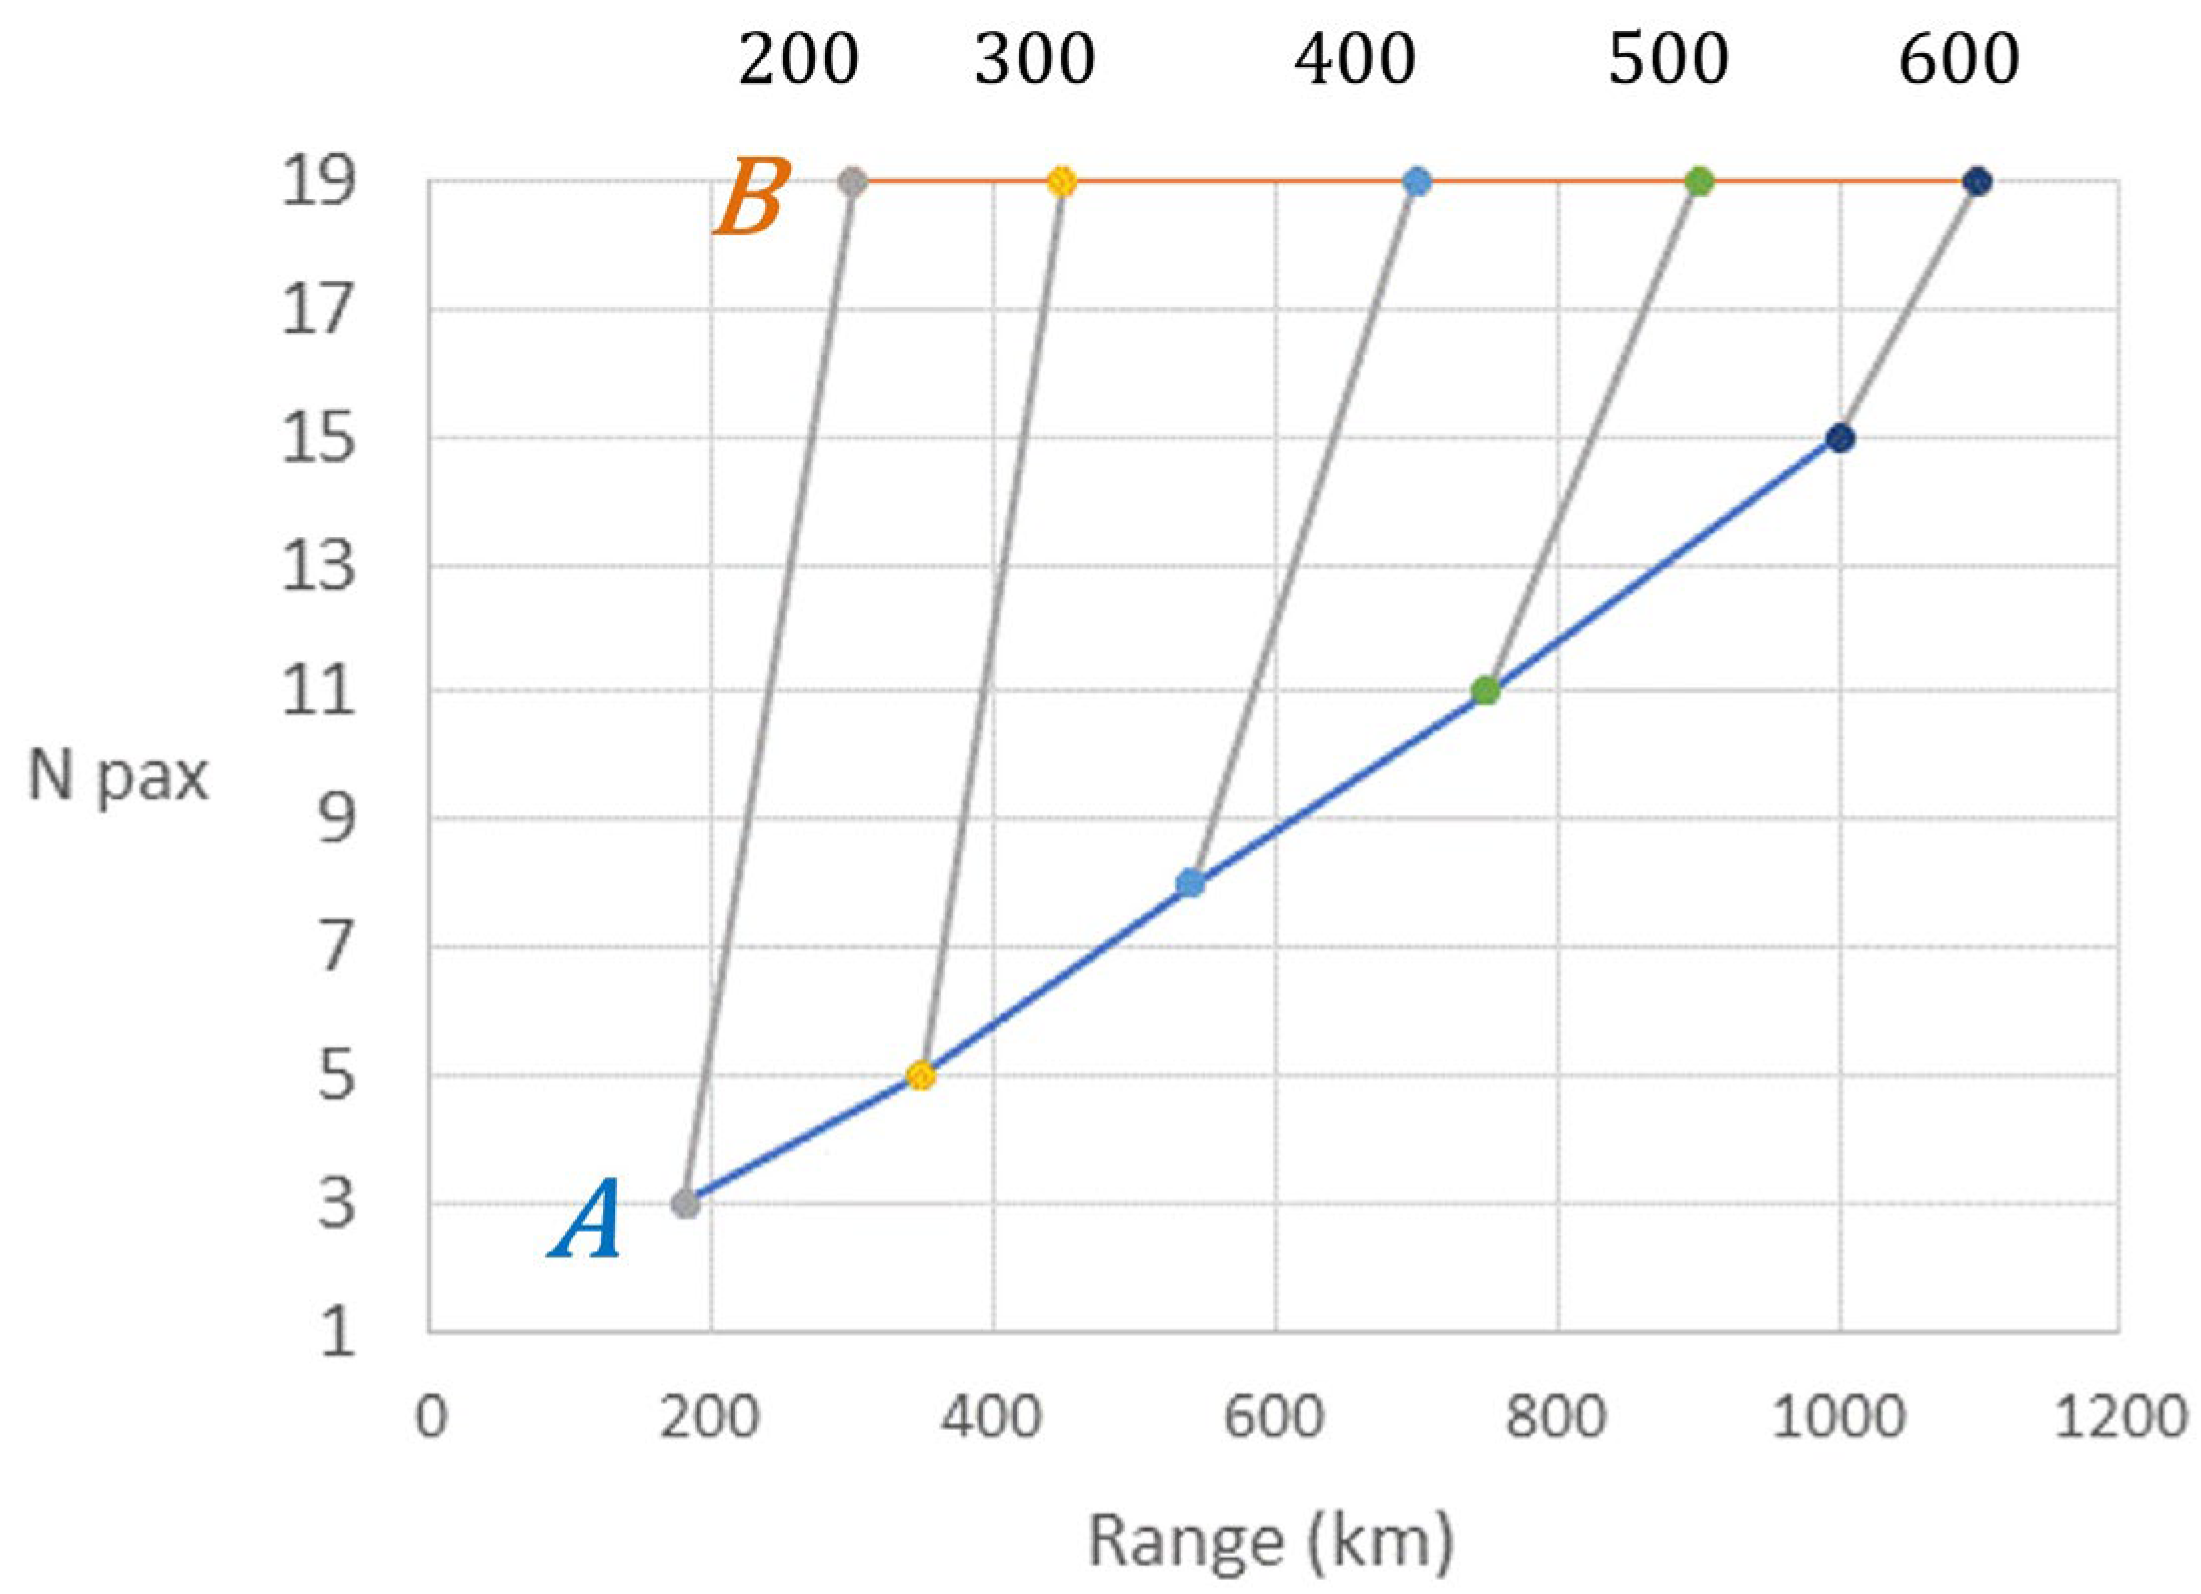
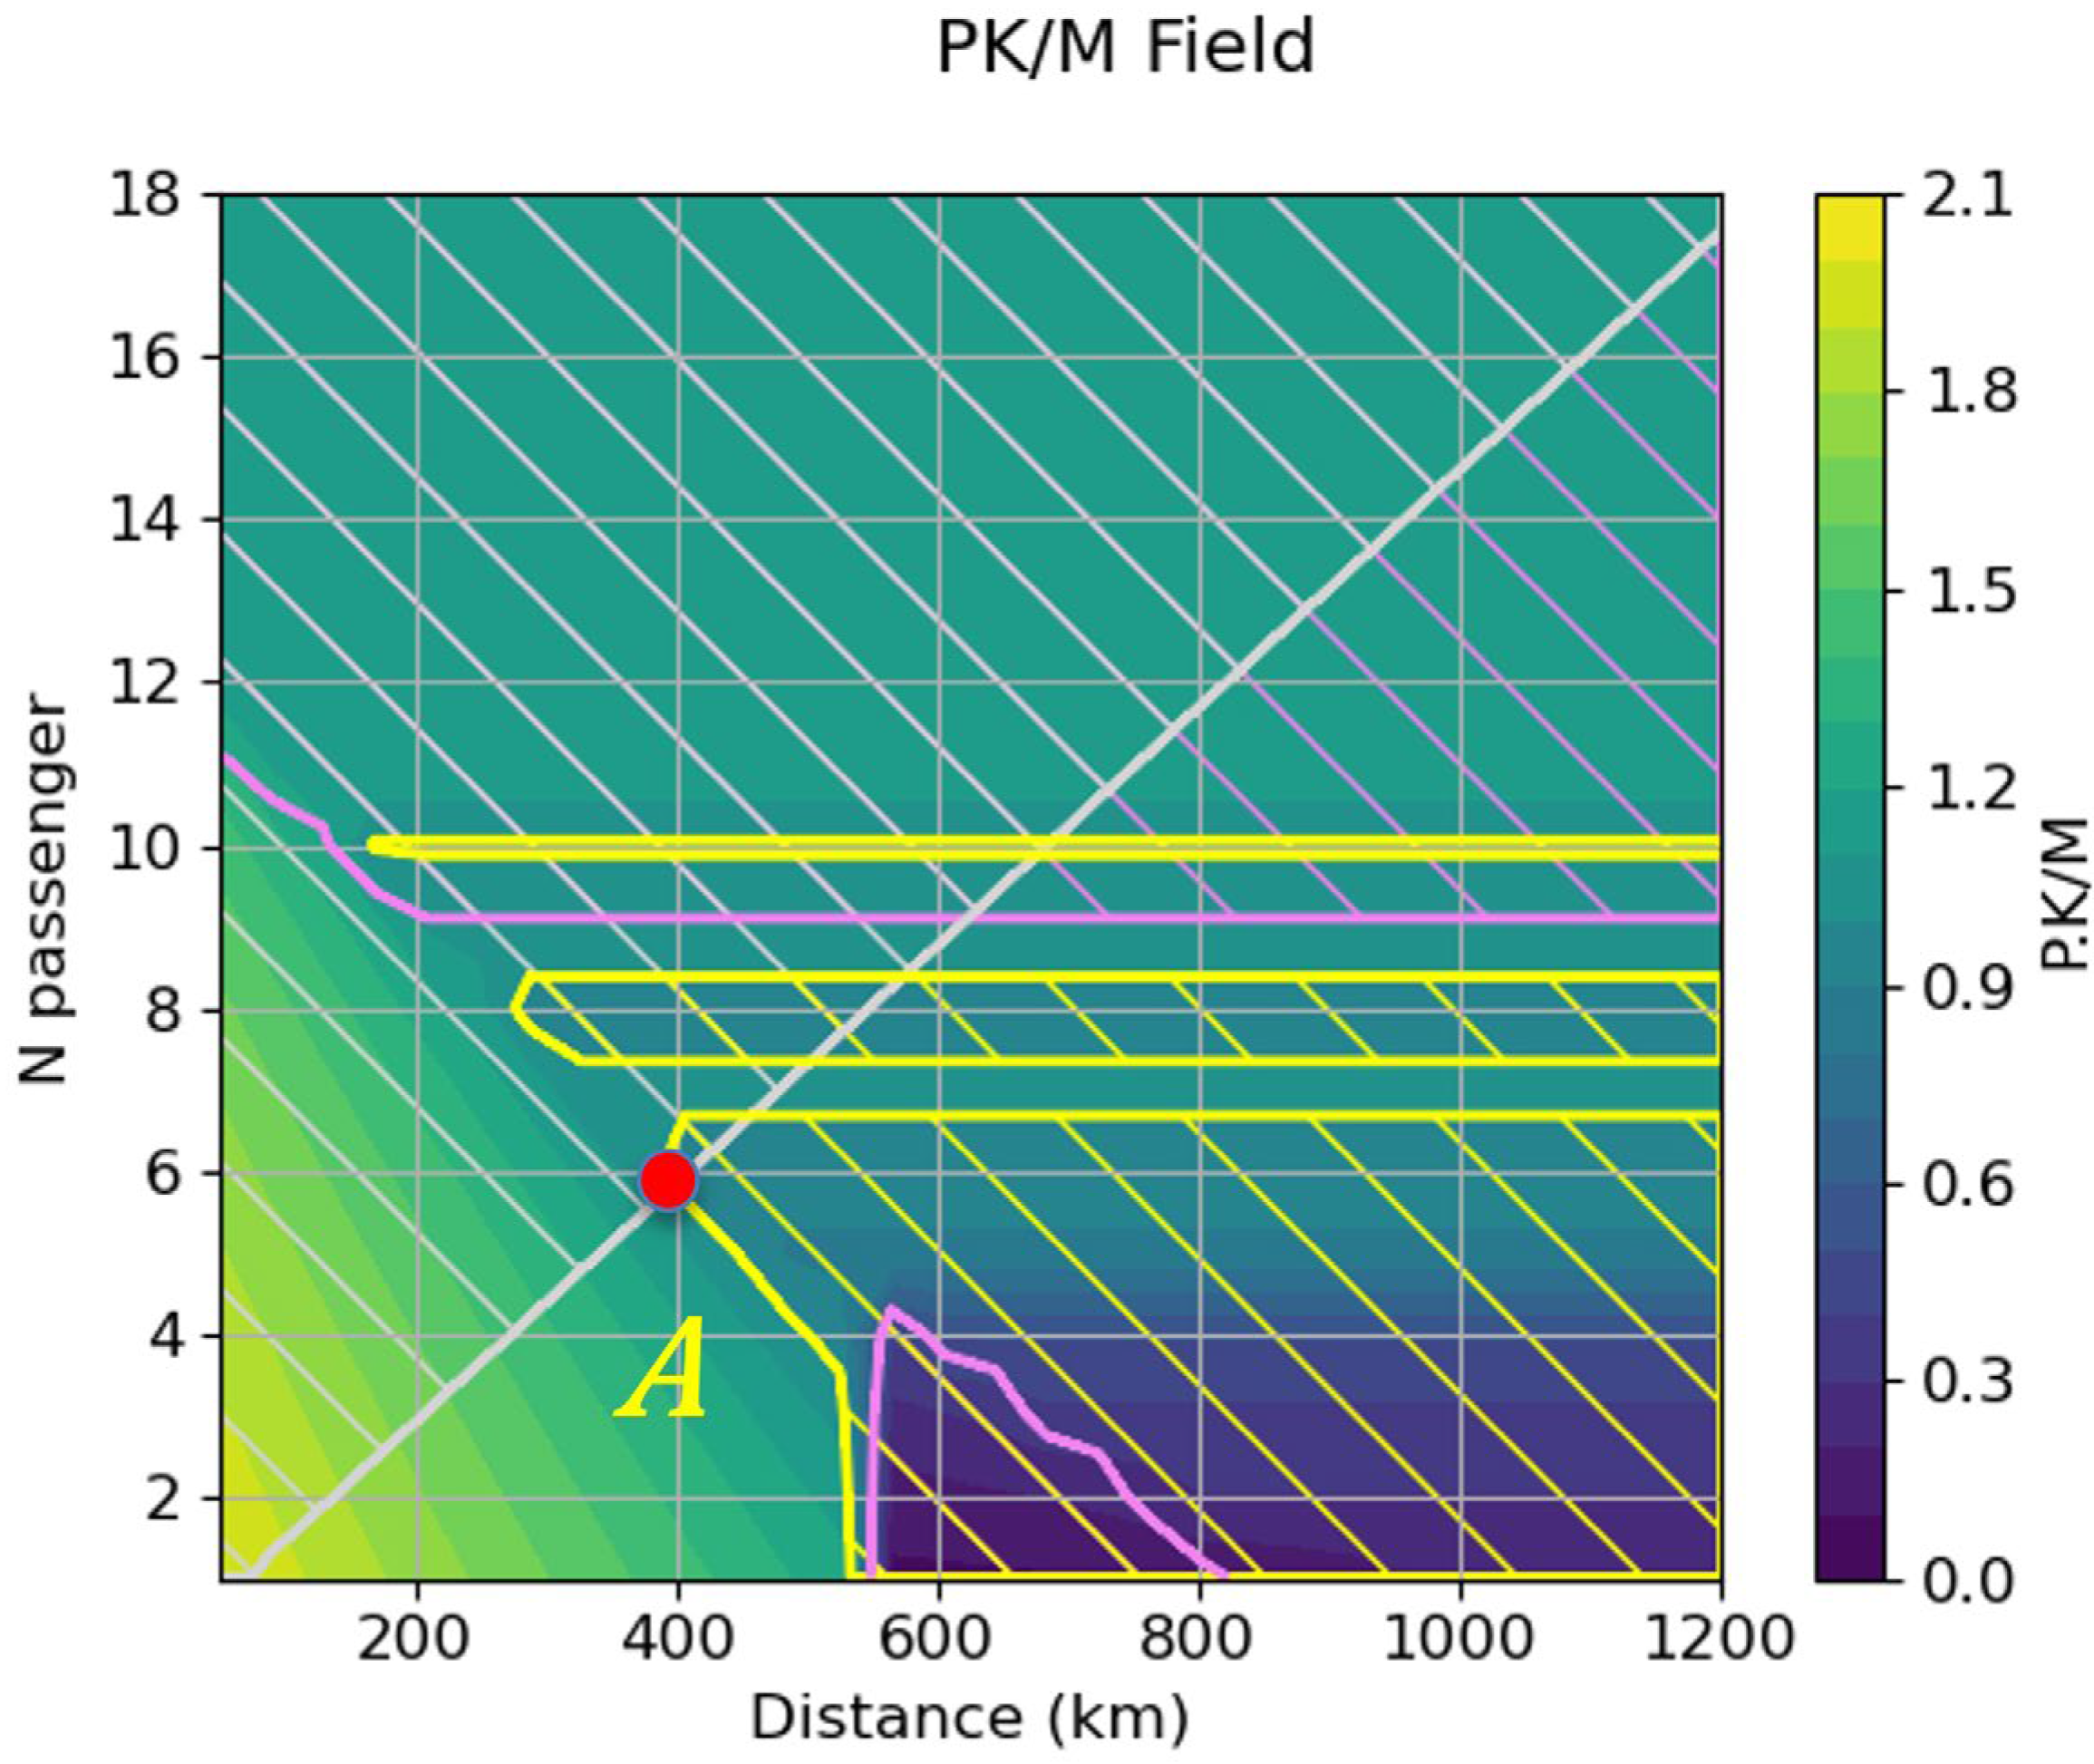
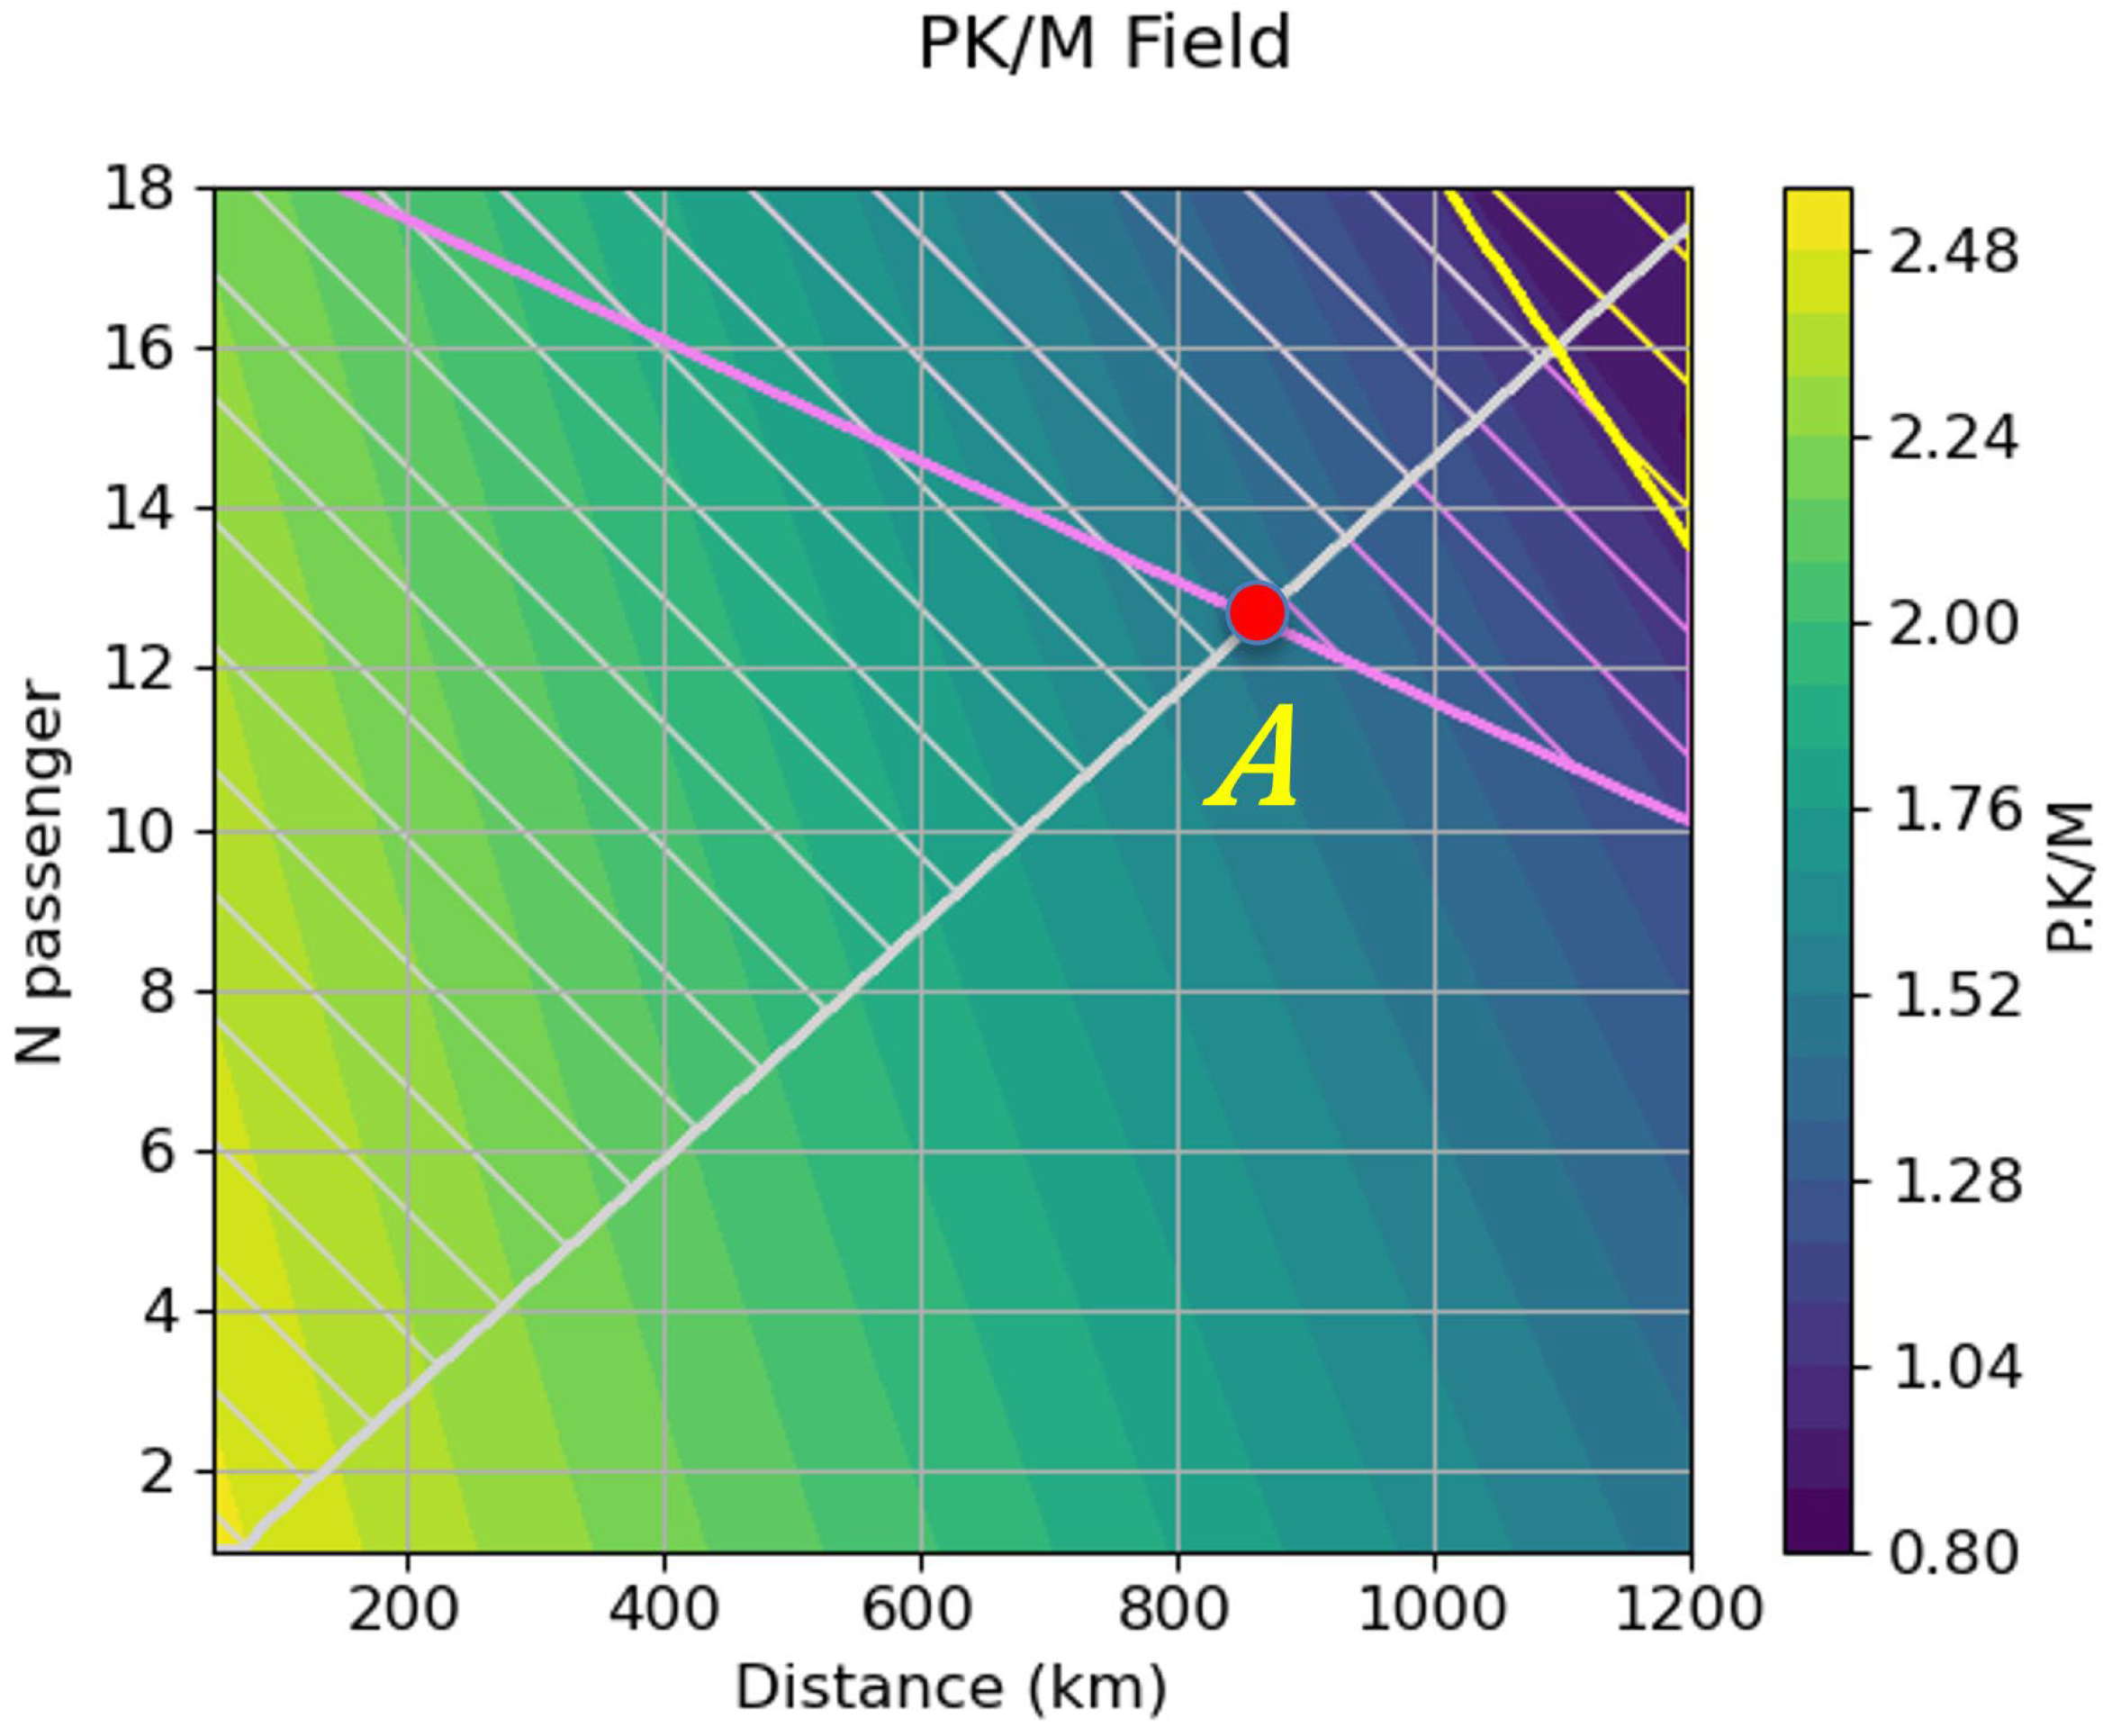
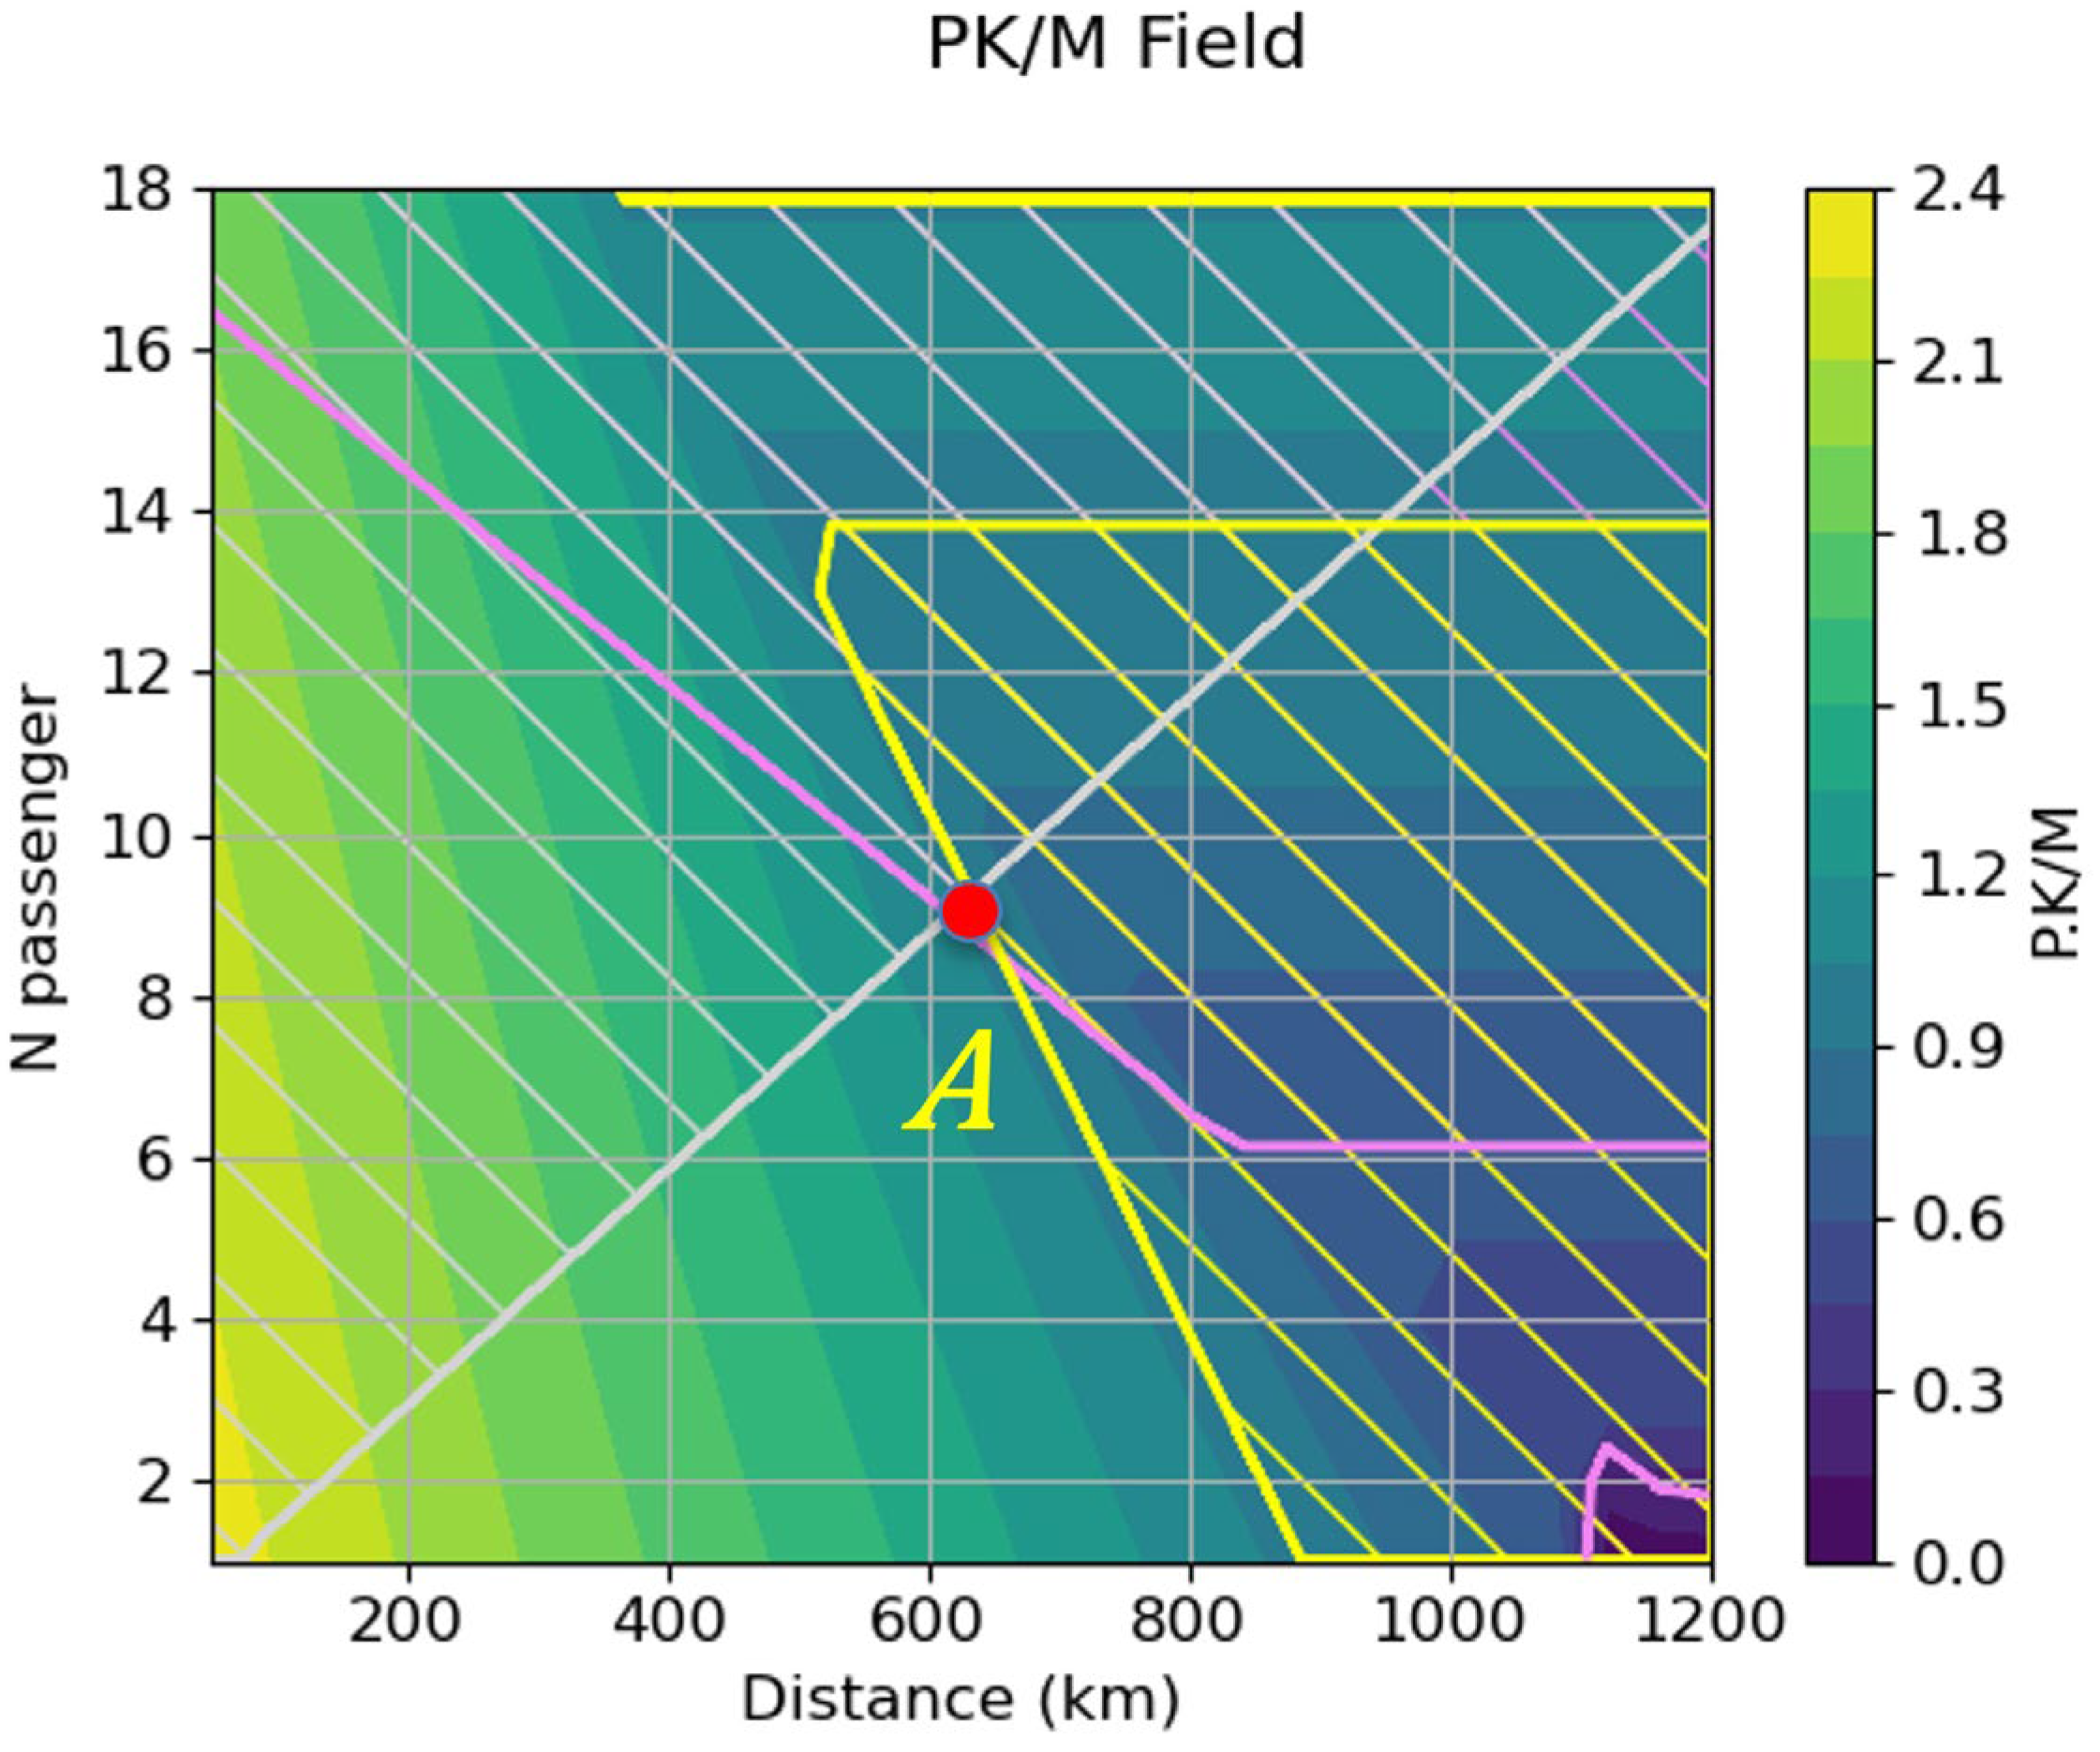
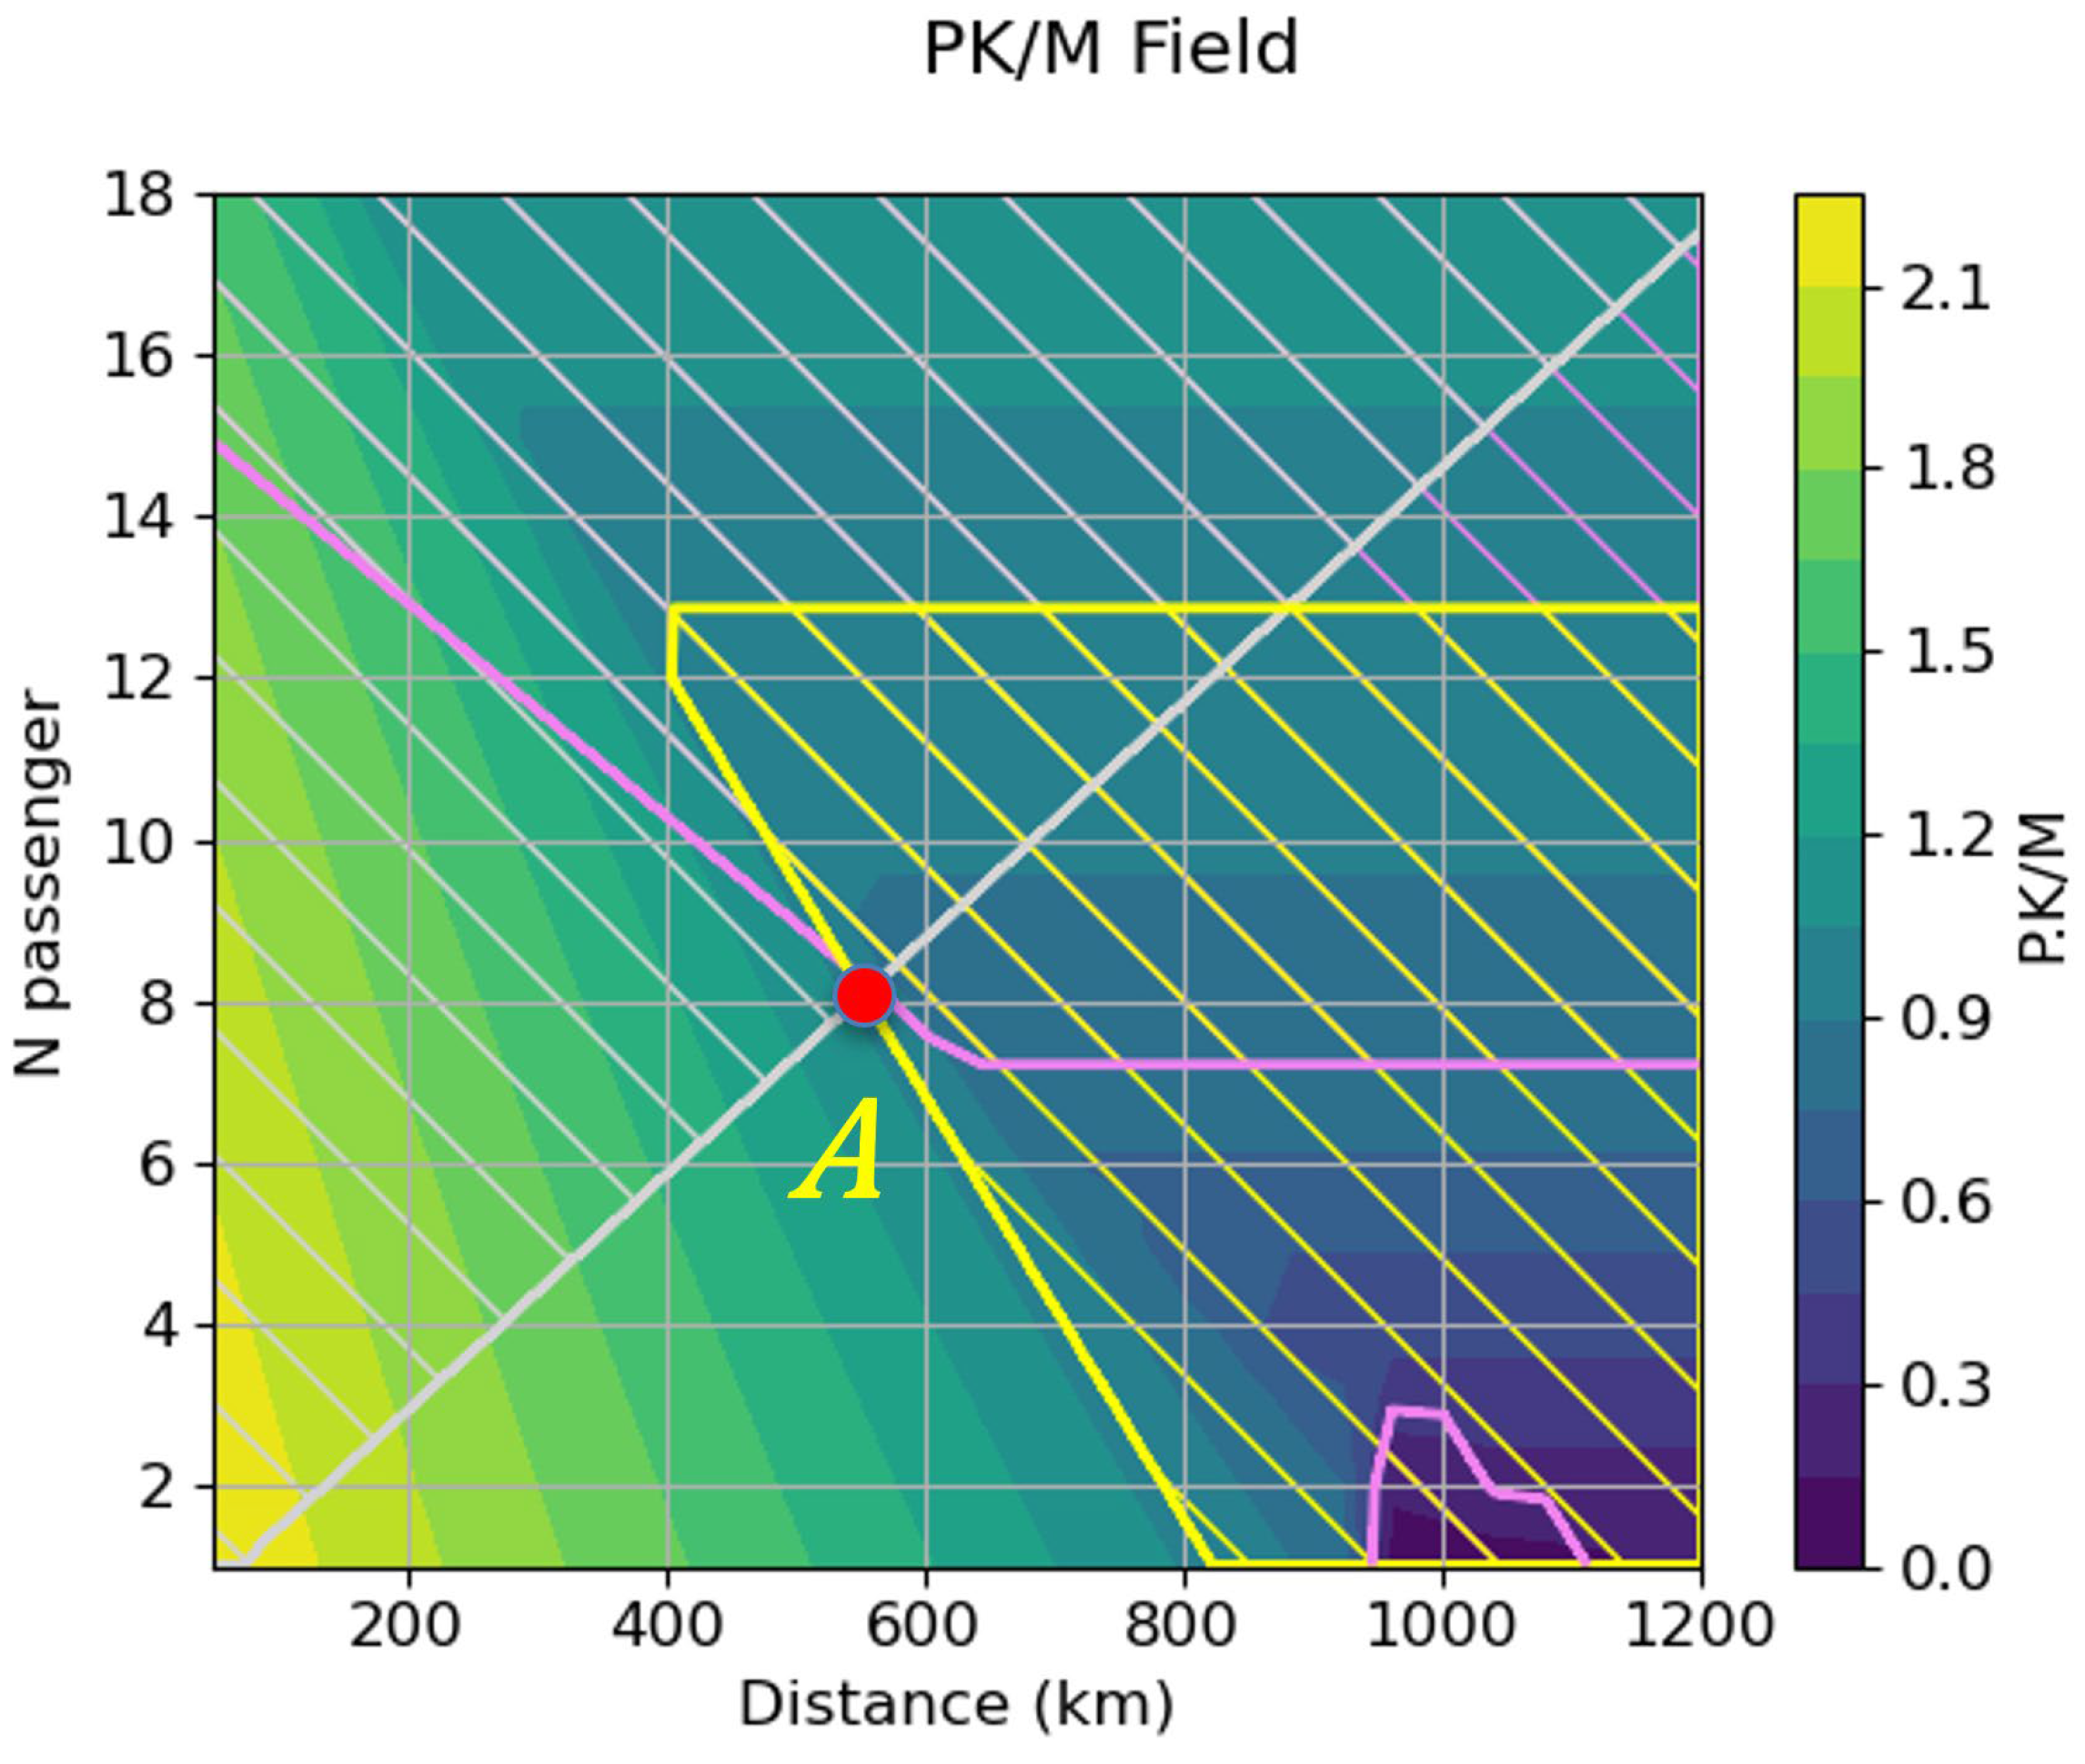
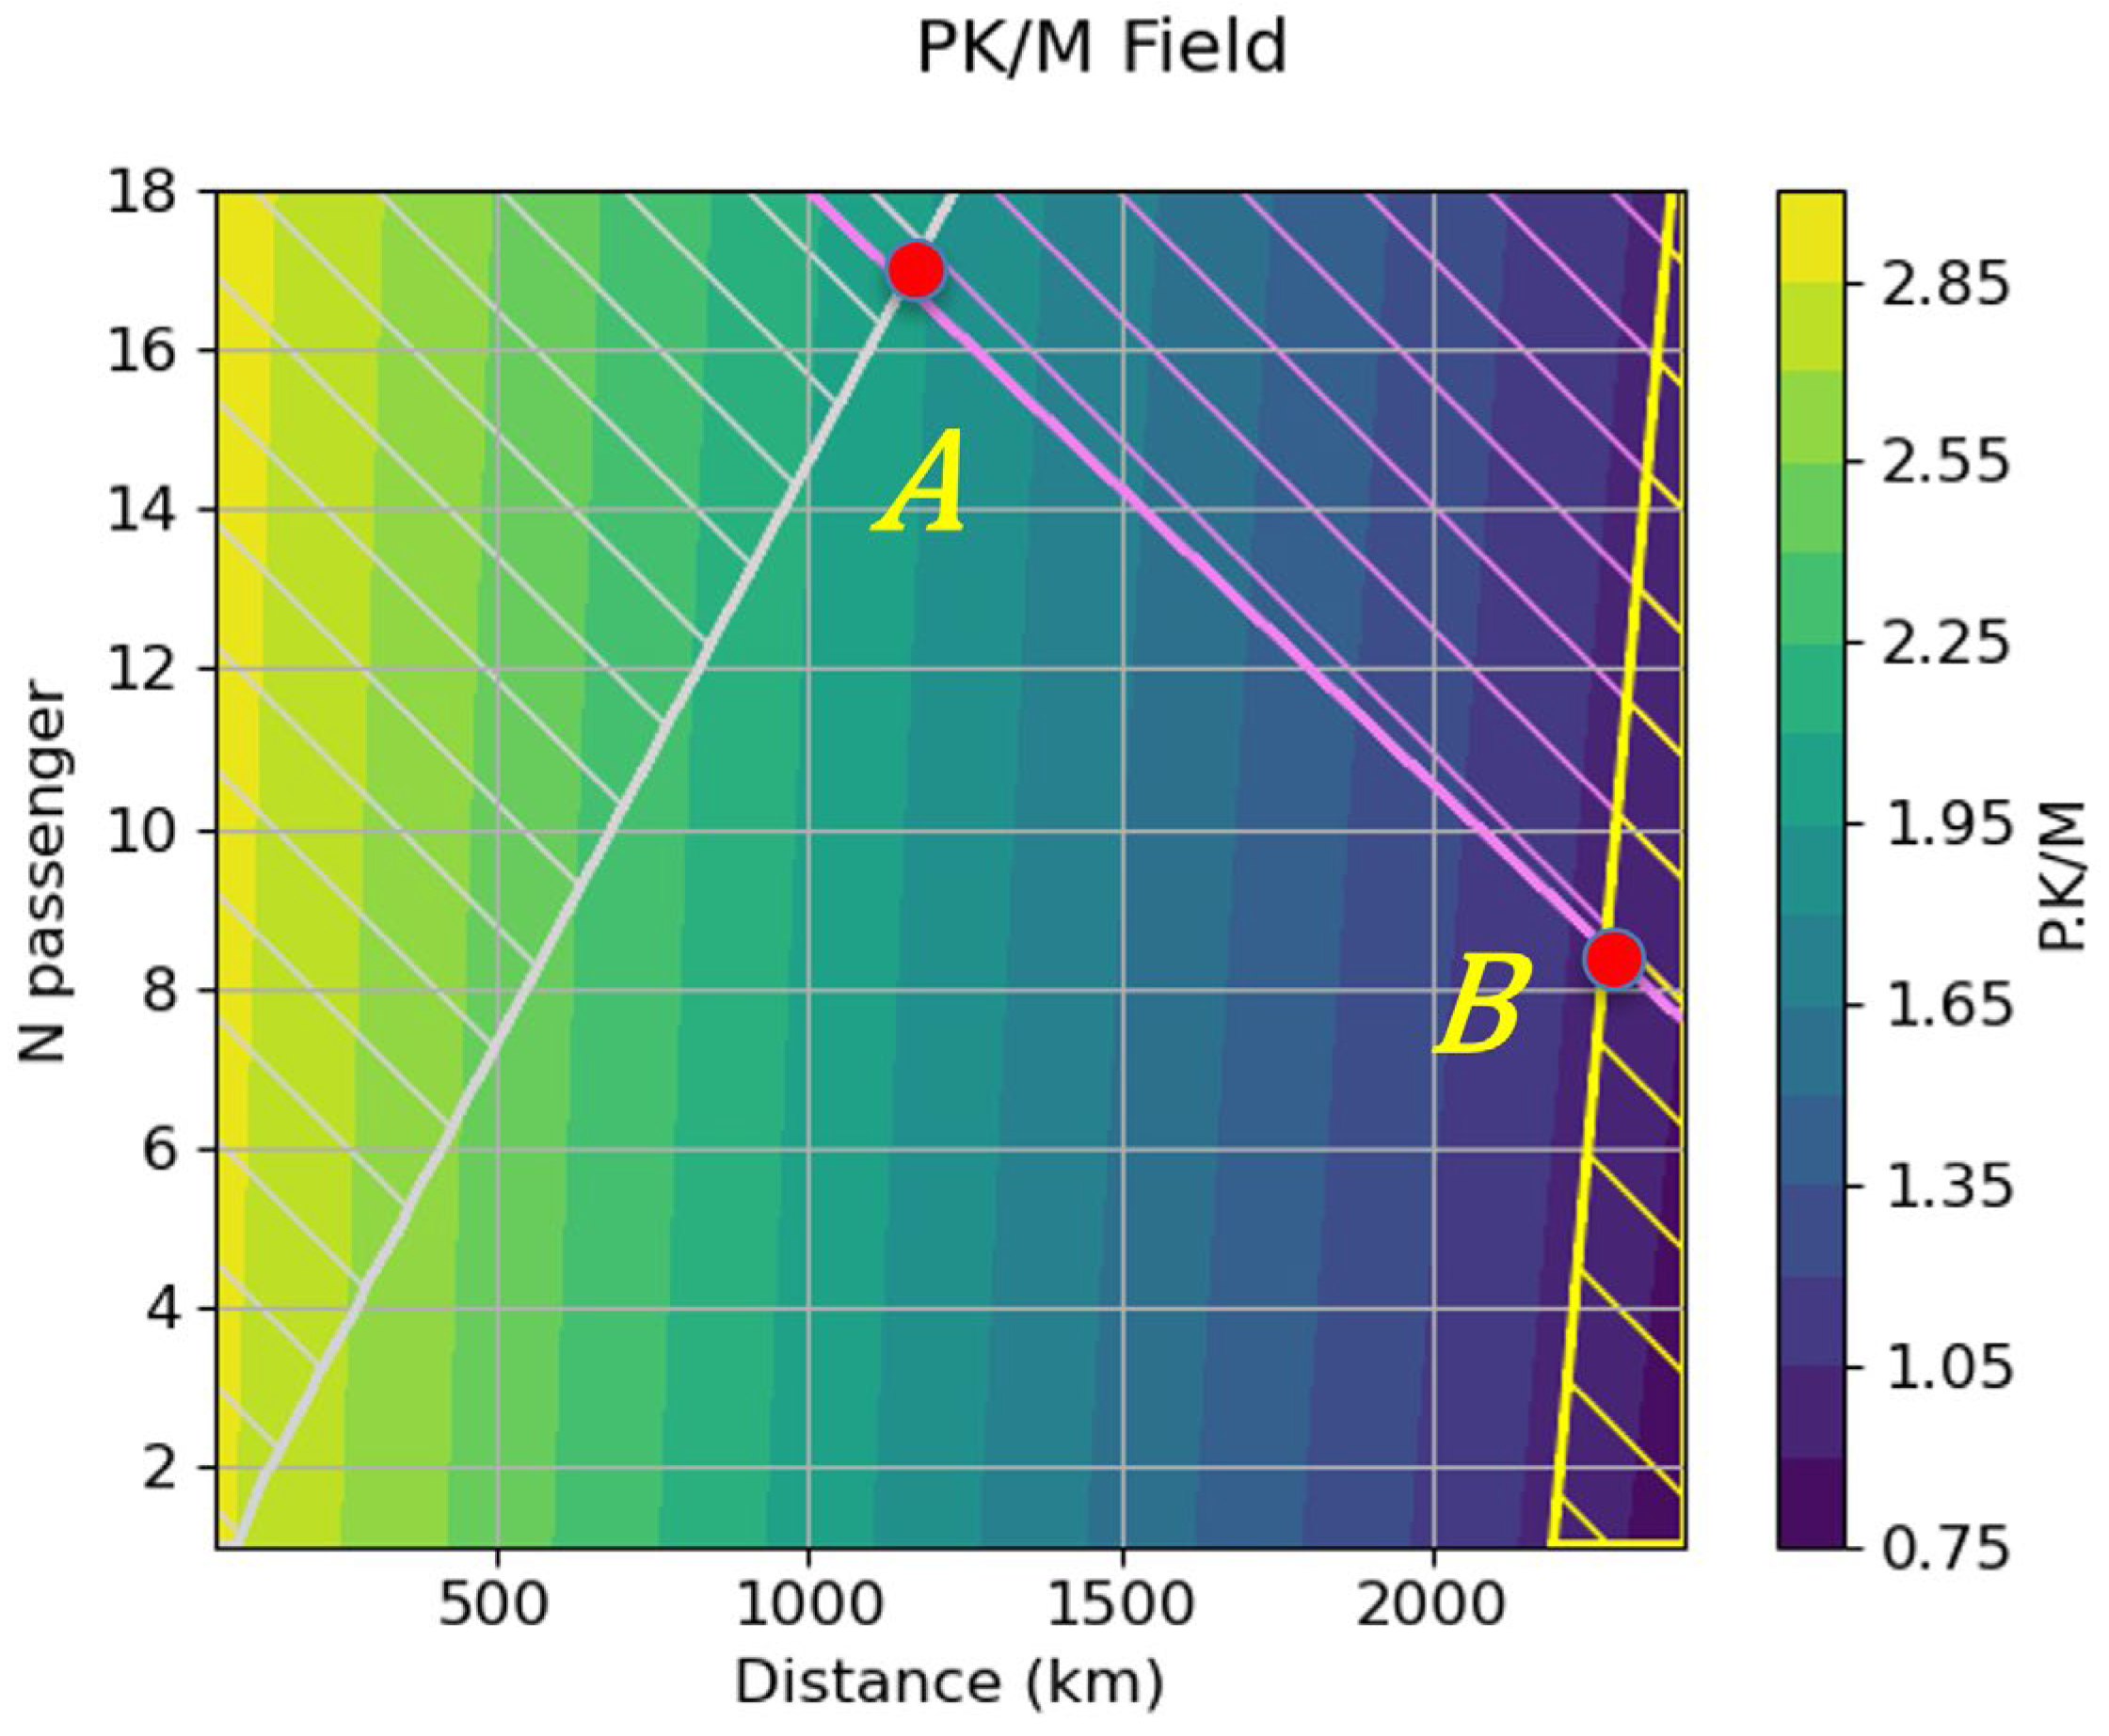
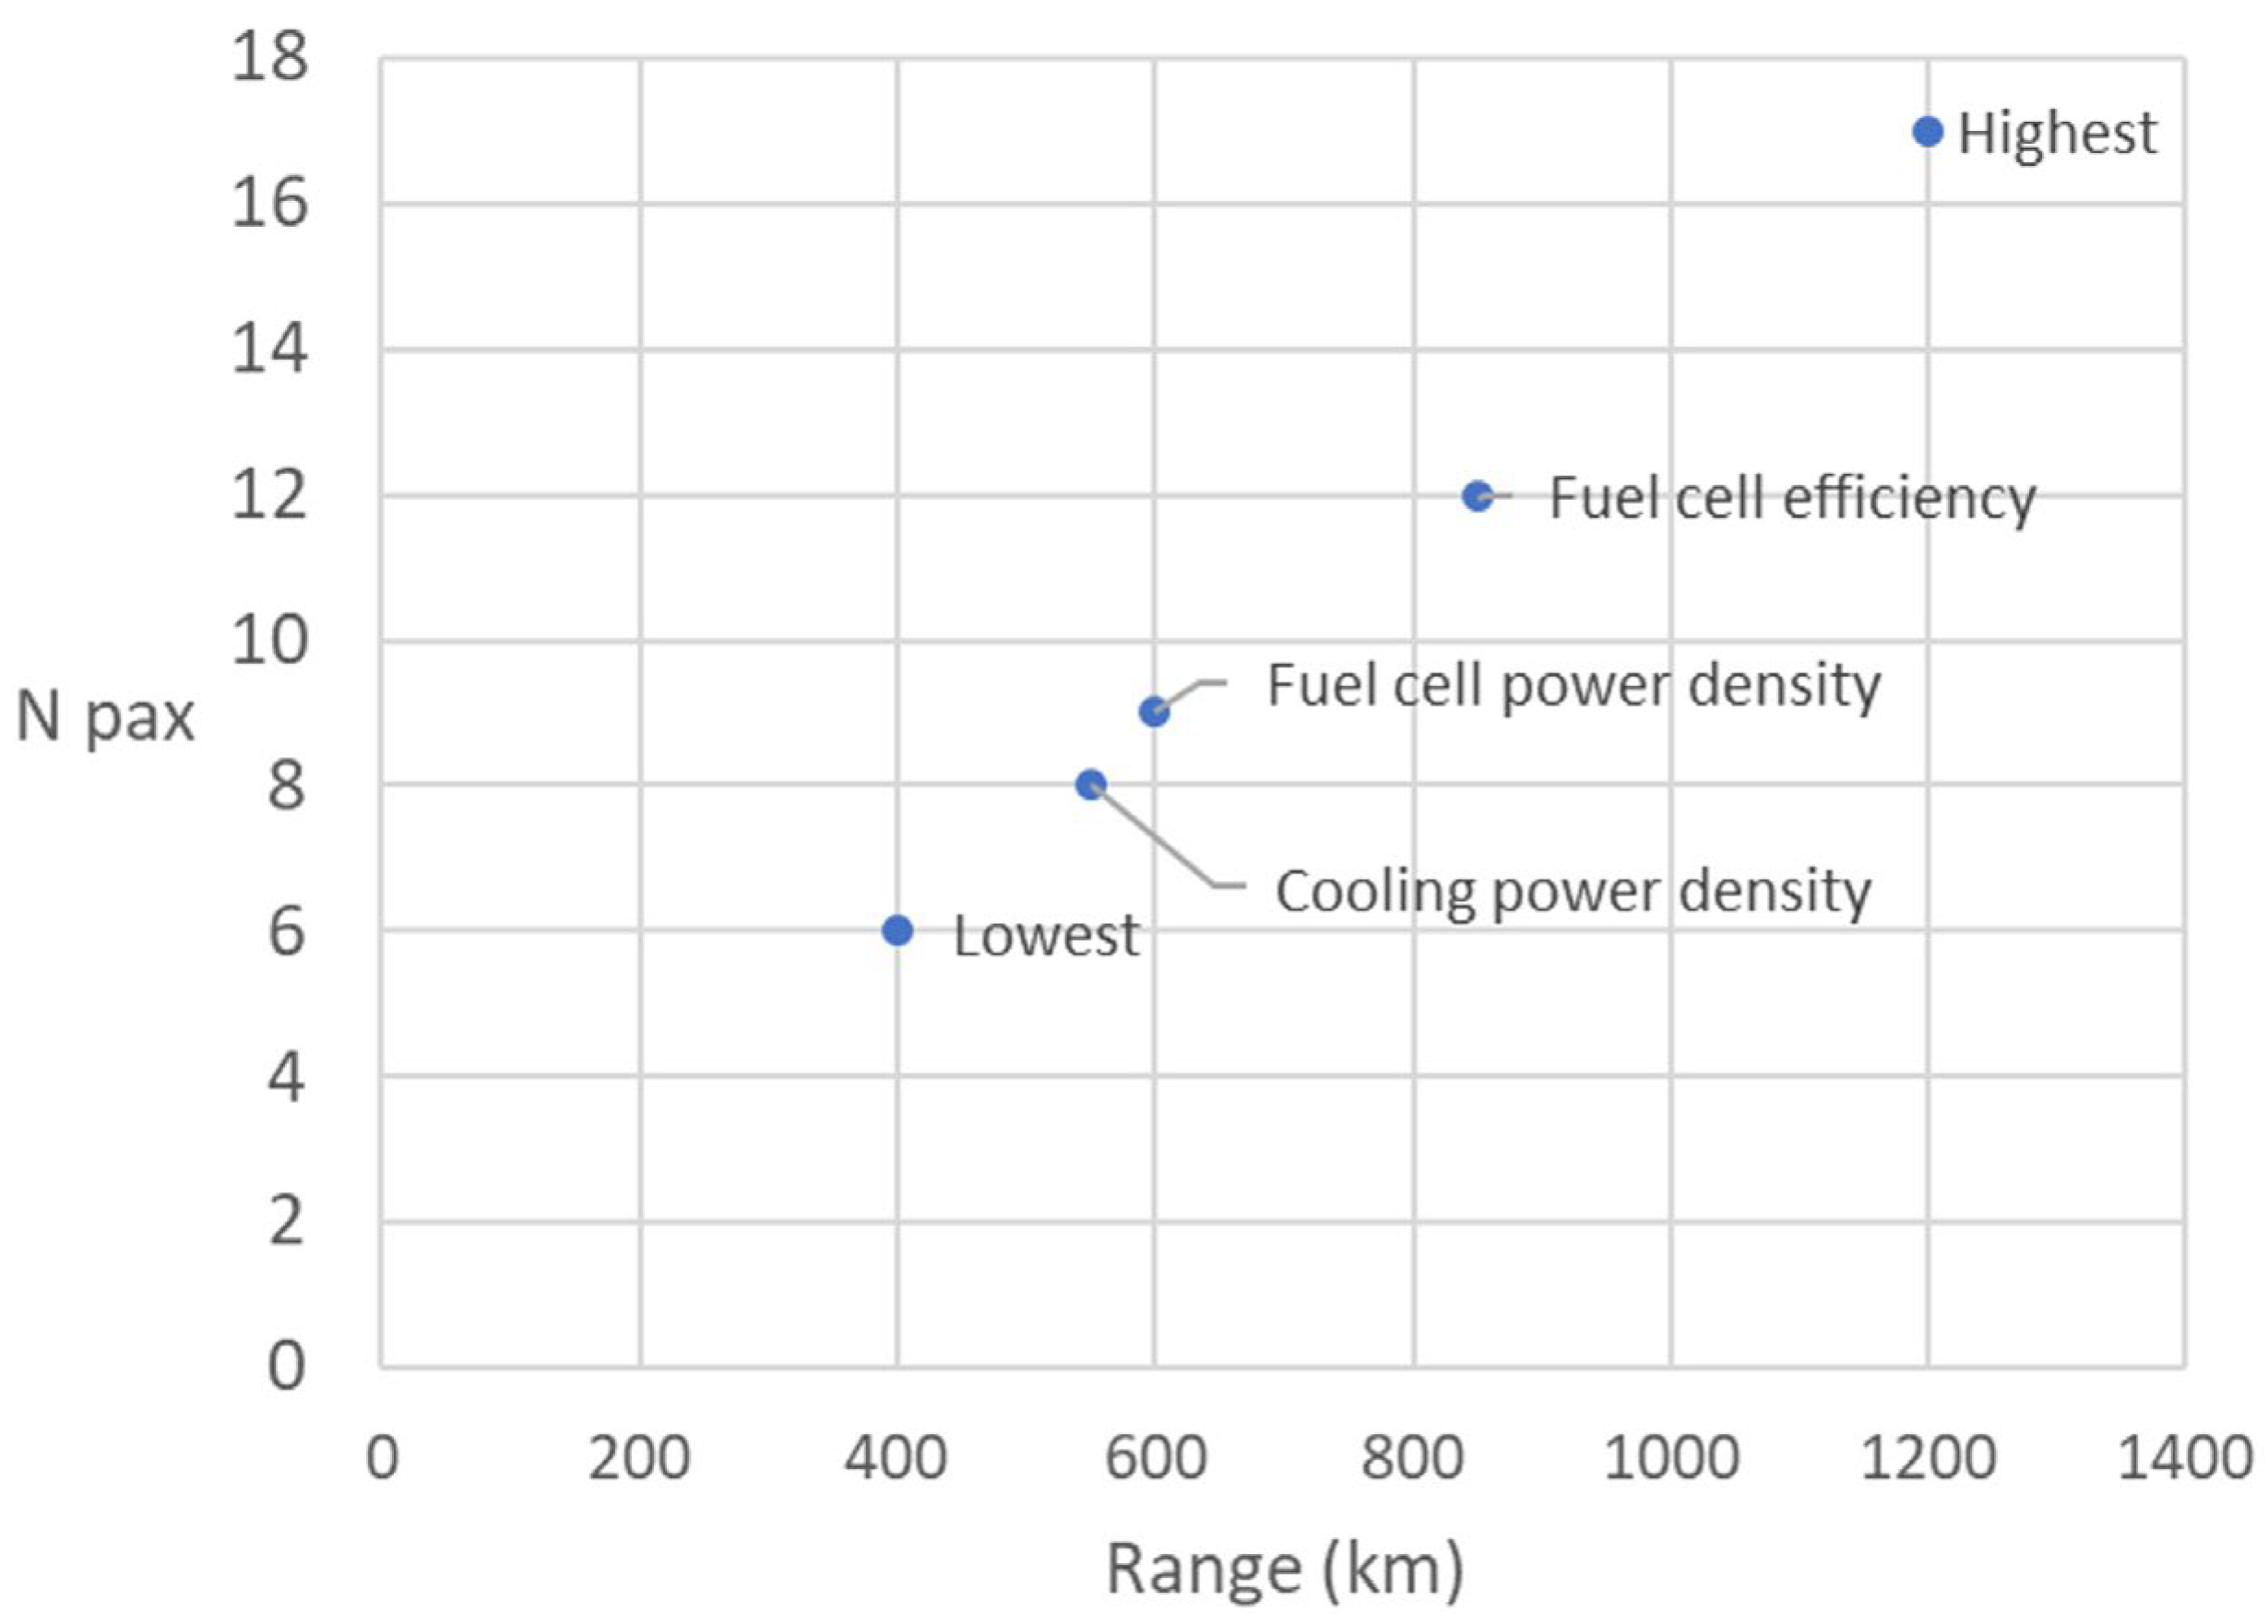