Article

Effect of Wavy Leading Edges on Airfoil Trailing-Edge Bluntness Noise

1
School of Power and Energy, Northwestern Polytechnical University, Xi’an 710129, China
2
Key Laboratory of Aerodynamic Noise Control, China Aerodynamics Research and Development Center, Mianyang 621000, China
*
Author to whom correspondence should be addressed.
Aerospace 2023, 10(4), 353; https://doi.org/10.3390/aerospace10040353
Submission received: 27 February 2023 / Revised: 31 March 2023 / Accepted: 31 March 2023 / Published: 3 April 2023
(This article belongs to the Special Issue Aeroacoustics and Noise Mitigation)

Abstract

:
Among the several noise-generation mechanisms of airfoil self-noise, trailing-edge bluntness noise is an important noise source, which is caused by the vortex shedding at blunt trailing edges. A numerical study on airfoil trailing-edge bluntness noise control using the bio-inspired wavy leading edges is presented in this paper. The high-fidelity, improved, delayed, detached eddy simulation (IDDES) method was used to calculate the flow field, and the acoustic analogy method was used for noise prediction. For both the blunt-trailing-edge airfoils, a baseline airfoil with a straight leading edge and a bio-inspired airfoil with a wavy leading edge were used in this study. The chord-based Reynolds number was 400,000, and there was no angle of attack. The numerical results show that the trailing-edge bluntness noise of the baseline airfoil was significantly reduced by the wavy leading edges. The sound pressure level reduction was about 3.7 dB at the characteristic frequency, and the maximum sound pressure level reduction was as high as 35 dB. The trailing-edge bluntness noise was decreased at all directional angles. The maximum overall sound pressure level reduction was 6.3 dB at 0°. In addition, by analyzing the pressure fluctuations, wake characteristics, turbulent vortex structures and spanwise correlation and coherence of the flow field, the noise-reduction mechanisms of the bio-inspired airfoil are deeply revealed.

1. Introduction

With the increasingly strict standards for civil aircraft’s airworthiness noise, the benefits of existing noise reduction methods are gradually decreasing. At the same time, with the continuous development of wind power technology and the popularity of small civil unmanned aerial vehicles (UAV), the problem of aerodynamic noise is becoming more and more prominent and needs to be solved urgently.
Aerodynamic noise generated by airfoils can be mainly divided into the leading-edge turbulence-airfoil interaction noise and the trailing-edge airfoil self-noise. According to the different flow patterns of airfoil boundary layer, Brooks et al. classified the generation mechanisms of the airfoil self-noise into five categories [1]. Among them, the trailing-edge bluntness noise caused by the vortex shedding from blunt trailing edges was established by Brooks and Hodgson [2] to be one of the important airfoil self-noise sources. This noise source might be encountered in many engineering applications, such as aircraft wings, engine blades, wind-turbine blades and small civil UAV propellers [3,4]. Especially for large wind-turbine blades, the blunt trailing edge can not only ensure their strength, but also improve the aerodynamic performance at small angles of attack [5].
There are many passive noise-reduction measures for airfoil aerodynamic noise, such as trailing-edge serrations [6], wavy leading edges and the use of porous materials [7]. In order to suppress the blunt trailing-edge vortex-shedding noise at the tooth root of the cutting sawtooth’s trailing edge, Chong [8,9] et al. proposed a poro-serrated trailing edge structure: using porous materials to fill the sawtooth gap. By filling the serrated gap with suitable porous materials, not only can the blunt trailing-edge vortex-shedding noise be completely suppressed, but the broadband noise can be further reduced by 1.5 dB without causing a destructive impact on aerodynamic performance.
The wavy leading edges which are inspired by the flippers of humpback whales are widely considered as an effective passive noise-control method. Many researchers have conducted a series of theoretical, experimental and numerical studies on various bio-inspired wavy leading edges, to investigate their effects on the aerodynamic [10] and aeroacoustic properties [11,12,13,14]. Hansen et al. [11] found in their experimental study in 2010 that the sinusoidal wavy leading edge can eliminate the tonal noise of the NACA0012 airfoil at a Reynolds number (Re) of 120,000. At the same time, the broadband noise in a relatively large frequency range around the tonal noise peak is reduced. In 2021, Wang et al. [13] used a numerical method combining large eddy simulation and acoustic analogy equations to study the effects of different types of leading-edge serrations with the surface ridge of owl wings on the far-field noise radiation of airfoils. The results show that the iron-shaped leading-edge serrations had the best noise reduction effect. With them, the sound pressure level was reduced by 14.3 dB.
The ability of a wavy leading edge to reduce the noise generated by the interaction between incoming turbulence and the airfoil’s leading edges has been widely studied and confirmed [15,16,17,18,19,20,21,22]. A lot of studies have been conducted experimentally and numerically by the present authors to explore the influences of wavy leading edges on the airfoil instability noise [14], airfoil-turbulence interaction noise [18,23], axial-flow fan noise [24] and the airfoil’s aerodynamic performance [25]. However, there are few studies concerning the reduction in the trailing-edge bluntness noise granted by wavy leading edges. Hasheminejad et al. studied the suppression effect of leading-edge serrations on the tonal noise of the NACA65 airfoil due to the trailing-edge bluntness [26] and explored the suppression mechanism of leading-edge serrations on different sound sources [27]. The results show that a long leading-edge sawtooth has a good noise reduction effect on vortex-shedding noise, of about 10 dB, and the sawtooth wavelength can change the frequency of the noise.
It was found that the wavy leading edges resemble the vortex generators, which can generate pairs of contra-rotating streamwise vortices at the wavy trough, so that the momentum exchange within the boundary layer could be improved [28,29,30,31]. The present study aimed at a reduction in the trailing-edge bluntness noise with bio-inspired wavy leading edges and explored the potential noise-reduction mechanisms.

2. Numerical Setup

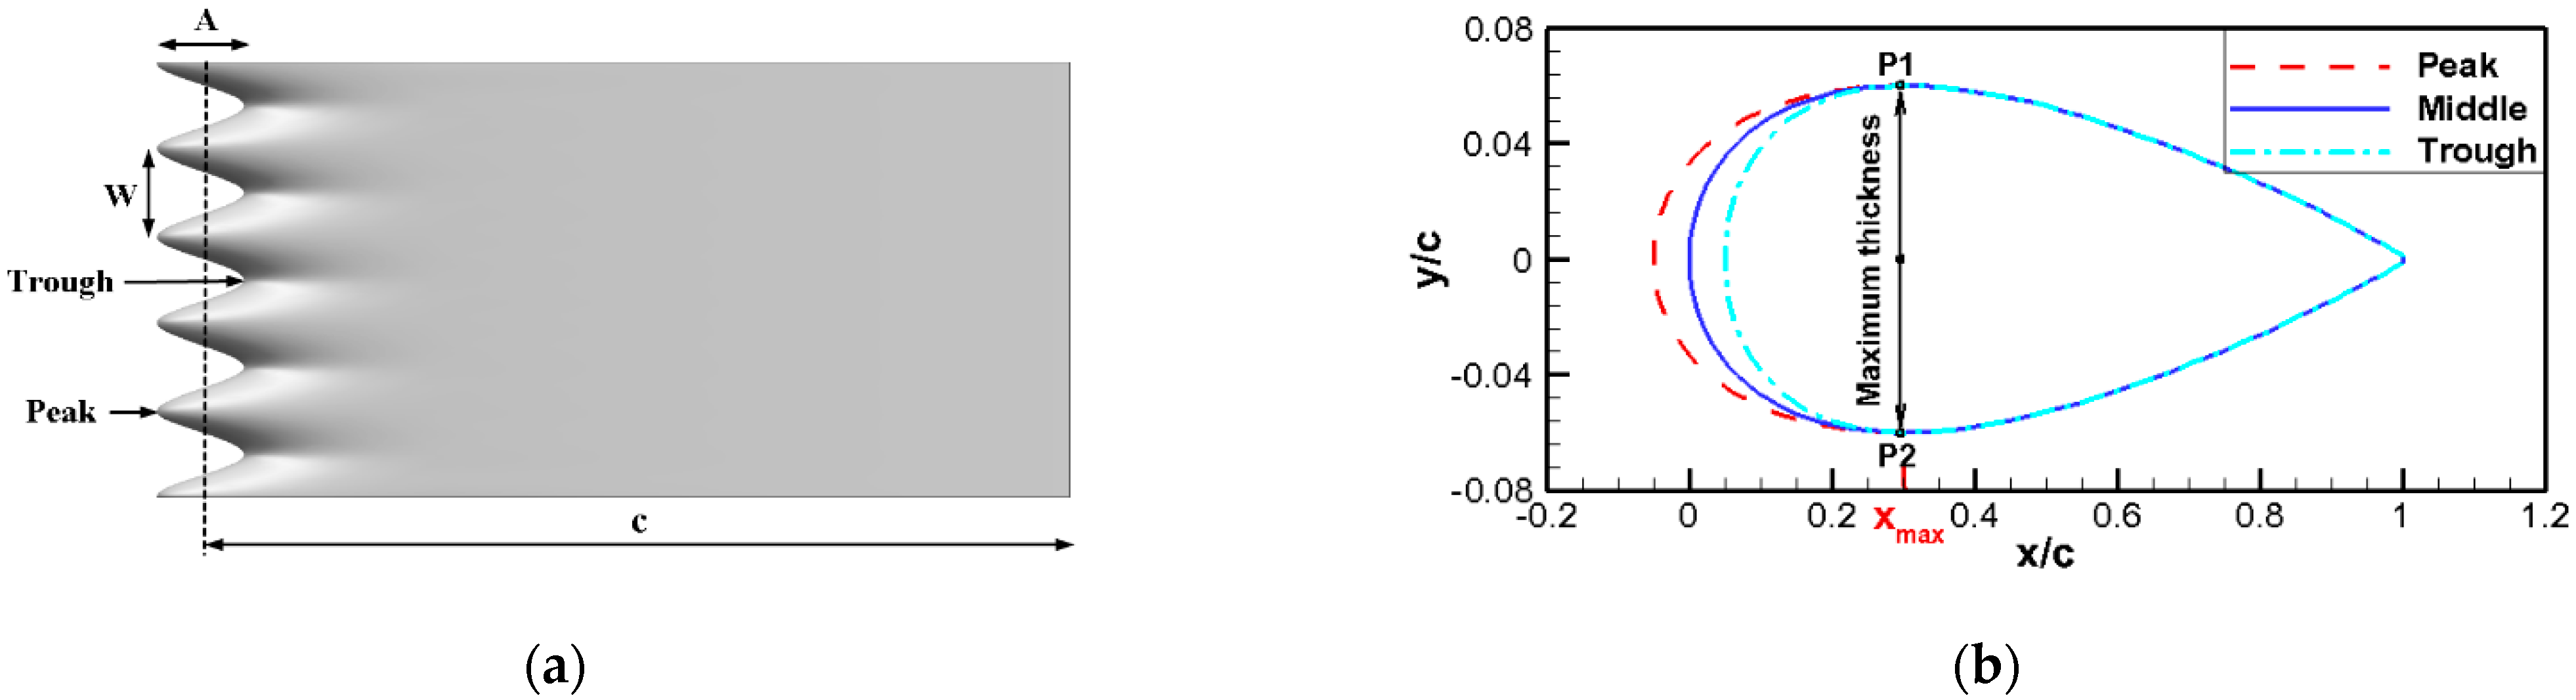
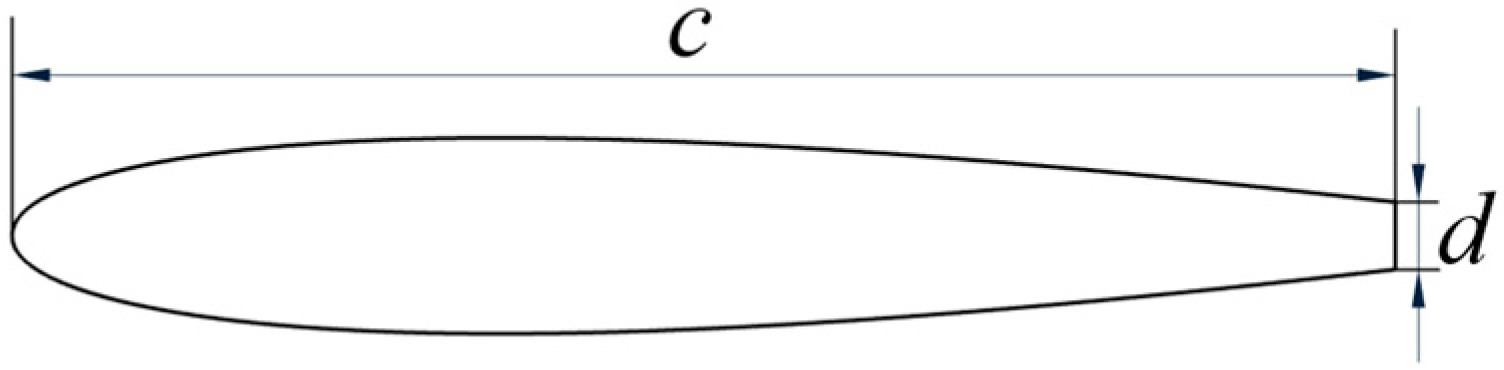
2.1. Design of Wavy Leading Edges and the Blunt Trailing Edge

The baseline airfoil used in this study was a symmetrical NACA0012 (National Advisory Committee for Aeronautics, NACA) airfoil, for which c = 150 mm (chord length) and L = 60 mm (span length). As shown in Figure 1a, the wavy leading line is determined by the wavy amplitude (A) and wavelength (W).
The chord length of the airfoil with a wavy leading edge varies spanwise according to the following formula.
c z = c + A 2 cos 2 π W z
The averaged chord length and projected area of the airfoil with a wavy leading edge are kept the same as the baseline airfoil by stretching or compressing the x-axis. The spanwise section is generated according to the following equation.
x n e w = x o l d x max x max + c z c c z c x o l d < x max x o l d x o l d x max y n e w = y o l d
The subscripts new and old represent the coordinates of the wavy-leading-edge airfoil and the baseline airfoil, respectively. x max represents the position of the maximum thickness of the baseline airfoil. As shown in Figure 1b, only the geometry from the leading edge to the maximum thickness is changed. The wavy-leading-edge airfoil studied in this paper is a A10W10 airfoil, which means that both the amplitude and the wavelength are 10% of the chord length.
After designing the wavy leading edges, the blunt-trailing-edge airfoils studied in this paper were directly cut from the baseline airfoil and wavy A10W10 airfoil. When 15% is cut off from the trailing edge, the airfoil chord length becomes 127.5 mm, and the thickness of the blunt trailing edge is d = 6.1576 mm, as shown in Figure 2.

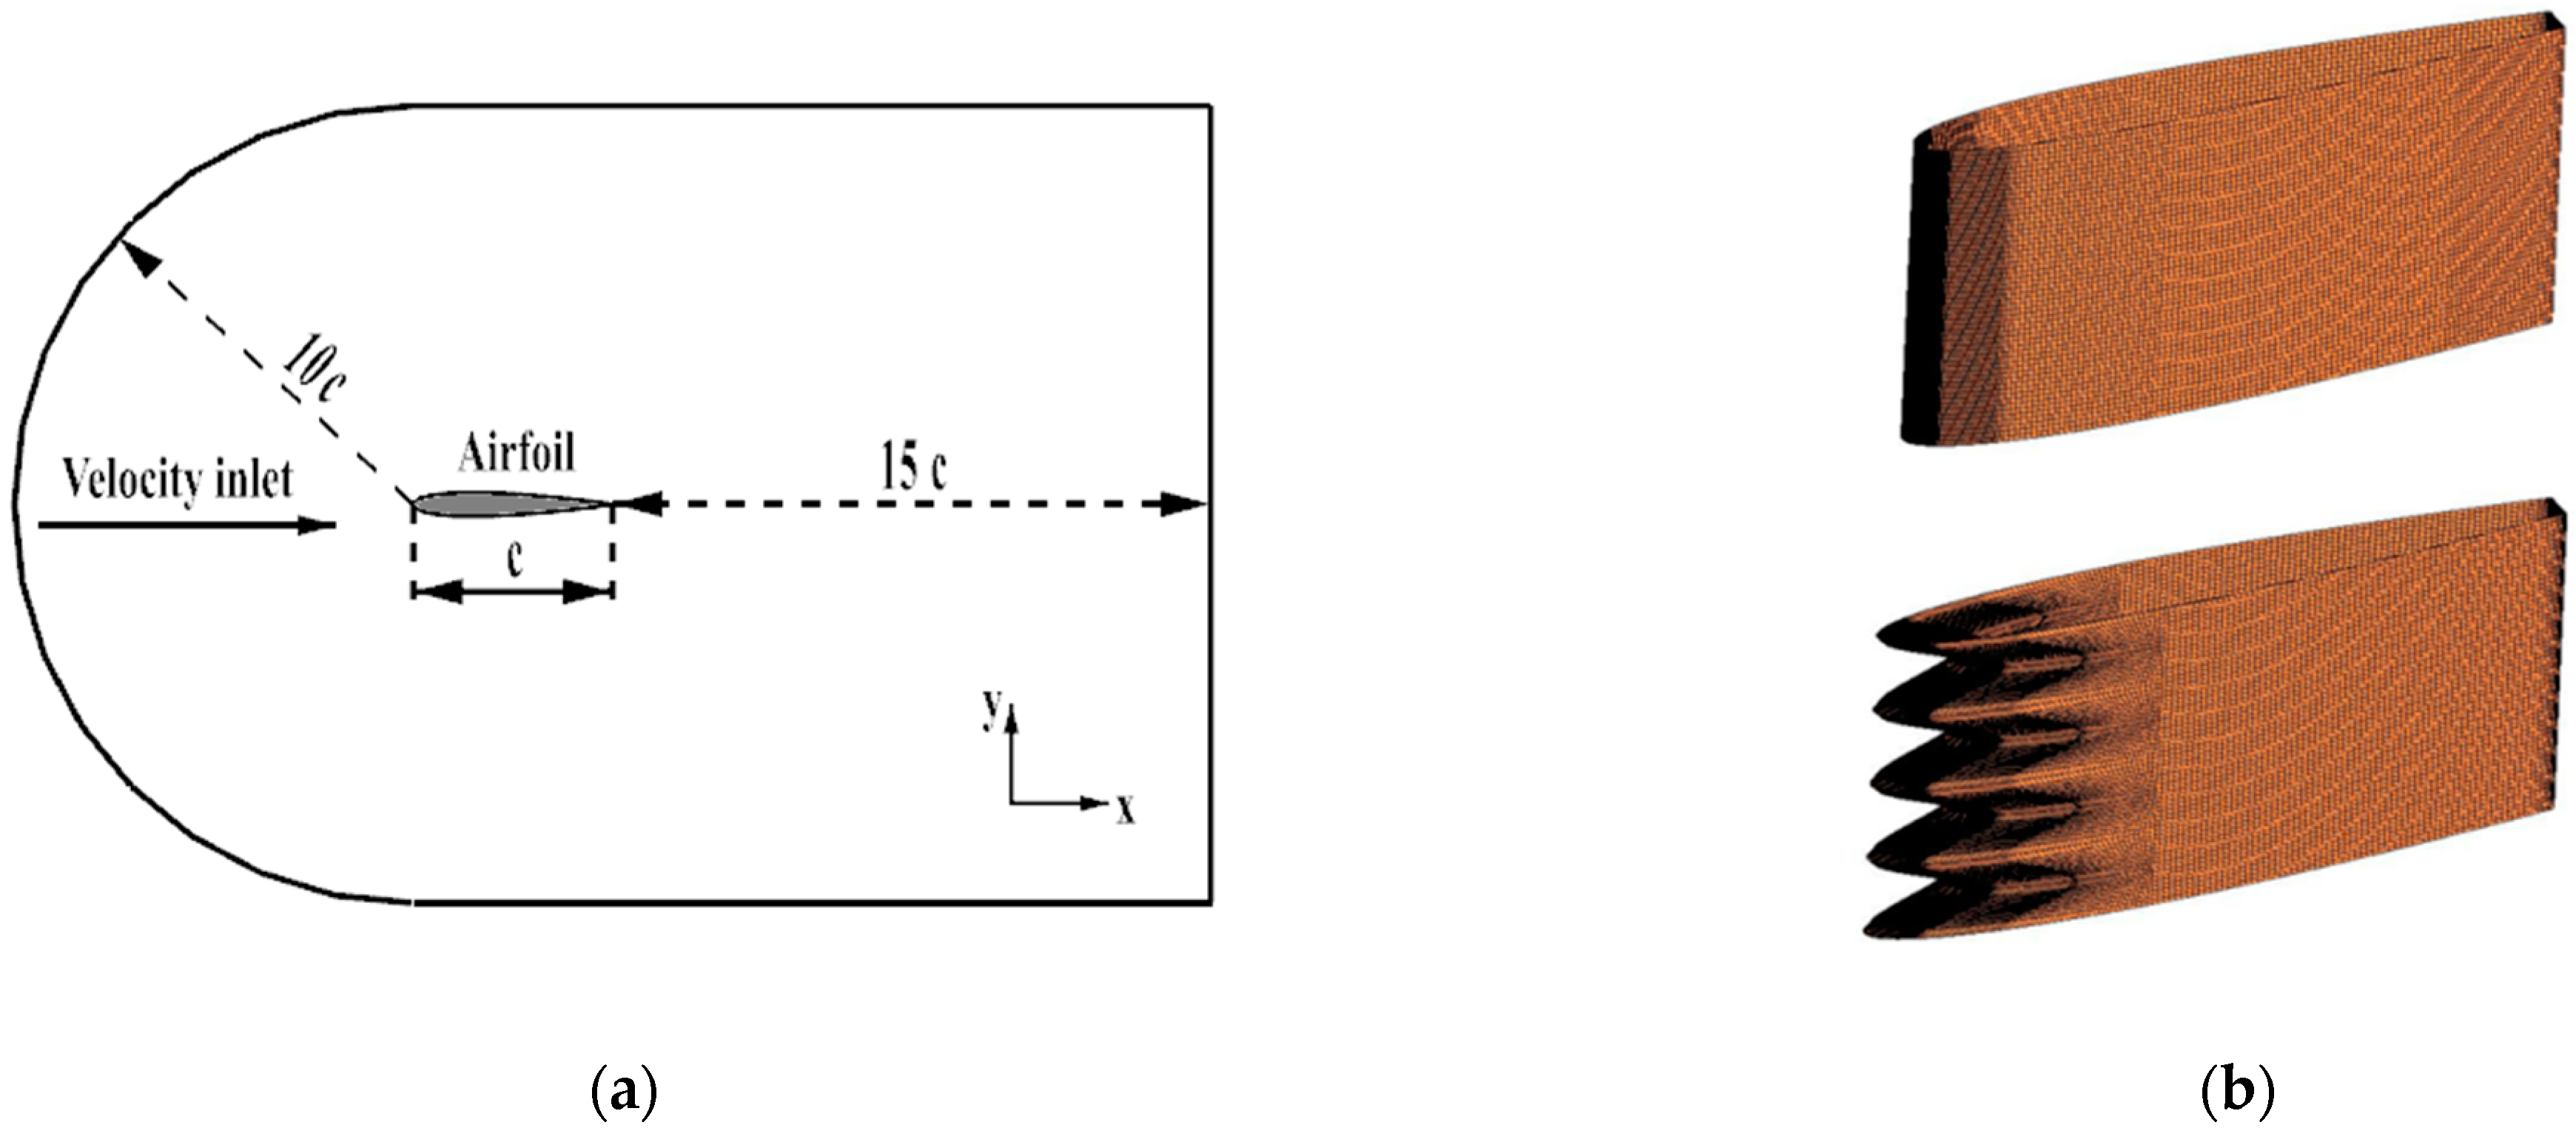
2.2. Aerodynamic Simulation by the IDDES Method

The improved delayed detached eddy simulation (IDDES) method was adopted to calculate the unsteady flow field in this study. The IDDES method is a hybrid RANS/LES method which uses the RANS method to deal with the wall boundary layer flow and the LES method for other flow regions.
The original detached eddy simulation (DES) method has two main disadvantages, namely, the mesh-induced separation issue and the log-layer mismatch issue [32]. The delayed detached eddy simulation (DDES) method was further proposed by Spalart et al. [33]. The DDES method takes the effect of viscosity into account in the turbulent scale, thereby delaying the premature conversion of the RANS model to an LES model and solving the mesh-induced separation problem. In order to further solve the log-layer mismatch problem, Shur et al. proposed the IDDES model [34]. This method utilizes the wall-modeled LES model to effectively deal with those meshes that are solved by RANS and LES models simultaneously in the logarithmic region, reducing the mesh correlation and successfully solving the log-layer mismatch [34,35]. The IDDES/FW-H framework is a suitable method for bluntness-noise predictions of airfoils by compromising on the computation accuracy and efficiency [36].
The governing equations of the IDDES method are as follows:
ρ k t + ρ ¯ U ˜ k = μ + μ T σ k 3 k + P k ρ β * k ω F I D D E S
ρ ω t + ρ ¯ U ˜ ω = μ + μ T σ ω 3 ω + 1 F 1 2 ρ k ω σ ω 2 ω + α 3 ω k P k β 3 ρ ω 2
F I D D E S = l R A N S l I D D E S
where F I D D E S is based on the RANS turbulence scale and LES mesh scale, l R A N S = k / β * ω .
The settings of the computational domain and the airfoil surface mesh are shown in Figure 3. The distance between the inlet boundary and the leading edge of the airfoil was 10c, and the distance between the outlet boundary and the trailing edge of the airfoil was 15c. The spanwise length of the computational domain was 0.4c. The structured H-O-H mesh was adopted. The total numbers of grids for the baseline airfoil and wavy A10W10 airfoil were 8.9 million and 10 million, respectively. As shown in Table 1, a grid-independence test was conducted. The wall-normal grid size in wall units was y+ < 1.
In this study, the incoming flow speed was 40 m/s, and the outlet pressure was 96,400 Pa. The periodic boundary condition in the spanwise and the adiabatic non-slip boundary condition on the airfoil surface were used. The k-ω SST (shear-stress transport, SST) model was selected as the turbulence model. The pressure-velocity coupling scheme used was the SIMPLEC algorithm, and the momentum spatial discretization was solved by the bounded central-differencing method. A bounded, second-order implicit scheme was used for time-marching with a time step of 1 × 10⁻⁵ s. After the convergence of the unsteady calculation, the acoustic model was turned on. The flow field was recorded for 10,000 timesteps, and the corresponding physical time was 0.1 s. Then, the Ffowcs Williams-Hawkings (FW-H) equation was solved for far-field noise prediction.

2.3. Noise Prediction by the FW-H Equation

Noise prediction was carried out using acoustic analogy theory. The input data of the noise prediction model were the near-field flow values calculated by the IDDES method. The time domain integral formula in Fluent software (ANSYS Fluent 2019 R2) was used [35] to directly calculate the time history of the sound signal at the specified receiving points. The FW-H equation can be written as [35]:
1 c 0 2 2 p t 2 2 p = 2 x i x j T i j H f x i P i j n j + ρ u i u n v n δ f + t ρ 0 v n + ρ u n v n δ f
where c o is the far-field sound speed, p = p p 0 is the far-field sound pressure and f = 0 represents the acoustic integral surface. u i and u n are the velocity components in the direction of flow and perpendicular to the sound-source surface, pointing to the external region, respectively. v i and v n are the velocity components of the sound source surface in the above two directions. H f is the Heaviside function and δ f is the Dirac delta function. T i j = ρ u i u j + P i j c 0 2 ρ ρ 0 δ i j is the Lighthill stress tensor, where P i j is the compressive stress tensor. For the Stokes’ fluid,
P i j = p δ i j μ u i x j + u j x i 2 3 u k x k δ i j
In this paper, the airfoil’s surface is selected as the acoustic integral surface. In that case, the quadrupole terms were neglected, and the Lighthill stress tensor was not calculated.

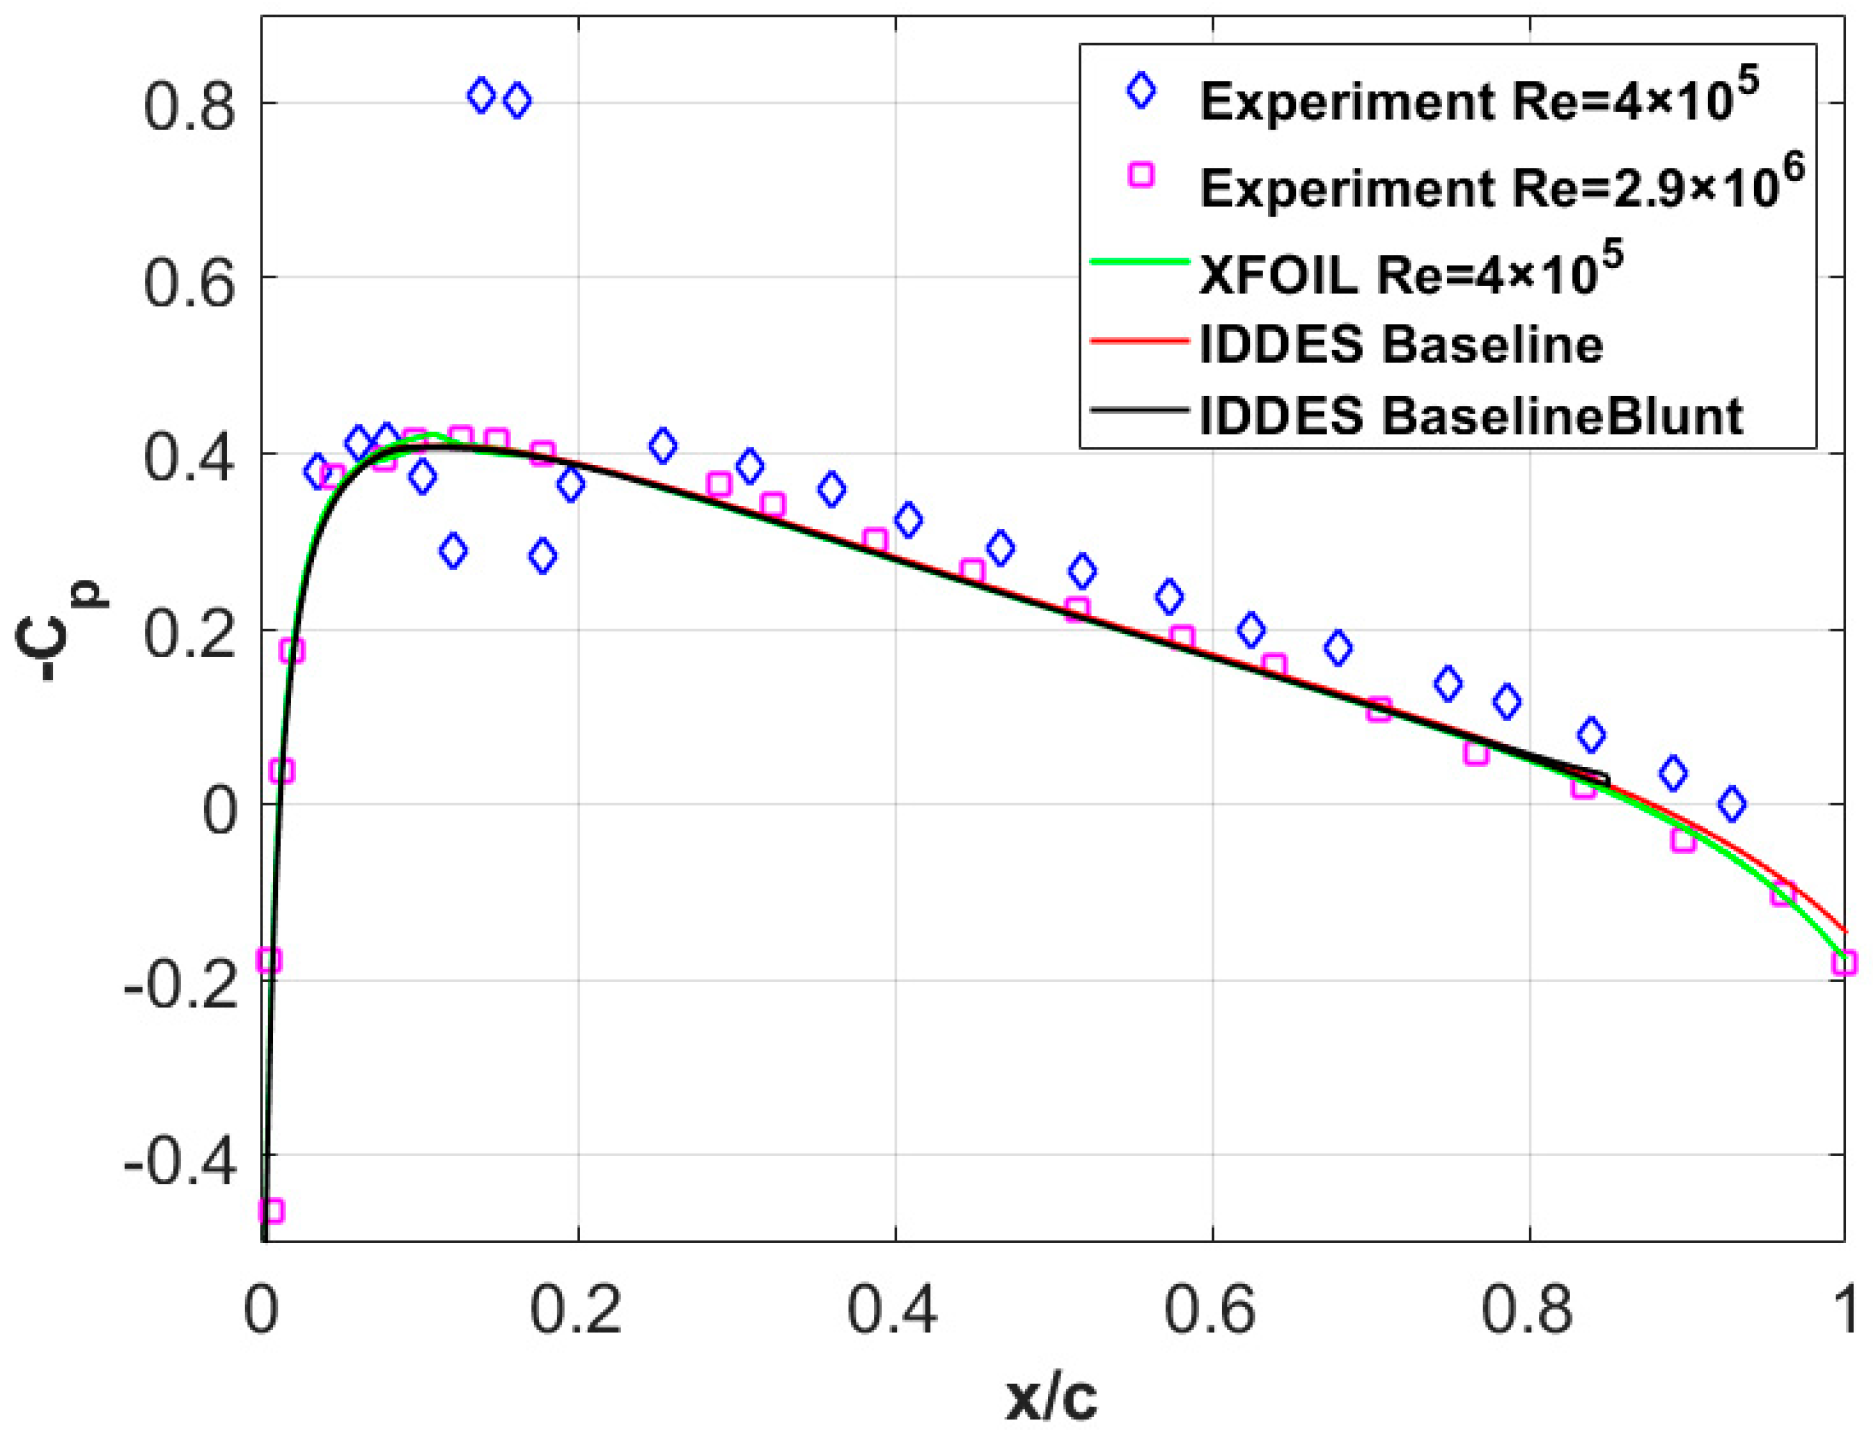
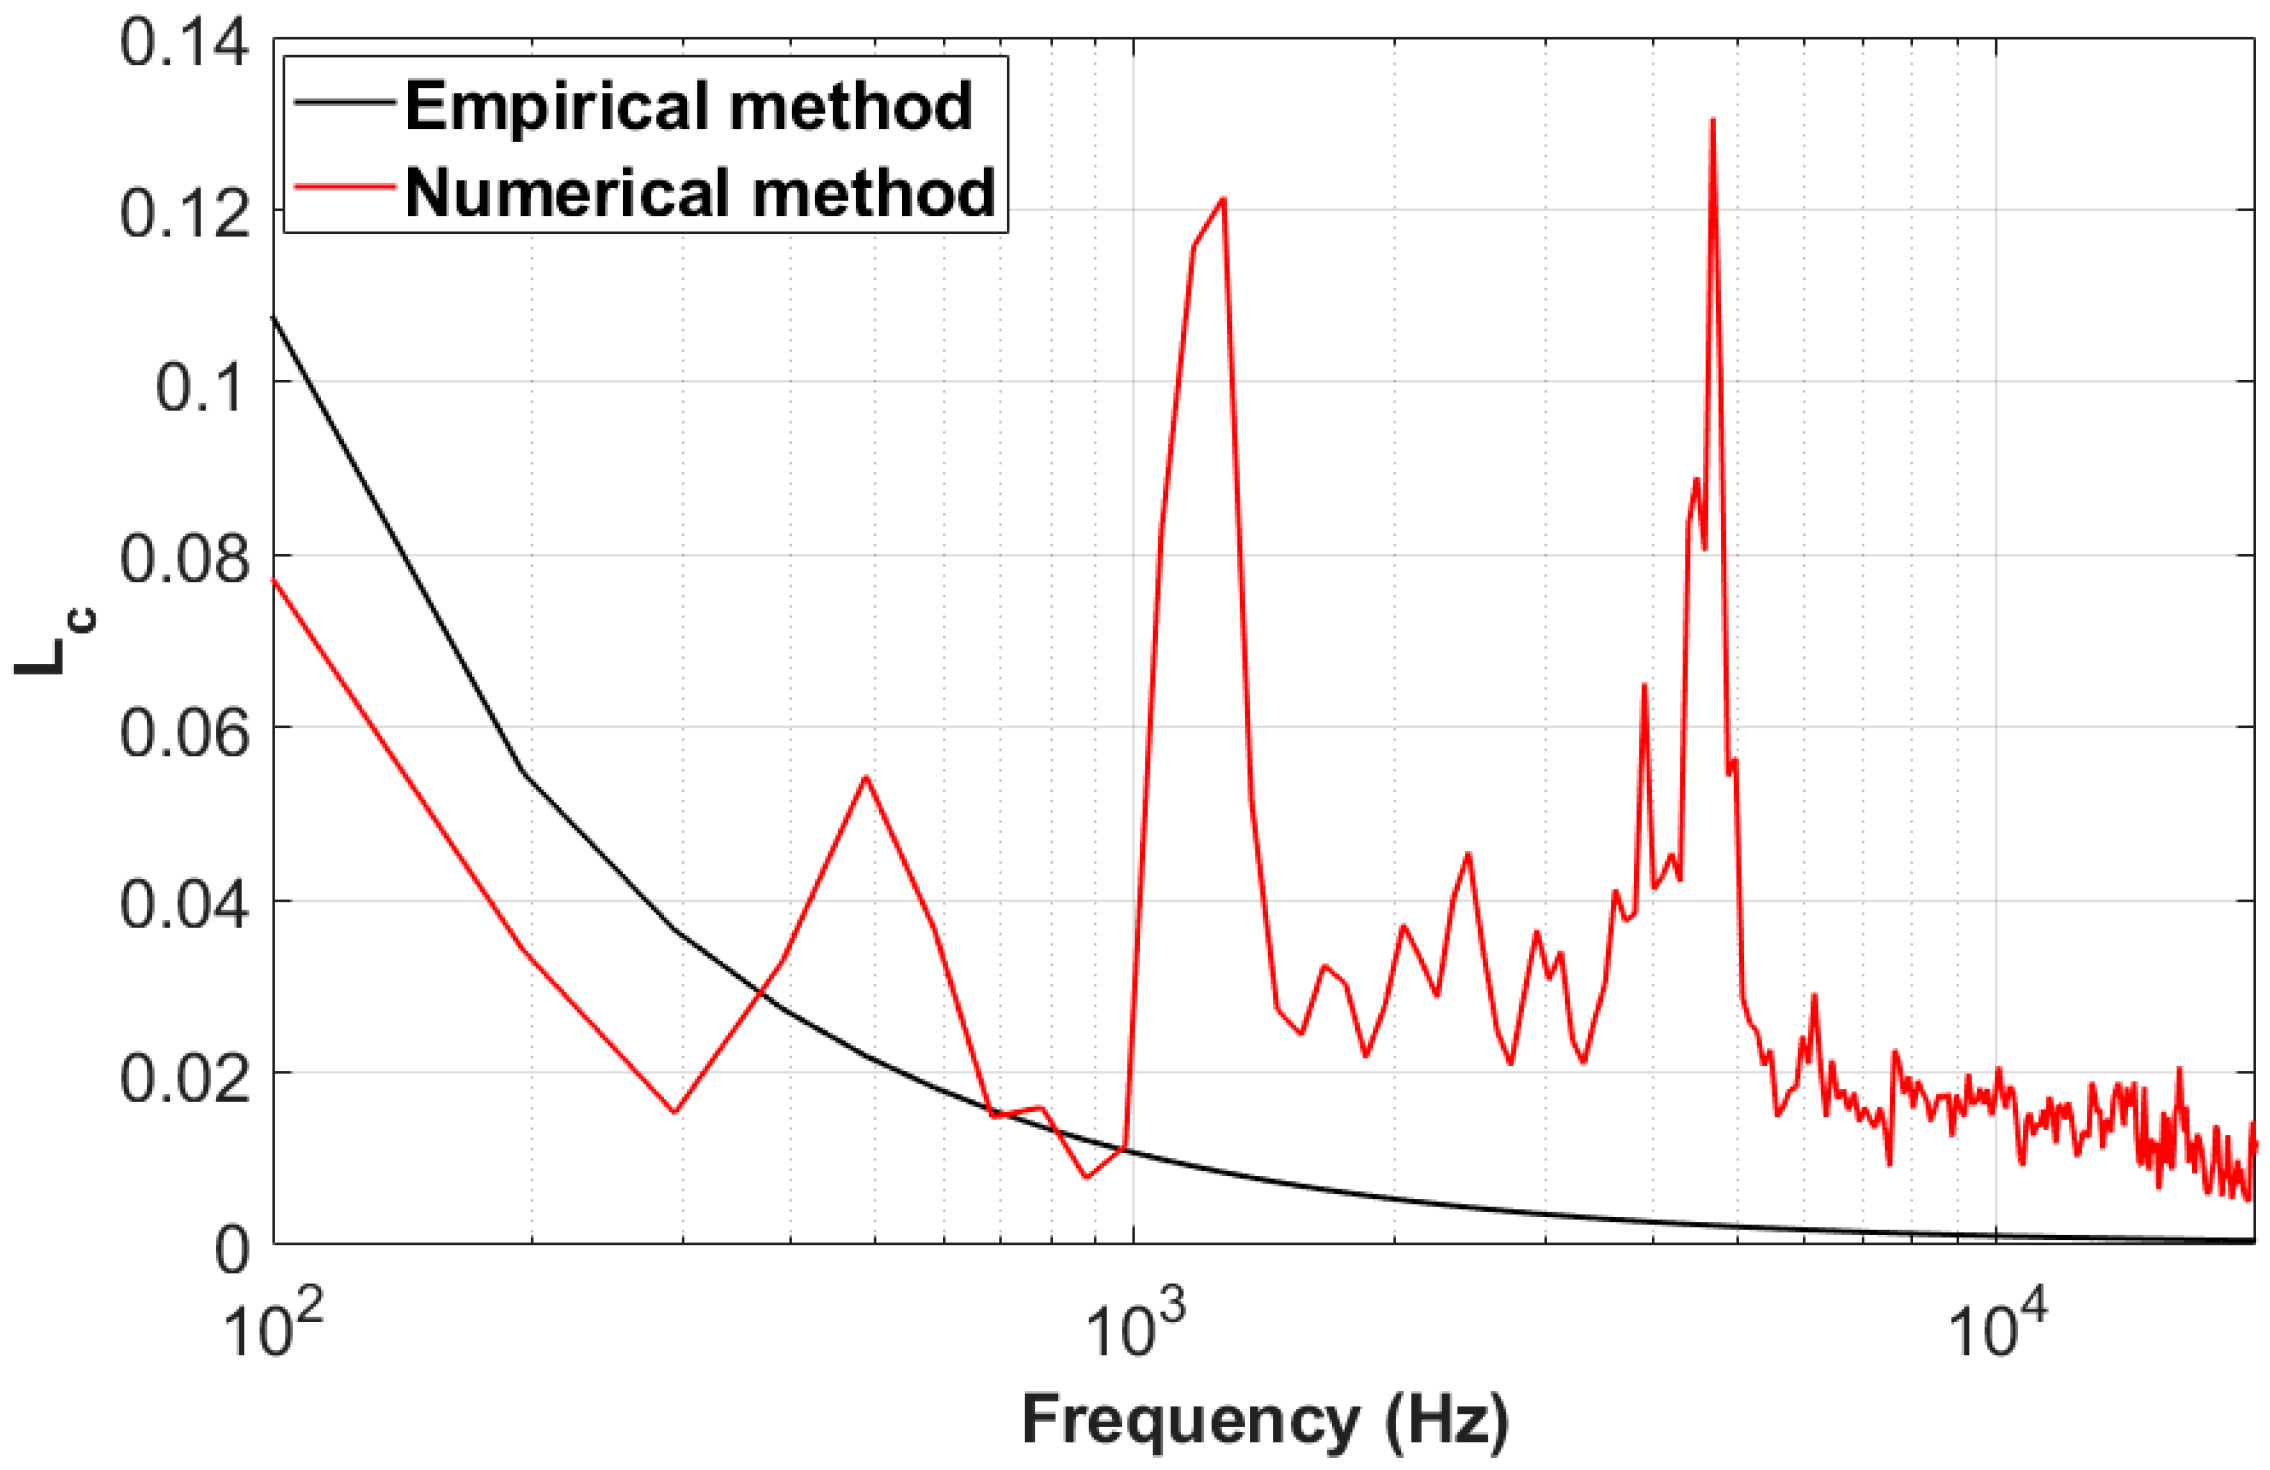
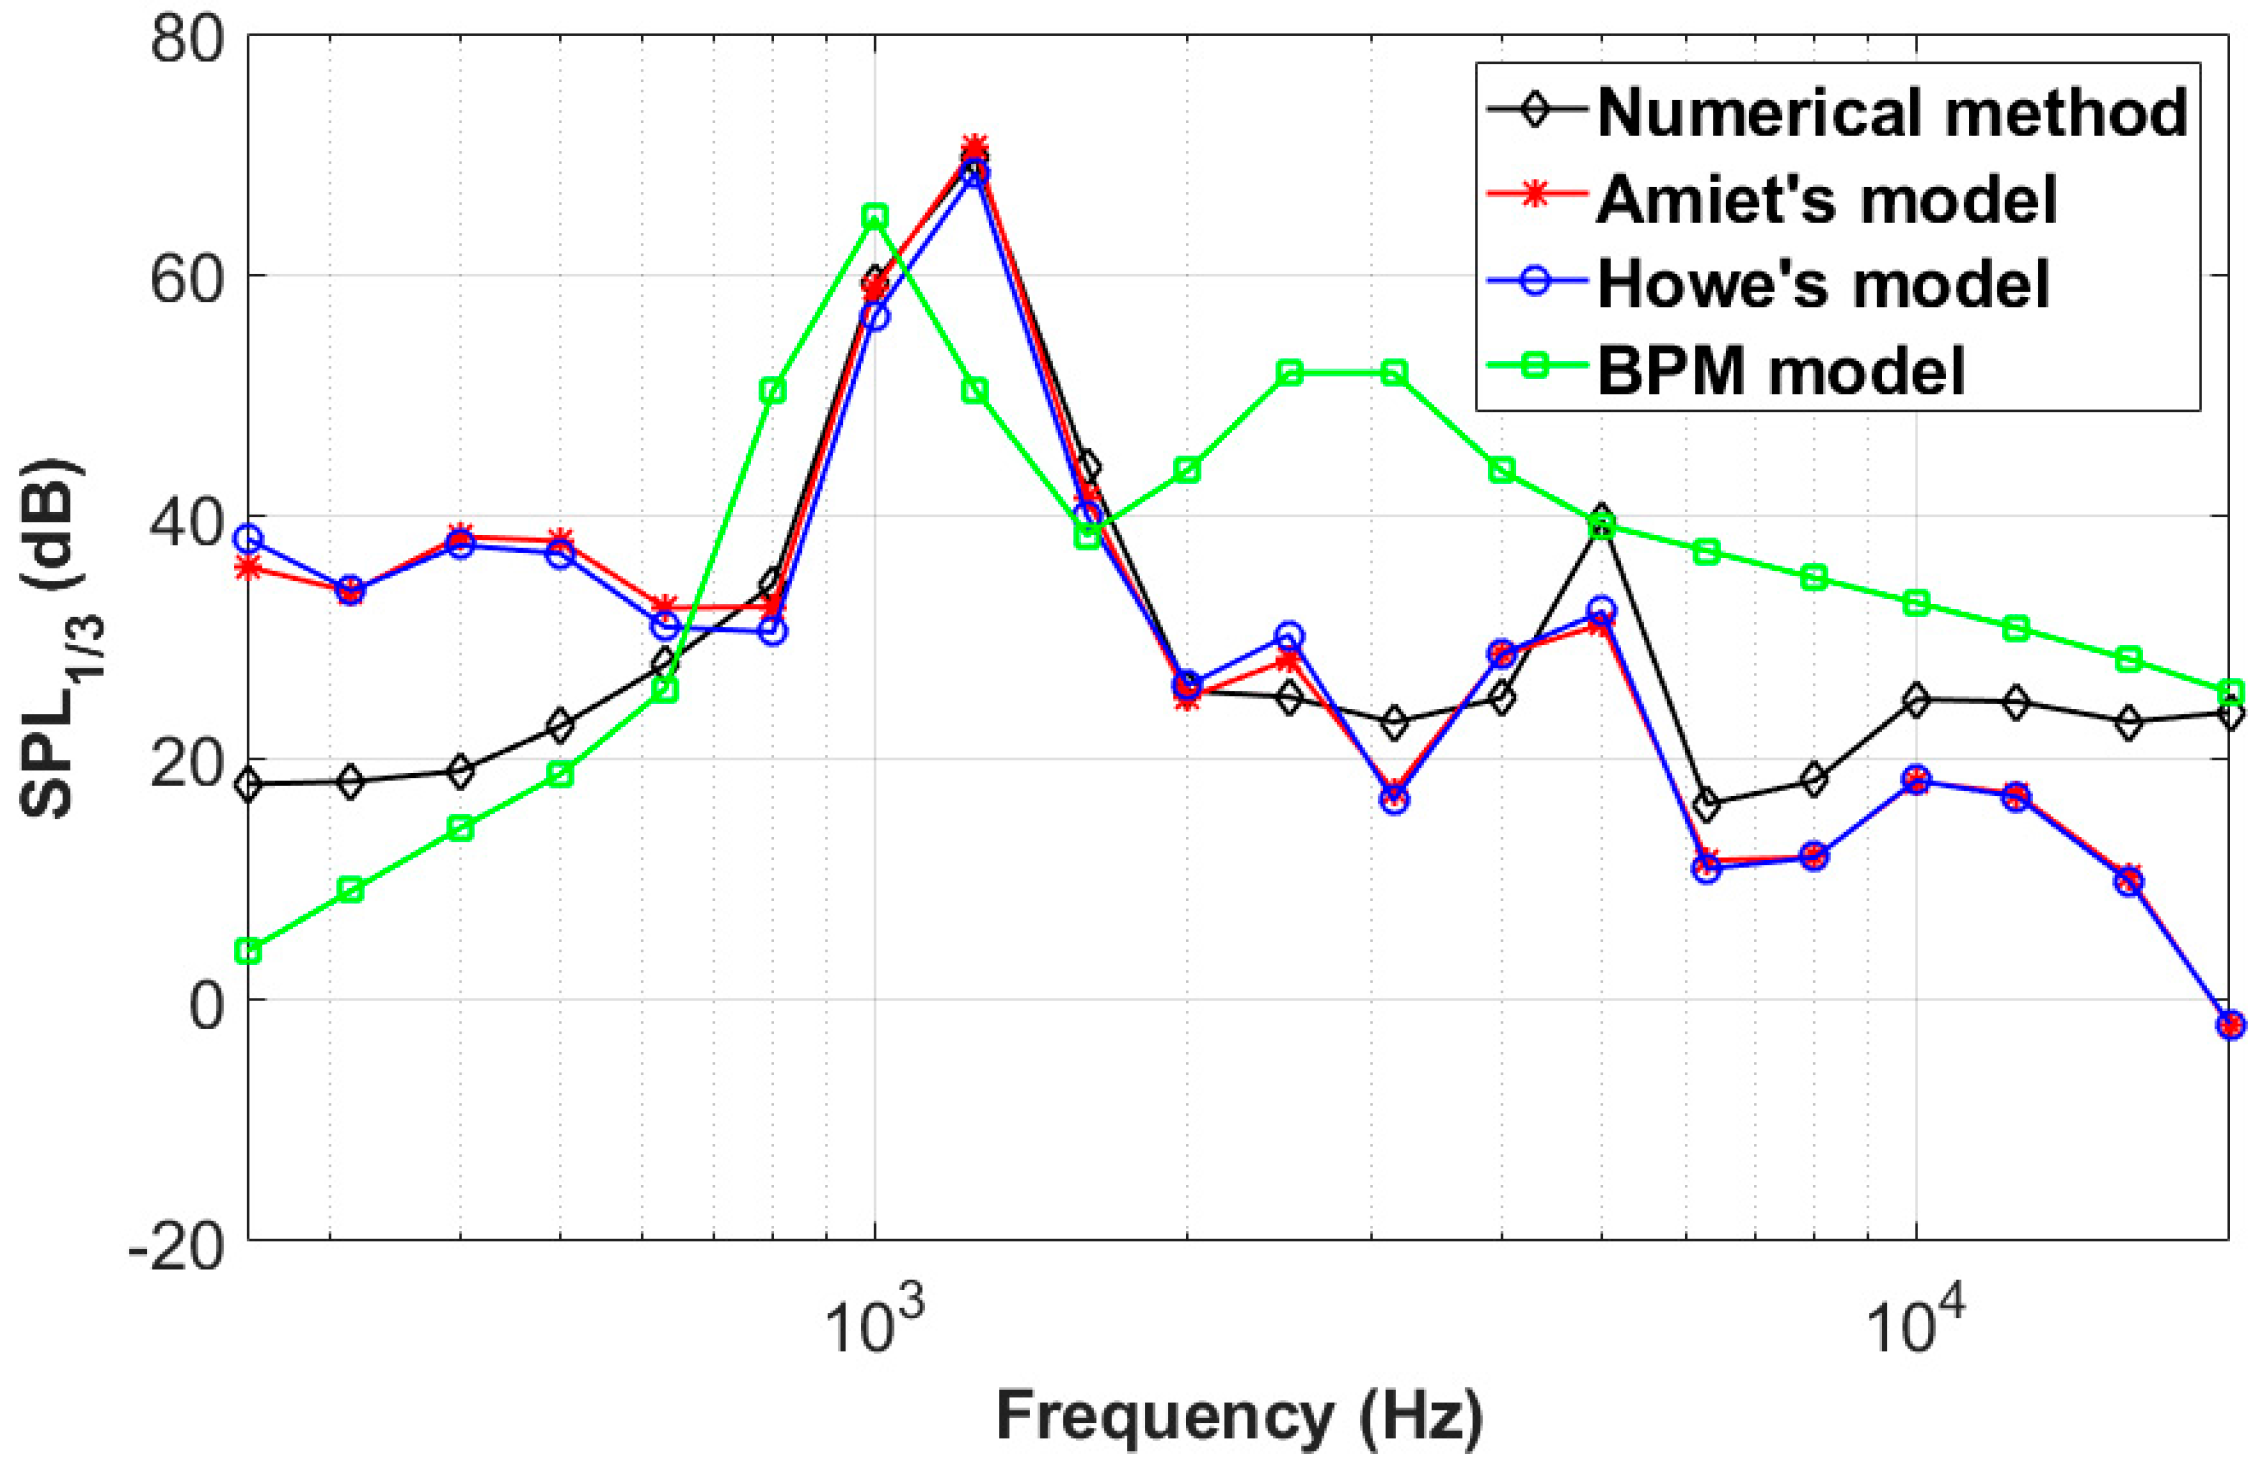
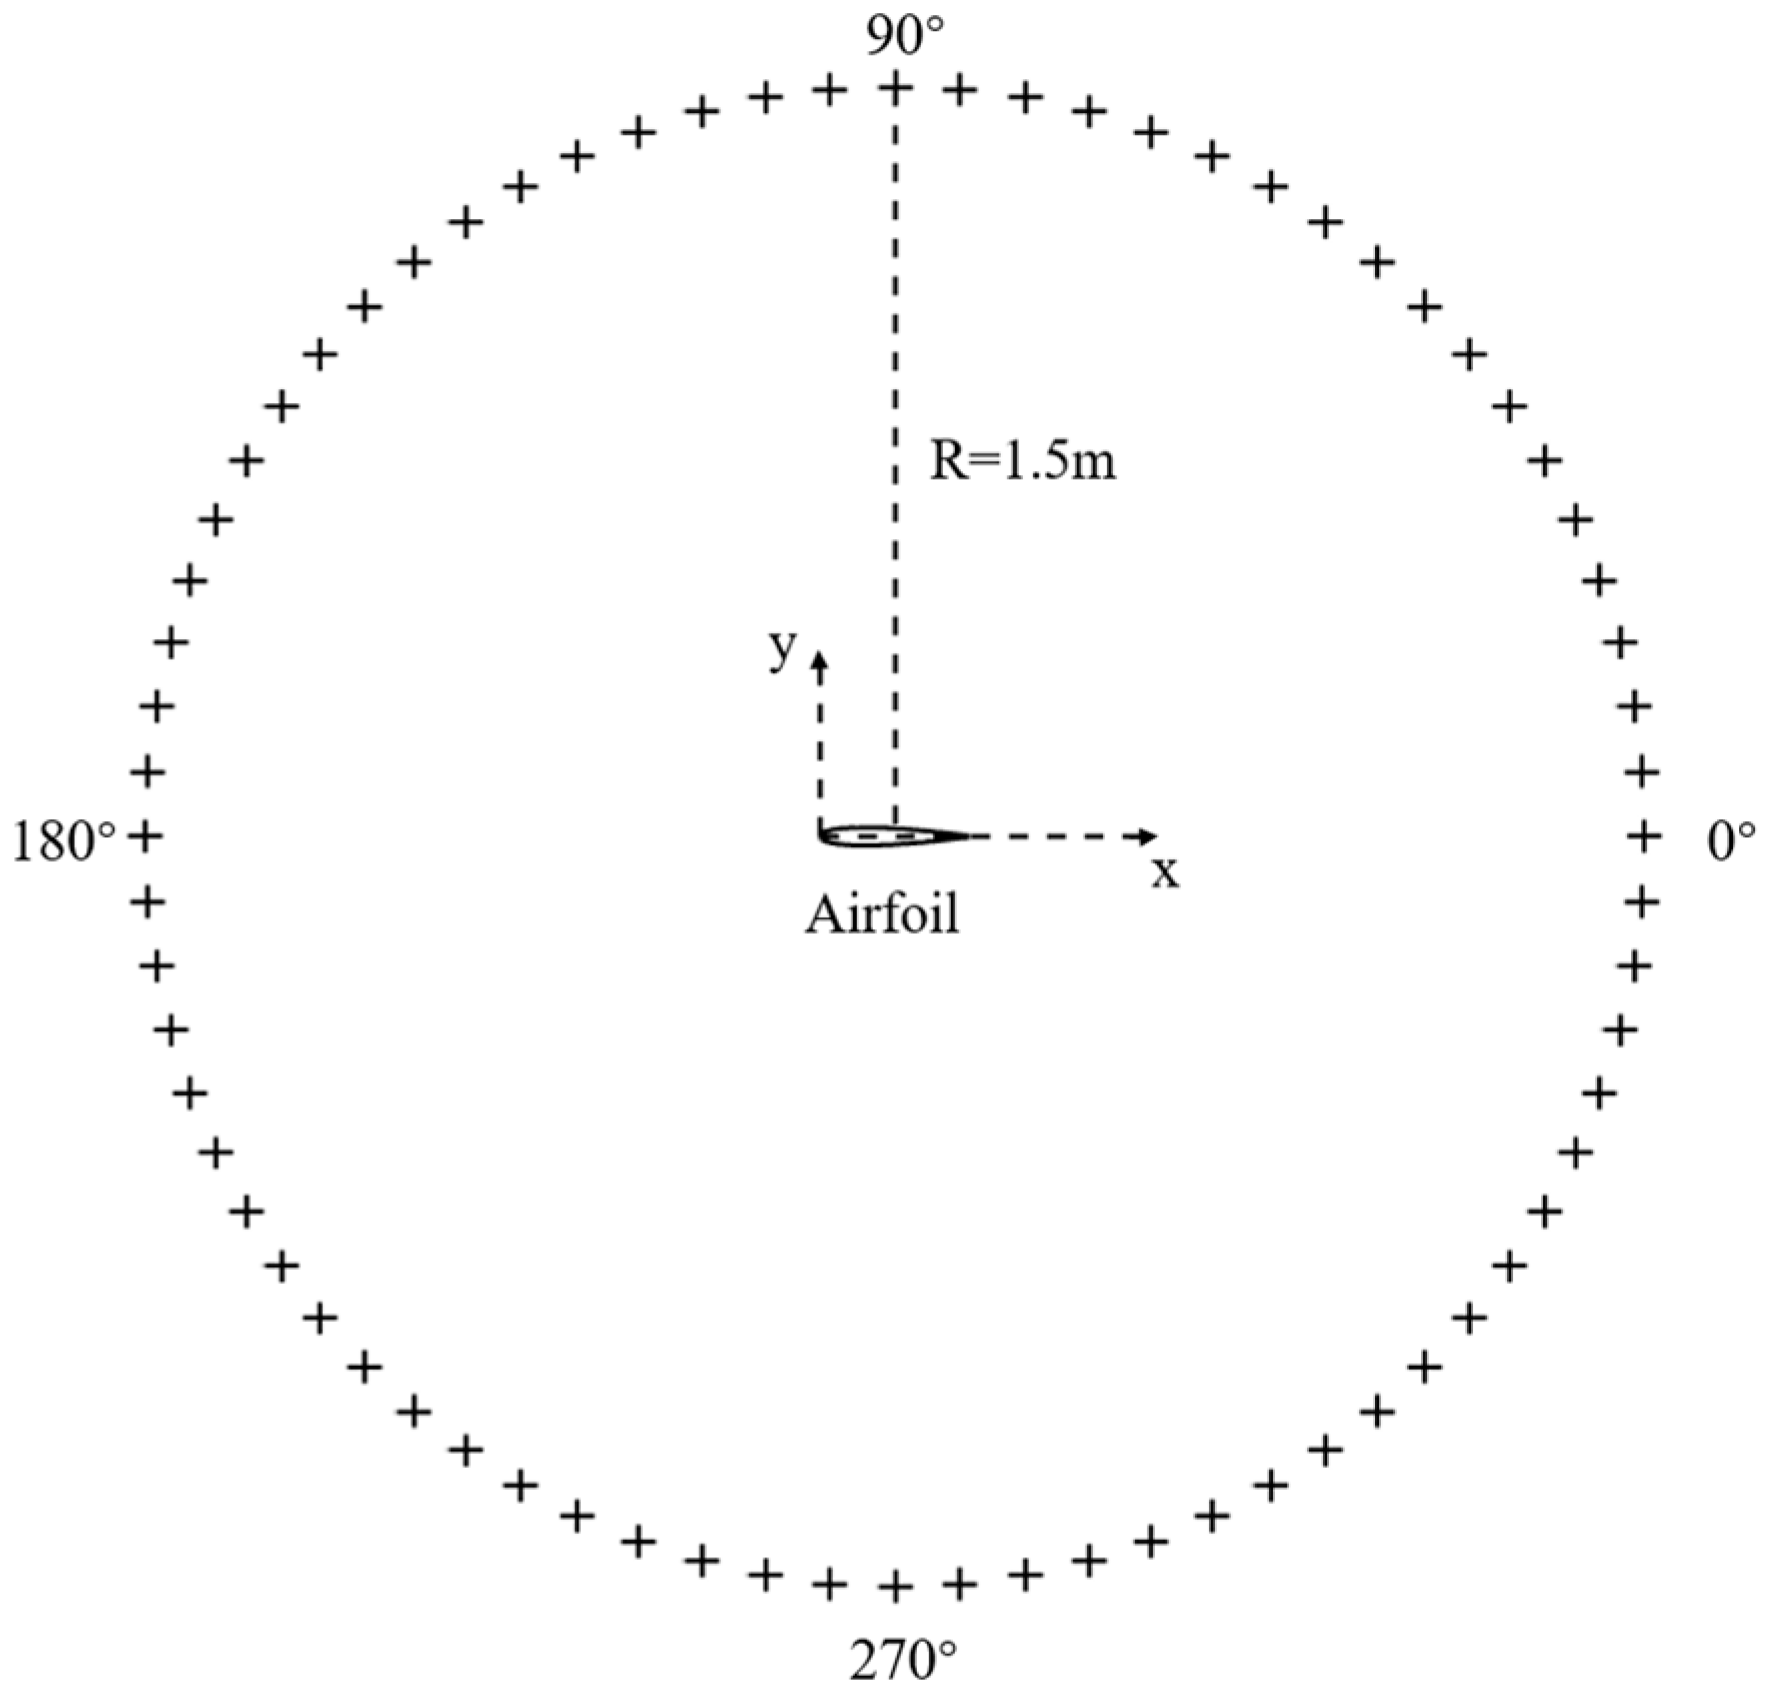
2.4. Validation and Verification of the Numerical Method

The validation of the CFD simulations was performed using the baseline NACA0012 airfoil. The distribution of pressure coefficient on the airfoil surface is shown in Figure 4. The numerical calculation results using IDDES method in this paper are compared with the XFOIL [37] prediction results and the experimental results of Garcia-Sagrado et al. [38] and Gregory et al. [39]. It can be seen in the figure that the results agree well, which proves the validation of the numerical calculation method for the flow field in this paper. As for the difference between the experimental Re of 400,000 and the simulation results at x/c < 0.2, it may have been due to a trip wire being placed at 12.7% of the chord length of the airfoil’s surface in the experiment to ensure a turbulent boundary layer at the trailing edge [38].
The theory of airfoil trailing-edge noise might be the first noise problem concerned with people, and several trailing-edge prediction models have been proposed by Amiet [40], Howe [41] and Brooks et al. [1]. The trailing-edge noise model proposed by Amiet is given by:
S p p ω = ω b z 2 π c 0 σ 2 2 l y ω d L 2 S q q ω
The trailing-edge noise model proposed by Howe is given by [42]:
S p p ω = 1 4 L π 2 R 2 M c 1 M c l y ω S q q ω
where S p p ω is the power spectral density (PSD) of the far-field sound pressure, S q q ω is the spectrum of wall pressure at the airfoil trailing edge, ω = 2 π f is the angular frequency, b = c / 2 is the semi-chord, R is the distance from the receiver to the noise source, L is the span length, z = R sin θ (θ is the directivity angle), d = L / 2 is the semi-span, U c is the convection velocity, M c = U c / c 0 is the convective Mach number, σ = x 2 + 1 M 2 z 2 and L is the lift function. l y ω is the coherence length, spanwise, which is often represented by the following Corcos model [43].
l y ω 2.1 U c / ω
where the convection velocity is often assumed to be U c = 0.8 U . However, it should be noted that the Corcos’s model is mainly suitable for attached turbulent boundary layer flow. When using Amiet’s model or Howe’s model to predict the trailing-edge bluntness noise, the direct adoption of Corcos’s model may lead to a large discrepancy.
Therefore, in this study, the spanwise coherence length was firstly calculated based on the high-fidelity IDDES data. The spanwise coherence coefficient of the surface-pressure fluctuations is defined as:
γ p p Δ z , f = S p p Δ z , f S p p z 1 , f S p p z 2 , f
There are 65 spanwise monitoring points at 0.98c on the airfoil’s surface. The spanwise coherence coefficient between different spanwise locations at each frequency is computed by Equation (11). Then, the following Gaussian function is used to determine the spanwise coherence length L c f by least-square fitting of the coherence coefficient curve.
γ z , f = exp π 4 z 2 L c f 2
The spanwise coherence length calculated using the IDDES data and the empirical Corcos model [43] given by Equation (10) are shown in Figure 5. It can be seen in Figure 4 that there are great differences between the empirical model and the calculated results, especially around the frequencies of vortex shedding from the trailing edge. It is proved that Corcos’s model cannot be used for the prediction of spanwise coherence length for trailing-edge vortex shedding. Consequently, it is necessary to firstly compute the spanwise coherence length based on the high-fidelity numerical methods or high-resolution experiments before Amiet/Howe’s model can be used for bluntness-noise prediction.
The spanwise coherence length computed based on the IDDES data was substituted into the Amiet/Howe’s model for noise prediction, as shown in Figure 6. The noise prediction using the famous BPM (Brooks, Pope and Marcolini) model is also plotted in this figure. The details about the BPM model are not given here for clarity, and they can be found in the literature [1]. The receiver point was 1.5 m away from the airfoil, and the azimuthal angle was 90°.
As shown in Figure 6, the noise spectra predicted by Amiet’s and Howe’s models are basically consistent, and the noise spectrum predicted by the IDDES/FW-H method agrees well with the above two models in the range of 600–10,000 Hz. The low-frequency noise and vortex-shedding noise predicted by the present numerical method are also in good agreement with the BPM model. However, obvious differences are observed in mid- to high frequencies, which might be due to the limitations of the semi-empirical model [44].

3. Results and Discussions

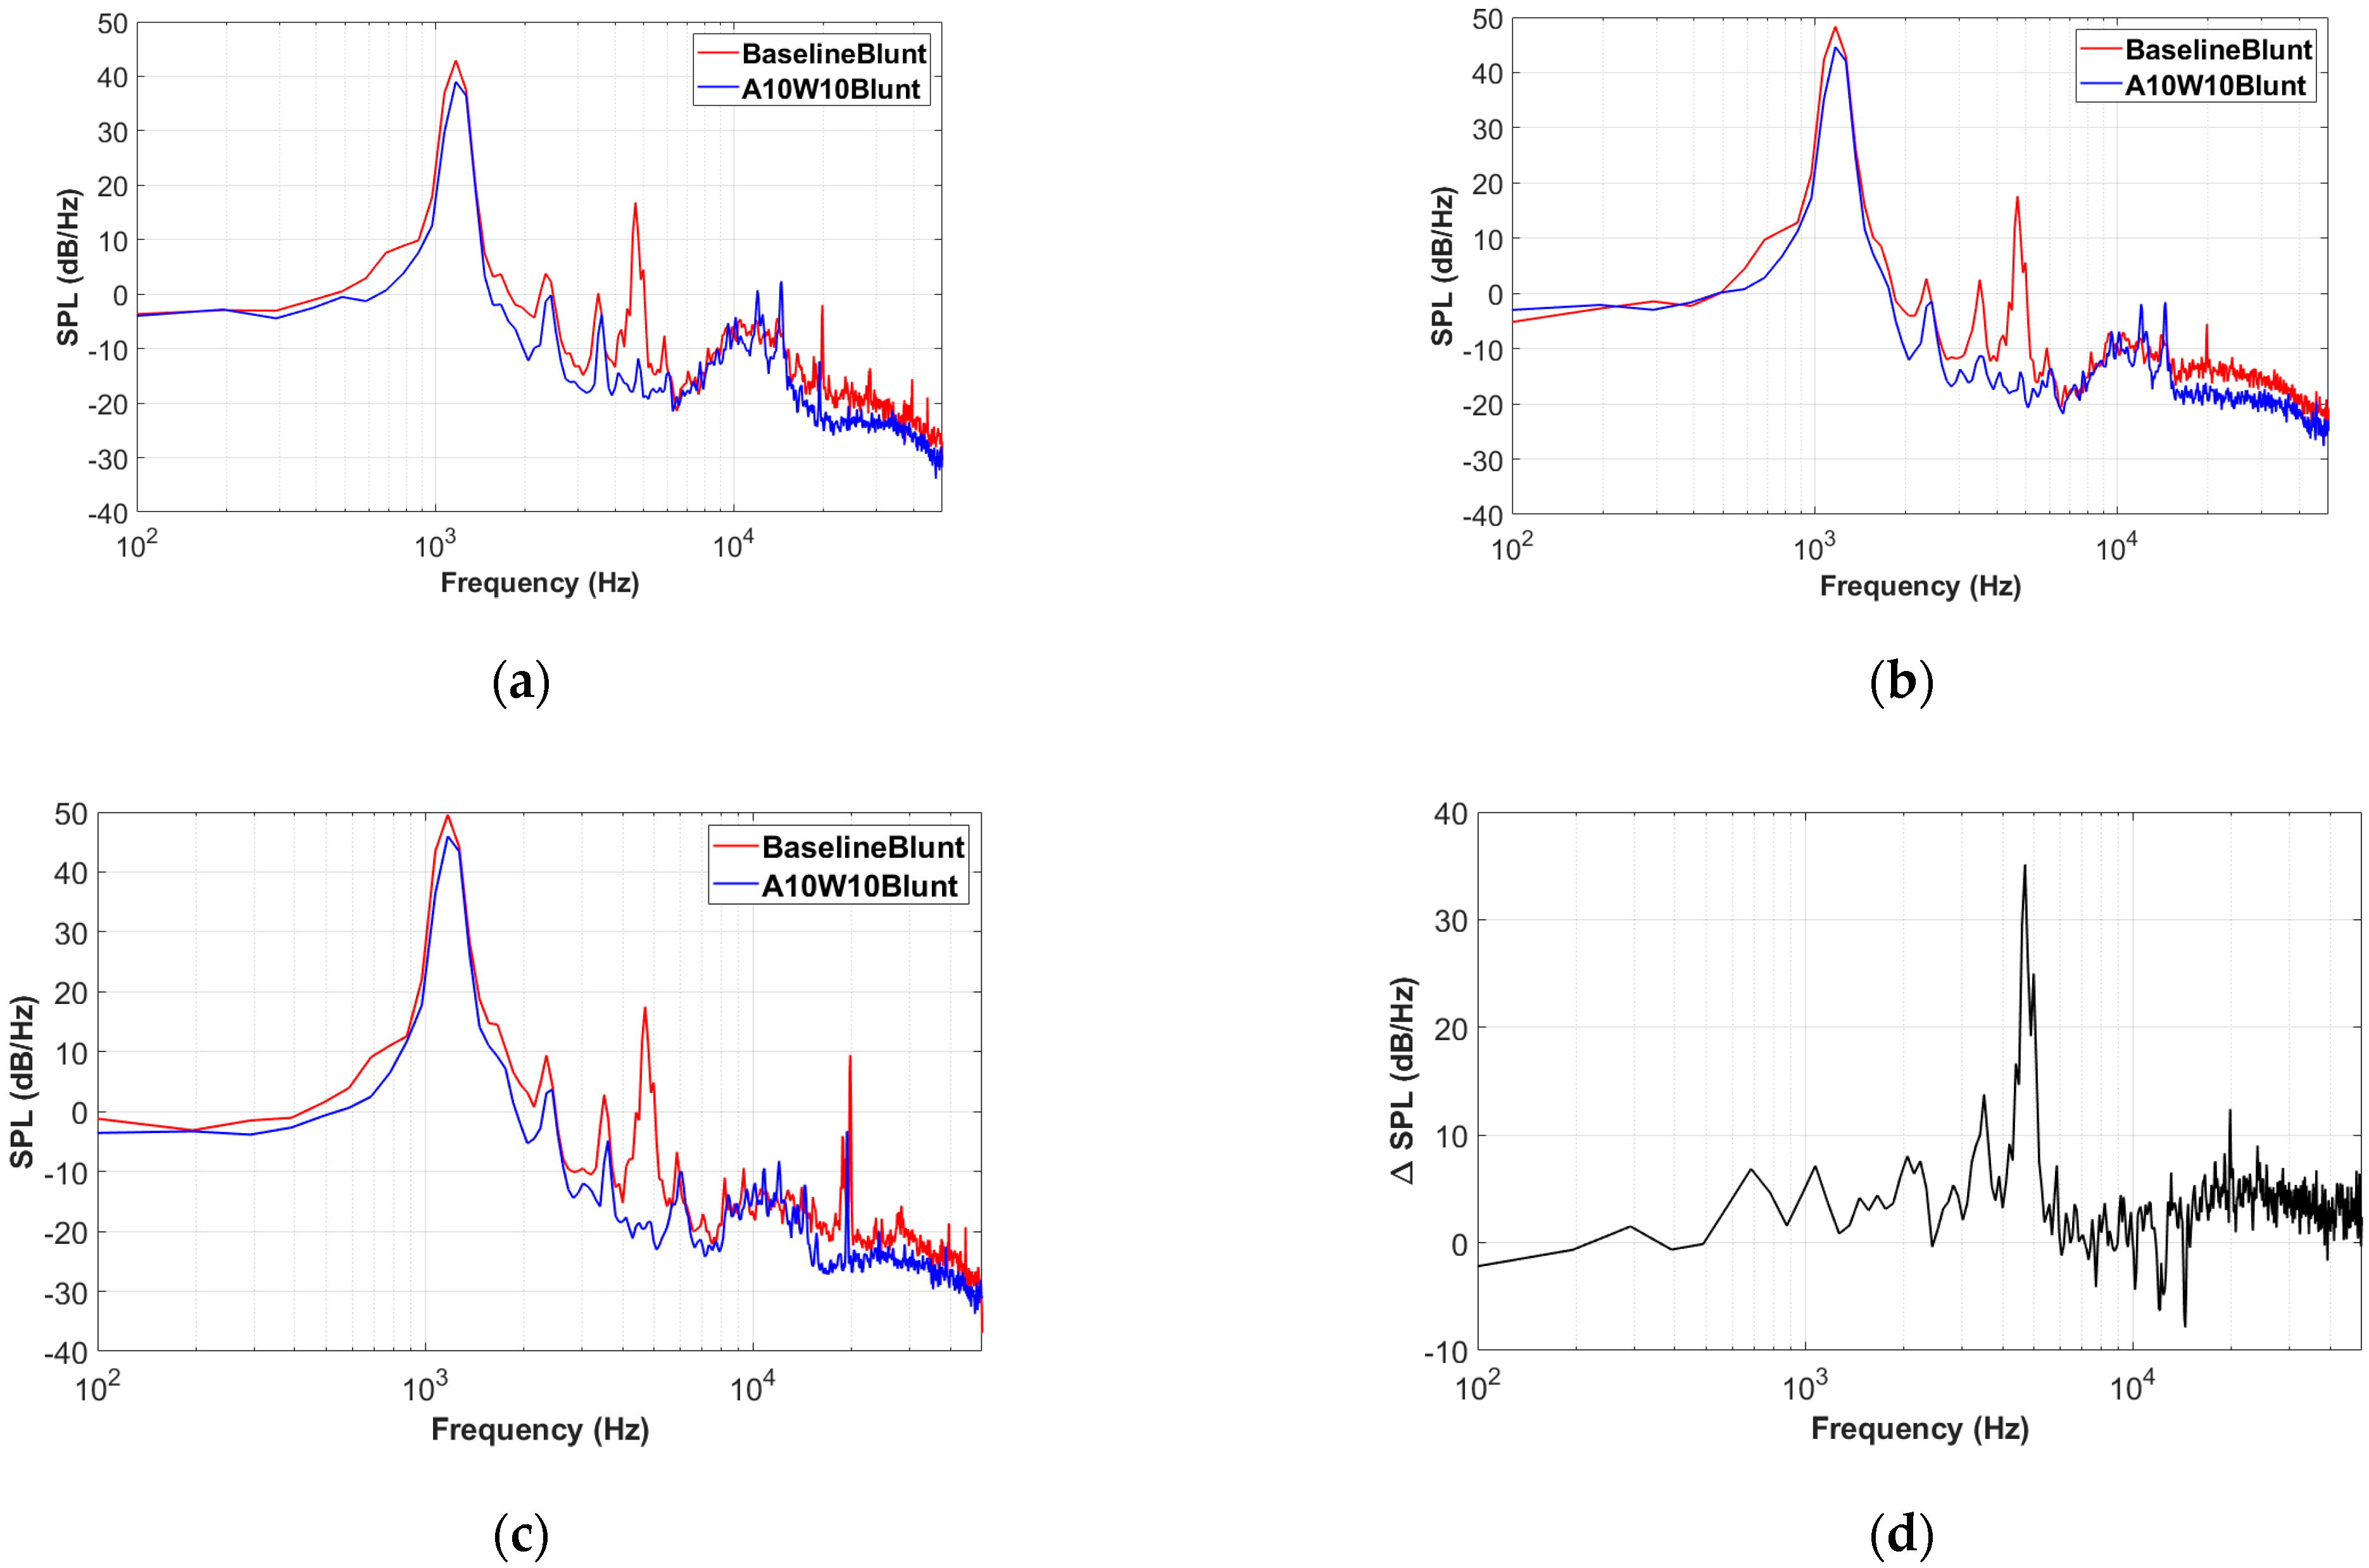
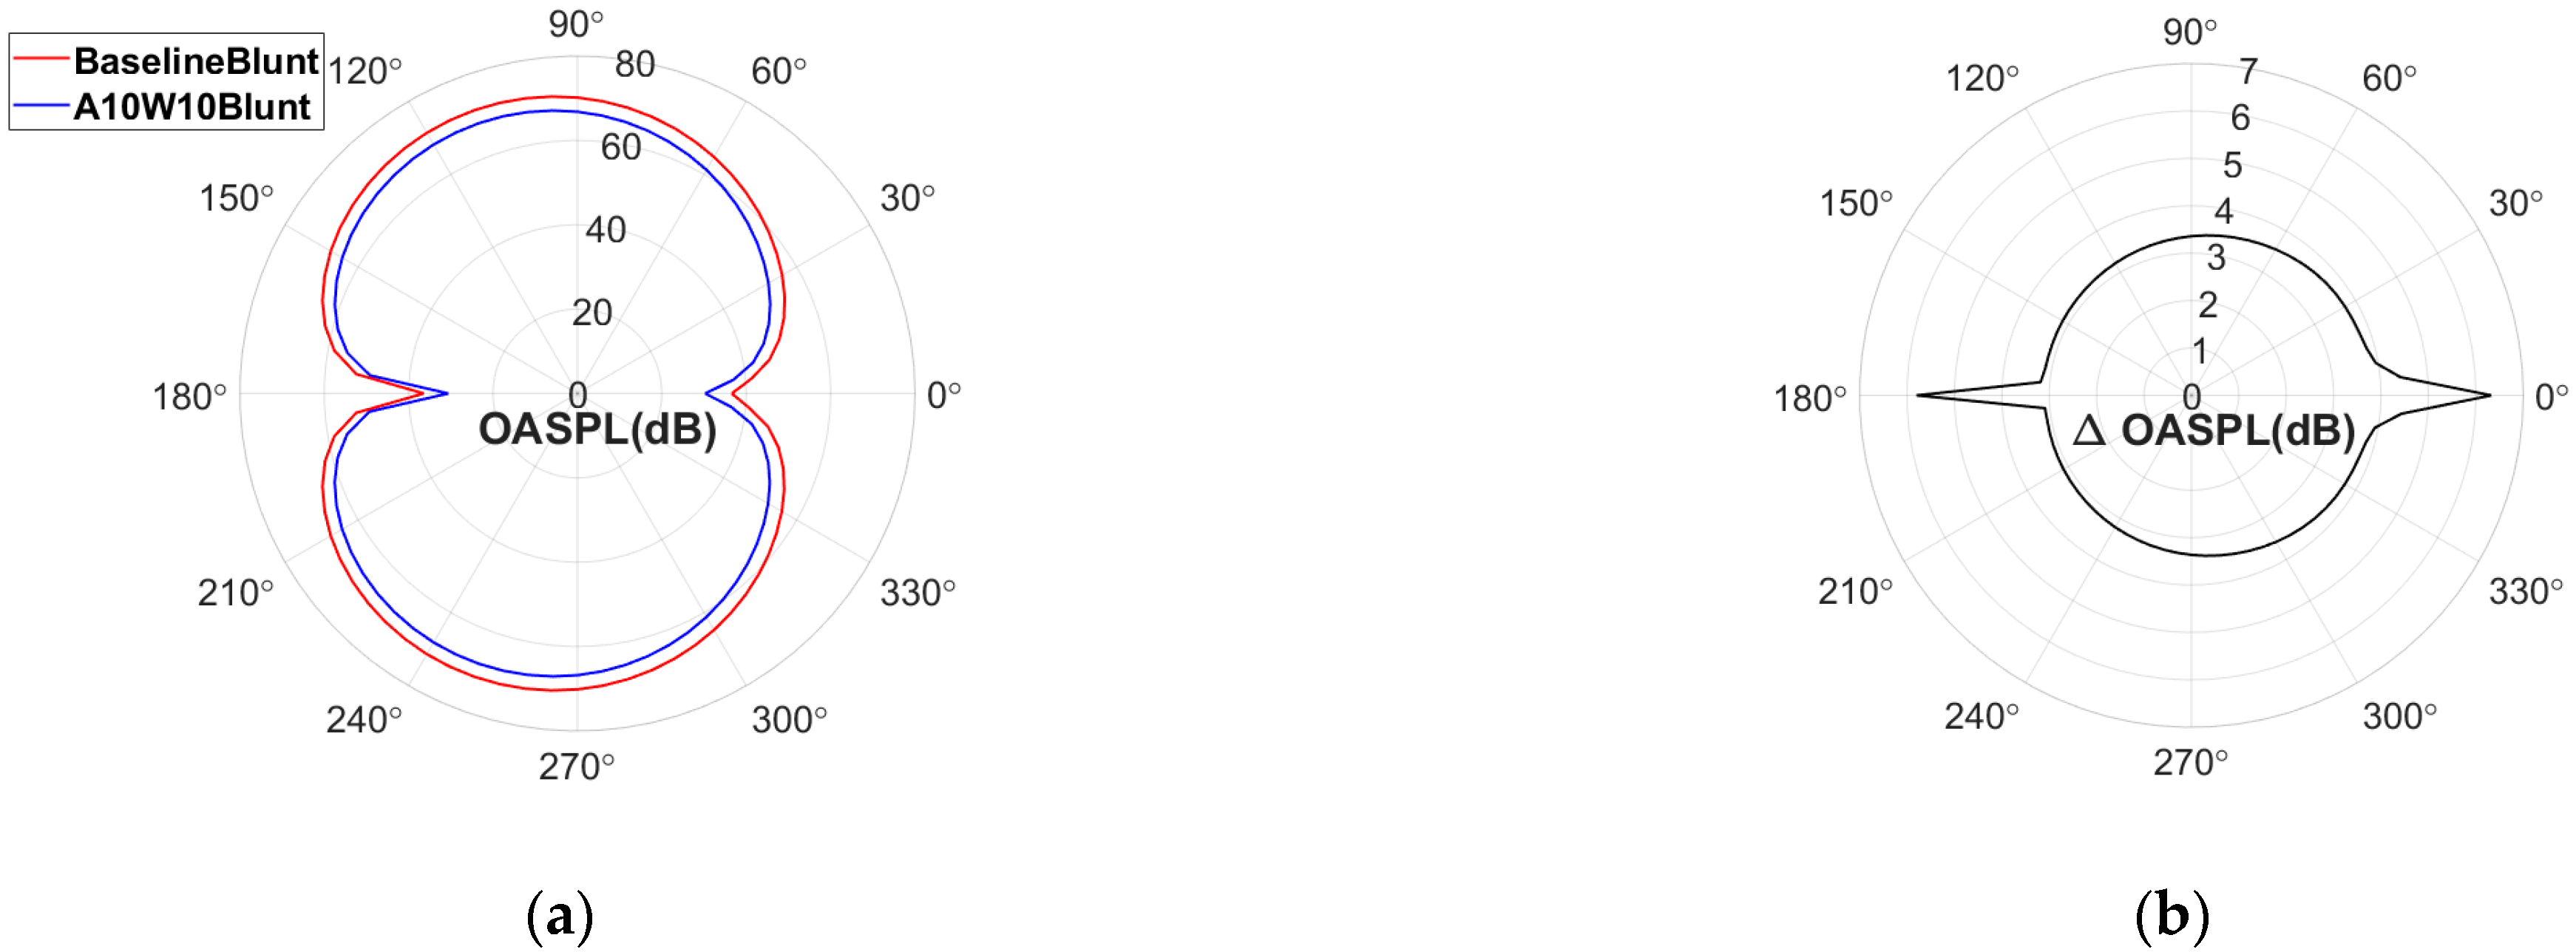
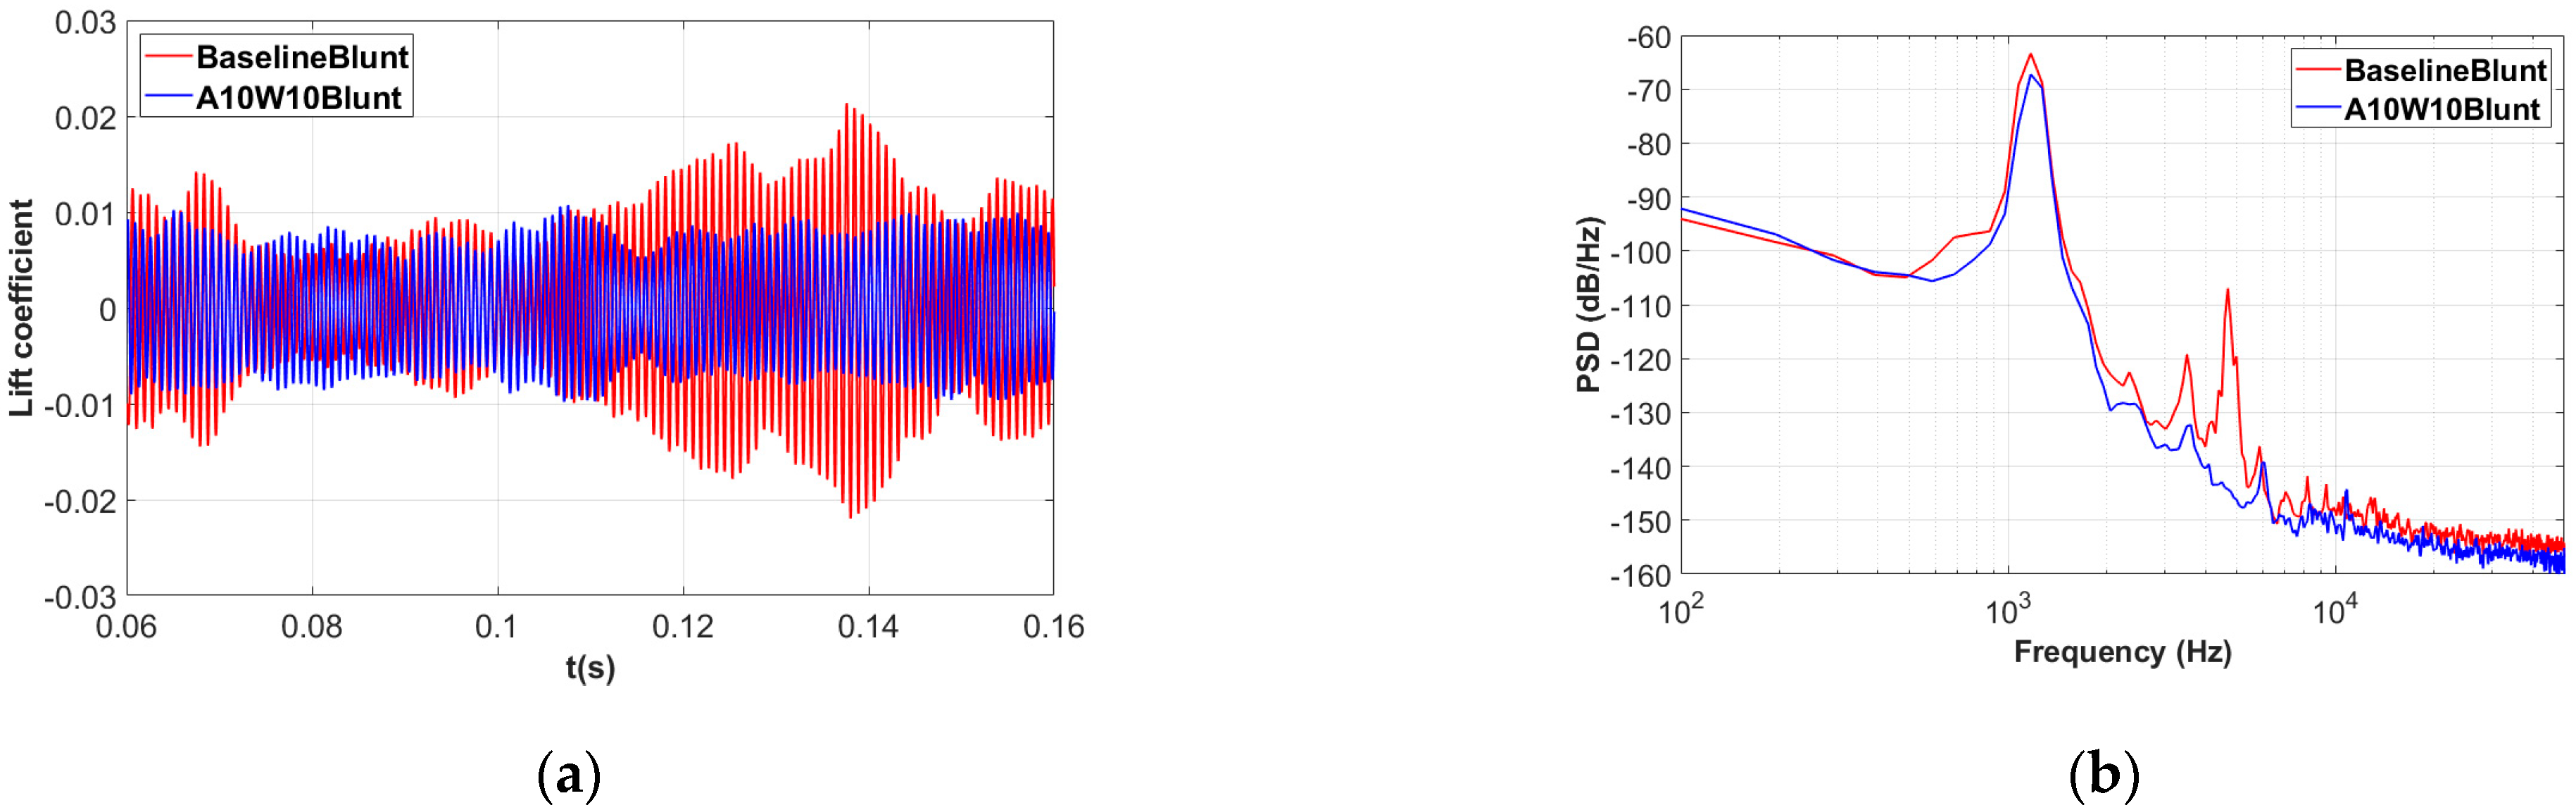
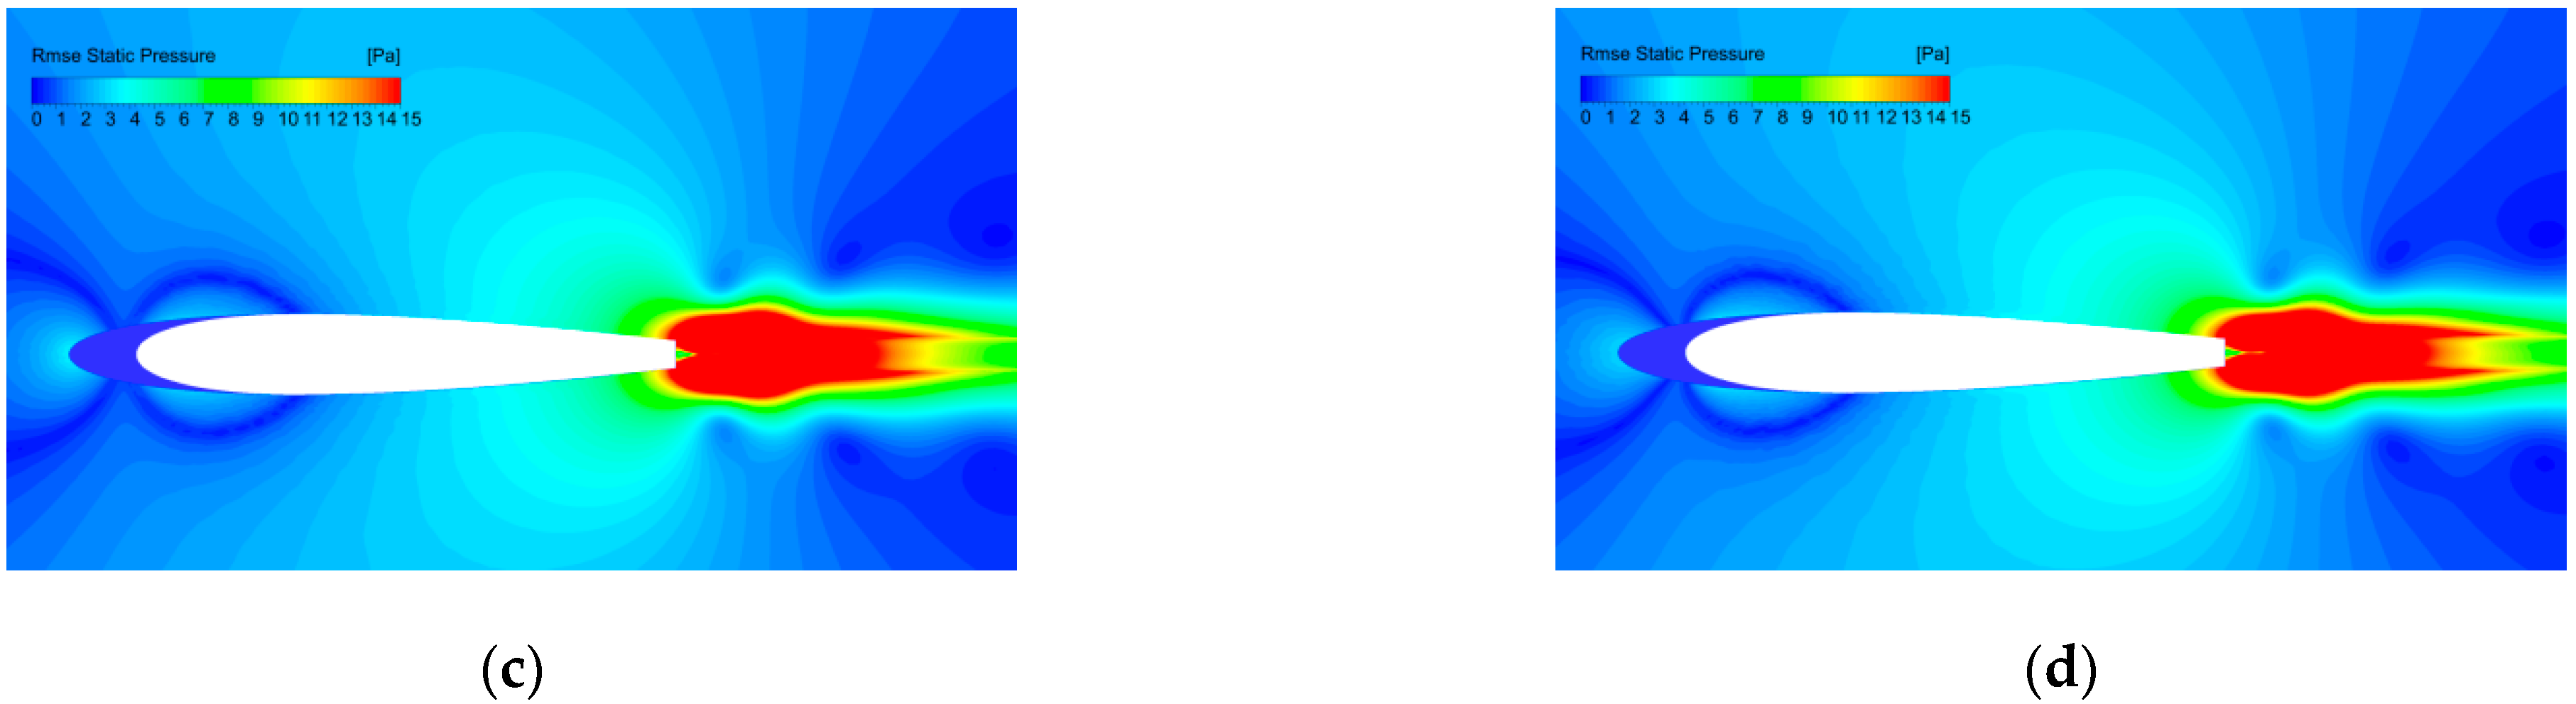
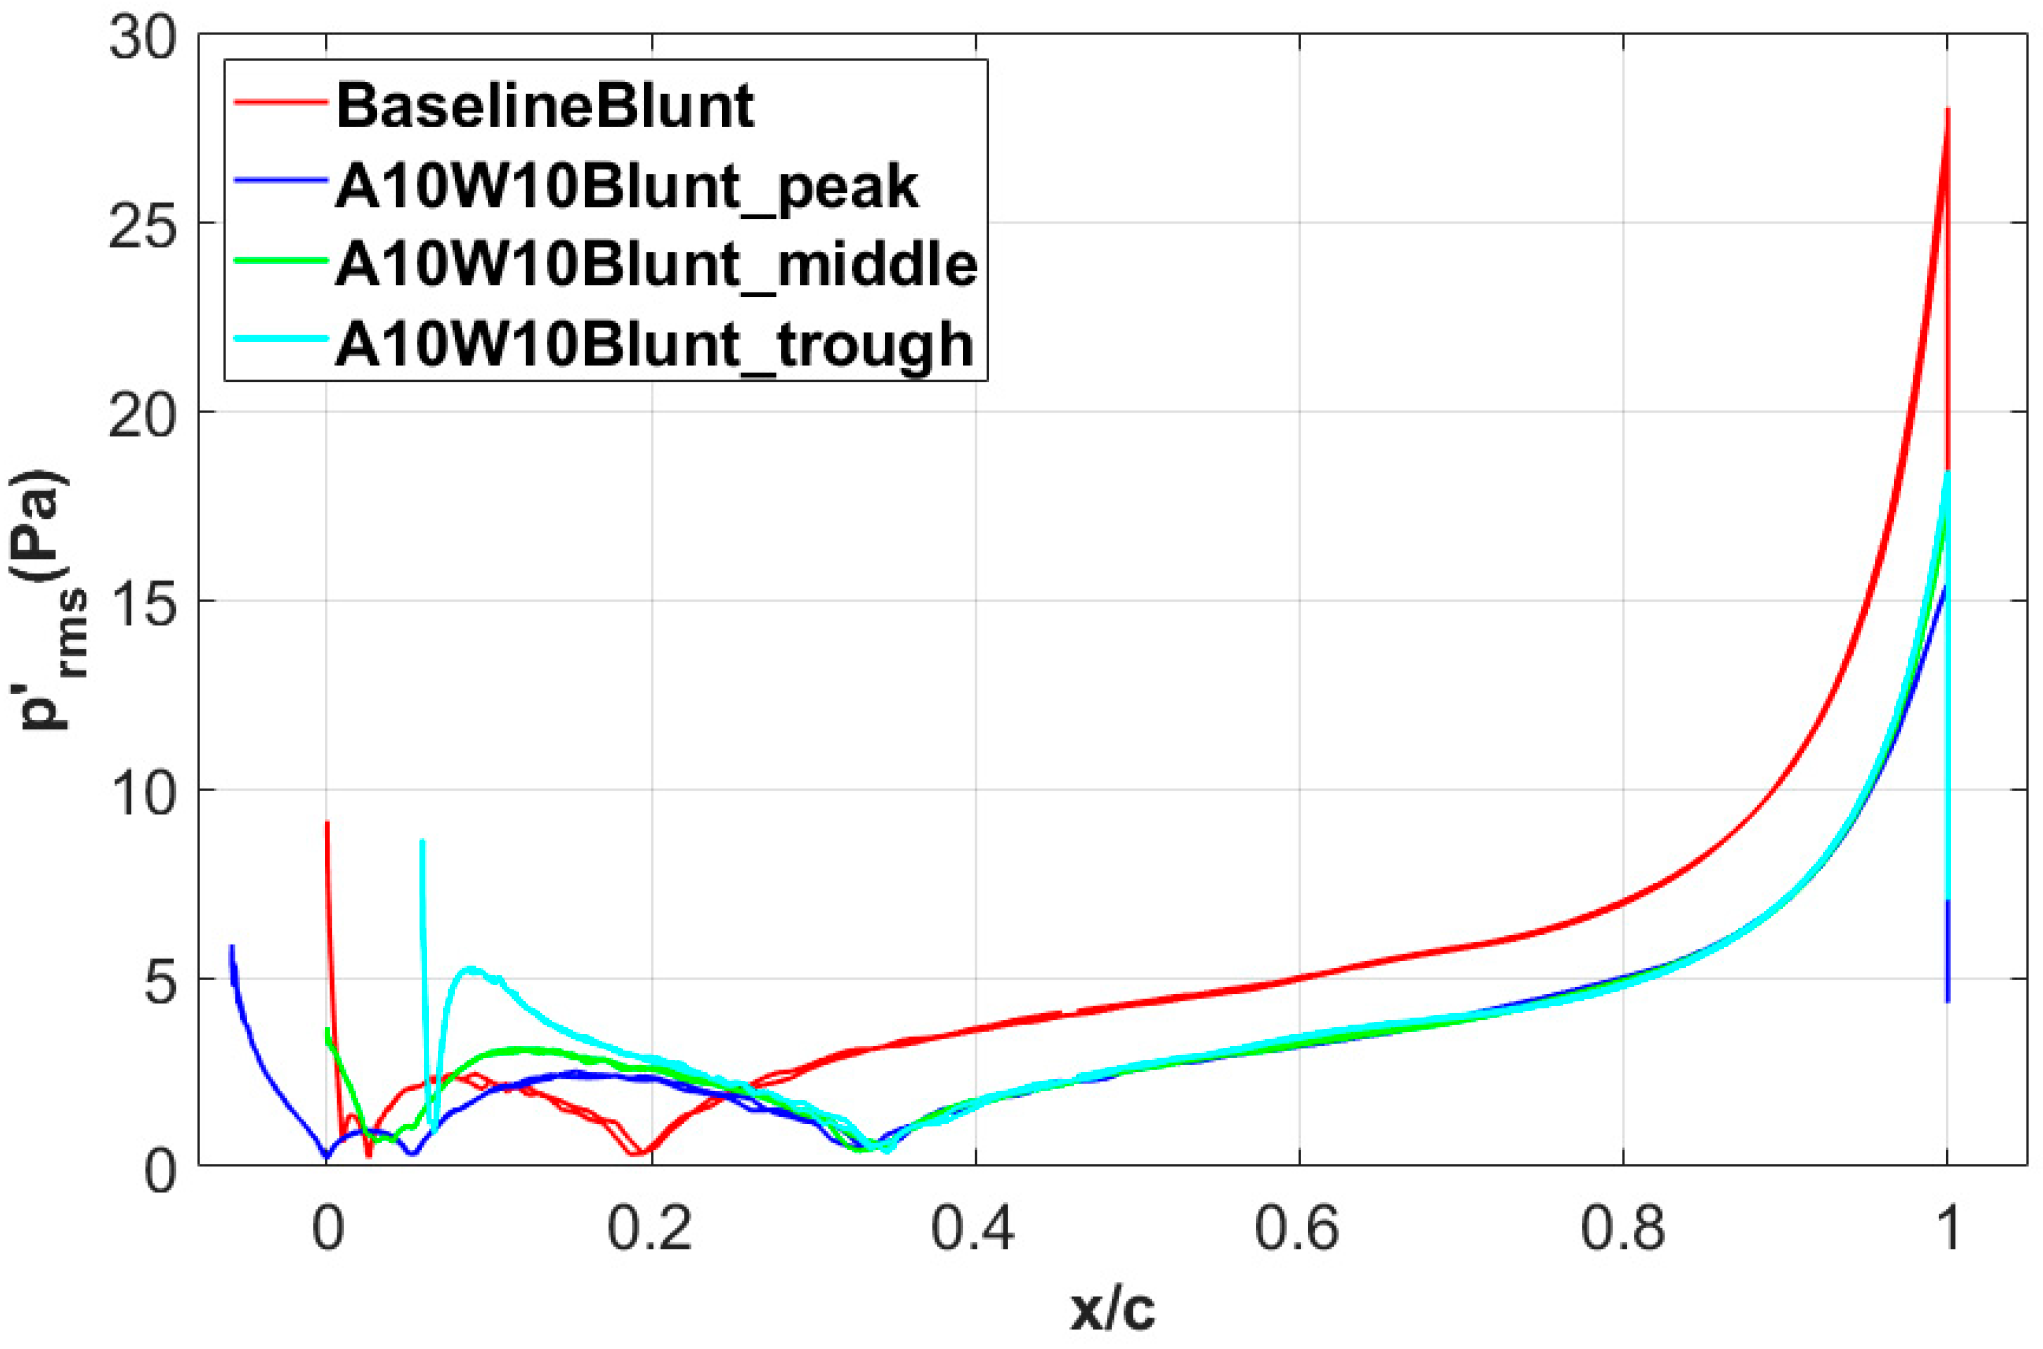
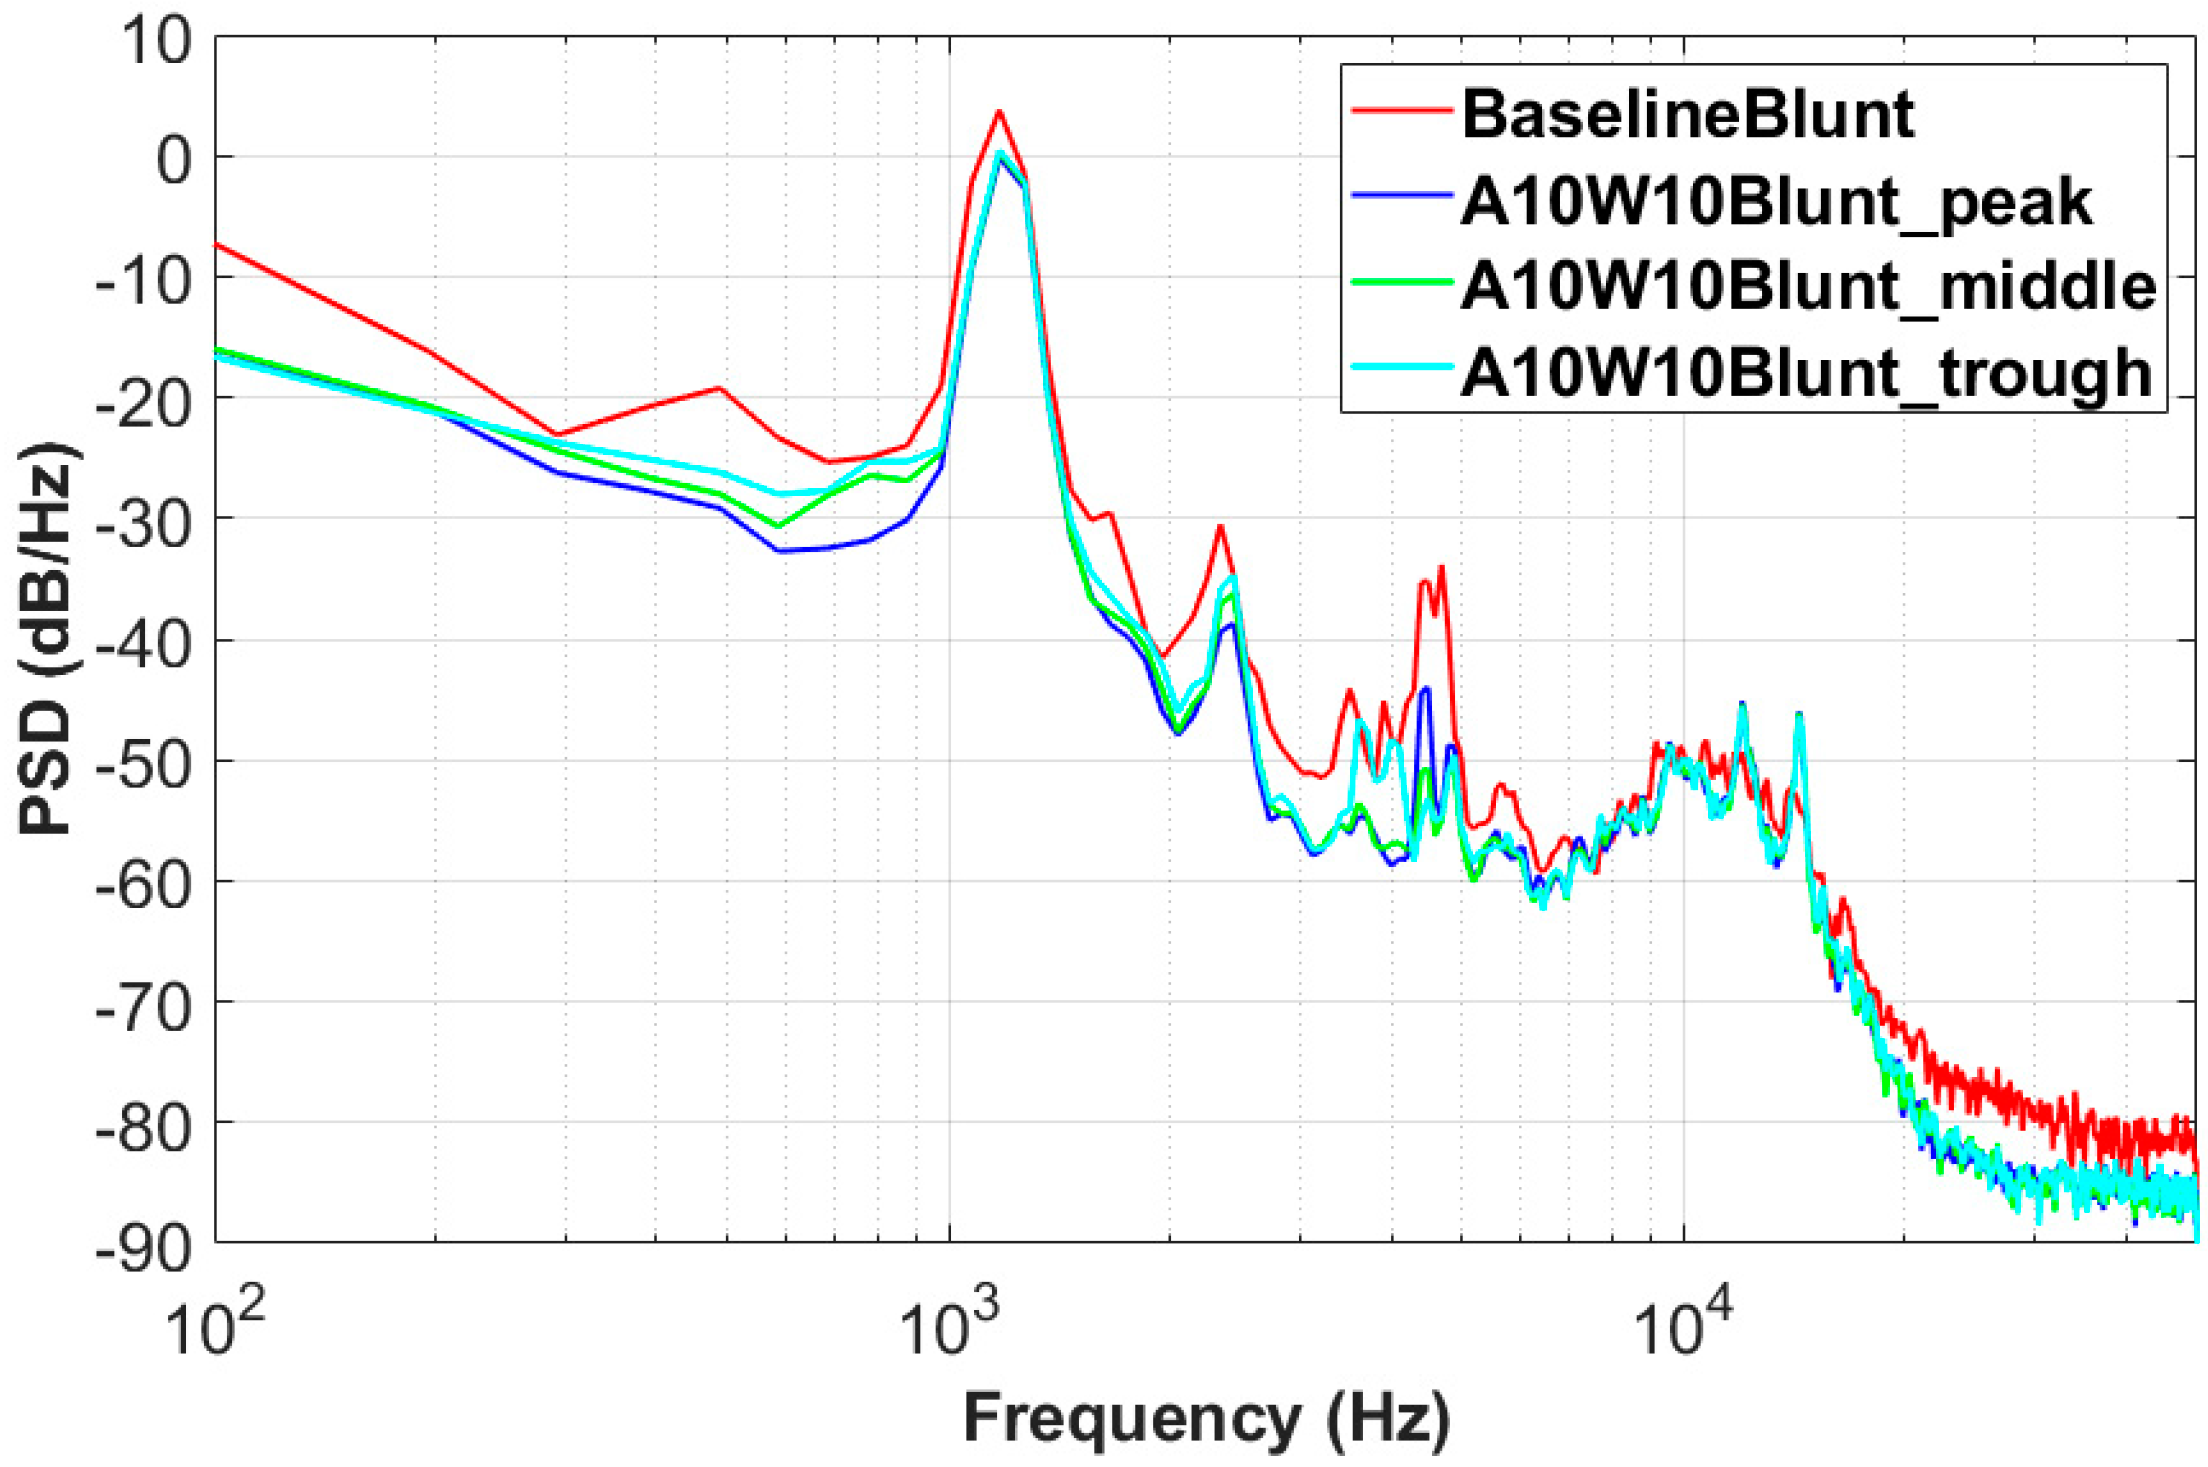
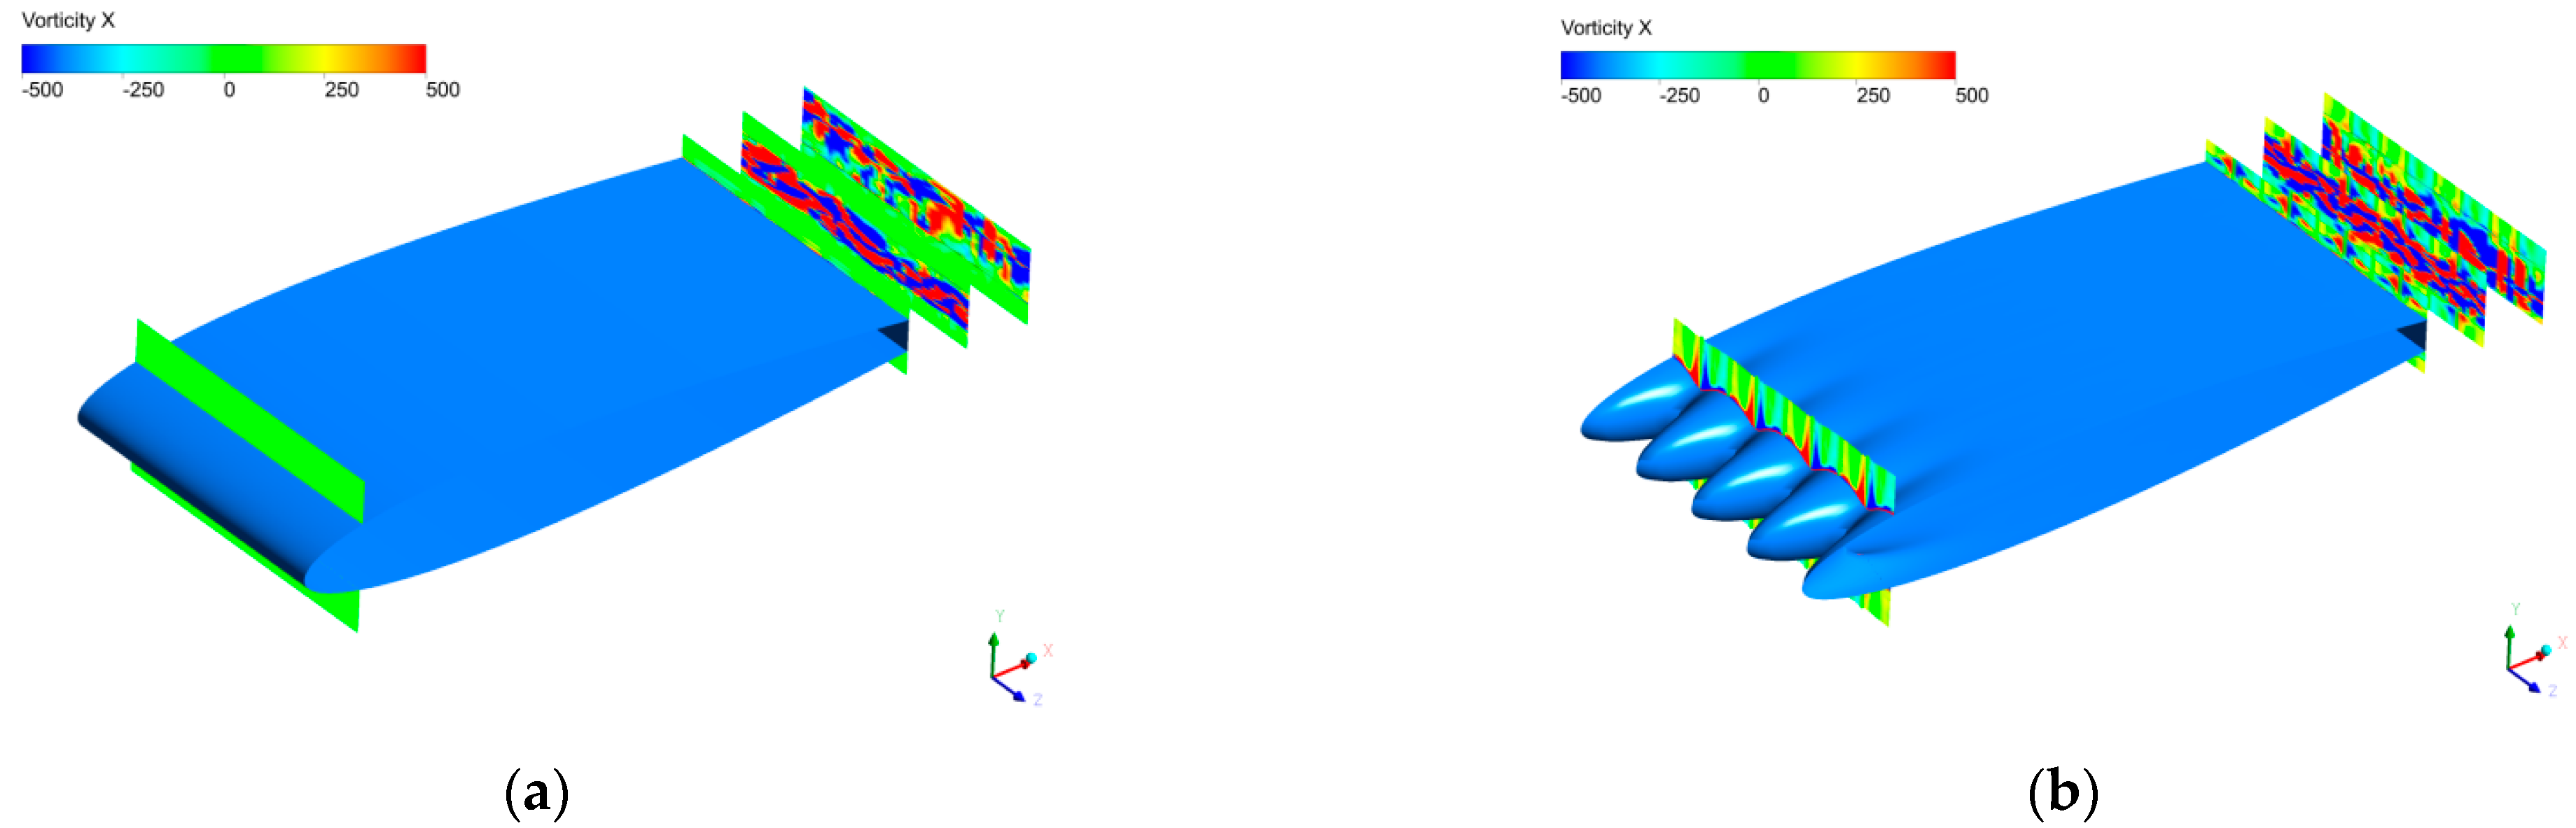
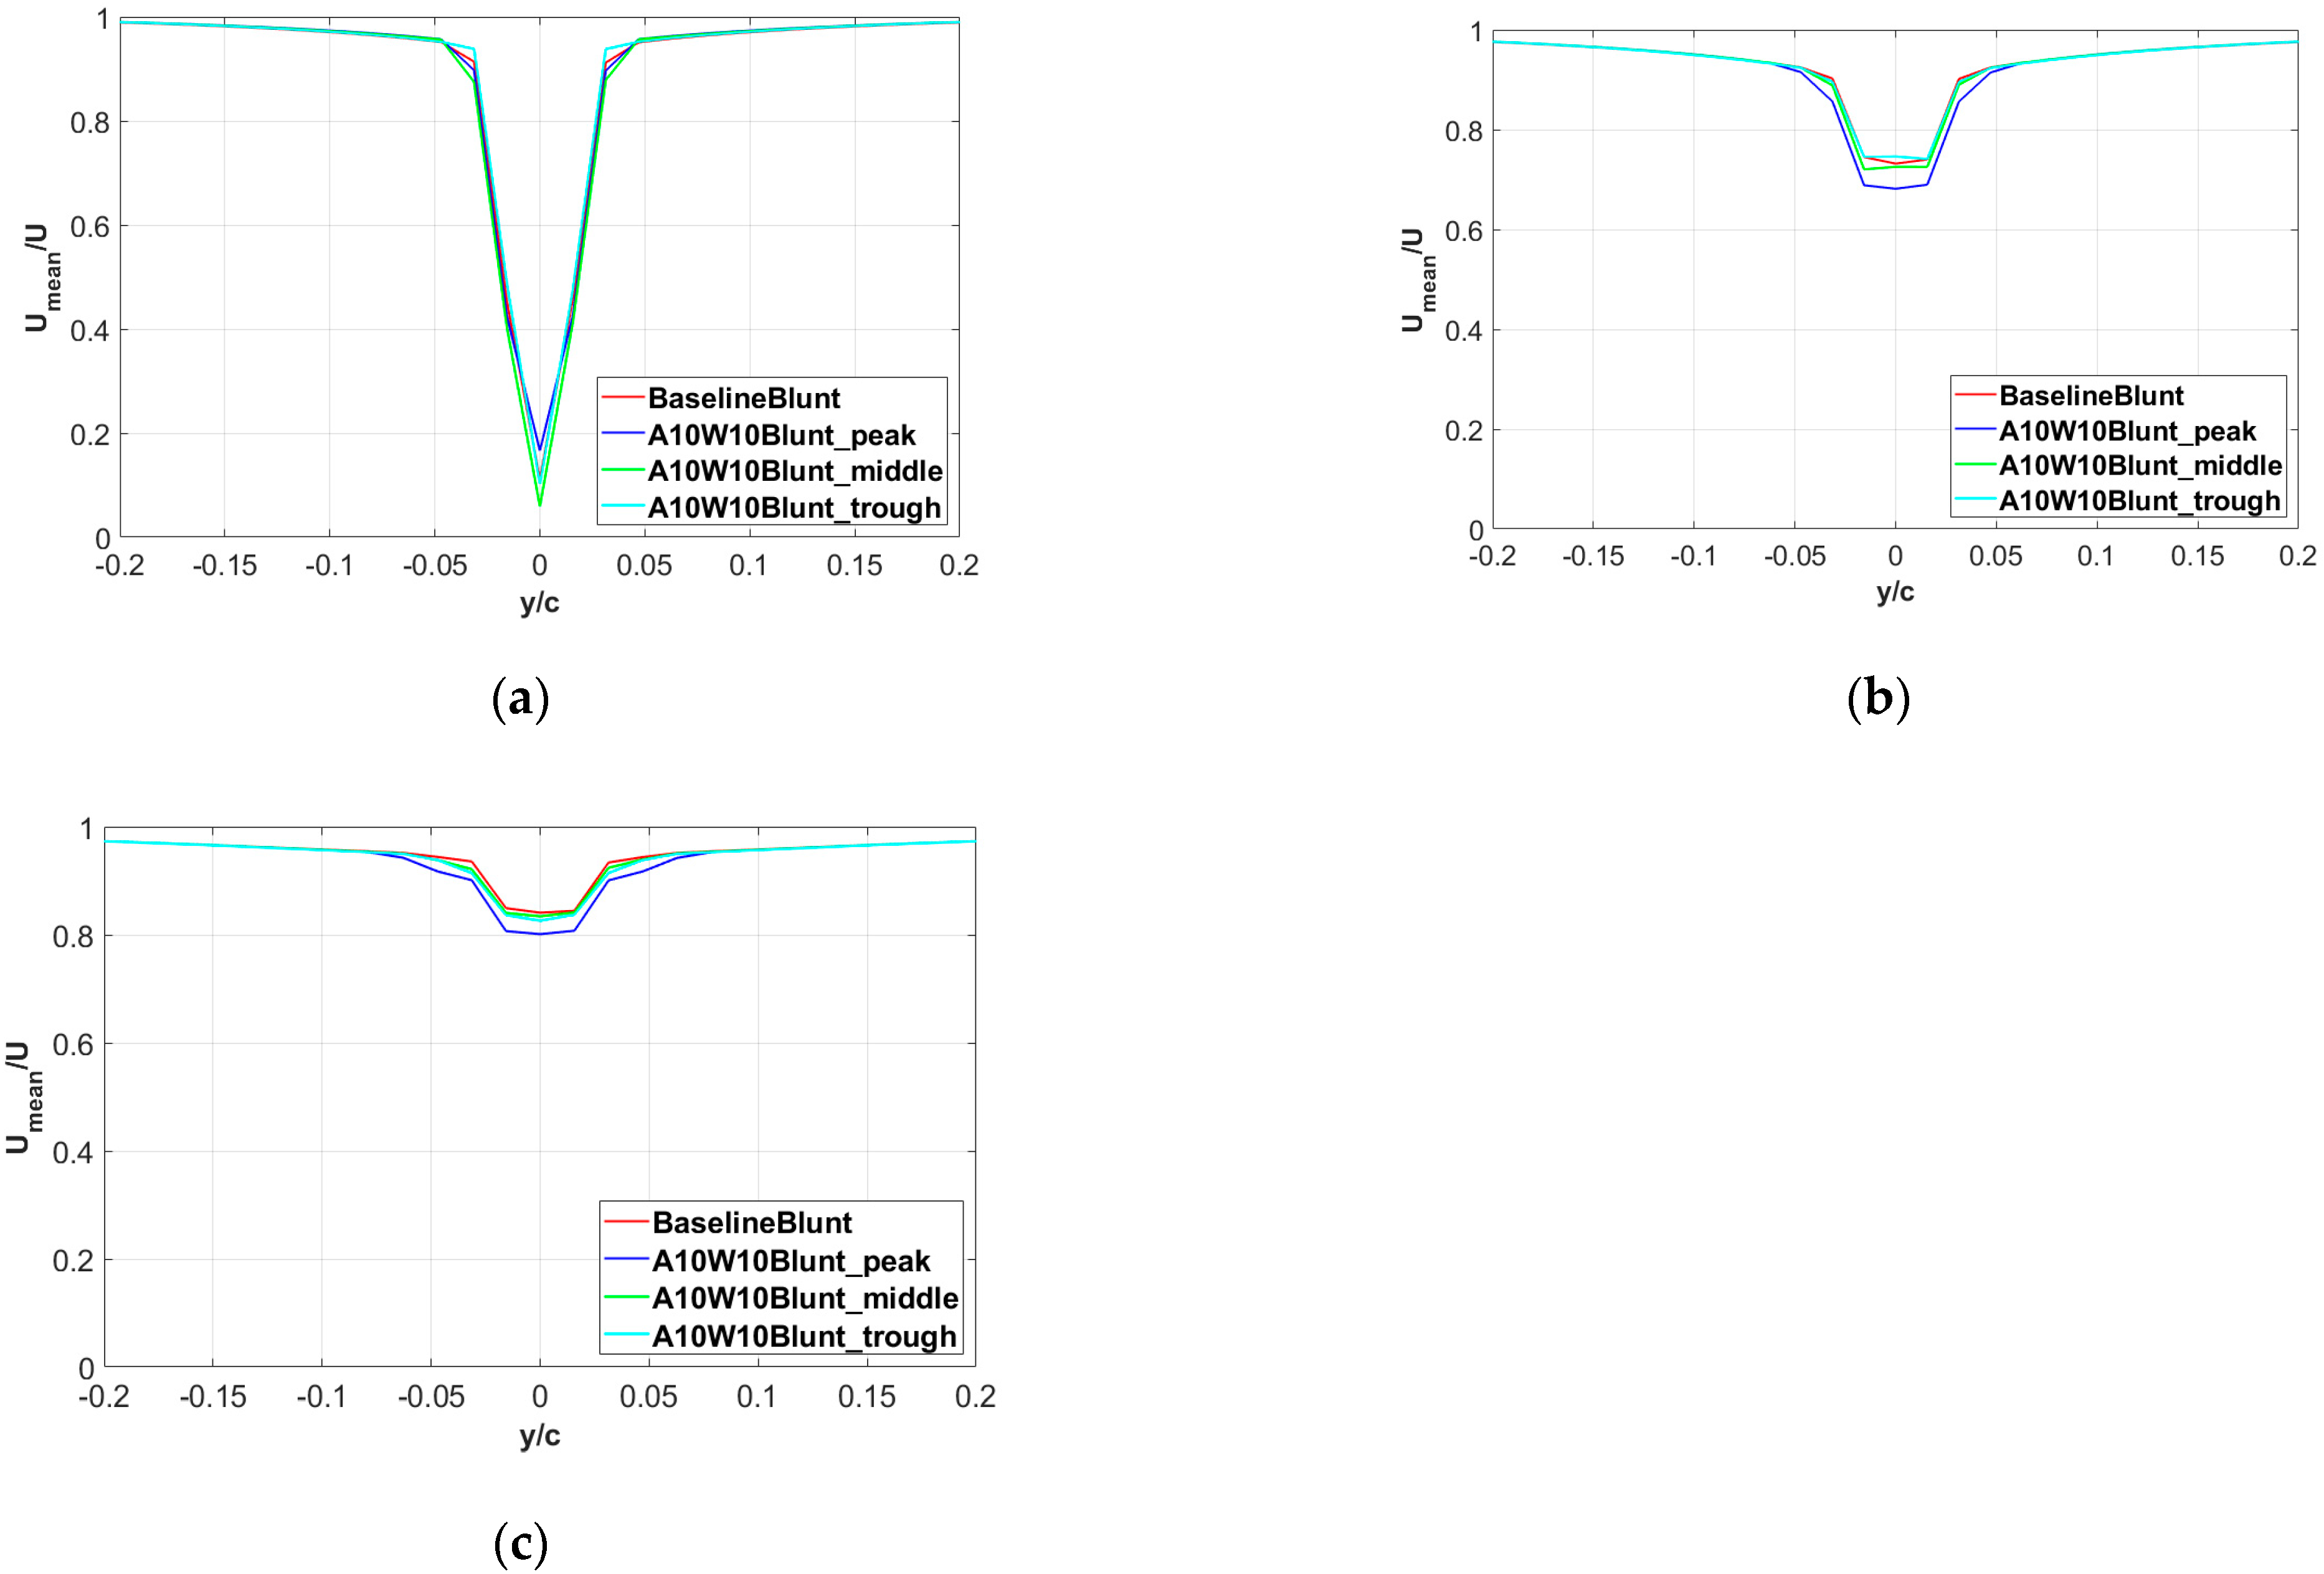
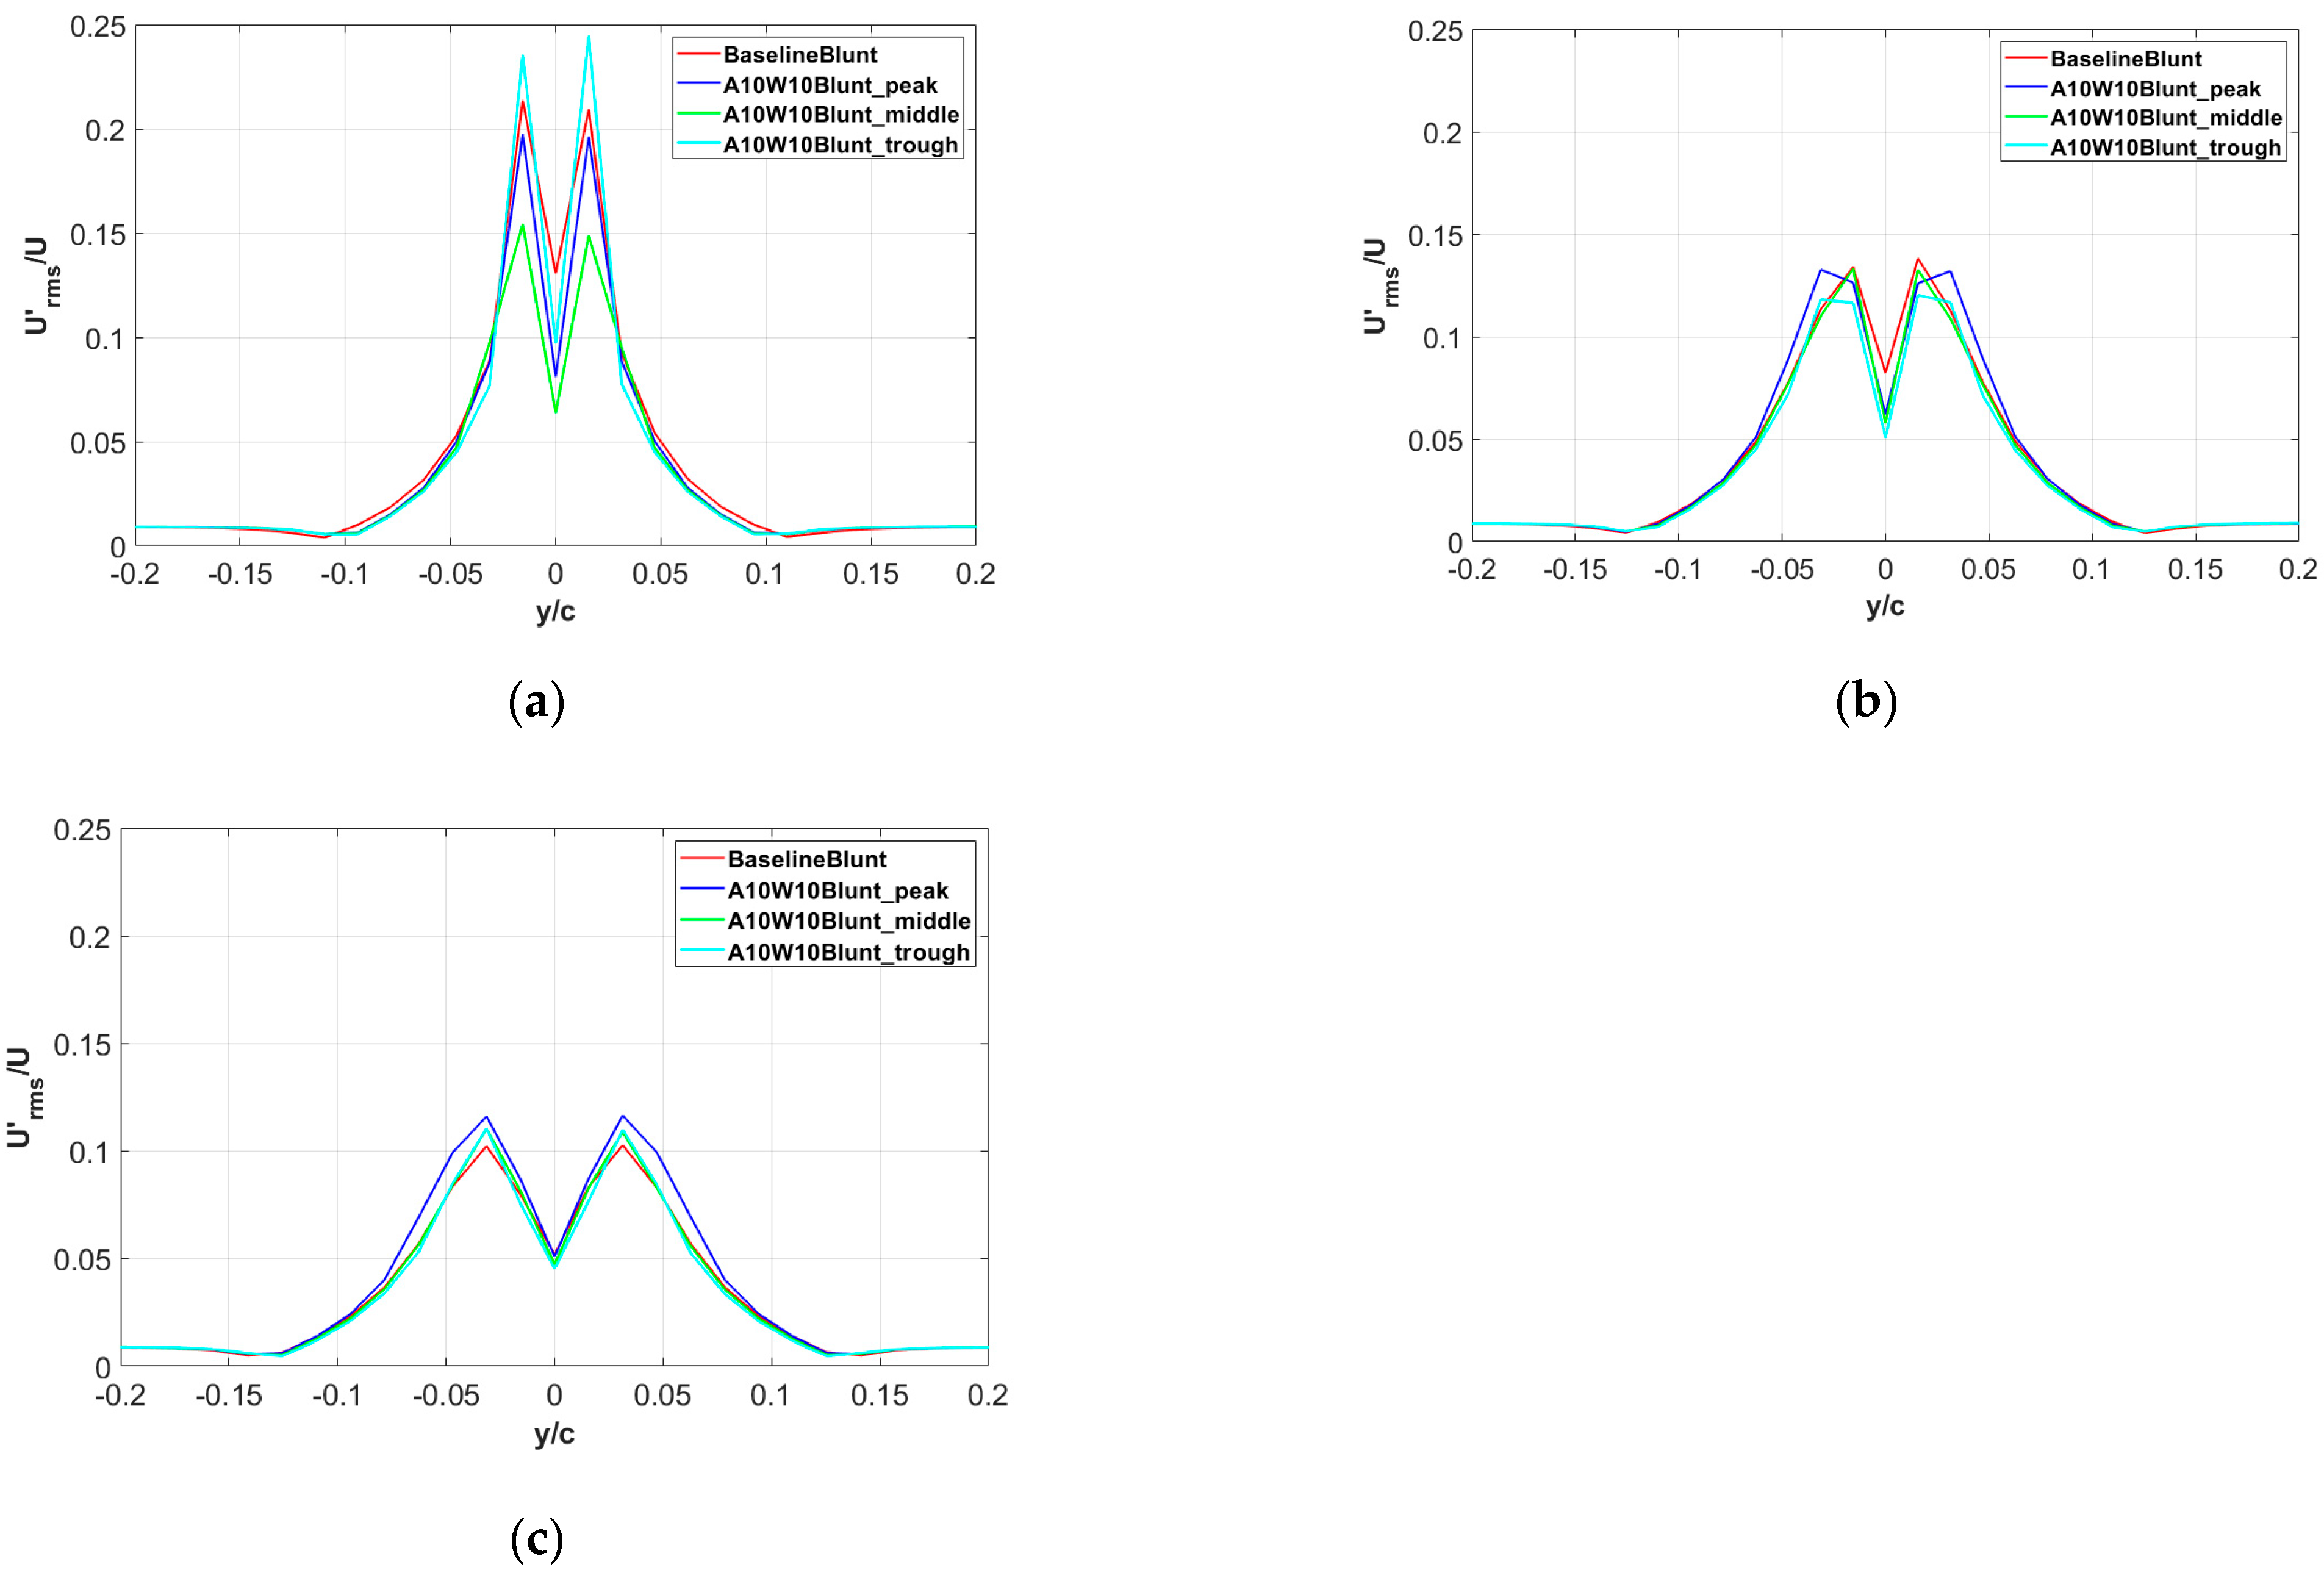
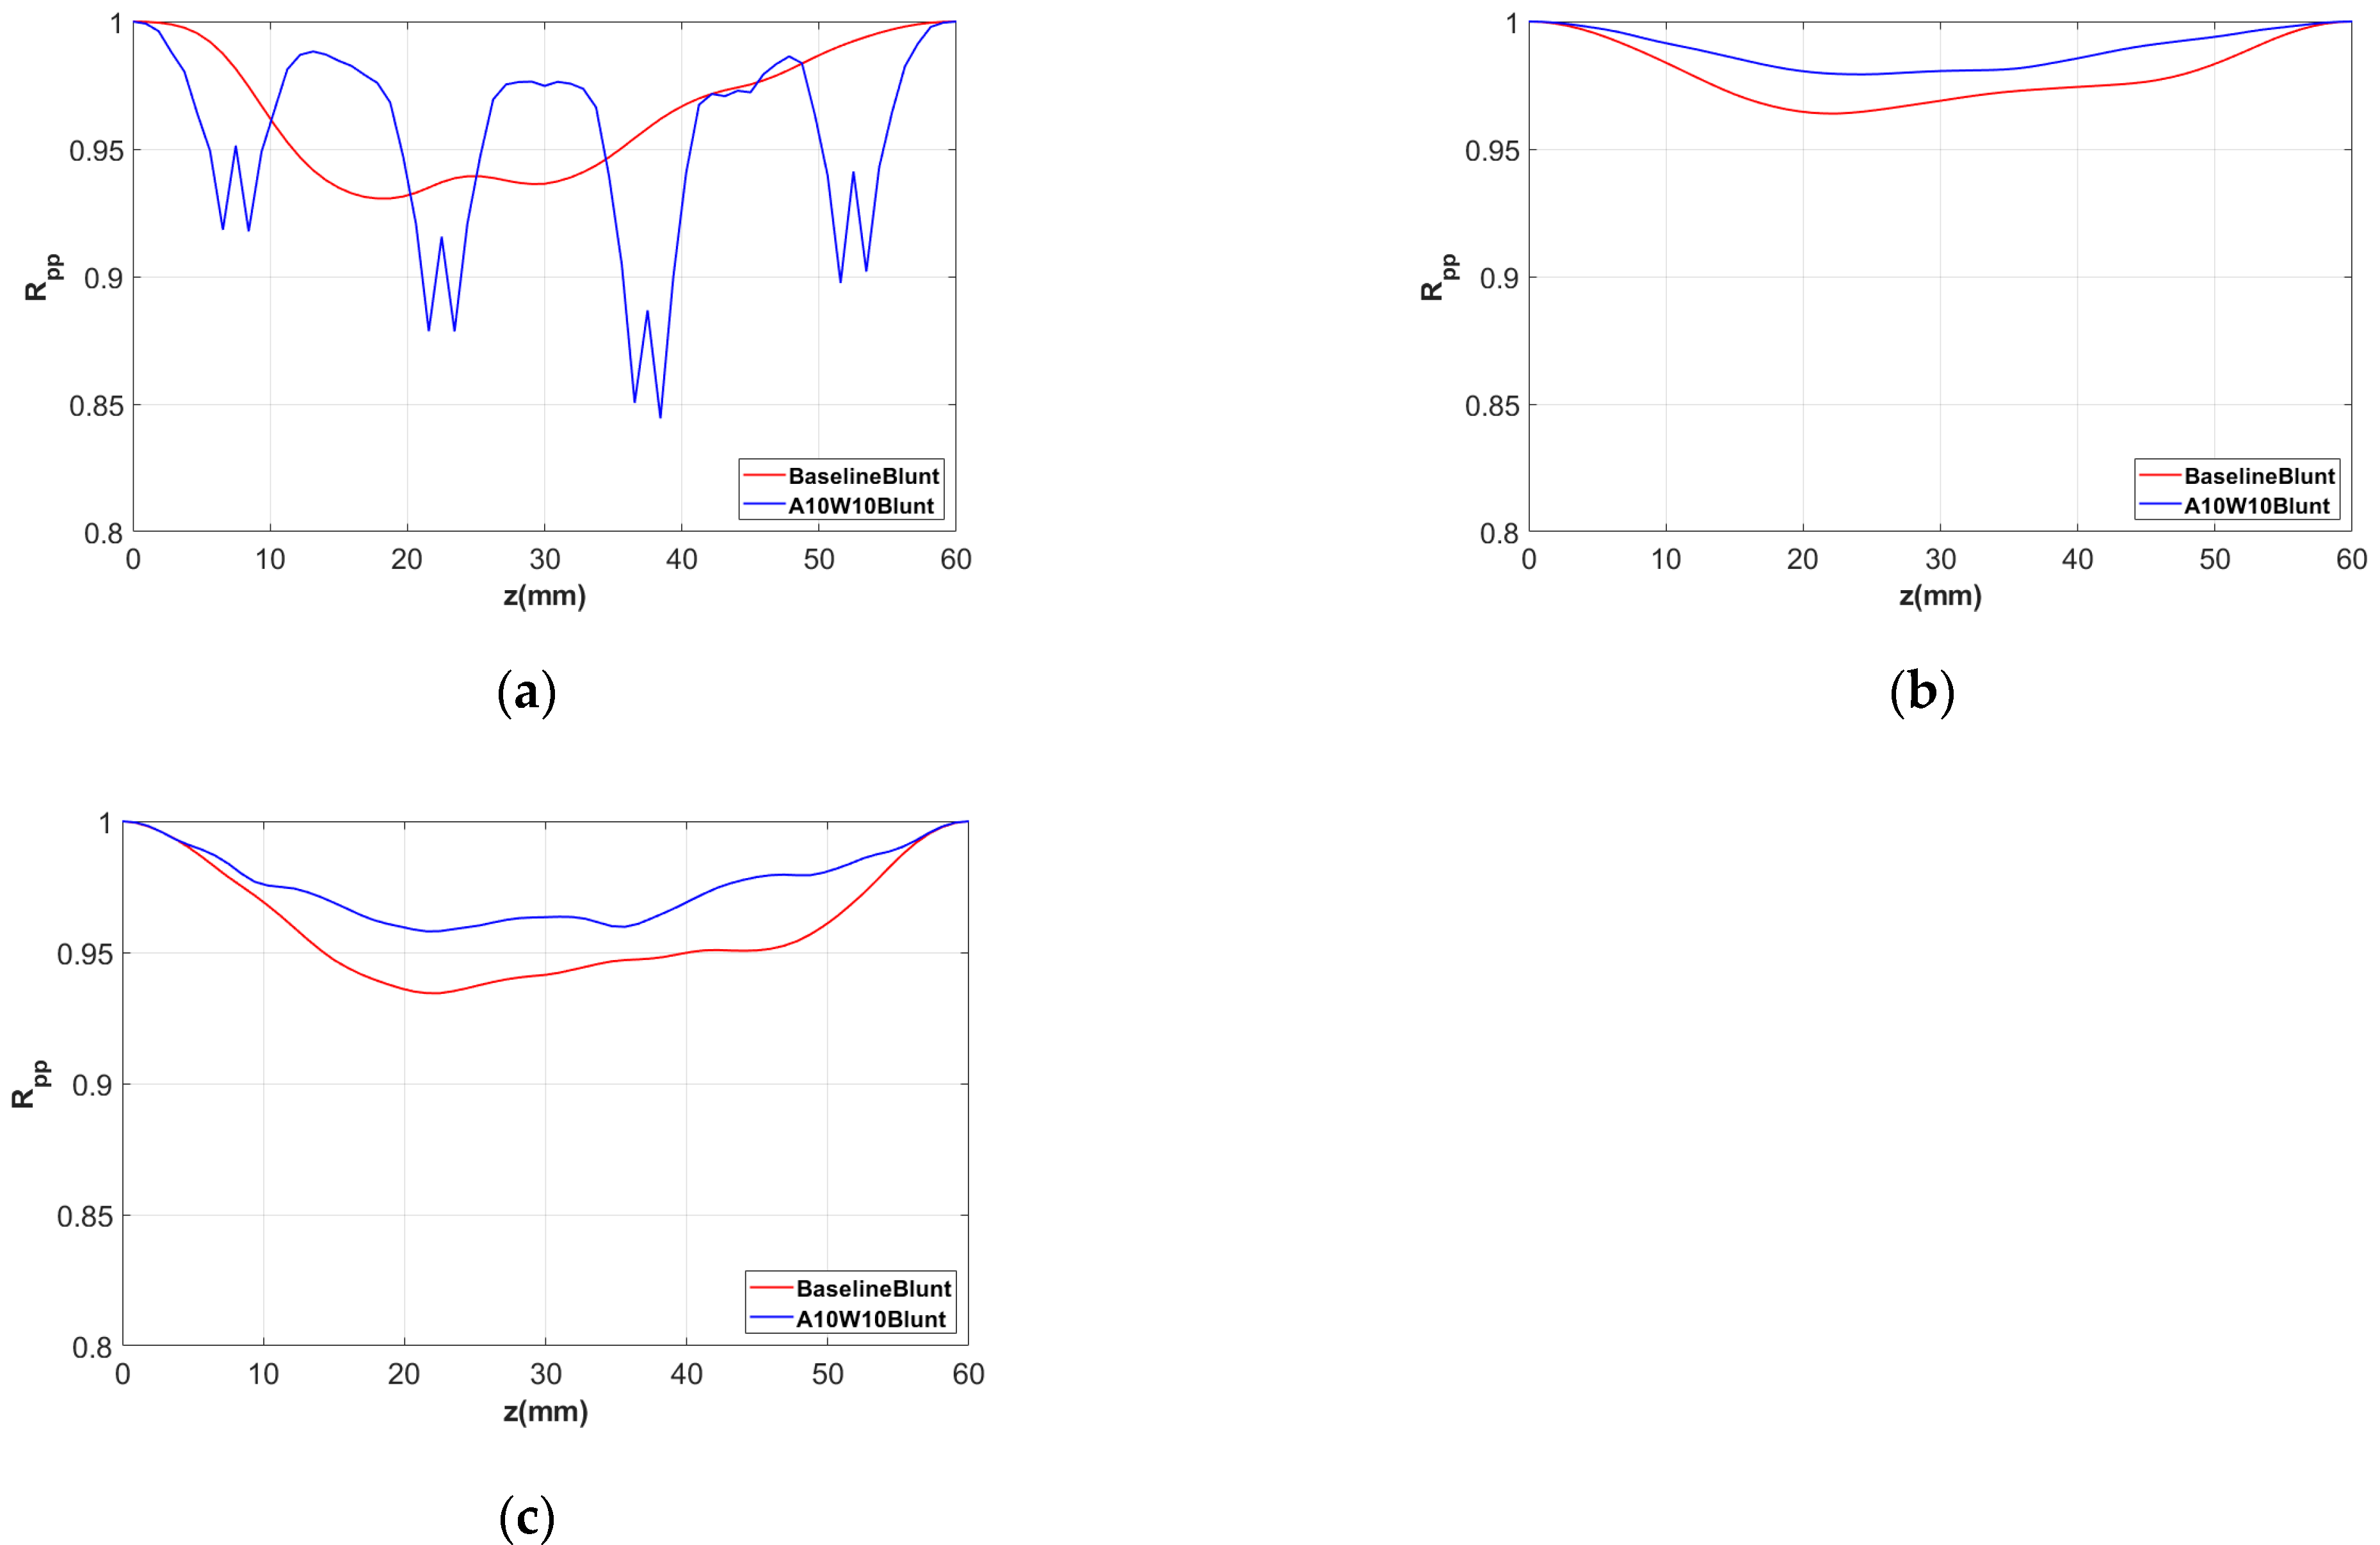
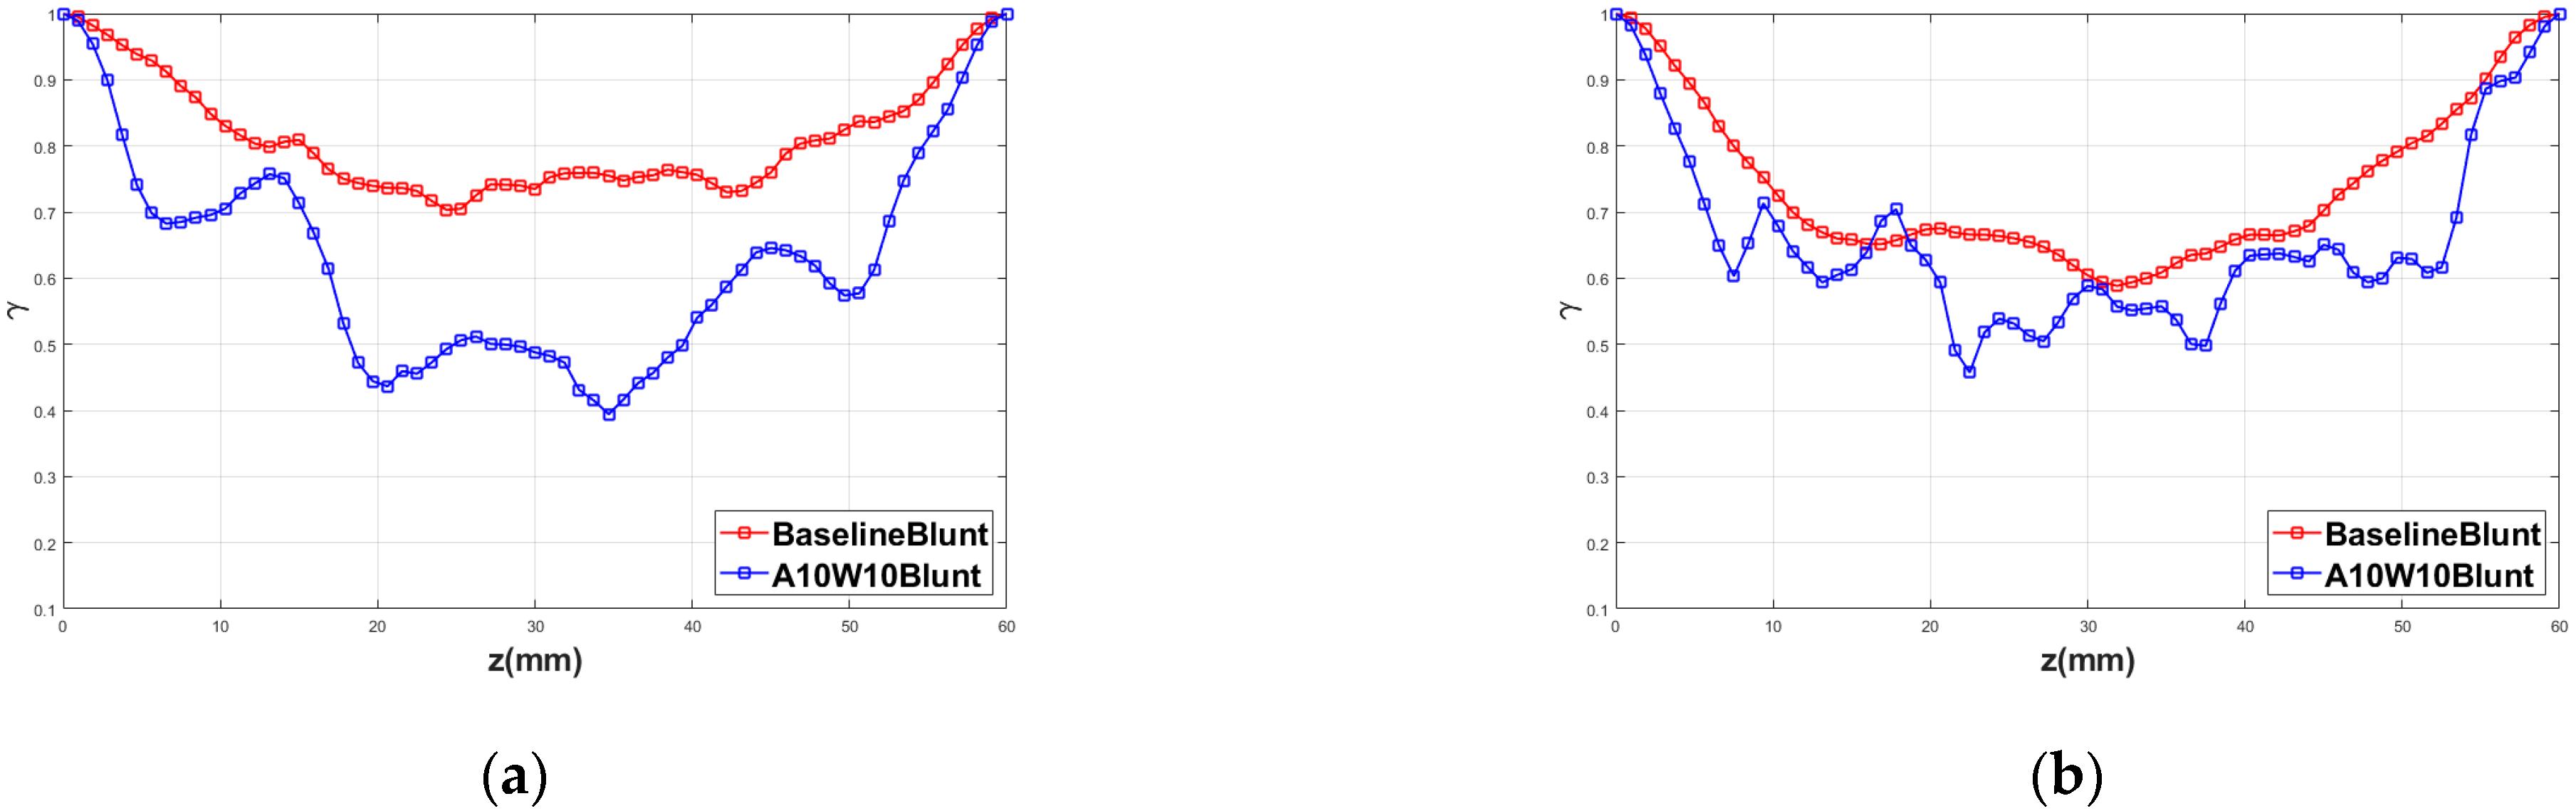
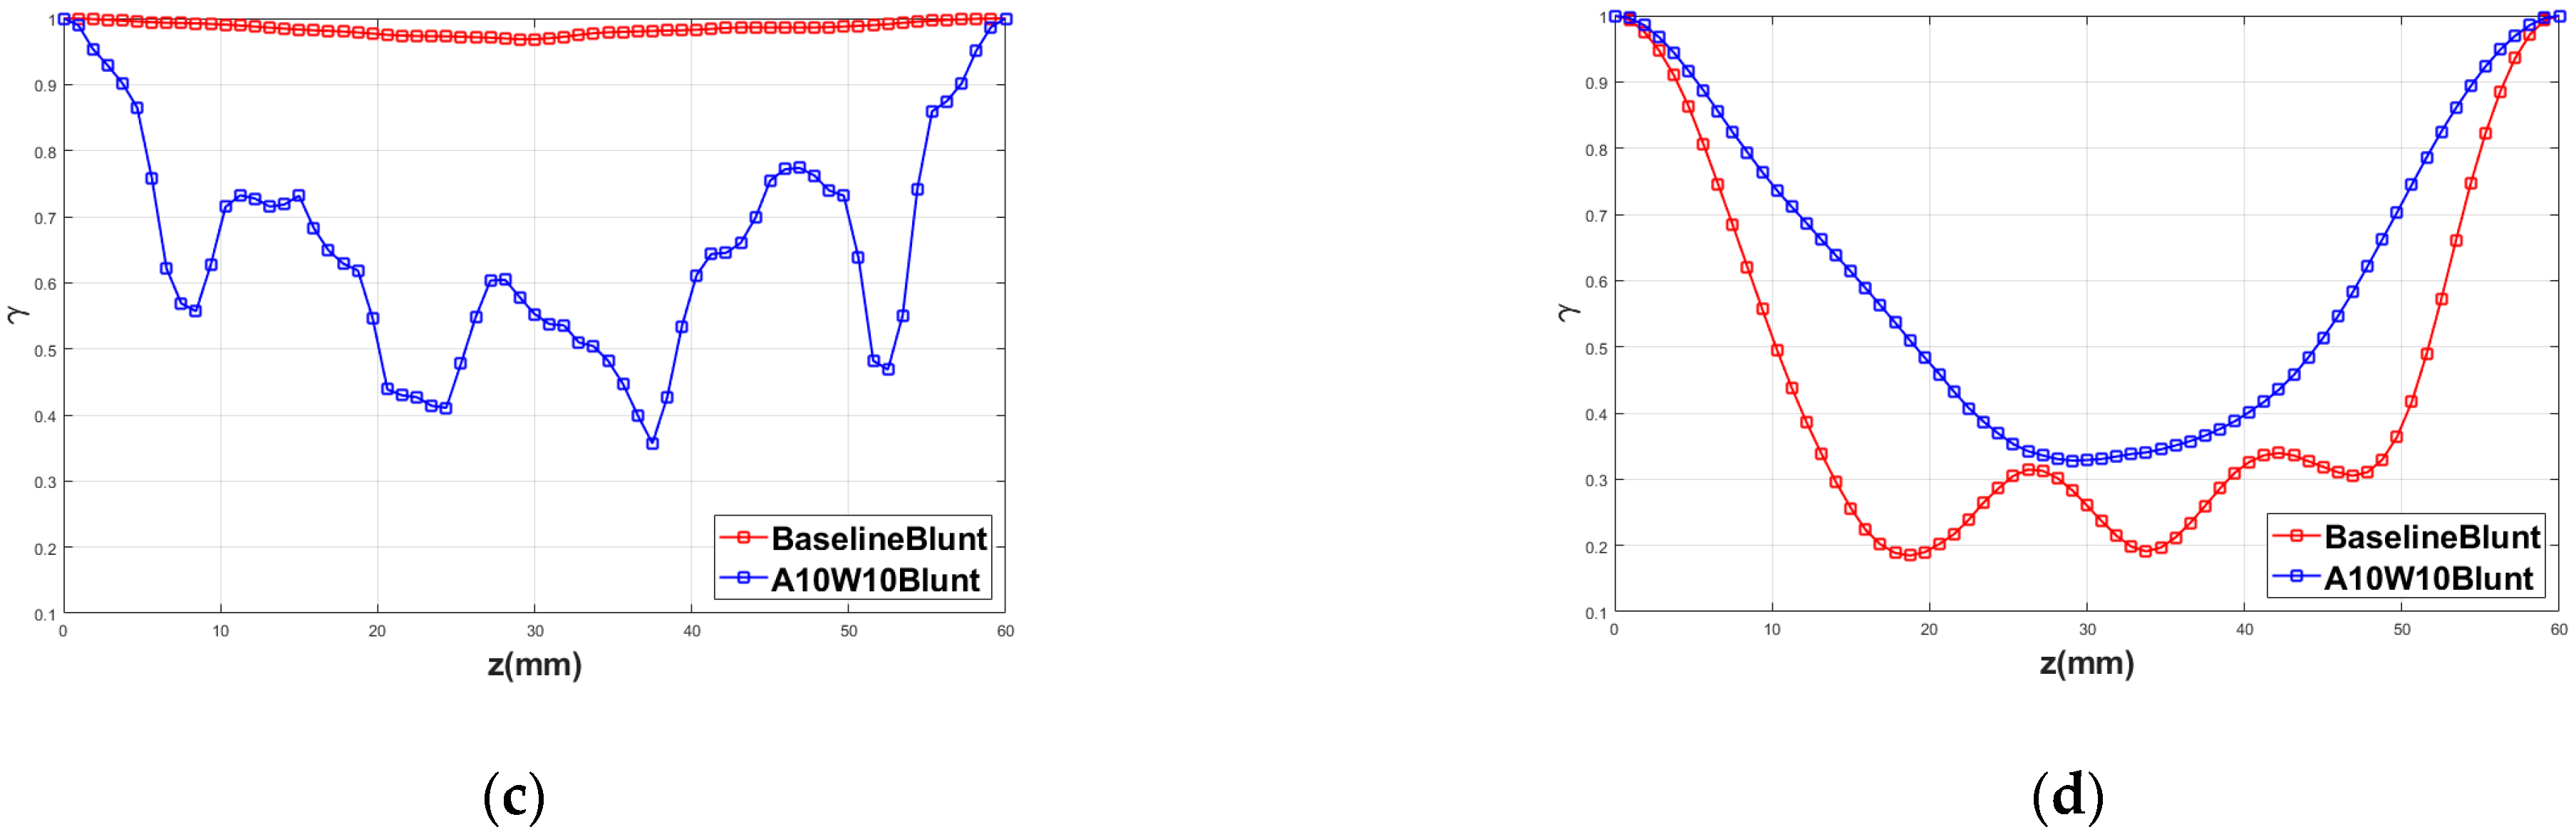
3.1. Noise-Reduction Effects of the Wavy Leading Edges

The acoustic receiver points were distributed on a circle 1.5 m away from the center of the airfoil, as shown in Figure 7. The sound pressure level (SPL) reduction effects of the wavy airfoil at three azimuthal angles are shown in Figure 8. Welch’s method [45] was used to calculate the sound pressure level, and the Hanning window with a block-size of 1024 data points was adopted. The frequency resolution was approximately 98 Hz, and the number of average was about 19 with 50% overlap.
For the baseline airfoil, obvious trailing-edge bluntness noise at 1172 Hz can be observed, whose corresponding Strouhal number (St = fd/U) is 0.18, and the SPL is up to 48.3 dB. What is more, the frequencies of the several noise peaks are all integral multiples of 1172 Hz. For the wavy blunt-trailing-edge A10W10 airfoil, the tonal noise caused by the trailing-edge bluntness is significantly reduced, and even broadband noise at almost all frequencies is reduced. The noise reduction level at 90° shown in Figure 8d clearly gives the noise-reduction characteristics in the frequency domain. A maximum noise-reduction level of 35 dB occurred at 4688 Hz, which is four times the characteristic frequency of 1172 Hz. Local maximum noise reduction levels of 7 and 13.8 dB were obtained at 1074 and 3516 Hz, respectively. At the same time, the SPL of broadband noise was reduced by 2–5 dB on average.
The overall sound-pressure level (OASPL) reduction effects of the wavy airfoil are shown in Figure 9. Seventy-two receiver points with an interval of 5° were set to plot the directivity pattern. The frequency range used to calculate the OASPL was 100–10,000 Hz. As shown in Figure 9a, the directivity pattern of the two airfoils exhibits a typical dipole sound source. The use of the wavy leading edges can reduce the aerodynamic noise at all azimuthal angles. The maximum OASPL reduction was about 6.3 dB at 0°. The noise reduction level at 195° was the smallest, which was about 3.1 dB. Overall, the noise reduction effects at downstream locations were slightly better than those at upstream locations.

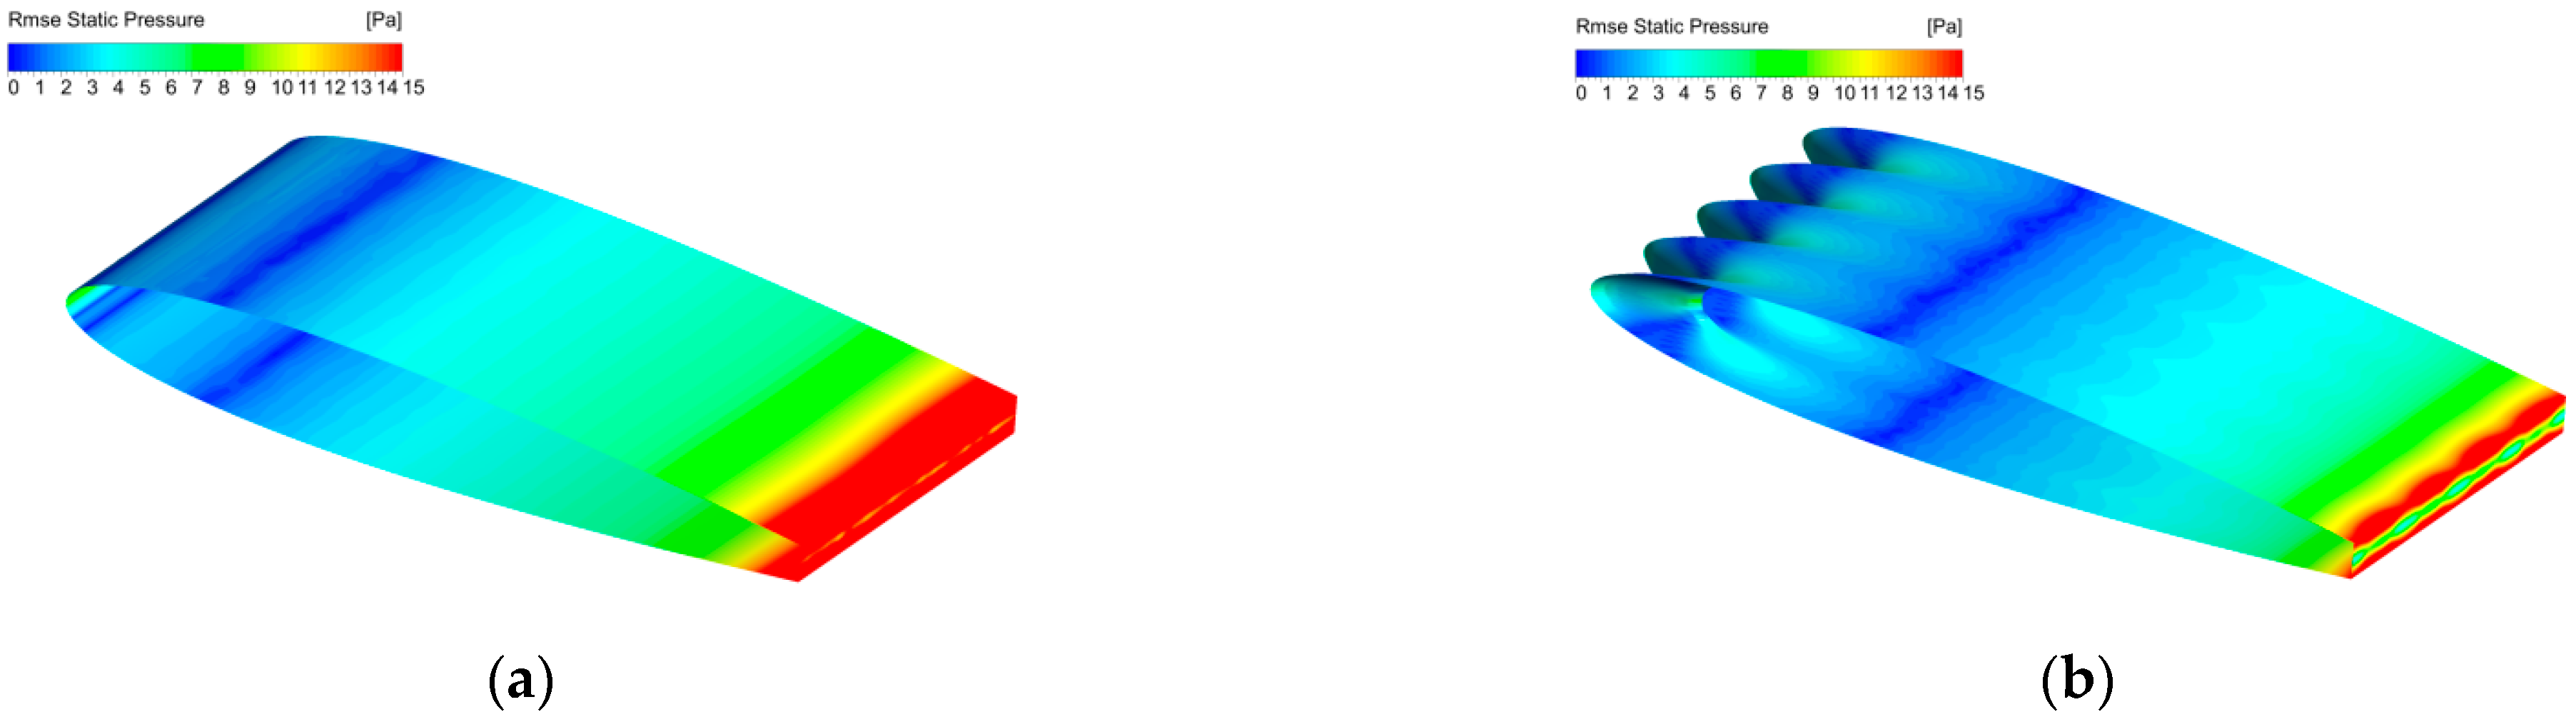
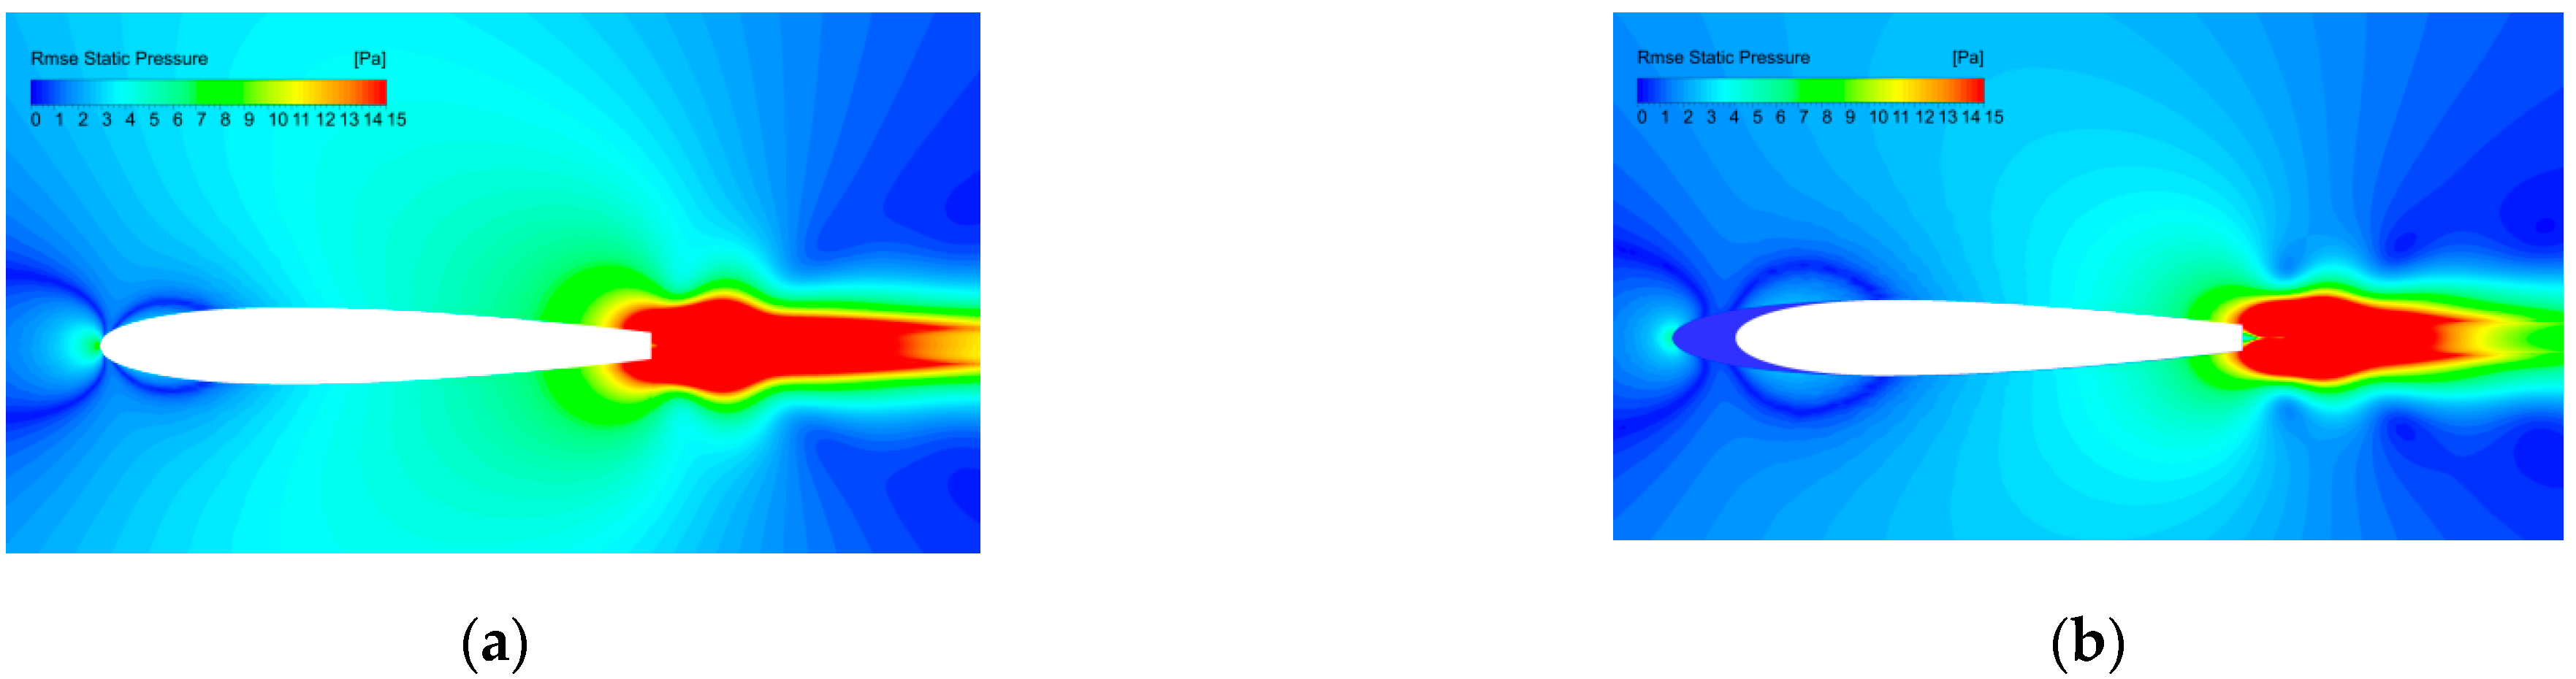
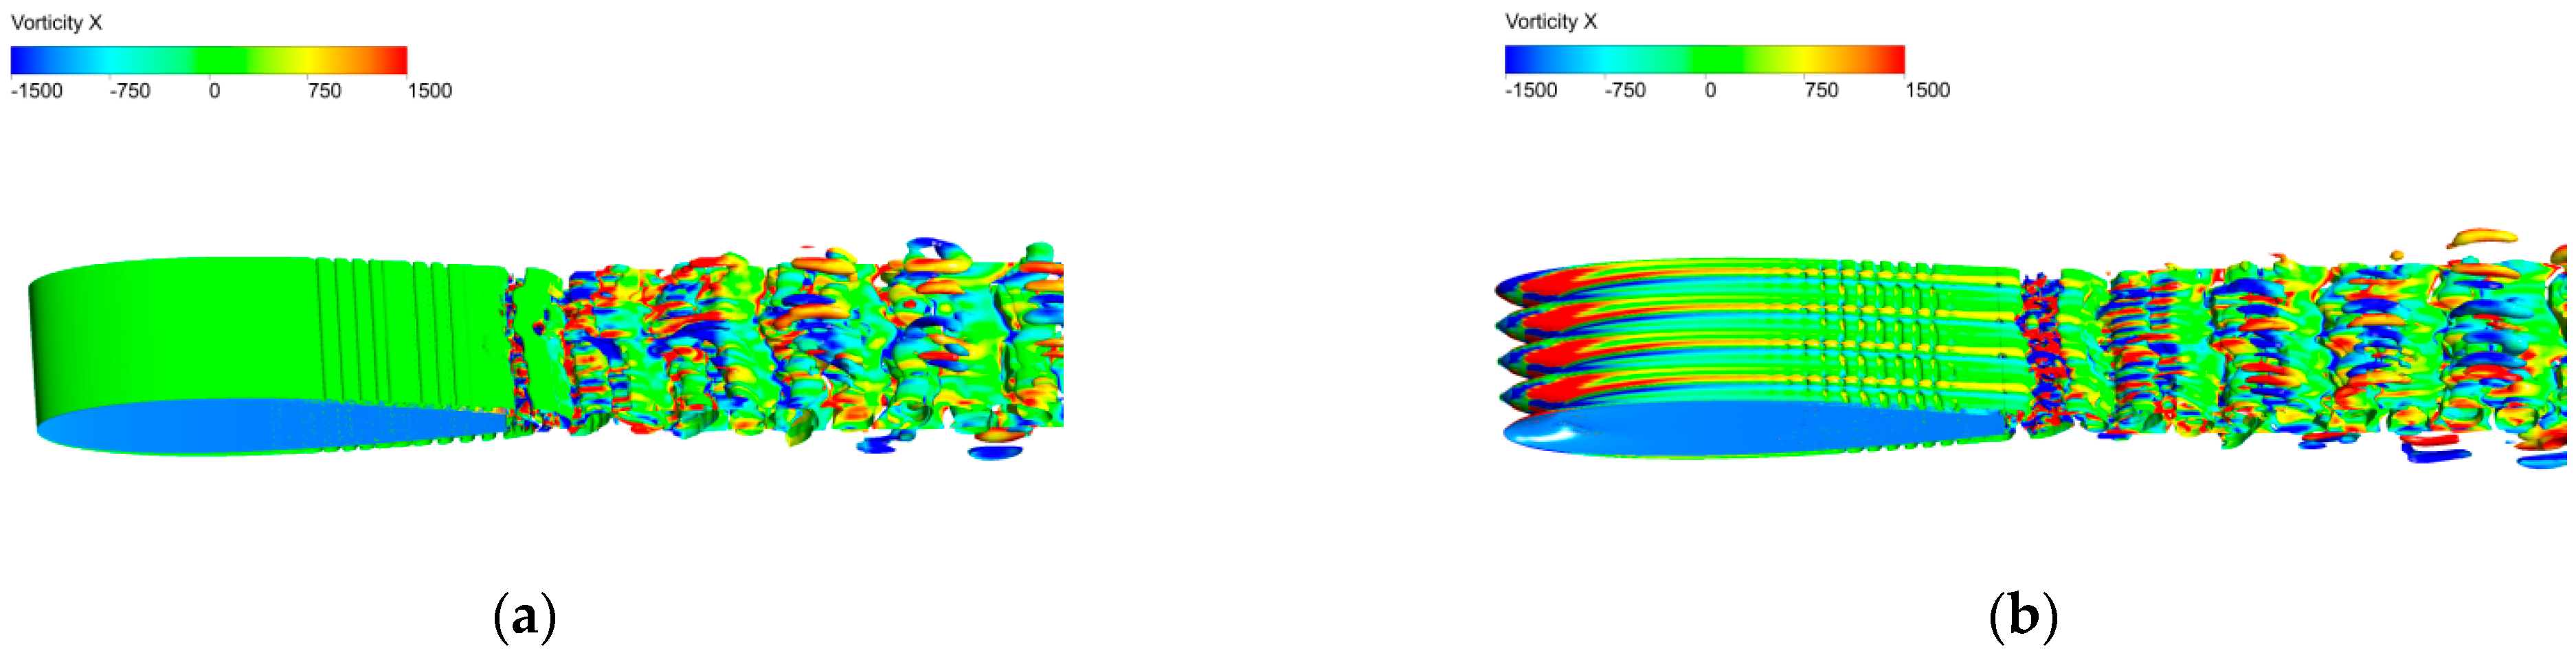
3.2. Noise-Reduction Mechanisms of the Wavy Leading Edges

Airfoil loading noise can be generally divided into lift and drag noise, and the lift noise often dominates the overall noise [46]. The lift coefficient of the airfoil is defined as:
C L = F L 0.5 ρ U 0 2 c L
where F L is the airfoil lift.
The lift coefficients of the baseline airfoil and wavy airfoil in both the time domain and the frequency domain are compared in Figure 10. As can be observed in Figure 10a, the wavy leading edges have no effect on the averaged lift coefficient, but the lift fluctuation is significantly reduced, which helps to reduce the noise scattering from the airfoil. The PSD of the fluctuating lift is decreased by the wavy airfoil in almost the whole frequency range, especially around the frequency of trailing-edge vortex shedding, as shown in Figure 10b. The fluctuating-lift-reduction spectra are similar to the SPL-reduction spectra shown in Figure 6.
The distributions of the root mean square of the pressure fluctuations on the airfoil surface are shown in Figure 11. The pressure fluctuations of both airfoils are concentrated near the trailing edge. However, the pressure fluctuation around the trailing edge of the wavy A10W10 airfoil is significantly reduced and presents a spanwise periodic distribution. At the same time, the area with strong pressure fluctuations on the wavy A10W10 airfoil is significantly smaller, which is conducive to reducing the noise.
The distribution of the pressure fluctuations on different spanwise locations of the baseline and A10W10 airfoils are shown in Figure 12. The baseline airfoil takes the mid-span section, and the wavy airfoil takes the peak, middle and trough positions, respectively. It is proved once again that the wavy leading edges can effectively reduce the pressure fluctuations near the airfoil blunt trailing edge, thereby suppressing the generation and radiation of an airfoil’s trailing-edge bluntness noise.
Figure 13 further shows the distribution of the pressure fluctuations at different spanwise positions on the airfoil’s surface. It can be observed that the pressure fluctuations increase rapidly before the trailing edge of the airfoil. The maximum pressure fluctuation of 28.5 Pa was obtained at the blunt trailing edge of the baseline airfoil. However, for the wavy A10W10 airfoil, the pressure fluctuation at the trailing edge was about 15–18 Pa lower than that of the baseline airfoil. This shows that the wavy leading edges can effectively reduce the intensity of the sound source around the trailing edge.
Figure 14 shows the PSDs of the pressure fluctuations on the surfaces of the two airfoils. The monitor points were located at 0.98c. The differences among the peak, middle and trough locations for the wavy A10W10 airfoil were small, which is consistent with the pressure fluctuations shown in Figure 13. It can be observed from Figure 14 that the wavy airfoil can reduce the pressure fluctuations in almost the whole frequency range.
Figure 15 shows the iso-surface of the Q-criterion (Q = 150,000 s−2) colored by the streamwise vorticity for the baseline and wavy airfoils. For the baseline airfoil shown in Figure 15a, shed vortices are generated in the middle section of the airfoil, and finally, the large-scale vortex shedding in the spanwise direction can be seen on the blunt trailing edge. For the A10W10 airfoil, the small-scale, counter-rotating streamwise vortex induced at the wavy trough destroys the large-scale spanwise vortex structure generated by the vortex shedding of the blunt trailing edge to a certain extent.
Figure 16 further depicts the streamwise vorticity distributions along several streamwise sections for the two airfoils. For the baseline airfoil, intensive streamwise vorticity can only be observed at the sections downstream of the blunt trailing edge. However, for the wavy A10W10 airfoil, intensive, small-scale, counter-rotating streamwise vortices are induced at each trough. The interaction between streamwise vortices and spanwise vortices destroys the structure of large-scale spanwise shedding vortices, which makes a great contribution to noise reduction.
The mean streamwise velocity distributions for the baseline and wavy airfoils in the wake region are compared in Figure 17. At the near wake of x = 1.1c, the velocity deficit of the wavy airfoil is comparable to that of the baseline airfoil, and the wake width is also equivalent. At the positions further downstream, the wavy airfoil has the lager velocity deficit and the broader wake width, compared to the baseline airfoil. In addition, the velocity deficit is more obvious at the peak of the wavy airfoil.
The distributions of the streamwise velocity fluctuations in the wake region are compared in Figure 18 for the two airfoils. It can be seen in Figure 18a that the turbulence intensity at the peak and middle of the wavy airfoil is decreased in the near wake of x = 1.1c. The maximum turbulence intensity at middle position is reduced from 21% to 15%. At the positions further downstream of x = 1.2c and x = 1.3c, the turbulence intensity decreases gradually without an obvious difference about different spanwise positions. In general, the wavy airfoil increases the wake deficit, broadens the wake width and reduces the turbulence intensity in the wake region.
The spanwise correlation coefficient of the pressure fluctuations is defined as:
R p p Δ z = cov p z , t , p z + Δ z , t var p z , t var p z + Δ z , t
where ‘cov’ represents the covariance of the two pressure time signals at different spanwise positions, and ‘var’ represents the variance in a series of pressure time signals.
Figure 19 shows the distributions of the pressure fluctuation correlation coefficient at different streamwise locations of x = 0.0c (the airfoil leading edge), x = 0.95c and x = 0.98c. The time histories of the fluctuating pressure at 65 spanwise monitor points of each streamwise position were recorded for the correlation analysis. It was found that, at the leading edges of the airfoils, the spanwise correlation is effectively reduced by the wavy configuration and has a periodic distribution, and its period is consistent with the wavelength. However, near the trailing edge of the airfoil, the spanwise correlation of the wavy airfoil is increased, which is significantly different from previous results. An increase in the spanwise correlation is not conducive to noise reduction according to Amiet’s and Howe’s noise prediction models, as shown in Equations (8) and (9). Therefore, spanwise correlation is not the main factor affecting the reduction of trailing-edge bluntness noise.
Figure 20 shows the distributions of the spanwise coherence coefficient of the surface-pressure fluctuations at different frequencies. There were 65 spanwise monitor points at 0.98c on the airfoil’s surface. The spanwise coherence coefficient for different spanwise locations at each frequency was computed by Equation (11). It was found that the spanwise coherence is effectively reduced by the wavy configuration at 2050.8, 3515.6 and 4687.5 Hz, corresponding to the locally maximal noise-reduction points in Figure 8. On the contrary, the spanwise coherence coefficient of the wavy airfoil increased at 14,550.8 Hz, and the corresponding noise also increased. A decrease in the spanwise coherence is indeed beneficial to noise reduction according to Amiet’s and Howe’s noise prediction models, as shown in Equations (8) and (9).

4. Conclusions

In this paper, a hybrid computational aeroacoustics method of the IDDES combined with the FW-H equation was used to study the effect of wavy leading edges on airfoil trailing-edge bluntness noise and to reveal the underlying physical mechanisms of the noise reduction. When the thickness of the airfoil’s trailing edge is large, due to the vortex shedding from the trailing edge, the bluntness noise becomes the dominant noise source for the baseline airfoil at small angles of attack. The wavy airfoil can significantly reduce the trailing-edge bluntness noise, and a maximum noise-reduction level of 35 dB was obtained. The OASPL-reduction levels were between 3.1 and 6.3 dB. The sound source distributions of the baseline and wavy airfoils were similar, and the pressure fluctuations were mainly around the trailing edges of the airfoils. However, the size of the pressure fluctuations at the trailing edge of the wavy airfoil was significantly reduced. The wavy leading edges can also affect the wake flow by increasing the velocity deficit, broadening the wake width and reducing the turbulence intensity. In addition, the time-space correlation of the pressure fluctuations is increased a little, and the spanwise coherence is substantially decreased, by the wavy airfoil.

Author Contributions

Conceptualization, W.C. and Y.X.; methodology, W.C.; software, Y.X.; validation, Y.X. and W.C.; formal analysis, Y.X.; investigation, X.W.; resources, W.Q. and F.T.; data curation, X.W.; writing—original draft preparation, Y.X., W.C., X.W., W.Q. and F.T.; writing—review and editing, Y.X. and W.C.; supervision, W.Q.; project administration, F.T. All authors have read and agreed to the published version of the manuscript.

Funding

This work is supported by the National Natural Science Foundation of China (No. 52106056), the Science Center for Gas Turbine Project (No. P2022-A-II-003-001, P2022-B-II-011-001), the National Science and Technology Major Project of China (No. 2017-II-0008-0022, J2019-II-0013-0034), the Fundamental Research Funds for the Central Universities (No. 3102021OQD706), the National Key Laboratory of Science and Technology on Aerodynamic Design and Research (No. 614220121050103) and the Key Laboratory of Aerodynamic Noise Control (No. ANCL20210104, ANCL20220101).

Data Availability Statement

The data are available from the corresponding author upon reasonable request.

Conflicts of Interest

The authors declare no conflict of interest.

References

  1. Brooks, T.F.; Pope, D.S.; Marcolini, M.A. Airfoil Self-Noise and Prediction (NASA Reference Publication); Technical Report 1218; National Aeronautics and Space Administration: Washington, DC, USA, 1989. [Google Scholar]
  2. Brooks, T.F.; Hodgson, T.H. Trailing edge noise prediction from measured surface pressures. J. Sound Vib. 1981, 78, 69–117. [Google Scholar] [CrossRef]
  3. Dobrzynski, W. Almost 40 years of airframe noise research: What did we achieve? J. Aircr. 2010, 47, 353–367. [Google Scholar] [CrossRef]
  4. Christian, A.W.; Cabell, R. Initial investigation into the psychoacoustic properties of small unmanned aerial system noise. In Proceedings of the 23rd AIAA/CEAS Aeroacoustics Conference, Denver, CO, USA, 5–9 June 2017; Volume 4051. [Google Scholar]
  5. Xiong, P.; Wu, L.; Chen, X.Y.; Wu, Y.G.; Yang, W.J. Aerodynamic Performance Analysis of a Modified Joukowsky Airfoil: Parametric Control of Trailing Edge Thickness. Appl. Sci. 2021, 11, 8395. [Google Scholar] [CrossRef]
  6. Avallone, F.; Van Der Velden, W.C.P.; Ragni, D.; Casalino, D. Noise reduction mechanisms of sawtooth and combed-sawtooth trailing-edge serrations. J. Fluid Mech. 2018, 848, 560–591. [Google Scholar] [CrossRef] [Green Version]
  7. Ali, S.A.S.; Azarpeyvand, M.; Da Silva, C.R.I. Trailing-edge flow and noise control using porous treatments. J. Fluid Mech. 2018, 850, 83–119. [Google Scholar]
  8. Vathylakis, A.; Chong, T.P.; Joseph, P.F. Poro-serrated trailing-edge devices for airfoil self-noise reduction. AIAA J. 2015, 53, 3379–3394. [Google Scholar] [CrossRef] [Green Version]
  9. Chong, T.P.; Dubois, E. Optimization of the poro-serrated trailing edges for airfoil broadband noise reduction. J. Acoust. Soc. Am. 2016, 140, 1361–1373. [Google Scholar] [CrossRef] [Green Version]
  10. Fish, F.E.; Battle, J.M. Hydrodynamic design of the Humpback Whale Flipper. J. Morphol. 1995, 225, 51–60. [Google Scholar] [CrossRef]
  11. Hansen, K.L.; Kelso, R.M.; Doolan, C.J. Reduction of flow induced tonal noise through leading edge tubercle modifications. In Proceedings of the 16th AIAA/CEAS Aeroacoustics Conference, Stockholm, Sweden, 7–9 June 2010; p. 3700. [Google Scholar]
  12. Gruber, M.; Joseph, P.F.; Polacsek, C.; Chong, T.P. Noise reduction using combined trailing edge and leading edge serrations in a tandem airfoil experiment. In Proceedings of the 18th AIAA/CEAS Aeroacoustics Conference (33rd AIAA Aeroacoustics Conference), Colorado Springs, CO, USA, 4–6 June 2012; p. 2134. [Google Scholar]
  13. Wang, L.; Liu, X.M.; Li, D. Noise reduction mechanism of airfoils with leading-edge serrations and surface ridges inspired by owl wings. Phys. Fluids 2021, 33, 015123. [Google Scholar] [CrossRef]
  14. Chen, W.J.; Qiao, W.Y.; Duan, W.H. Experimental study of airfoil instability noise with wavy leading edges. Appl. Acoust. 2021, 172, 107671. [Google Scholar] [CrossRef]
  15. Narayanan, S.; Joseph, P.; Haeri, S. Noise reduction studies from the leading edge of serrated flat plates. In Proceedings of the 20th AIAA/CEAS Aeroacoustics Conference, Atlanta, GA, USA, 16–20 June 2014; p. 2320. [Google Scholar]
  16. Chong, T.P.; Vathylakis, A.; McEwen, A. Aeroacoustic and aerodynamic performances of an aerofoil subjected to sinusoidal leading edges. In Proceedings of the 21st AIAA/CEAS Aeroacoustics Conference, Dallas, TX, USA, 22–26 June 2015; p. 2200. [Google Scholar]
  17. Chaitanya, P.; Joseph, P.; Narayanan, S. Performance and mechanism of sinusoidal leading edge serrations for the reduction of turbulenc-aerofoil interaction noise. J. Fluid Mech. 2017, 818, 435–464. [Google Scholar] [CrossRef] [Green Version]
  18. Chen, W.J.; Qiao, W.Y.; Tong, F. Experimental investigation of wavy leading edges on rod-aerofoil interaction noise. J. Sound Vib. 2018, 422, 409–431. [Google Scholar] [CrossRef]
  19. Clair, V.; Polacsek, C.; Garrec, T. Experimental and numerical investigation of turbulence-airfoil noise reduction using wavy edges. AIAA J. 2013, 51, 2695–2713. [Google Scholar] [CrossRef] [Green Version]
  20. Agrawal, B.R.; Sharma, A. Numerical analysis of aerodynamic noise mitigation via leading edge serrations for a rod-airfoil configuration. Int. J. Aeroacoustics 2016, 15, 734–756. [Google Scholar] [CrossRef]
  21. Kim, J.W.; Haeri, S.; Joseph, P.F. On the reduction of aerofoil-turbulence interaction noise associated with wavy leading edges. J. Fluid Mech. 2016, 792, 526–552. [Google Scholar] [CrossRef] [Green Version]
  22. Aguilera, F.G.; Gill, J.; Angland, D. Wavy leading edge airfoils interacting with anisotropic turbulence. In Proceedings of the 23rd AIAA/CEAS Aeroacoustics Conference, Denver, CO, USA, 5–9 June 2017; p. 3370. [Google Scholar]
  23. Chen, W.J.; Qiao, W.Y.; Tong, F.; Wang, L.F.; Wang, X.N. Numerical investigation of wavy leading edges on rod-airfoil interaction noise. AIAA J. 2018, 56, 2553–2567. [Google Scholar] [CrossRef]
  24. Tong, F.; Qiao, W.Y.; Xu, K.B.; Wang, L.F.; Chen, W.J.; Wang, X.N. On the study of wavy leading-edge vanes to achieve low fan interaction noise. J. Sound Vib. 2018, 419, 200–226. [Google Scholar] [CrossRef]
  25. Chen, W.J.; Qiao, W.Y.; Wei, Z.J. Aerodynamic performance and wake development of airfoils with wavy leading edges. Aerosp. Sci. Technol. 2020, 106, 106216. [Google Scholar] [CrossRef]
  26. Hasheminejad, S.M.; Chong, T.P.; Joseph, P.; Lacagnina, G. Effect of Leading-Edge Serrations on Trailing-Edge-Bluntness Vortex-Shedding Noise Radiation. In Proceedings of the 25th AIAA/CEAS Aeroacoustics Conference, Delft, The Netherlands, 20–23 May 2019; p. 2437. [Google Scholar]
  27. Hasheminejad, S.M.; Chong, T.P.; Lacagnina, G. On the manipulation of flow and acoustic fields of a blunt trailing edge aerofoil by serrated leading edges. J. Acoust. Soc. Am. 2020, 147, 3932–3947. [Google Scholar] [CrossRef] [PubMed]
  28. Zhang, M.M.; Wang, G.F.; Xu, J.Z. Aerodynamic control of low-Reynolds-number airfoil with leading-edge protuberances. AIAA J. 2013, 51, 1960–1971. [Google Scholar] [CrossRef]
  29. Hansen, K.L.; Rostamzadeh, N.; Kelso, R.M.; Dally, B.B. Evolution of the streamwise vortices generated between leading edge tubercles. J. Fluid Mech. 2016, 788, 730–766. [Google Scholar] [CrossRef]
  30. Skillen, A.; Revell, A.; Pinelli, A.; Piomelli, U.; Favier, J. Flow over a wing with leading-edge undulations. AIAA J. 2015, 53, 464–472. [Google Scholar] [CrossRef]
  31. Rostamzadeh, N.; Hansen, K.L.; Kelso, R.M.; Dally, B.B. The formation mechanism and impact of streamwise vortices on NACA 0021 airfoil’s performance with undulating leading edge modification. Phys. Fluids 2014, 26, 107101. [Google Scholar] [CrossRef]
  32. Spalart, P.R.; Jou, W.H.; Strelets, M.; Allmaras, S.R. Comments on the feasibility of LES for wings and on the hybrid RANS/LES approach. In Proceedings of the First AFOSR International Conference on DNS/LES, Ruston, LA, USA, 4–8 August 1997; pp. 137–147. [Google Scholar]
  33. Spalart, P.R.; Deck, S.; Shur, M.L.; Squires, K.D.; Strelets, M.; Travin, A. A new version of detached-eddy simulation, resistant to ambiguous grid densities. Theor. Comput. Fluid Dyn. 2006, 20, 181–195. [Google Scholar] [CrossRef]
  34. Shur, M.L.; Spalart, P.R.; Strelets, M.; Travin, A.K. A hybrid RANS-LES approach with delayed-DES and wall-modelled LES capabilities. Int. J. Heat Fluid Flow 2008, 29, 1638–1649. [Google Scholar] [CrossRef]
  35. ANSYS, Inc. ANSYS Fluent: Theory Guide, Release 2019 R2; ANSYS, Inc.: Canonsburg, PA, USA, 2019. [Google Scholar]
  36. Pindi Nataraj, P. Airfoil Self-Noise Predictions Using DDES and the FWH Analogy. Master’s Thesis, University of Twente, Enschede, The Netherlands, 2022. [Google Scholar]
  37. Drela, M. XFOIL: An analysis and design system for low Reynolds number airfoils. In Low Reynolds Number Aerodynamics: Proceedings of the Conference Notre Dame, Indiana, USA, 5–7 June 1989; Springer: Berlin/Heidelberg, Germany, 1989; pp. 1–12. [Google Scholar]
  38. Garcia-Sagrado, A.; Hynes, T. Wall pressure sources near an airfoil trailing edge under turbulent boundary layers. J. Fluids Struct. 2012, 30, 3–34. [Google Scholar] [CrossRef]
  39. Gregory, N.; O’reilly, C.L. Low-speed aerodynamic characteristics of NACA 0012 aerofoil section, including the effects of upper-surface roughness simulating hoar frost. Tech. Rep. NASA Rep. Memo. 1970, January, 3726. [Google Scholar]
  40. Amiet, R.K. Noise due to turbulent flow past a trailing edge. J. Sound Vib. 1976, 47, 387–393. [Google Scholar] [CrossRef]
  41. Howe, M.S. Trailing edge noise at low Mach numbers. J. Sound Vib. 1999, 225, 211–238. [Google Scholar] [CrossRef]
  42. Lee, S.; Shum, G. Prediction of airfoil trailing-edge noise using empirical wall-pressure spectrum models. AIAA J. 2019, 57, 888–897. [Google Scholar] [CrossRef]
  43. Corcos, G.M. The structure of the turbulent pressure field in boundary-layer flows. J. Fluid Mech. 1964, 18, 353–378. [Google Scholar] [CrossRef]
  44. Wang, J.; Zhang, C.C.; Wu, Z.Y.; Wharton, J.; Ren, L.Q. Numerical study on reduction of aerodynamic noise around an airfoil with biomimetic structures. J. Sound Vib. 2017, 394, 46–58. [Google Scholar] [CrossRef]
  45. Welch, P.D. The use of fast Fourier transform for the estimation of power spectra: A method based on time averaging over short, modified periodograms. IEEE Trans. Audio Electroacoust. 1967, 15, 70–73. [Google Scholar] [CrossRef] [Green Version]
  46. Chen, W.J.; Wang, X.N.; Qiao, W.Y.; Wang, L.F.; Tong, F. Rod-airfoil interaction noise reduction using leading edge serrations. In Proceedings of the 21st AIAA/CEAS Aeroacoustics Conference, Dallas, TX, USA, 22–26 June 2015; p. 3264. [Google Scholar]
Figure 1. Design of wavy leading edges: (a) structure of the wavy-leading-edge airfoil; (b) spanwise-section generation method.
Aerospace 10 00353 g001
Figure 2. Baseline blunt-trailing-edge airfoil.
Aerospace 10 00353 g002
Figure 3. Computational domain and airfoil surface mesh: (a) computational domain; (b) computational mesh.
Aerospace 10 00353 g003
Figure 4. Comparison of the pressure-coefficient distributions.
Aerospace 10 00353 g004
Figure 5. Comparison of the spanwise coherence length between the results computed based on IDDES data and the empirical Corcos model.
Aerospace 10 00353 g005
Figure 6. Comparison of the one-third octave band spectra predicted by different models for the baseline airfoil.
Aerospace 10 00353 g006
Figure 7. The distribution of 72 receiver points.
Aerospace 10 00353 g007
Figure 8. SPL reduction effects of the wavy airfoil: (a) SPL at 60°; (b) SPL at 90°; (c) SPL at 120°; (d) ΔSPL at 90°.
Aerospace 10 00353 g008
Figure 9. OASPL-reduction effects of the wavy airfoil: (a) directivity pattern; (b) OASPL reduction.
Aerospace 10 00353 g009
Figure 10. Comparison of the lift coefficient between the baseline airfoil and A10W10 airfoil: (a) time domain; (b) frequency domain.
Aerospace 10 00353 g010
Figure 11. Distribution of the pressure fluctuations on the airfoil’s surface: (a) baseline; (b) A10W10.
Aerospace 10 00353 g011
Figure 12. Distribution of the pressure fluctuations on various spanwise sections: (a) baseline; (b) A10W10 peak; (c) A10W10 middle; (d) A10W10 trough.
Aerospace 10 00353 g012aAerospace 10 00353 g012b
Figure 13. Distribution of the pressure fluctuations at different spanwise positions on the airfoil’s surface.
Aerospace 10 00353 g013
Figure 14. PSD of the pressure fluctuations at 0.98c on each airfoil surface.
Aerospace 10 00353 g014
Figure 15. Iso-surfaces of the Q-criterion (Q = 150,000 s−2) colored by the streamwise vorticity: (a) BaselineBlunt; (b) A10W10Blunt.
Aerospace 10 00353 g015
Figure 16. Streamwise vorticity distributions on several streamwise sections: (a) BaselineBlunt; (b) A10W10Blunt.
Aerospace 10 00353 g016
Figure 17. Distribution of the mean streamwise velocity in the wake region: (a) x = 1.1c; (b) x = 1.2c; (c) x = 1.3c.
Aerospace 10 00353 g017
Figure 18. Distribution of the fluctuating streamwise velocity in the wake region: (a) x = 1.1c; (b) x = 1.2c; (c) x = 1.3c.
Aerospace 10 00353 g018
Figure 19. Spanwise correlation analysis of the pressure fluctuations at various streamwise locations: (a) x = 0.0c; (b) x = 0.95c; (c) x = 0.98c.
Aerospace 10 00353 g019
Figure 20. Spanwise coherence analysis of the pressure fluctuations at various frequencies: (a) f = 2050.8 Hz; (b) f = 3515.6 Hz; (c) f = 4687.5 Hz; (d) f = 14,550.8 Hz.
Aerospace 10 00353 g020aAerospace 10 00353 g020b
Table 1. Grid numbers and the independence test.
MeshGrid NumberCDΔCD
Coarser2,658,1540.018473−0.038%
Coarse6,410,8420.018461−0.103%
Medium8,912,6340.018480---
Fine11,414,4260.018469−0.060%
Disclaimer/Publisher’s Note: The statements, opinions and data contained in all publications are solely those of the individual author(s) and contributor(s) and not of MDPI and/or the editor(s). MDPI and/or the editor(s) disclaim responsibility for any injury to people or property resulting from any ideas, methods, instructions or products referred to in the content.

