1. Introduction
PBN is a key enabler for airspace design; it allows for defining routes in the most advantageous location to ensure strategic de-confliction of flight paths thus reducing the need for ATC intervention. This PBN advantage provides spin-off benefits in terms of key performance areas (capacity, safety, flight efficiency, and the environment) [
1,
2]. However, PBN design and implementation is not an easy task [
3]; it should meet user expectations while maintaining safety [
4]. The International Civil Aviation Organization (ICAO) defined the Global Aviation Safety Plan (GASP) in order to present the strategy supporting the prioritization and continuous improvement of aviation safety; its main purpose is to continually reduce fatalities and the risk of fatalities [
5].
Furthermore, according to the European Union Aviation Safety Agency (EASA), 30% of accidents occur during approach and landing due to the more complex nature of these flight phases [
6]. So far, many PBN specifications have been defined to meet the operational requirements for every phase of flight, so there are area navigation (RNAV) and required navigation performance (RNP) specifications for the oceanic, remote continental, continental, terminal, and approach phases [
4]. For the approach phase, there are different instrument flight procedures, which allow the aircraft to descent to lateral navigation performance (LNAV), lateral and vertical navigation performance (LNAV/VNAV), or localizer performance with vertical guidance (LPV) minima. A thorough description of the design criteria can be found in the ICAO PANS-OPS [
7] and other related documents; however, many times, these criteria are not clear enough, so the flight procedure designer must make some decisions without knowing the exact implications on safety, the environment, capacity, or efficiency.
The ICAO published the first edition of the
PBN Manual [
8] in 2008. By this time, the ICAO, at the 37th Assembly, took the resolution 37-11 which stated the PBN implementation plan as a matter of urgency. This resolution required among other things, “the implementation of approach procedures with vertical guidance (APV) (Baro-VNAV and/or augmented GNSS), including LNAV only minima for all instrument runways ends, either as primary approach or as a back-up for precision approaches…”. This resolution was the starting point for the PBN implementation race all over the world.
Once the ICAO resolution was stated, the European Commission issued the PBN implementation rule [
1] through which it is a requirement to implement PBN applications in all the airspace above the territory to which the European Union Treaty applies; its implementation is planned by 2020, 2024, or 2030 depending on the aerodrome and/or instrument runway ends.
The FAA (Federal Aviation Administration) in its roadmap for PBN [
9] highlights that the use of RNAV and RNP is expected to: increase safety, improve airport and airspace access, increase reliability and reduce delays, improve efficiency and flexibility, reduce workload, and improve air traffic controller productivity.
In PBN approach procedures with barometric vertical guidance, the effective VPA depends on the airport temperature at the approach execution time. The ICAO PANS-OPS [
7] states, “The VPA promulgated shall be such that the effective VPA throughout the year is as close as possible to 3.0° for the given aerodrome elevation and prevailing temperatures”. This requirement contains several issues to be clarified aimed at meeting the vertical margin over the obstacles and, at same time, obtaining maximum runway throughput (approach minima) [
10]. Due to the characteristics of vertical navigation based on atmospheric pressure, the effective VPA depends on the airport temperature. If the actual airport temperature is lower than the ISA (International Standard Atmosphere) temperature for a particular altitude/elevation, the effective VPA results will thus be lower than the promulgated one. Conversely, if the actual temperature is higher than the ISA temperature, the effective VPA will be higher than the promulgated one [
11].
Moreover, in PBN approach procedures with barometric vertical guidance, an obstacle protection surface, called the final approach segment (FAS), comes into play. The purpose of this surface is to protect against obstacles along the final segment of the approach. The FAS slope depends on the minimum effective VPA, which in turn depends on the selected low temperature design.
When the effective VPA is the minimum allowed (2.5°), there is more likelihood for obstacles to penetrate the FAS surface, resulting in higher obstacle clearance height (OCH) and potentially poorer runway throughput. On this basis, it seems essential to know a suitably designed low temperature to be selected for computation of the effective minimum VPA, seeking a FAS that is not lower than needed (potential higher minima).
Much research work on the implementation of PBN procedures has been carried out to demonstrate its benefits or its safety. Butchibabu et al. [
12] noted in their study that PBN procedures offered significant safety improvements; although it is recognized that PBN implementation brings both opportunities and challenges, it is also true that PBN brings more flexibility in airspace design and its derivative benefits.
The FAA [
13] conducted a study using a risk analysis methodology developed by the Multiple Parallel Approach Program (MPAP) for simultaneous independent ILS approaches to parallel runways. This methodology was used to determine the acceptability of including RNAV and RNP aircraft in simultaneous independent approach operations with high-update radar surveillance, as specified in Order 7110.65S [
14]. The study used a high-fidelity simulation of the operation to perform a Monte Carlo analysis and it was assumed that the integrity, availability, and continuity functions inherent in RNP were covered for RNAV aircraft by the required ATC surveillance and the other conservative assumptions. At present, the ICAO has stated criteria for implementing simultaneous approaches in parallel runways using RNP APCH (LNAV/VNAV), that is, approaches with barometric vertical guidance [
7,
15,
16].
Muller et al. [
17] expound that PBN procedures help to improve throughput and increase the safety margins associated with high-elevation airports and remote areas with little ground-based navigation infrastructure. In addition, the safe reduction of separation and traffic congestion were among the airspace improvements highlighted. They also considered environmental improvements such as reducing fuel consumption and noise pollution.
Ralf H. et al. [
18] examined PBN procedures in relation to independent final approaches for parallel runway landings. They stated that the use of the published PBN procedures has resulted in improvements in navigational accuracy and, in addition, improved the reliability of operations in the terminal airspace surrounding major United States airports. They concluded that potential benefits are expected with PBN implementation at airports with closer runway spacing in terms of operational safety and reductions in approach control requirements.
Tian et al. [
19] established a safety assessment model for PBN airspace operational planning. This model considers the meteorological uncertainty factor, identifies the capacity scenarios with the capacity probability distribution, and studies the conflict risks under various capacity scenarios. They demonstrate that safety can be effectively quantified and that compelling benefits are expected from an optimal operational scheme development that balances risk and capacity demand.
Lim et al. [
20] analyzed how different final approach descent profiles can affect runway occupation time. An important fact related to the study presented is that the selection of the temperature in the design of the procedure directly affects the slope that the aircraft will follow in each approach, which could influence the runway exit that the aircraft is able to use.
Finally, Kabir O et al. [
21] identified significant operational benefits from the use of PBN procedures. They also revealed that fewer conflicts are reported with PBN procedures than with conventional ones.
From the literature review, it seems clear that the implementation of PBN procedures will contribute positively to safety. On this basis, this research study focused on analyzing the impact on the final proposal of temperature selection in the early design phase for PBN approach procedures with barometric vertical guidance. The selected temperature should meet the required safety levels and, at the same time, maintain or improve runway throughput and provide the maximum period of time in which the approach procedure can be used.
This research work is directly involved with the implementation of PBN approach procedures and its consequences on the potential reduction of CFIT (controlled flight into terrain) accidents during approach and landing, bearing in mind that the final approach descent path other than the nominal 3° directly affects the non-stabilization of the approach and therefore runway over-run can occur as a result [
22,
23].
The remainder of this paper is structured as follows:
Section 2 presents the problem description;
Section 3 presents the methodology for carrying out the statistical analysis of airport temperatures;
Section 4 presents the application of the temperature statistical analysis of the selected airports;
Section 5 presents a practical example of the impact of temperature selection on the OCH; then,
Section 6 presents the proposed methodology for selecting the low temperature to be used in the approach design; and, finally, in
Section 7, the conclusions are presented.
2. Problem Description
Every state shall promulgate the VPA (nominal vertical path angle) for the PBN procedures with barometric vertical guidance for a particular approach in the AIP. Then, depending on the airport temperature at any time, the effective VPA could be different.
In all instrument approach procedures, the obstacle clearance height (OCH) must be determined, that is, the height above the threshold to which the aircraft will be able to descend in instrument flight conditions to maintain a safety margin above the obstacles. If having reached that height, the pilot acquires the required external visual references, the pilot may continue with visual references to land. If visual references have not been acquired, the pilot must start the missed approach.
As indicated, the temperature at the airport at the time of the approach will determine the actual descent angle, which is called the effective VPA. In the design of the procedure, the temperatures that may occur at the airport must be considered so that in no case the minimum effective VPA is lower than 2.5° and the maximum does not exceed 3.5°, with this maximum being a recommendation. De Smedt et al. in their research [
24] stated that in scenarios with high positive temperature ISA deviations (∆ISA), in particular when combined with lateral navigation errors, caused the aircraft to lose the signal of the localizer, and thus, flight crew interventions were required to intercept the glide path. Hence, knowing how temperature affects the VPA becomes of essential in the design process to guarantee safety.
The study presented below refers exclusively to the selection of temperatures that result in effective VPA below the promulgated VPA.
During the design of the procedure, the designer is faced with making a decision about which “low” temperature to use considering that if the chosen low temperature were, for example, the historical minimum, the effective VPA could be very low and this would not be a problem if it were not for the fact that by choosing a lower temperature than necessary, the OCH value could be higher than necessary and this could reduce the airport’s throughput. The problem is explained in more detail below.
Due to the characteristics of vertical navigation based on atmospheric pressure, the effective VPA depends on the airport temperature. If the actual airport temperature is lower than ISA (International Standard Atmosphere) temperature for a particular altitude/elevation, the effective VPA results will thus be lower than the promulgated results. Conversely, if the temperature is higher than the ISA temperature, the effective VPA will be higher than the promulgated one [
10].
Formulas for computing the effective VPA as a function of an ISA deviation which is constant with altitude can be found in ICAO PANS-OPS Volume II; the formula reads as follows [
7]:
where:
FAP: final approach point
HFAP: FAP height above runway threshold considering promulgated VPA
THR: runway threshold
XFAP: horizontal distance FAP-THR
RDH: reference datum height. Height above THR of the promulgated VPA
Δh: height correction for high/low temperatures at FAP
Note that in Equation (1), Δh has its own sign; Δh is negative for high temperatures and positive for low temperatures. Δh is obtained with the following equation:
where:
ΔTSTD: aerodrome temperature deviation at sea level regarding standard atmosphere temperature
L0 = −0.0065 °C/m = standard temperature lapse rate with pressure altitude in the first layer (sea level to tropopause) of the ISA
T0 = 288.15 K standard temperature at sea level
Note that, in Equation (2), when , that is, the actual aerodrome temperature is the one that corresponds to it according to the standard atmosphere, the value of Δh is 0, and therefore, the effective VPA will be equal to the promulgated VPA.
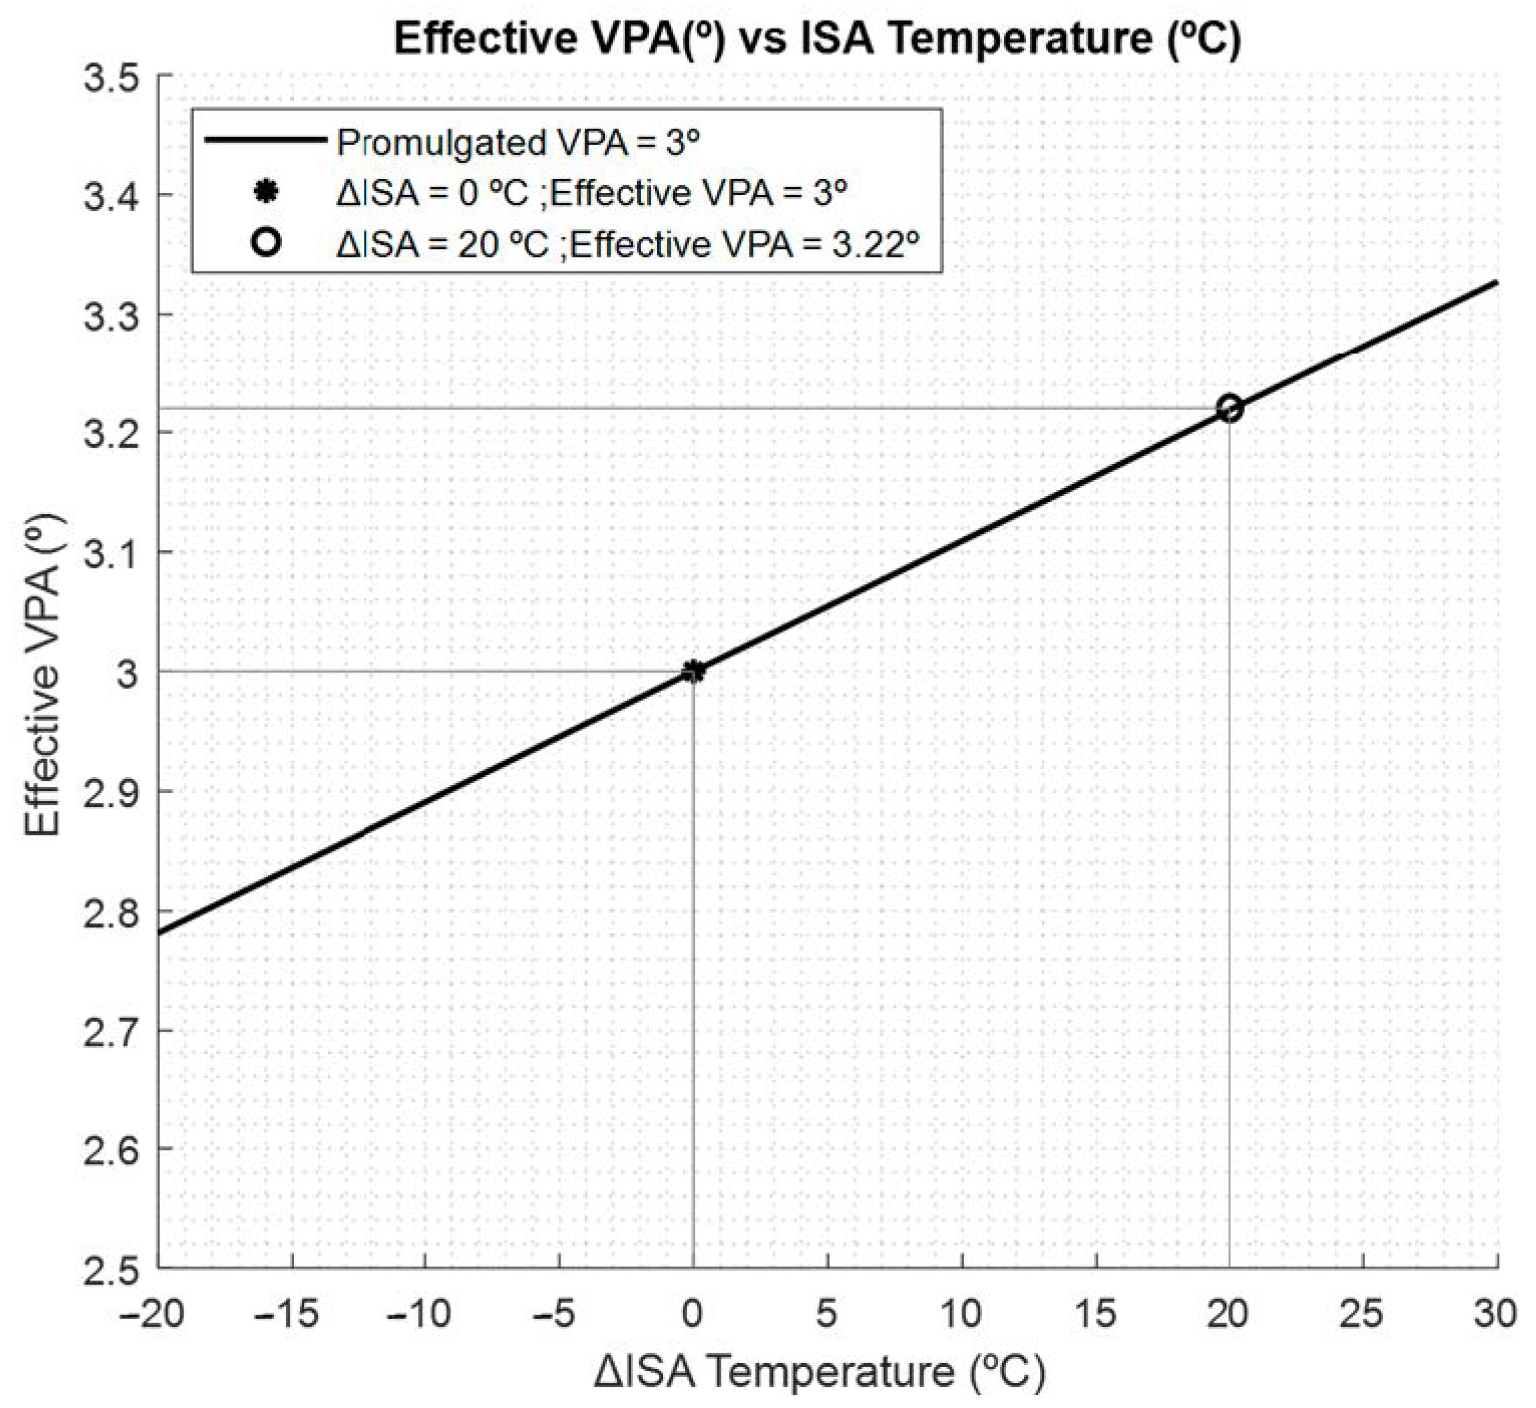
Figure 1 shows the effective VPA obtained as a function of the ΔISA temperature. It can be clearly seen that when airport temperatures are very low or very high, the effective VPA is very different from the promulgated one. For example, if the ΔISA were 0 °C, the value of the effective VPA would coincides with the value of the promulgated VPA. However, if the ΔISA were 20 °C, the value of the effective VPA would be higher than the promulgated VPA.
2.1. Effective VPA and Final Approach Surface (FAS) Relationship
Moreover, in PBN approach procedures with barometric vertical guidance, an obstacle protection surface, called a final approach segment (FAS), comes into play. The purpose of this surface is to protect against obstacles along the final segment of the approach. The FAS slope depends on the minimum effective VPA, which in turn depends on the selected design temperature.
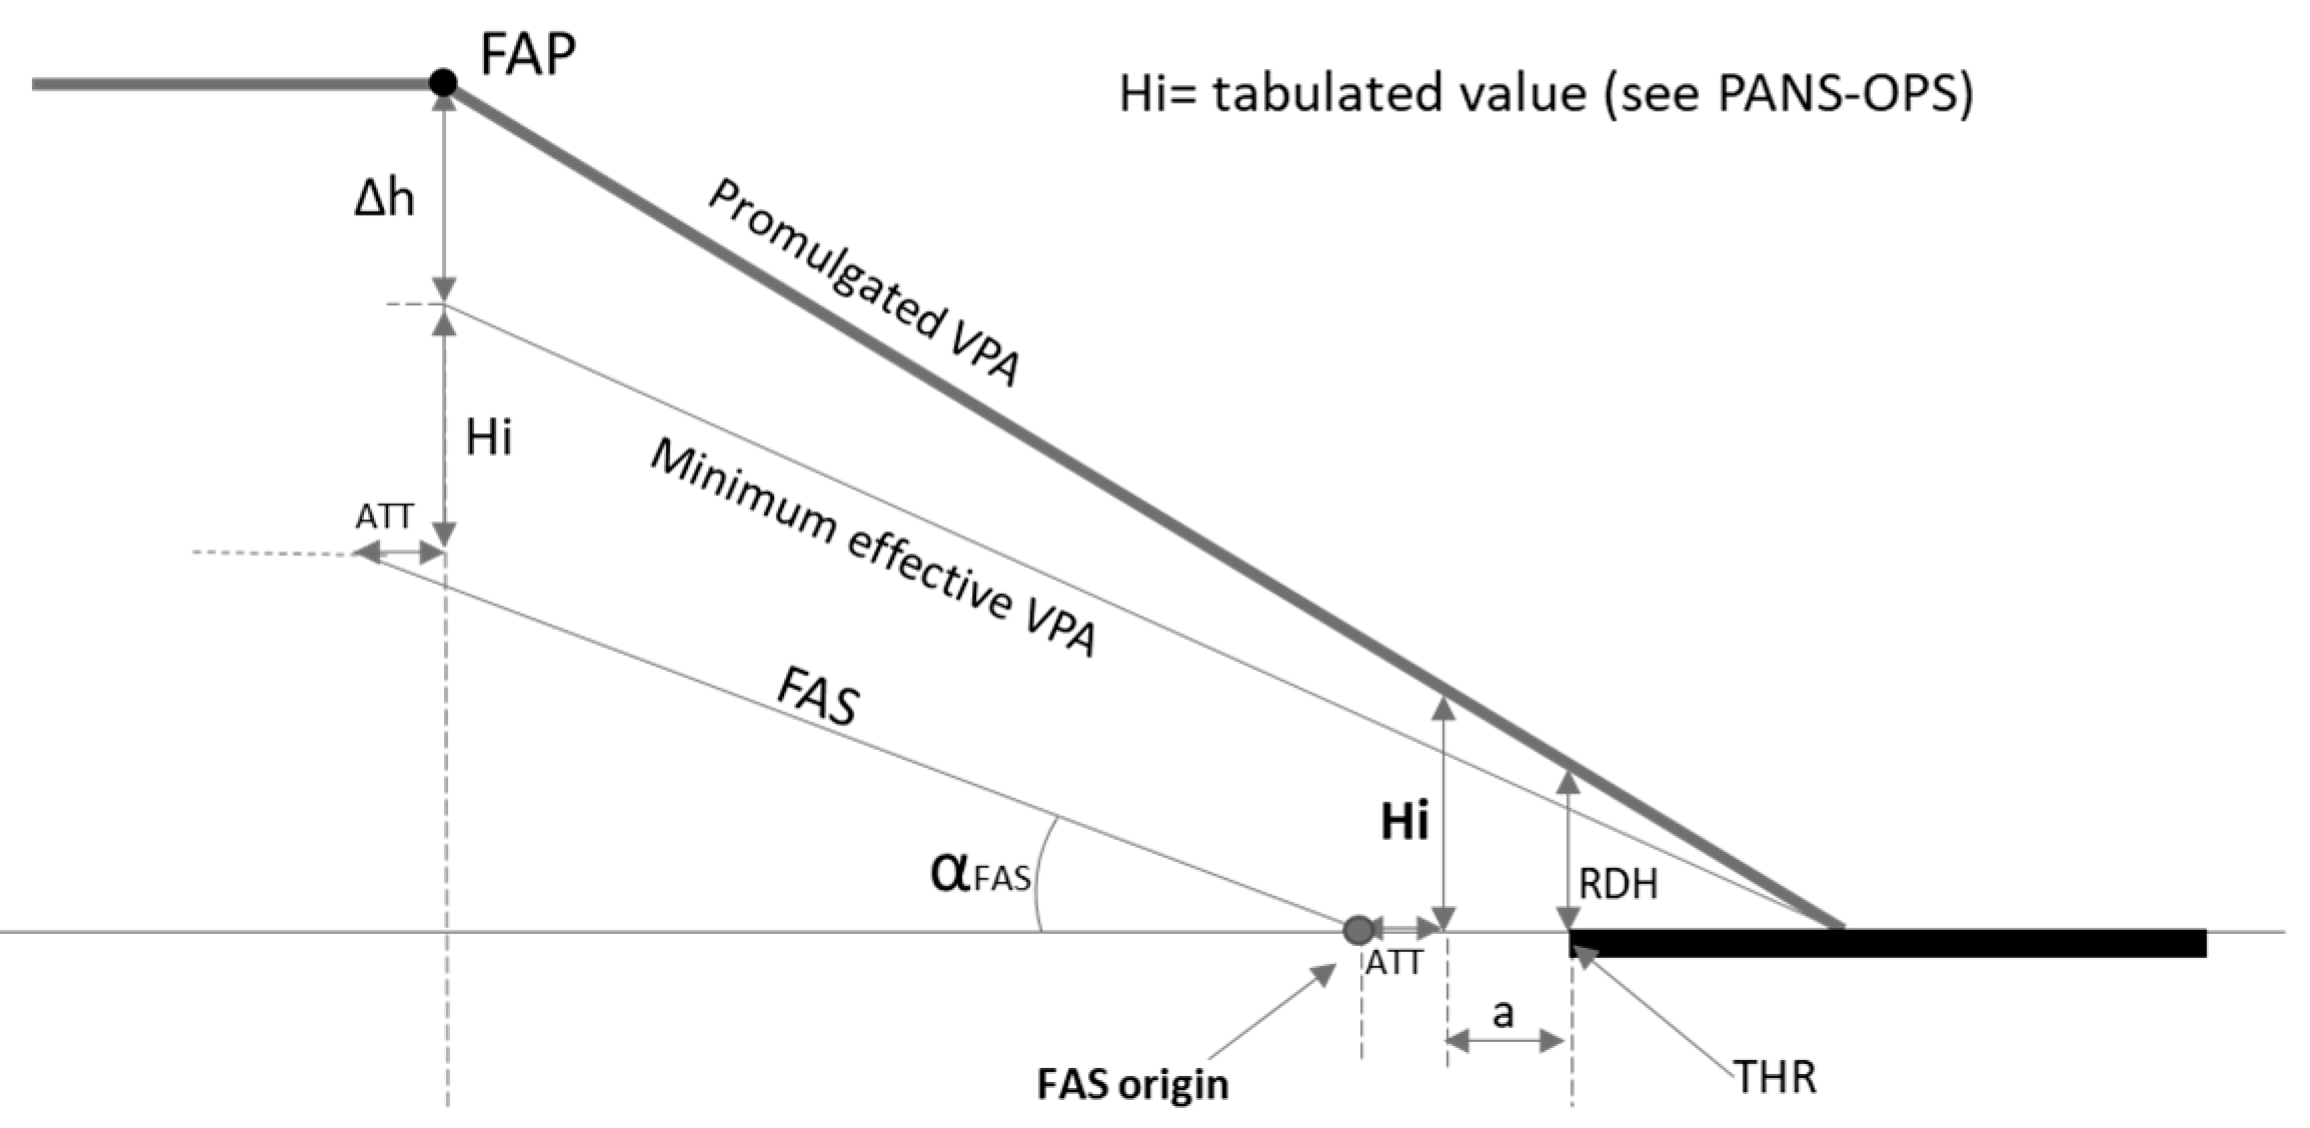
Figure 2 presents the relationship between the slopes of the promulgated VPA, the effective VPA, and the FAS. In
Figure 2, starting from the position of FAP, the Δh is subtracted from FAP height to obtain the effective VPA, and later, a value Hi is subtracted from it to obtain the slope of the FAS. Hi is a tabulated value that does not depend on the temperature.
2.2. FAS and Obstacle Clearance Height (OCH) Relationship
The lower the effective VPA, the lower the slope will be for the FAS, and, therefore, the greater the probability that there will be obstacles that penetrate the FAS, and, therefore, the greater the probability that the OCH will be higher.
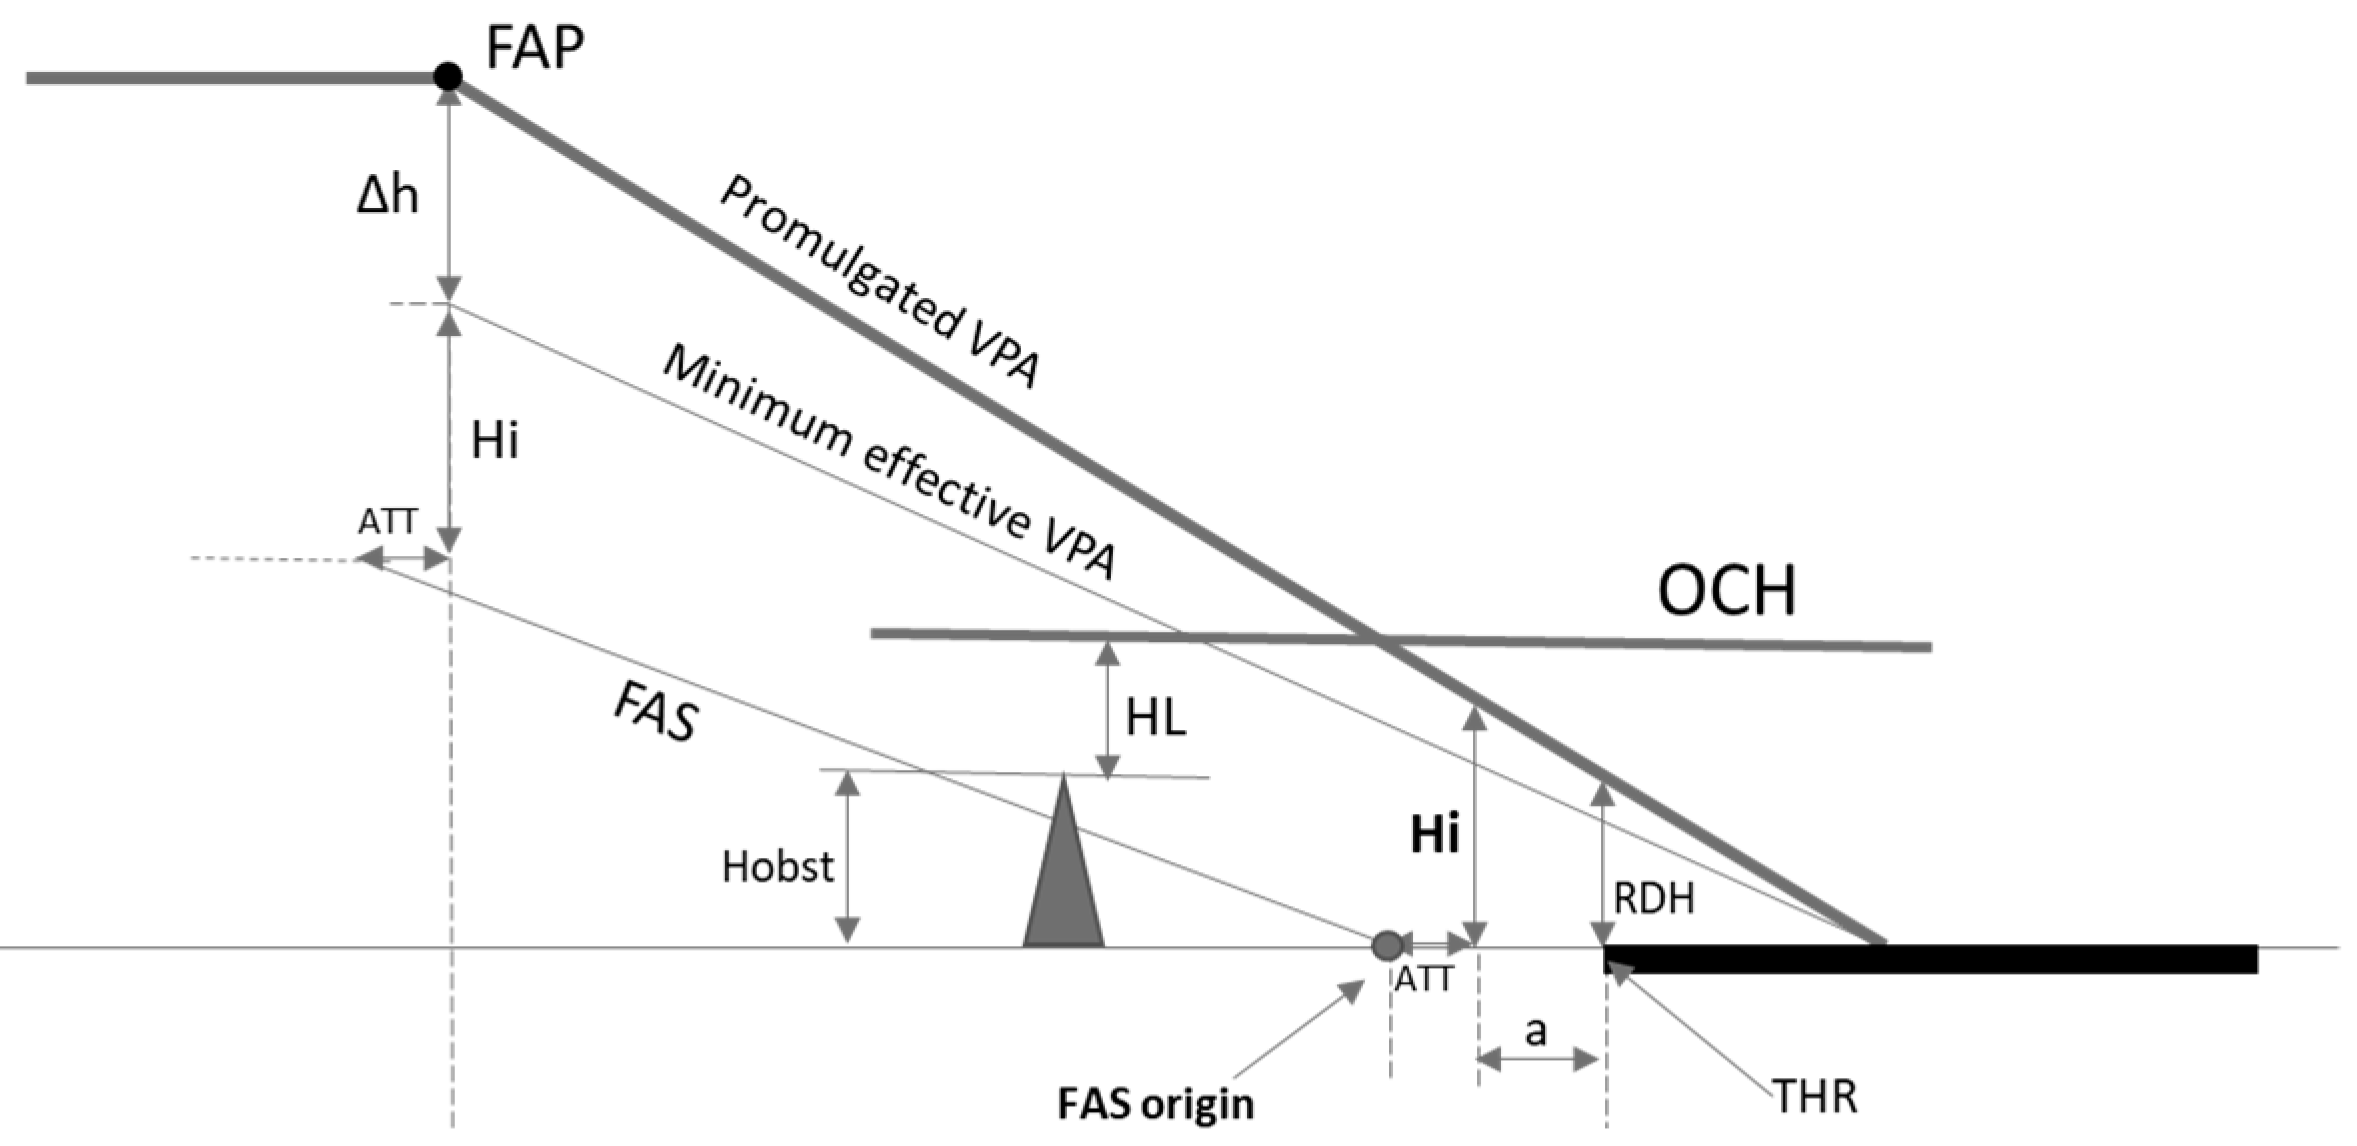
Figure 3 shows the situation in which there is an obstacle that penetrates the FAS. In this case, a height lost (HL) margin is added to the obstacle height to obtain the OCH value.
To calculate the OCH, the obstacles that penetrate the FAS are taken into account, and two conditions may exist:
No obstacles penetrate the FAS, so OCH = HL
There are some obstacles that penetrate the FAS, so OCH = Hobs + HL
As a summary, if the FAS is lower than needed, there may be obstacles that penetrate it and that determines an OCH higher than necessary.
2.3. OCH and Cloud Ceiling
Obviously, the cloud ceiling does not depend on the OCH, but the height of the cloud ceiling relative to the OCH can affect the probability of having to perform a missed approach, thus:
If OCH > cloud ceiling, then the missed approach probability is very high.
If OCH ≤ cloud ceiling, then the missed approach probability is low
Figure 4 shows the situation where the cloud ceiling is lower than the OCH. In this case, when the aircraft descends to the height of the OCH, the clouds will probably prevent the pilot from acquiring the necessary visual references, and therefore, he/she would have to start the missed approach. In this situation, the runway throughput would be reduced.
3. Statistical Analysis of Airport Temperatures: Theoretical Background
Once the importance of selecting the value of the minimum design temperature was explained, a statistical analysis of the temperatures of selected airports was carried out, the results of which allow certain conclusions to be drawn.
In order to obtain representative low temperatures for each airport, the next steps have been followed:
Obtaining the airport temperature database for the hours of operation over a period of at least 5 years, preferably the last 5 years [
25];
Checking that the sample size is relevant;
Plotting the database histograms;
Fitting the probability density function to each histogram;
Obtaining representative low temperatures.
Sample size can be defined as the number of data points tested in a study. Larger sample sizes help researchers identify outliers in data and provide smaller margins of error [
26].
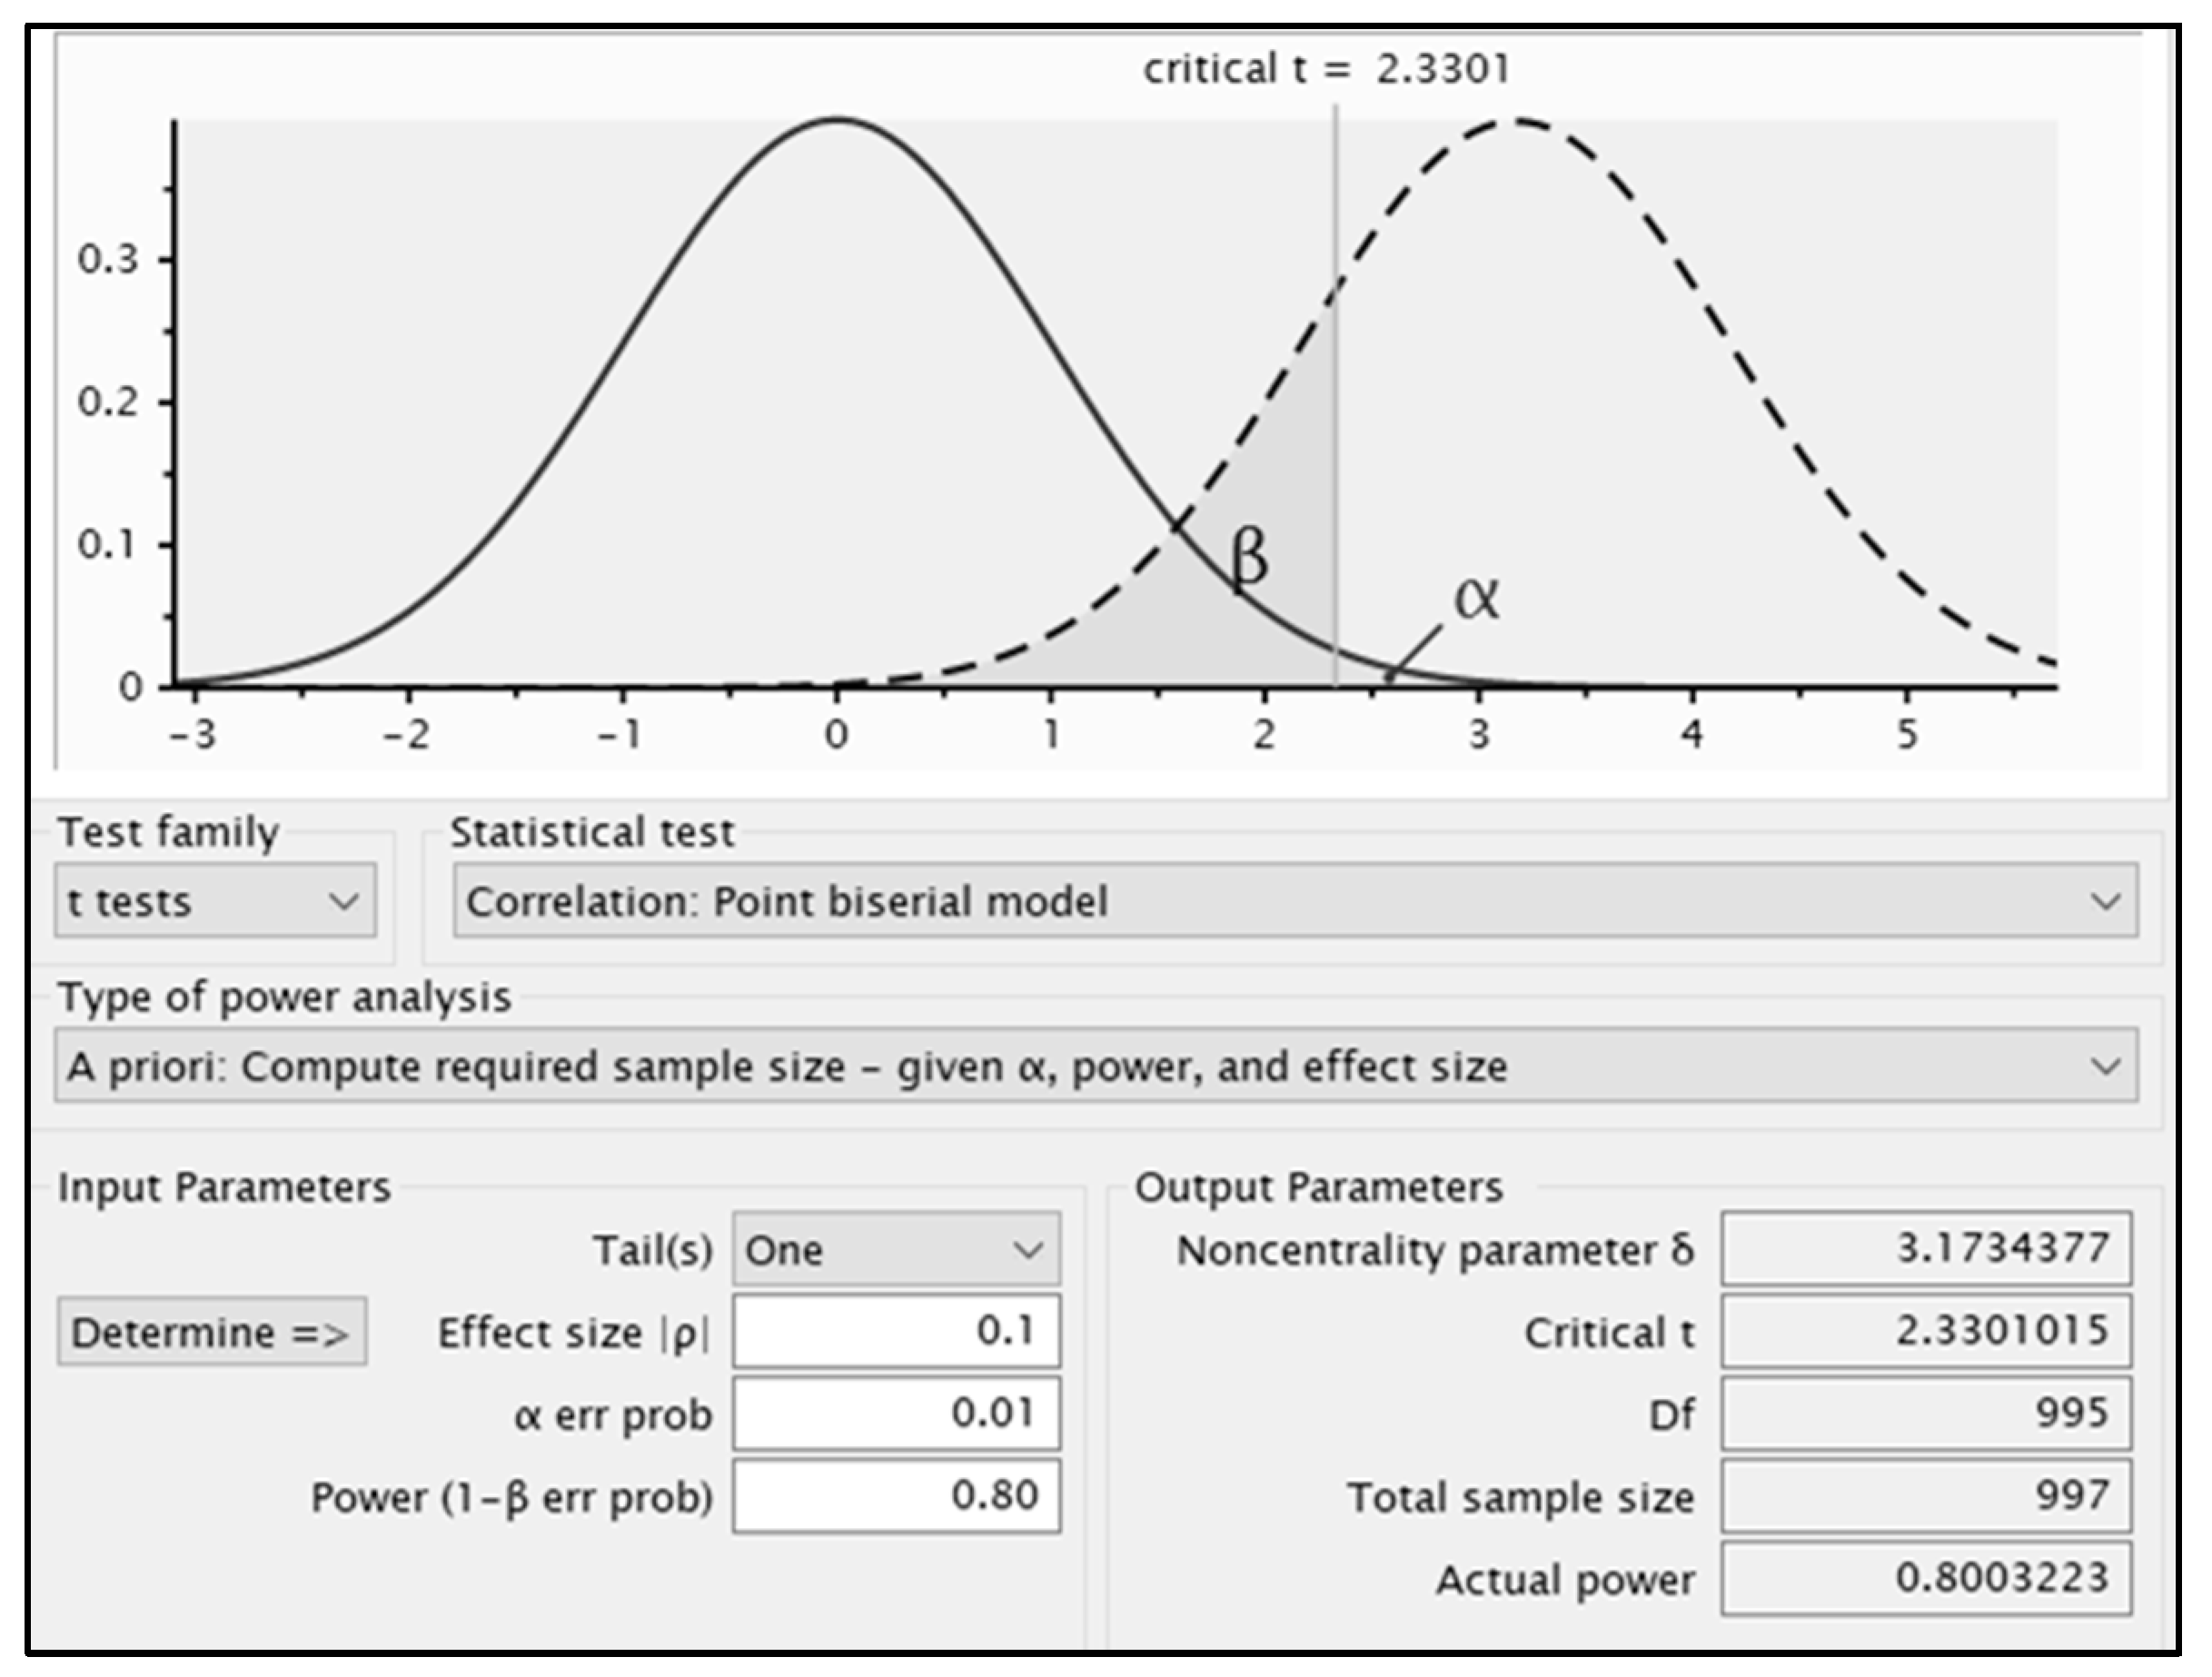
Different methods can be used before the start of the study to calculate the most suitable sample size for the specific research. In recent years, numerous pieces of software and websites have been developed which can successfully calculate sample sizes in various study types. In particular, G-Power v3.1 software has been used in this study. G-Power is a free-to-use tool that can be used to calculate statistical power for many different
t-tests, F-tests, χ
2 tests, z-tests, and some exact tests. By setting the effect size values to 0.1, a 99% confidence level (α = 0.01), and 80% power, the sample size should be at least 997, as shown in
Figure 5.
According to the previous figure, a sample size of 997 would be sufficient. In the study presented here, the sample size is not a problem, since when considering temperature data extracted from the METAR, there is a sample every half hour, which means that thousands of data are available over a period of 5 years, a sufficient value to consider a relevant sample size.
Once it has been verified that the sample size is adequate to perform the statistical study, a histogram of the data is plotted. Then, the different probability density functions are fit to these histograms. The probability density function fitting in this study was achieved using STATGRAPHICS Centurion v19 software [
27].
The two commonly used goodness-of-fit tests are the Kolmogorov–Smirnov test and the Anderson–Darling test. They are used to decide whether a sample comes from a population with a given distribution (normal, logistic, largest extreme value, etc.).
The Kolmogorov–Smirnov test [
28] has a representative statistic, which is the largest difference (in absolute value) between the cumulative sample distribution and the theoretical distribution. “D” is defined as:
where:
F: the frequency of the theoretical distribution at position i
N: the total number of elements
Comparing this “D”-value of all the functions studied, the one with the smallest is the best fit to the data. Note that probability density functions can be different for every assessed airport since each one has its own temperatures histograms.
Conversely, the Anderson–Darling test [
29] gives more weight to the tails of the distribution than the Kolmogorov–Smirnov test. Its statistic is defined as:
where as before:
F: the frequency of the theoretical distribution at position i
N: the total number of elements
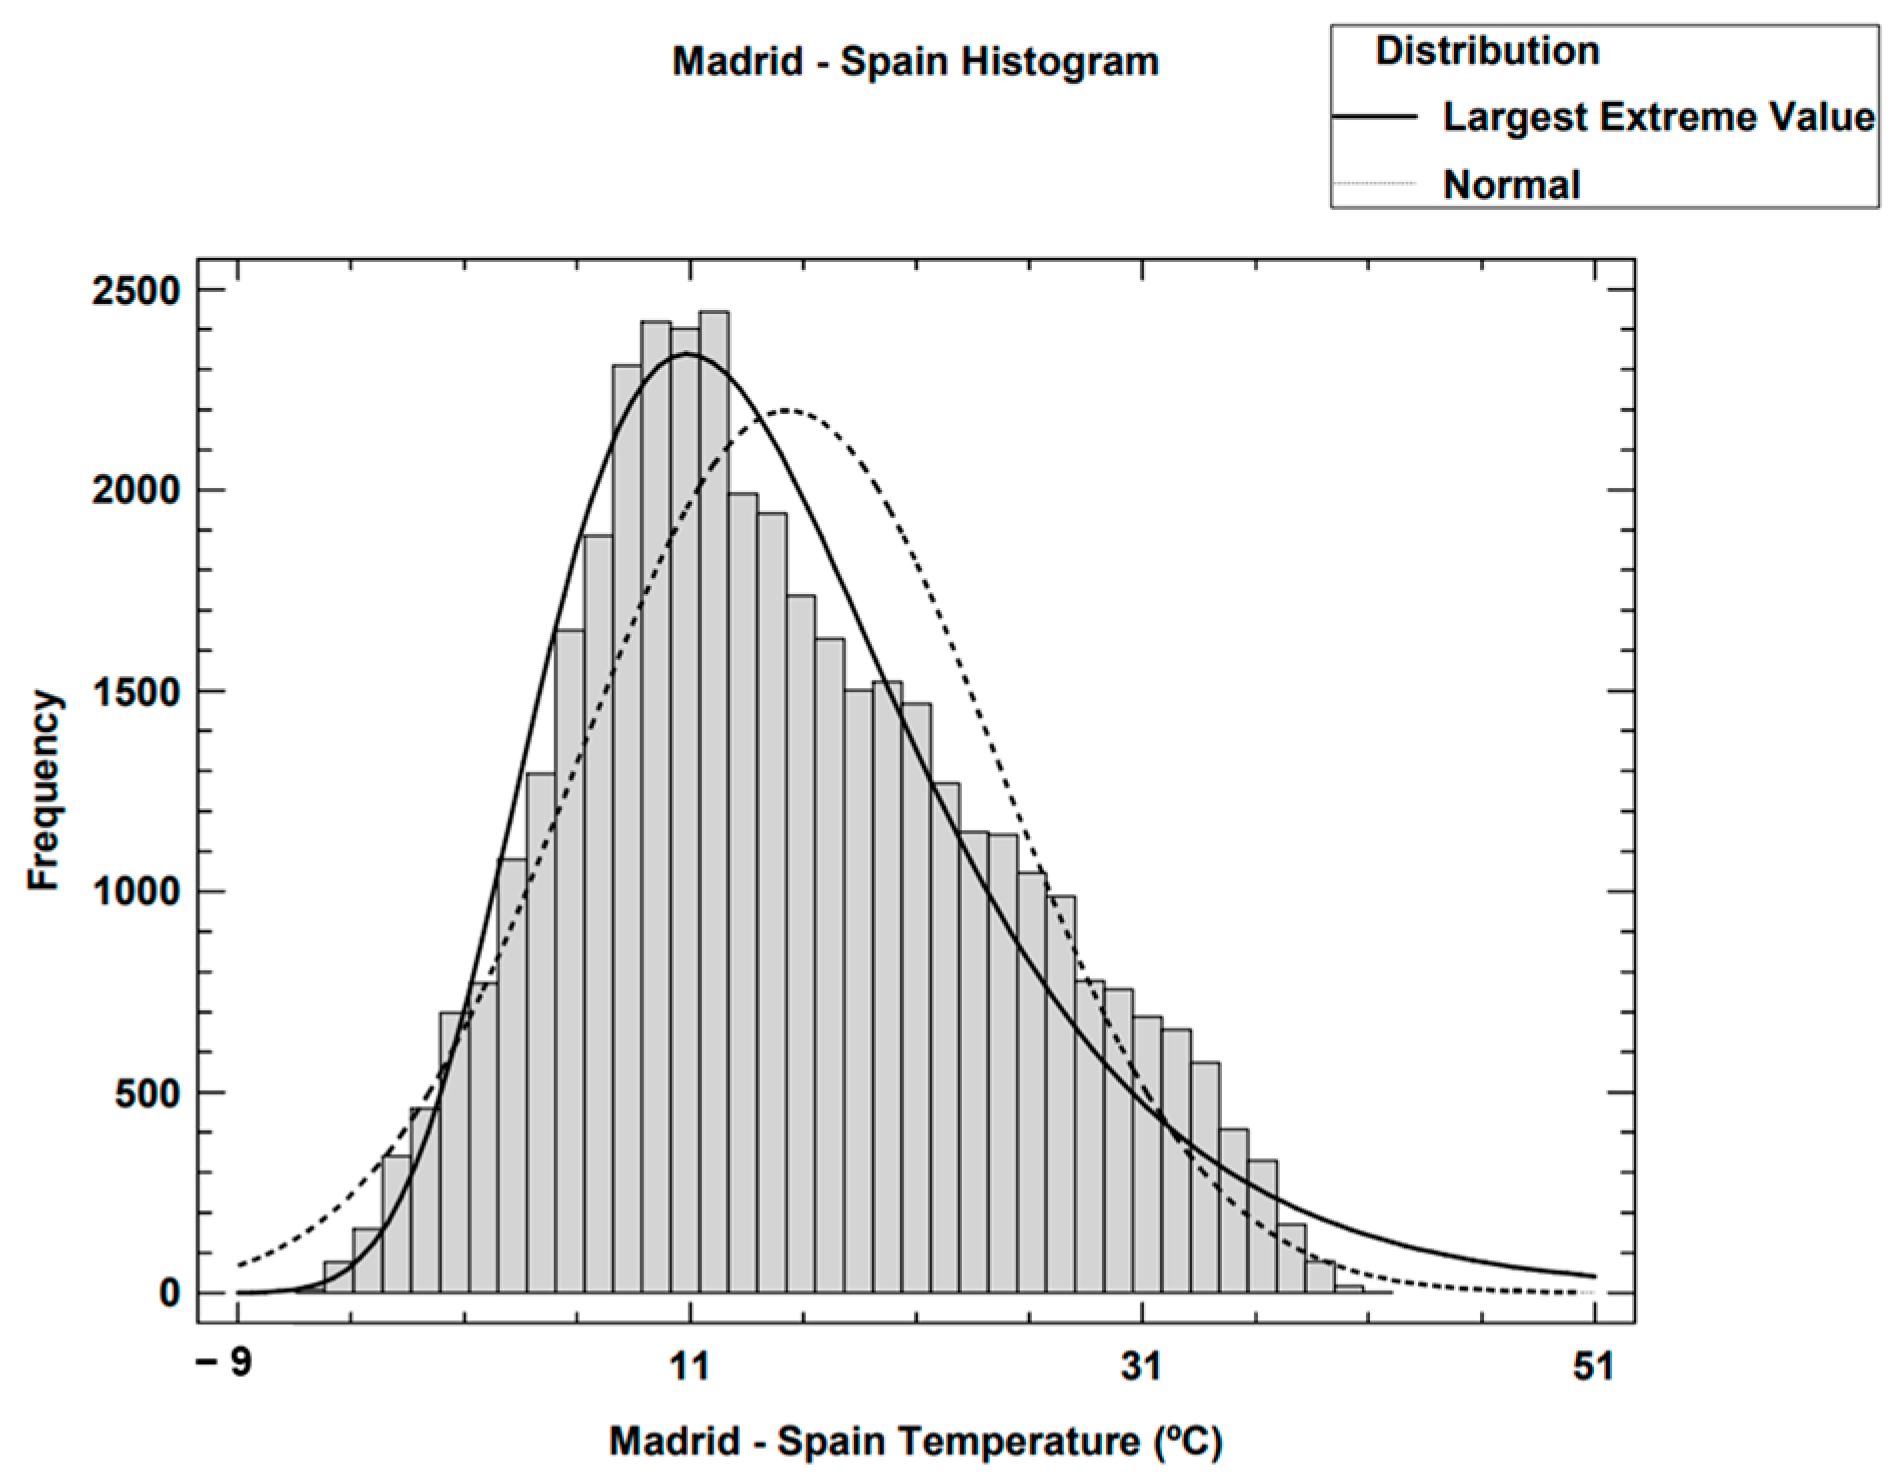
Taking Madrid Airport as an example, its statistic values for each of the probability density functions are represented in
Table 1.
In this example, according to
Table 1, the best-fit function is the largest extreme value distribution [
30] because it has the smallest “D” and A
2 values. This can be considered a good fit as the density function graphically matches the histogram (see
Figure 6). In fact, other temperature studies have been carried out in which the extreme value model best fits the temperature data as compared to other models [
31,
32].
Once the probability density function for the airport is known, each representative temperature threshold can be calculated.
Table 2 shows the temperature thresholds at which the actual temperatures at the aerodrome will be greater than or equal to them with the stated probability. Any temperature threshold can be selected; however, for the purposes of this study, choosing a particular threshold means accepting that for the temperatures below it, the approach procedure cannot be used; therefore, 95% is considered the lowest value, therefore accepting that for 5% of temperatures, the approach procedure cannot be used.
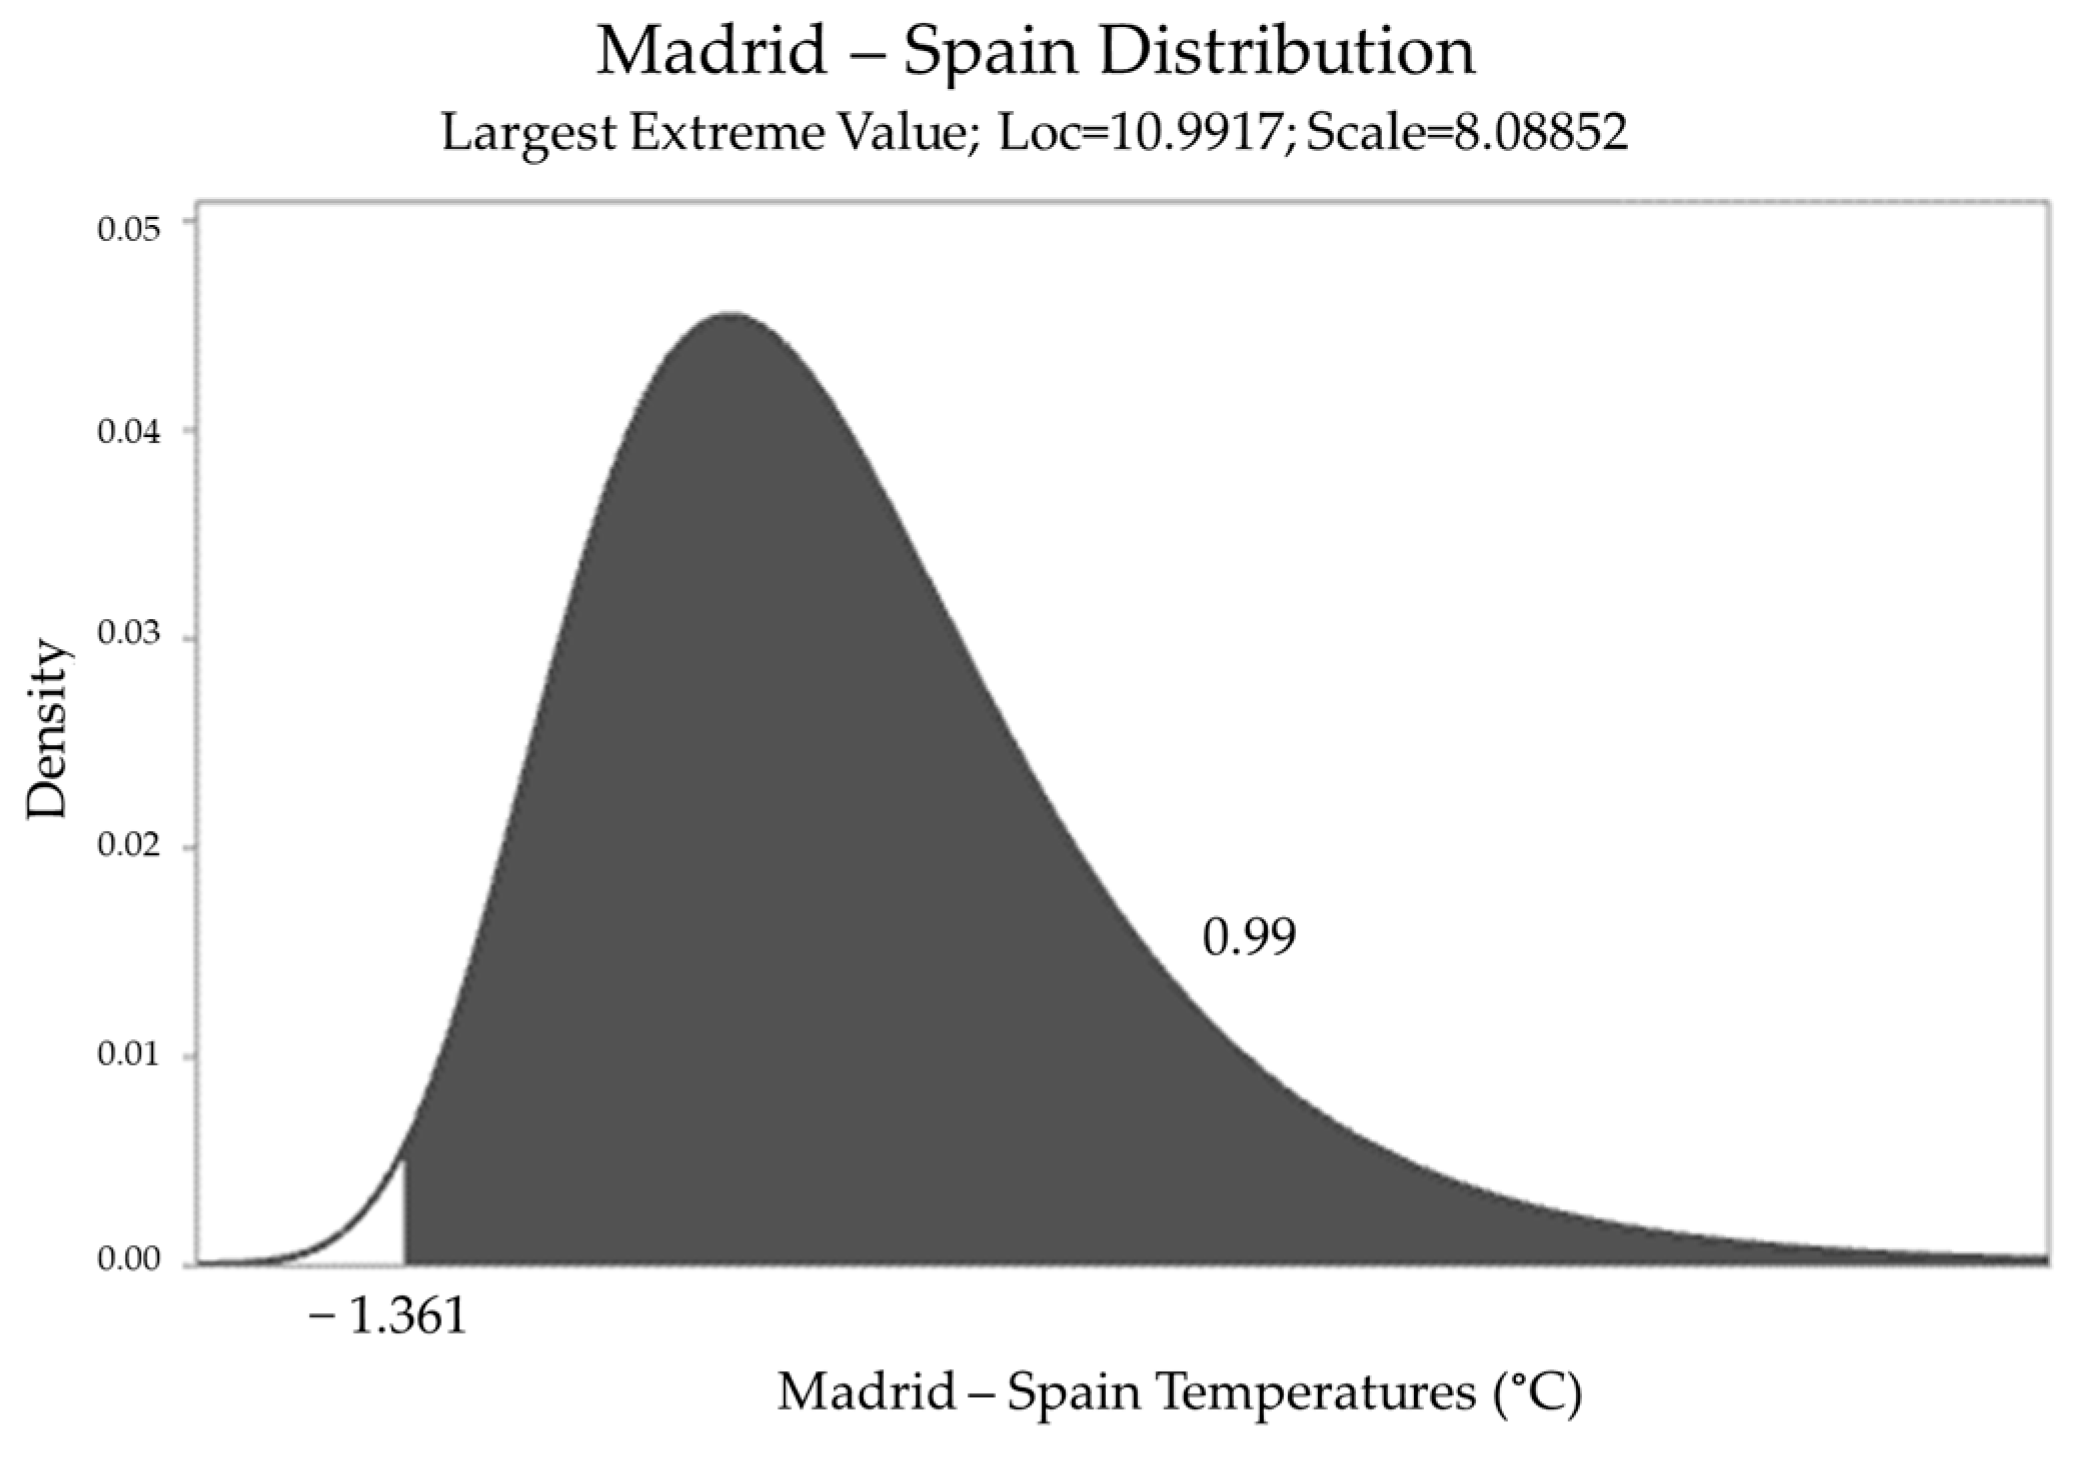
In this study, the temperatures that correspond to 95 and 99% were selected as the threshold values. These thresholds were chosen because they are the most commonly used values in statistics as explained by Avijit Hazra [
33] and those used by the ICAO, for example, when defining the accuracy or the errors of navigation aids or surveillance systems.
For example, the probability that the actual temperature at the airport is greater than or equal to −1.36 °C is 99%, as is shown in
Figure 7.
Occasionally, the fitting between the probability density function and the histograms is good graphically; however, the
p-value obtained is negligible. In this case, this fact should not be used to reject the adjustment. Many authors, such as J. Ranstam [
34], have shown that the
p-value should not be taken as the only decision element.
In cases where the
p-value does not offer the expected value, the use of percentiles can be taken as an alternate method. For this study, the 95% and 99% percentiles of the temperature databases were also calculated. For example, in
Table 3, it is shown that with 95% confidence, the airport temperatures are greater than 1.8 °C.
There may be small differences between the temperature thresholds using probability density functions and percentiles; however, for the purpose of calculating the minimum effective VPA, these differences are not significant.
4. Statistical Analysis of Airport Temperatures: Application to Selected Airports
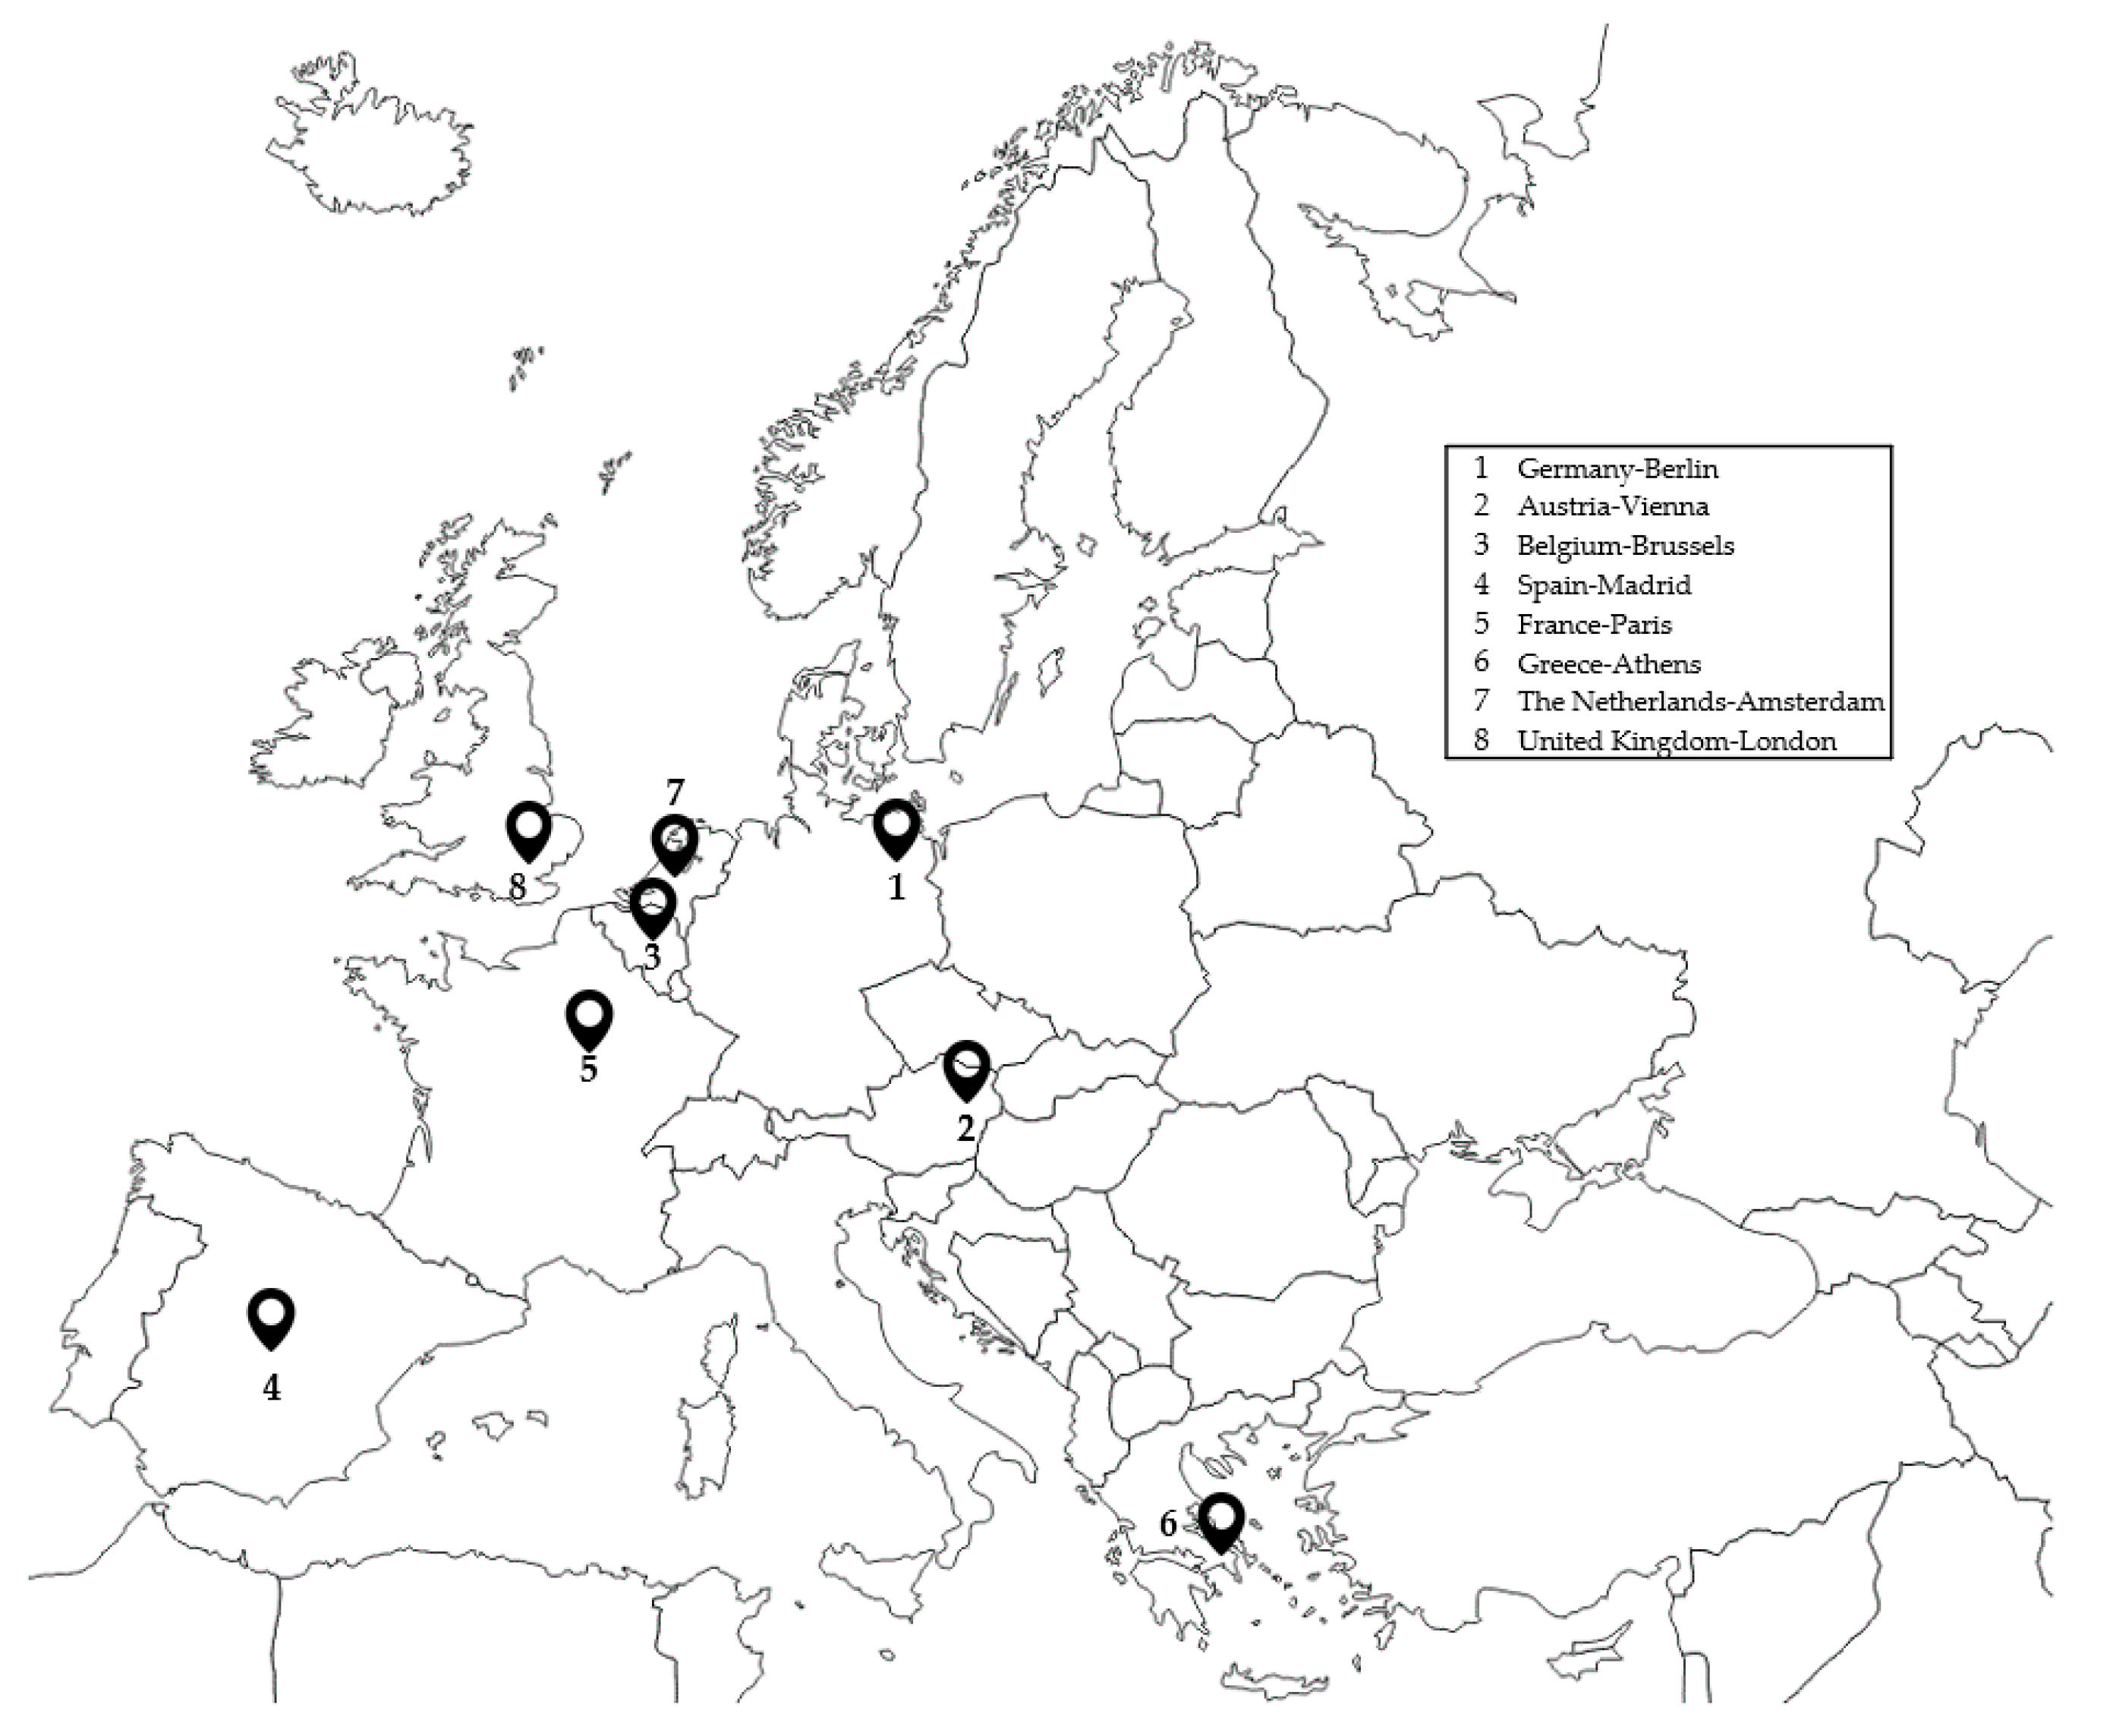
In this section, the results obtained from the statistical study of the temperature databases are presented. These databases correspond to different European airports in a time frame from 2016 to 2020. The databases were created using METAR information.
An attempt was made to choose airports with different climates and temperatures in order to cover sufficient scenarios (see
Figure 8).
4.1. Sample Size Verification
As demonstrated in the previous section, as a minimum the sample size has to be 997 values. All the databases that have been studied are more than sufficient.
Table 4 demonstrates this. Furthermore, the exact value of the effect size has been calculated with the sample size of each database, keeping the confidence at 99% and the power at 80%.
As can be seen, the effect size is smaller than 0.1, a value that is established as small. Thus, for small effect sizes, the power is equal to or greater than 80%, and confidence levels of 99% ensure that the sample size is sufficiently significant.
4.2. Identification of Representative Low Temperatures at the Airport
Following the process explained in
Section 3, the probability density function for each airport studied was calculated.
Table 5 summarizes the results obtained. It should be noted that the value of the historical minimum temperature (2016–2020) has been added to allow for comparison and to obtain more accurate conclusions.
The results obtained were used to calculate the different effective VPAs corresponding to a promulgated VPA of 3° following Equation (1). (see
Table 6).
As mentioned above, 95% and 99% percentiles were also calculated for each of the airports and their respective minimum effective VPAs. (see
Table 7).
Analyzing the previous tables (
Table 6 and
Table 7), it can be affirmed that in terms of effective VPA, there are no significant differences in choosing as the “low” design temperature the one that represents 95%, 99%, or even the historical minimum, regardless of whether temperatures corresponding to probability density functions or percentiles are chosen.
5. Impact of Temperature Selection on the OCH: A Practical Case
In order to check if the variation between effective VPAs is substantial, a practical case has been made to see how the OCH varies depending on the obstacles and the minimum design temperature. It should be noted that all the values obtained are taken as an example from Madrid Airport.
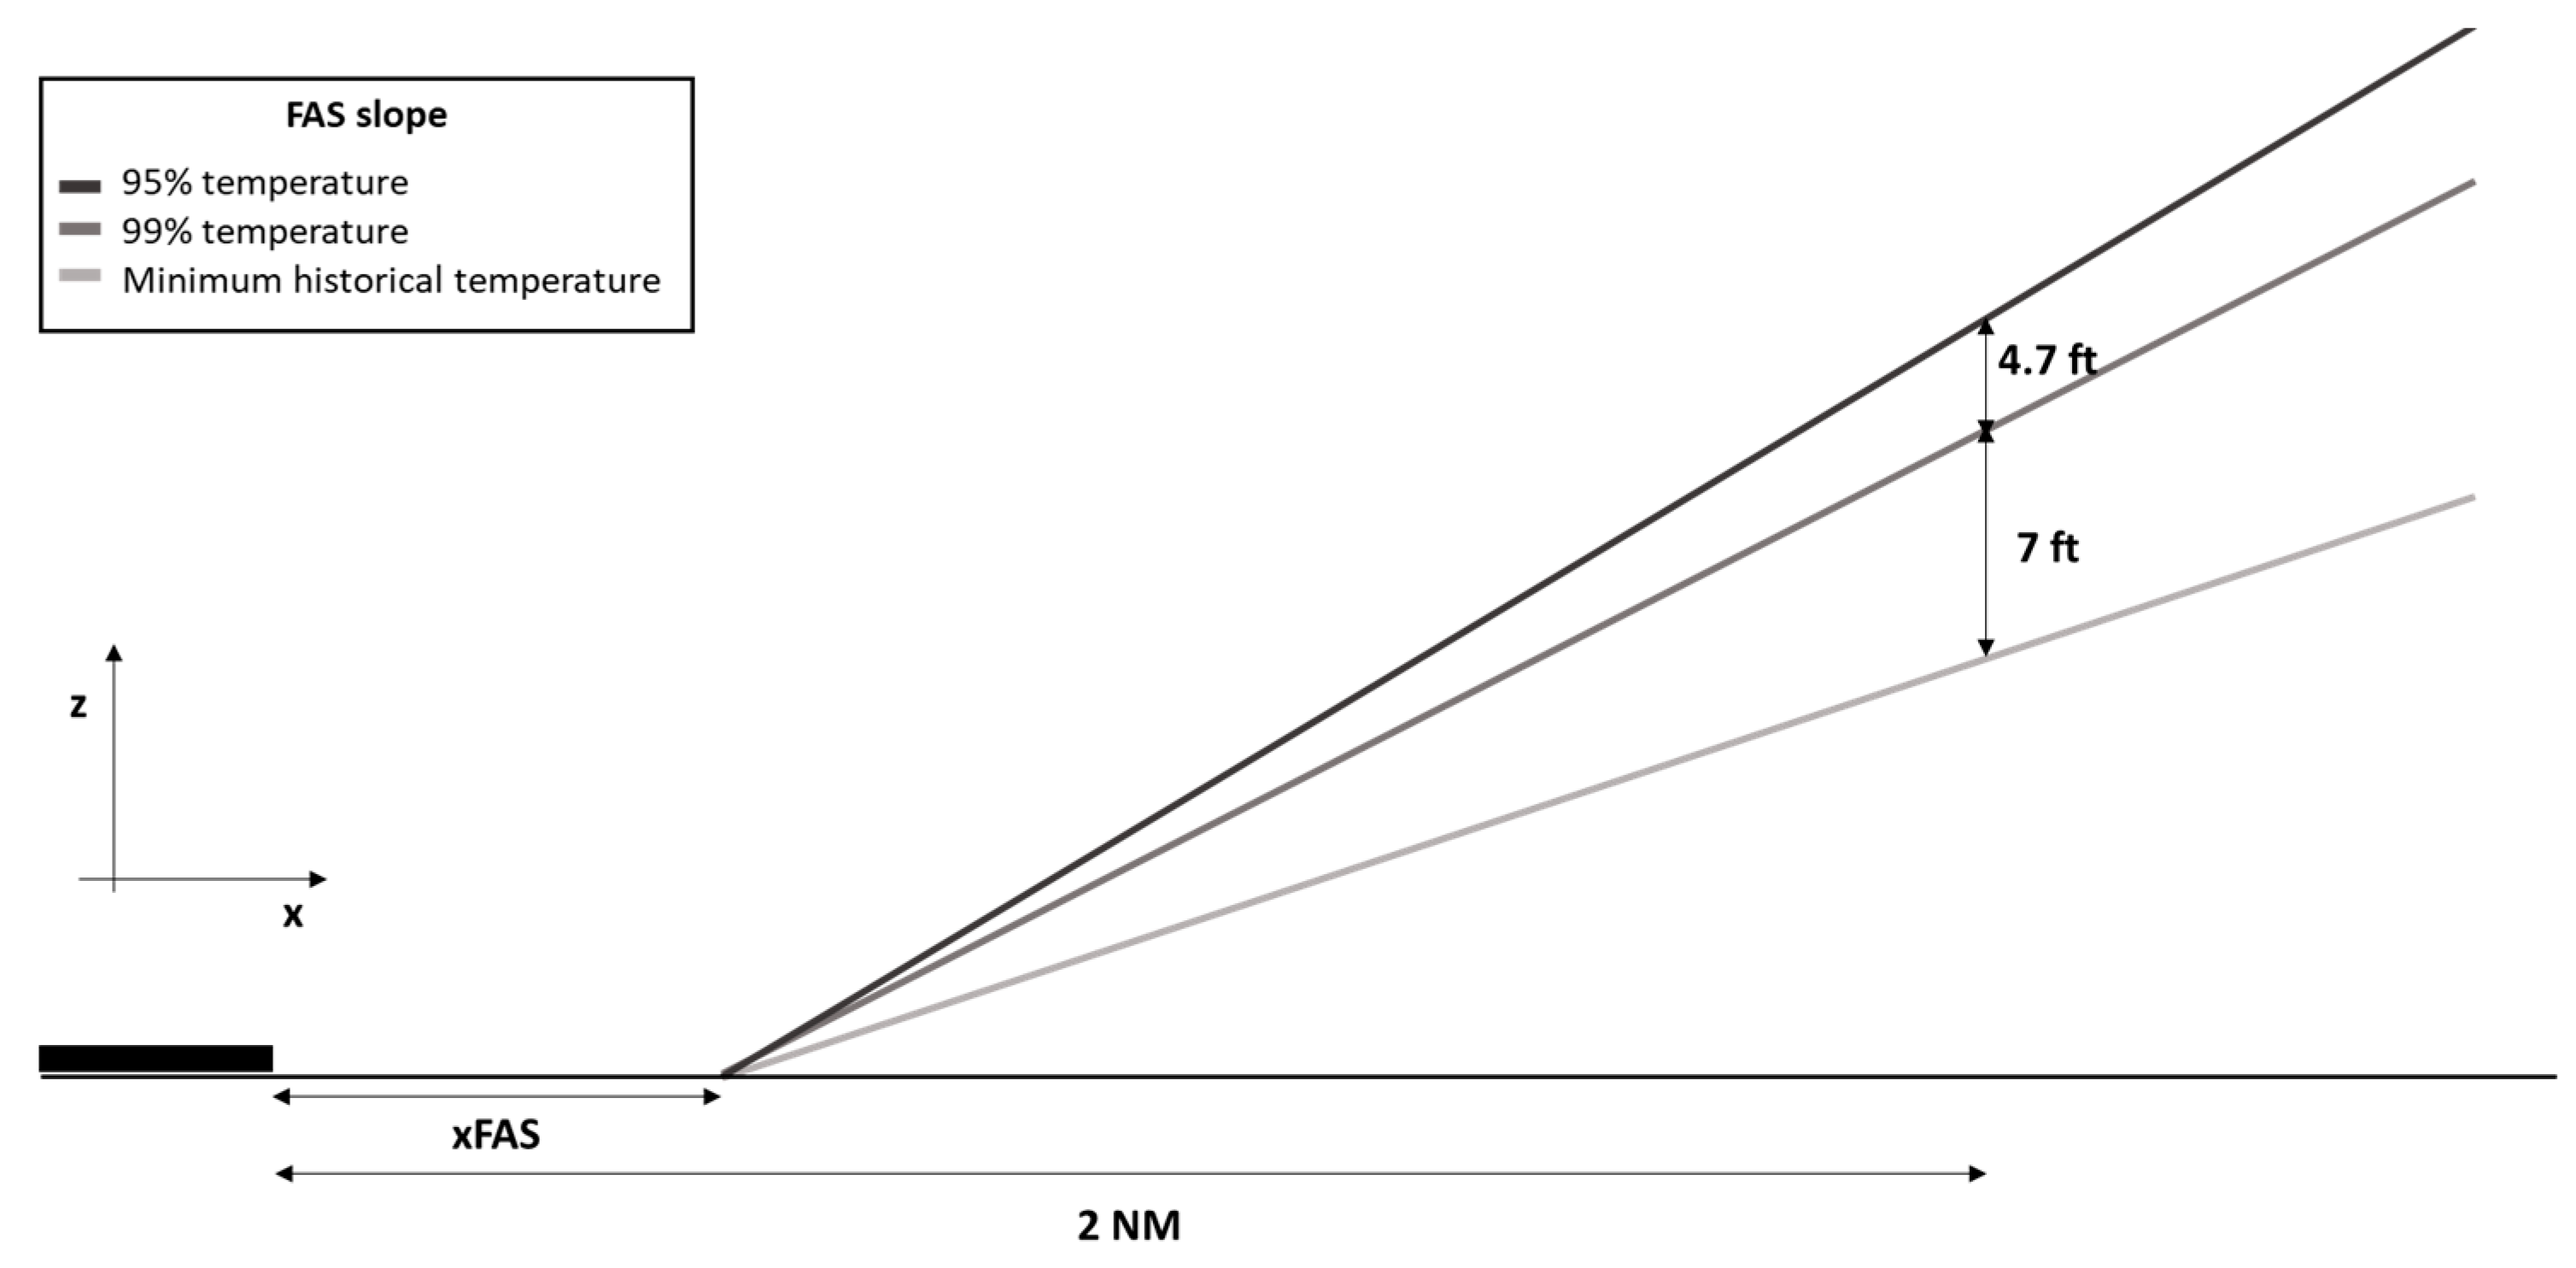
In
Figure 9, the slopes of the final approach surface (FAS) corresponding to each of the temperatures obtained are shown. It should be mentioned that the figure is not to scale in order to be able to understand all the annotations. As an example, at 2 NM from the threshold, there are 12 ft approximately between the FAS height corresponding to the 95% temperature and the one corresponding to the minimum historical temperature. As can be noted, there is not much variation between them, but it will be necessary to know if this difference is significant in terms of obtaining the OCH. (
Figure 9).
Table 8 shows the height of the FAS at different distances from the THR; the further away from the THR, the greater the difference between the surfaces.
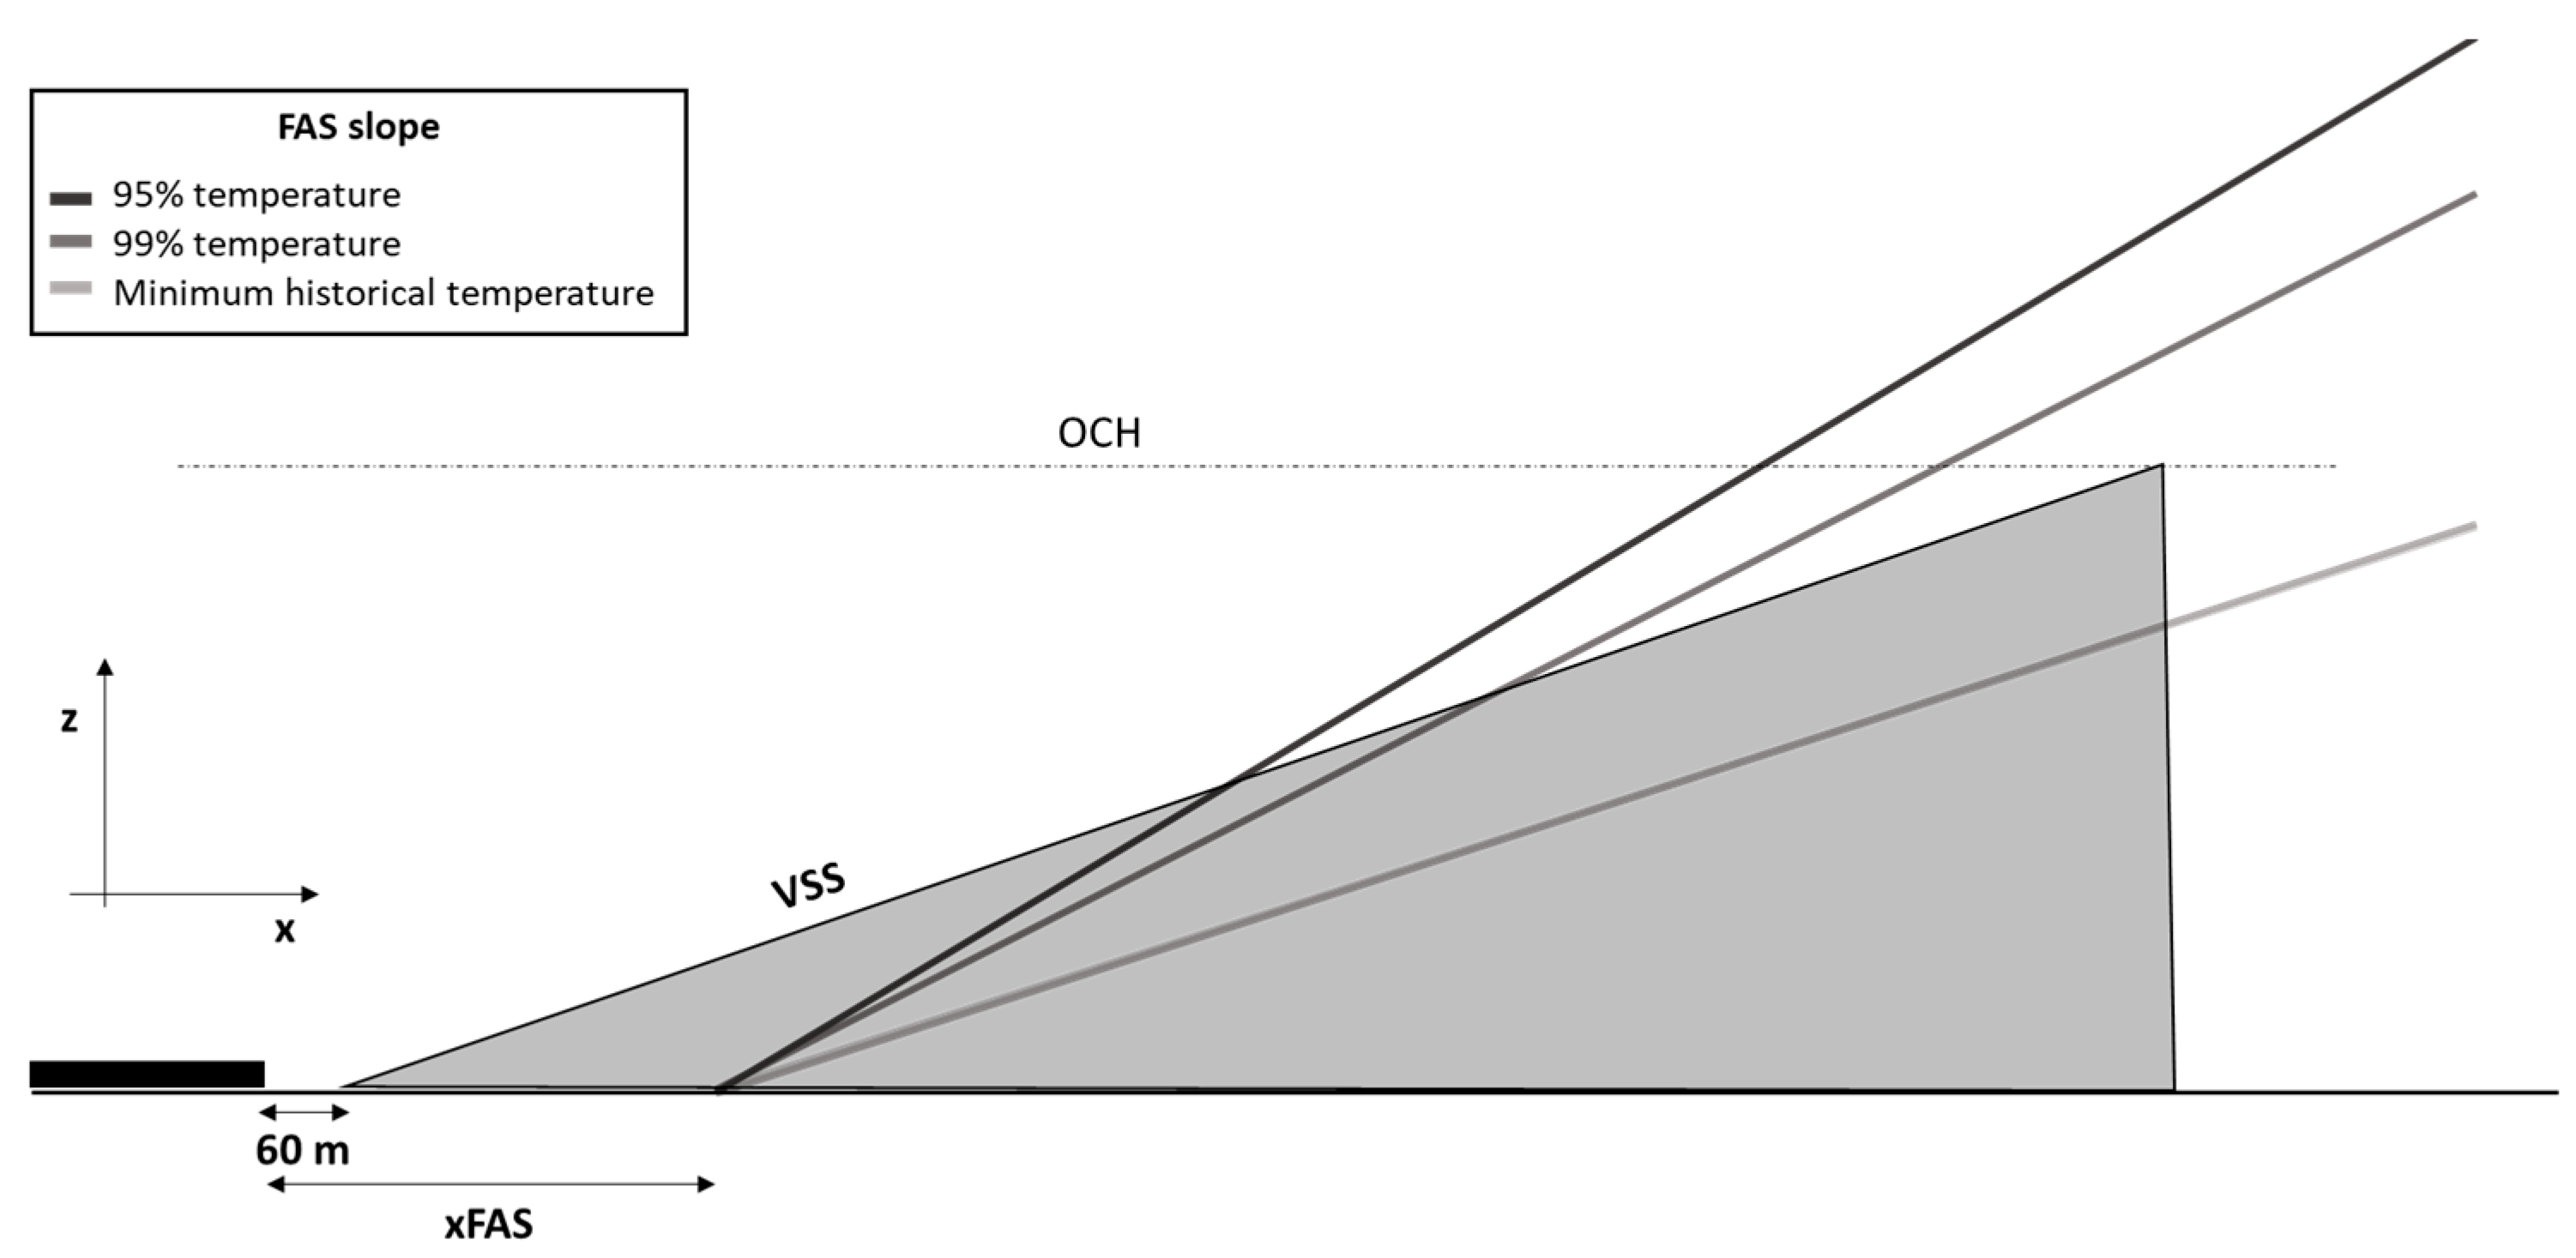
In order to know the position and height of the obstacles of interest, the visual segment surface (VSS) has been represented, which, according to the ICAO PANS-OPS [
7] must not be penetrated by any obstacle. Therefore, all those obstacles that are located in the shaded area of the
Figure 10 shall be taken into account.
In the following step, different obstacles at different positions and heights have been plotted in order to find out the variation between the OCHs according to them and the design temperature that has been used.
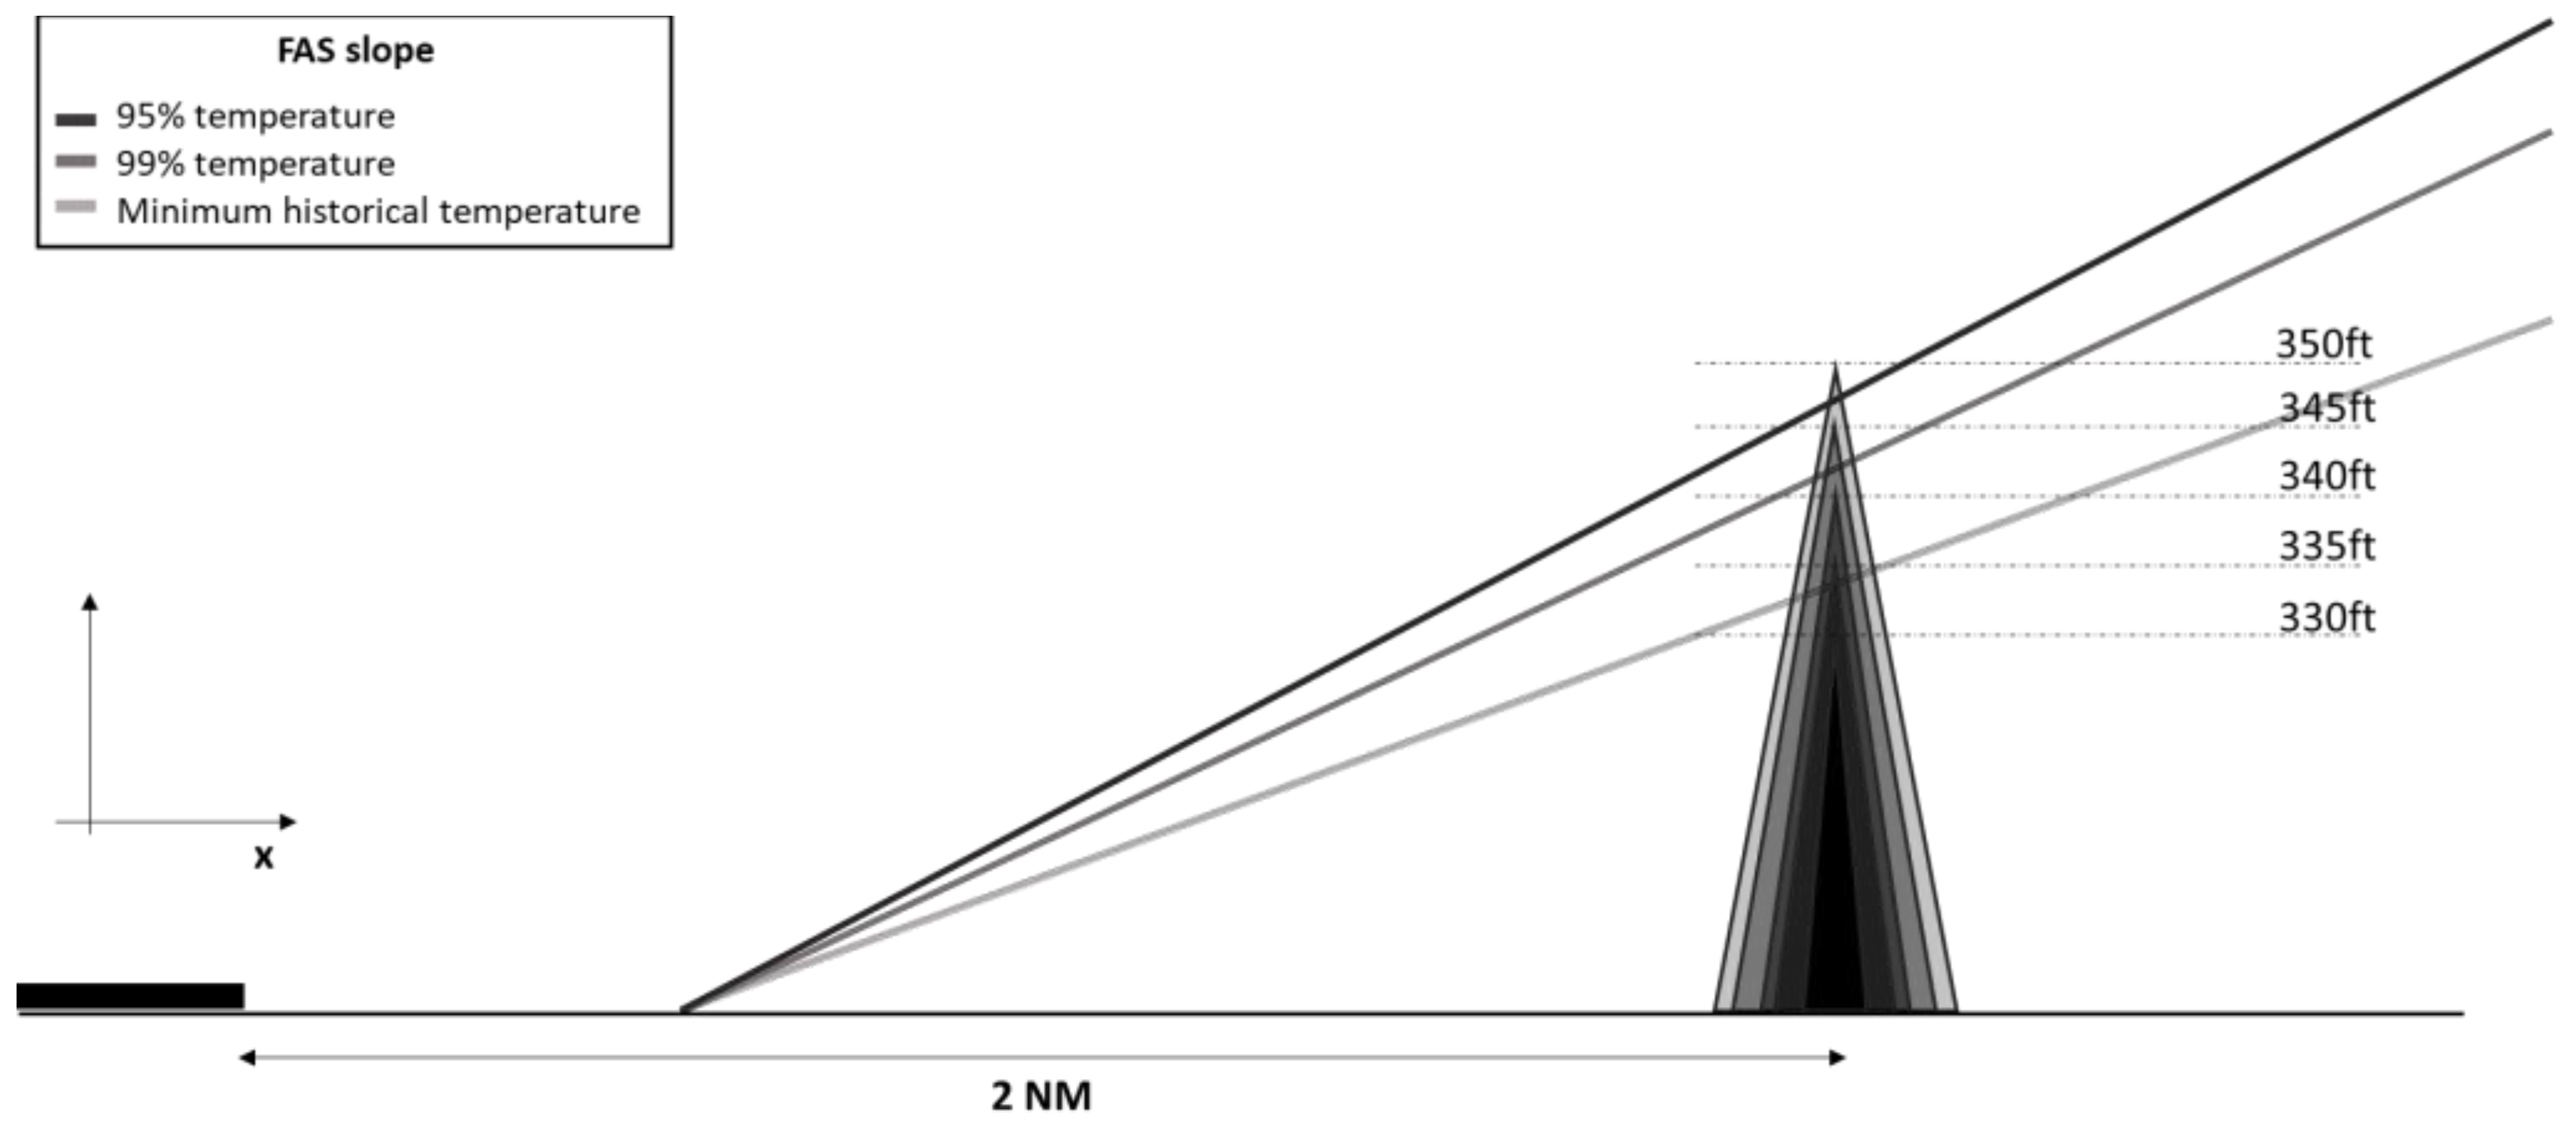
First, it has been assumed that the obstacle maintains its position, but its height varies. The position in this case is 2 NM from the THR and the height varies from 330 ft to 350 ft in 5 ft intervals (see
Figure 11).
According to the ICAO PANS-OPS [
7]: “For final approach obstacles penetrating the FAS or the ground plane, the final approach OCH shall be determined by adding the category-related height loss margin to the height of the obstacle”. The
Table 9 shows the category-related height loss margins.
The OCH values according to this practical case are shown in
Table 10.
As can be seen, obstacles in the same position, with heights varying by only 5 ft, lead to significantly different minima, depending on the chosen design temperature. For example, for an obstacle located 2 NM from the THR and with a height above it of 340 ft, in the case of using the temperature that represents 95%, which for Madrid is 1.66 °C, the OCH is 161 ft, with it being the same value if the temperature that represents 99% had been used, which is −1.36. However, if the minimum historical temperature, which is −5.7 °C, had been selected, the OCH would be much higher, 501 ft, that is, if one temperature or another was taken, the difference in the OCH would be very important. Remember that a high OCH value means that a missed approach is likely to be required when the cloud ceiling is below it. According to the above, it would be better to use the temperature that corresponds in this case to 99%, admitting in this case that when the temperatures are lower, that is to say, 1% of the time, the procedure cannot be used.
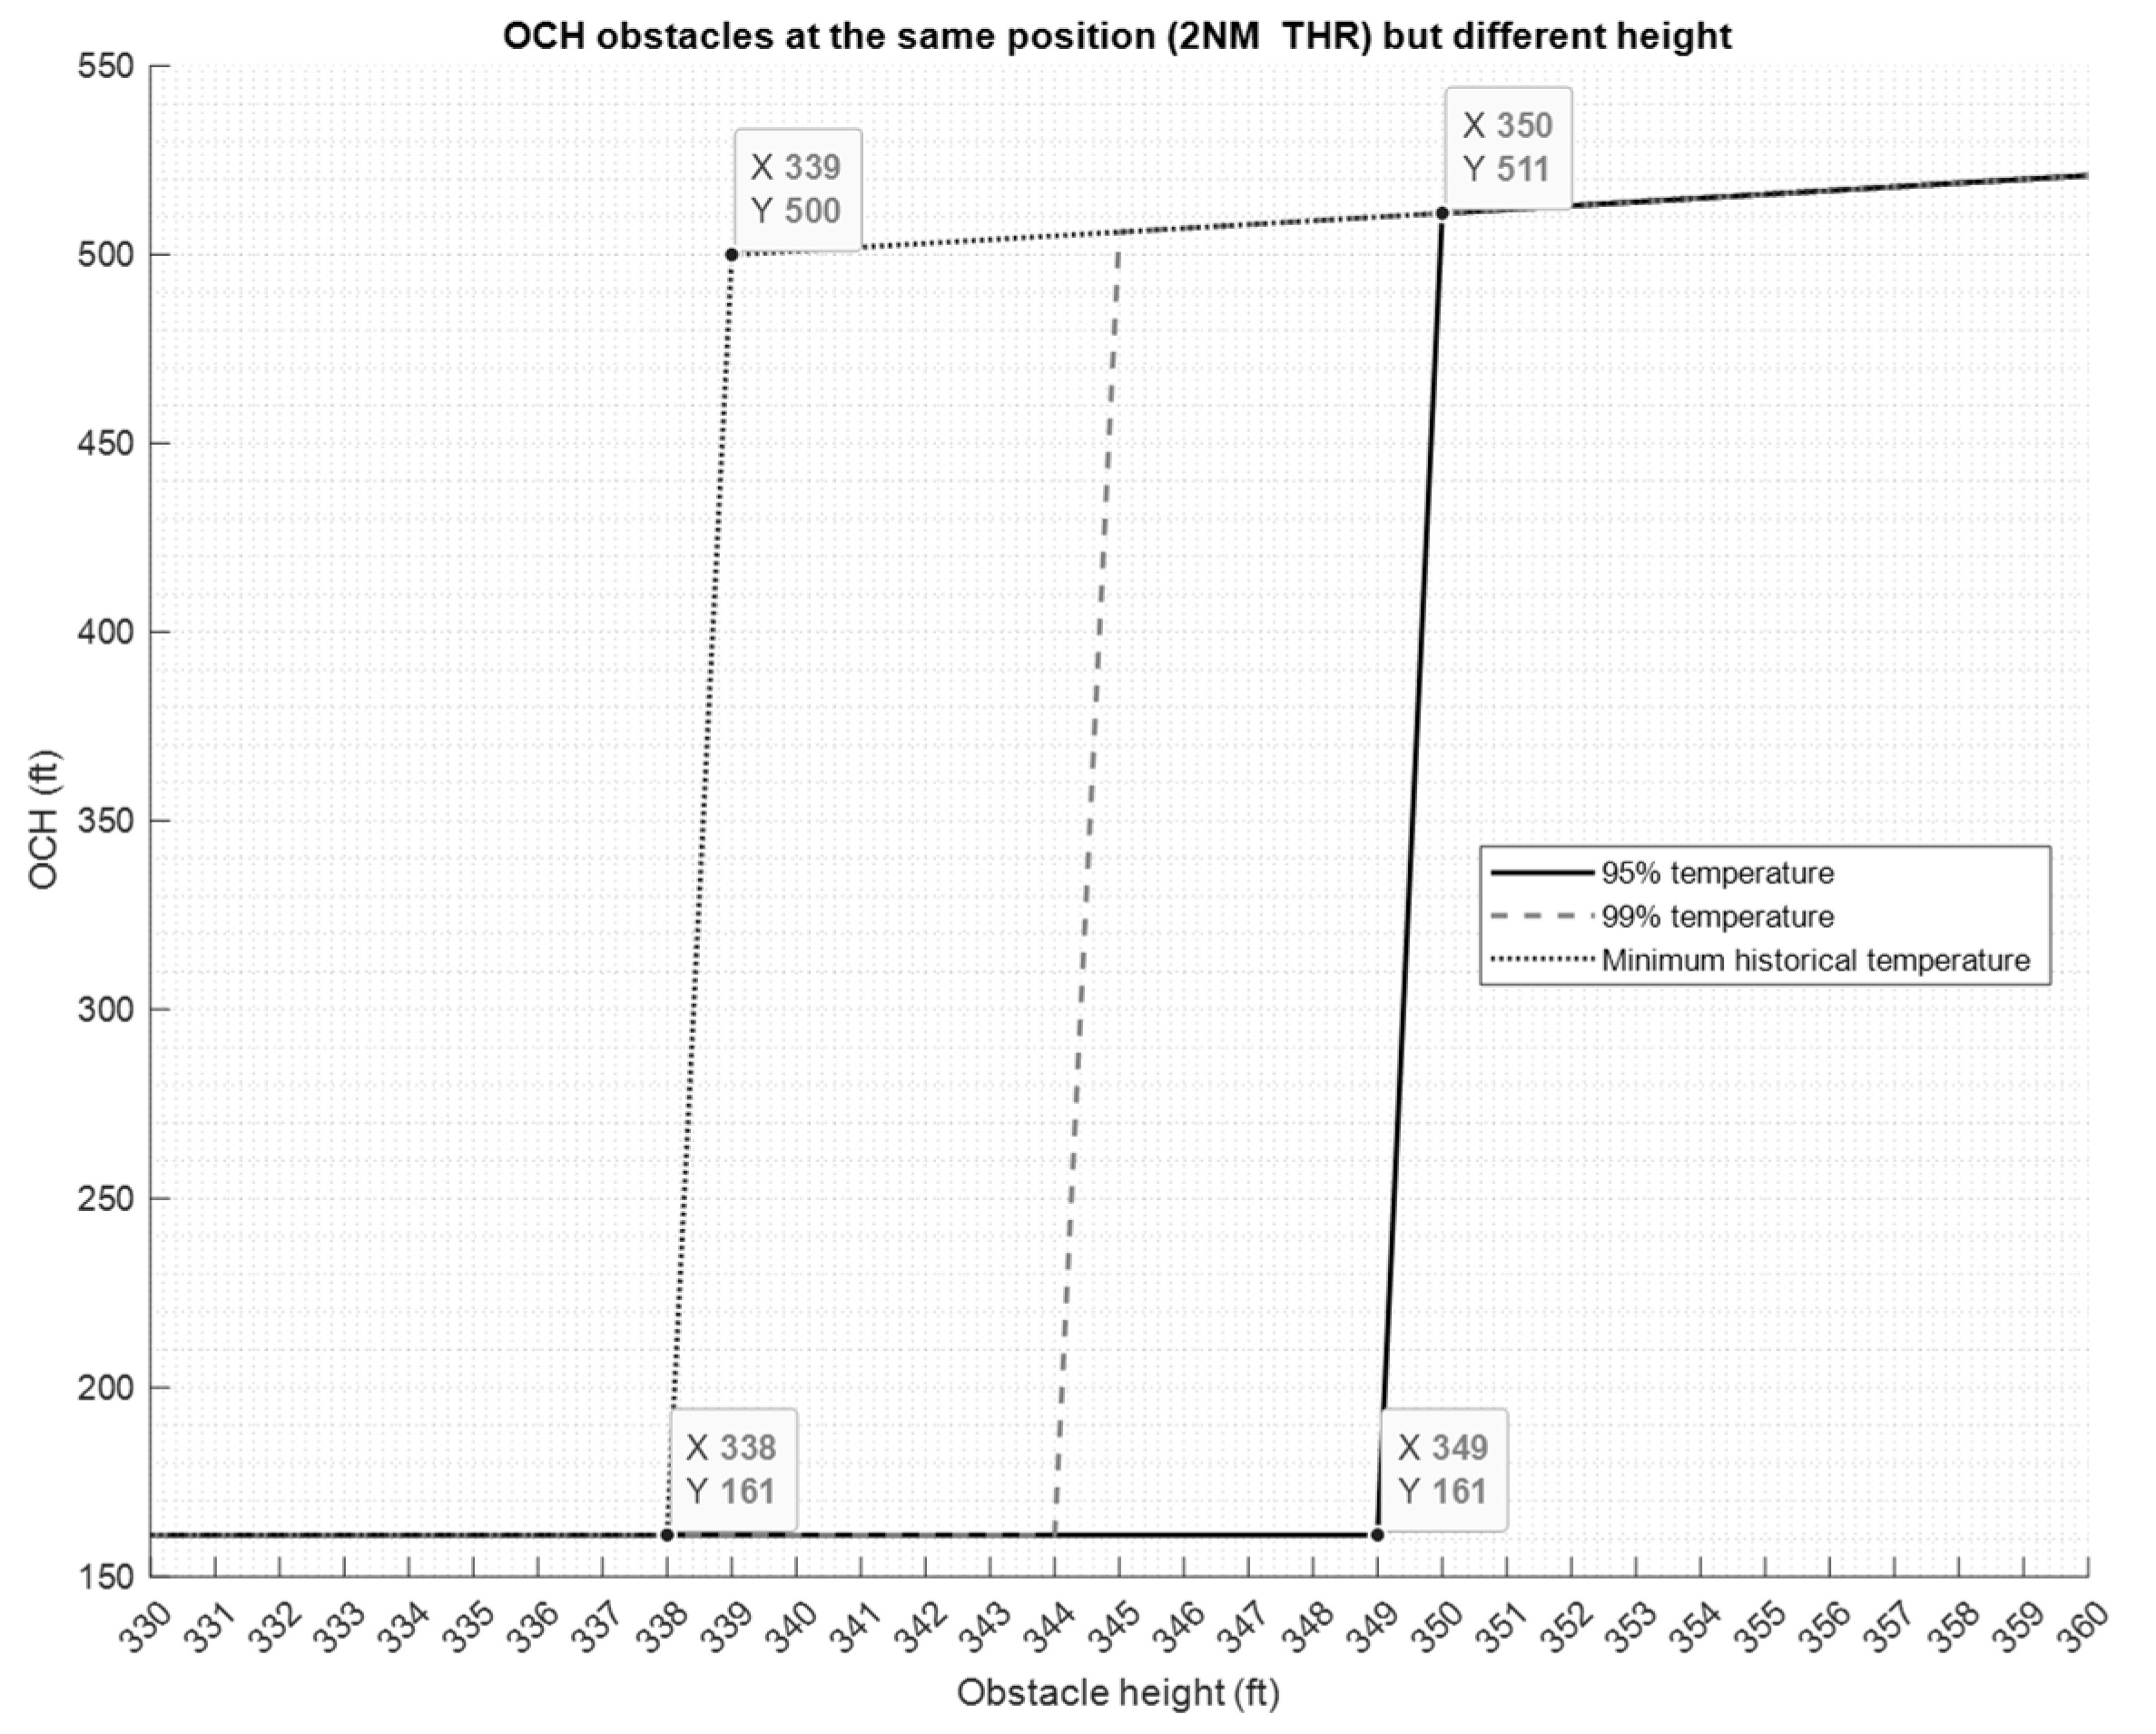
Figure 12 depicts the previous concept, the OCH as a function of design temperature and obstacle height. In the graphic, the OCH obtained for obstacles at the same location with small differences in height are quite different from each other depending on the temperatures considered in the computation. For example, for an obstacle 349 ft in height sited at 2 NM from THR, using the temperature corresponding to 95%, the OCH would be 161 ft; however, for temperatures of 99% or the historical minimum it would be 510 ft. If the obstacle were only 1 ft higher, 350 ft, the OCH would be 511 ft for all three temperatures.
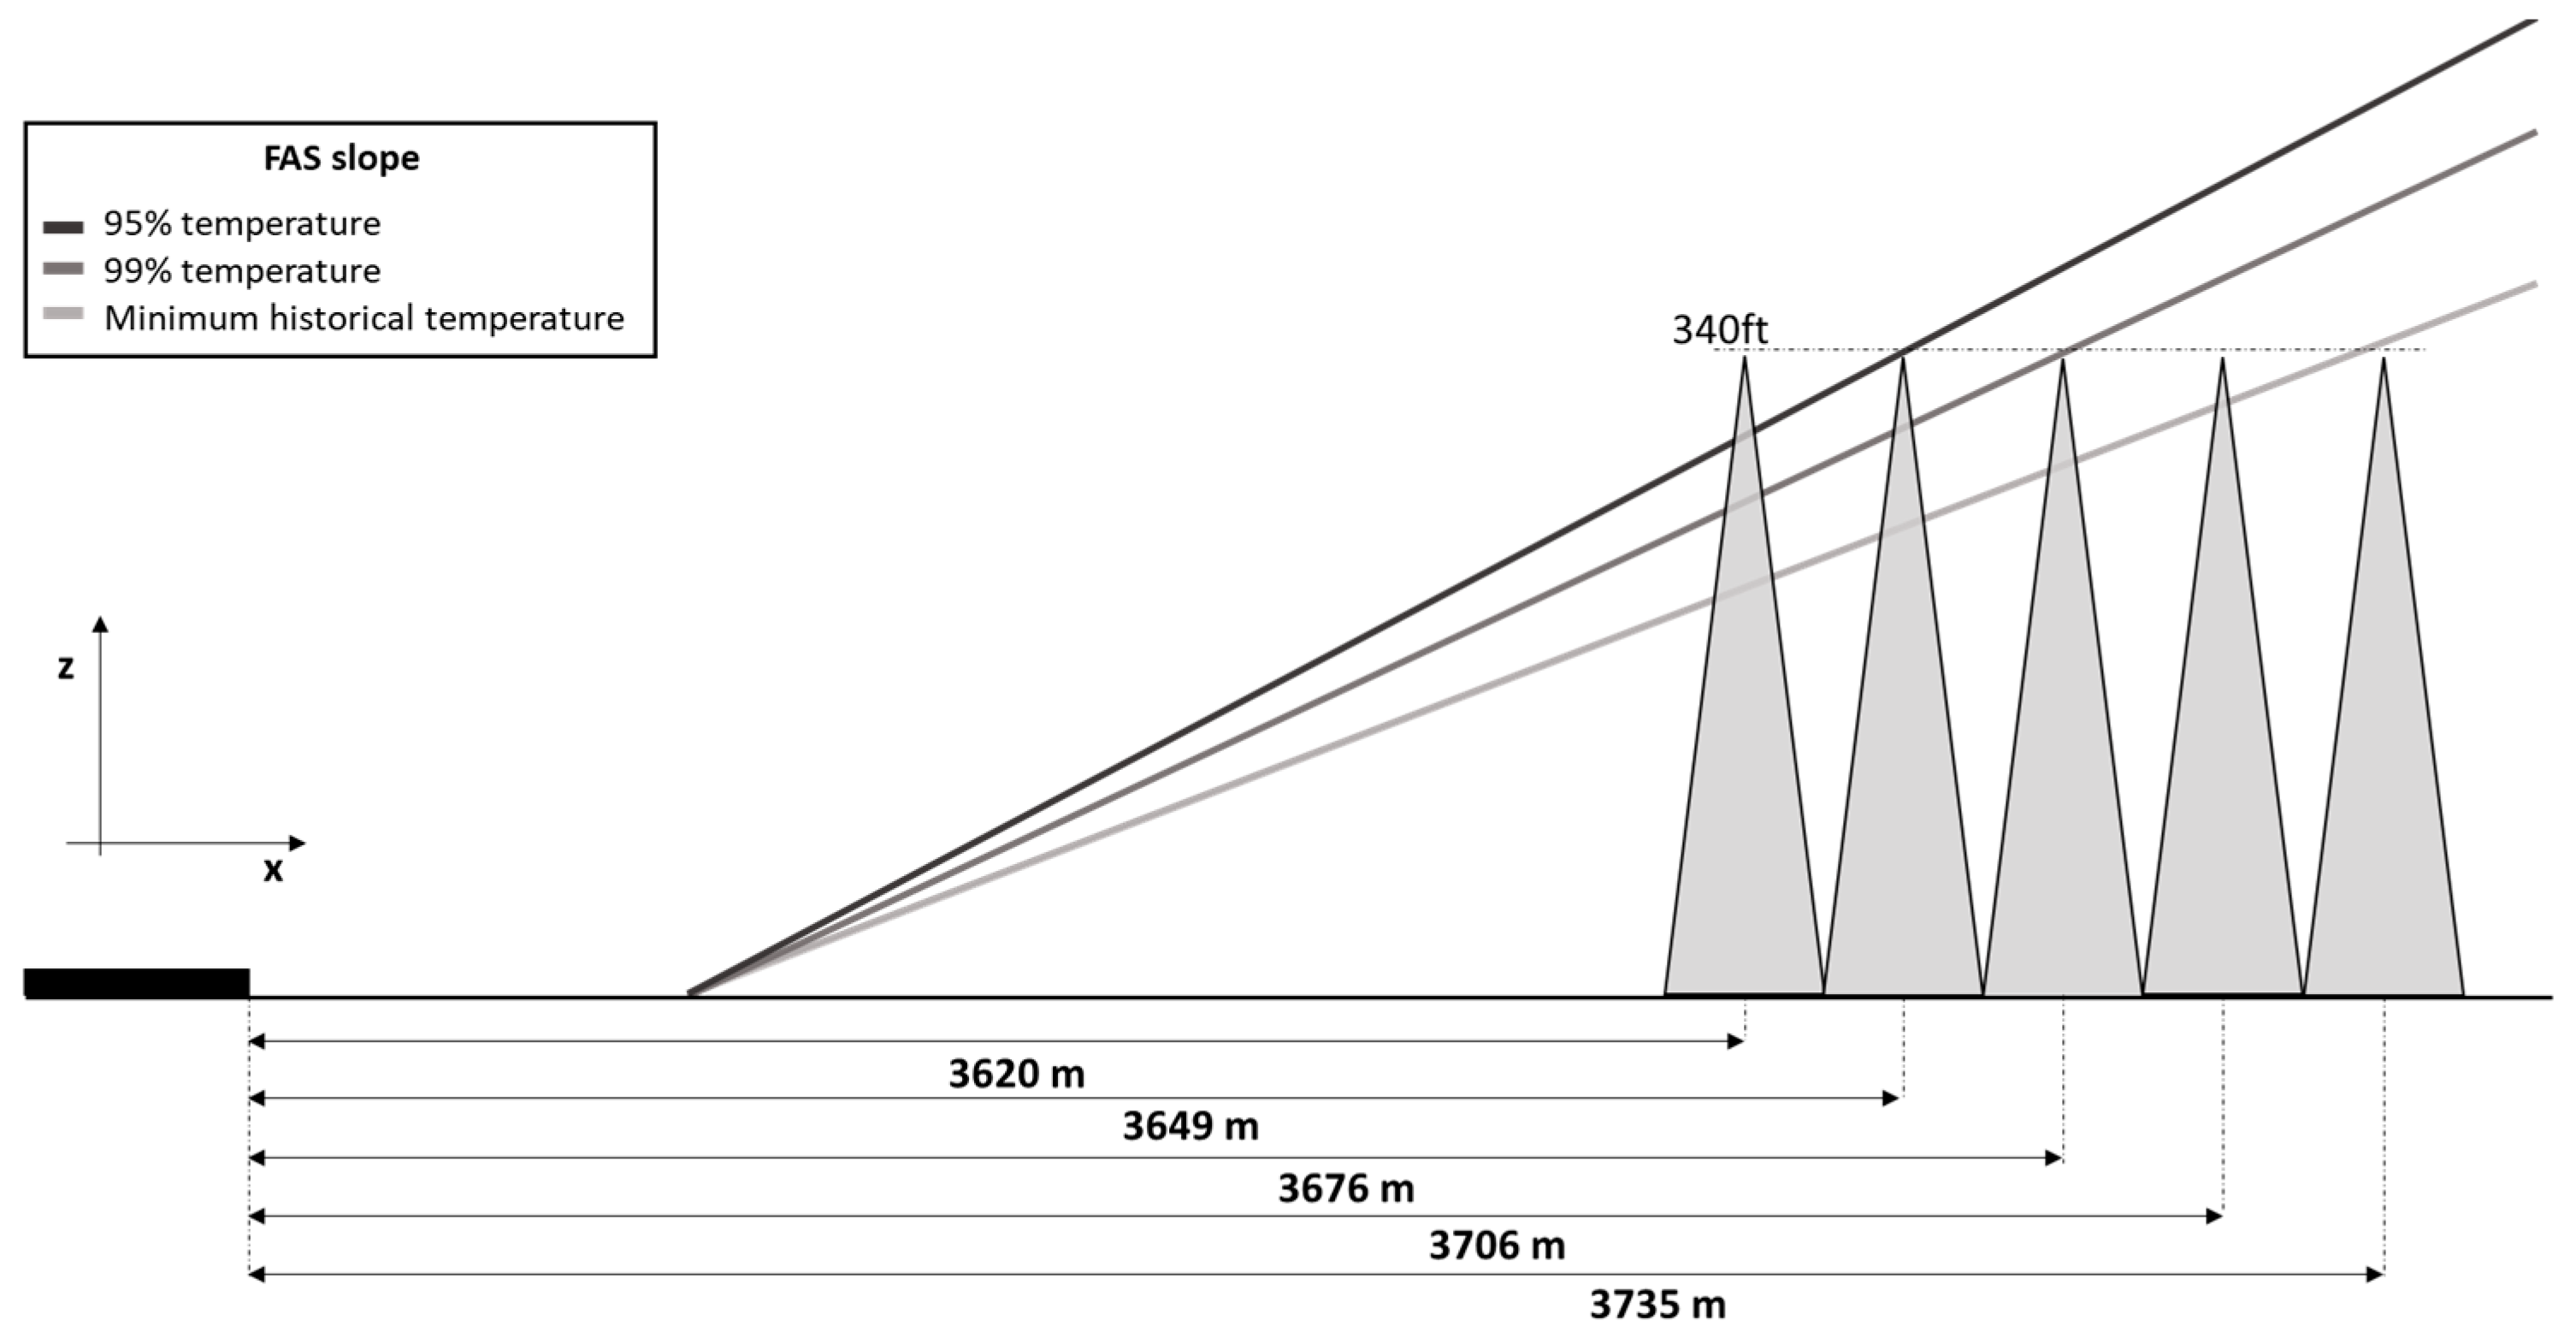
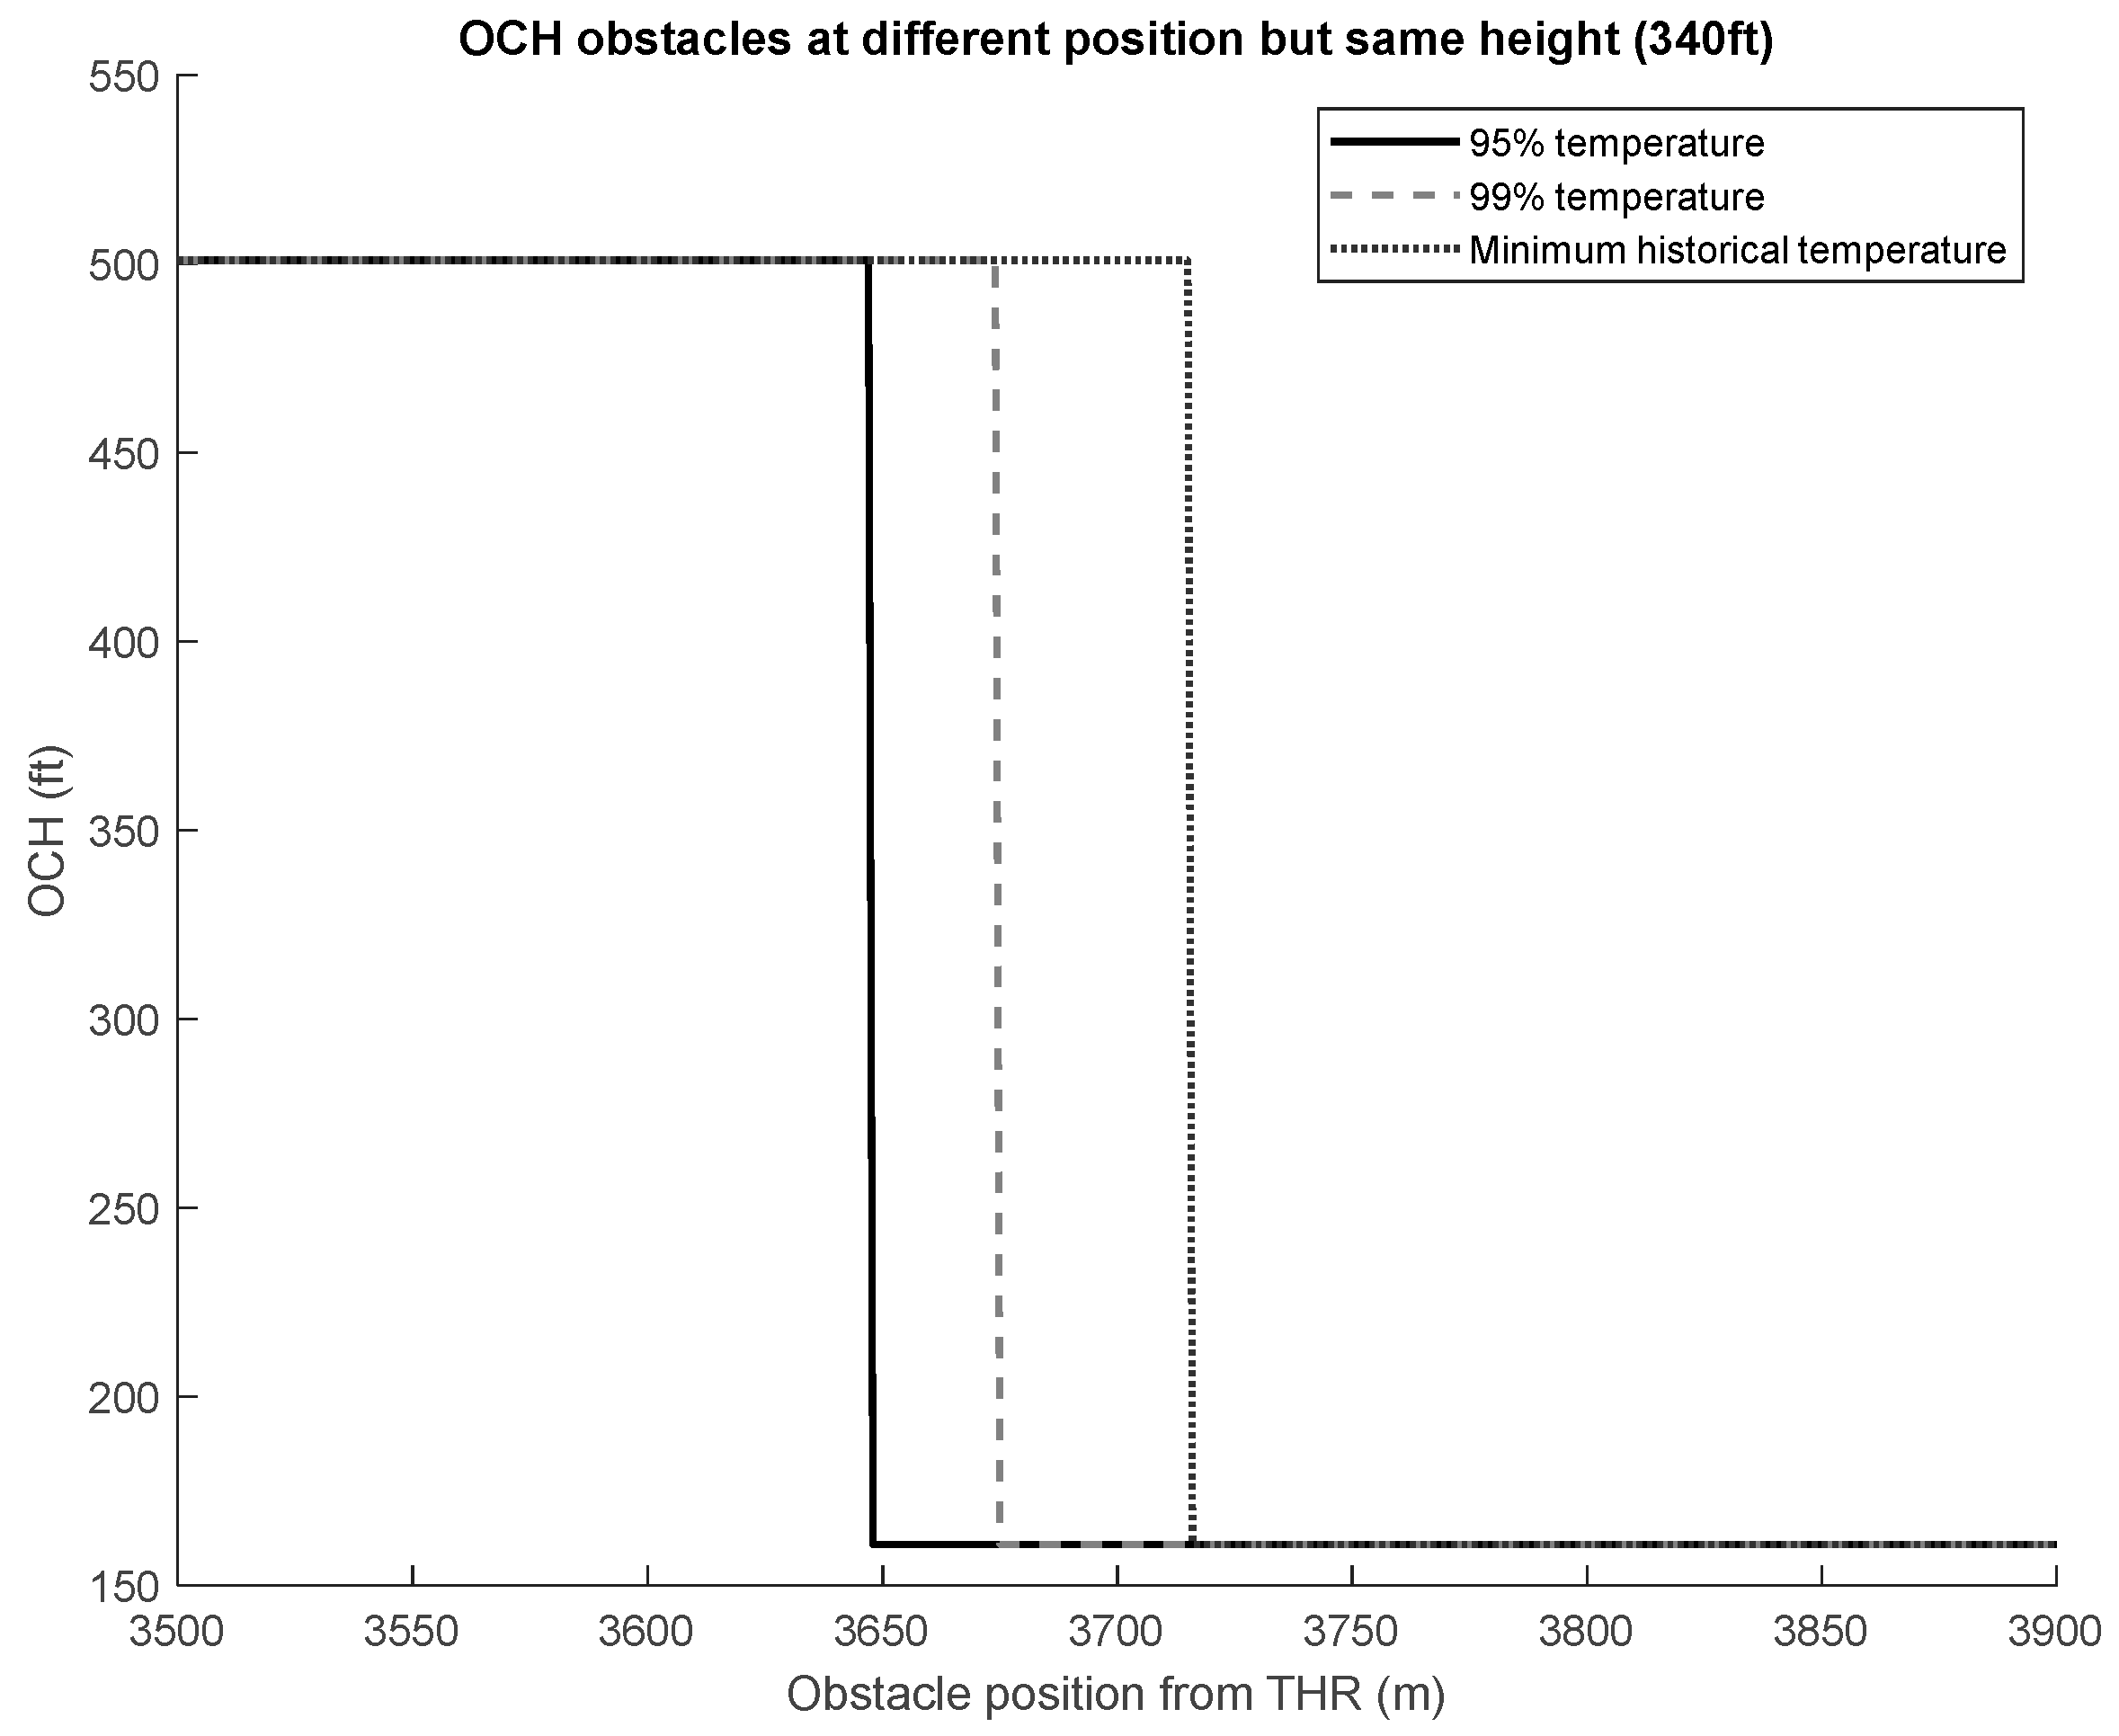
Similarly, the event of considering the same obstacle at different distances from the threshold was analyzed, obtaining the OCH for different design temperatures. (see
Figure 13).
Table 11 shows the OCH values corresponding to the obstacles depicted in the figure above for the different design temperatures for category D aircraft. In the table, it can be seen that for a 340 ft-high obstacle located at 3620 m from the threshold, it would represent an OCH of 501 ft regardless of the chosen design temperature; however, if the same obstacle were located at 3649 m from the threshold, that is, 29 m further away, the design temperature would matter, with it obtaining an OCH of 161 ft for the temperature that represents 95% and an OCH of 501 for lower temperatures (99% or historical minimum).
In view of the results, small variations in the obstacle position (a variation between them of about 30 m) lead to significantly different minima, depending on the chosen design temperature.
Figure 14 shows the OCH as a function of the design temperature and the position of the obstacle. For two obstacles with the same height, located at a short distance from each other, it may be interesting to calculate the OCH with a temperature higher than the historical minimum. In
Figure 14, considering an obstacle 340 ft in height sited at 3700 m from the threshold, if the OCH is calculated with the historical minimum temperature, the OCH would be 500 ft. However, considering the same obstacle in the same position, the OCH obtained with the 99% temperature would be 161 ft. Additionally, in
Figure 14, when the obstacle (340 ft in height) is sitting at 3650 m or closer to the runway threshold the OCH is 501 ft for the three temperatures. When the obstacle is sitting between 3650 and 3675 m, the OCH is approximately 161 ft for the 95% temperature and 500 ft for the 99% temperature. In other words, a displacement of only about 25 m considering different temperatures yields significant differences in the OCH results.
6. Proposed Methodology for Selecting Airport Temperature
For the evaluation and selection of the minimum design temperature, provided that the effective VPA at this temperature is ≥2.5°, the following methodology is proposed. It is not possible to choose a unique temperature, as it depends on the scenario, the characteristics of the airport, and the obstacles in the neighborhood.
Determine the cloud ceiling corresponding to the expected periods of use of the approach procedure with barometric vertical guidance.
Calculate the value of the temperature which means that 95 or 99% will be above them. Two methods:
If a probability density function is available which clearly fits the data with an appropriate p-value, it is recommended to use the temperatures of this fit.
If this is not possible, the corresponding 95% and 99% percentiles can be used. (The percentile method is the simplest one and is equivalent for the purpose of this application)
Identify the temperature which corresponds to the minimum historical temperature.
FAS calculation using the representative temperatures identified in the previous step.
Obstacle assessment for each FAS.
OCH calculation for each FAS.
Compare the OCH values obtained with the cloud ceiling for the period of interest. Select OCHs lower than the cloud ceiling.
From the OCHs selected in the previous step, identify the temperature that represents the highest percentage value.
7. Conclusions
A transformation towards a performance-based navigation concept is taking place worldwide. PBN procedures offer many advantages that both operators and air traffic service providers can exploit. This study covers the effects of the choice of design temperature on airport throughput when a PBN approach procedure whose vertical guidance is barometric.
Since vertical navigation is based on atmospheric pressure, the temperature at the time of approach will have a direct influence on the actual trajectory flown by the aircraft. Thus, when the temperature is below the corresponding one at this elevation as in the ISA model, the effective VPA will be lower than the promulgated one, and with a higher temperature than the ISA, the effective VPA will be also higher than the promulgated one. The lower the temperature, the lower the minimum effective VPA, thereupon the lower the FAS slope, the more obstacles that can penetrate the FAS. Thus, if the low temperature used to calculate the minimum effective VPA is lower than that needed, then the FAS will be lower than needed and the approach minima (OCA/H) could be higher than needed. Therefore, the selection of a suitable temperature to calculate the minimum effective VPA is a crucial issue to increase runway throughput and, at same time, to obtain a longer period of time in which the approach procedure could be used.
The temperature thresholds at which the actual temperatures at the aerodrome will be greater than or equal to a value have been calculated with an established probability of 95% and 99%.
From this research, it is deducted that:
The effective VPAs corresponding to each temperature (95 and 99%) are very similar. There is no significant operational difference in terms of effective VPA.
As far as the OCH is concerned, there are significant differences. The same obstacle can mean big differences in the value of the OCH if one lower limit of temperature or another is considered. In this case, it is convenient to carry out a detailed study and choose the temperature that offers an OCH lower than the cloud ceiling. On the other hand, obstacles of the same height, located at small distances between them measured from the threshold, can also mean large differences in the OCH value.
Other factors to be taken into account, but which have not been considered in this study, are the effects that the choice of certain low temperatures could have on the stabilization of the approach and in the runway occupation time after landing, which are facts that could be investigated in future works.

 ,
, 


