

Life Cycle Assessment of the Cellulosic Jet Fuel Derived from Agriculture Residue
Abstract
:1. Introduction
2. Method
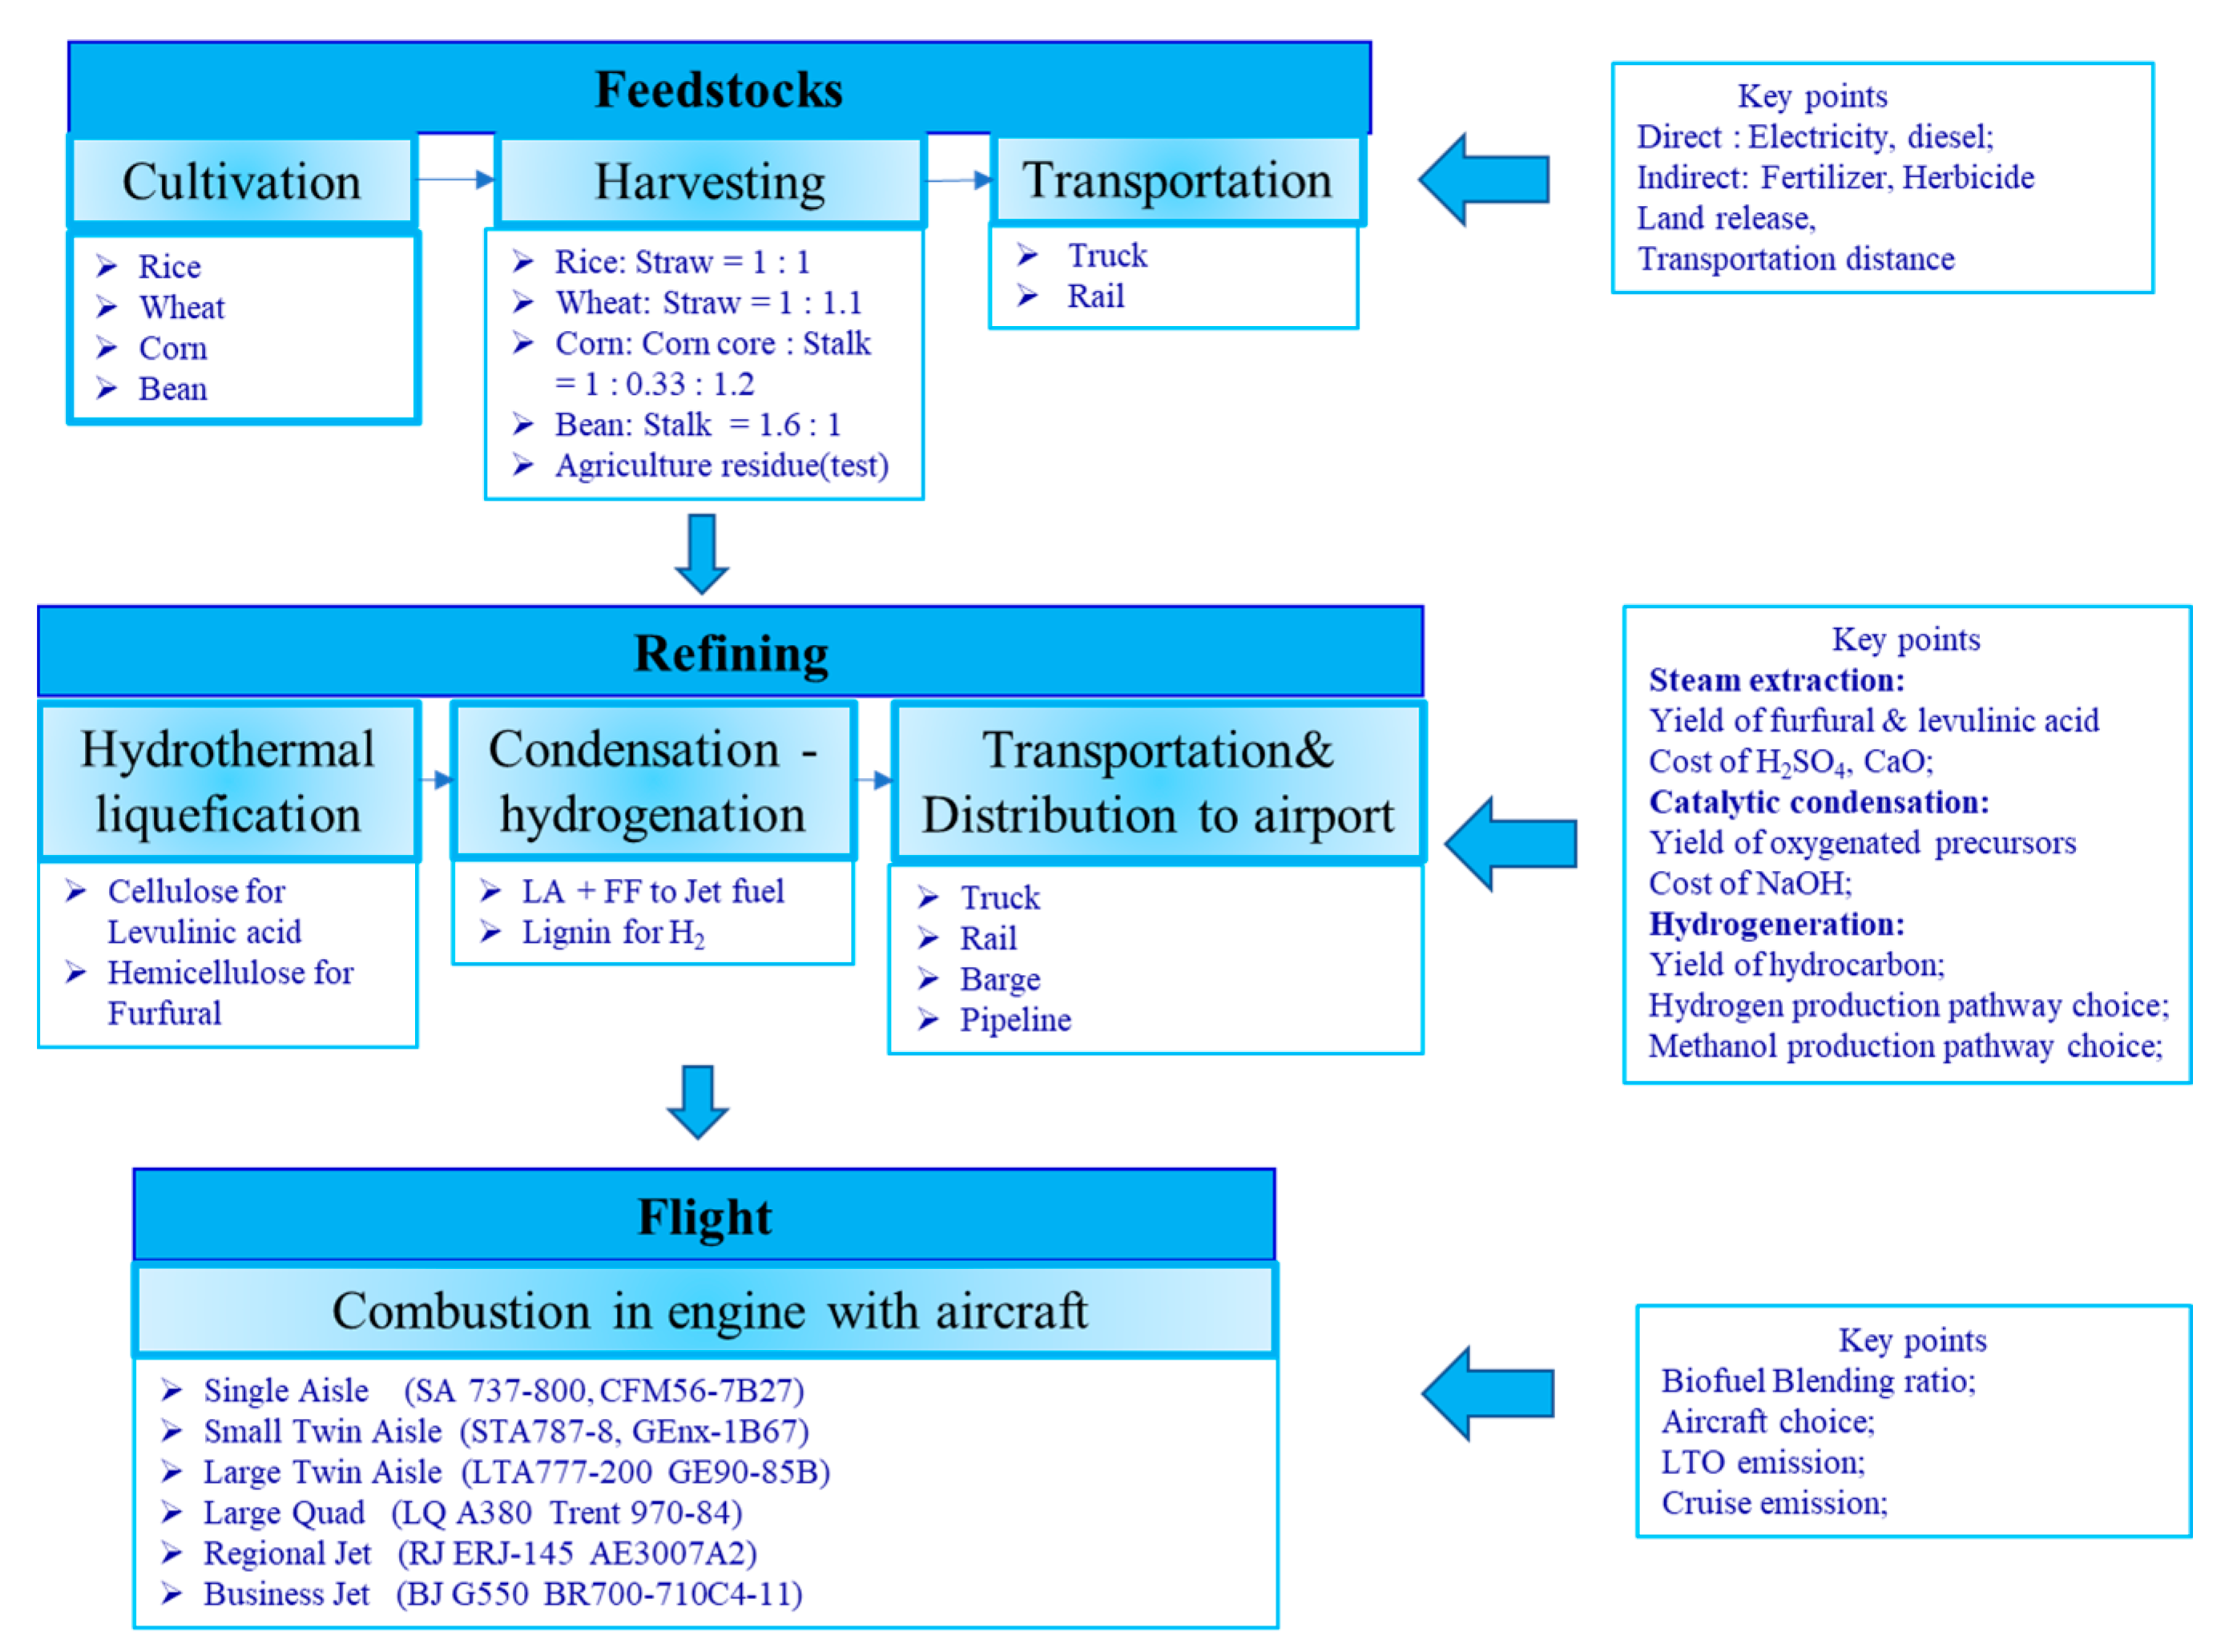
2.1. Goal Definition and System Boundary
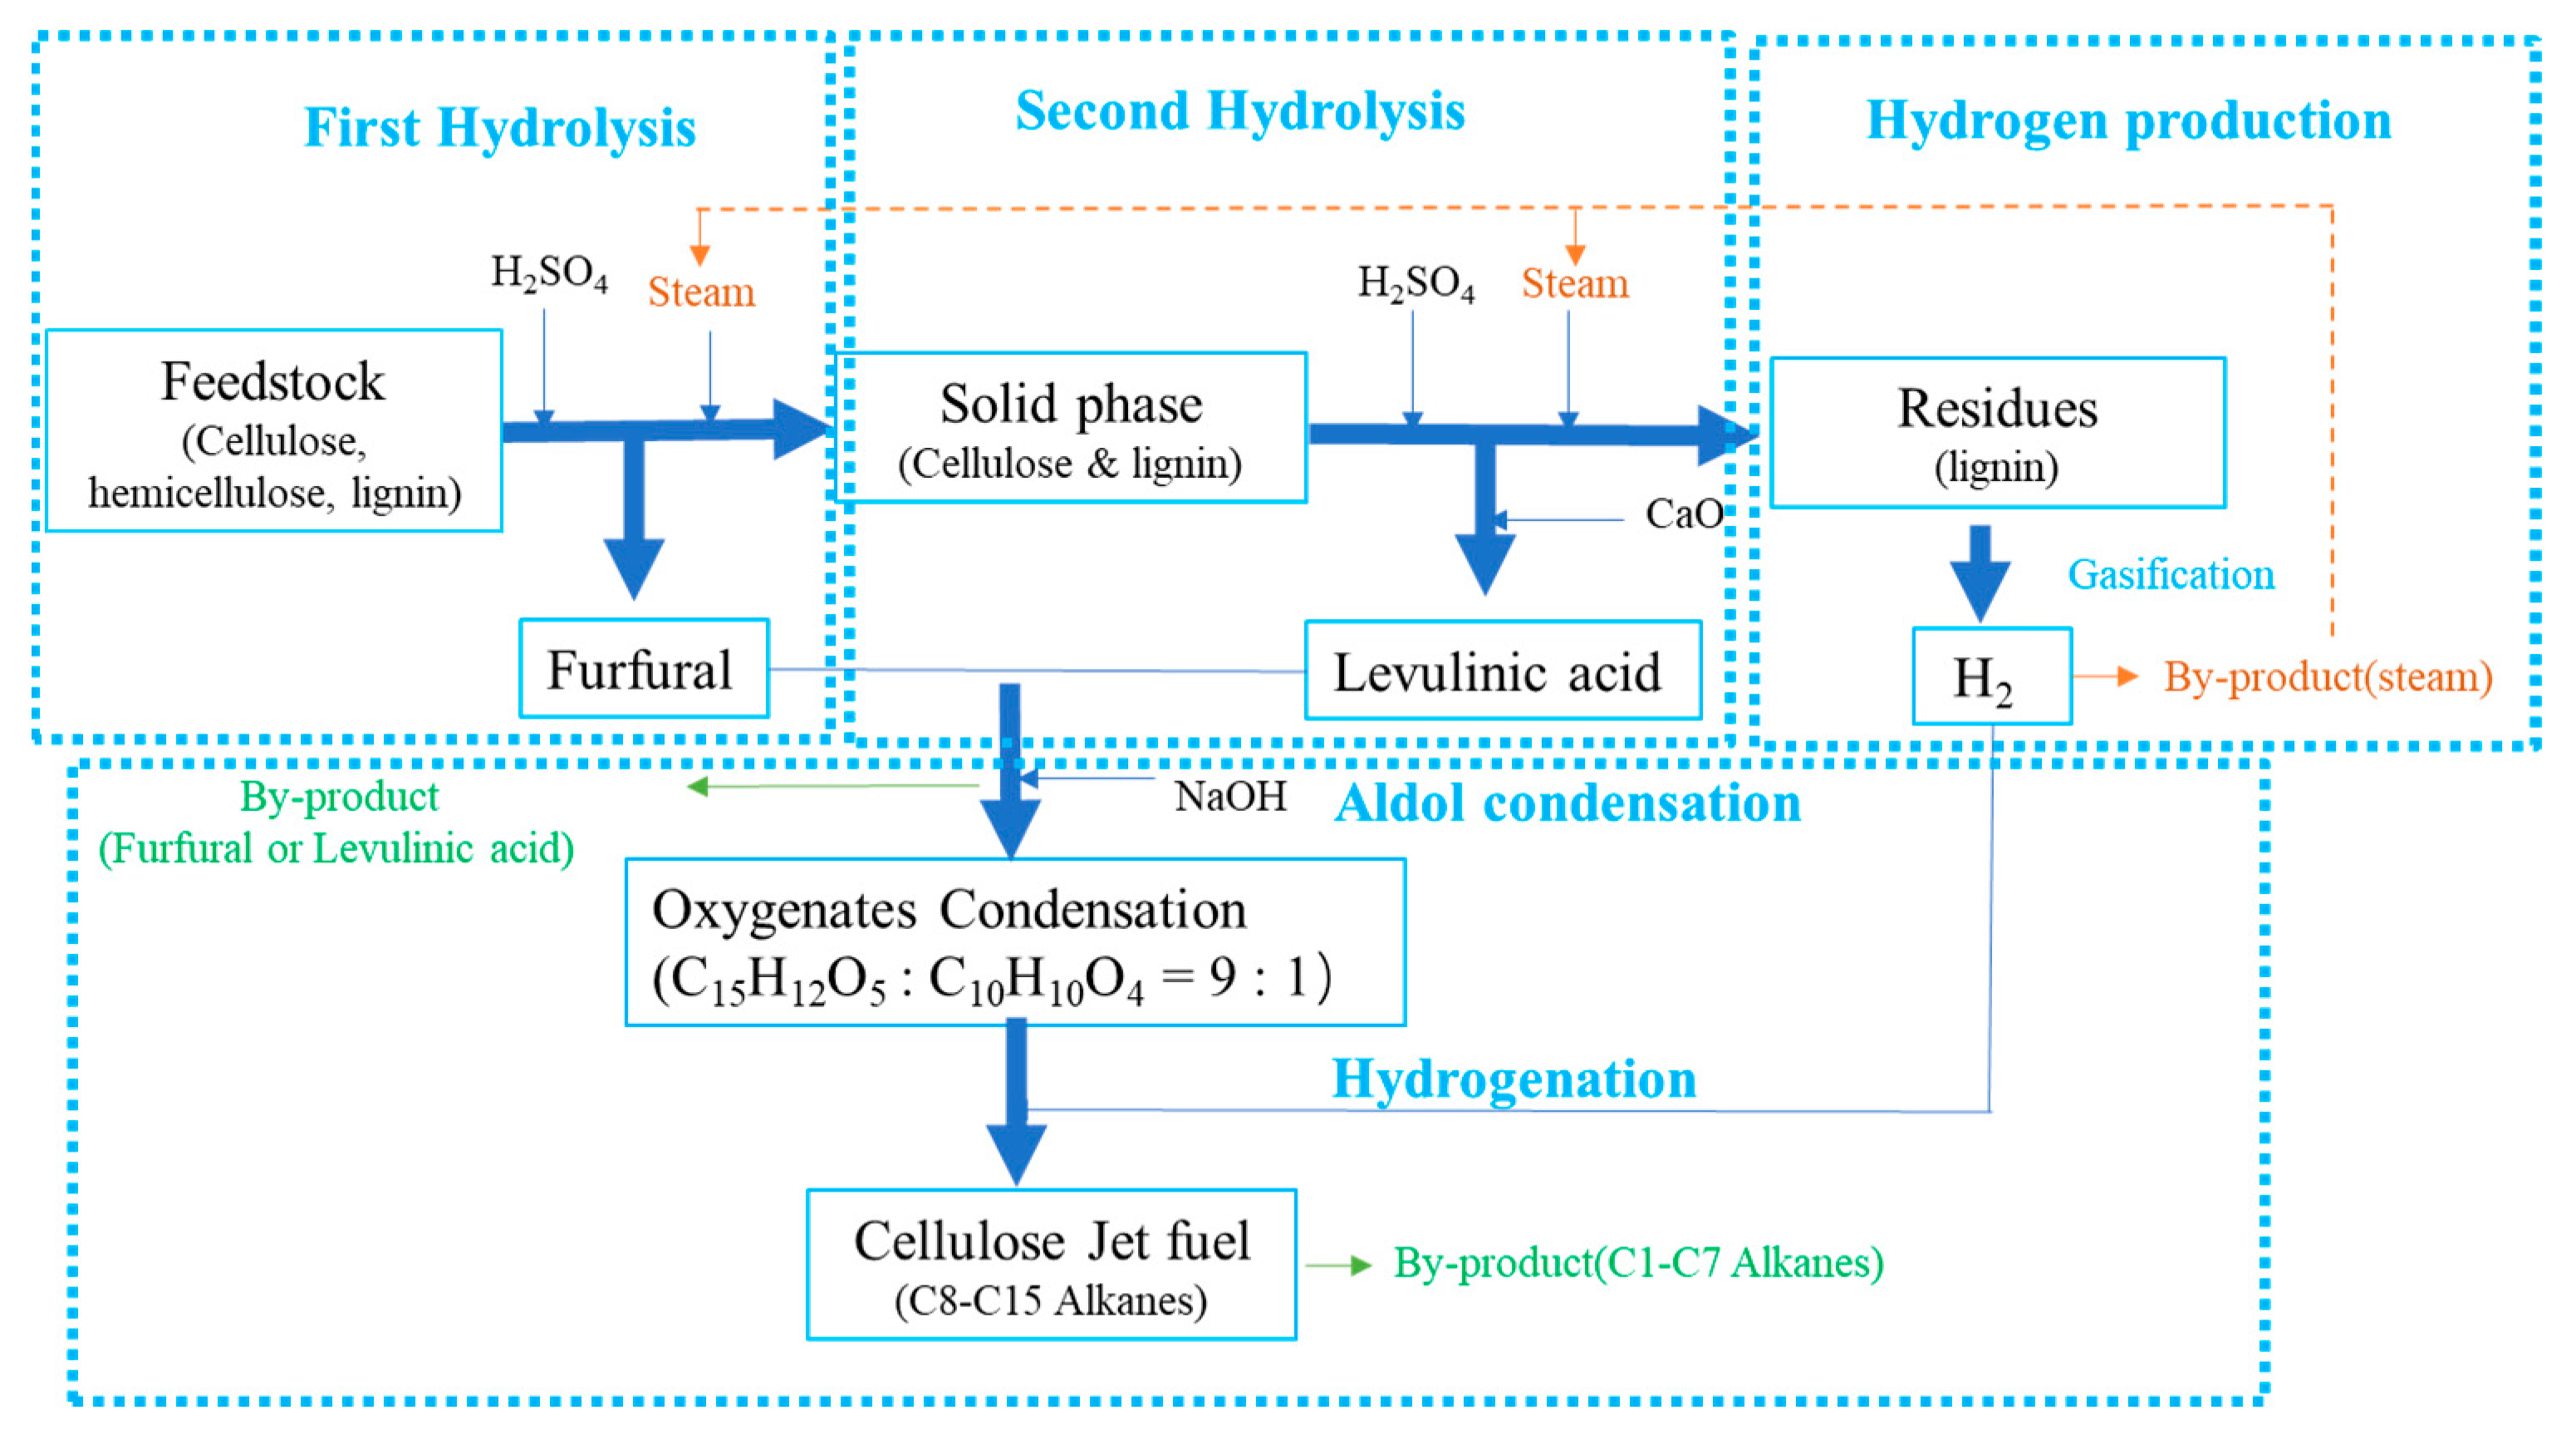
2.2. Cellulose Jet Fuel Computational Framework
2.3. Inventory Data
3. Results and Discussion
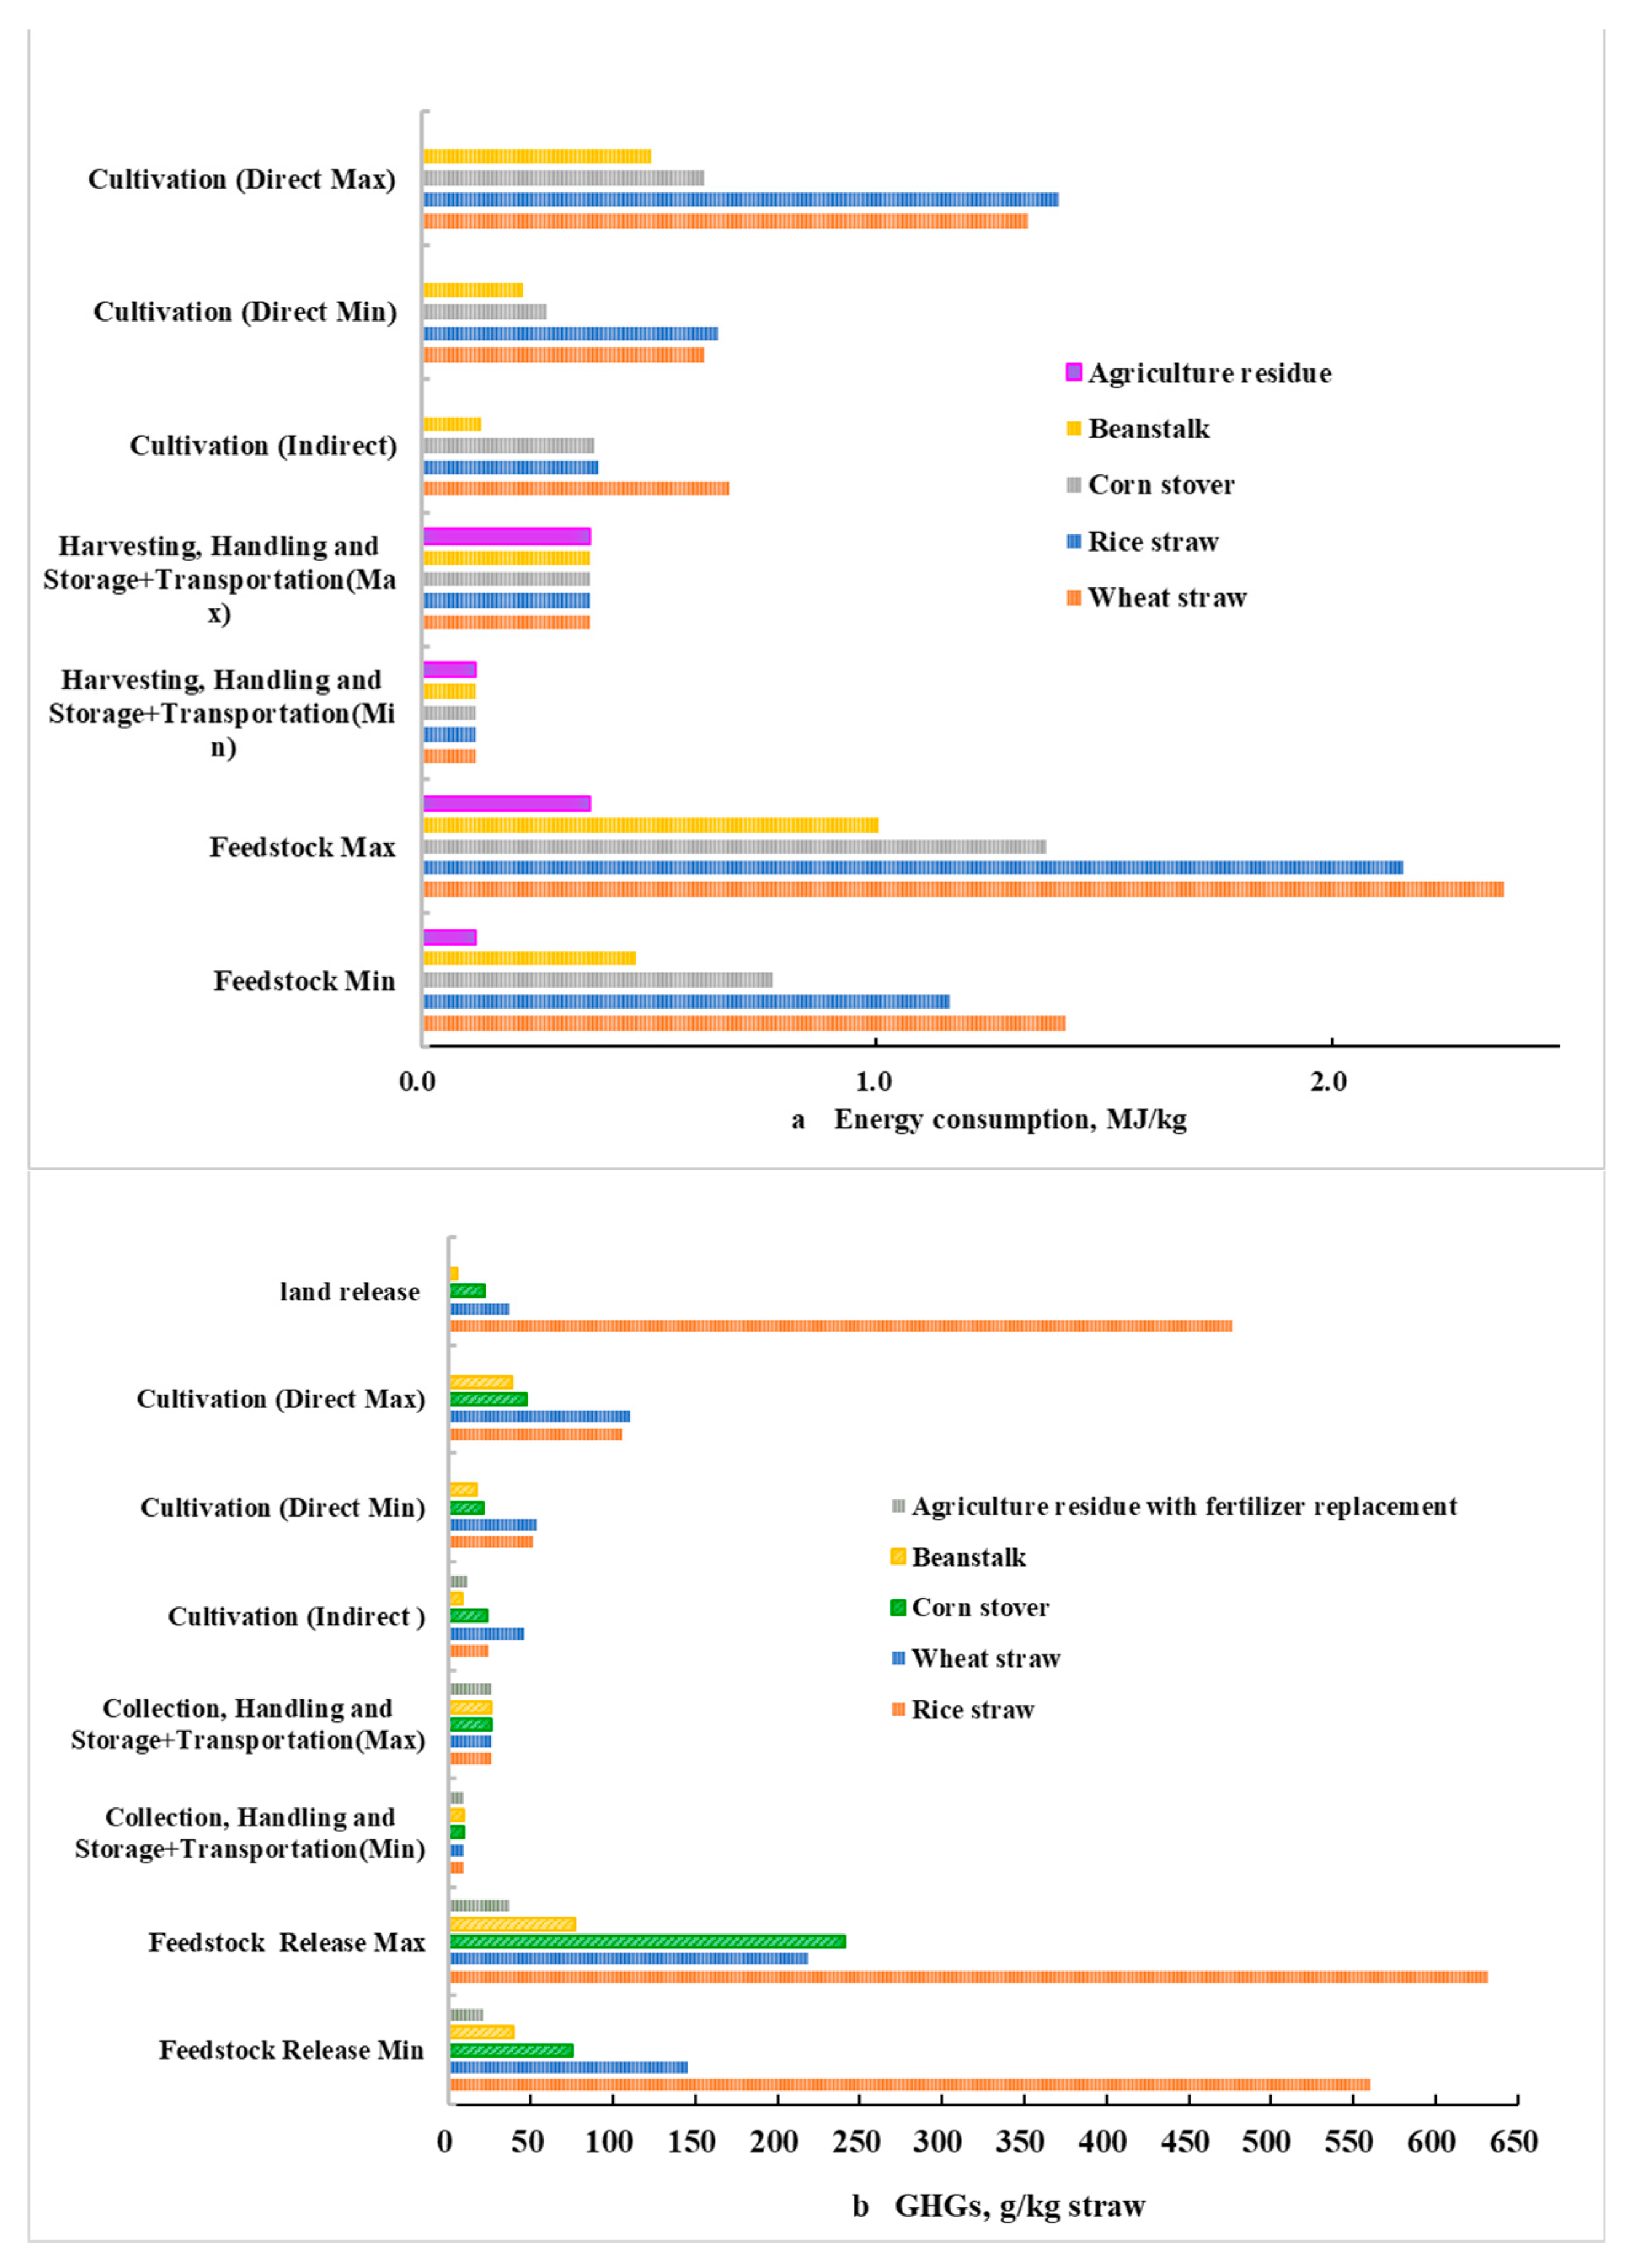
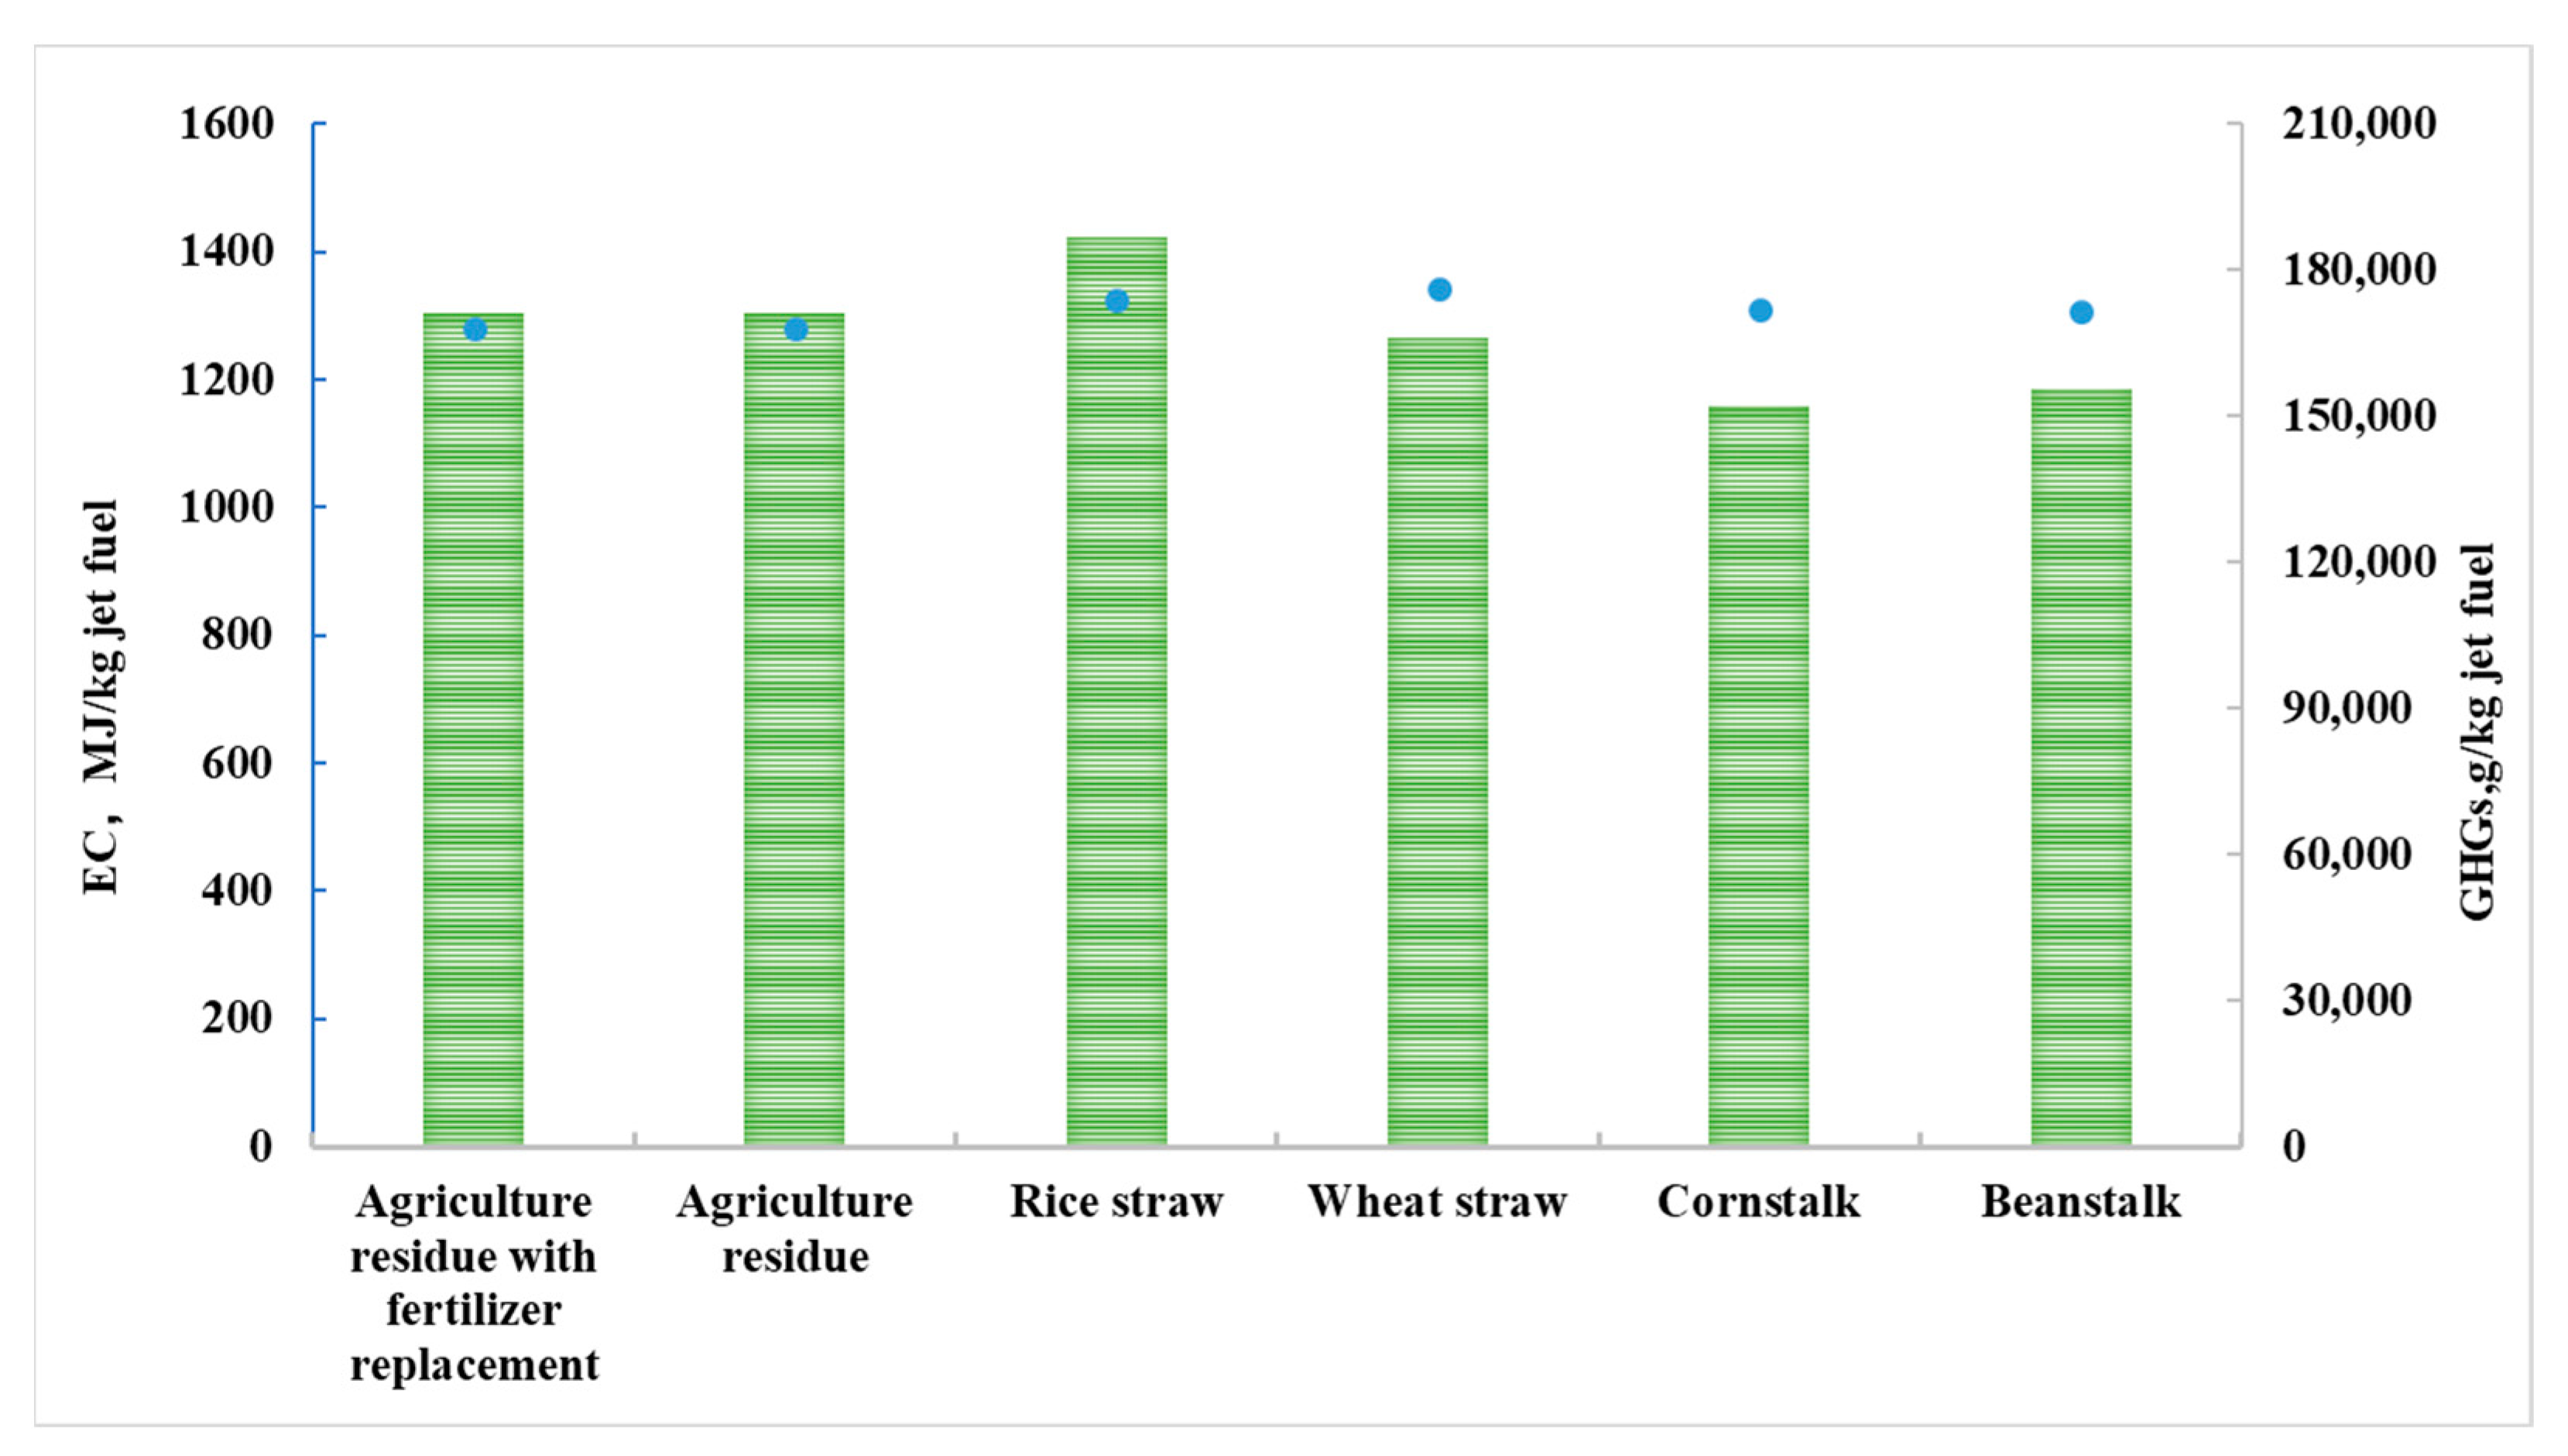
3.1. Feedstocks Stage
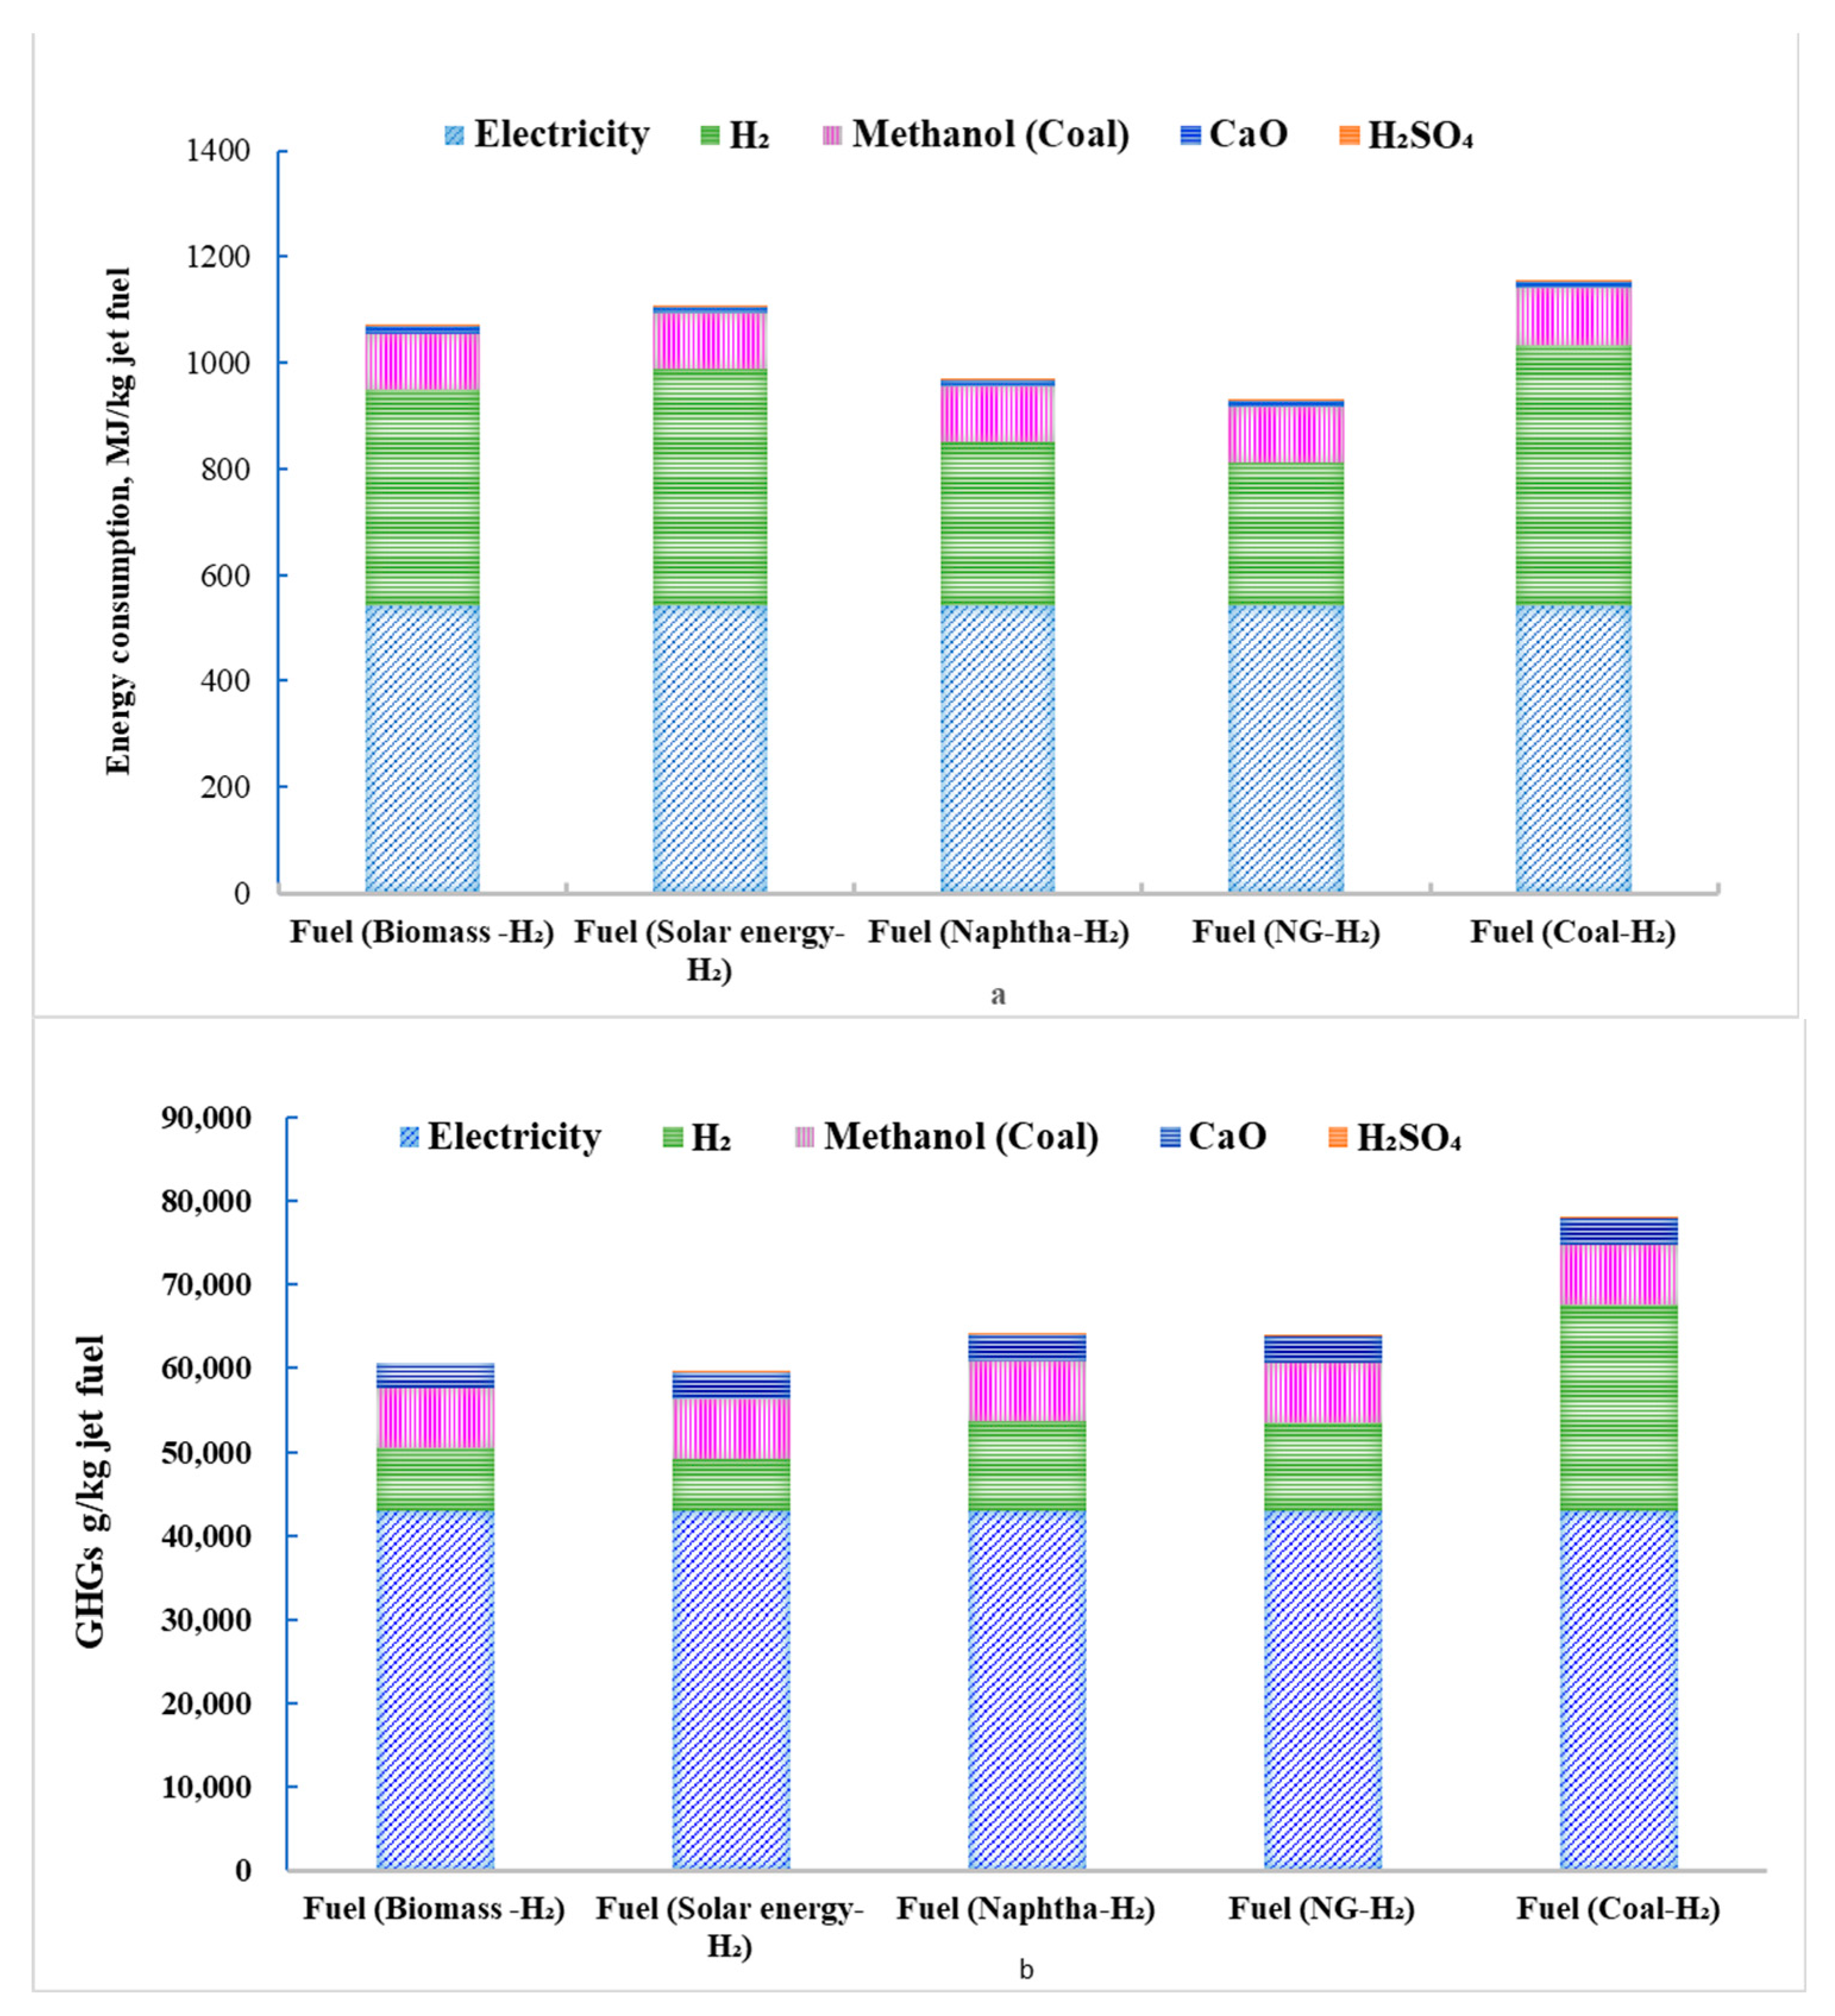
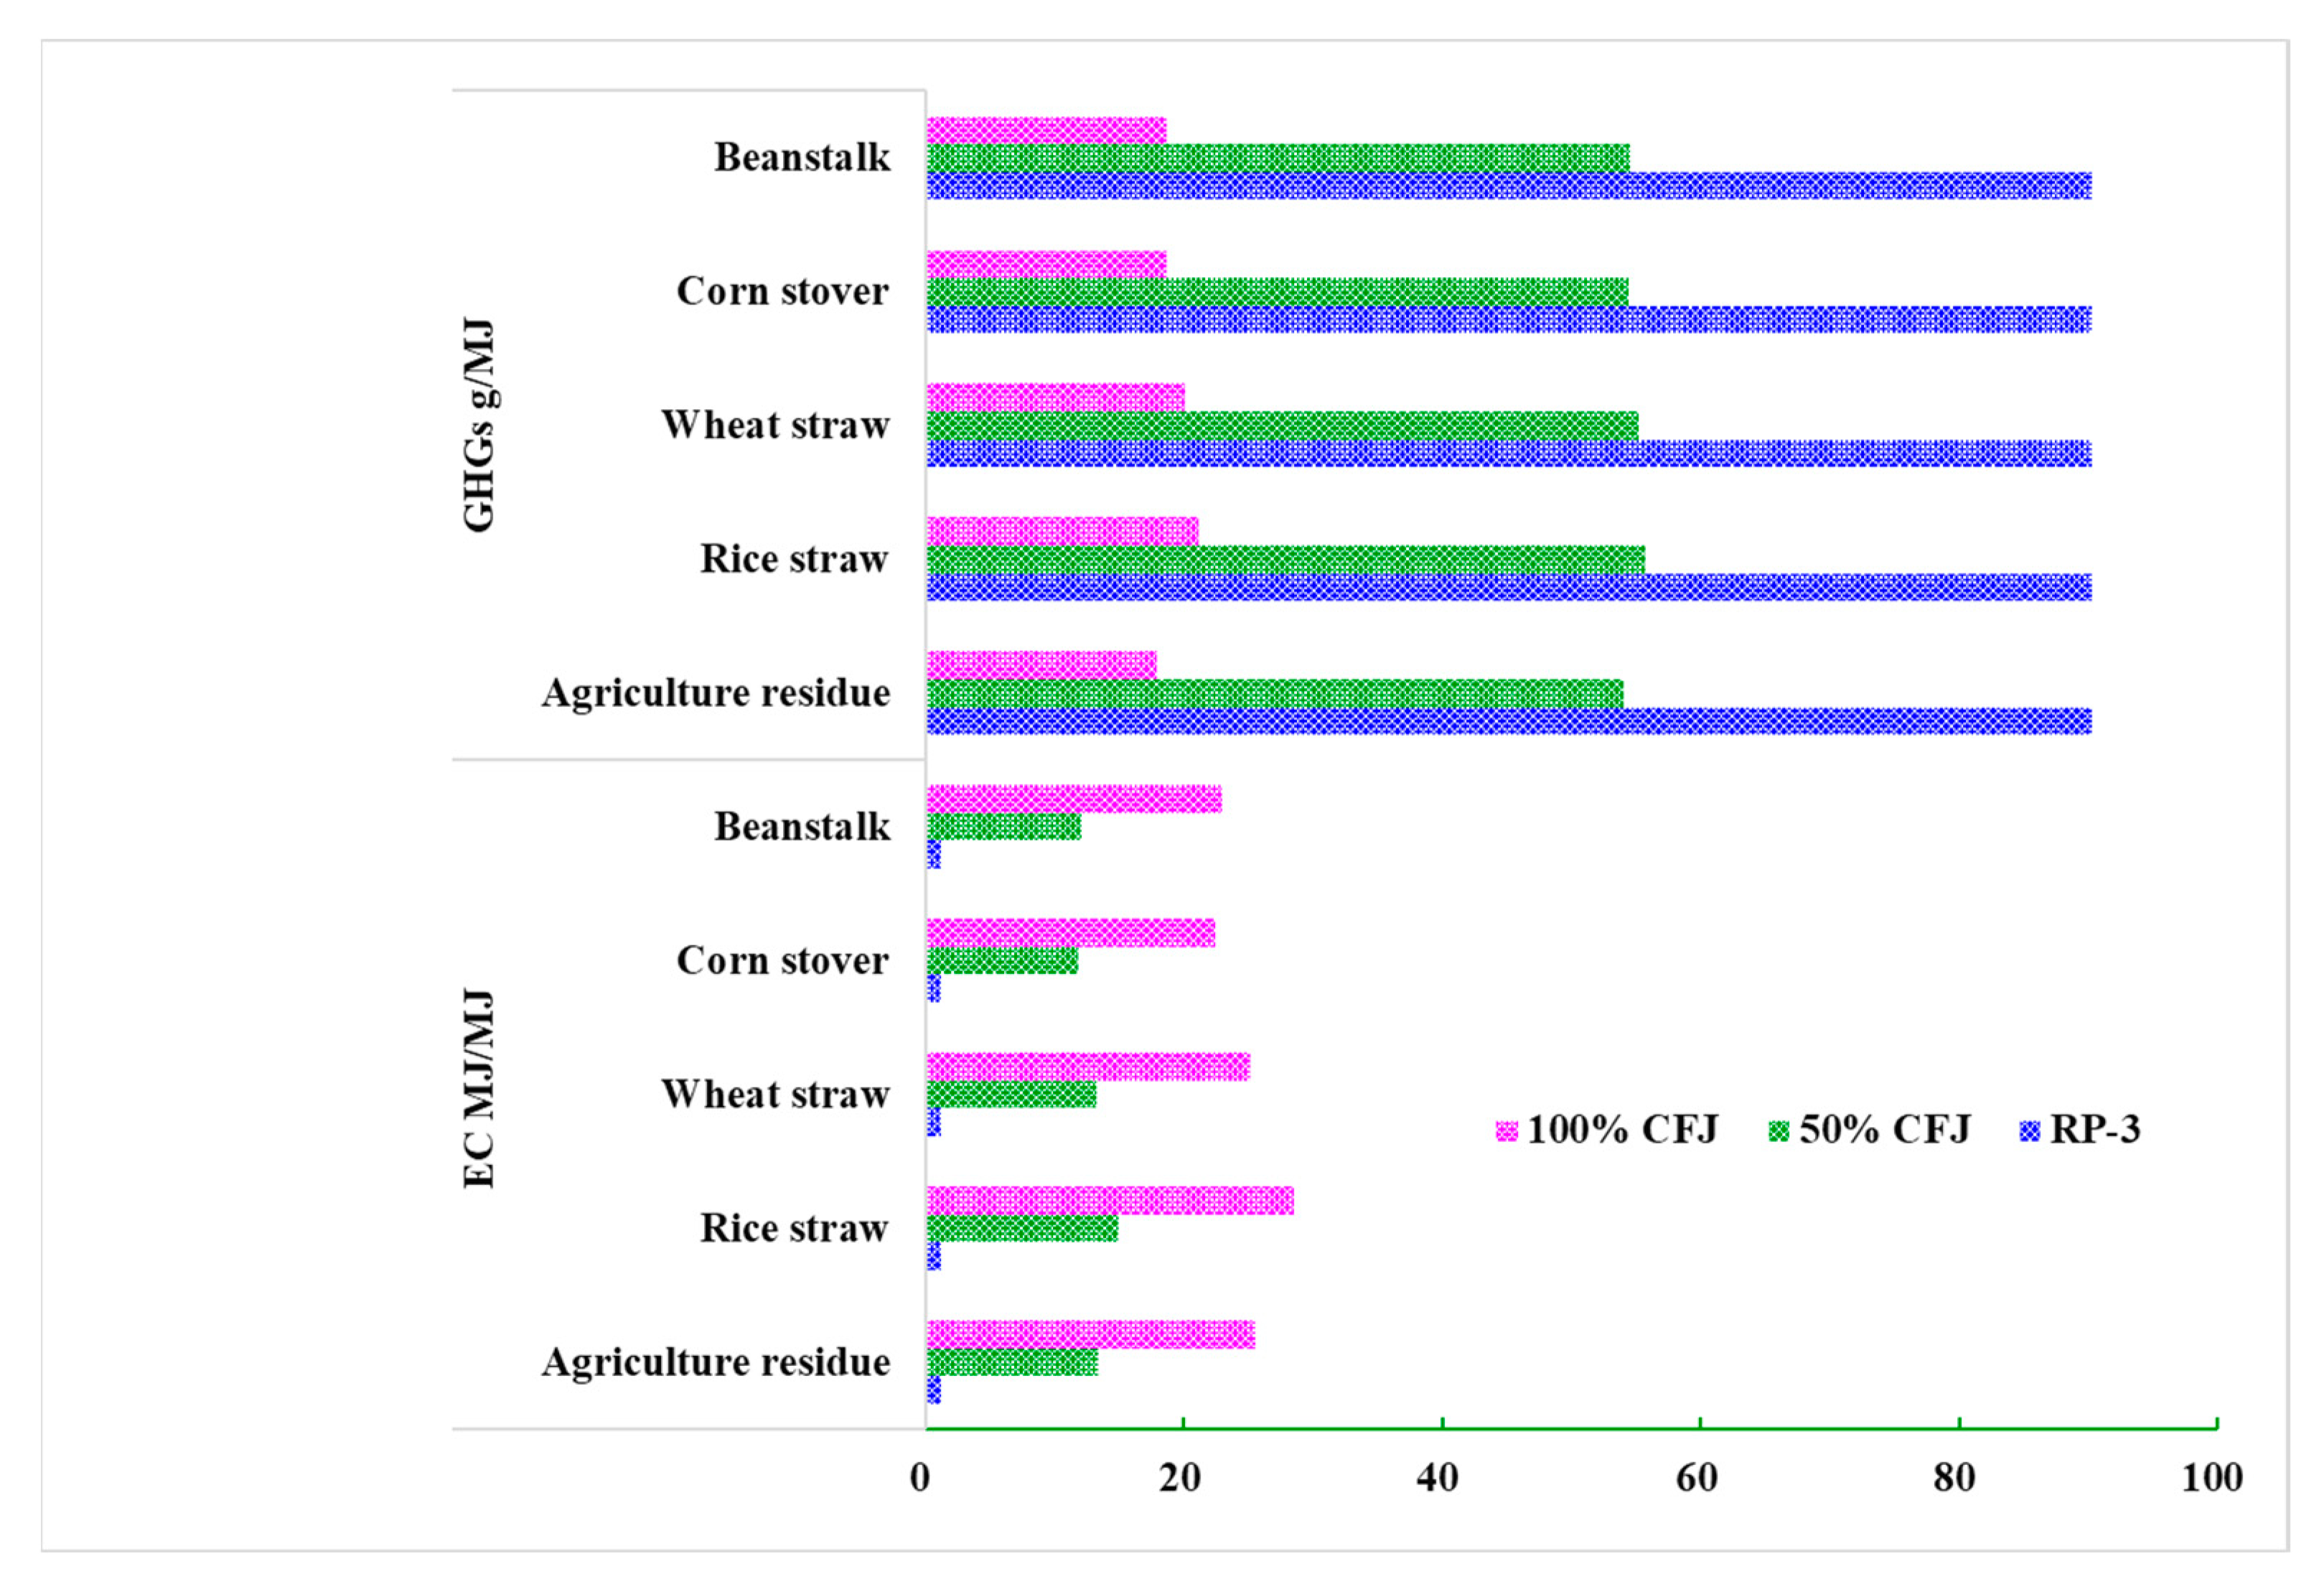
3.2. Refining Stage
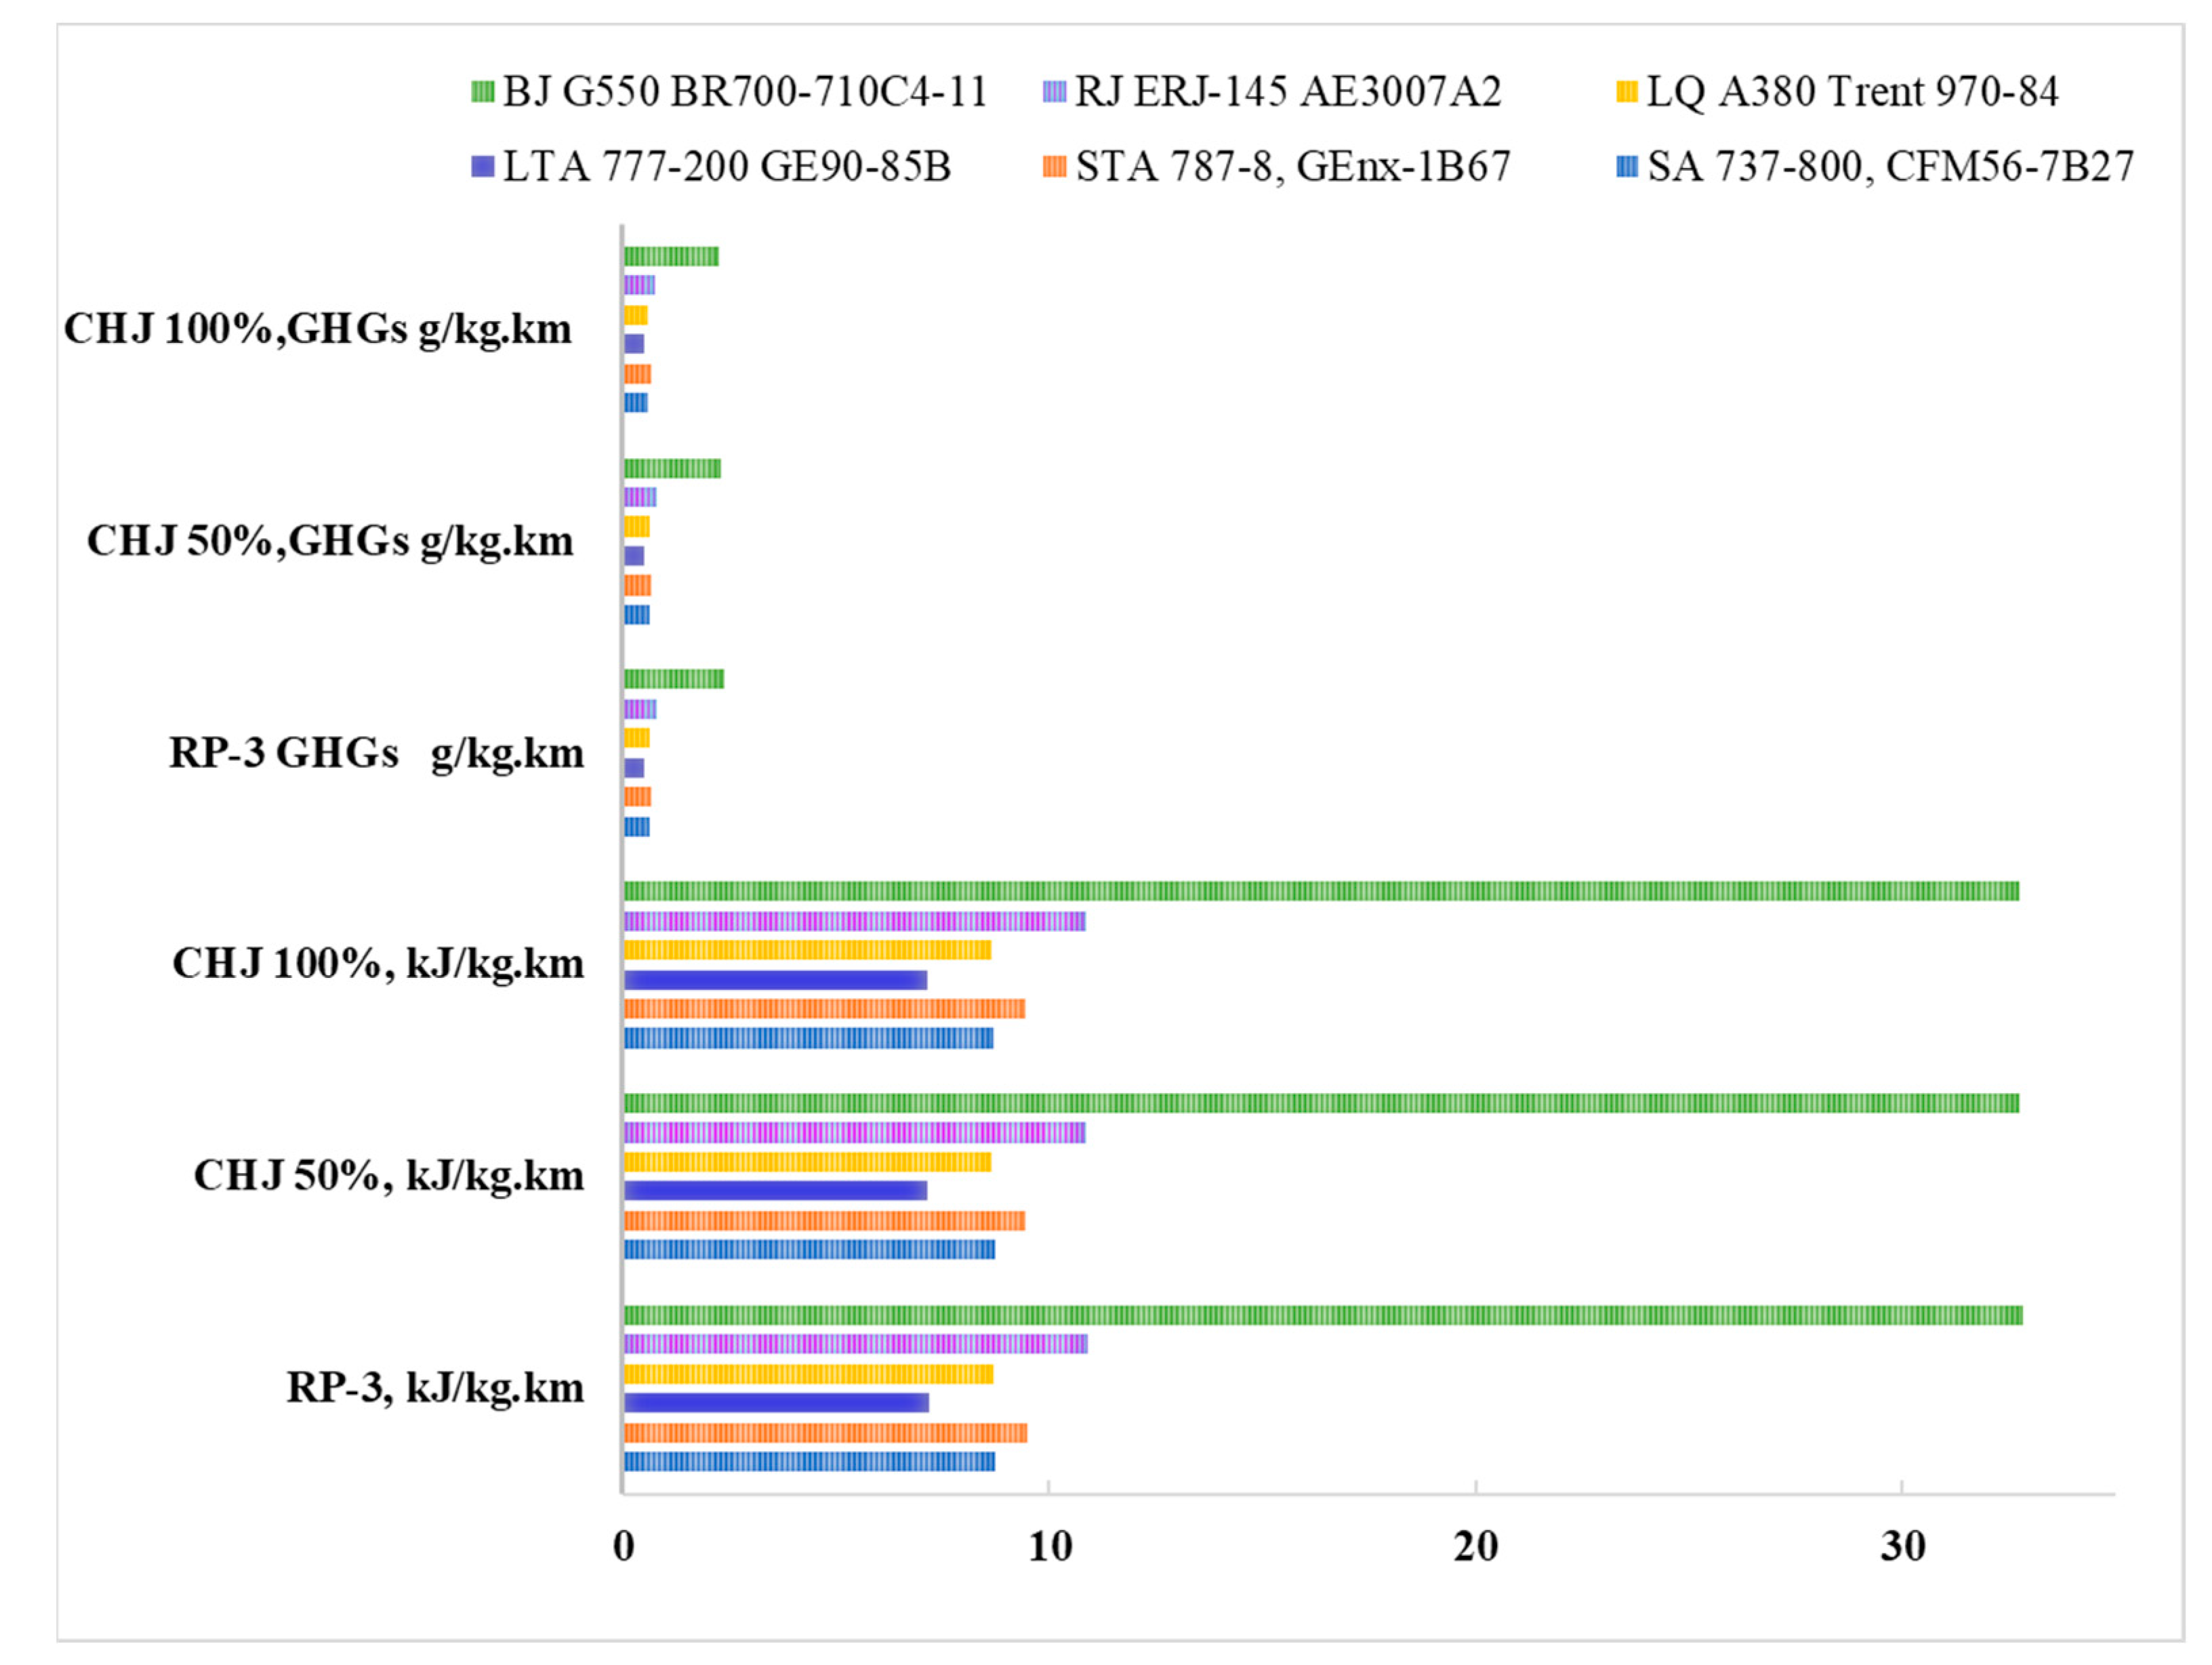
3.3. Flight Stage
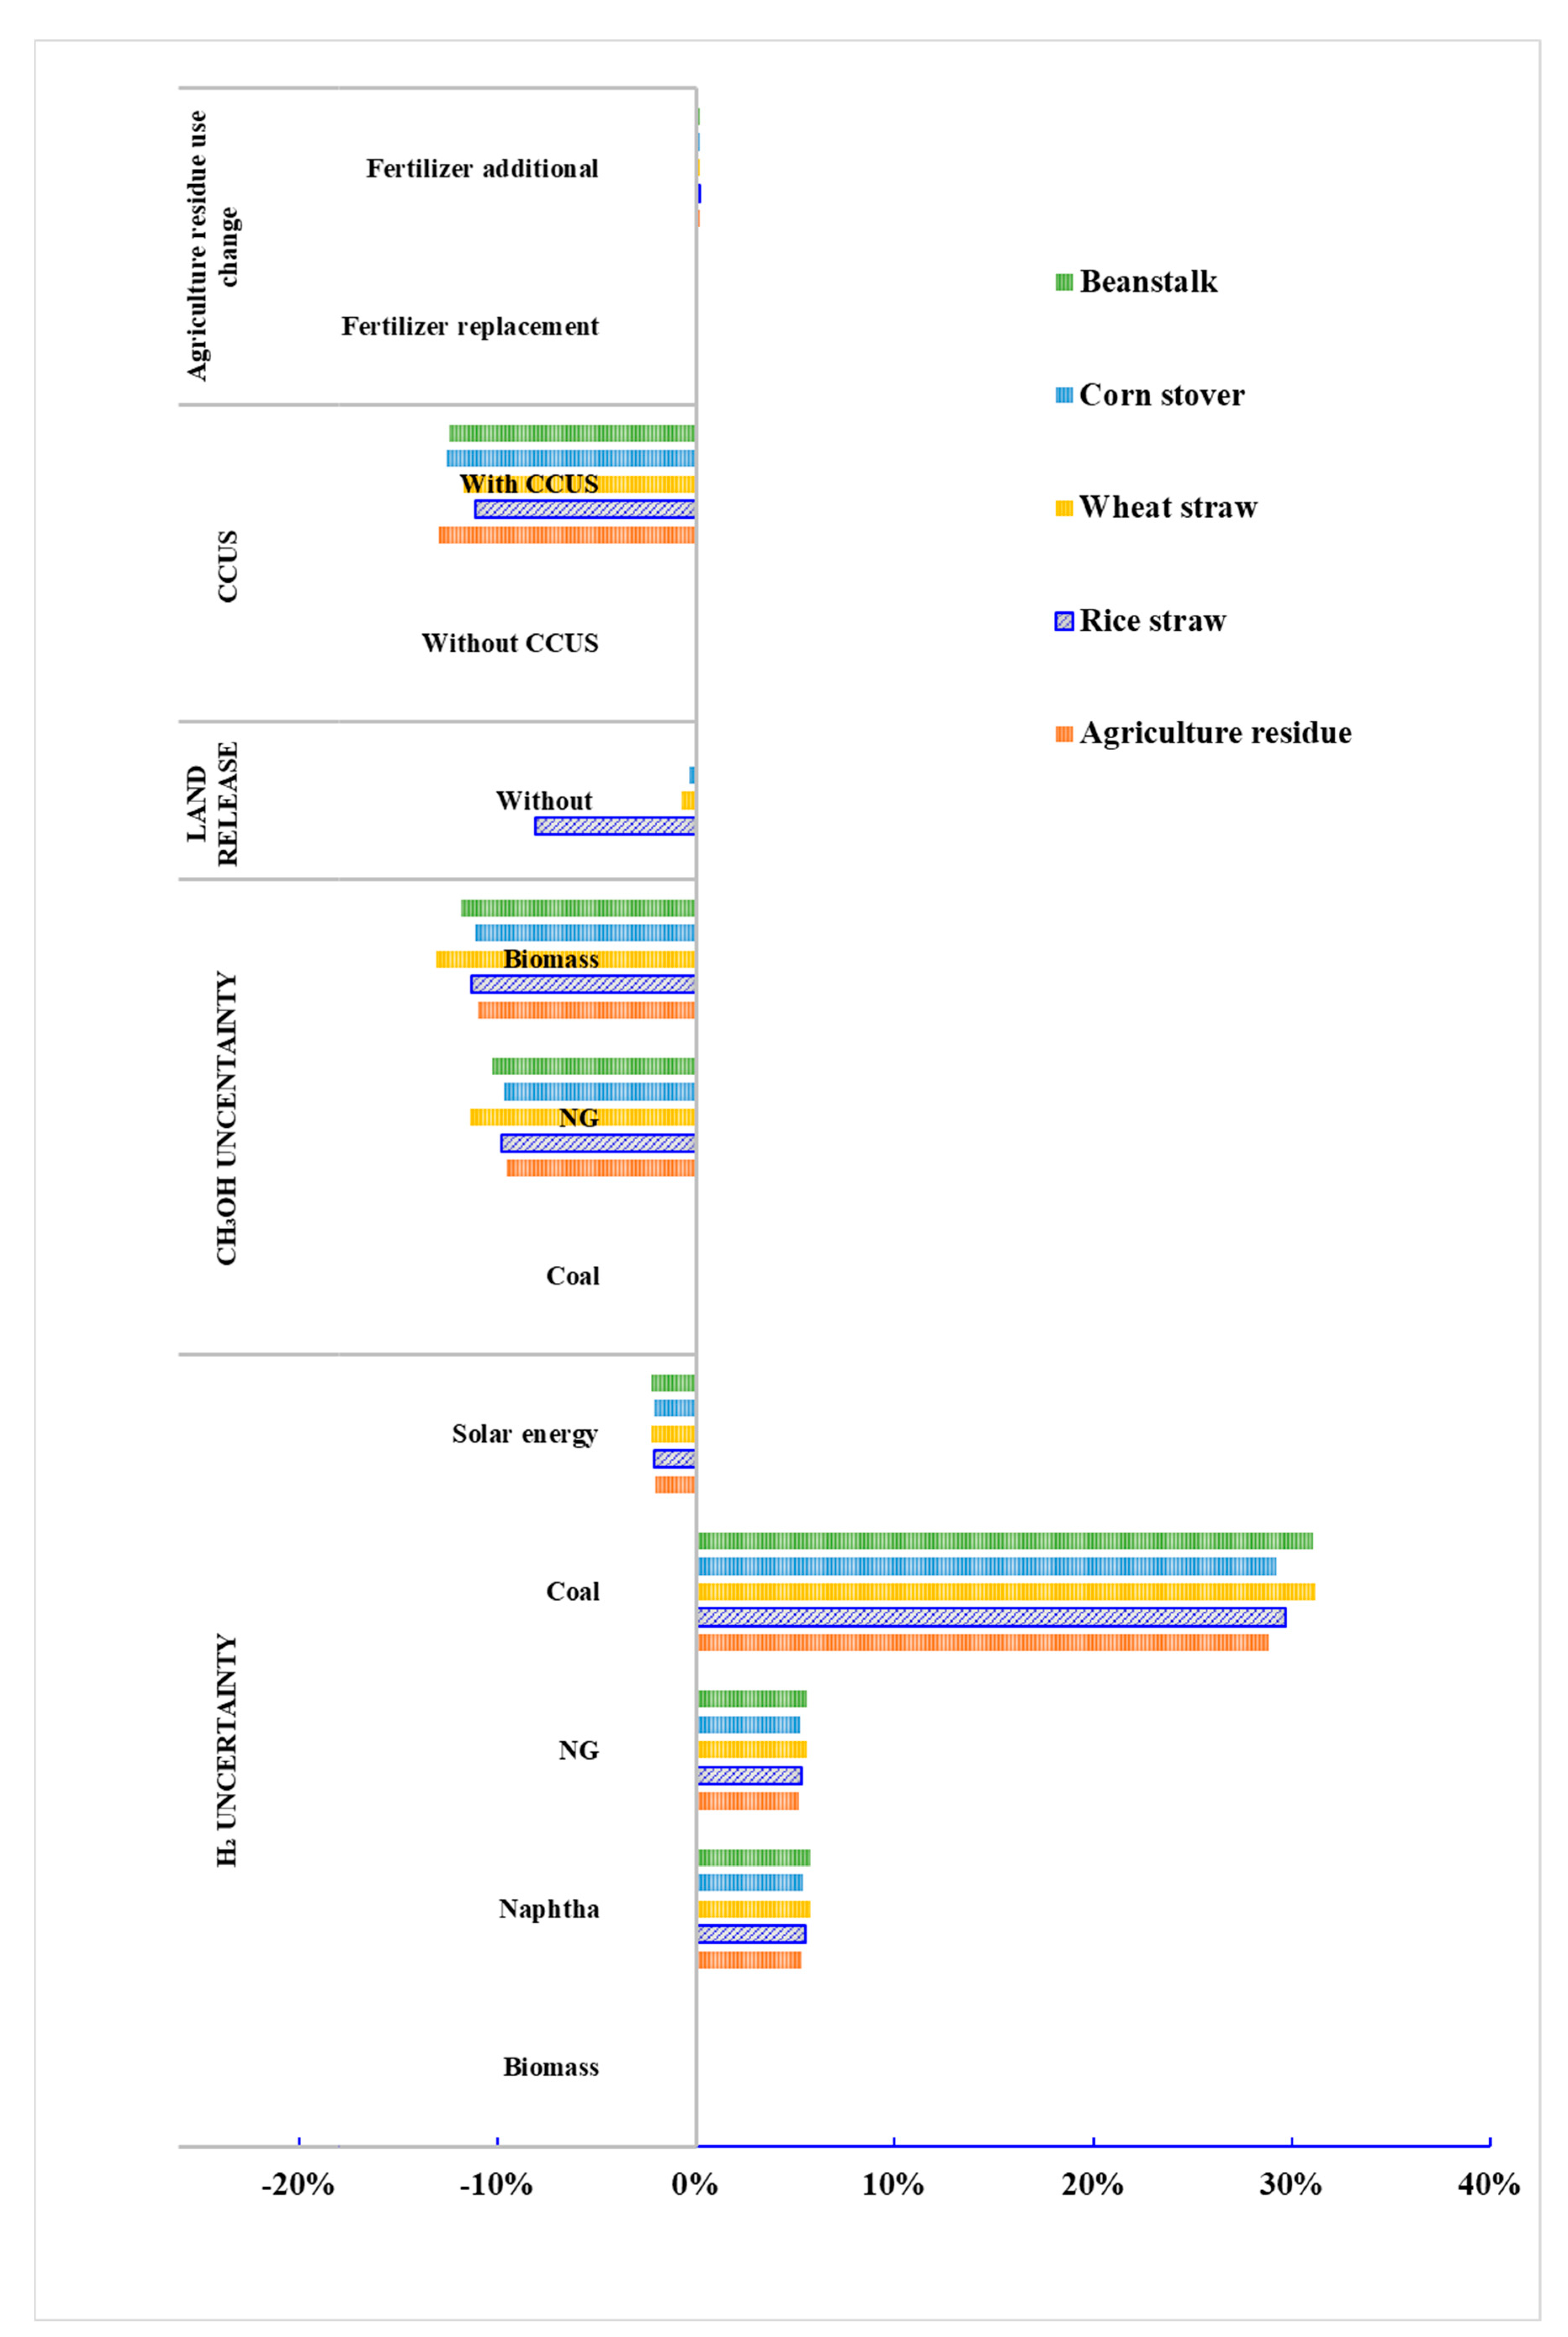
3.4. Uncertainty Analysis in WTW
4. Conclusions
Supplementary Materials
Author Contributions
Funding
Institutional Review Board Statement
Informed Consent Statement
Data Availability Statement
Conflicts of Interest
References
- Liu, Z.; Yang, X. Refining drop-in jet fuel coupling GHGs reduction in LCA with airworthiness in aero-engine and aircraft. Catal. Today 2020, 353, 260–268. [Google Scholar] [CrossRef]
- Yang, X.; Guo, F.; Xue, S.; Wang, X. Carbon distribution of algae-based alternative aviation fuel obtained by different pathways. Renew. Sustain. Energy Rev. 2016, 54, 1129–1147. [Google Scholar] [CrossRef]
- Fernanda, M.; Michailos, S.; Akram, M.; Cardozo, E.; Hughes, K.J.; Ingham, D.; Pourkashanian, M. Bioenergy with carbon capture and storage (BECCS) potential in jet fuel production from forestry residues: A combined Techno-Economic and Life Cycle Assessment approach. Energy Convers. Manag. 2022, 255, 115346. [Google Scholar] [CrossRef]
- Guo, X.; Guo, L.; Zeng, Y.; Kosol, R.; Gao, X.; Yoneyama, Y.; Yang, G.; Tsubaki, N. Catalytic oligomerization of isobutyl alcohol to jet fuels over dealuminated zeolite Beta. Catal. Today 2020, 368, 196–203. [Google Scholar] [CrossRef]
- Tanzil, A.H.; Brandt, K.; Wolcott, M.; Zhang, X.; Garcia-Perez, M. Strategic assessment of sustainable aviation fuel production technologies: Yield improvement and cost reduction opportunities. Biomass Bioenergy 2021, 145, 105942. [Google Scholar] [CrossRef]
- Santos, D.; Goncalves, R.; Alencar, A.C. Biomass-derived syngas production via gasification process and its catalytic conversion into fuels by Fischer Tropsch synthesis: A review. Int. J. Hydrogen Energy 2020, 45, 18114–18132. [Google Scholar] [CrossRef]
- Li, Y.; Chen, L.; Zhang, X.; Zhang, Q.; Wang, T.; Qiu, S.; Tan, J.; Li, K.; Ma, L. Process and Techno-economic Analysis of Bio-jet Fuel-range Hydrocarbon Production from Lignocellulosic Biomass via Aqueous Phase Deconstruction and Catalytic Conversion. Energy Procedia 2017, 105, 675–680. [Google Scholar] [CrossRef]
- Zhang, Q.; Li, Y.; Chen, G.; Wang, T.; Liu, Y.; Zhang, X.; Tan, J.; Li, K.; Ma, L. Material and Energy Conversion of Integrated 100 t/a-Scale Bio-Jet Fuel-Range Hydrocarbon Production System via Aqueous Conversion of Biomass. J. Tianjin Univ. (Sci. Technol.) 2017, 50, 13–18. (In Chinese) [Google Scholar] [CrossRef]
- Wang, C.; Zhang, X.; Liu, Q.; Zhang, Q.; Ma, L. A review of conversion of lignocellulose biomass to liquid transport fuels by integrated refining strategies. Fuel Process. Technol. 2020, 208, 106485. [Google Scholar] [CrossRef]
- Carter, N.; Stratton, R.; Bredehoeft, M.; Hileman, J. Energy and Environmental Viability of Select Alternative Jet Fuel Pathways. In Proceedings of the 47th AIAA/ASME/SAE/ASEE Joint Propulsion Conference & Exhibit, San Diego, CA, USA, 31 July–3 August 2011. [Google Scholar] [CrossRef]
- A, L.; Wen, M.; Guo, F.; Yang, X. Life cycle assessment of algae based aviation fuel on basis of engine type and related aircraft. J. Aerosp. Power 2018, 33, 1315–1325. (In Chinese) [Google Scholar] [CrossRef]
- Zhao, J.; Guo, F.; Yang, X. Research of sustainable feedstock for future alternative aviation fuels. J. Beijing Univ. Aeronaut. Astronaut. 2016, 42, 2378–2385. (In Chinese) [Google Scholar] [CrossRef]
- Liu, Z.; Liu, C.; Han, S.; Yang, X. Optimization upstream CO2 deliverable with downstream algae deliverable in quantity and quality and its impact on energy consumption. Sci. Total Environ. 2019, 709, 136197. [Google Scholar] [CrossRef] [PubMed]
- Ou, X.; Zhang, X.; Chang, S. Scenario analysis on alternative fuel/vehicle for China’s future road transport: Life-cycle energy demand and GHG emissions. Energy Policy 2010, 38, 3943–3956. [Google Scholar] [CrossRef]
- Ou, X.; Zhang, X.; Chang, S. Alternative fuel buses currently in use in China: Life-cycle fossil energy use, GHG emissions and policy recommendations. Energy Policy 2010, 38, 406–418. [Google Scholar] [CrossRef]
- Dong, S.; Huang, X.; Yang, X. Energy consumption for production of jet fuel precursors from cellulosic biomass by hydrothermal method. J. Beijing Univ. Areonautics Astronaut. 2022, 48, 620–631. (In Chinese) [Google Scholar] [CrossRef]
- Wu, C.; Wang, Z.; Dupont, V.; Huang, J.; Williams, P.T. Nickel-catalysed pyrolysis/gasification of biomass components. J. Anal. Appl. Pyrolysis 2013, 99, 143–148. [Google Scholar] [CrossRef]
- Huang, X.; Dong, S.; Yang, X. Energy consumption of condensation-hydrogenation process to prepare alkanes from lignocellulose biomass. J. Beijing Univ. Aeronaut. Astronaut. 2022, 48, 121–131. (In Chinese) [Google Scholar] [CrossRef]
- Wang, Z.; Zhang, X.; Liu, L.; Wang, S.; Zhao, L.; Wu, X.; Zhang, W.; Huang, X. Estimates of methane emissions from Chinese rice fields using the DNDC model. Agric. For. Meteorol. 2021, 303, 108368. [Google Scholar] [CrossRef]
- Qing, X. Research on the Atmospheric Evironment Impact Assessment from Aircraft Engine Emissions in Airport. Ph.D. Thesis, Nanjing University of Aeronautics and Astronautics, Nanjing, China, 2009. (In Chinese). [Google Scholar] [CrossRef]


| Emission | Alternative Jet Fuel | LPP Burner (CJF/RP-3 Test) | Aircraft-Single Aisle (CJF/RP-3 Simulation) | Aircraft-Small Twin Aisle, Large Twin Aisle, Large Quad (CJF/RP-3 Simulation) | Aircraft-Regional Jet, Business Jet (CJF/RP-3 Simulation) | ||||
|---|---|---|---|---|---|---|---|---|---|
| Blending ratio | LTO | Cruise | LTO | Cruise | LTO | Cruise | LTO | Cruise | |
| CH4 | 100% | 0.38 | 0.28 | 0.38 | 0.28 | 0.52 | 0.38 | 0.34 | 0.25 |
| 50% | 0.80 | 0.30 | 0.80 | 0.30 | 0.71 | 0.27 | 0.20 | 0.52 | |
| N2O | 100% | 1.00 | 1.00 | 1.00 | 1.00 | 1.00 | 1.00 | 1.00 | 1.00 |
| 50% | 1.00 | 1.00 | 1.00 | 1.00 | 1.00 | 1.00 | 1.00 | 1.00 | |
| CO2 | 100% | 0.999 | 0.999 | 0.999 | 0.999 | 0.999 | 0.999 | 0.999 | 0.999 |
| 50% | 0.999 | 0.999 | 0.999 | 0.999 | 0.999 | 0.999 | 0.999 | 0.999 | |
| UHC | 100% | 0.38 | 0.28 | 0.38 | 0.28 | 0.52 | 0.38 | 0.34 | 0.25 |
| 50% | 0.30 | 0.80 | 0.30 | 0.80 | 0.71 | 0.27 | 0.20 | 0.52 | |
| CO | 100% | 1.38 | 0.88 | 1.38 | 0.88 | 1.65 | 1.05 | 1.17 | 0.75 |
| 50% | 2.60 | 0.90 | 2.60 | 0.90 | 2.47 | 0.86 | 2.37 | 0.82 | |
| NOx | 100% | 1.79 | 0.56 | 1.79 | 0.56 | 1.74 | 0.55 | 1.96 | 0.61 |
| 50% | 1.38 | 0.91 | 1.38 | 0.91 | 1.39 | 0.91 | 1.45 | 0.95 | |
| PM | 100% | 0.80 | 0.80 | 0.80 | 0.80 | 0.16 | 0.16 | 0.22 | 0.22 |
| 50% | 0.76 | 0.76 | 0.76 | 0.76 | 0.65 | 0.65 | 0.81 | 0.81 | |
| SOx | 100% | 0 | 0 | 0 | 0 | 0 | 0 | 0 | 0 |
| 50% | 0.51 | 0.51 | 0.51 | 0.51 | 0.51 | 0.51 | 0.51 | 0.51 | |
| Feedstock Stage | Energy | Material, g/kg | Land Release | ||||||
|---|---|---|---|---|---|---|---|---|---|
| Cultivation | Feedstock | Electricity kwh/t | Diesel g/kg | N | P2O5 | K2O | Pesticides/ Herbicide | CH4 kg/hm2 | N2O kg/kgN |
| Rice | 127.3–151.4 | 5.2–32.2 | 6.34 | 1.76 | 3.32 | 1.025 | 218 | 0.01 | |
| Wheat | 127.3–151.4 | 5.2–32.2 | 16.95 | 1.63 | 0 | 1.025 | - | 0.01 | |
| Corn | 44.3–77.9 | 4.4–13.9 | 11.08 | 0.57 | 0.37 | 0.275 | - | 0.01 | |
| Bean | 44.3–77.9 | 4.4–13.9 | 2.99 | 1.5 | 3.29 | 0.275 | - | 0.01 | |
| Agriculture | - | - | - | - | |||||
| Harvesting | 7–22 | 0.5–2.4 | |||||||
| Transportation | 25–50 km | 0.02 kg/(t·km) | |||||||
| Fuel stage | Electricity | Thermal heat | H2 | CH3OH | CaO | H2SO4 | |||
| Hydrolysis/Aldol condensation/ Hydrotreating | FF 0.385 g/ghemicellulose LA 0.259 g/gcellulose H2 0.105 g/glignin | 234.73 MJ/kgjet fuel | 71.54 MJ/kgjet fuel | 0.142 g/gjet fuel | 28.43 g/kgstraw | 279.41 g/kgstraw | 503.92 g/kgstraw | ||
Disclaimer/Publisher’s Note: The statements, opinions and data contained in all publications are solely those of the individual author(s) and contributor(s) and not of MDPI and/or the editor(s). MDPI and/or the editor(s) disclaim responsibility for any injury to people or property resulting from any ideas, methods, instructions or products referred to in the content. |
© 2023 by the authors. Licensee MDPI, Basel, Switzerland. This article is an open access article distributed under the terms and conditions of the Creative Commons Attribution (CC BY) license (https://creativecommons.org/licenses/by/4.0/).
Share and Cite
Liu, Z.; Liu, H.; Yang, X. Life Cycle Assessment of the Cellulosic Jet Fuel Derived from Agriculture Residue. Aerospace 2023, 10, 129. https://doi.org/10.3390/aerospace10020129
Liu Z, Liu H, Yang X. Life Cycle Assessment of the Cellulosic Jet Fuel Derived from Agriculture Residue. Aerospace. 2023; 10(2):129. https://doi.org/10.3390/aerospace10020129
Chicago/Turabian StyleLiu, Ziyu, Haobo Liu, and Xiaoyi Yang. 2023. "Life Cycle Assessment of the Cellulosic Jet Fuel Derived from Agriculture Residue" Aerospace 10, no. 2: 129. https://doi.org/10.3390/aerospace10020129