1. Introduction
Access to space cannot be achieved without powerful propulsion devices, including rocket engines [
1,
2], ramjet engines [
3,
4], and their combination engines. Rocket engines are self-contained with fuel and oxidizer, while ramjet engines can use the oxygen in the air. In the last century, hydrazine propellants have been widely used in liquid rocket engines [
5]. However, they are toxic and easily pollute the environment, so they are gradually being replaced by environmentally friendly propellants in the development of modern space technology. High-concentration hydrogen peroxide has the advantages of high density specific impulse, room temperature storage capability, non-toxicity, and is non-polluting. Therefore, high-concentration hydrogen peroxide is a good oxidizer in the field of aerospace propulsion [
6,
7,
8,
9].
The high-temperature and high-pressure products produced by the catalytic decomposition of high-concentration hydrogen peroxide can ignite spontaneously with most liquid fuels, thereby eliminating the redundant ignition system of the engine, resulting in a significant reduction in system complexity, difficulty, and weight [
10]. Fagherazzi et al. [
11] used three-dimensional printing to fabricate regenerative cooling nozzles and tested a 450 N bipropellant engine based on high-concentration hydrogen peroxide. The results proved that the nozzle was able to pass the test, demonstrating the feasibility of three-dimensional printing technology. The thrust of the engine is less than that of the engine of the present work, but the machining method is the same. Heo and others [
12,
13] conducted tests of a 2500 N thruster with hydrogen peroxide and kerosene. Using hydrogen peroxide as the coolant, gas film cooling was used to protect the combustion chamber and nozzle materials from the combustion gases. Four experimental cases were conducted by varying the ratio of coolant to the total amount of hydrogen peroxide supplied between 13.4% and 25.6%. The successful ignition of the engine had laid the foundation for the experimental verification of the present study. Li et al. [
14] designed, built, and tested a 35 kN staged combustion rocket engine with hydrogen peroxide and kerosene. A total of five hot tests were conducted with a running time of 119 s. Thus, the propellant combination of hydrogen peroxide and kerosene not only meets space technology’s urgent need to protect the environment, but also has a good working performance, with good application prospects and important research significance.
For liquid rocket engines, effective thermal protection and reliable ignition of the thrust chamber are key technologies in their development. Shine et al. [
15] and Strokach et al. [
16] studied the characteristics of gas-film cooling and liquid-film cooling, respectively, while Mahmoodi et al. [
17] investigated the cooling process within the regenerative cooling channel. On the other hand, Gagne et al. [
18] studied the ignition of a dual-mode propulsion system with hydrogen peroxide. Currently, the most widely used cooling method is regenerative cooling [
19,
20]. Regenerative cooling is the flow of liquid fuel or oxidizer in the cooling channels inside the thrust chamber walls to absorb heat, thus reducing the temperature of the thrust chamber walls to the temperature allowed by the material [
21,
22,
23]. Zhou et al. analyzed the effect of regenerative cooling channel parameters on the dynamic characteristics of the engine [
21,
22], while Ricci et al. investigated the flow state within the regenerative cooling channel [
23]. Since the heat absorbed by the coolant can be reused in the combustion chamber along with the propellant, there is no overall loss of engine performance. In this study, the same regenerative cooling method was used to ensure that the thrust chamber was protected from damage.
For the regenerative cooling problem of liquid rocket engines, the current research mainly includes heat transfer on the gas side, physical properties, and flow characteristics of the coolant, etc. Johakar et al. [
24] combined computational fluid dynamics (CFD) and rocket thermal evaluation (RTE) to implement a coupled gas-side and coolant-side heat transfer calculation method for regenerative cooling of rocket engines and validated the model predictions of heat flow, gas wall surface temperature, coolant temperature rise, and pressure reduction, etc. Parris and others [
25] calculated the effect of channel geometry characteristics on regenerative cooling performance, while comparing the effect of using variable and constant physical properties on the calculation results. The results indicated that the use of supercritical hydrogen as coolant results in considerable performance changes, with a significant impact on the developing flow and the heat transfer. Wennerberg et al. [
26] used a combination of experimental and computational methods to investigate the effect of high depth-to-width ratios on cooling enhancement. They used two-dimensional simulations to compare with the traditional empirical equation approach and pointed out the possible shortcomings of the traditional calculation method. The above studies obtained the variation law of regenerative cooling for conventional rocket engines, however, they did not focus on hydrogen peroxide, a propellant that is very sensitive to temperature.
With the continuous development of numerical computation, the methods and means for solving the complex regenerative cooling problems of different engines have been gradually enriched. Song et al. [
27] investigated the regenerative cooling of a variable-thrust expansion cycle rocket engine with liquid oxygen and liquid methane. The reduction of the methane mass flow rate led to the instability of the two phases in the regenerative cooling channel at low engine thrust. The gas-side wall temperature was stratified because of the different phase transition heat mechanisms. The gas-side wall temperature had a local peak at the throat and reached a maximum in the two-phase region. Zhang and others [
28] investigated the thermal behavior in the cooling channel of the regenerative cooling system with different channel sizes by experimental and three-dimensional numerical simulation methods and found the optimal design parameters. The results indicated that a smaller flow area can significantly reduce the wall temperature, but, at the same time, the pressure drop will increase significantly. Decreasing the inner wall thickness can significantly reduce the wall temperature without significantly increasing the pressure drop. Zhang et al. [
29] performed coupled flow and heat transfer for combustion and regenerative cooling and compared the results with and without a manifold. The results demonstrated that the presence of the manifold would result in a non-uniform distribution of mass flow and wall temperature along the circumferential direction. The larger the angle between the inlet and outlet, the greater the inhomogeneity of mass flow and wall temperature along the circumferential direction.
In addition to the coolant flow in the regenerative cooling channel, the propellant combustion process inside the thrust chamber is also a necessary part of the regenerative cooling calculation. The two main common liquid rocket engines with hydrogen peroxide and kerosene currently contain liquid–liquid combustion and gas–liquid combustion. For the liquid–liquid combustion method, Pourpoint et al. [
30] and Frolik et al. [
31] conducted an experimental study on the auto-ignition of fuel with hydrogen peroxide. The effects of initial ambient pressure, initial ambient gas properties, hydrogen peroxide concentration, and catalyst concentration on ignition delay were analyzed. The ignition delay was found to decrease with increasing catalyst concentration. The ignition delay increased by 30% as the pressure decreased from atmospheric pressure to 48 kPa. The ignition delay increased by 50% as the hydrogen peroxide concentration decreased from 99% to 92%. The study provided ideas to carry out the calculation of the flow field inside the engine. Kang and others [
32,
33] developed a fuel with a metal hydride addition and combined it with a high concentration of hydrogen peroxide to form a two-component propellant with good self-ignition characteristics. The effect of the oxygen–fuel ratio and hydrogen peroxide concentration on the phenomenon of hard start during ignition initiation was analyzed by static ignition tests. The oxygen-rich ignition process has a much longer ignition delay than the fuel-rich ignition process and is more prone to the hard start phenomenon. It was a guideline for the determination of the ignition timing in the present study. In the present ignition test, the oxidizer was injected first and then the fuel was injected.
Unlike the impingement injection, which is often used in the liquid–liquid catalytic ignition, the gas–liquid catalytic ignition usually takes the form of injection where the fuel is injected laterally into the hydrogen peroxide decomposition gas. Sisco et al. [
34] investigated the spontaneous combustion characteristics of kerosene in hydrogen peroxide decomposition products by lateral injection. The results indicated that increasing the hydrogen peroxide concentration and thrust chamber contraction ratio increases the auto-ignition limit and makes it easier to achieve auto-ignition. At equivalence ratios as low as 1.37, spontaneous ignition could not be achieved using 85% hydrogen peroxide, while strong spontaneous ignition could be achieved using 98% hydrogen peroxide at equivalence ratios as high as 2.06. The equivalence ratio is defined as the ratio of the hydrocarbon-to-oxidizer ratio to the stoichiometric hydrocarbon-to-oxidizer ratio. Schiebl and others [
35] developed a model for the spontaneous ignition of kerosene and hydrogen peroxide decomposition products in a micro-rocket combustion chamber. The model predictions were verified to be in good agreement with the experimental data. Li et al. [
36] conducted numerical simulations of the chemical ignition delay of hydrogen peroxide decomposition products with kerosene. A significant effect of the hydrogen peroxide decomposition rate of less than 80% on the chemical ignition delay was found, and a negative temperature coefficient phenomenon was observed for the chemical ignition delay of below 85% decomposition rate. This phenomenon decreased with increasing pressure and almost disappeared at pressures greater than 4 MPa.
At present, the performance of hydrogen peroxide engines has been largely verified and understood. However, few researchers have studied and explored the cooling problem of hydrogen peroxide engines, especially the regenerative cooling problem. The existing methods of separately studying regenerative cooling channels and engine combustion flow fields have large errors and limitations. It is necessary to perform joint calculation of the combustion flow field and regenerative cooling channel to improve the accuracy, especially for high-concentration hydrogen peroxide, which is highly sensitive to the temperature. Therefore, further studies are needed concerning the regenerative cooling of engines using hydrogen peroxide and kerosene.
2. Structure and Composition
2.1. Thrust Chamber and Cooling Channel Structure
The mixing ratio of hydrogen peroxide and kerosene used in this study was 7.5, which is near the optimum mixing ratio according to the specific impulse of the rocket engine. The mixing ratio is the ratio of the oxidizer flow rate to the fuel flow rate. The combustion chamber pressure was 2.0 MPa. The schematic diagram of the engine with regenerative cooling is shown in
Figure 1. The coolant entered from the rear of the thrust chamber, passed through the cooling channel, and exited at the front of the thrust chamber. The discharged coolant entered the catalytic bed, and the oxygen and water vapor at high temperature after decomposition entered the injector.
The injector structure and the thrust chamber structure in this study are shown in
Figure 2. According to the design principle of the thrust chamber, the combustion chamber was cylindrical, and the nozzle convergence section and nozzle expansion section were biarc. The inner diameter of the thrust chamber was 45 mm. For the injection scheme, a seven-injector lateral injection scheme was used. That is, the plane orifice injectors for the oxidizer were distributed in a cyclic manner on the injection panel. One orifice in the center was surrounded by six orifices. The fuel was injected radially through the injection orifices at an angle of 90 degrees to the axially injected oxidizer. The number of fuel injection orifices in each oxidizer injector was five, and the fuel was injected into the combustion chamber while mixing with the oxidizer. The diameter of the gas injection orifice was 7 mm, while the diameter of the liquid injection orifice was 0.45 mm. Since hydrogen peroxide is decomposed into a mixture of oxygen and water vapor at high temperature by the catalytic bed, it can be spontaneously ignited with kerosene, so no additional ignition device was needed.
The regenerative cooling channels were of milled-slot construction, taking the design of constant rib width. The rib width of the cooling channels was 2 mm; the inner wall thickness of the engine as well as the height of the cooling channels were 1 mm. The number of cooling channels was 18, and the outer wall thickness was 2 mm. Considering the compatibility of hydrogen peroxide and materials, the cooling channel materials were 1Cr18Ni9Ti stainless steel, while copper could not be used.
In order to verify the rationality of the regenerative cooling channel design, one-dimensional preliminary calculations for regenerative cooling were required. The steps of the preliminary regenerative cooling calculation are shown in
Figure 3. The preliminary calculation was based on a one-dimensional thrust chamber, the results of which can quickly determine whether the design of the regenerative cooling channels is reasonable. The one-dimensional preliminary calculation provided the basis for the subsequent detailed simulation in three dimensions.
The one-dimensional preliminary calculation assumed that the thrust chamber and the internal gas were axisymmetric and that the parameters differed only in the axial direction. It started by dividing the thrust chamber into several segments in the axial direction and assumed that the parameters of each segment were the same. The aerodynamic parameters of the gas consisted of two parts: one was the macro parameters in the thrust chamber and the other was the property parameters of the gas. Macro parameters included combustion chamber pressure, mass flow, gas temperature, etc., while property parameters included gas constant, viscosity, gas composition, etc. The gas temperature and the gas property parameters were obtained by the CEA (chemical equilibrium with applications). It can carry out thermal balance calculations of rocket engines. The convective heat transfer at the gas side and liquid side of the cooling channel with the coolant was calculated by initially giving the gas wall temperature. The convective heat transfer coefficient on the side of the hot gas and the wall was calculated by the Bartz formula. The gas wall temperature distribution was given mainly based on the allowable temperature of the material. The gas wall temperature at the nozzle throat section was close to the allowable temperature of the material, while the gas wall temperature at the nozzle outlet section was much lower than the allowable temperature of the material. On this basis, the gas wall temperature of each segment of the thrust chamber was obtained. The difference between the calculated gas wall temperature and the initially given gas wall temperature was used to determine the reasonableness of the regenerative cooling channel design.
The one-dimensional preliminary calculation results are shown in
Figure 4. The temperature deviation of the gas wall was within 8%, which was reasonable for the preliminary calculation of the rocket engine heat transfer. The deviation was mainly caused by the simplicity of the model used, which did not consider the circumferential inhomogeneity of the gas. However, the one-dimensional preliminary calculation was less computationally intensive and could quickly determine the rationality of the regenerative cooling channel. Therefore, it was necessary to carry out the calculations before the three-dimensional simulation. On this basis, the design of 2 mm rib width, 1 mm inner wall thickness, and 1 mm rib height, 18 cooling channels, 2 mm outer wall thickness and 1Cr18Ni9Ti stainless steel was reasonable and met the cooling requirements.
2.2. The Three-Dimensional and Fluid-Heat Coupling Calculation Scheme
The coupled heat transfer within the regenerative cooling thrust chamber consists of three main processes, that is, heat transfer between the gas and the wall of the thrust chamber, heat conduction in the wall of the thrust chamber, and heat convection between the wall of the thrust chamber and the regenerative coolant. The three processes affect each other. In order to obtain the exact temperature of the thrust chamber wall, the three processes must be coupled and calculated simultaneously. However, this generates extremely high computational resources and numerical instability, so the calculation was divided into two parts, which were calculated separately. These two parts were the coupled heat transfer of the coolant and cooling channel, and the combustion, flow, and heat transfer inside the thrust chamber. The coupling between the two parts was achieved by automatic iteration. This scheme ensured the continuity of temperature and heat flow on the coupling surface of the two parts, thus satisfying the energy conservation, and the specific calculation steps and flow chart are as shown in
Figure 5. The numerical simulation was implemented on Fluent 2020 manufactured by ANSYS, using a pressure-based solver. The two-phase flow model was used here because of the potential for hydrogen peroxide to exceed its boiling point after heat absorption. In order to work properly for the engine cooling channels, no gas should be present in the cooling channels. The gas will cause an increase in the pressure drop and thus affect the engine injection and combustion. The two-phase flow medium model utilized temperature and density to express pressure, internal energy, enthalpy, entropy, specific heat capacity at constant volume, specific heat capacity at constant pressure, Helmholtz free energy, Gibbs free energy, etc. That is, in this study, it was assumed that the medium was homogeneous and met the above model.
Step 1: Given the initial temperature distribution on the gas-side wall of the thrust chamber, the turbulent combustion, flow, and heat transfer inside the thrust chamber were simulated numerically, and the heat flow distribution on the gas-side wall was obtained after convergence. It refers to the combustion flow field in the thrust chamber.
Step 2: Using the heat flow distribution obtained in step 1 as the boundary condition, the whole-field direct coupling scheme was used to calculate the coupled heat transfer of the coolant and cooling channel, and the new temperature distribution of the gas-side wall was obtained after the calculation. It refers to the cooling heat transfer in the cooling channels.
Step 3: Given the newly obtained boundary temperature distribution from step 2, the turbulent combustion, flow, and heat transfer in the thrust chamber were again simulated numerically, and the new heat flow distribution on the gas-side wall was obtained as a result.
Step 4: Steps 2 and 3 were repeated until the temperature and heat flow distribution on the boundary satisfied the convergence criterion. That is, the temperature and heat flow on the gas-side wall in two successive iterations were basically constant. The heat flow and temperature change rate were no more than 4% as the convergence criterion, considering the time cost and accuracy.
2.3. Working Condition Setting
In this study, the influence of the thrust chamber structure parameters of the cooling channel on the cooling effect was investigated, and the influence law was analyzed by changing the rib height, rib width, and inner wall thickness. The details of the calculation cases in this study are shown in
Table 1. The coolant flow was 353 g/s, and it was maintained. The variables were rib height, rib width, and inner wall thickness.
3. Models and Methods
3.1. Liquid-Phase Models
For the combustion chamber, the fuel is injected as a liquid, while the oxidizer is injected as a gas. In this study, the liquid-phase substances are described using the Lagrangian method. That is, the discrete phase model is used to describe the motion of liquid droplets. The method is concerned with fluid masses rather than spatial points in the computational domain. The idea is to track the motion of each mass throughout the flow and record each physical quantity and its change at each moment and each spatial point of each mass. The droplet equation can be viewed as the liquid phase control equation, and the droplet equation is shown in Equations (1) and (2) [
37,
38]:
where
is the number of droplets in size group
of the propellant element of
,
is the mass flow rate of the propellant element of
,
is the mass fraction of droplets in size group
of the propellant element of
,
is the density of droplets in size group
of the propellant element of
, and
is the particle size of droplets in size group
of the propellant element of
.
The momentum equation for droplets of different size groups is as follows. Because of the large order of magnitude difference, factors affecting droplet momentum such as pressure gradient, Magnus force, Saffman lift, and gravity are usually negligible.
In the above equation, is the resistance coefficient; , , and are the components of gas phase velocity on each axis; , , and are the components of droplet velocity on each axis.
The calculation of the coefficient of resistance is shown in Equation (3), which has a wide range of application and can be calculated accurately for both combustible and noncombustible droplets. The injector in this study was the lateral injection form, so a uniform initial particle size distribution model was chosen.
3.2. Turbulence Combustion Model and Chemical Reaction Mechanism
In the combustion chamber of a rocket engine, complex flows and chemical reactions take place. The realizable
model can satisfy some mathematical constraints for Reynolds stress in turbulent flow. It is more realistic than the Standard
model and is commonly used in the analysis of rotational flow, free flow in injection and mixed layers, pipes, and boundary layer flow [
39]. The equation and the model are more realistic than the Standard model. The equation
and equation
are shown in Equations (4) and (5) [
40]:
where
, , .
In these equations, represents the generation of turbulence kinetic energy owing to the mean velocity gradients, is the generation of turbulence kinetic energy because of buoyancy, represents the contribution of the fluctuating dilatation in compressible turbulence to the overall dissipation rate, and are the turbulent Prandtl numbers for , and , , and are source terms.
The model constants in these equations are as follows:
, , , .
The eddy viscosity,
, is computed from Equation (6), and
is no longer constant, which is computed from Equation (7) [
40].
In order to couple turbulence and chemical reactions, the model of the eddy dissipation concept (EDC) is used. In this model, the generation of turbulent kinetic energy occurs mainly between the main flow and the large-scale eddy structure. The dissipation of turbulent kinetic energy occurs only with very small-scale and well-mixed eddy structures, so the structure is also called the dissipation zone. There is energy transfer between eddy structures of different scales and there is energy dissipation during the energy transfer. Chemical reactions occur in turbulent structures with suitable scales, which are determined based on the volumetric ratio:
where
is the volume ratio constant and
is the kinematic viscosity. In addition to the spatial scale, the time scale is also necessary for the chemical reaction to occur:
where
is the time scale constant.
Chemical reaction mechanisms can be divided into several categories, such as lump-sum reaction mechanisms, simplified mechanisms, skeleton mechanisms, and detailed mechanisms. The lump-sum reaction mechanism is very simple and can be considered a single-step reaction. That is, the initial reactants are considered the final products after a one-step reaction, and there is no process of intermediate reactions. This reaction mechanism has a large error and is only suitable for engineering tasks that do not require high precision [
41].
The skeleton mechanism and the detailed mechanism are very complex. For kerosene mechanisms, the skeleton mechanism often contains dozens of components and hundreds of reactions, while the detailed mechanism can also describe in detail the processes of kerosene cracking, polymerization, oxidation, carbon soot generation, etc. Although they are more accurate and more realistic, the computational resources required are huge.
The simplified mechanism model is more complex than the lump-sum reaction mechanism, but the accuracy is better than the lump-sum reaction mechanism and requires fewer computational resources than the skeleton mechanism and the detailed mechanism. Since hydrogen peroxide will react to oxygen and water vapor after decomposition in the catalytic bed, a simplified 10-component 10-step reaction mechanism of oxygen and kerosene was used in this study to perform the calculations.
The 10-component 10-step mechanistic chemical reaction steps are listed in
Table 2 [
42,
43]. The ignition delay of the mechanism as compared with the experimental data, and the combustion temperature and component of the mechanism as compared with the NASA CEA were investigated [
42]. The ignition delay time at 20 atm and 30 atm conditions was basically consistent with the experimental data, and its error was within 20 μs. With the increase in temperature, the ignition delay time decreased significantly. At the same time, the ignition delay time also decreased slightly with the increase in the pressure. The combustion temperature with the mechanism at 20 bar was 3393.57 K, which was very close to the calculated temperature of 3395.20 K under chemical equilibrium conditions. In addition, the error rate of the components of the combustion products for both was within 1%. Therefore, it was reasonable to use the mechanism for the combustion process in this study.
3.3. Mesh Independence and Experiment Validation
Since the fluid–solid interface must exchange data frequently during the iterative computation, a local mesh densification was performed for the fluid–solid interface in order to improve the accuracy. At the same time, the meshes of the two regions needed to be generated integrally to ensure that the nodes at the intersection of the two computational domains corresponded to each other for data transfer between them. The specific mesh regions of combustion flow field and regenerative cooling channel are shown in
Figure 6 and
Figure 7.
Mass flow inlet was used for the oxidizer. The fuel was set to a discrete phase model, given the flow rate at rated operating conditions. The nozzle outlet was at a pressure, given an atmospheric ambient. The wall boundary condition was set to a no-slip wall. For the turbulent flow of fluid in the thrust chamber, the realizable k-epsilon turbulence model was used, and the standard wall function method was selected to deal with the transfer of physical quantities in the core and near-wall regions. For the choice of chemical dynamic model, the eddy dissipation concept model was used to solve the coupling problem of turbulence and chemical reaction. The finite volume method was applied to the set of control equations, and the least squares cell based was selected to deal with the gradient in the spatial discretization.
For the regenerative cooling problem of the rocket engine with hydrogen peroxide and kerosene in this study, the chemical reaction and turbulent flow were very complicated, so the simulation considered the mesh size as well as the mesh quality, both of which will affect the calculation results to some extent. Therefore, before the simulation, it was necessary to verify the mesh independence. In this study, a part of the combustion flow field was selected for the mesh independence verification. A consistent mesh generation method was used to generate different numbers of meshes, and the final adjusted number of mesh elements were 500,000, 800,000, and 1,360,000, corresponding to three accuracies of coarse, medium, and fine, respectively.
The combustion chamber pressure was 2.0 MPa, the flow rate of hydrogen peroxide was 353 g/s, and the mixing ratio of hydrogen peroxide and kerosene was 7.5. Keeping the model settings, initial conditions, and boundary conditions consistent, the combustion flow field simulations were carried out for the above three meshes, and the calculation results were analyzed. After convergence of the algorithm, the temperature on the engine axis was extracted, and the specific values are shown in
Figure 8. It can be seen that the temperature curves obtained from the three meshes had the same trend. However, the difference between the results of the coarse mesh and the other two meshes was relatively large, while the results of the fine mesh and the medium mesh were very close. Taken together, the global size of the coarse mesh was larger and the calculation accuracy was lower, while the fine and medium meshes had less influence on the calculation accuracy. In order to improve the computational efficiency, the medium mesh was selected for the regenerative cooling problem of the hydrogen peroxide and kerosene engine.
In order to verify the accuracy of the simulation, hot tests of the thrust chamber with hydrogen peroxide and kerosene were conducted. The thrust chamber object, ignition combustion, and combustion chamber pressure curves for the test are shown in
Figure 9. The thrust chamber was made of stainless steel rather than copper, which has higher thermal conductivity, mainly because copper is incompatible with hydrogen peroxide. The structural dimensions of the regenerative cooling channels were the same as those in the simulation. The propellant used for cooling was 90% hydrogen peroxide, and the flow rate was the same as that in the simulation, which was 353 g/s. The mixing ratio of hydrogen peroxide to kerosene was 7.5, which was the best condition for combustion.
In total, three 30 s hot tests were carried out, and each hot test contained a single-component catalytic process of hydrogen peroxide and an ignition and combustion process of hydrogen peroxide and kerosene. The pressure curves in the tests are shown in
Figure 9d. The combustion chamber pressure rose instantaneously at the moment of catalysis and ignition, indicating that the start-up process was rapid. The combustion chamber pressure remained stable after the ignition, indicating that the combustion process of hydrogen peroxide and kerosene was smooth and there was no significant damage in the nozzle throat. The above conclusions are also illustrated by the combustion flame in
Figure 9b and the inner wall after the test in
Figure 9c. The overlap of the combustion chamber pressure curves for the three 30 s hot tests was high, indicating good repeatability of the tests.
The heat flux at the nozzle throat was measured during the three 30 s hot tests, and the experiment and simulation are shown in
Table 3. According to Fourier’s law, the heat flux was calculated by the temperature of the metal at different depths at the throat. The temperature sensor was the customized product adopting the K-type thermocouple with the accuracy reaching 0.4% FS. Four measurement points were evenly distributed around the circumference of the nozzle throat, called top, bottom, left, and right. The heat flux at the nozzle throat was the highest in the thrust chamber, and the most dangerous location in the thrust chamber was also at the nozzle throat. The heat flux at different locations around the nozzle throat circumference was basically similar, indicating good uniformity. The average heat flux of the different tests was also close, indicating good consistency. The average heat flux was 9.502 × 10
6 W/m
2 and the uncertainty was around 0.043 × 10
6 W/m
2. The heat flux of the simulation had an error rate of approximately 3% compared to the three 30 s hot tests, revealing the accuracy of the simulation.
4. Results and Discussion
4.1. The Influence of Rib Height on Cooling Effect
In order to investigate the influence of rib height on the regenerative cooling effect of rocket engines with hydrogen peroxide and kerosene, the other structure parameters were kept constant while the rib heights were 0.75, 1.00, and 1.25 mm in this study. The model settings and boundary conditions used in this process were consistent in the different cases.
In this study, the flow rate of hydrogen peroxide was 353 g/s, and the mixing ratio of hydrogen peroxide and kerosene was 7.5. The simulation was carried out for the flow field inside the combustion chamber with the rated operating conditions of rib height, rib width, and the inner wall thickness.
Figure 10a,b shows the contours of pressure distribution and temperature distribution, respectively. The pressure distribution and temperature distribution were clearly stable. The pressure decreased gradually from the injector to the nozzle, and the combustion chamber pressure was about 2 MPa. The thrust chamber had a low-temperature zone near the injector, and the gas reached its maximum temperature in the combustion chamber. The distribution of pressure and temperature was in accordance with the general law of rocket engines. The pressure and temperature of the combustion chamber were consistent with the design value and the theoretical value, which indicated that the calculation of the combustion was reasonable.
Figure 10c shows the contour of heat flux distribution near the thrust chamber wall. The heat flux distribution was stable with a maximum value close to 9.3 MW/m
2. There were two zones of high heat flux at the nozzle throat and near the injector. The heat flux in the nozzle throat zone was the highest in the thrust chamber, which was also consistent with the general law of rocket engines. Because of the presence of the propellant, the heat flux in the zone closest to the injector panel was small. Therefore, the most dangerous zone in terms of heat flux was the nozzle throat.
Figure 11a shows the contour of the kerosene distribution. After the kerosene droplets were sprayed horizontally from the injector, they encountered the mixture of oxygen and water vapor at high temperature and underwent mixing, atomization, and evaporation, then were carried into the combustion chamber by the gas for the chemical reaction. Since the temperature of the gas produced by the decomposition of hydrogen peroxide is much higher than the self-ignition temperature of kerosene, the kerosene and the high temperature oxygen reacted rapidly in the combustion chamber. The chemical reaction of kerosene occurred about 5 mm from the injection panel, resulting in a large reduction in the kerosene component, which was completely consumed about 10 mm from the injection panel. Because the kerosene atomization, evaporation, and chemical reaction occurred within a relatively short period of time, the spraying distance was short, and the kerosene did not provide effective thermal protection of the panel, resulting in the poor thermal environment of the injector.
Figure 11b,c shows the contours of the oxygen distribution and carbon monoxide distribution, respectively. In the zone close to the injector, the injector could decrease the flow area and increase the velocity of propellant, and the oxidizer was injected quickly, which enabled the oxygen in the zone to be injected into the cylindrical section of the combustion chamber. With the rapid atomization and evaporation of the kerosene, the oxygen rapidly reacted with it chemically to produce carbon monoxide and hydrogen. As seen in the temperature contour in
Figure 10, although the reaction was exothermic, the temperature gradient was relatively small, and the temperature of the thrust chamber rose slowly. There was a large accumulation of carbon monoxide in the head of the thrust chamber, as well as a clear stratification phenomenon. One part of the carbon monoxide was close to the wall of the combustion chamber, and the other part was located in the middle zone of the injector. The chemical reaction between carbon monoxide and oxygen basically occurred at the interface between the two. After the oxygen was completely depleted, the stratification of carbon monoxide disappeared. Combined with the temperature contour in
Figure 10 and the kerosene distribution, a large carbon monoxide consumption area corresponded to a rapid increase in the temperature area, indicating that the subsequent kerosene decomposition reaction was the main reason for the increase in thrust chamber temperature.
The heat flux of the intersection line between the wall and the cross-section at the near wall surface under different rib height conditions was extracted and plotted, as shown in
Figure 12. The heat flux distribution trends were very similar for the different rib heights, and the difference between the three curves was also very small. Therefore, the change in rib height had very little effect on the distribution of heat flux near the wall, which was neglected.
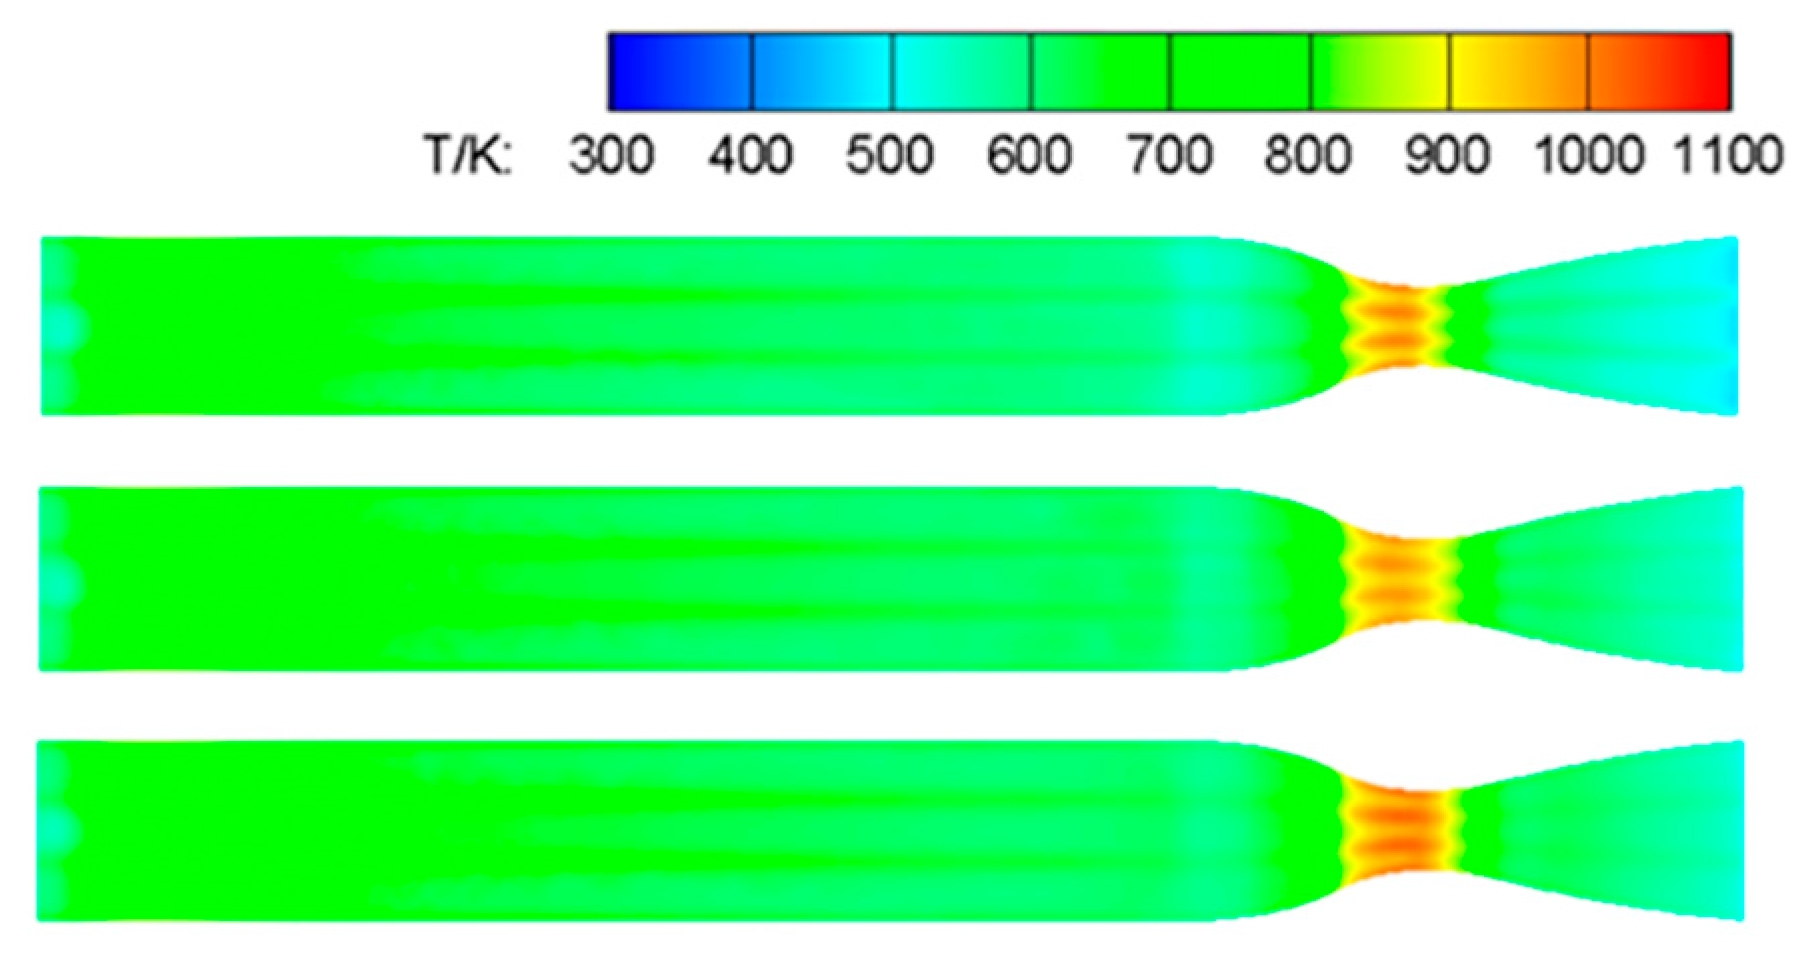
Figure 13 shows the temperature contours of the inner wall under different rib height conditions after regenerative cooling. Unlike the heat flux distribution, the high-temperature zone at the throat of the inner wall indicated a tendency of regional expansion as the rib height increased and was more obvious compared to the heat flux trend. There was also an obvious low-temperature zone at the outlet of the nozzle for the 0.75 mm rib height, with a temperature of about 450 K and a shape close to the cooling channel. The overall heat flux in this condition was small, and the narrowing of the rib height led to a higher coolant flow rate and enhanced heat transfer, resulting in the formation of a low-temperature zone.
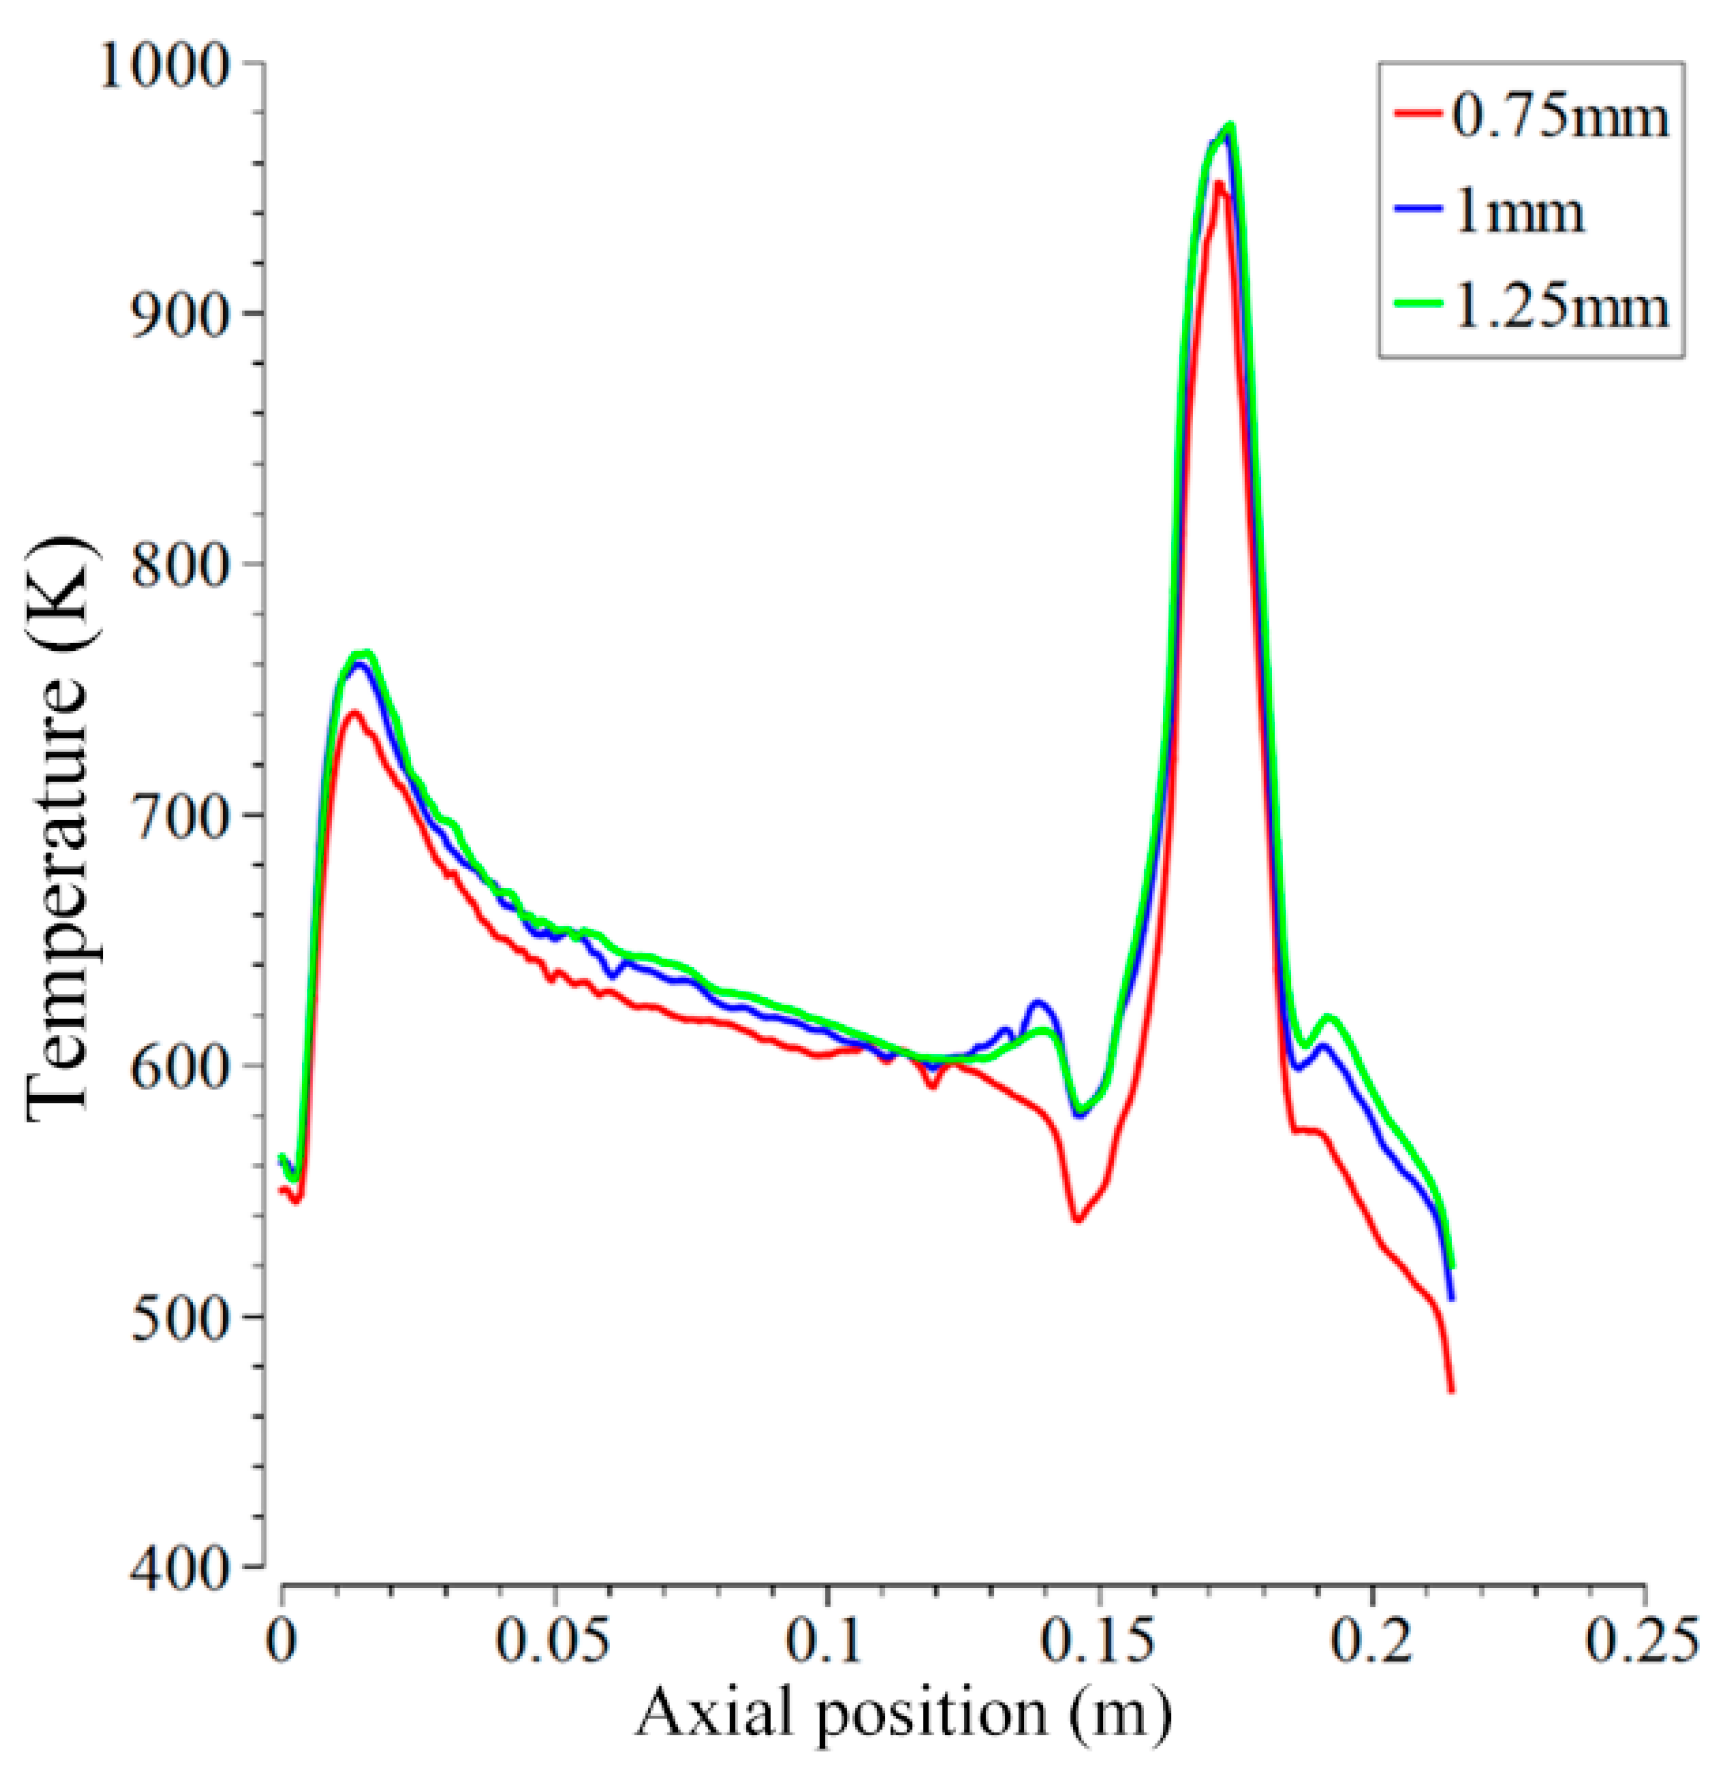
The engine inner wall temperature on the symmetrical section through the oxidizer injection hole was extracted, and the curve was plotted, as shown in
Figure 14. The temperature profiles of the three conditions showed the same trend; there were high-temperature zones in the throat because of the high heat flux and in the head because of the coolant temperature rise caused by the cooling efficiency decline in the high-temperature zone. In addition, in the head, the flow speed was decreased and thus the heat could transfer to the coolant fully. It was obvious that the increase in rib height weakened the heat exchange phenomenon in the cooling channel and made the wall temperature rise.
Figure 15a shows the wall temperature maxima for different rib heights and the average coolant outlet temperature. As seen in the figure, as the rib height increased, the temperature of the inner wall in the thrust chamber rose. However, the magnitude of the change was not large and basically stayed within 20 K. At the same time, with the increase in rib height, the average temperature of the coolant outlet had a relatively small decrease, and the amount of change was very small.
The heat transfer of regenerative cooling was affected by a combination of factors, including the contact area between the coolant and the cooling channel, the rib efficiency, and the degree of convective heat transfer. Under the premise of a constant rib width, increasing the rib height increased the entire cooling channel area and the contact area between the coolant and cooling channel, and the rib efficiency also increased, enhancing the heat transfer effect. At the same time, the coolant flow rate remained unchanged; increasing the cooling channel area led to a decrease in the coolant flow rate and a decrease in the convective heat transfer coefficient, thus decreasing the heat transfer and increasing the wall temperature to a certain extent. In this process, the influence of the latter dominated, so the increase in rib height weakened the heat exchange effect.
The coolant pressure drop for different rib height conditions is shown in
Figure 15b. The change in rib height significantly affected the pressure drop in the cooling channel. An increase in the rib height led to a decrease in the coolant pressure drop, and a decrease in the coolant flow speed, which had a positive effect on the thermal protection of the wall surface.
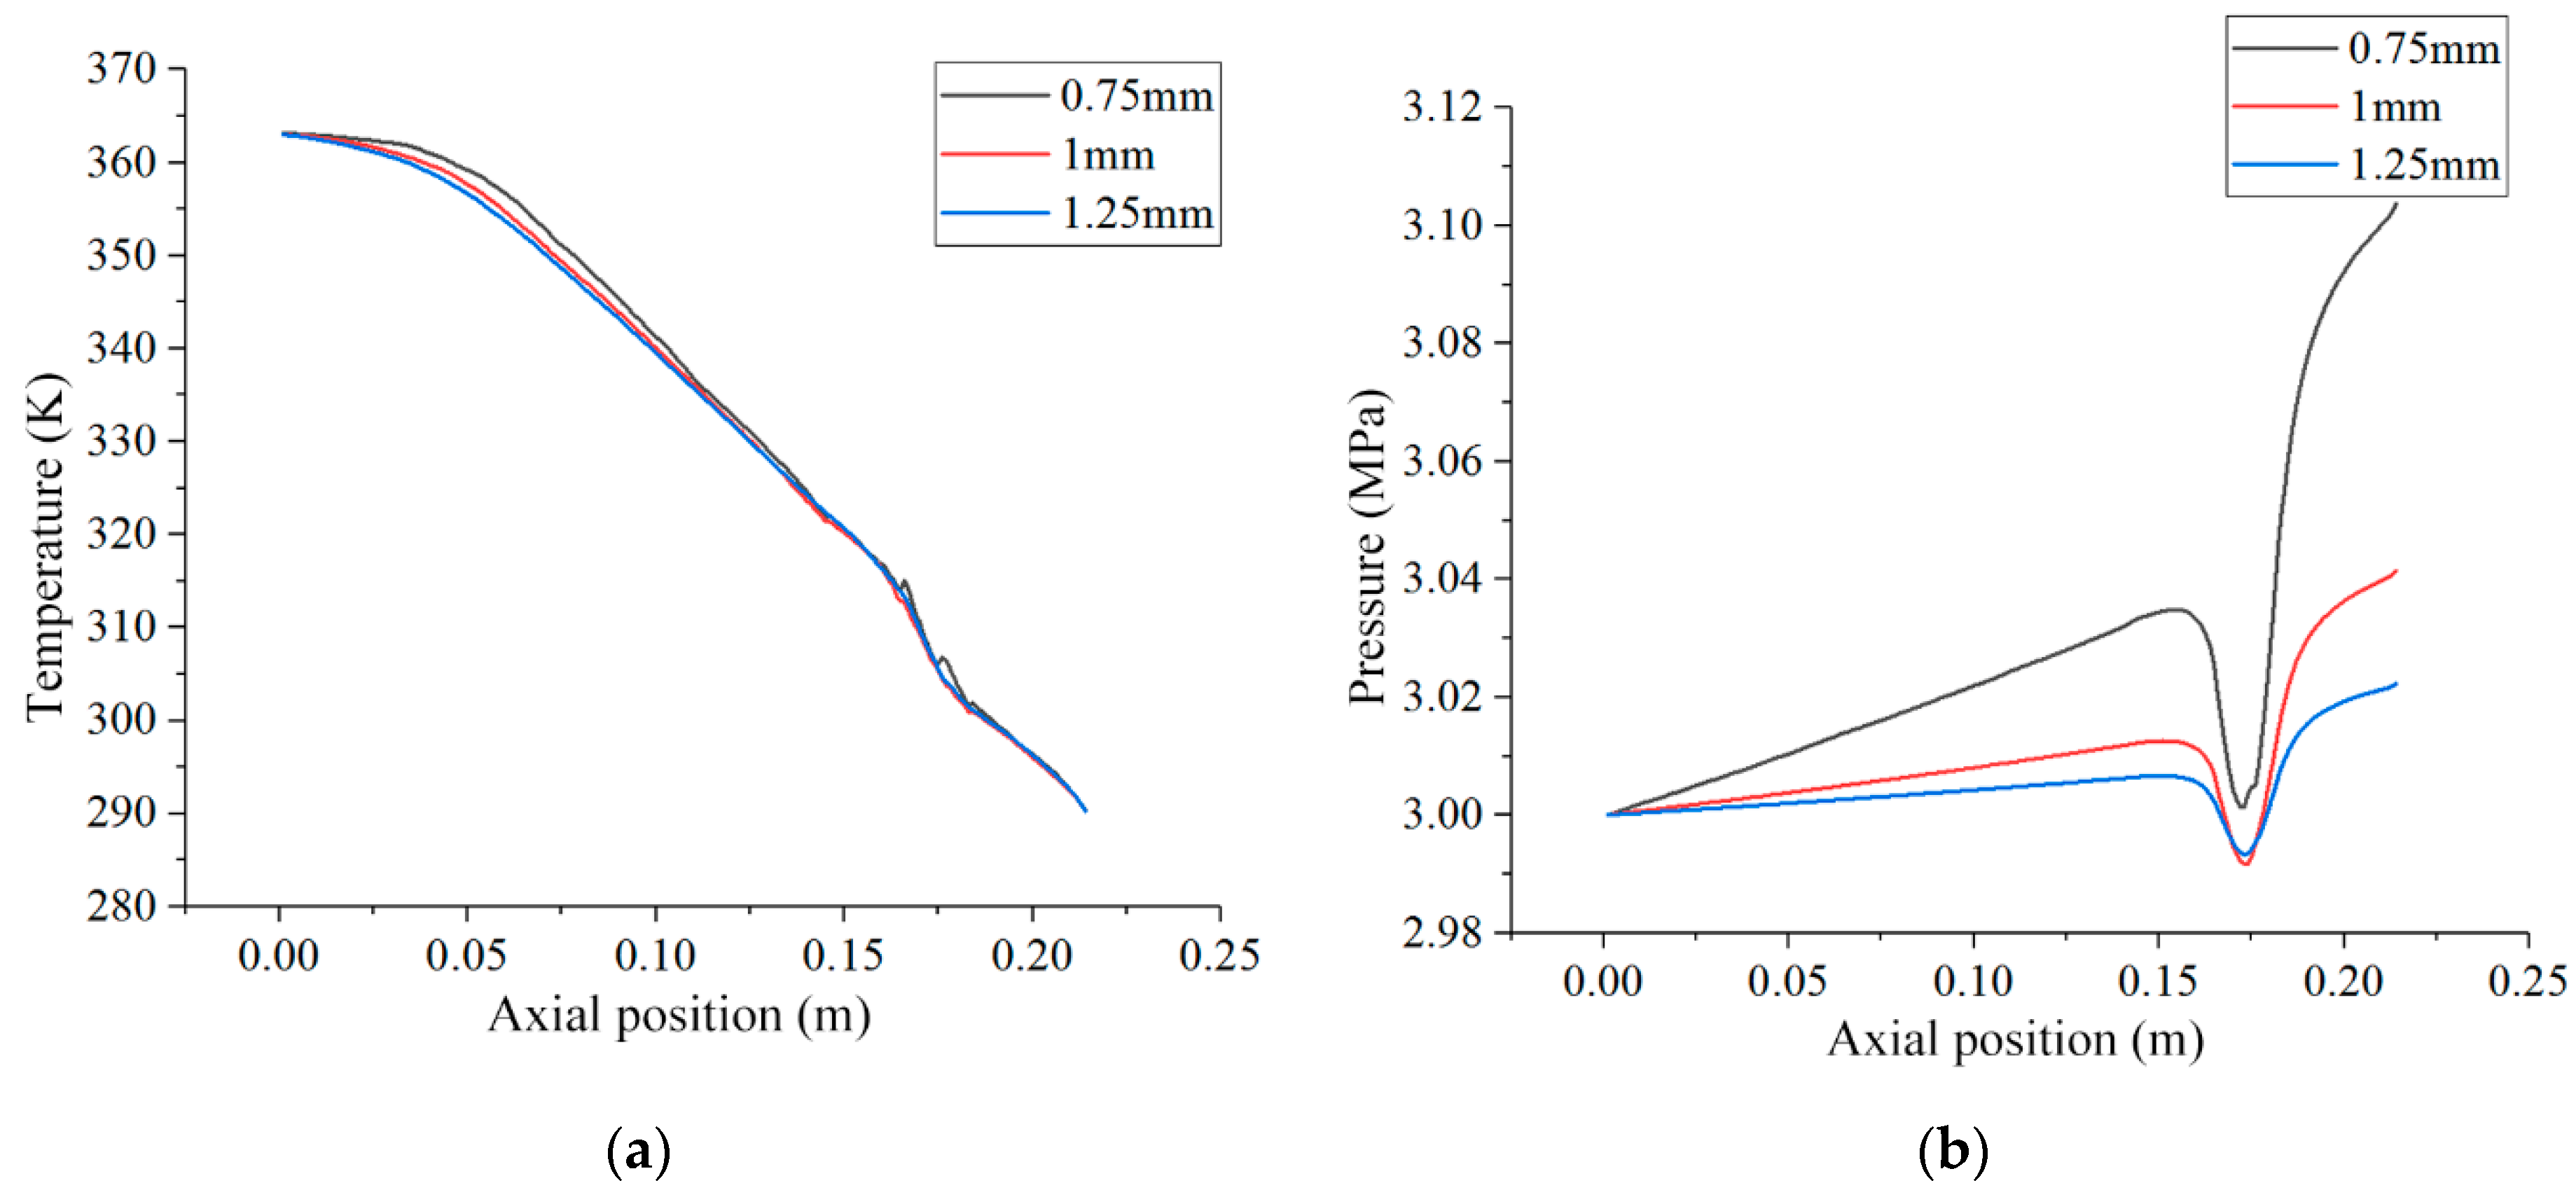
Figure 16 shows the temperature and pressure variation of the coolant along the course of different rib heights. It can be seen from the figure that the coolant temperature curves for the three operating conditions basically overlapped. There was a distinction near the head position and close to a coincidence at the outlet. The temperature rose fastest at the throat of the nozzle and slowly in the converging and expanding sections of the nozzle. The three conditions of the coolant along the pressure were clearly distinguished. The smaller the rib height, the faster the coolant flow rate and the greater the change in pressure drop along the range. The maximum difference in pressure reached 0.11 MPa.
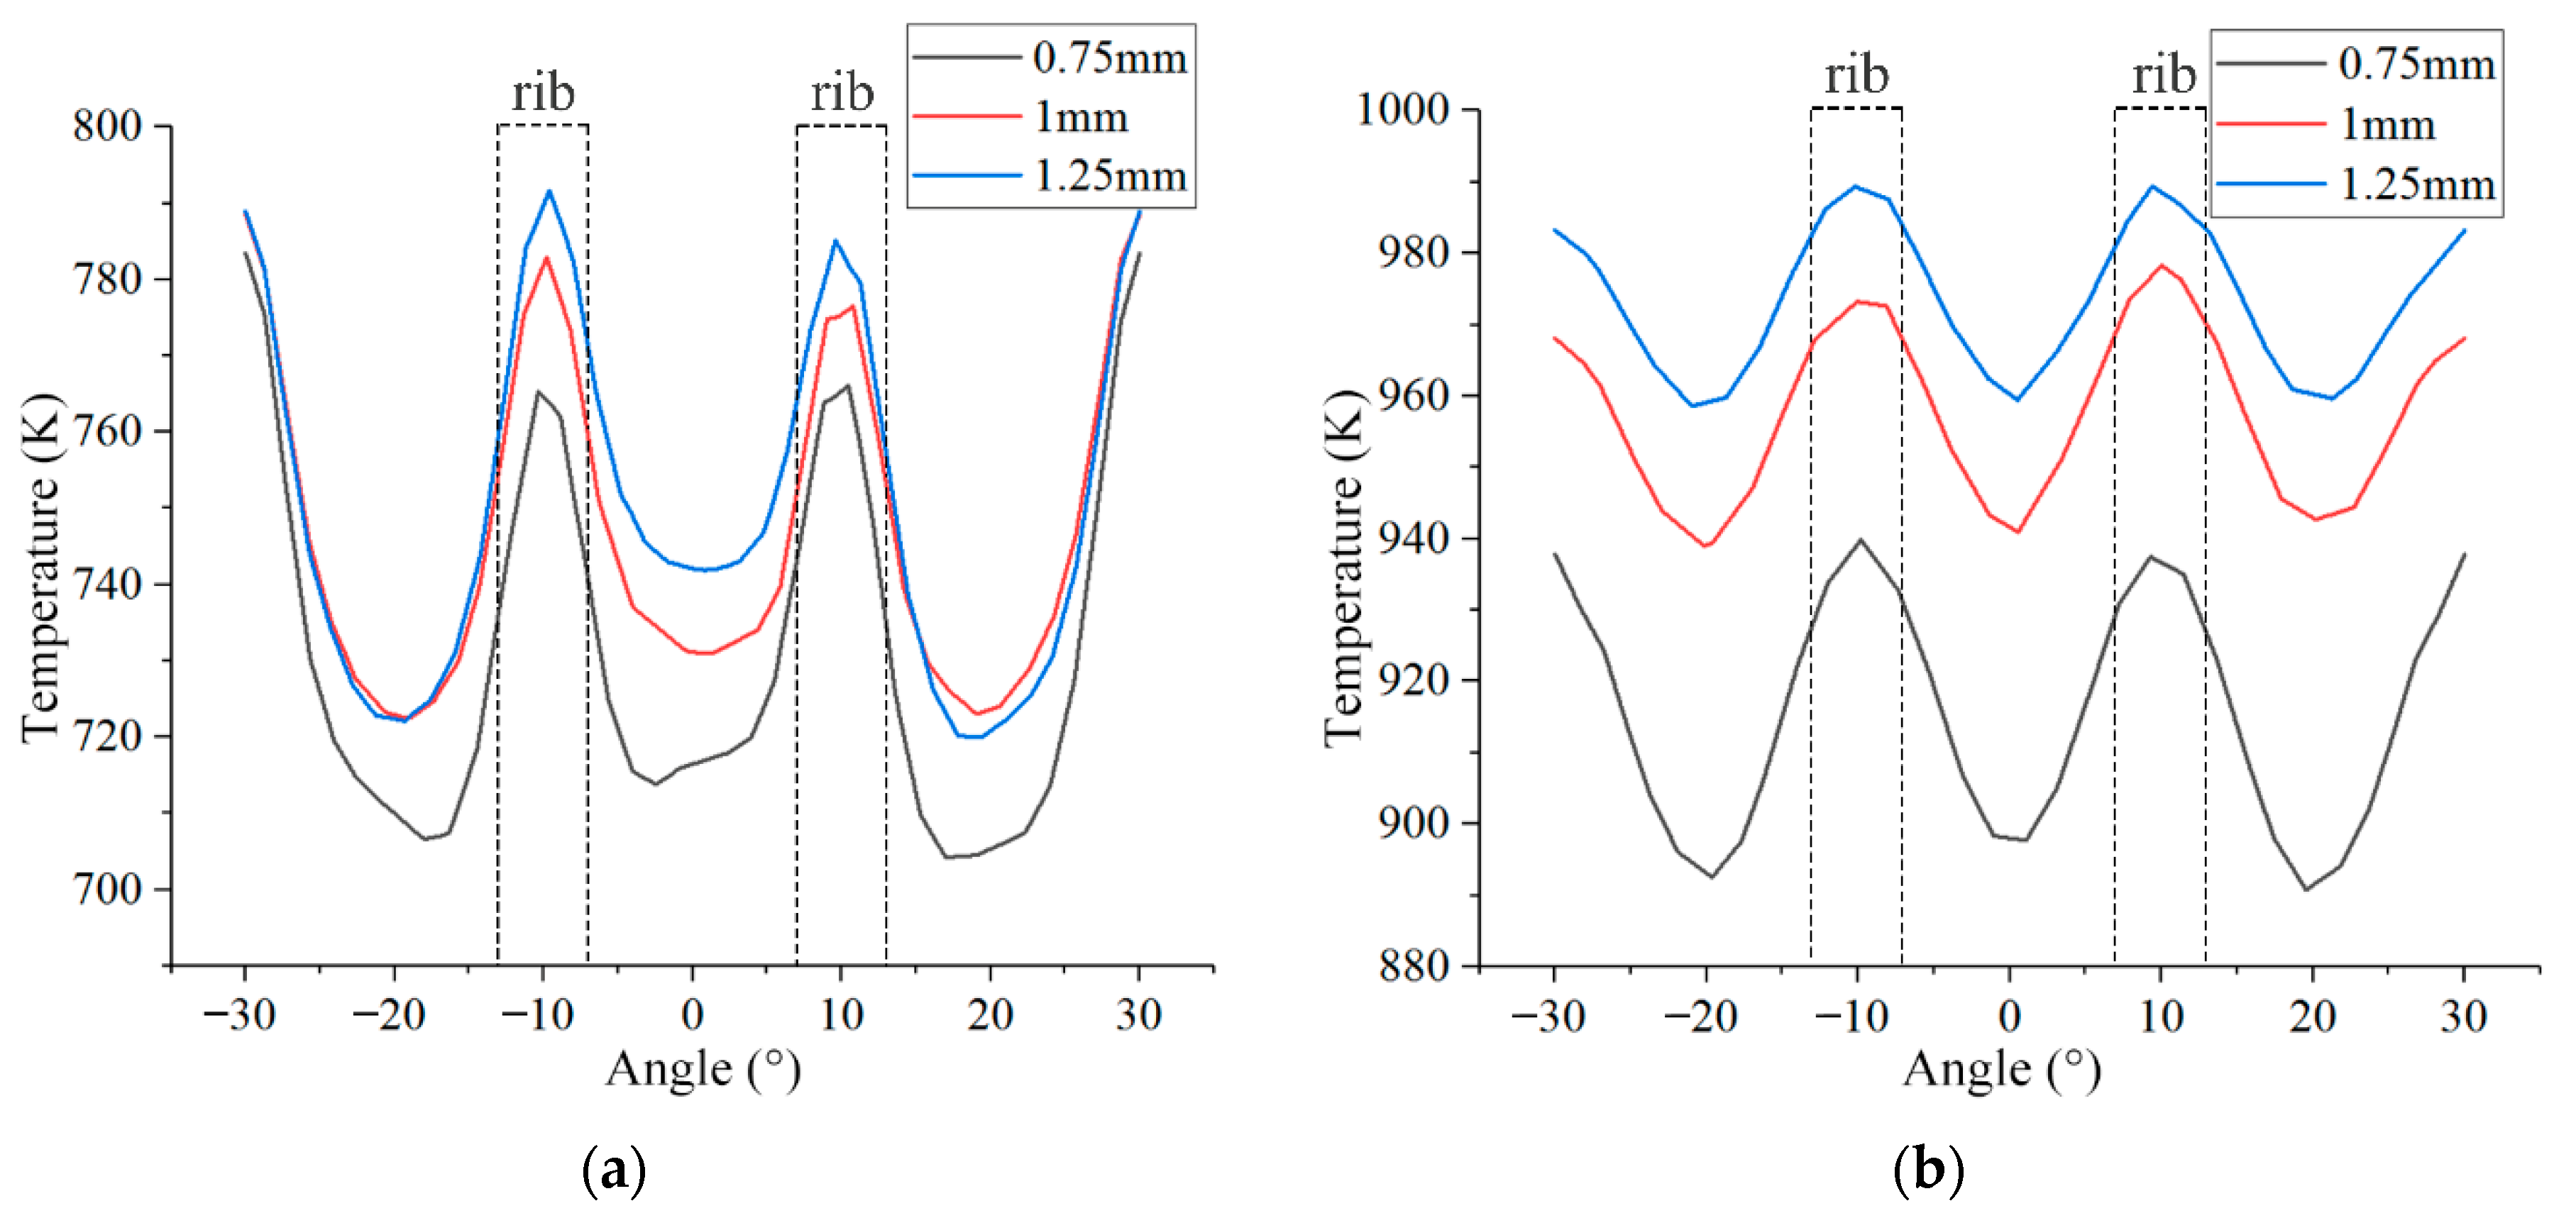
The temperatures of the inner wall near the head position (Z = 20 mm) and throat position (Z = 175 mm) were extracted and plotted, as shown in
Figure 17, to study the effect of rib height on the circumferential inhomogeneity of the temperature. The comparison of the two figures shows that the axial positions of the temperature maxima were the same, and both had extreme values at ±10° and ±30°. The minimum values appeared at 0° and ±20°, and the circumferential inhomogeneity was 50–70 K. By increasing the rib height, the circumferential inhomogeneity of the temperature near the throat position decreased, and the decrease was more pronounced in the throat than in the head position.
4.2. The Influence of Rib Width on Cooling Effect
In order to investigate the influence of rib width on the regenerative cooling effect of the rocket engines with hydrogen peroxide and kerosene, the other structure parameters were kept constant, and the rib widths were 1.5, 2.0, and 2.5 mm in this study. The model settings and boundary conditions used in this process were consistent in the different cases.
As when changing the rib height, the change in rib width did not affect the pressure field and temperature field of the engine. The distribution and the magnitude of the two values remained basically consistent, in keeping with the law obtained by changing the rib height. The heat flux distribution was also basically consistent for different rib width conditions. There were two high heat flux regions in the throat and the head of the combustion chamber.
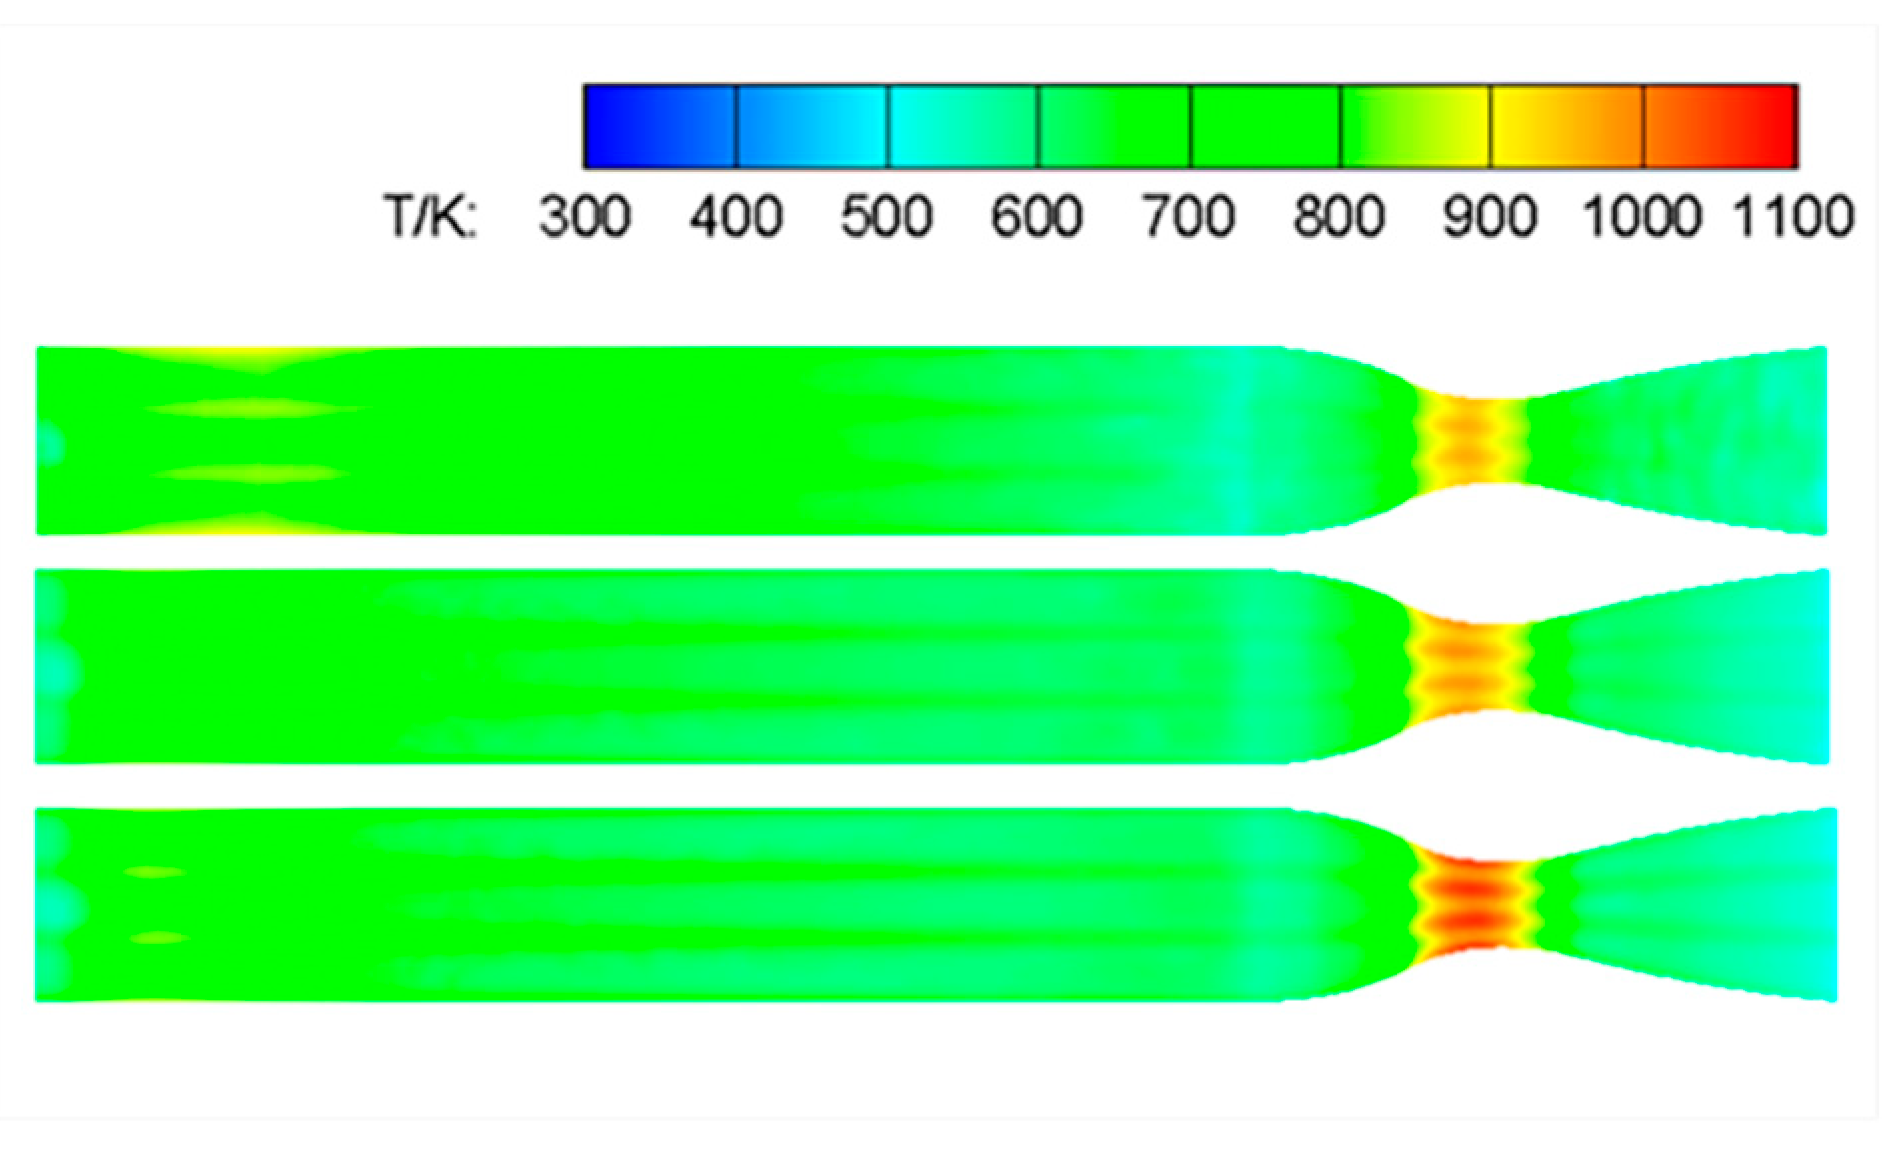
The most significant effect of the change in rib width was the temperature field at the inner wall.
Figure 18 shows the temperature contour of the inner wall under different rib width conditions. The temperature distribution of the inner wall under different rib widths was relatively consistent, but there were some differences. The high-temperature zone of the throat had an obvious trend of expansion and warming with the increase in rib width. The area of the throat high-temperature zone in the 2.5 mm rib width case was almost twice as large as that in the 1.5 mm rib width case. The overall temperature of the zone was significantly higher, indicating that the increase in rib width caused the deterioration of the regenerative cooling heat transfer in the throat area.
In addition, unlike the variable rib height condition, changing the rib width resulted in a certain degree of difference in the temperature distribution at the head wall of the combustion chamber. The high-temperature zone of the head wall in the low rib width condition expanded in the direction of the ribs, and the degree of expansion was negatively correlated with the rib width. This indicated that increasing the rib width improved the heat transfer in the head area.
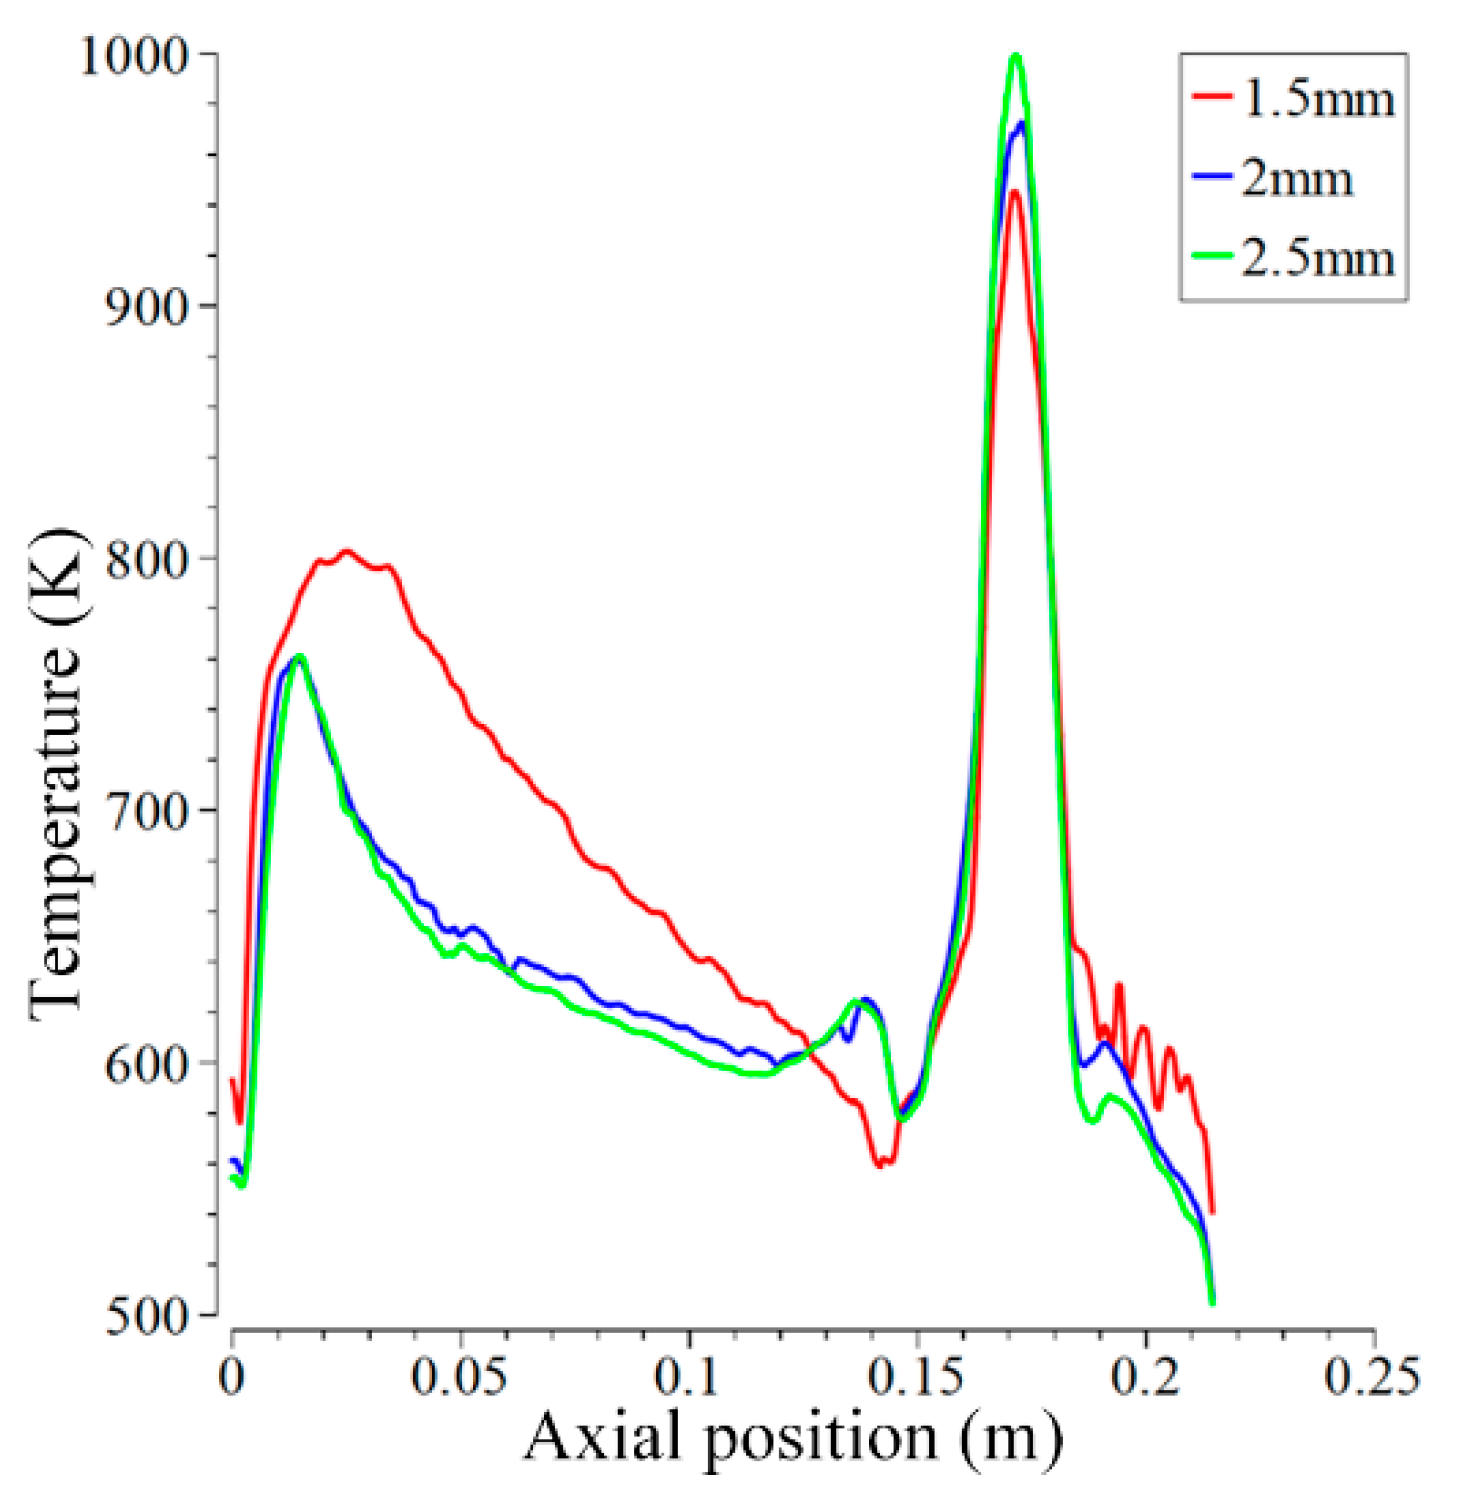
In order to observe more intuitively the distribution of the inner wall temperature under different rib width conditions, the wall temperature on the symmetric section passing through the injector was extracted and plotted in
Figure 19. In the wall of the cylindrical section of the thrust chamber, the large rib width improved the heat transfer of regenerative cooling, so the wall temperature decreased. The temperature under the 1.5 mm rib width was 30–50 K higher than the other two widths in this region, while the difference between the temperatures under the 2.5 mm and 2 mm rib widths was not significant, with an overall difference of about 10 K.
The wall surface in the middle and outlet of the converging section of the nozzle also followed the same temperature distribution pattern as the wall surface of the cylinder section. The larger the rib width, the lower the overall inner wall temperature. In the throat region, however, the wall temperature distribution law changed. The overall wall temperature in the region increased as the rib width increased. The difference was approximately 20 K.
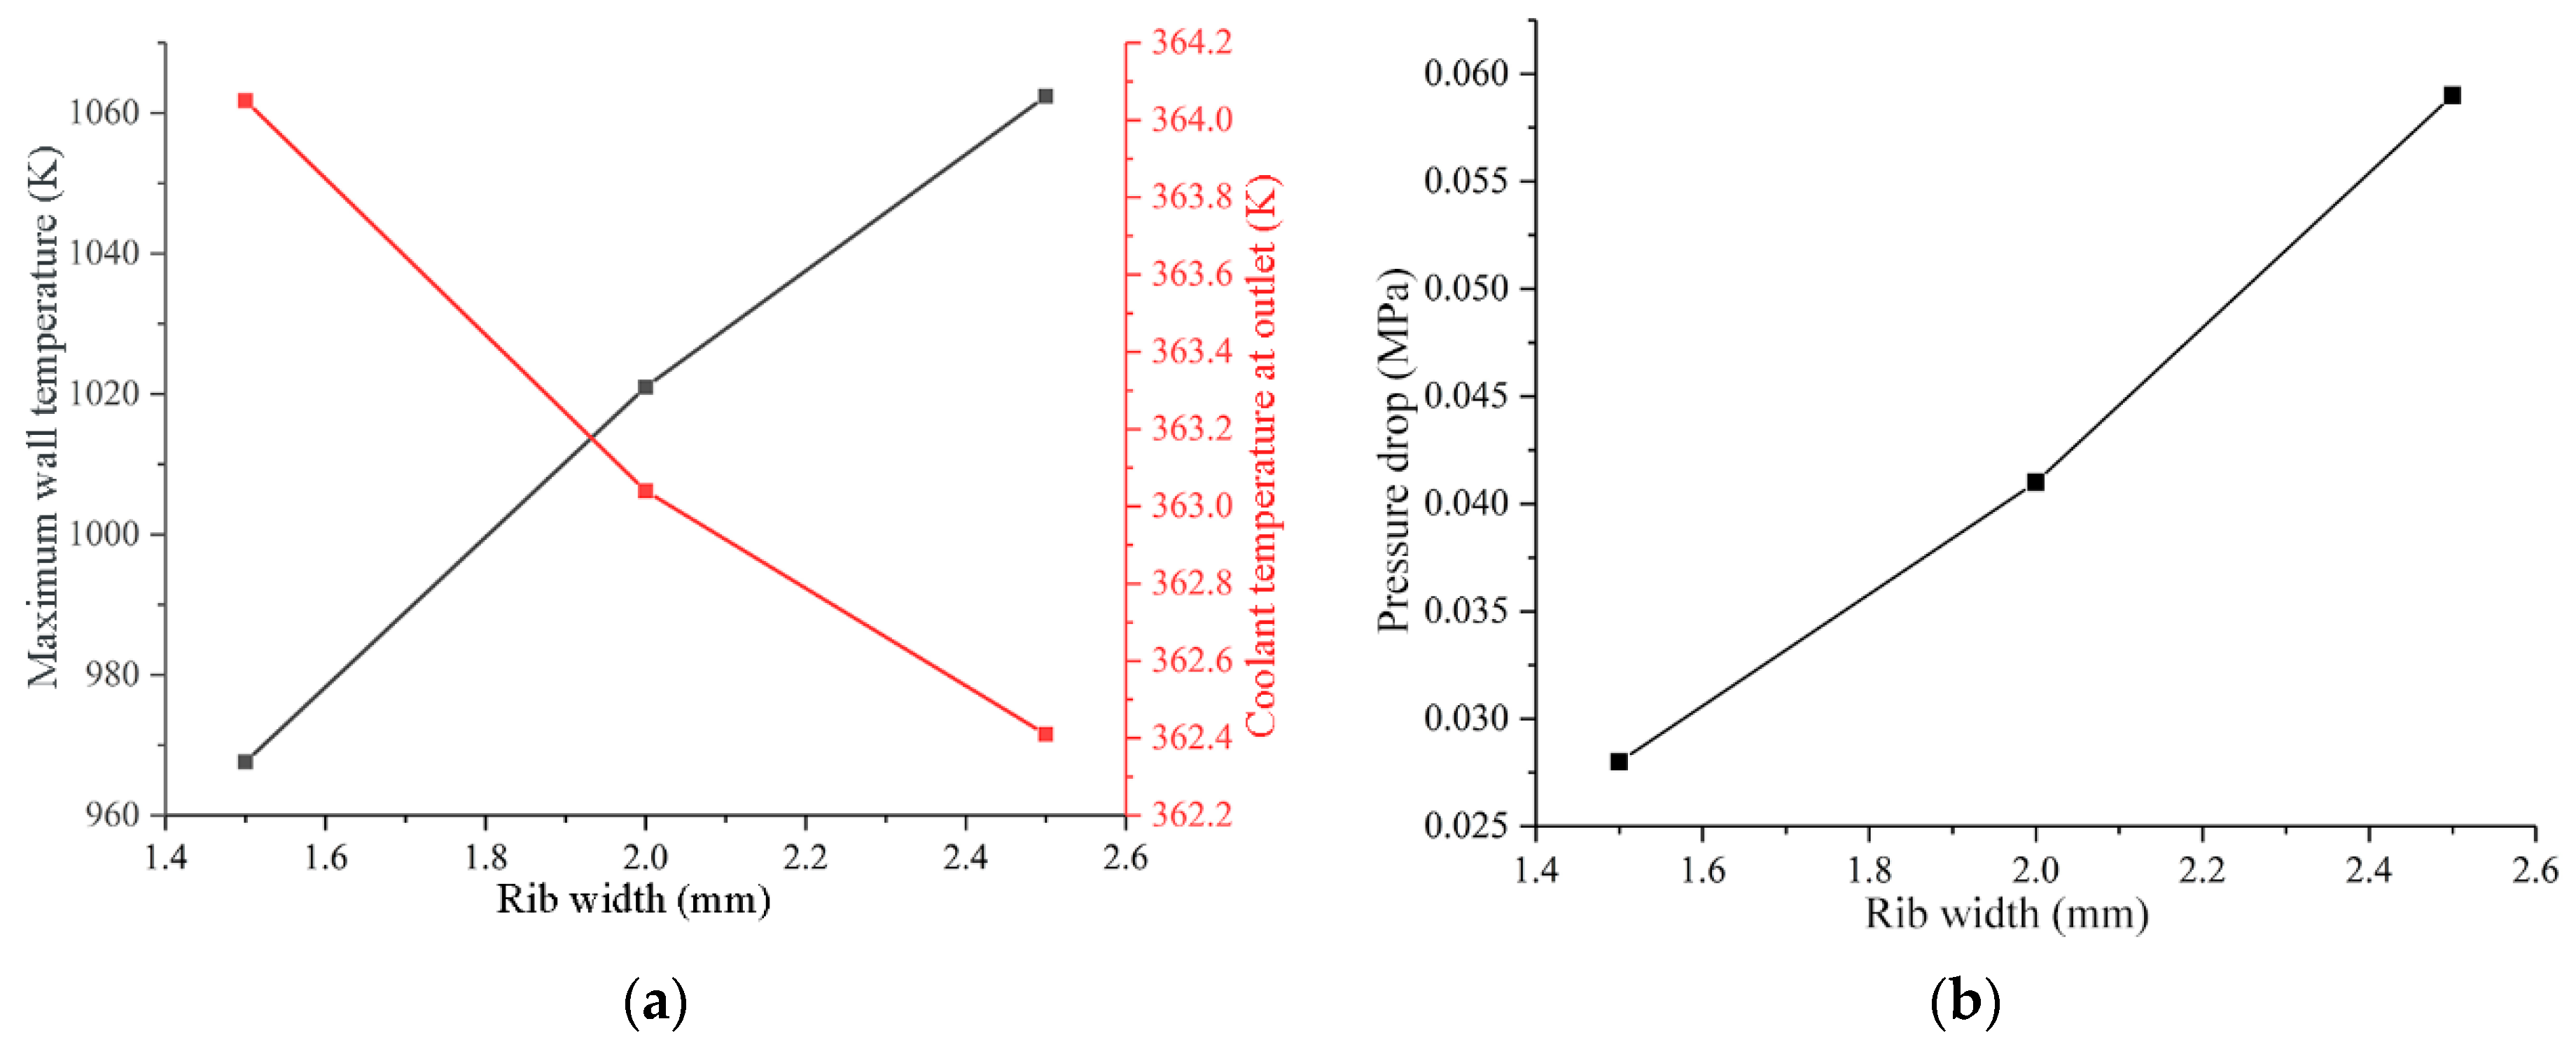
Figure 20 shows the wall temperature maxima at different rib width conditions as well as the average coolant outlet temperature and the coolant pressure drop. Combining the two figures, it can be concluded that with the increase in the rib width of the cooling channel, the maximum value of the temperature of the inner wall of the engine increased significantly. The average coolant outlet temperature decreased slightly, while the coolant pressure drop increased sharply. Increasing the rib width resulted in a decrease in the height-to-width ratio of the cooling channels while keeping the rib height constant. The coolant flow was accelerated by the reduced channel area, the convective heat transfer coefficient was increased, and the overall heat transfer effect was enhanced to some extent. This is also reflected in
Figure 19, which shows a small decrease in the overall temperature of the wall surface. In the throat area, because of the small diameter and compact structure, increasing the rib width caused the heat transfer area in the channel to decrease sharply. The effect was more prominent and dominant, so the maximum temperature of the wall surface showed a positive correlation with the rib width.
The degree of variation in wall temperature and average coolant outlet temperature for different rib width conditions was much more pronounced. The maximum wall temperature variation was around 50 K. The average coolant outlet temperature variation also increased. This was due to the small overall size of the engine used. Considering the small size and the low thermal conductivity, the cooling channel was designed with a lower aspect ratio, and the effect of changing the rib width on the aspect ratio was more pronounced than changing the rib height.
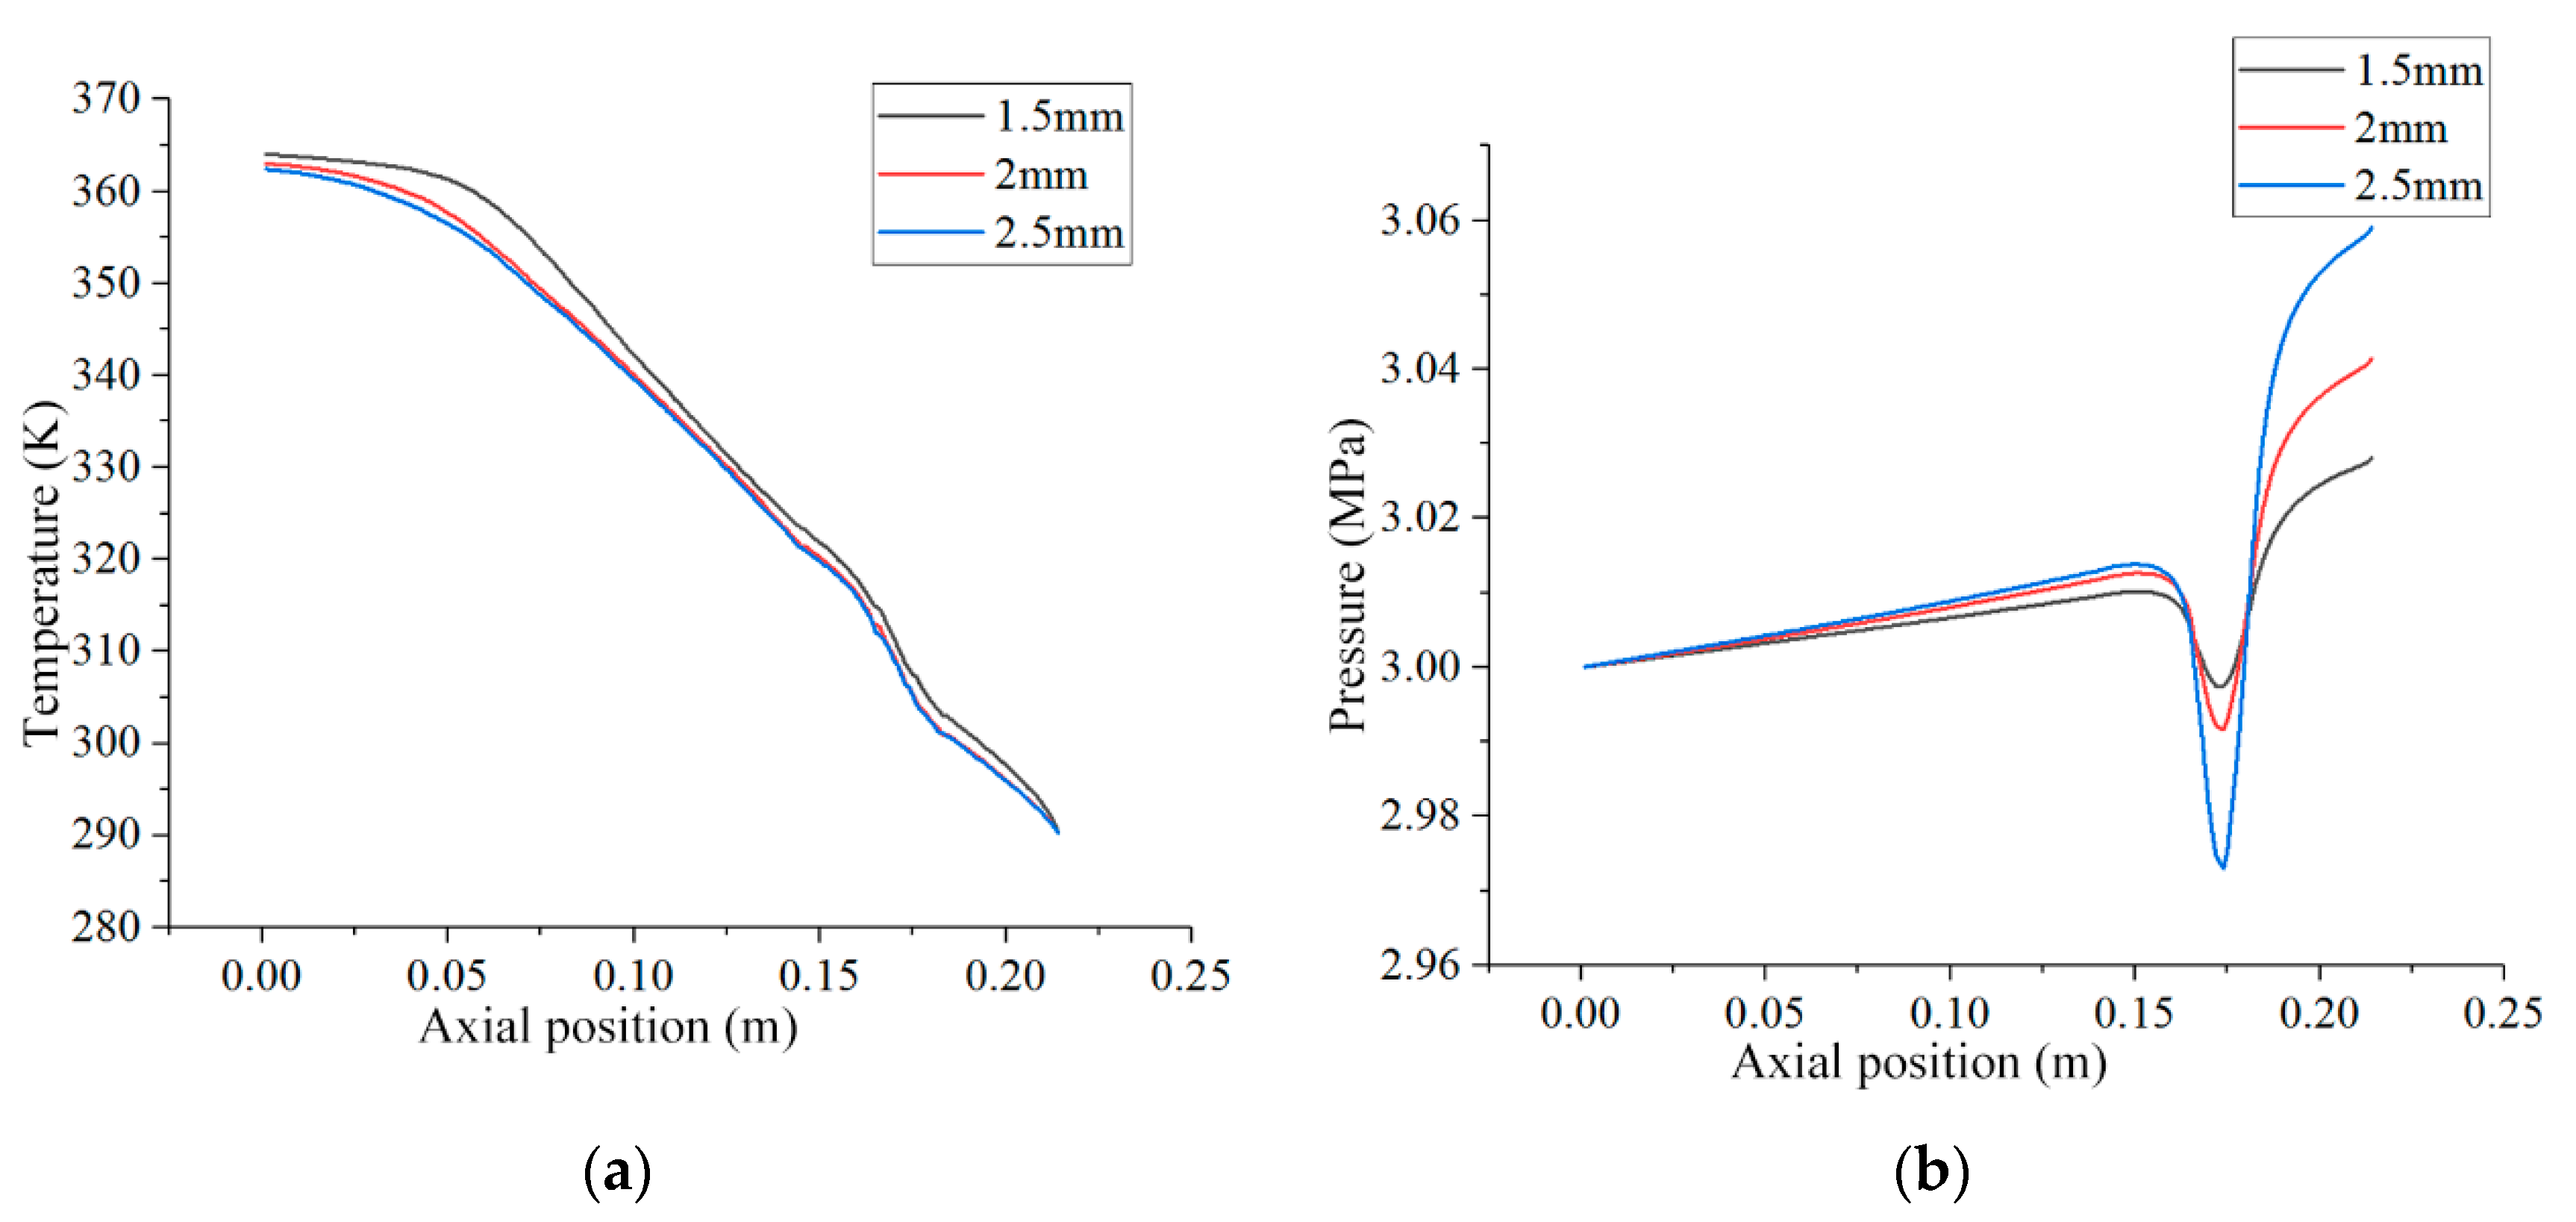
Figure 21 shows the temperature and pressure variation along the coolant for different rib widths. Under the three working conditions, the change patterns of the coolant temperature were similar. However, there was a certain distinction when changing the rib width, and the three did not basically overlap. The overall increase in temperature along the process when the rib width was 1.5 mm was more obvious than the other conditions. The smaller the rib width, the larger the cooling channel area, and the lower the coolant flow rate, the smaller the variation in pressure along the course. Compared with changing the rib height, the effect of changing the rib width on the change in coolant pressure along the process was relatively small. The maximum difference in pressure was about 0.08 MPa. The minimum pressure along the process was lower than the outlet pressure when changing the rib width.
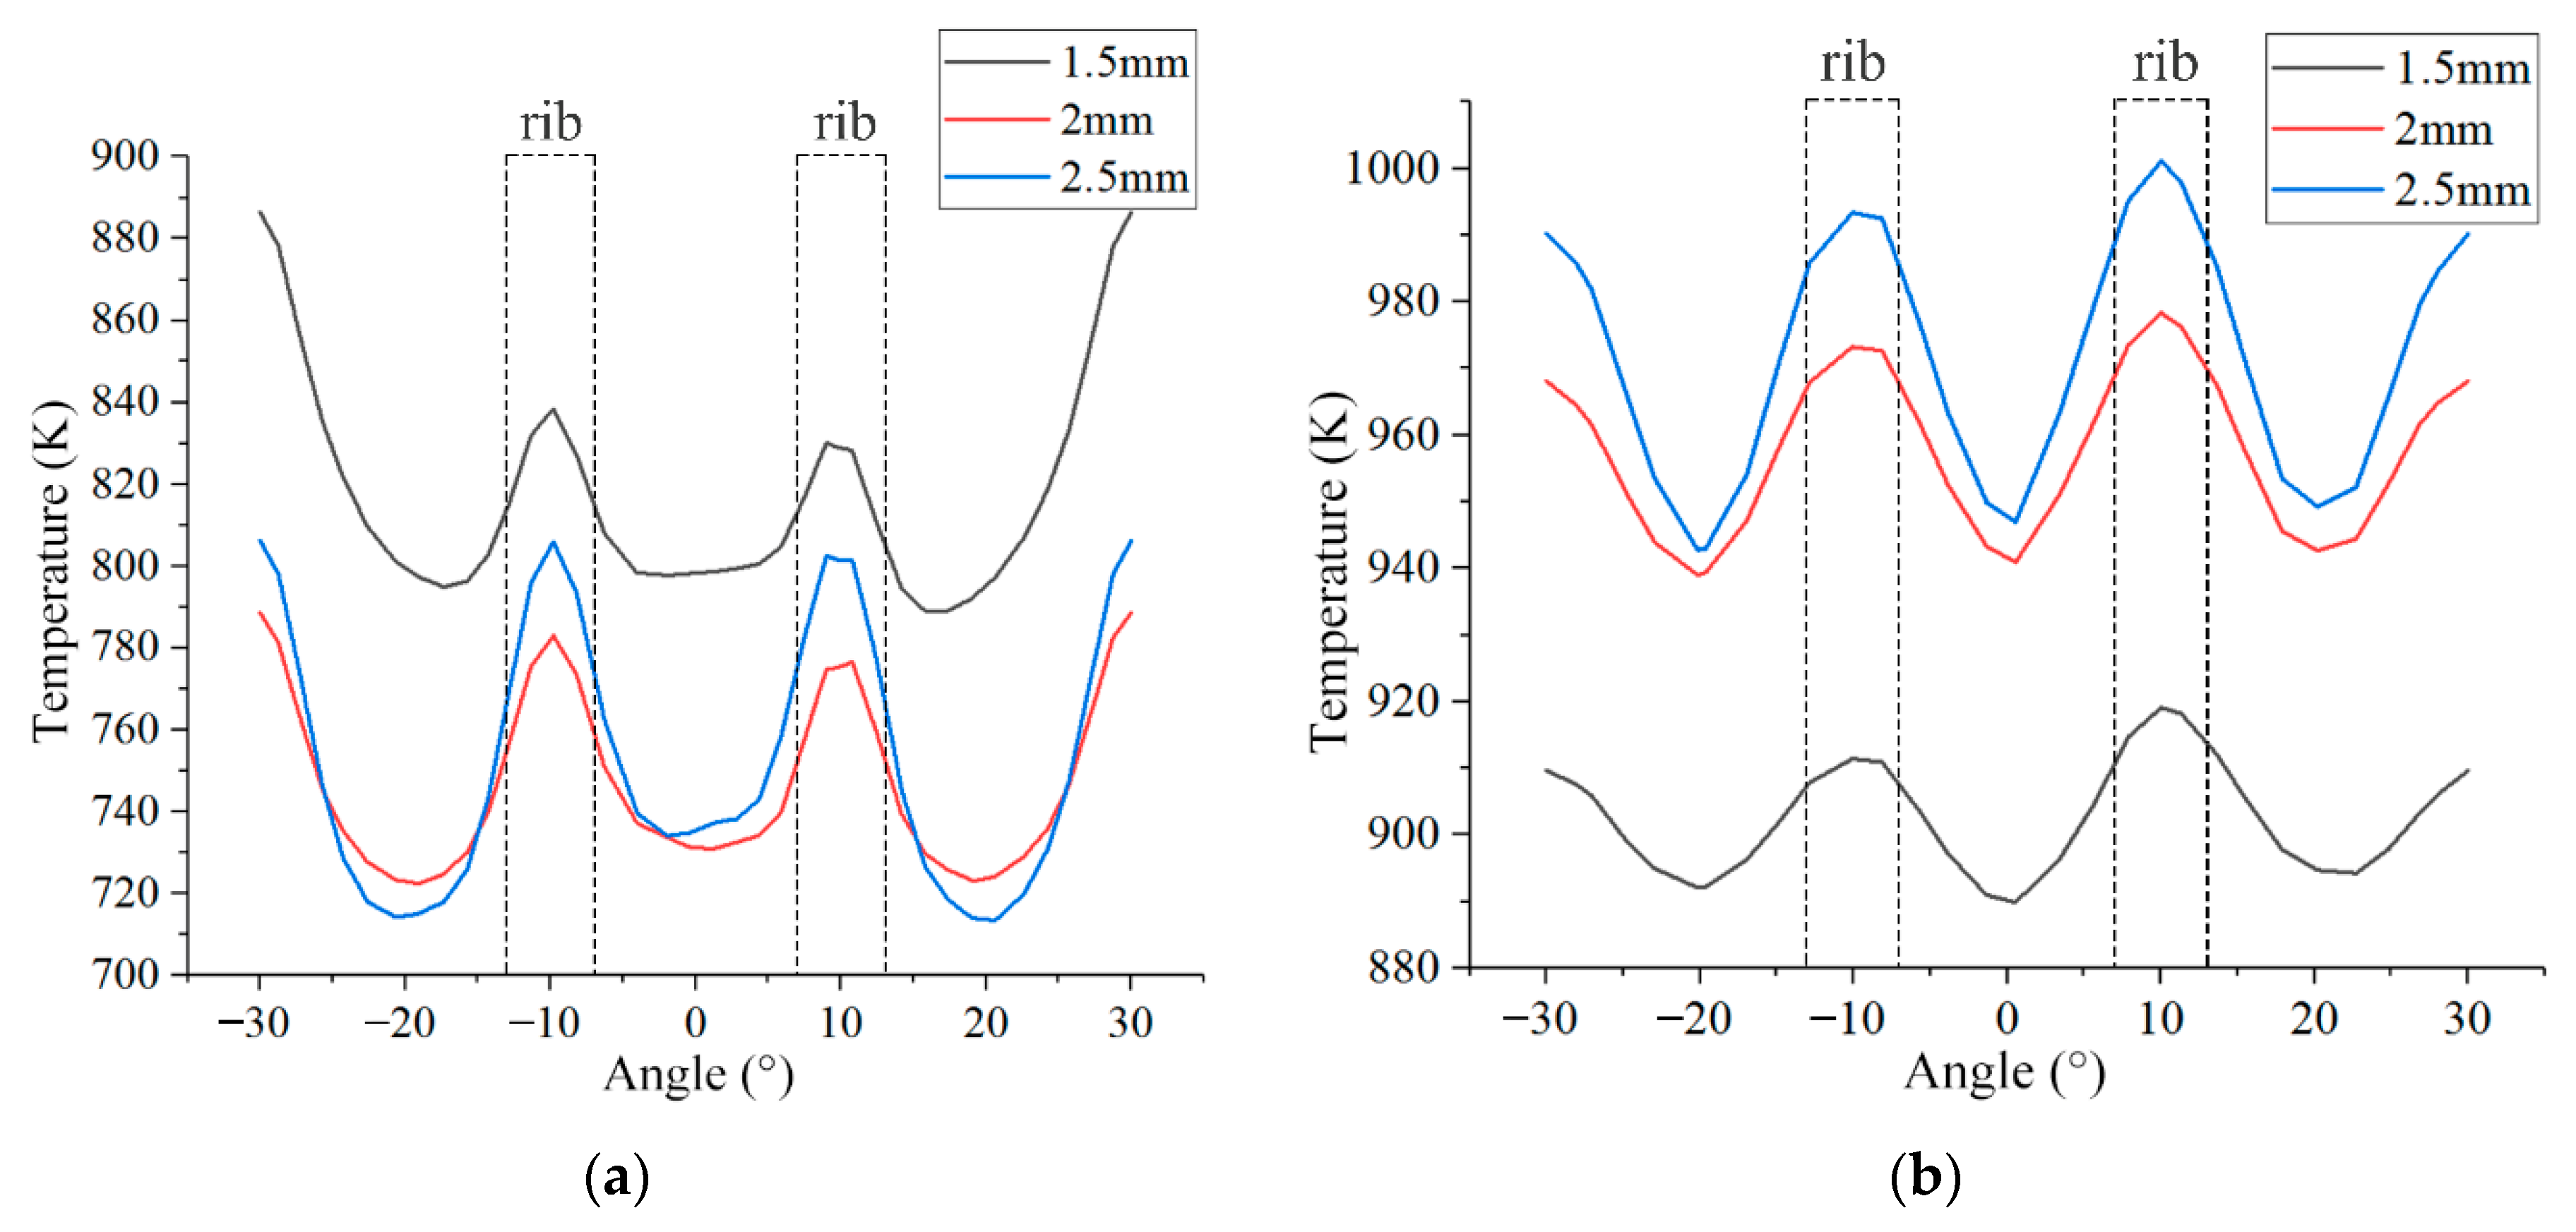
The temperatures of the inner wall near the head position (Z = 20 mm) and throat position (Z = 175 mm) were extracted and plotted, as shown in
Figure 22, to study the effect of rib width on the circumferential inhomogeneity of the temperature. Unlike other operating conditions, the extreme value at the ±10° position was much smaller than the extreme value at the ±30° position for the 1.5 mm rib width, and the local inhomogeneity was reduced. When the rib width was reduced, the flow area of the coolant increased resulting in sufficient heat absorption. Together with the effect of the injector, different peaks might appear. By increasing the rib width, the temperature circumferential inhomogeneity at the head position and that at the throat position showed different change patterns. The circumferential inhomogeneity of temperature at the head position was lowest for the 2 mm rib width and highest for the rib width of 1.5 mm, which did not show linear correlation. In contrast, the circumferential inhomogeneity of temperature in the throat position increased with the rib width.
4.3. The Influence of Inner Wall Thickness on Cooling Effect
In order to investigate the effect of inner wall thickness on the regenerative cooling effect of the rocket engines with hydrogen peroxide and kerosene, the other structure parameters were kept constant, and the inner wall thicknesses were 0.8, 1.0, and 1.2 mm in this study. The model settings and boundary conditions used in this process were consistent in the different cases.
As with changing the rib height and rib width, the pressure, temperature, and heat flux distribution patterns and the magnitude of the values remained basically consistent when changing the inner wall thickness, so they are not repeated. Hydrogen peroxide, which was used as a regenerative coolant, absorbed the heat and warmed up into the catalytic bed. Its energy rose, resulting in a small increase in the temperature of the decomposed gas mixture. The difference in the average coolant outlet temperature led to a slight difference in the injection temperature, and this slight effect was reflected in the heat flux distribution. However, on the whole, changing the inner wall thickness of the regenerative cooling channel had a very small effect on the distribution of the engine combustion flow field, which was negligible for the combustion flow field.
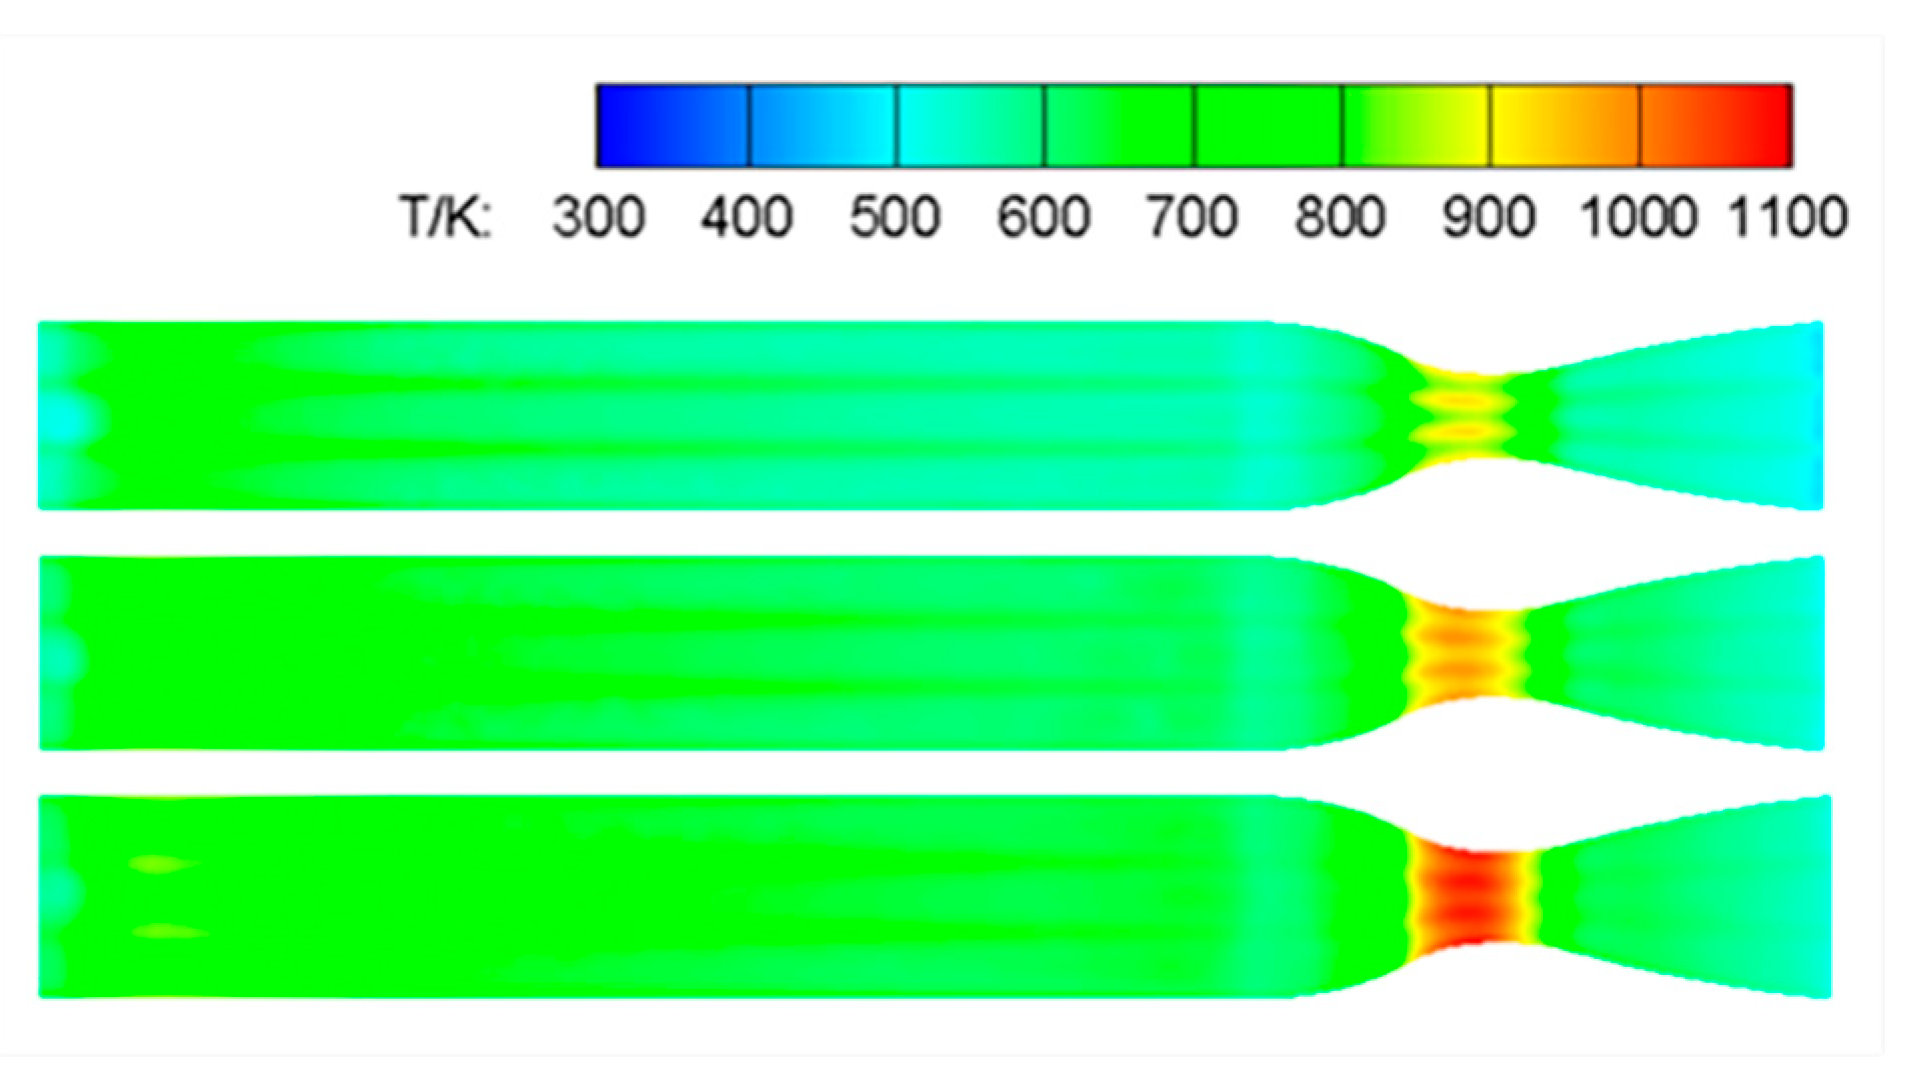
Figure 23 shows the temperature contour of the inner wall under different inner wall thickness conditions. The change in the inner wall thickness had a significant effect on the temperature field of the inner wall. First of all, the thermal environment of the high-temperature zone in the throat was significantly improved in the thin wall case. Not only was the area of the high-temperature zone significantly reduced, but the overall temperature also had a certain degree of decline.
On the other hand, the thin inner wall thickness had an overall decrease in temperature in the middle and outlet area of the cylinder section of the thrust chamber and the nozzle expansion section, which was very close to the shape of the cooling channel and had an average temperature of about 500 K. Therefore, reducing the thickness of the inner wall significantly optimized the thermal environment of the engine inner wall, and the thin inner wall thickness was more conducive to heat dissipation.
In order to observe more intuitively the distribution of the inner wall temperature under different inner wall thickness conditions, the temperature of the symmetric section through the injector was extracted and plotted in
Figure 24. Although the inner wall thickness was different, the temperature trend of the inner wall remained highly consistent. There was only a certain difference in values, with an overall temperature difference of about 50 K. Compared with the 1.0 and 1.2 mm working conditions, the temperature drop of the 0.8 mm working condition was greater and more obvious.
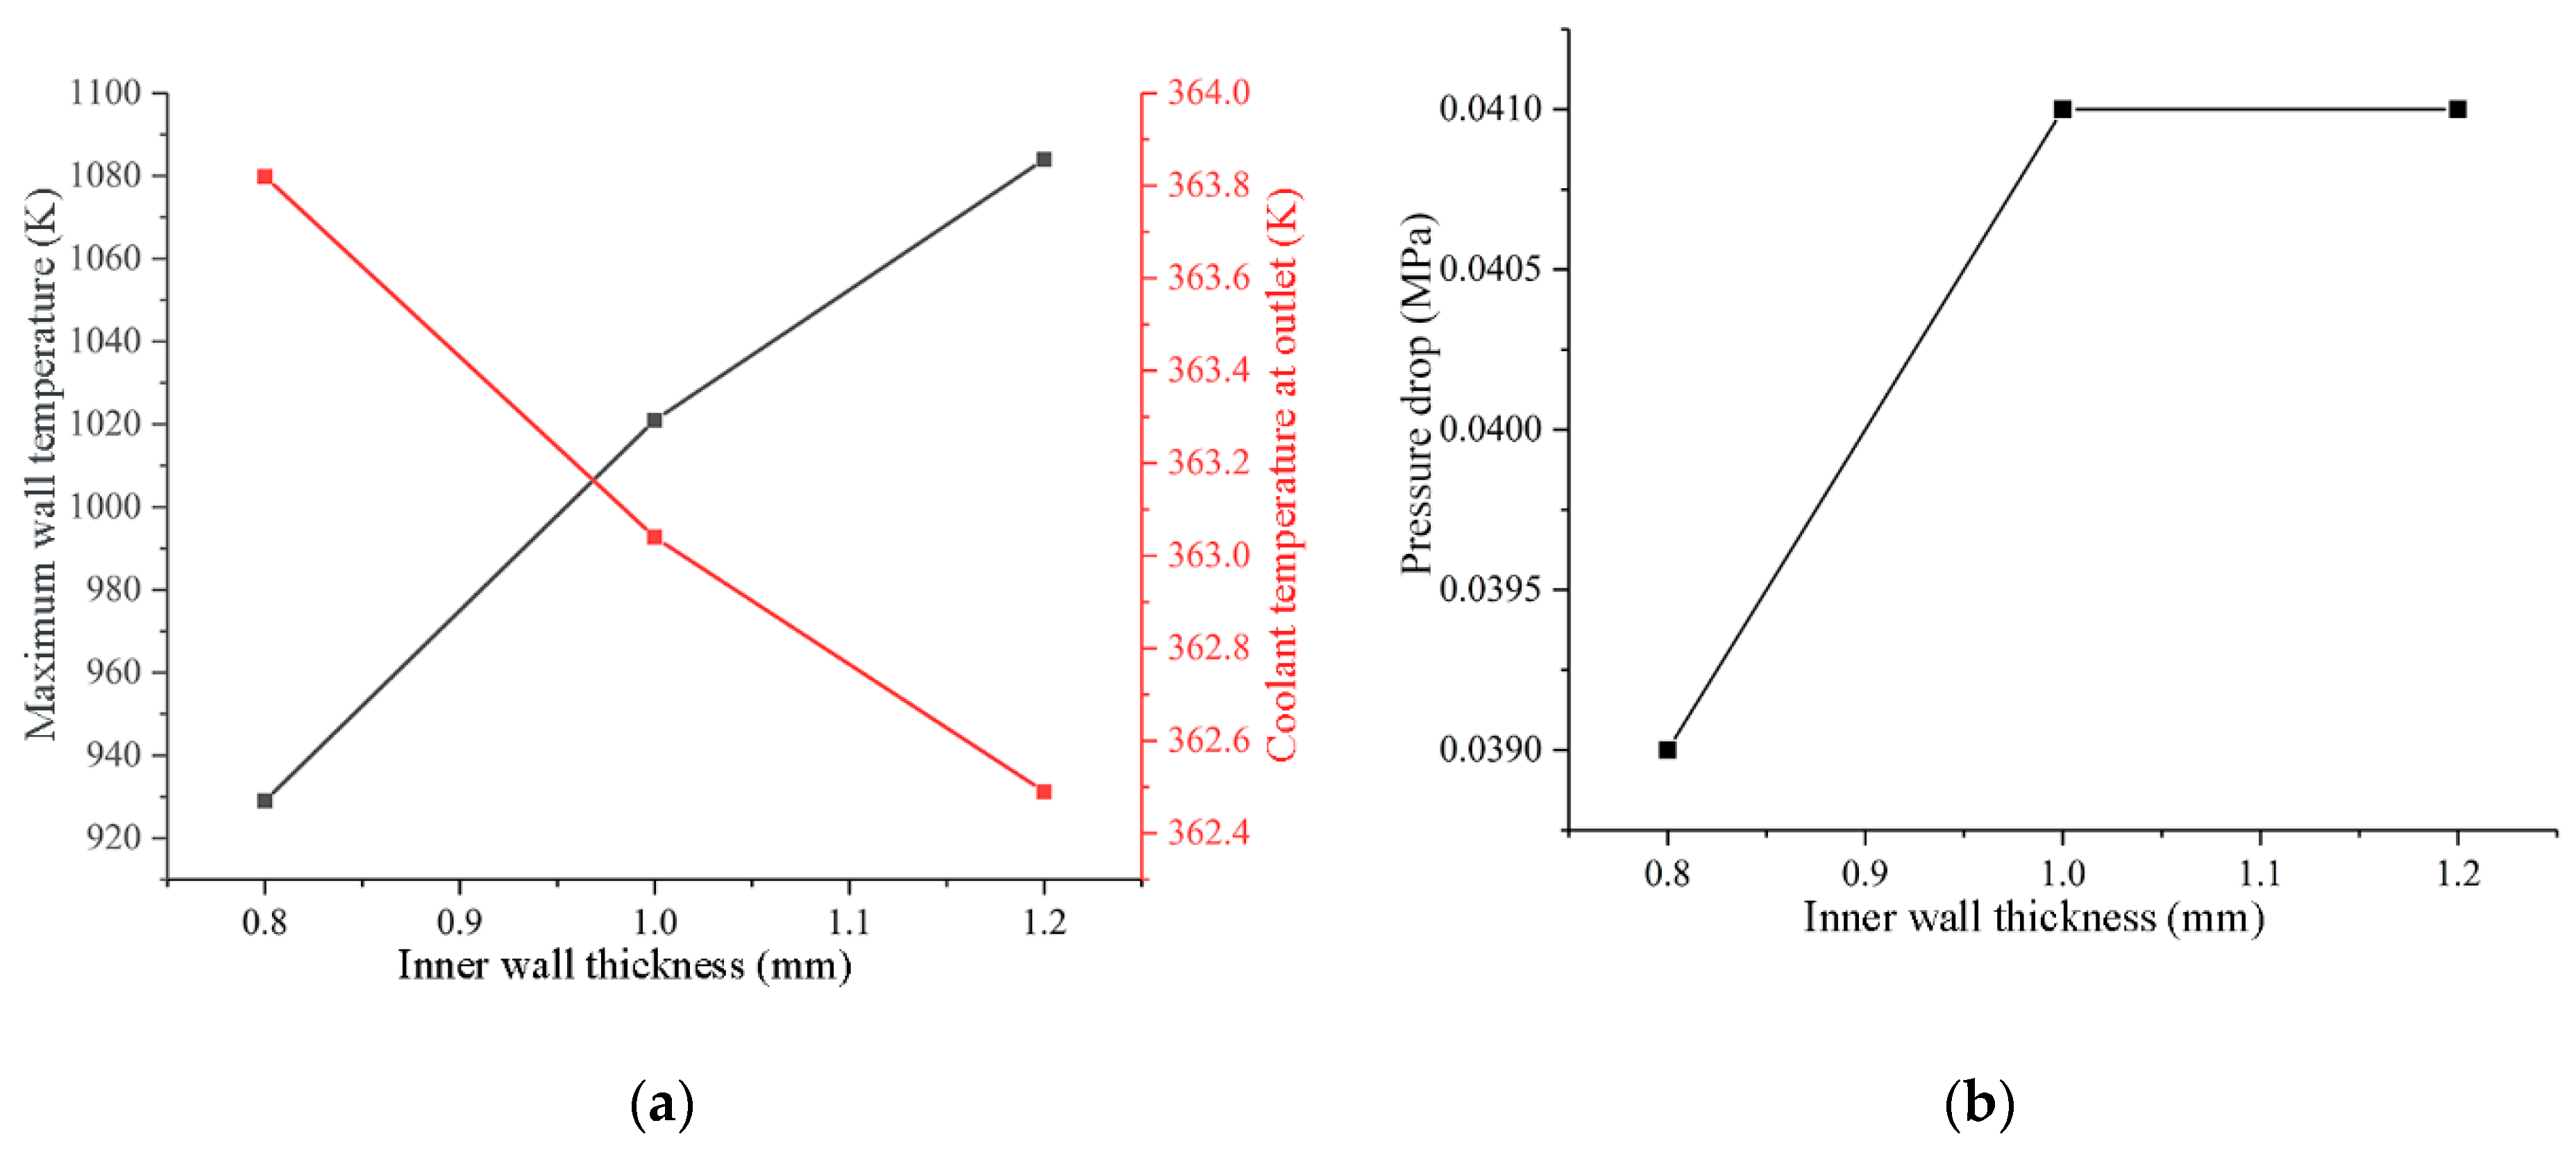
Figure 25 shows the wall temperature maxima and the average coolant outlet temperature profiles for different inner wall thickness states. Collectively, an increase in the inner wall thickness resulted in a significant increase in the maximum wall temperature and a small decrease in the average coolant outlet temperature. Overall, it was not favorable for engine thermal protection. The heat transfer of the inner wall was approximated as a one-dimensional steady-state heat conduction problem. An increase in the thickness of the inner wall increased the heat transfer thermal resistance, and the wall temperature then rose. Especially for 1Cr18Ni9Ti stainless steel, a material with relatively poor thermal conductivity, the change in the inner wall thickness had a more significant effect on the wall temperature.
The effect of changing the inner wall thickness on the coolant pressure drop was very small, and the coolant pressure drop remained basically the same for the three working conditions. This was because changing the inner wall thickness did not change the parameters of the cooling channel, such as the aspect ratio, rib efficiency, and coolant flow rate. Therefore, from the cooling performance point of view, for the hydrogen peroxide and kerosene rocket engine, it is necessary to adopt the thin-wall design as much as possible while ensuring the wall strength.
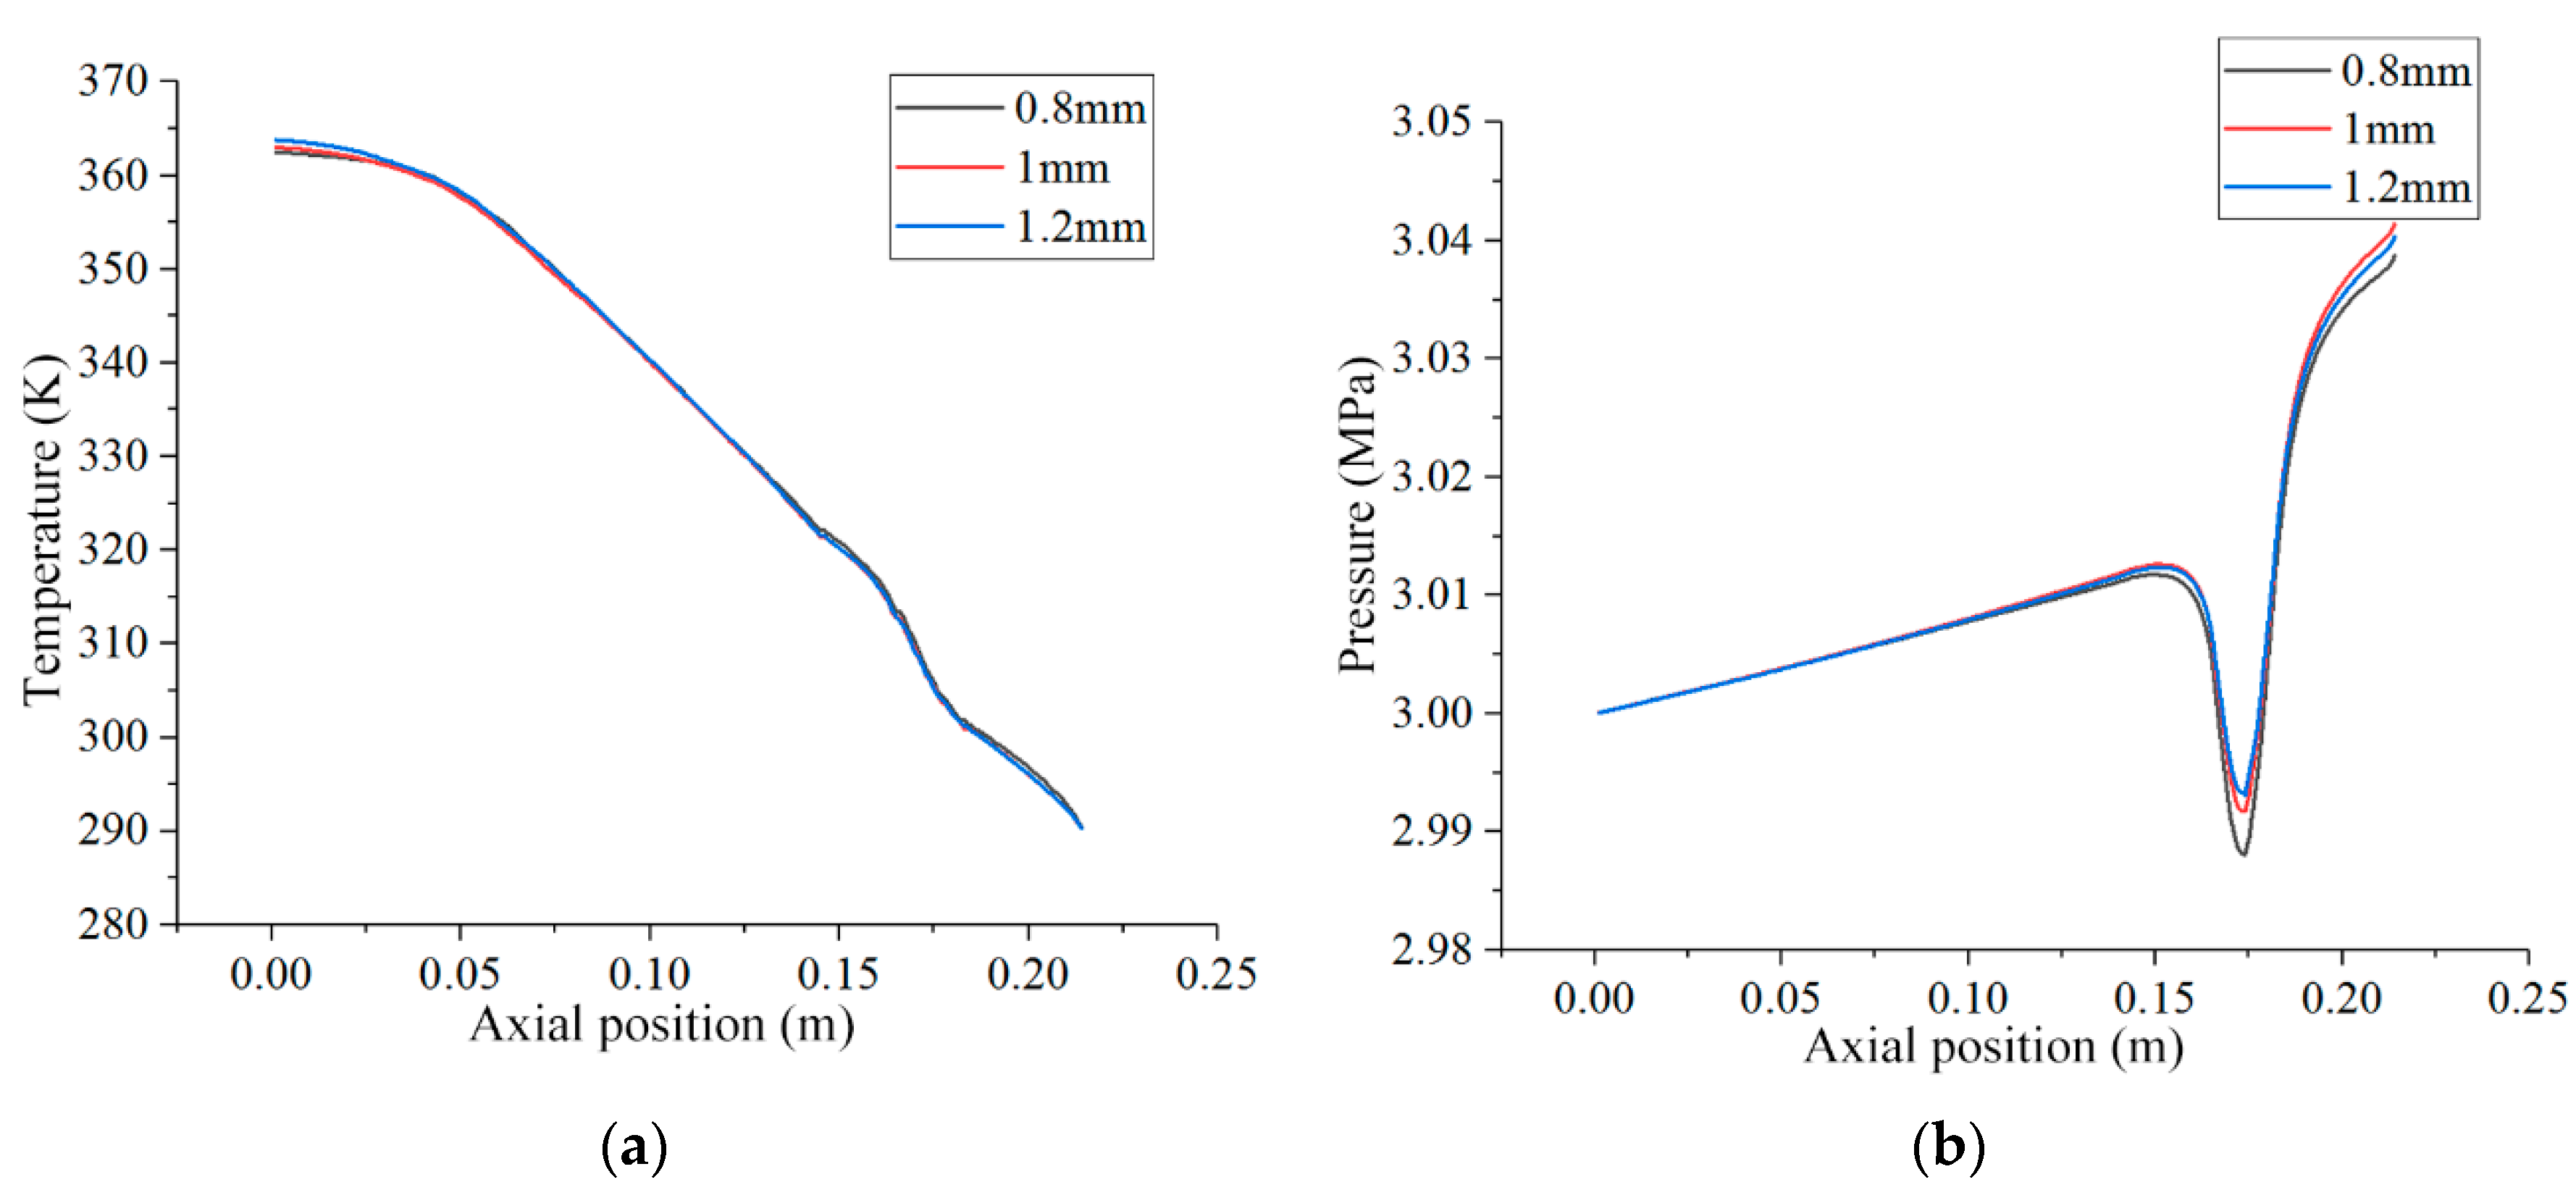
Figure 26 shows the temperature and pressure variation along the coolant path under different inner wall thickness conditions. The coolant flow rate and velocity remained unchanged because the channel area was not changed, resulting in the overlap of the coolant pressure variation curves along the course. This means that changing the inner wall thickness basically did not change the coolant flow and pressure distribution along the course. The temperature distribution curves along the coolant path also nearly overlapped and were only differentiated near the head position. Compared to the temperature curves for different rib heights and rib widths, the overlap of different inner wall thickness was the highest.
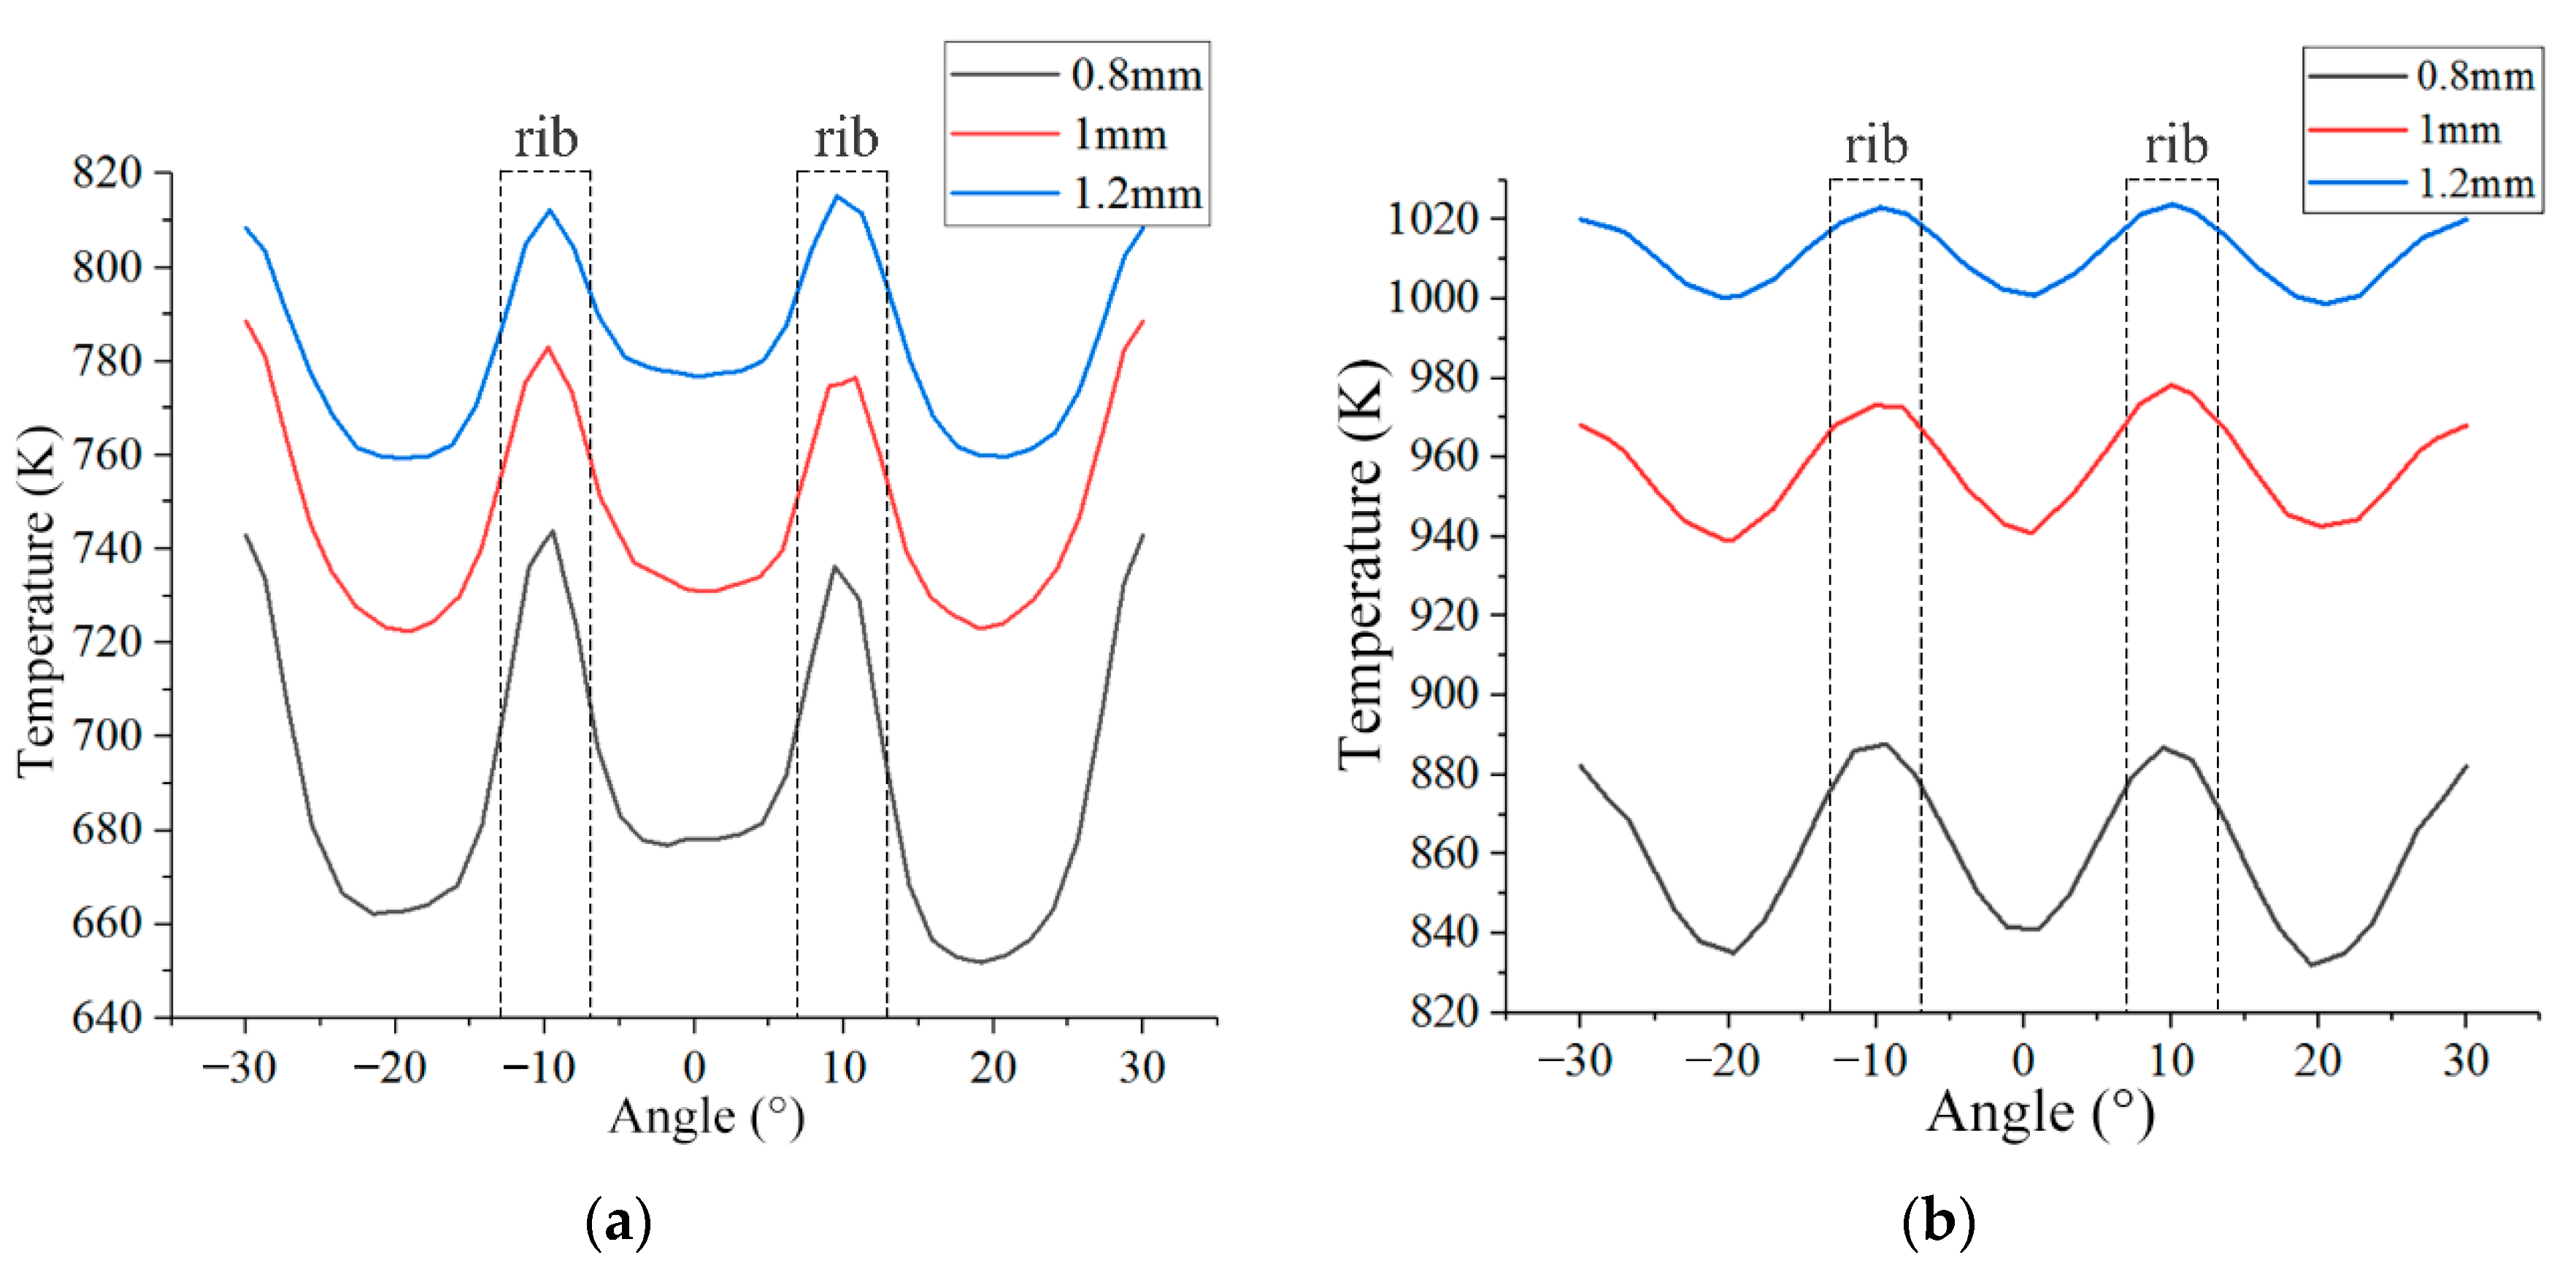
The temperatures of the inner wall near the head position (Z = 20 mm) and throat position (Z = 175 mm) were extracted and plotted as shown in
Figure 27 to study the effect of inner wall thickness on the circumferential inhomogeneity of the temperature. In summary, the increase in the inner wall thickness significantly weakened the circumferential inhomogeneity of the wall temperature. The circumferential inhomogeneity of the wall temperature was more sensitive to the inner wall thickness, and the magnitude of change was more obvious compared with the rib height and rib width.
5. Conclusions
In this study, the thrust chamber and regenerative cooling channels for the regenerative cooling of rocket engines with hydrogen peroxide and kerosene were modeled. The effect of regenerative cooling with hydrogen peroxide and the effect of the structure parameters of the cooling channels on the cooling were investigated. Overall, the inner wall thickness was the most significant for the heat transfer process, followed by the rib width and rib height. Therefore, in the design and processing of rocket engine cooling channels, the error of the inner wall thickness is the most stringent required.
The increase in the rib height of the cooling channel weakened the heat exchange effect in the cooling channel. The high-temperature area at the throat of the inner wall showed a trend of regional expansion with the increase in rib height, and the temperature of the inner wall rose. However, the overall temperature difference was not large, at approximately 20 K. As the rib height increased, the average coolant outlet temperature decreased slightly, the coolant pressure drop decreased, and the circumferential temperature inhomogeneity of the wall surface was improved.
The increase in the rib width of the cooling channel enhanced the overall heat transfer effect of the cooling channel. However, the heat transfer effect in the throat area deteriorated because of the dramatic reduction of the heat transfer area, resulting in a significant expansion and warming trend in the high temperature area of the throat. As the rib width increased, the overall temperature of the wall decreased, but the wall temperature in the throat area increased. The average coolant outlet temperature decreased, the coolant pressure drop rose, and the circumferential inhomogeneity of the wall temperature rose in the throat region.
The reduced thickness of the inner wall greatly enhanced the heat transfer effect in the cooling channel. The thermal environment in the high-temperature zone of the throat experienced a significant improvement. As the wall thickness decreased, the wall temperature decreased significantly, with a difference of up to 50 K. The average coolant outlet temperature rose slightly, but had no effect on the coolant pressure drop. Compared to the rib height and rib width, the wall temperature circumferential inhomogeneity was more sensitive to the inner wall thickness. The thicker the inner wall, the smaller the circumferential inhomogeneity of the temperature.

 ,
, 


