Article

Numerical Simulation on Primary Breakup Characteristics of Liquid Jet in Oscillation Crossflow

College of Energy and Environment, Shenyang Aerospace University, Shenyang 110136, China
*
Author to whom correspondence should be addressed.
Aerospace 2023, 10(12), 991; https://doi.org/10.3390/aerospace10120991
Submission received: 27 September 2023 / Revised: 13 November 2023 / Accepted: 23 November 2023 / Published: 25 November 2023

Abstract

:
In order to understand the breakup characteristics of a transverse liquid jet flow in an actual combustion chamber, a numerical study was conducted using the Volume of Fluid (VOF) method combined with grid adaptation technology. The study focused on the primary breakup characteristics of liquid jets under the conditions of a steady and oscillating air crossflow. The simulated mediums were set to water and air. The research findings revealed that fluctuations in the incoming gas velocity can influence the development speed of surface waves and the mode of jet breakup during the initial stage of jet development as compared to the steady condition. In both conditions, the surface waves were initially observed to appear within 1/4 T–2/4 T. The surface wave of the jet develops faster under steady conditions because the average velocity of the steady flow is higher than that of the oscillation flow during this stage. As a result, the fragmentation of the jet is primarily influenced by the surface wave. Under an oscillating flow, the rear of the jet begins to break up earlier due to the slower development of surface waves. The velocity of the oscillating air inflow increases over time, and the speed of surface wave development also increases, gradually leading to the dominance of surface-wave-induced jet breakup. In the second stage of air inflow oscillation, an “up and down slapping” phenomenon occurs at the tail of the jet. Additionally, increasing the air inflow velocity leads to a longer jet breakup length and a higher number of droplets near the jet column. Surface waves are observed on both the windward and leeward sides of the jet. The penetration depth of the jet fluctuates with changes in the crossflow velocity, and the response of the jet penetration depth to the velocity fluctuations in the transverse air is delayed by half a period.

1. Introduction

Atomization, evaporation, and mixing processes play crucial roles in controlling the combustion efficiency and stability of fuel engines. Liquid jets in a crossflow configuration are particularly important as they are commonly used in various equipment such as burners, afterburners, and ramjets. The primary breakup of the jet directly affects the jet atomization. Therefore, in order to optimize fuel atomization, it is important to understand the jet breakup process [1,2,3,4].
A large number of numerical and experimental studies have been published on the process of jet breakup under a steady air crossflow. Lubarsky et al. [5] utilized the high-speed photography method to study the primary breakup of a liquid jet in a low-speed transverse airflow. They analyzed the characteristics of the jet surface wave fluctuations and obtained a relationship between the location of the jet primary breakup and the velocity of the liquid droplets after the breakup. Xiao et al. [6] conducted numerical investigations on the primary breakup processes of a liquid jet in both subsonic and supersonic crossflows, predicting different breakup morphologies at different Mach numbers. Zhao [7] discovered that the spray process could be divided into three stages: surface waves dominated the breakup of the liquid column, expansion waves promoted the acceleration of the jet spray, and compressed and reflected waves disrupted the gas–droplet mixing. Sinha [8] researched the surface waves on a liquid jet in a crossflow through the effect of injector geometry.
The studies mentioned above were conducted on steady-state continuous jets. Additionally, Lee et al. [9] conducted experiments to investigate the breakup and spray formation of swirl liquid jets. They demonstrated that the crossflow promoted the jet breakup and resulted in a finer spray across a wide range of injection velocities. Im et al. [10] performed simulations on the liquid properties of aerated-liquid jets in a crossflow and demonstrated the effects of the aeration degree, breakup, and mixing of the liquid spray. Lee et al. [11] concluded that a pulsed jet could enhance the spray mixing process. Nygård et al. [12]. simulated the physics of the breakup process of intermittent jets and found that a longer pulsation duration increased the global vorticity transfer rate.
Cyclic fluctuations in the transverse gas flow velocity and fuel injection velocity can occur in an engine combustion chamber because of unstable combustion. These fluctuations may have an impact on the mixing of fuel and air as well as the combustion efficiency in the combustion chamber [13]. Recently, the atomization process and spray characteristics of a jet in a velocity oscillation crossflow have been conducted in the last few years. Bunce et al. [14] and Song et al. [15] observed that the average penetration depth of the jet did not change obviously in the presence of crossflow oscillations. However, Anderson et al. [16] observed significant variations in the jet penetration depth during crossflow oscillation experiments at 200 Hz, contradicting the conclusions drawn by the aforementioned researchers. Sharma and Lee [13] found that when a crossflow oscillation was present, both the width and height of the jet exhibited fluctuations, and the degree of the jet response was mainly influenced by the frequency of the crossflow oscillations. In addition, Song and Lee [15] investigated the behavior of a spray under a transverse inflow velocity oscillation at a frequency of 800 Hz. They observed that there was a periodic variation in the droplet size distribution. Wen et al. [17] observed that the variation frequency of the breakup behavior, liquid jet trajectory, droplet size, and fuel vapor distribution were consistent with that of an oscillating crossflow, and the first three characteristics responded quickly to the inflow velocity, while the fuel vapor distribution was delayed by half a period. Moreover, the atomization and evaporation performance were better than under the steady-state working condition. Lee et al. [18] also reported that an oscillating crossflow promoted fuel–air mixing. Bodoc [19] found the periodic movement and breakup of a liquid column and the cyclic impact of a liquid jet on the upper wall of a channel and thus measured the time delays associated with each behavior. Desclaux et al. [20] experimentally and numerically studied atomization in an oscillating gaseous crossflow. Their findings indicated that spray dynamics were influenced by both the oscillations of the liquid column and the crossflow, and the periodic flapping motion of the liquid column was induced by the acoustic fluctuating velocity. The above researchers have verified that it is necessary to study the effect of an oscillating crossflow on jet sprays.
However, there is limited research on the breakup process of jets under oscillating transverse flow conditions, and the mechanism of jet breakup under transverse inflow velocity oscillation conditions is not well understood. Therefore, this research conducted a simulation investigation on the primary breakup of jets under a 500 Hz oscillating transverse flow and steady state conditions, aiming to obtain the similarities and differences in jet breakup processes and atomization characteristics between the two conditions and to gain a deeper understanding of how perturbations affect the primary breakup of jets. The obtained results will provide essential data for the development of combustion chamber.

2. Mathematical Physical Model

2.1. Numerical Methods

The numerical simulations were based on the Fluent2022R1 platform, computed on the Beijing Supercomputer, and the simulation data were post-processed by Tecplot software. The UDF program was compiled by C programs and then loaded into Fluent. The numerical solution of a jet breakup in a transverse flow was obtained using a pressure-based approach. The VOF model is employed as the multiphase flow model.
Near-surface interpolation was performed using the Geometric Reconstruction Scheme, which accurately depicts the interface between the fluids on generalized unstructured meshes in Fluent. In the VOF simulation, the interface compression algorithm played a crucial role in identifying the interface compression phenomenon. Commonly used interface compression algorithms in academic research include the CSF (Continuum Surface Force) [21], the CICSAM (Coupled Interface Compression and Sharpness Algorithm Method) [22], and others. The CSF model is utilized in this study. The CSF method converts the interfacial surface force into a corresponding volume force, which is then incorporated into the Navier–Stokes equations. The SST k–ω SBES model was employed to simulate the turbulence in this study. The SST k–ω model considers the transport of turbulent shear, as defined in the turbulent viscosity, applied to wall-bound and free-shear flows. The SBES model is capable of dynamically switching methods within the computational domain based on the computational requirements, thereby providing a more accurate calculation of the flow field that closely resembles real conditions. The discrete phase of the time term in the calculations was used with first-order accuracy, and the diffuse phase of the momentum equation is in a second-order windward format [23]. The unsteady time step was 1 × 10⁻⁷ s, and 30 steps were iterated in each time step, and the unsteady time t = 4 ms was calculated.

2.2. Multiphase Flow Model

The VOF method was first proposed by Hirt and Nichols [24]. The VOF method was used to track two or more immiscible fluids in a level trapping problem and a volumetric rate function. Both gas and liquid in this study were considered as incompressible fluids, and their mass conservation equation is
ρ ¯ t + x i ( ρ ¯ v ˜ i ) = 0
The momentum conservation equation is
t ( ρ ¯ u ˜ i ) + x j ( ρ ¯ u ˜ j u ˜ i ) = x i p ¯ + μ ¯ 2 u ˜ i + μ ¯ 3 2 x j x i u ˜ j + F ˜
where ρ ¯ and μ ¯ denote the density and viscosity of the gas–liquid phase in the grid cell. u ˜ i denotes the velocity vector, and F ˜ is the source term, which includes both the volume force and the surface tension. Here, the volume force is ignored, so F ˜ of only the surface tension at the gas–liquid interface is expressed as
F ˜ = σ ρ ¯ κ α ˜ 0.5 ( ρ l + ρ g )
where σ denotes the surface tension coefficient between the gas and liquid; α ˜ denotes the volume fraction of the gas–liquid phase in the grid cell; ρ g and ρ l denote the gas-phase density and liquid-phase density, κ denotes the curvature of the gas–liquid interface, defined as the rate of change of the normal-phase vector, which is linked to the surface tension and thus coupled to the equation with the expression:
κ = n ˜
where n ˜ denotes the direction vector at the interface:
n ˜ = ± F ˜ F ˜
α ( x ) was used to describe the volumetric rate occupied by a particular fluid in a cell grid. In this paper, α means the expression form of the volume rate function. When the cell grid is completely filled with a certain fluid, α = 1 ; when the cell grid does not have fluid, α = 0 ; when the cell grid has both a fluid and another fluid, 0 < α < 1 . The material properties in the governing equations are determined by the volume fraction of each component in the control volume. The transport equation for the volume fraction was described as follows.
t ( α ˜ ρ ¯ ) + ( α ˜ ρ ¯ μ ¯ ) = 0
where ρ ¯ and μ ¯ denote the density and viscosity of the gas–liquid phase in the grid cell.
In the gas–liquid mixing zone, the fluid density and viscosity can be expressed as
ρ ¯ = ( 1 α ˜ ) ρ g + α ˜ ρ l
μ ¯ = ( 1 α ˜ ) μ g + α ˜ μ l
where μ g and μ l denote the gas-phase viscosity and liquid-phase viscosity, respectively.

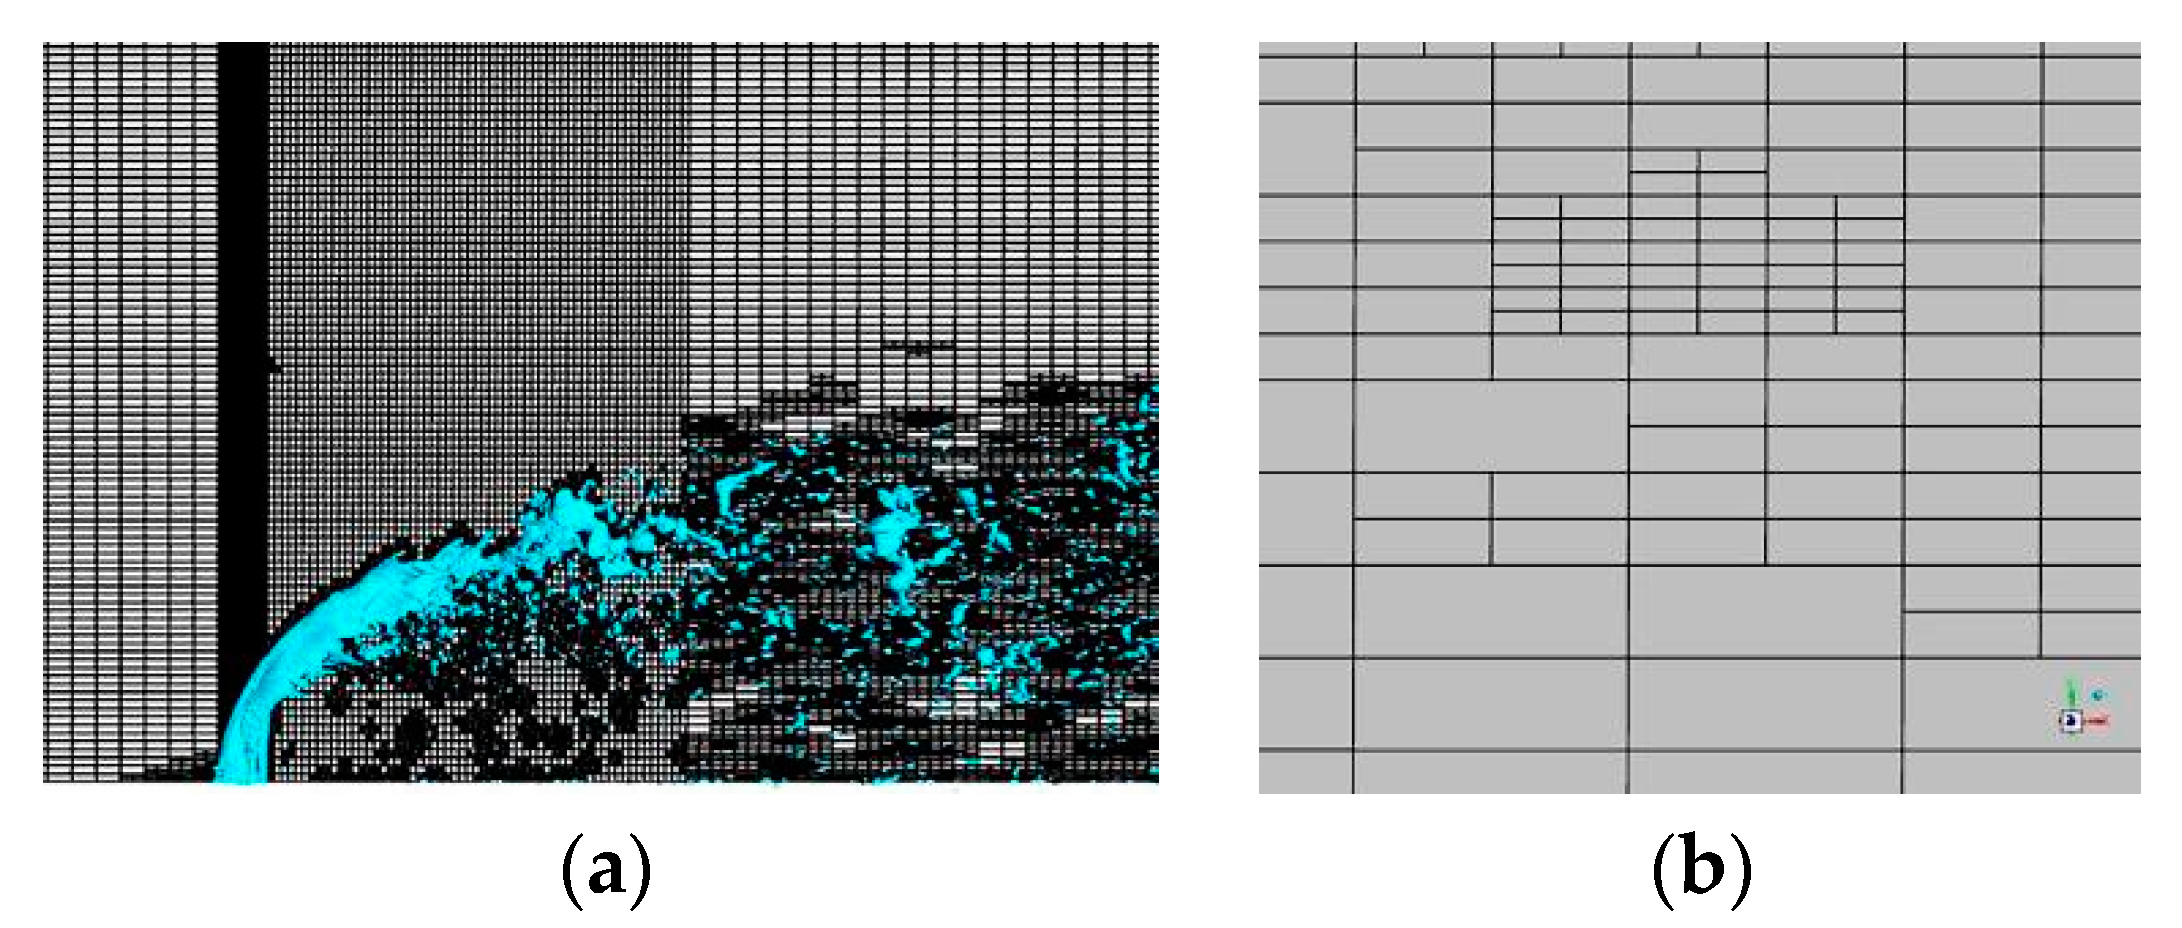
2.3. Computational Mesh

The VOF method can capture the motion and deformation of the gas–liquid interface, allowing for a meticulous investigation of the atomization process of jets by analyzing the distribution of the two-phase flow field. However, there is a large number of small droplets in the flow field, requiring the grid to be sufficiently fine and computationally intensive. Grid adaptation technology can automatically adjust the grid based on solution variations and requirements, thereby improving both computational accuracy and efficiency. In this study, in order to reduce computational costs and enhance computational accuracy, the VOF method was combined with grid adaptation technology to simulate the spray process of jets. The accuracy of the numerical results was validated with experimental results [25]. The structured grid was generated by ICEM, with refinement near the jet region. The initial grid consisted of 990,000 cells, and during the later stages of adaptive refinement, it increased to 11,600,000 cells. The maximum refinement level is three, and it is dynamically adaptive, and the minimum grid size is 0.011 mm (about 0.018 D), which enabled the details of the jet breakup to be captured [26]. The adapted grid is shown in Figure 1.

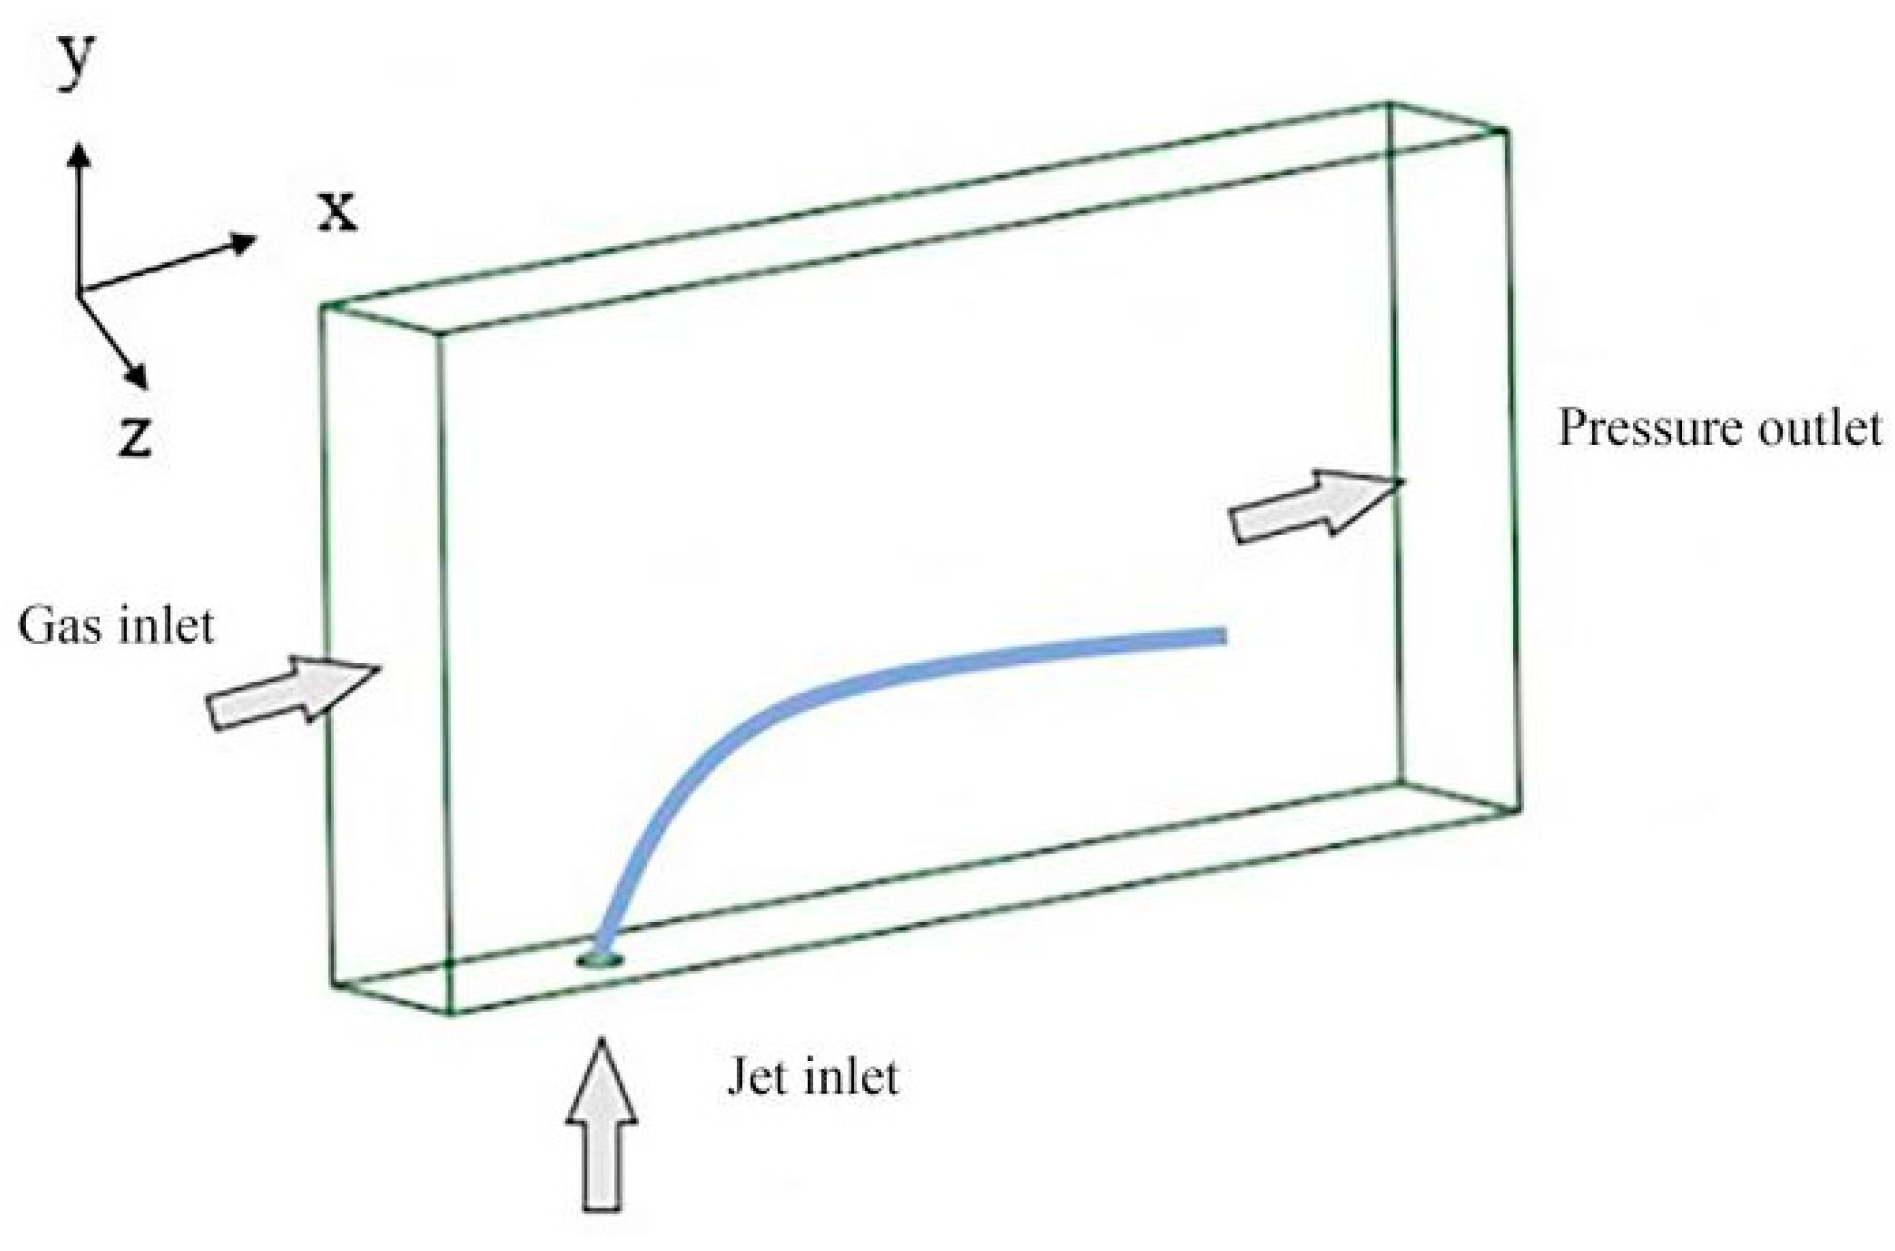
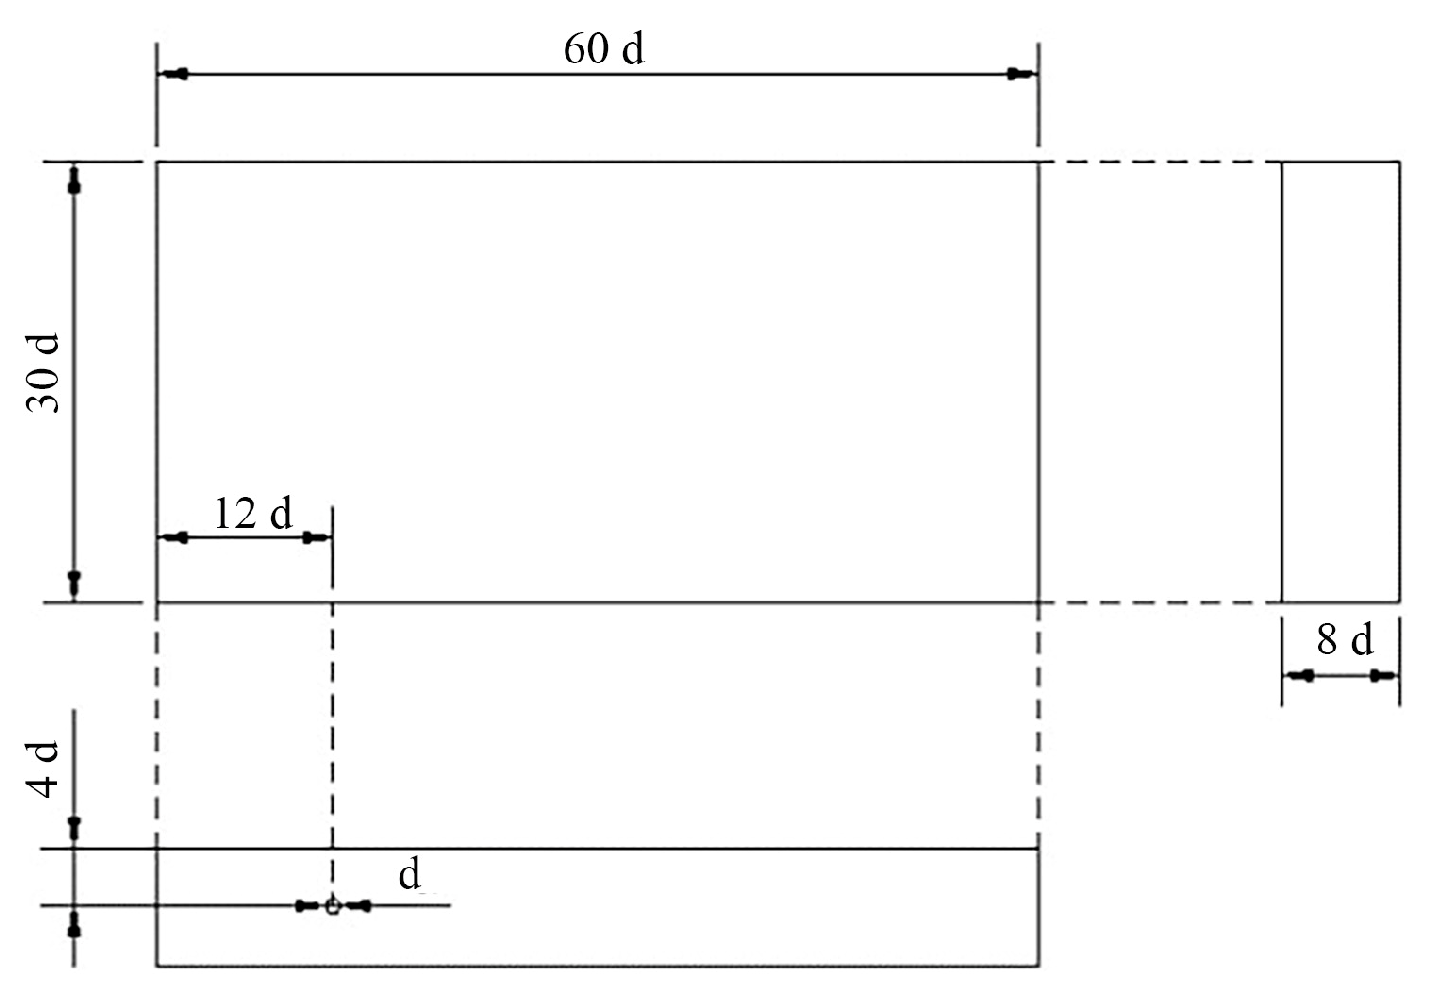
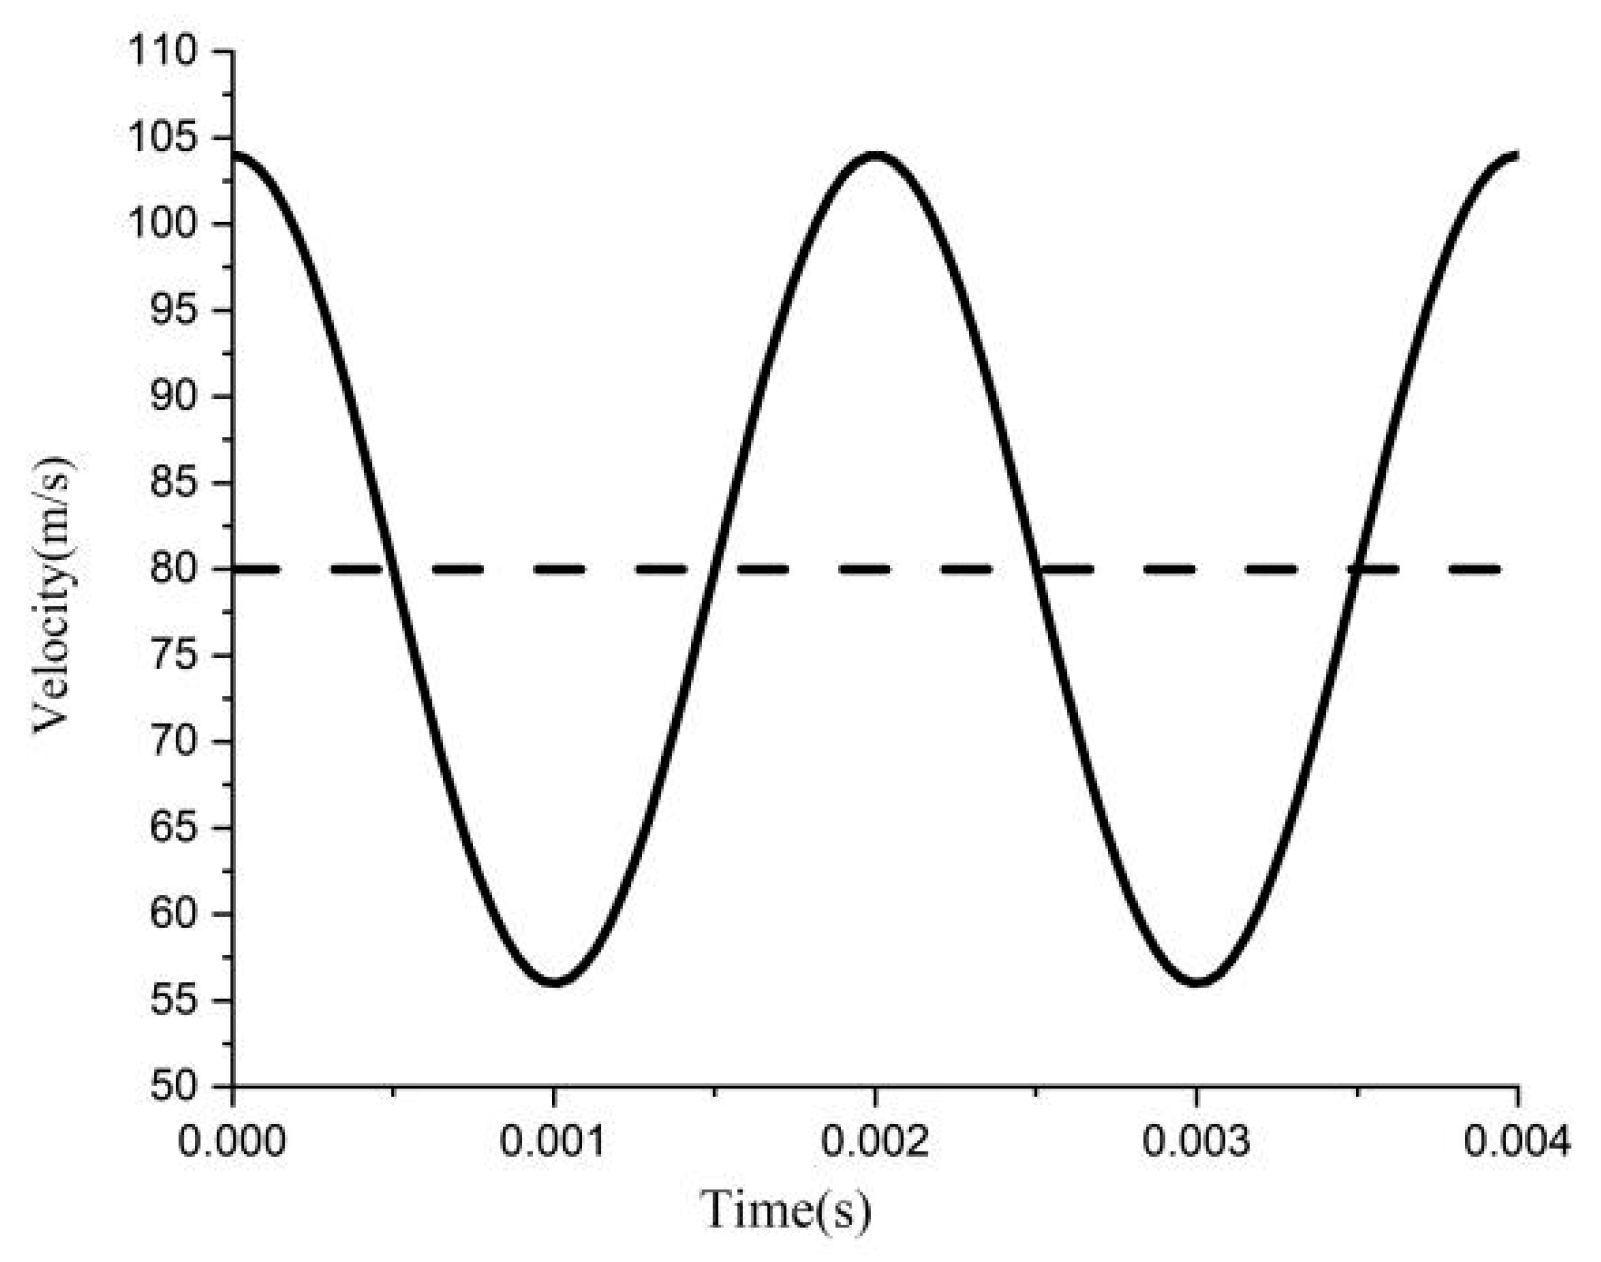
2.4. Physical Model and Boundary Conditions

This study investigates the fuel atomization process inside the primary blade passage of a certain swirl injector [27]. This process is simplified as the direct injection atomization process of a single-point fuel in a three-dimensional rectangular cuboid under a transverse airflow. Figure 2 and Figure 3 show a schematic diagram and dimension diagram of the computational domain, respectively. The left side represents the air inlet, the right side represents the outlet, and the circular hole on the bottom surface represents the jet inlet, while the rest are the wall surfaces. The computational ranges in the x, y, and z directions are [−12 d, 48 d], [0, 30 d], and [−4 d, 4 d], respectively. Here, d represents the nozzle diameter, which is 0.6 mm. In numerical calculations, boundary conditions need to be specified for the air inlet, jet inlet, outlet, and wall surfaces. The boundary condition type for both the air and jet inlets is a velocity inlet, and the outlet is a pressure outlet, assuming that the physical quantities at the outlet remain constant. The wall surface type is set as a no-slip wall. In this study, the operating parameters of the gas and jet under steady-state conditions are shown in Table 1. In order to investigate the impact of transverse velocity fluctuations on jet fragmentation, an oscillation is added at the gas inlet, and Figure 4 shows the velocity profile at the gas inlet. Its mathematical expression is expressed as
v g = 80 + 24 × cos ( 1000 π t )
According to previous research on combustion instability [28], the selected frequency of oscillations is 500 Hz, with an amplitude of 30% of the average velocity of the steady air crossflow at the inlet. The dimensionless parameters involved in this study are the liquid–gas momentum flux ratio (q), the gas Weber number (Weg), and the liquid Reynolds number (Rel), which are defined as follows.
q = ρ l v l 2 ρ g v g 2
We g = ρ g v g 2 l g σ
Re l = ρ l v l d μ l
where v l is the velocity of the liquid, v g is the velocity of the gas, l g is the equivalent diameter at the gas inlet, and d is the jet inlet diameter.

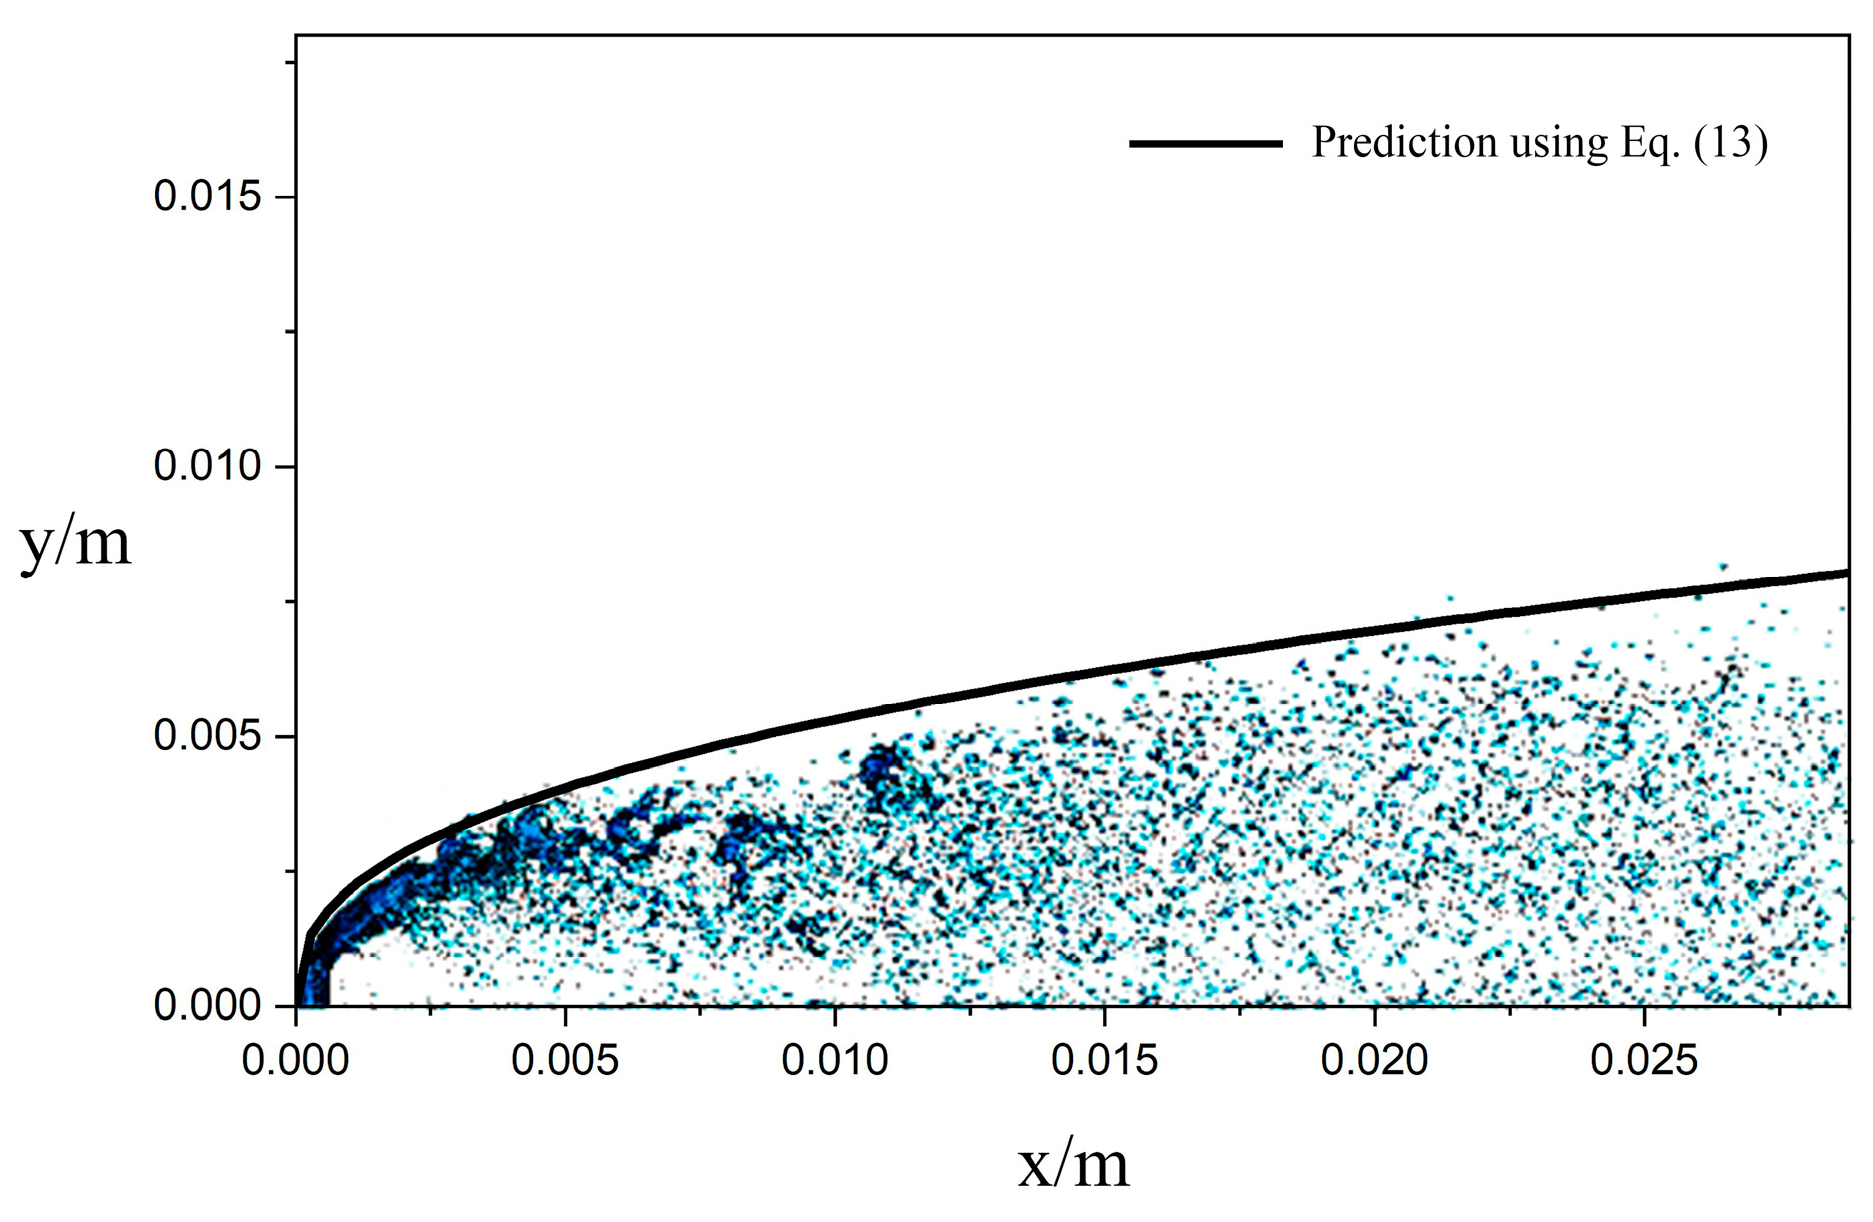
2.5. Verification of Calculation Results

To validate the accuracy of the jet simulation, the simulated penetration depth of the jet can be compared with the calculated value from the empirical formulas. Most studies often choose the empirical formulas derived by Stenzler et al. [29], which have wider applicability conditions. The specific form of the formula is as follows:
h d = 2.63 q 0.442 ( x d ) 0.39 W e 0.088 ( μ μ H 2 O ) 0.027
Figure 5 presents a comparison between the simulated penetration depth of the jet under steady crossflow conditions and the aforementioned empirical formula. It can be observed that the jet penetration depth agrees well with the results calculated from the empirical formula, but the second half of the jet is slightly lower than what the formula predicts. This is because factors such as the momentum flux ratio and jet diameter have an influence on the penetration depth of the jet. Additionally, small droplets at the periphery of the jet may not have been captured because of the limited computational conditions. Nevertheless, the simulation results still provide an accurate representation of the spatial distribution and mixing characteristics of the jet to a certain extent.
In addition, Wu et al. [3] concluded that the liquid jet always breaks up about eight times the nozzle diameter downstream of the nozzle outlet, independent of the injection conditions, and obtained the empirical equation x b = 8.06 d , with xb as shown in Figure 6. Figure 7 shows the initial breakup of the jet under steady-air-velocity crossflow conditions, and the simulation result of xb* is 7.25d. There is an error of 10.05% between the empirical and simulated values.

3. Conclusions and Discussion
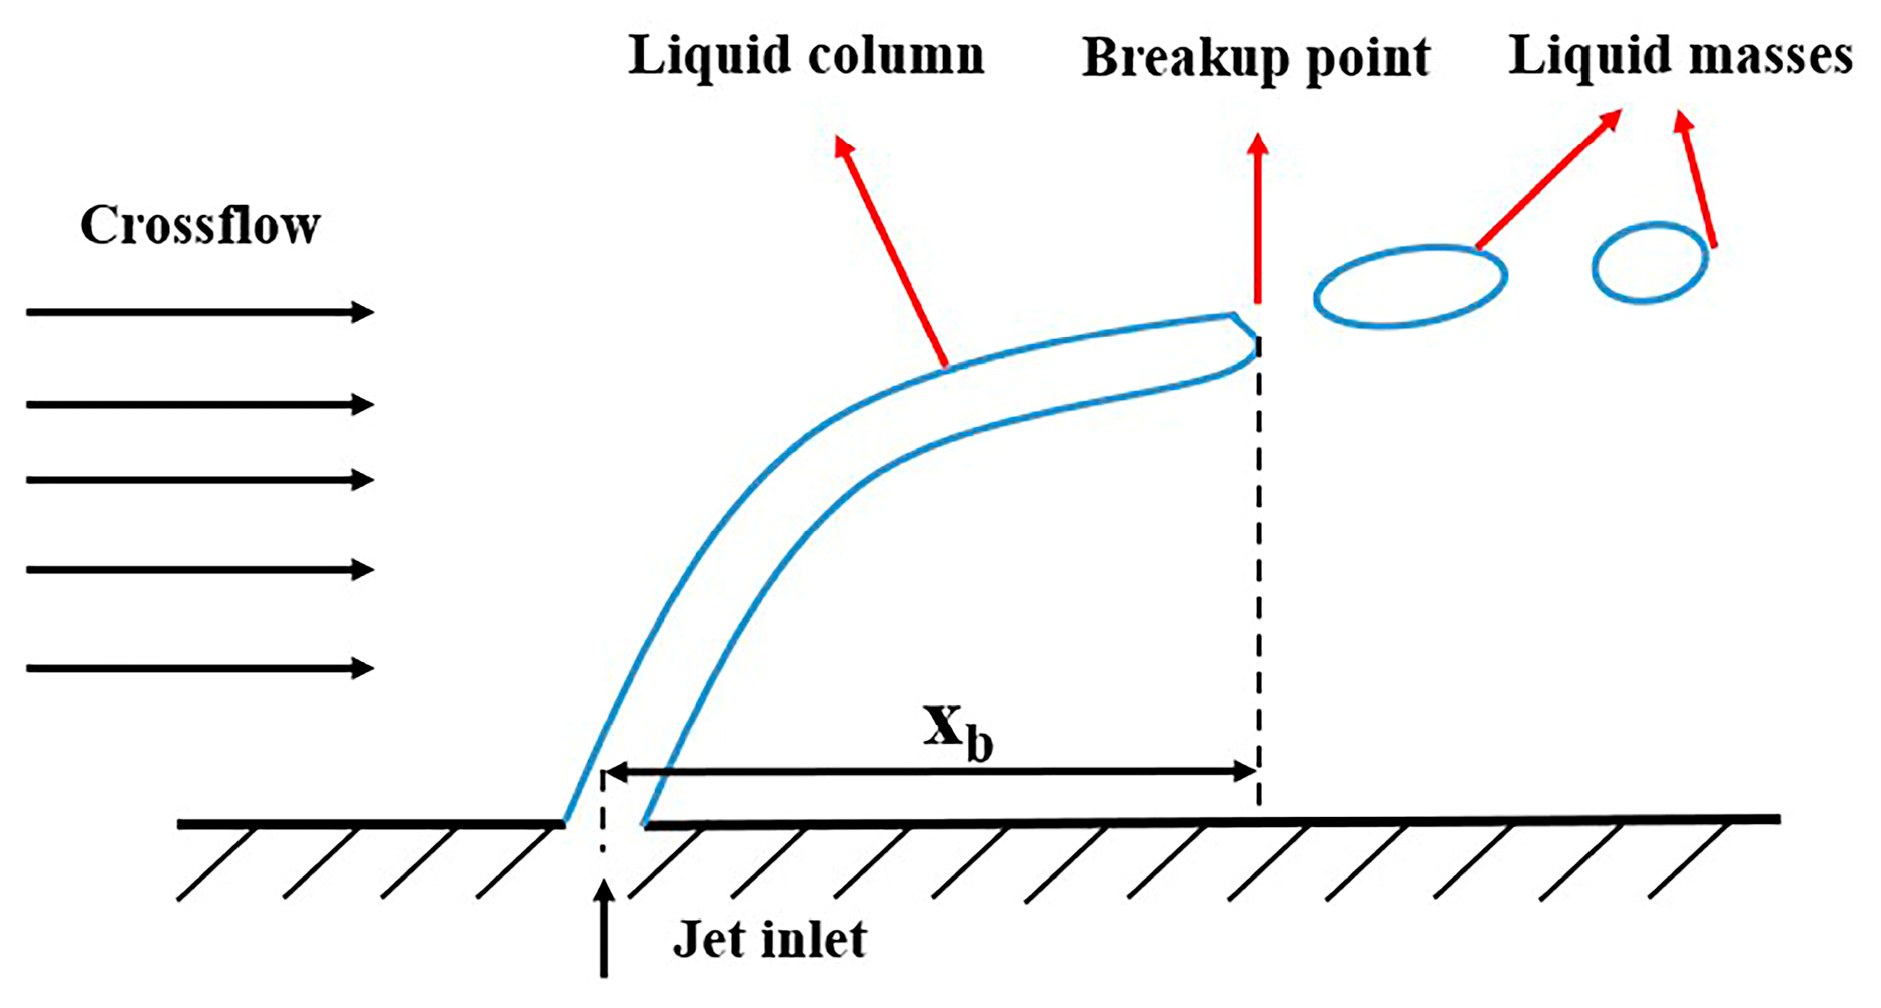
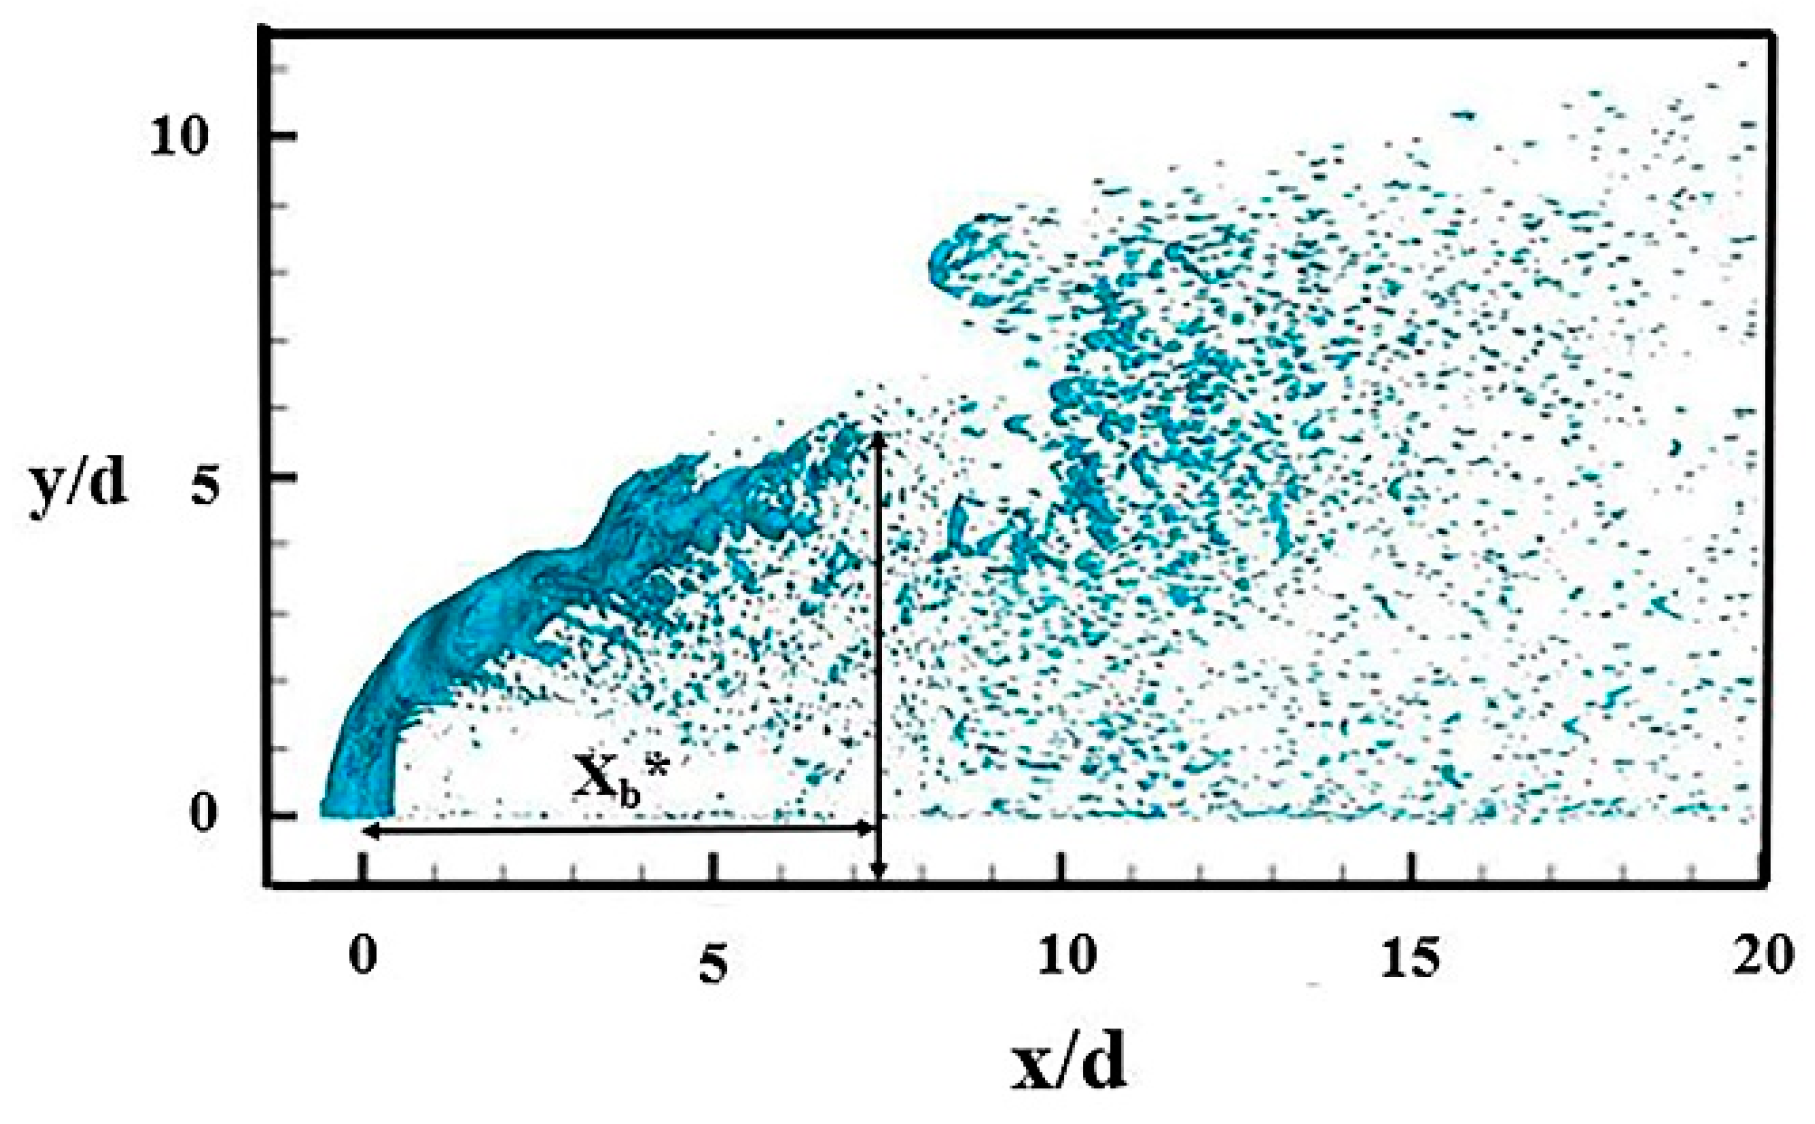
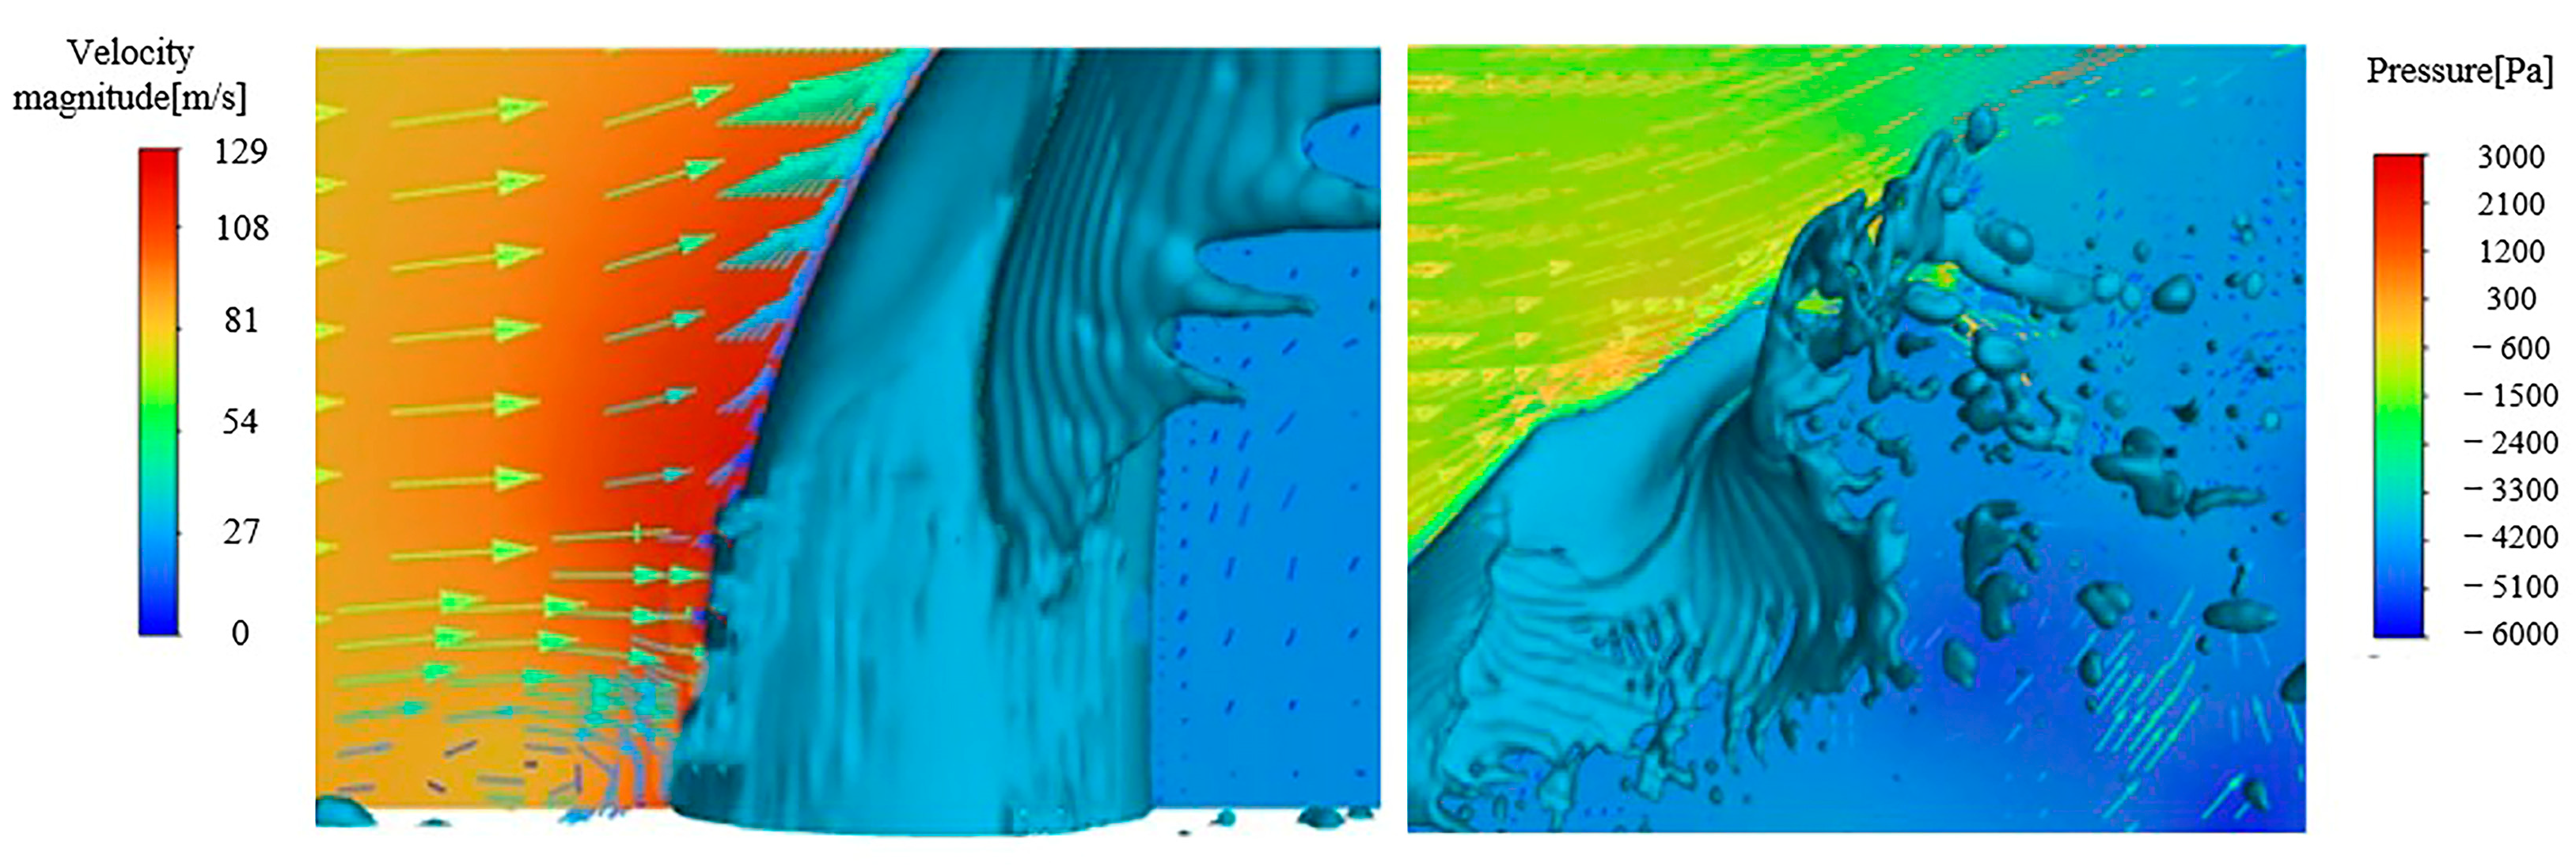
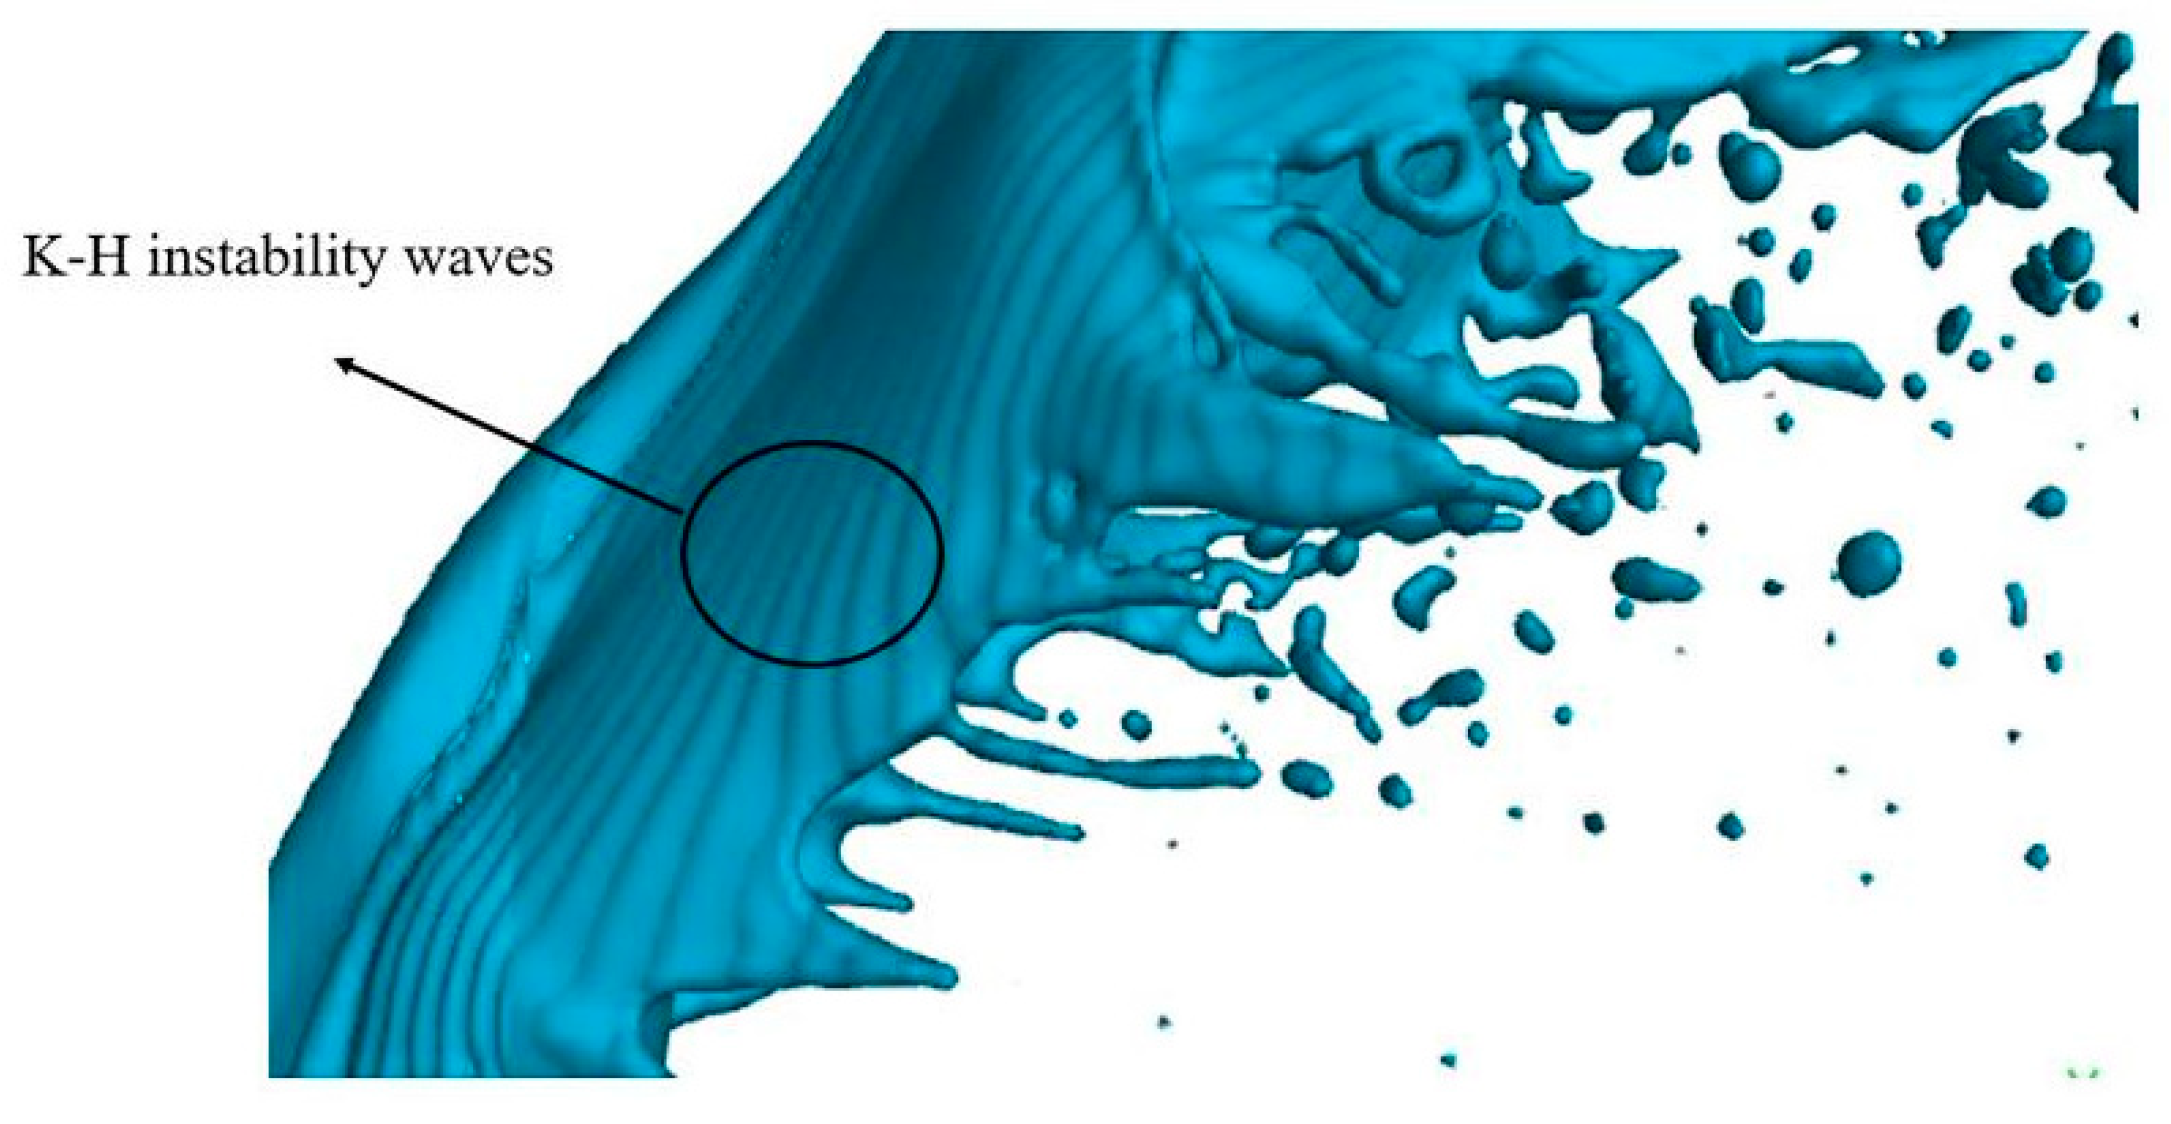
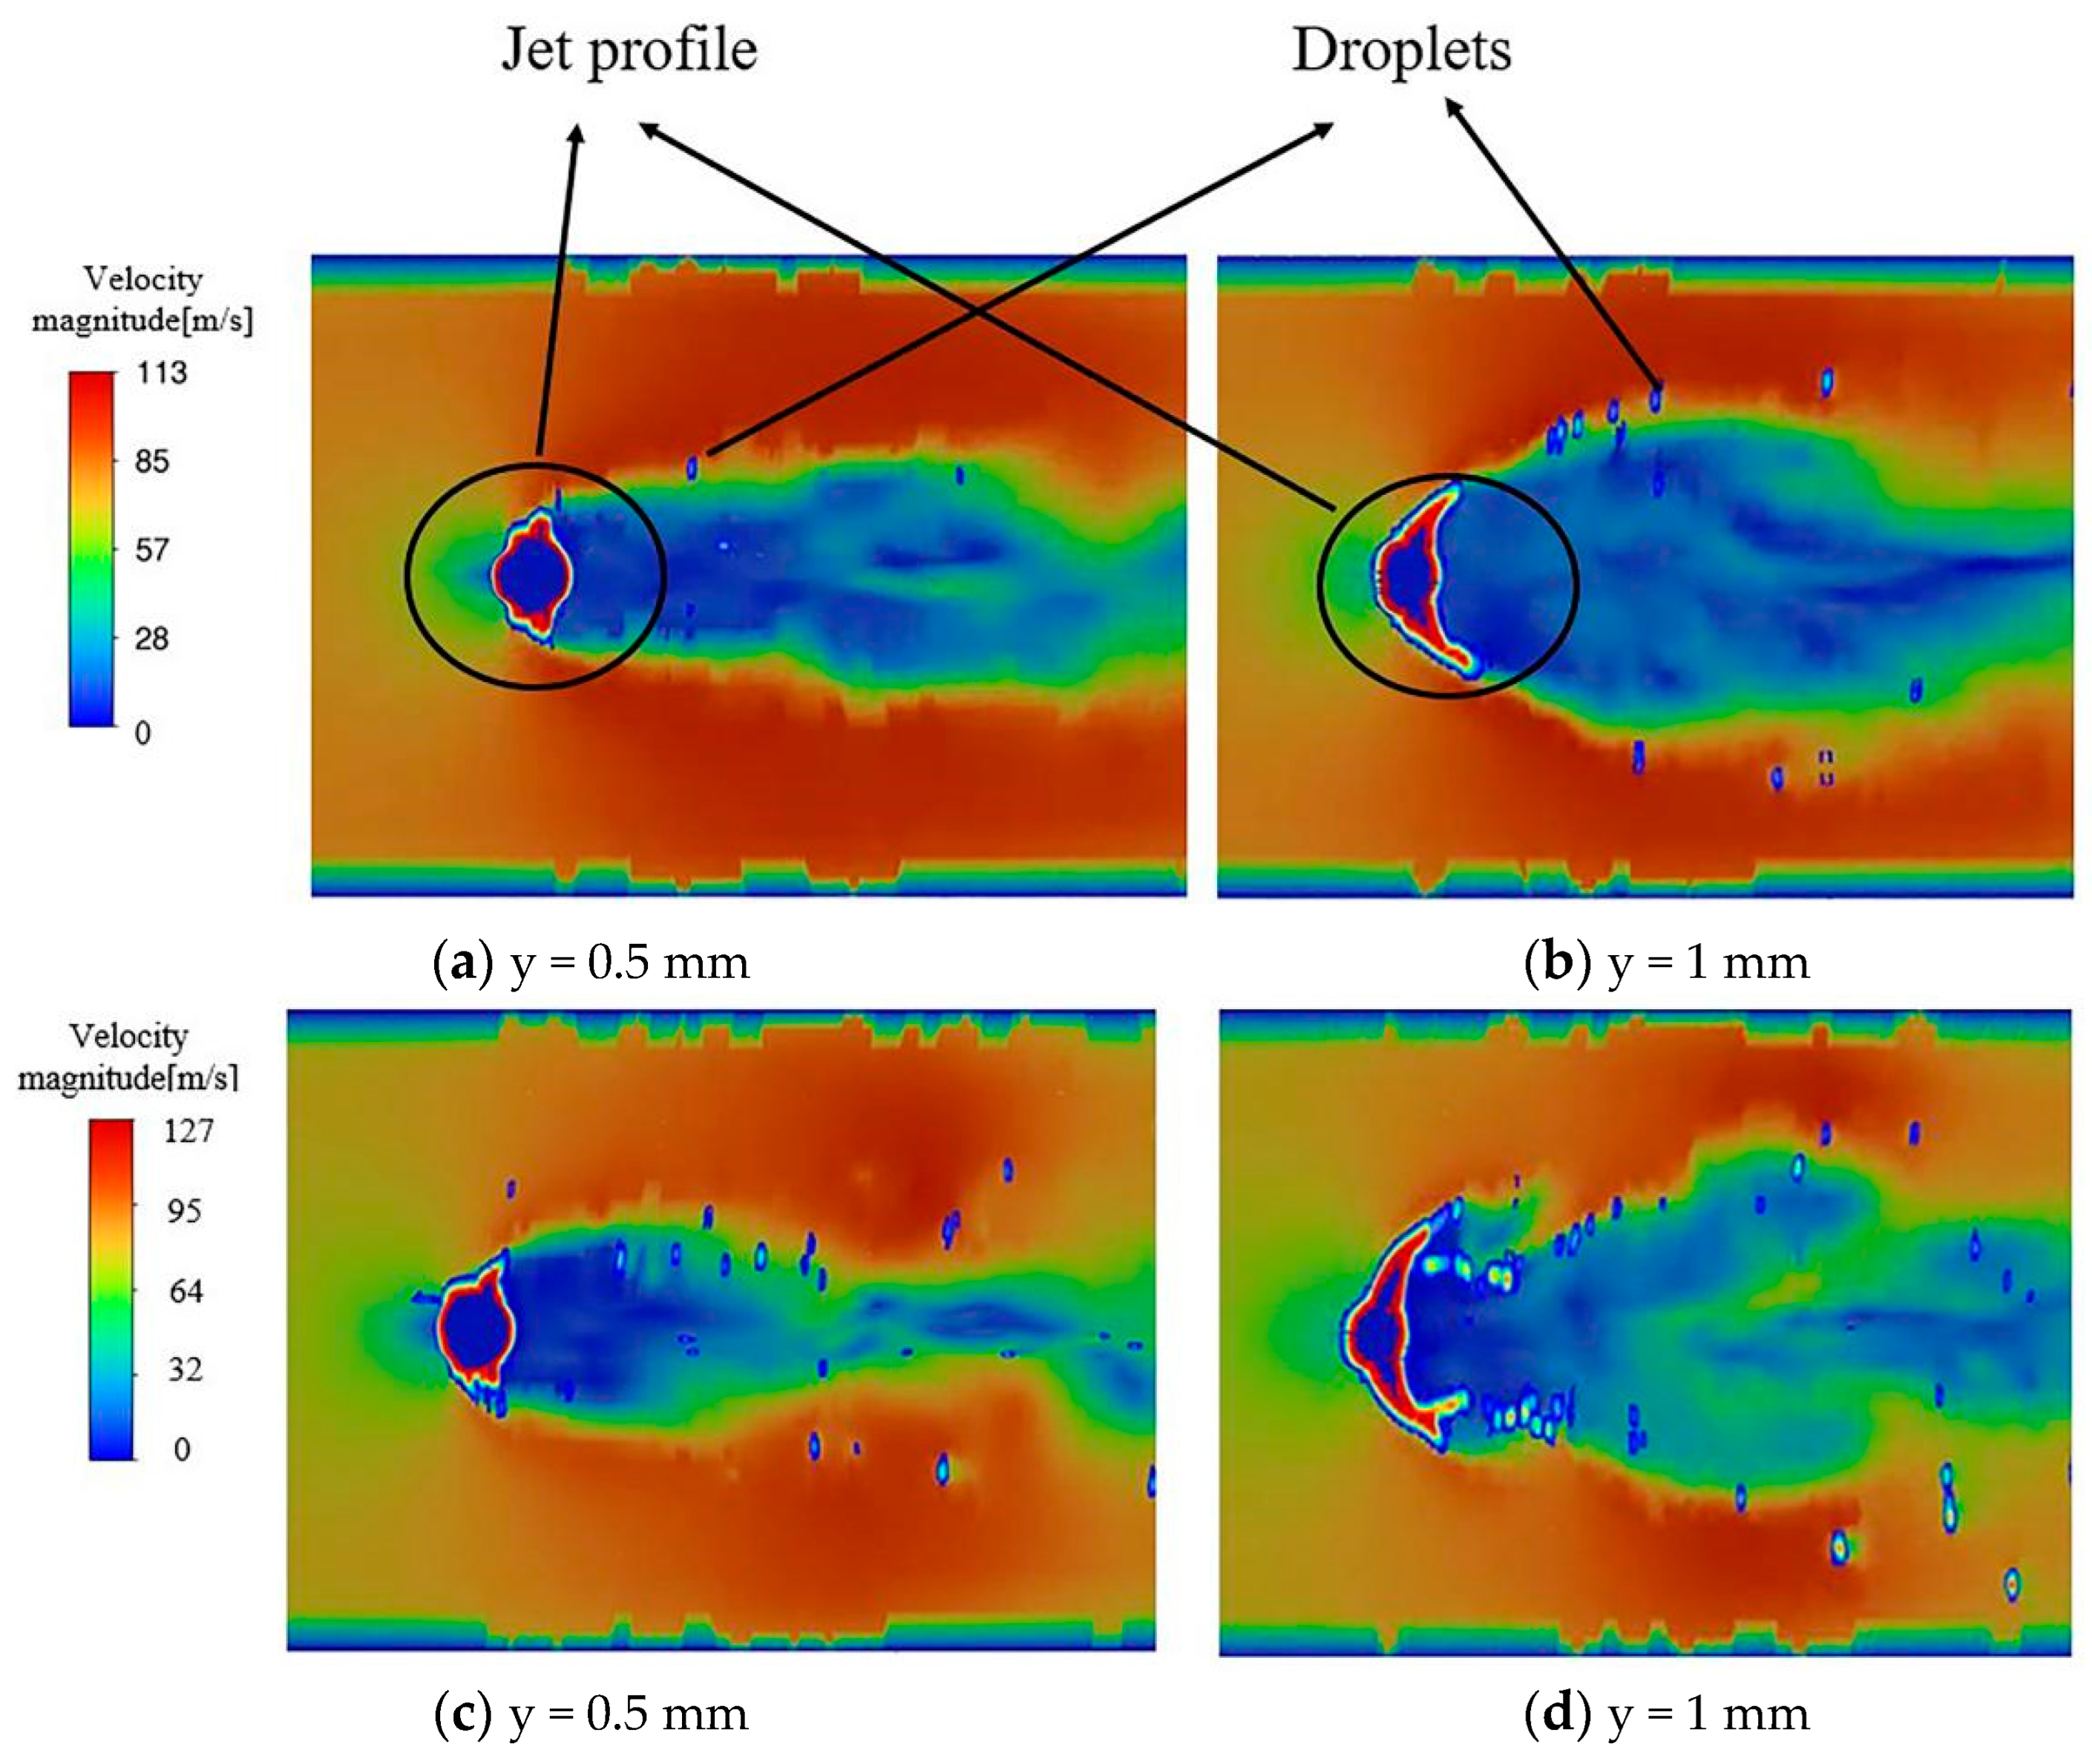
3.1. Jet Morphology

Figure 8 and Figure 9 illustrate the pressure contour and velocity vector of the jet at the root and tail under the conditions of a steady/oscillation inflow velocity at t = 0.5 ms, respectively. Regardless of whether the air inflow is steady or oscillating, the root morphology of the jet remains the same. This is because the presence of the boundary layer results in a lower gas velocity at the root of the jet, and the aerodynamic force is not sufficient to cause jet deformation. As the jet penetration depth increases, the contact area between the airflow and the jet increases, and the interaction between the gas and liquid phases also increases, leading to the deflection and deformation of the jet. The transverse inflow stagnates in front of the jet due to its obstruction, creating a small high-pressure zone, and then experiences flow separation. While the remainder of the airflow runs over the surface of the jet, part of the gas flow produces a recirculation close to the wall. Under the pressure difference before and after the jet, the transverse airflow passes through the continuous jet, causing the jet to break up.
Because of the tangential velocity gradient between the air and the jet, Kelvin–Helmholtz (K-H) instability waves are produced and emerge after the high-velocity air flow with centerline symmetry in the jet deviates along the surface of the jet [26]. Eventually, the jet forms a filament and further breaks up into droplets, as shown in Figure 10. Figure 11 presents the deformation of the liquid column at y = 0.5 mm and 1 mm, as well as the velocity cloud map on the x–z plane perpendicular to the jet direction under steady/oscillating inflow conditions at t = 0.5 ms. From Figure 11, it can be observed that compared with the steady-air inflow conditions, the deformation of the liquid column is more conspicuous under oscillating inflow conditions, and a larger number of droplets are detached from the liquid column surface. This is because the fluctuation of the airflow under oscillating inflow conditions causes aerodynamic fluctuations that make the airflow on the leeward side of the jet more turbulent, resulting in more droplets being detached from the jet column surface.
Figure 12 and Figure 13 show the development of the jet flow under steady/oscillating air inflow conditions within t = 0.5~1.5 ms, respectively. In the case of a steady air inflow, surface waves emerge on the jet surface due to the interaction between the gas and liquid, as well as the turbulence generated by the jet itself. These surface waves then propagate along the jet, characterized by an increase in their wavelength and amplitude. Eventually, the jet breaks up at the trough of the surface wave, forming large liquid fragments. Under the influence of aerodynamic forces, these liquid fragments continue to break up into smaller droplets, accompanied by the development of the next surface wave.
At the same time, under oscillating inflow conditions, the jet fragmentation morphology differs from that of steady state. During the initial period, surface waves occur on the jet surface, but they develop slowly without a significant increase in wavelength or amplitude. The breakup point of the liquid film remains at the tail of the jet, where it is stretched and thinned by aerodynamic forces, forming ligament filaments that eventually break up. As the jet develops over time, the surface waves increase until the jet disintegrates. However, since the tail of the continuous jet has already broken up, there are no large liquid fragments present, only small liquid clusters that further break up into droplets.
Figure 14 depicts a vector graph of the jet surface velocity under steady conditions at t = 0.75 ms. The presence of surface wave structures on the jet’s surface can be attributed to the pressure difference before and after the jet, resulting in the occurrence of Rayleigh–Taylor instability and the formation of Rayleigh–Taylor unstable waves [24]. The incoming gas stagnates and separates at the surface wave, giving rise to vortices at the trough of the wave. This enhances the interaction between the gas and the liquid. While a portion of the gas continues to propagate along the jet surface, the vortices at the trough of the wave exert a dominant influence on the jet, leading to its breakup at the trough of the surface wave. Subsequently, under aerodynamic forces, the jet further disintegrates into smaller droplets.
Figure 15 shows a vector graph of the jet surface velocity under oscillating inflow conditions at the same moment. The growth rate of the surface waves is influenced by aerodynamic forces. At this time, the air velocity of the oscillating inflow is slower than that of the steady inflow, and the velocity of the incoming flow decreases during this time period. Therefore, the surface wave growth of the jet is slow, and the depression on the jet surface is minimal. The transverse airflow cannot form vortices at the surface wave. The majority of the air inflow develops along the jet surface, exerting force on the rear of the jet and causing it to break up. During 1 ms~1.5 ms, the velocity of the transverse inflow continues to increase, leading to an escalation in the growth rate of the surface wave. Eventually, the surface wave becomes unable to withstand the aerodynamic force, resulting in the breakup of the jet at the trough of the surface wave. At this point, the development of the surface wave and the fragmentation of the tail occur simultaneously.
Figure 16 and Figure 17 illustrate the morphology of liquid atomization under steady/oscillating air crossflow conditions from 1.5 ms to 2 ms, respectively. Under steady-state air crossflow conditions, the jet experiences continuous breakup following its initial pattern. This process involves successive increases and breakups of surface waves on the jet surface, leading to the presence of liquid fragments in the spray field. However, under oscillating air crossflow conditions, the air velocity gradually increases, and the effect of gas on the jet surface is enhanced during this period. The growth rate of the surface waves increases, gradually becoming the dominant factor in affecting the jet.
Throughout the entire spray process, the jet breakup model varies with the fluctuation of air velocity under oscillating air crossflow conditions. Zandian et al. [30] identified three mechanisms and defined their dominant domains on the Weg–Rel diagram. The first mechanism involves liquid thinning and perforation, forming holes and liquid bridges. As the perforation expands, the liquid bridges break, and the liquid threads stretch and rupture into droplets due to capillary action. The second mechanism involves the formation of multiple ripples and the extension of liquid threads at the tail of the jet, which directly break into ligaments and droplets. The third mechanism is similar to the second one, but it does not involve the formation of ripples during the breakup process.
This study focuses on the first and second mechanisms mentioned above. Under steady-state air crossflow conditions, the jet breakup process corresponds to the first mechanism, while under oscillating crossflow conditions, the jet breakup at the tail corresponds to the second mechanism. Under the same Rel conditions, the first mechanism corresponds to a larger Weg value, while the second mechanism is associated with a smaller Weg value. Within 0.5 ms~1 ms, the oscillating crossflow velocity decreases continuously. Compared to in steady-state conditions, the jet transitions to the second breakup mode at relatively lower Weg values. From 1 ms to 1.5 ms, the crossflow velocity increases, resulting in the coexistence of both mechanisms due to the relatively small average velocity during this time period. From 1.5 ms to 2 ms, the average velocity of the crossflow gas reaches its peak, and the jet transitions to the first breakup mode at relatively higher Weg values, which is consistent with the findings of Zandian et al. [30].

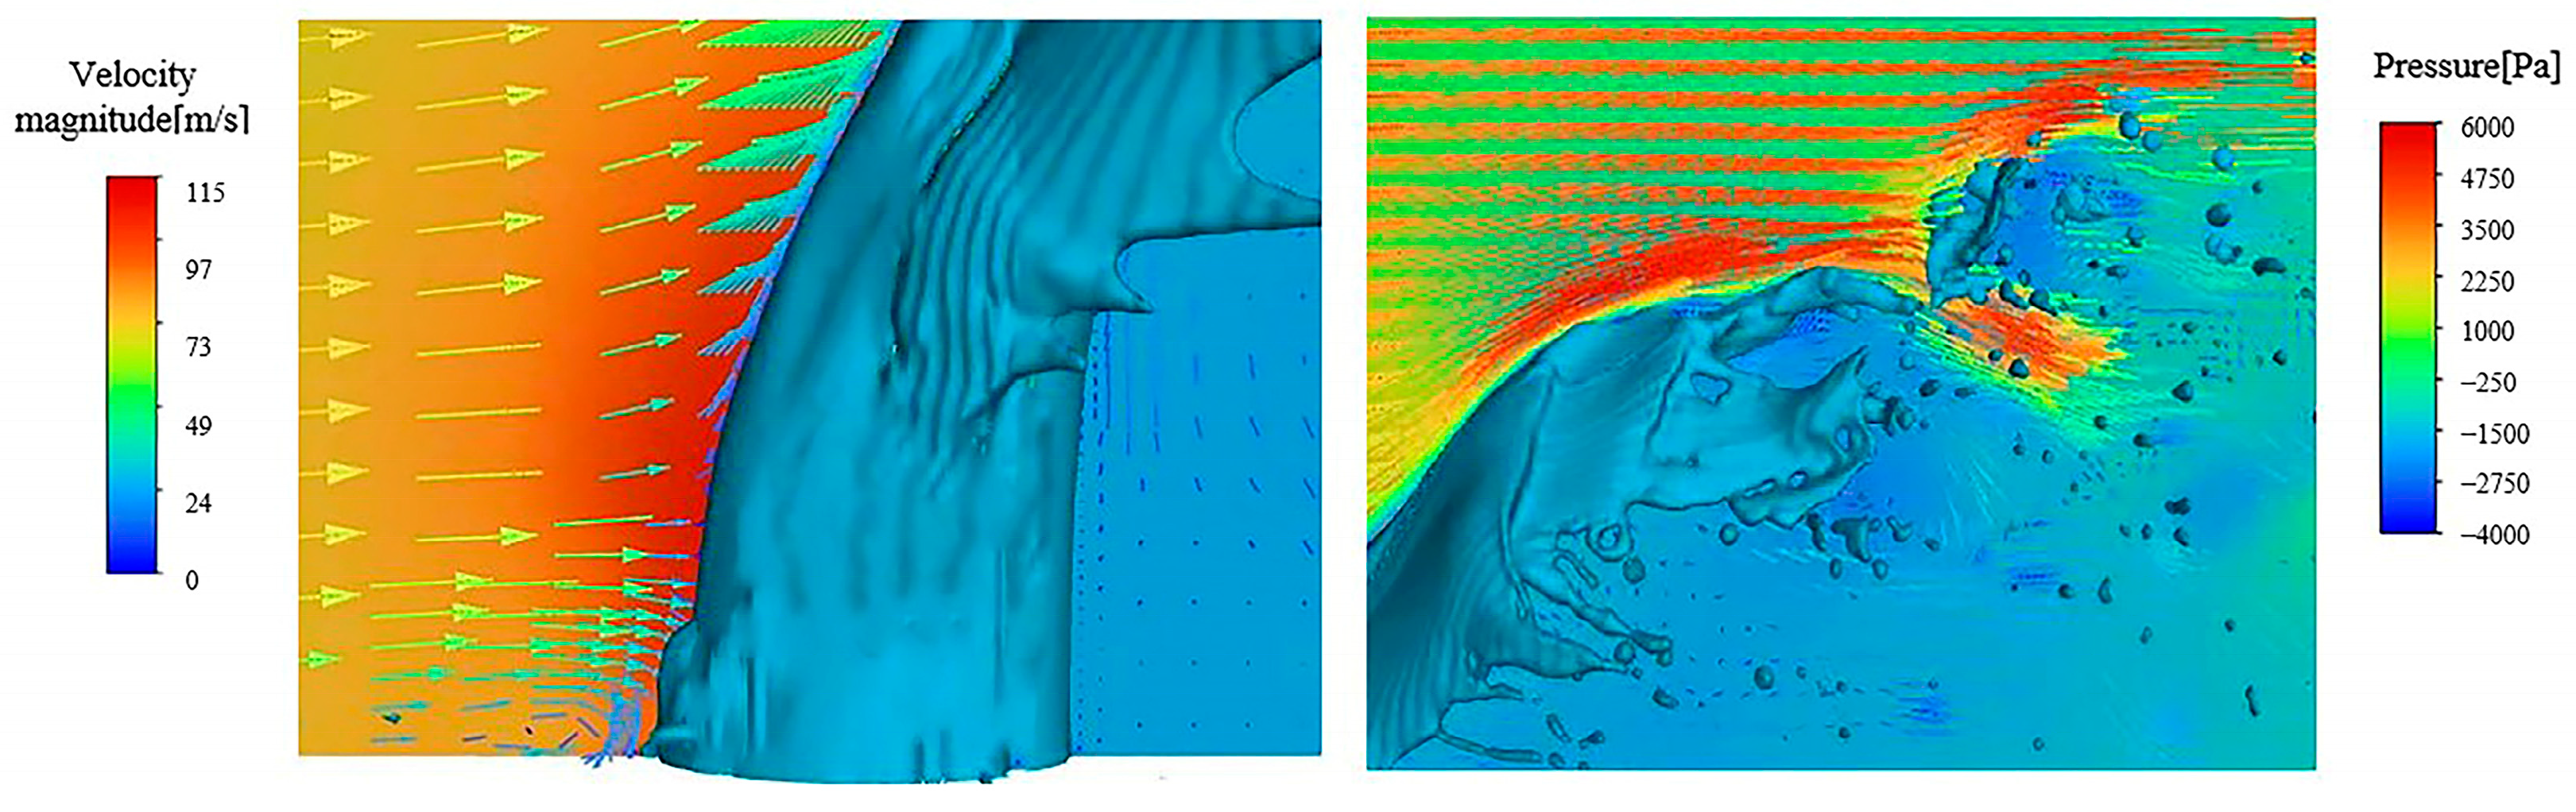
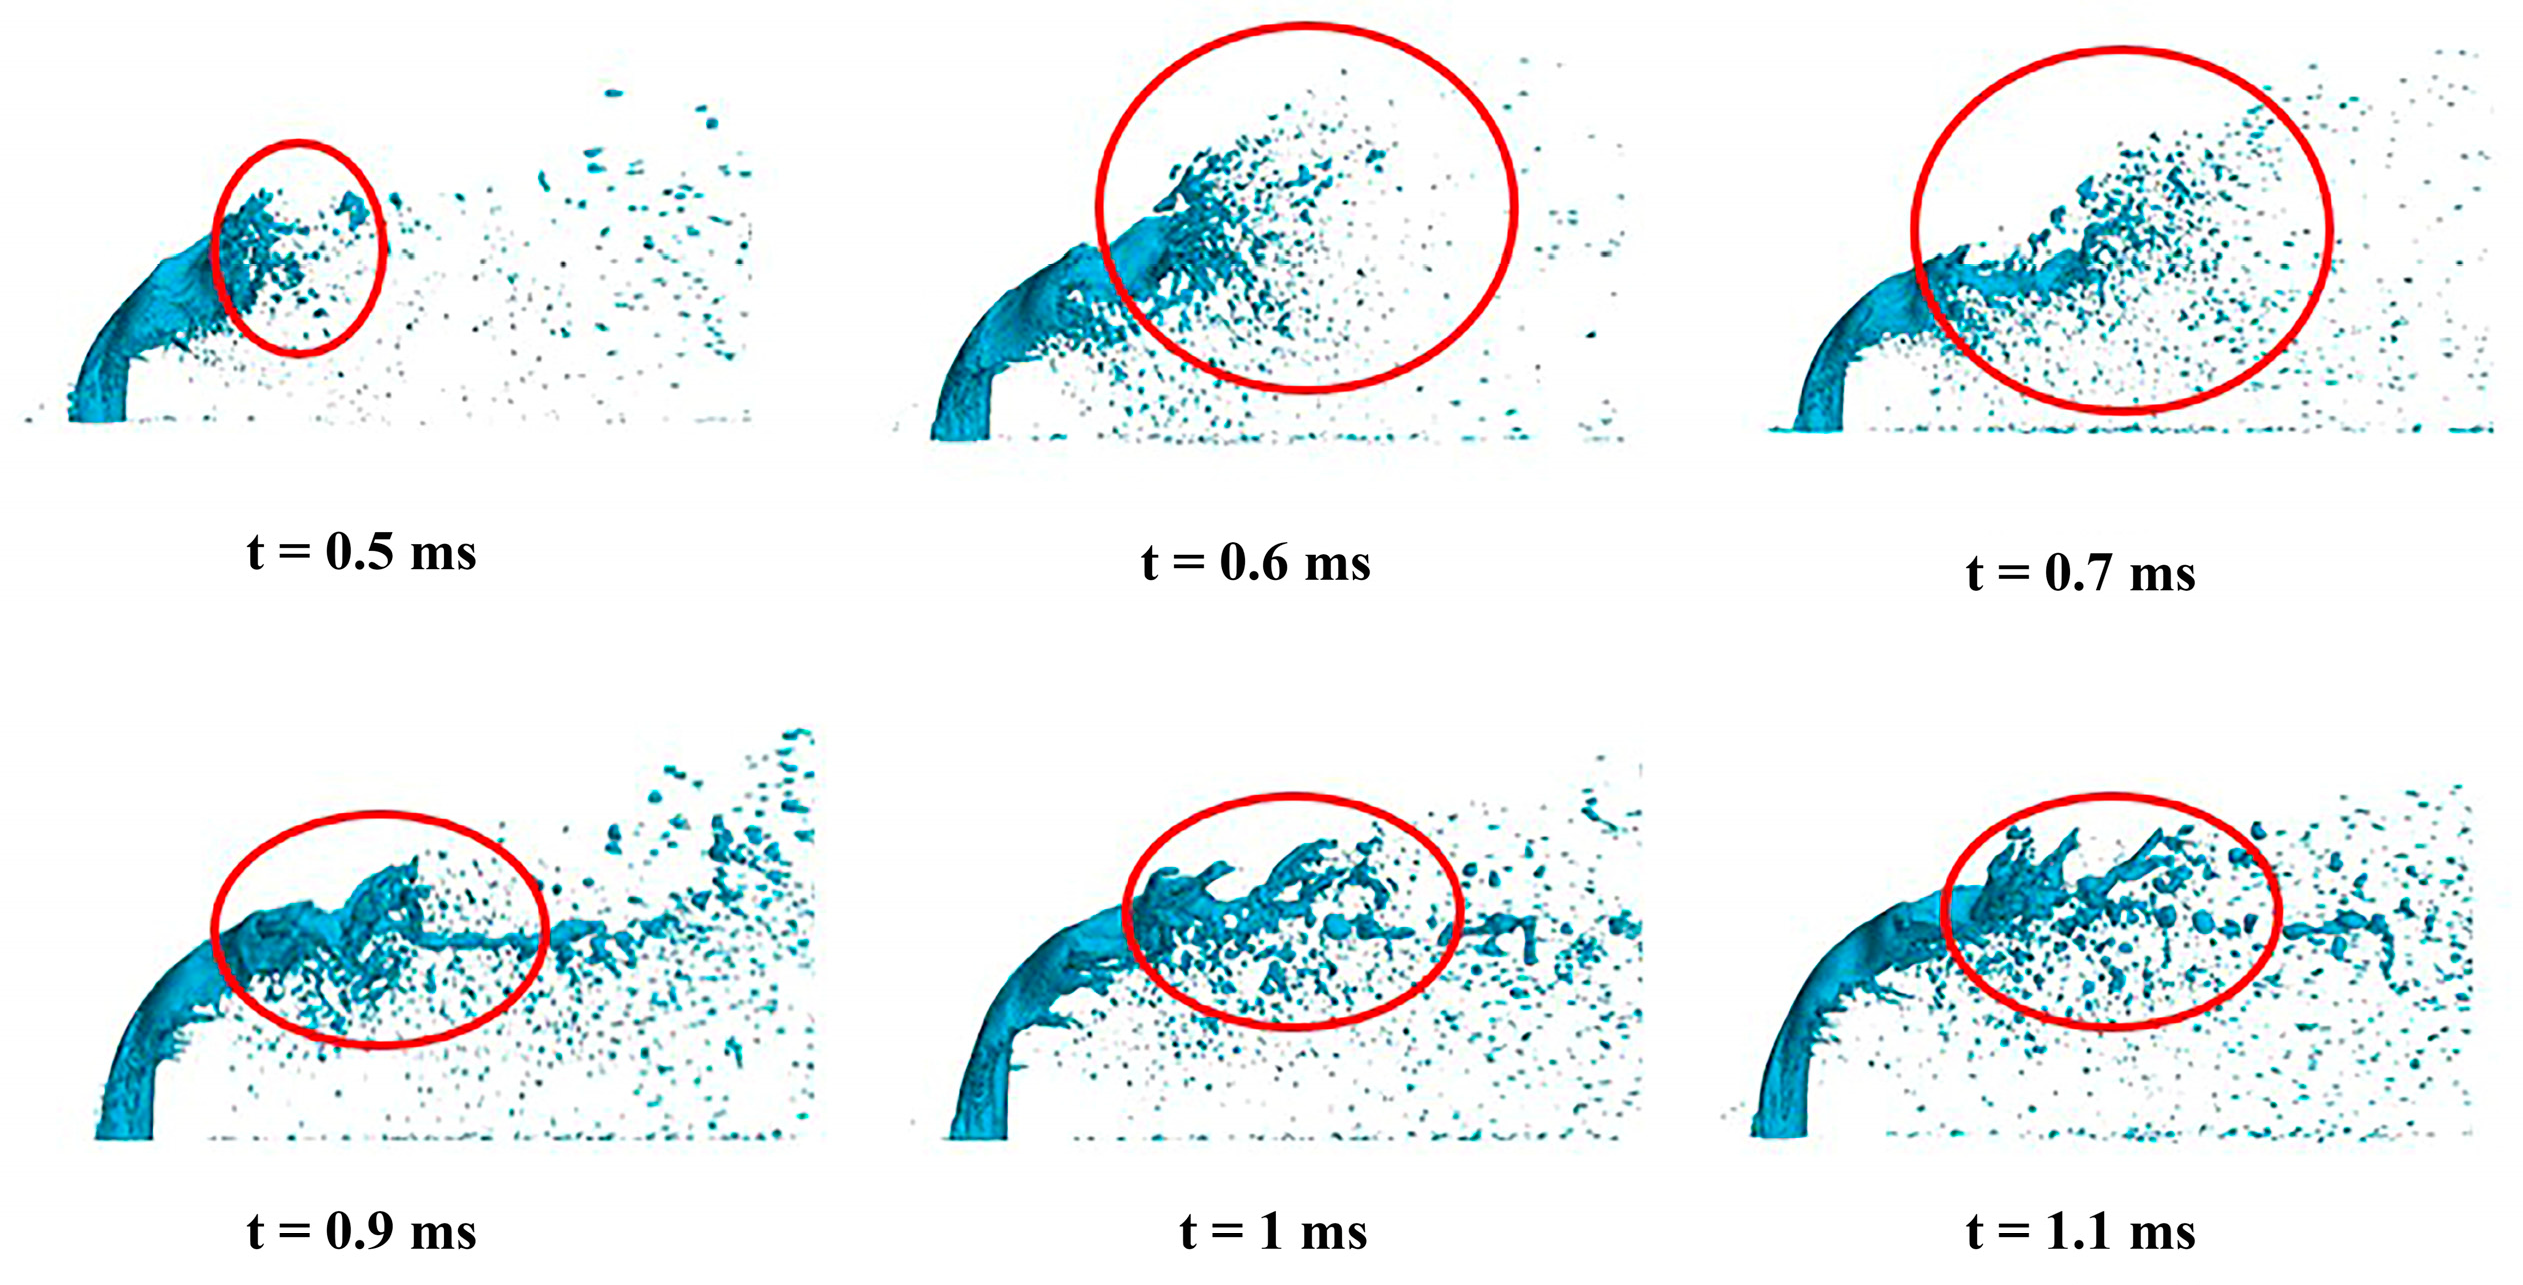
3.2. The Development of Oscillating Air Crossflow

Figure 18 shows the development process of a jet under oscillating air crossflow conditions during the second cycle. During the 0–1/4 T period, the jet continues to progress from the previous cycle. The jet breaks at the trough of the surface wave, forming larger liquid masses. Then, these liquid masses break up into smaller droplets due to the aerodynamic forces.
During the period from 1/4 to 2/4 T, the crossflow velocity gradually decreases and reaches its minimum. Consequently, the aerodynamic forces exerted by the crossflow on the jet are also minimal during this stage. As a result, the detachment of liquid masses from the continuous jet occurs at a slower rate. It is worth noting that there is no significant separation of large liquid fragments from the jet column during this stage. Instead, the primary phenomenon observed is the development of surface waves on the jet.
During the 2/4–3/4 T period, the crossflow velocity begins to increase. The jet begins to disintegrate and then forms liquid fragments, which tend to move towards the wall. At the same time, the velocity at which the liquid fragments break into droplets decreases significantly. Surface waves only appear upwind of the jet during this stage. This is because the average air crossflow velocity is still relatively low, leading to insufficient aerodynamic forces. Additionally, the crossflow, impeded by the jet, applies a reduced force on the liquid fragments, resulting in the movement of the liquid masses towards the wall due to gravity. Furthermore, the breakup length gradually increases during this stage. The breakup length is that when the core jet maintains a continuous liquid column, the jet distance from the outlet of the nozzle to the rupture of the continuous liquid column [31]. Sallam et al. [32] have summarized an empirical formula for the jet breakup length, which shows that the breakup length is proportional to the gas Weber number under a constant jet velocity. The results obtained in this study are consistent with the conclusion drawn by Sallam et al. [32].
During the 3/4–4/4 T period, compared to the previous stage, the tail of the liquid jet is elevated, and there is a notable rise in the number of droplets on the leeward side of the continuous jet. Droplets are observed upwind of the jet during this time period. Additionally, the number of droplets near the jet column is the highest during this stage. Simultaneously, the deviation of the jet column increases, and both the windward and leeward sides of the jet exhibit surface waves. This phenomenon facilitates increased air entrainment, thereby aiding in the disintegration of the jet. This can be attributed to the maximum average crossflow velocity, which leads to the exertion of the strongest aerodynamic forces on the jet at this particular time.

3.3. Penetration Depth

Figure 19 shows the variation trend of the penetration depth of the jet during the second cycle under oscillation crossflow conditions. The average penetration depth of the jet during each 1/4 cycle at the same time interval is considered the average penetration depth of the flow during that period. The average liquid-to-gas momentum flux ratio, q, is calculated by averaging the air velocity over the same time interval. From 0 T–1/4 T to 2/4–3/4 T, the average jet penetration depth decreases, and q increases. From 2/4 T–3/4 T to 3/4T–4/4 T, the average penetration depth increases, while q decreases. Previous research has shown that the jet penetration depth increases with q [13,14], and it can be concluded that the response of the jet penetration depth to crossflow oscillations lags by half a cycle, as observed in Figure 19. This behavior is most probably due to the inertia of the liquid jet. Based on this trend, the average penetration depth of the jet should increase in the next 1/4 T, aligning with the maximum average jet penetration depth during the 0–1/4 T time period within this cycle, forming an upward and downward flapping model.

4. Conclusions

In this study, numerical investigations were conducted on the primary breakup of liquid transverse jets under steady/oscillating inflow conditions using the Volume of Fluid (VOF) method combined with the grid adaptation technique. The breakup processes of the jets under these two conditions were described, and the behavior and penetration depth of the jets under oscillating air crossflow conditions during the second cycle were observed. The conclusions are as follows.
In this study, surface waves occur on the surface of the jet under two conditions during the development stage of the jet. The difference in transverse flow velocities results in varying speeds of surface wave development. In a steady transverse flow, the jet breaks up as the surface waves develop continuously, eventually breaking at the trough of the surface waves. While the jet first breaks up at the tail of the jet under oscillating transverse flow conditions, the jet breaks simultaneously at the trough of the surface waves and at the tail of the jet as time progresses. Finally, the jet breakup is dominated by surface waves.
During the second cycle of air oscillations, the transverse flow velocity initially decreases, followed by an increase. The jet fragmentation pattern produces reasonable changes as the transverse velocity oscillates. As the transverse flow velocity decreases, the detachment speed of the liquid fragments from the continuous liquid column decreases, accompanied by a tendency for the liquid fragments to move towards the wall. When the transverse flow velocity increases, the liquid fragments detach from the liquid column and move closer to the wall. Then, the tail of the liquid jet is elevated, forming an up-and-down flapping mode. At the same time, the breakup length of the jet increases, and the number of droplets near the jet column increases. Surface waves form on both the windward and leeward sides of the jet, promoting jet fragmentation.
Under oscillating crossflow conditions, the jet penetration depth fluctuates in response to the crossflow air velocity oscillating, and there is a half-cycle delay in the response of the jet penetration depth to the transverse velocity fluctuations.

Author Contributions

Conceptualization, T.Z., X.S. and X.K.; methodology, T.Z.; validation, T.Z. and X.S.; formal analysis, X.K.; investigation, T.Z. and X.S.; resources, T.Z.; data curation, X.S. and X.K; writing—original draft preparation, X.S.; writing—review and editing, T.Z., X.S. and X.K.; supervision, Y.H.; project administration, R.L.; funding acquisition, R.L. All authors have read and agreed to the published version of the manuscript.

Funding

This work was supported by Liaoning Revitalization Talents Program (Grant No. XLYC2008013).

Data Availability Statement

The data presented in this study are available on request from the corresponding author and the 1st author.

Conflicts of Interest

The authors declare no conflict of interest.

References

  1. Rezayat, S.; Farshchi, M.; Ghorbanhoseini, M. Primary breakup dynamics and spray characteristics of a rotary atomizer with radial-axial discharge channels. Int. J. Multiph. Flow 2019, 111, 315–338. [Google Scholar] [CrossRef]
  2. Mazallon, J.; Dai, Z.; Faeth, G. Aerodynamic primary breakup at the surface of nonturbulent round liquid jets in crossflow. In Proceedings of the 36th AIAA Aerospace Sciences Meeting and Exhibit, Reno, NV, USA, 12–15 January 1998. [Google Scholar]
  3. Wu, P.K.; Kirkendall, K.A.; Fuller, R.P.; Nejad, A.S. Breakup Processes of Liquid Jets in Subsonic Crossflows. J. Propuls. Power 1997, 13, 64–73. [Google Scholar] [CrossRef]
  4. Schetz, J.A.; Padhye, A. Penetration and Breakup of Liquids in Subsonic Airstreams. AIAA J. 1977, 15, 1385–1390. [Google Scholar] [CrossRef]
  5. Lubarsky, E.; Shcherbik, D.; Bibik, O.; Gopala, Y.; Zinn, B.T. Fuel Jet in Cross Flow—Experimental Study of Spray Characteristics. In Advanced Fluid Dynamics; In Tech: London, UK, 2012. [Google Scholar]
  6. Xiao, F.; Sun, M.B. Effects of Mach number on liquid jet primary breakup in gas crossflow. At. Sprays 2018, 28, 975–999. [Google Scholar] [CrossRef]
  7. Zhao, J.; Ren, Y.; Tong, Y.; Lin, W.; Nie, W. Atomization of a liquid jet in supersonic crossflow in a combustion chamber with an expanded section. Acta Astronaut. 2021, 180, 35–45. [Google Scholar] [CrossRef]
  8. Sinha, A. Surface Waves on Liquid Jet in Crossflow: Effect of Injector Geometry. AIAA J. 2019, 57, 4577–4582. [Google Scholar] [CrossRef]
  9. Lee, S.; Kim, W.; Yoon, W. Spray formation by a swirl spray jet in low speed cross-flow. J. Mech. Sci. Technol. 2010, 24, 559–568. [Google Scholar] [CrossRef]
  10. Im, K.S.; Zhang, Z.C.; Cook, G.; Lai, M.C.; Chon, M.S. Simulation of Liquid and Gas Phase Characteristics of Aerated-Liquid Jets in Quiescent and Cross Flow Conditions. Int. J. Automot. Technol. 2019, 20, 207–213. [Google Scholar] [CrossRef]
  11. Lee, I.C.; Kang, Y.S.; Moon, H.J.; Jang, S.P.; Kim, J.K.; Koo, J. Spray jet penetration and distribution of modulated liquid jets in subsonic cross-flows. J. Mech. Sci. Technol. 2010, 24, 1425–1431. [Google Scholar] [CrossRef]
  12. Nygård, A.; Altimira, M.; Semlitsch, B.; Wittberg, L.P.; Fuchs, L. Analysis of Vortical Structures in Intermittent Jets. In Proceedings of the International Conference of Jets, Wakes and Separated Flows (ICJWSF2015), Stockholm, Sweden, 15–18 June 2015. [Google Scholar]
  13. Sharma, A.; Lee, J.G. Dynamics of Near-field and Far-field Spray Formed by Liquid Jet in Oscillating Crossflow. J. Int. Inst. Liq. At. Spray Syst. 2018, 28, 1–21. [Google Scholar] [CrossRef]
  14. Bunce, K.; Lee, J.; Santavicca, D. Characterization of Liquid Jets-In-Crossflow Under High Temperature, High Velocity Non-Oscillating and Oscillating Flow Conditions. In Proceedings of the 44th AIAA Aerospace Sciences Meeting and Exhibit, Reno, NV, USA, 9–12 January 2006; American Institute of Aeronautics and Astronautics: Reston, VA, USA, 2006. [Google Scholar]
  15. Song, J.; Lee, J.G. Characterization of Spray Formed by Liquid Jet Injected Into Oscillating Air Crossflow. In Asme Turbo Expo: Turbine Technical Conference & Exposition; American Society of Mechanical Engineers: New York, NY, USA, 2015. [Google Scholar]
  16. Anderson, T.; Kendrick, D.; Cohen, J. Measurement of spray/acoustic coupling in gas turbine fuel injectors. In Proceedings of the 36th AIAA Aerospace Sciences Meeting and Exhibit, Reno, NV, USA, 12–15 January 1998. [Google Scholar]
  17. Wen, J.; Hu, Y.; Kurose, R. Numerical simulation of kerosene jet in crossflow atomization and evaporation under the elevated pressure and oscillating air-flow condition. At. Sprays 2021, 31, 73–87. [Google Scholar] [CrossRef]
  18. Lee, I.; Kang, Y.; Koo, J. Mixing Characteristics of Pulsed Air-assist Liquid Jet into an Internal Subsonic Cross-flow. J. Therm. Sci. 2010, 19, 136–140. [Google Scholar] [CrossRef]
  19. Bodoc, V.; Desclaux, A.; Gajan, P.; Simon, F.; Illac, G. Characterization of Confined Liquid Jet Injected into Oscillating Air Crossflow. Flow Turbul. Combust. 2019, 116, 1–18. [Google Scholar] [CrossRef]
  20. Desclaux, A.; Thuillet, S.; Zuzio, D.; Senoner, J.M.; Sebbane, D.; Bodoc, V.; Gajan, P. Experimental and Numerical Characterization of a Liquid Jet Injected into Air Crossflow with Acoustic Forcing. Flow Turbul. Combust. 2020, 105, 1087–1117. [Google Scholar] [CrossRef]
  21. Brackbill, J.U.; Kothe, D.B. Dynamical modeling of surface tension. In Proceedings of the Third Microgravity Fluid Physics Conference, Cleveland, OH, USA, 13–15 June 1996. [Google Scholar]
  22. Ubbink, O.; Issa, R.I. A Method for Capturing Sharp Fluid Interfaces on Arbitrary Meshes. J. Comput. Phys. 1999, 153, 26–50. [Google Scholar] [CrossRef]
  23. Li, C.; Shen, C.B.; Li, Q.L. Primary breakup process of liquid jet in supersonic crossflow. J. Natl. Univ. Def. Technol. 2019, 41, 73–78. [Google Scholar]
  24. Hirt, C.W.; Nichols, B.D. Volume of fluid (VOF) method for the dynamics of free boundaries. J. Comput. Phys. 1981, 39, 201–225. [Google Scholar] [CrossRef]
  25. Zhou, Y.; Li, Q.; Li, C. Study on Breaking Process of Liquid Jet in Supersonic Flow Based on Adaptive Mesh. J. Propuls. Technol. 2020, 41, 1571–1579. [Google Scholar]
  26. Zhang, B.; Cheng, P.; Li, Q.L.; Chen, H.Y.; Li, C.Y. Breakup process of liquid jet in gas film. Acta Phys. Sin. 2021, 70, 1–12. [Google Scholar] [CrossRef]
  27. Wang, Y.; Yan, Y.; Dang, L.; LI, J. Numerical investigation on atomization characteristics of liquid jet. J. Aerosp. Power 2016, 31, 2464–2471. [Google Scholar]
  28. Tachibana, S.; Saito, K.; Yamamoto, T.; Makida, M.; Kitano, T.; Kurose, R. Experimental and numerical investigation of thermo-acoustic instability in a liquid-fuel aero-engine combustor at elevated pressure: Validity of large-eddy simulation of spray combustion. Combust. Flame 2015, 162, 2621–2637. [Google Scholar] [CrossRef]
  29. Stenzler, J.N.; Lee, J.G.; Santavicca, D.A.; Lee, W. Penetration of Liquid Jets in a Crossflow. At. Sprays 2013, 16, 887–906. [Google Scholar] [CrossRef]
  30. Zandian, A.; Sirignano, W.A.; Hussain, F. Planar liquid jet: Early deformation and atomization cascades. Phys. Fluids 2017, 29, 062109. [Google Scholar] [CrossRef]
  31. Wan, Y.X.; Huang, Y.; Zhu, Y. Experiment on the breakup process of free round liquid jet. J. Aerodyn. 2008, 23, 208–214. [Google Scholar]
  32. Sallam, K.A.; Dai, Z.; Faeth, G.M. Liquid breakup at the surface of turbulent round liquid jets in still gases. Int. J. Multiph. Flow 2002, 28, 427–449. [Google Scholar] [CrossRef]
Figure 1. Mesh after adaptive encryption. (a) Mesh after encryption of the symmetric plane at the center of the jet. (b) Three-level encrypted grid.
Aerospace 10 00991 g001
Figure 2. Schematic diagram of the computational domain.
Aerospace 10 00991 g002
Figure 3. Dimensioned diagram of the computational domain.
Aerospace 10 00991 g003
Figure 4. Gas flow velocity contour lines under oscillating incoming flow conditions.
Aerospace 10 00991 g004
Figure 5. Penetration depth of the jet under steady-air-velocity crossflow conditions vs. empirical equations.
Aerospace 10 00991 g005
Figure 6. Schematic diagram of the jet liquid column breakup.
Aerospace 10 00991 g006
Figure 7. The initial breakup of the jet under steady-air-velocity crossflow conditions.
Aerospace 10 00991 g007
Figure 8. Coupled pressure and velocity vectors at the root and tail of the jet under steady-air-velocity crossflow conditions.
Aerospace 10 00991 g008
Figure 9. Coupled pressure and velocity vectors at the root and tail of the jet under oscillating conditions.
Aerospace 10 00991 g009
Figure 10. Jet stretching phenomenon.
Aerospace 10 00991 g010
Figure 11. (a,b) liquid-phase and velocity maps superimposed on the steady air inflow conditions; (c,d) liquid-phase and velocity maps superimposed on the oscillating air inflow conditions.
Aerospace 10 00991 g011
Figure 12. Breakup process of the jet under steady-state incoming flow conditions. (The surface wave regions are highlighted in red circles).
Aerospace 10 00991 g012
Figure 13. Breakup process of the jet under oscillating incoming flow conditions. (The breakup regions are highlighted in red circles).
Aerospace 10 00991 g013
Figure 14. Vector plot of jet surface velocity and its regional enlargement under velocity steady air crossflow conditions.
Aerospace 10 00991 g014
Figure 15. Vector plot of jet surface velocity under velocity oscillating air crossflow conditions and its regional magnification.
Aerospace 10 00991 g015
Figure 16. Jet morphology under steady-state crossflow conditions.
Aerospace 10 00991 g016
Figure 17. Jet morphology under oscillating crossflow conditions. (The surface wave regions are highlighted in red circles).
Aerospace 10 00991 g017
Figure 18. The development process of a jet under oscillating crossflow. (a) (0–1/4) T. (b) (1/4–2/4) T. (c) (2/4–3/4) T. (d) (3/4–4/4) T.
Aerospace 10 00991 g018
Figure 19. Trends in jet penetration depth.
Aerospace 10 00991 g019
Table 1. Steady-state air working condition parameters.
Gas InletJet Inlet
MediumAirWater
Density, ρ (kg/m3)1.225998.2
Kinematic viscosity, μ (Pa·s)1.7894 × 10−50.001003
Liquid–gas momentum flux ratio (q)4.58
Disclaimer/Publisher’s Note: The statements, opinions and data contained in all publications are solely those of the individual author(s) and contributor(s) and not of MDPI and/or the editor(s). MDPI and/or the editor(s) disclaim responsibility for any injury to people or property resulting from any ideas, methods, instructions or products referred to in the content.

