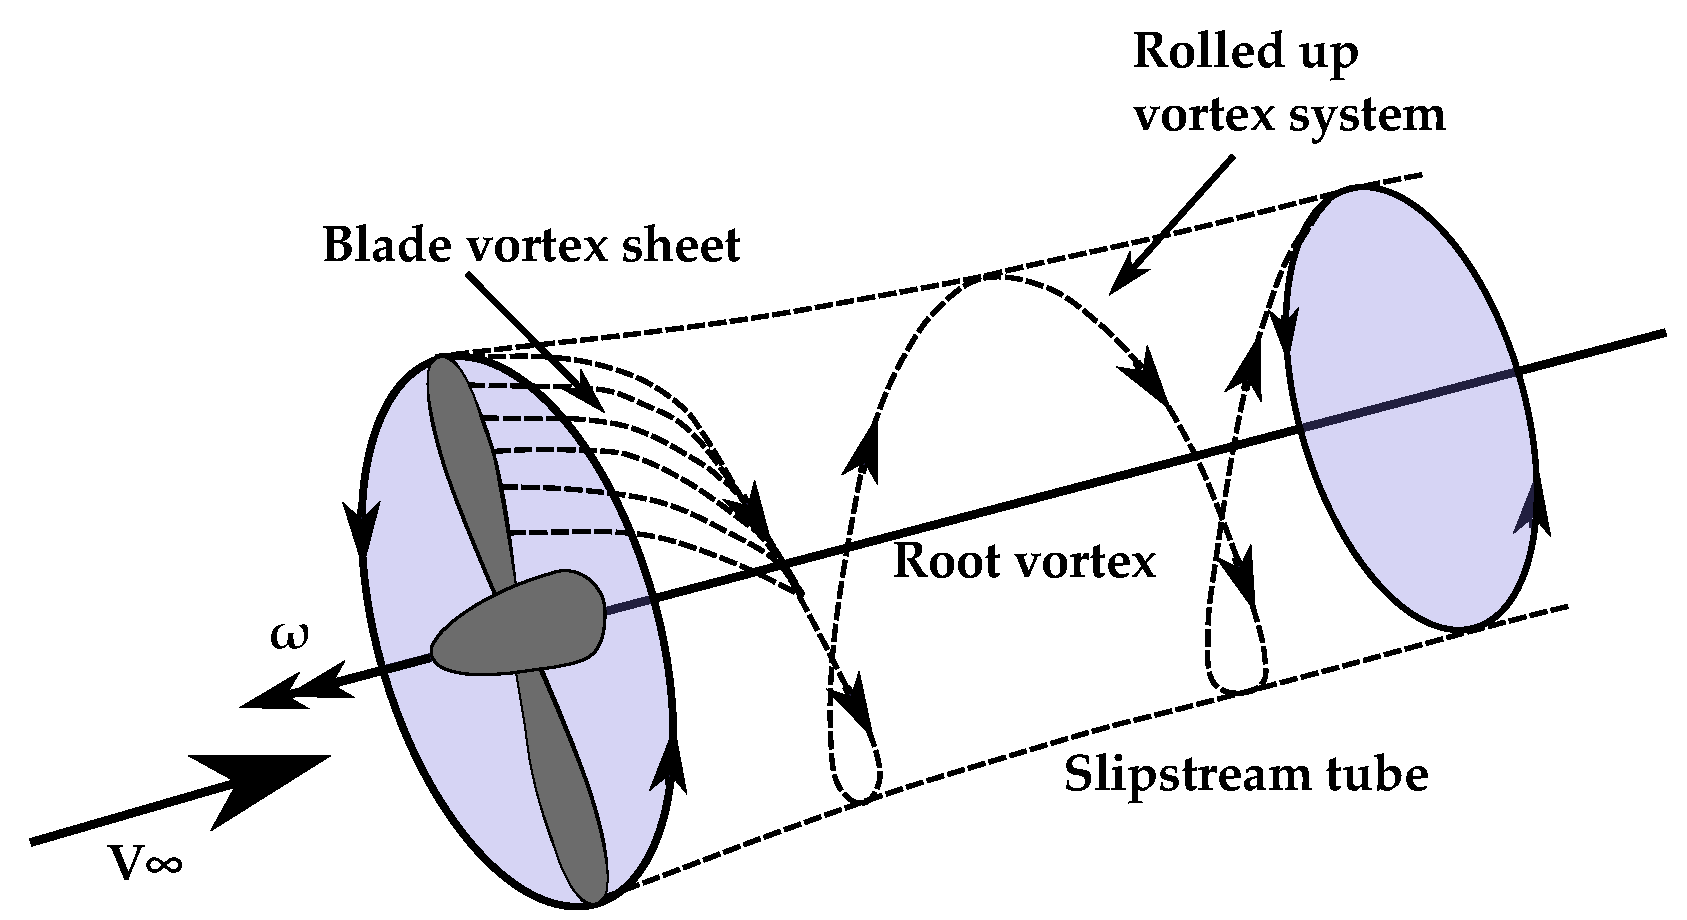
Figure 1.
Vortex system and slipstream tube behind a propeller.
Figure 1.
Vortex system and slipstream tube behind a propeller.
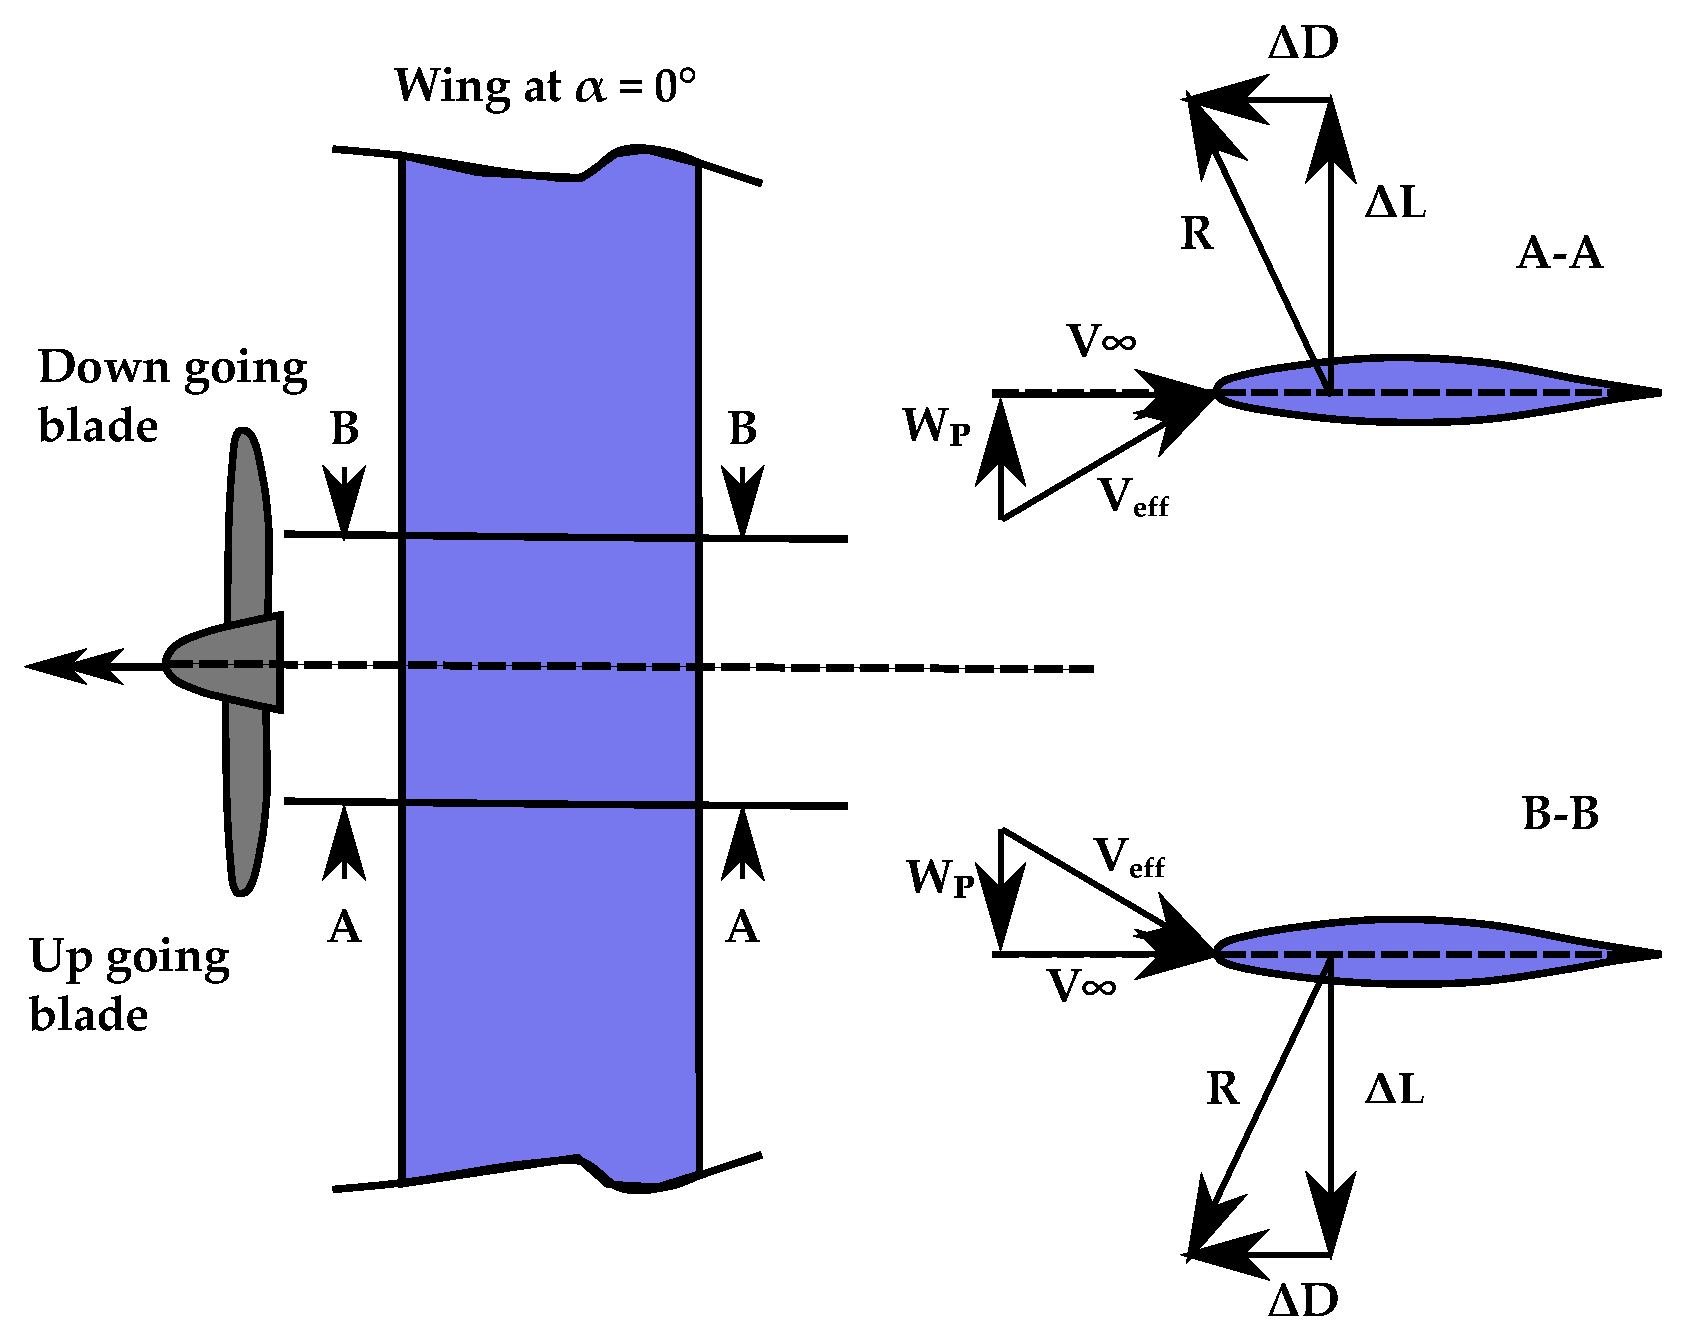
Figure 2.
Local forces on a wing section inside the propeller slipstream: upwash region (section A-A) and downwash region (section B-B).
Figure 2.
Local forces on a wing section inside the propeller slipstream: upwash region (section A-A) and downwash region (section B-B).
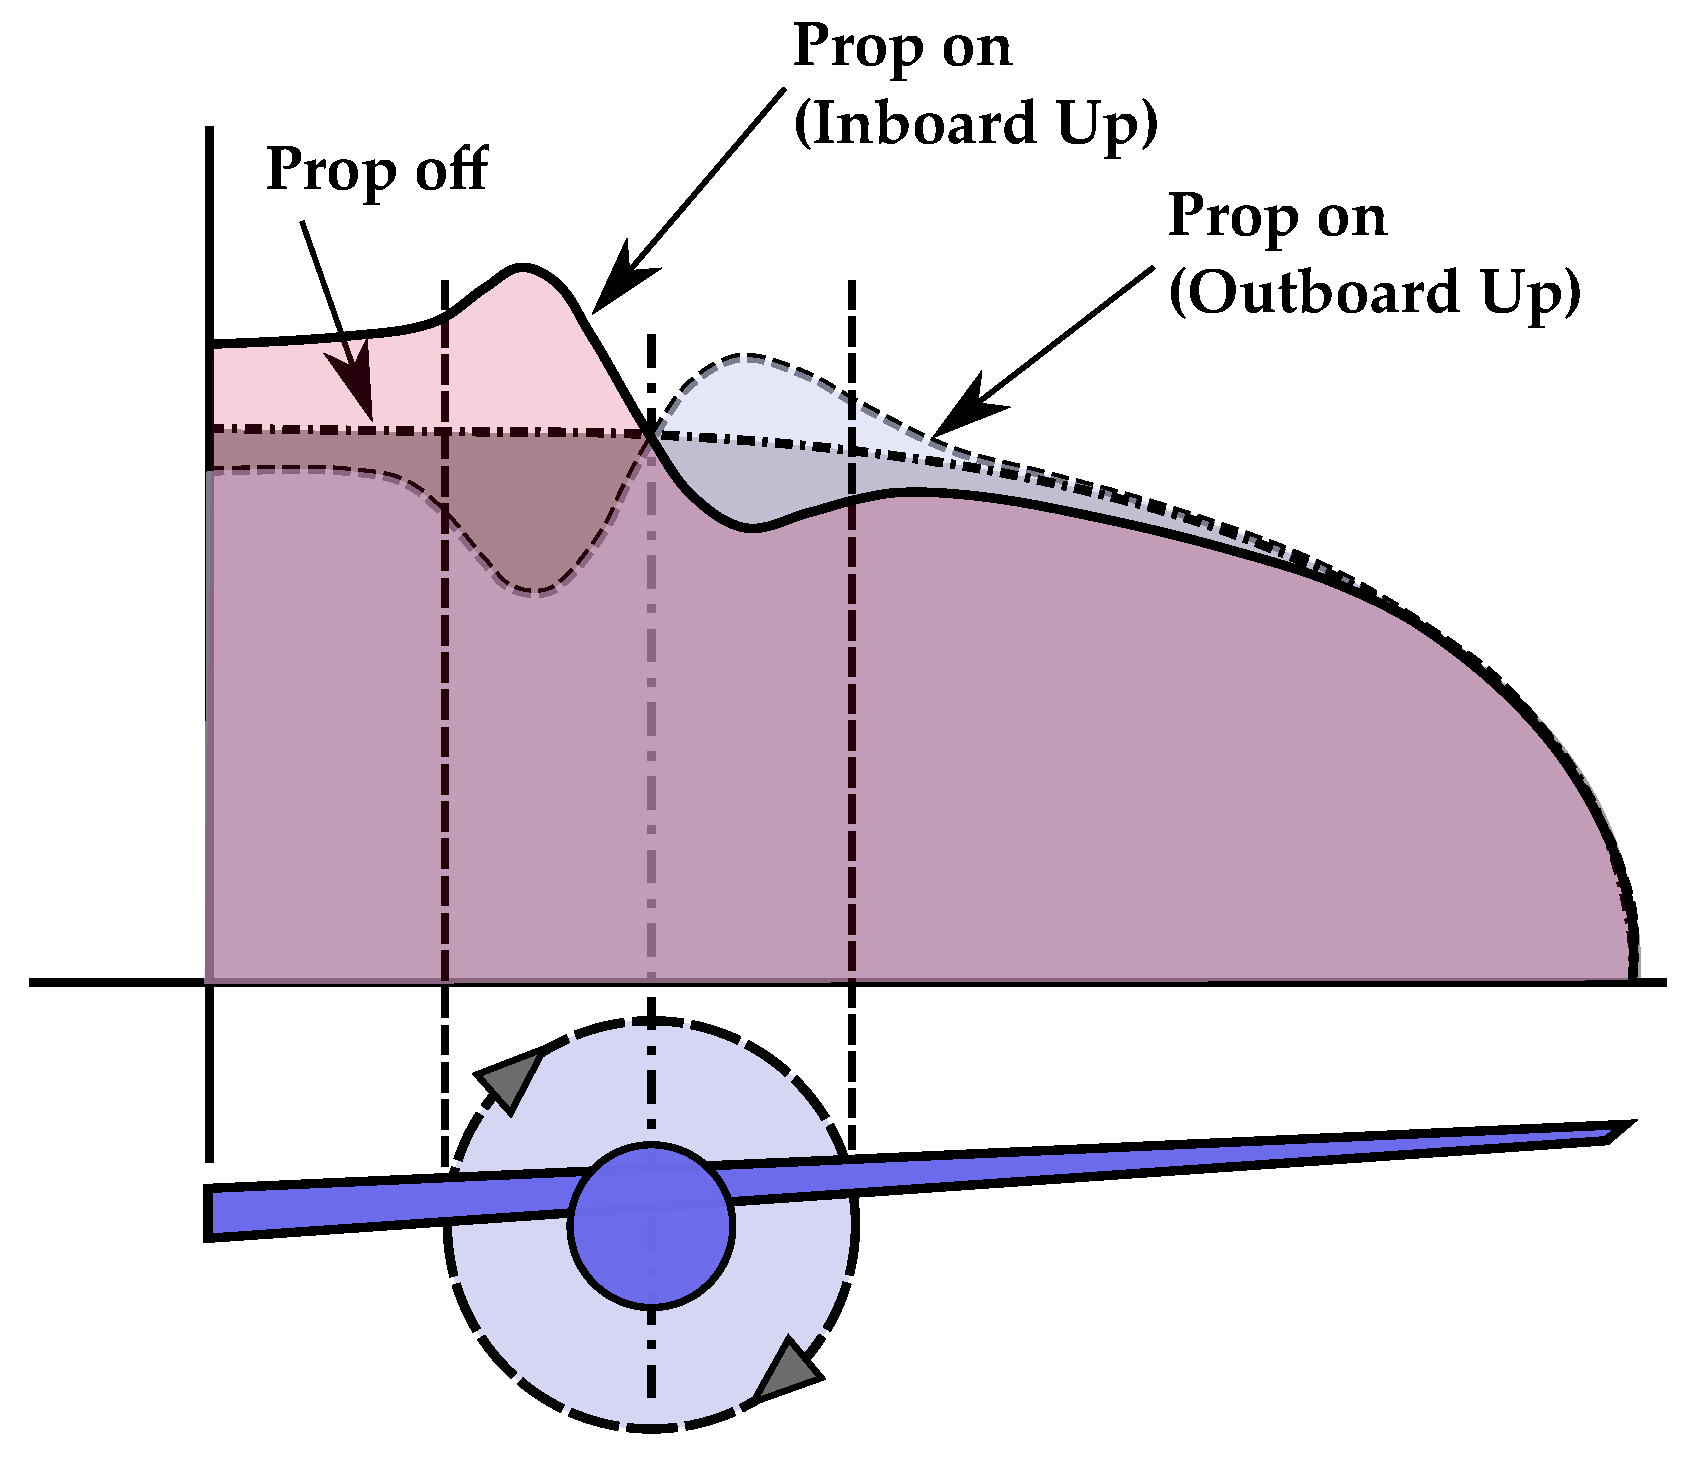
Figure 3.
Effects of propeller slipstream on wing loading.
Figure 3.
Effects of propeller slipstream on wing loading.
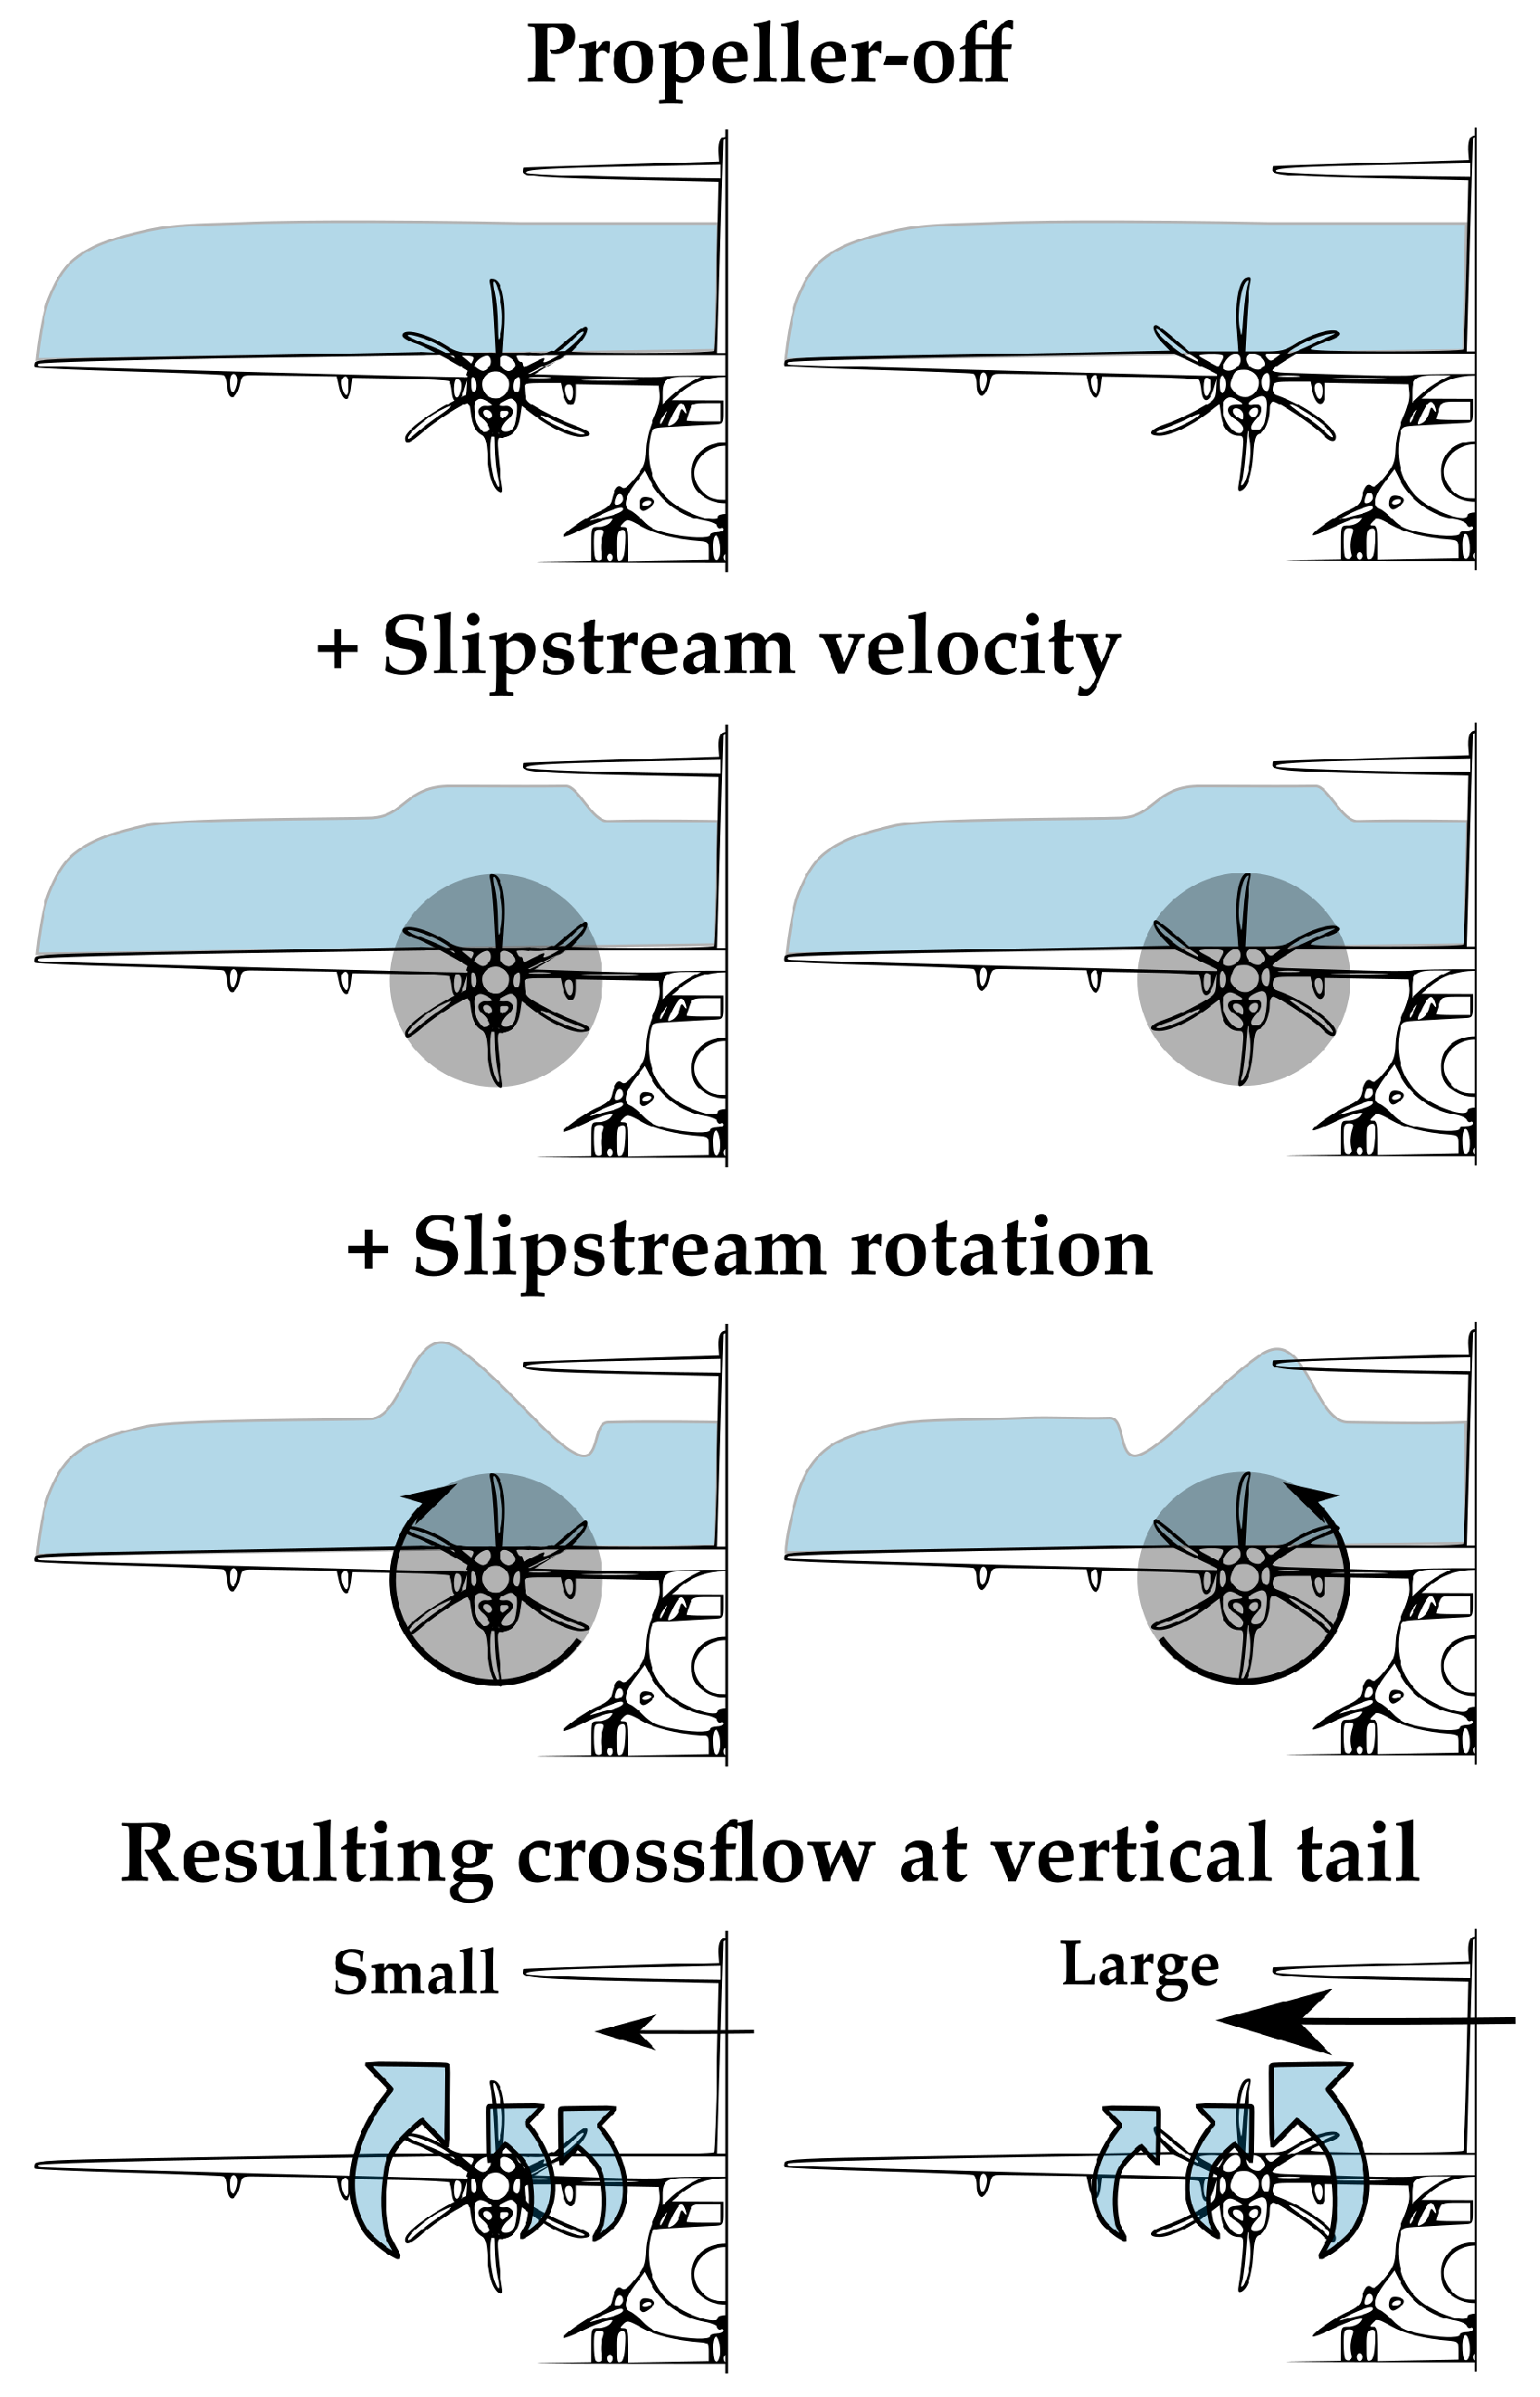
Figure 4.
Effects of propeller slipstream on vertical tail due to the wing loading distributions caused by inboard-up and outboard-up rotations.
Figure 4.
Effects of propeller slipstream on vertical tail due to the wing loading distributions caused by inboard-up and outboard-up rotations.
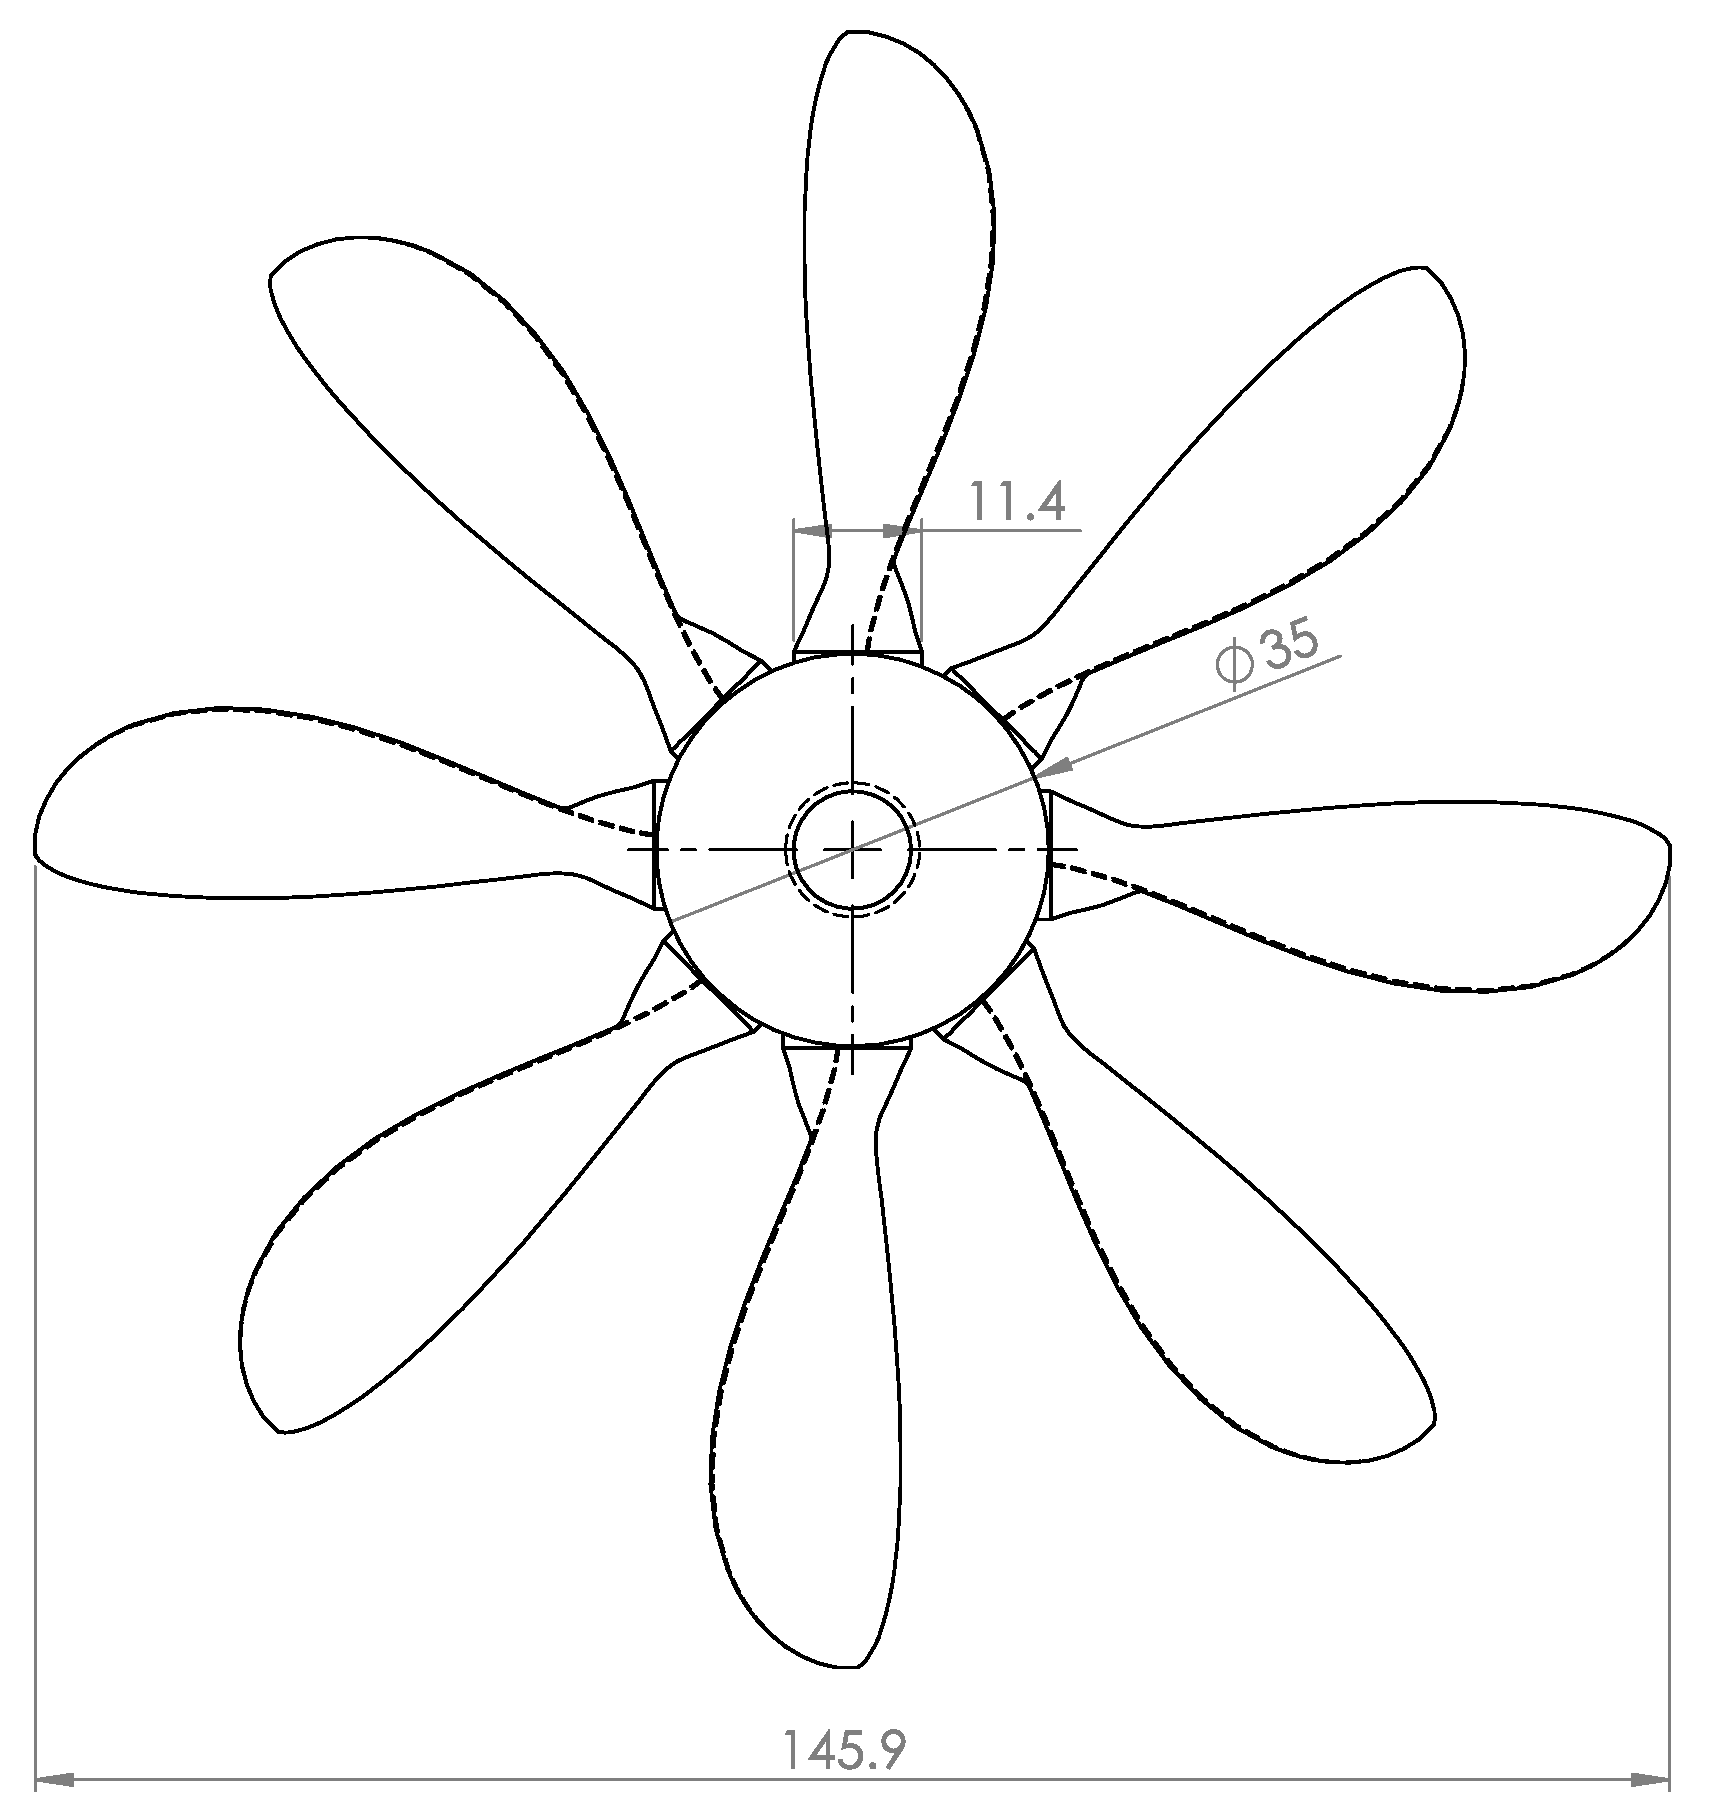
Figure 5.
Planform of the propeller model for wind tunnel testings [
37]. Units in mm.
Figure 5.
Planform of the propeller model for wind tunnel testings [
37]. Units in mm.
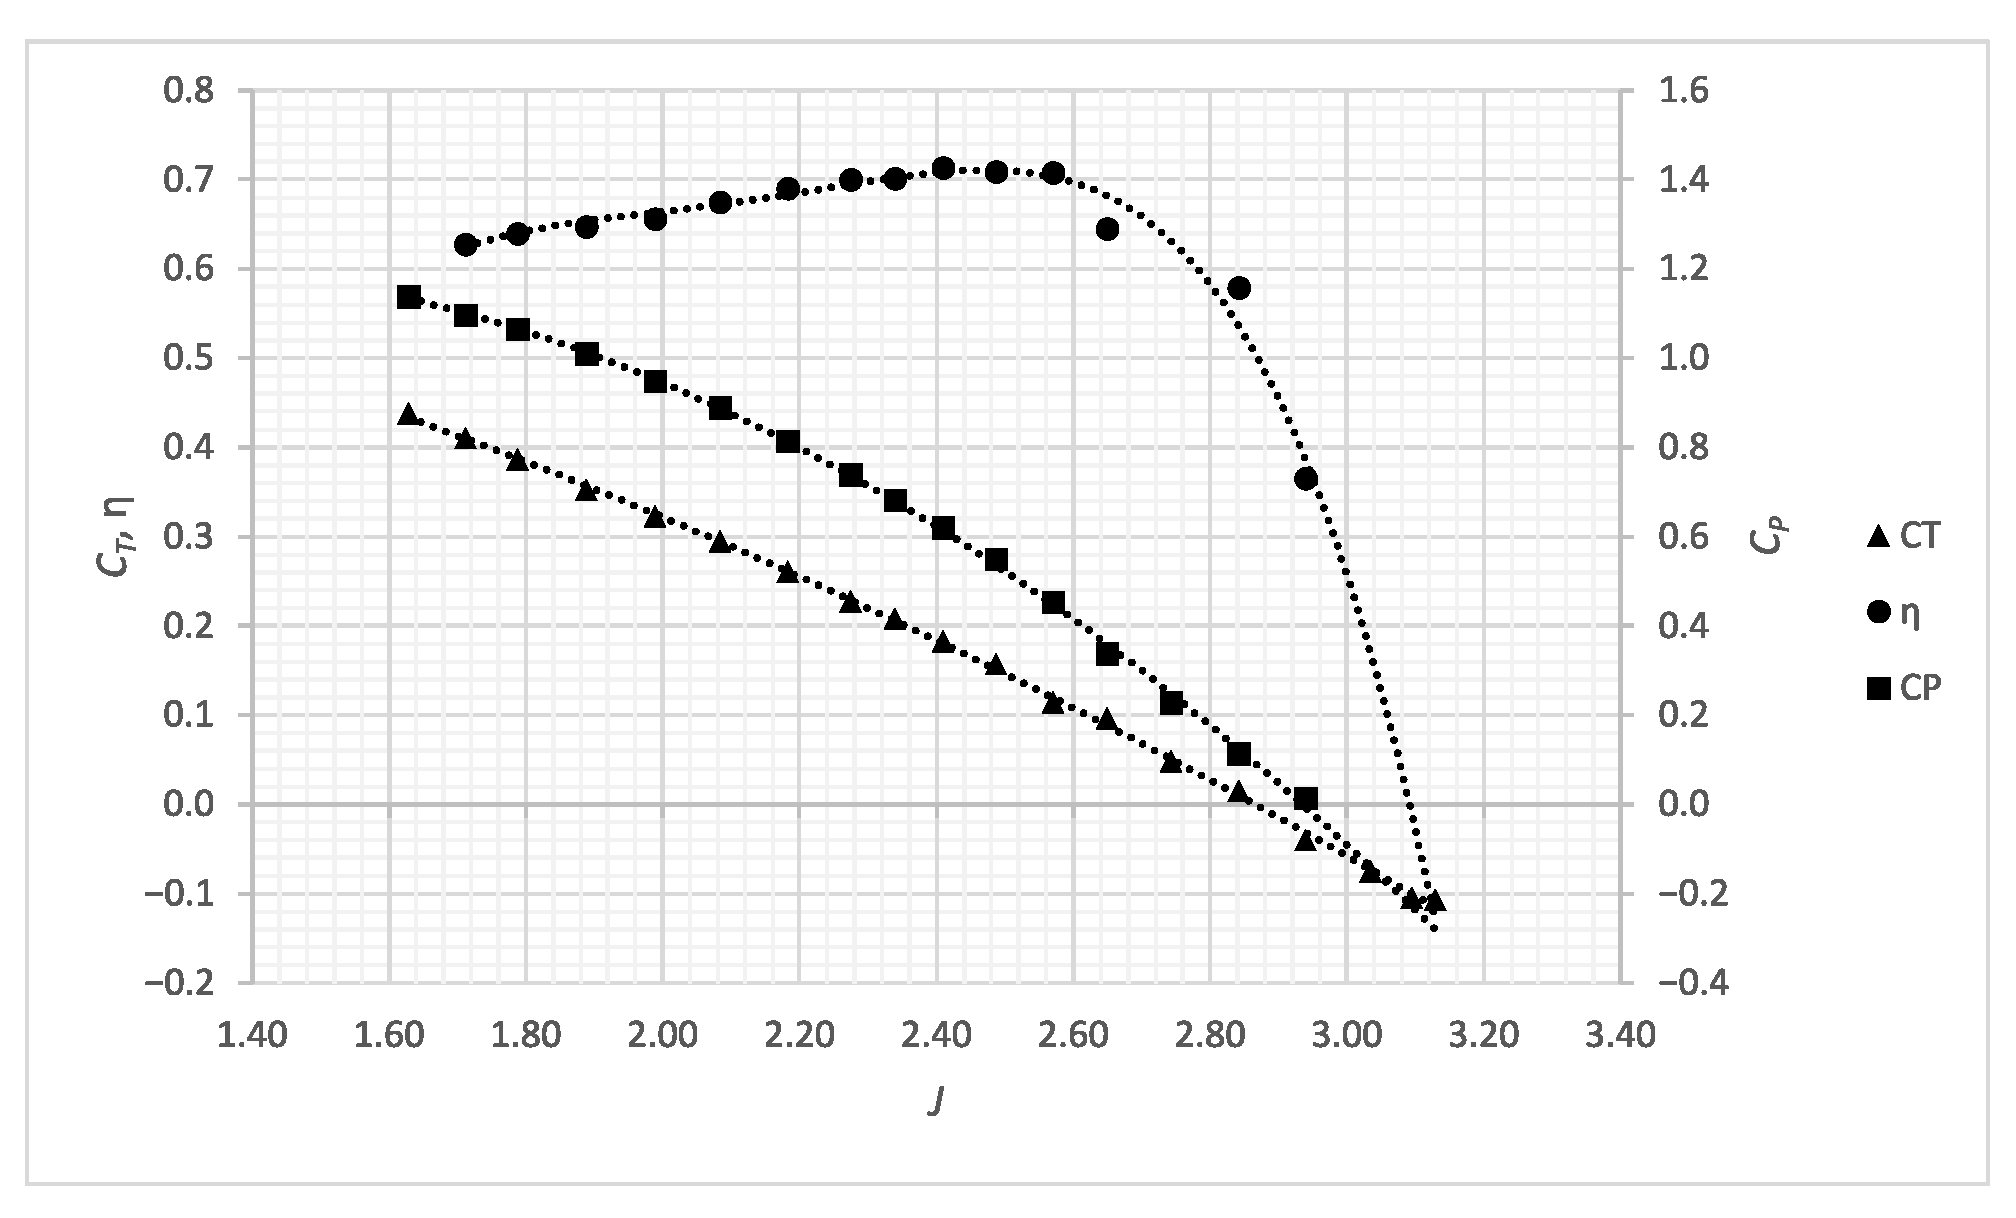
Figure 6.
Isolated propeller characteristics from wind tunnel measurements [
37].
Figure 6.
Isolated propeller characteristics from wind tunnel measurements [
37].
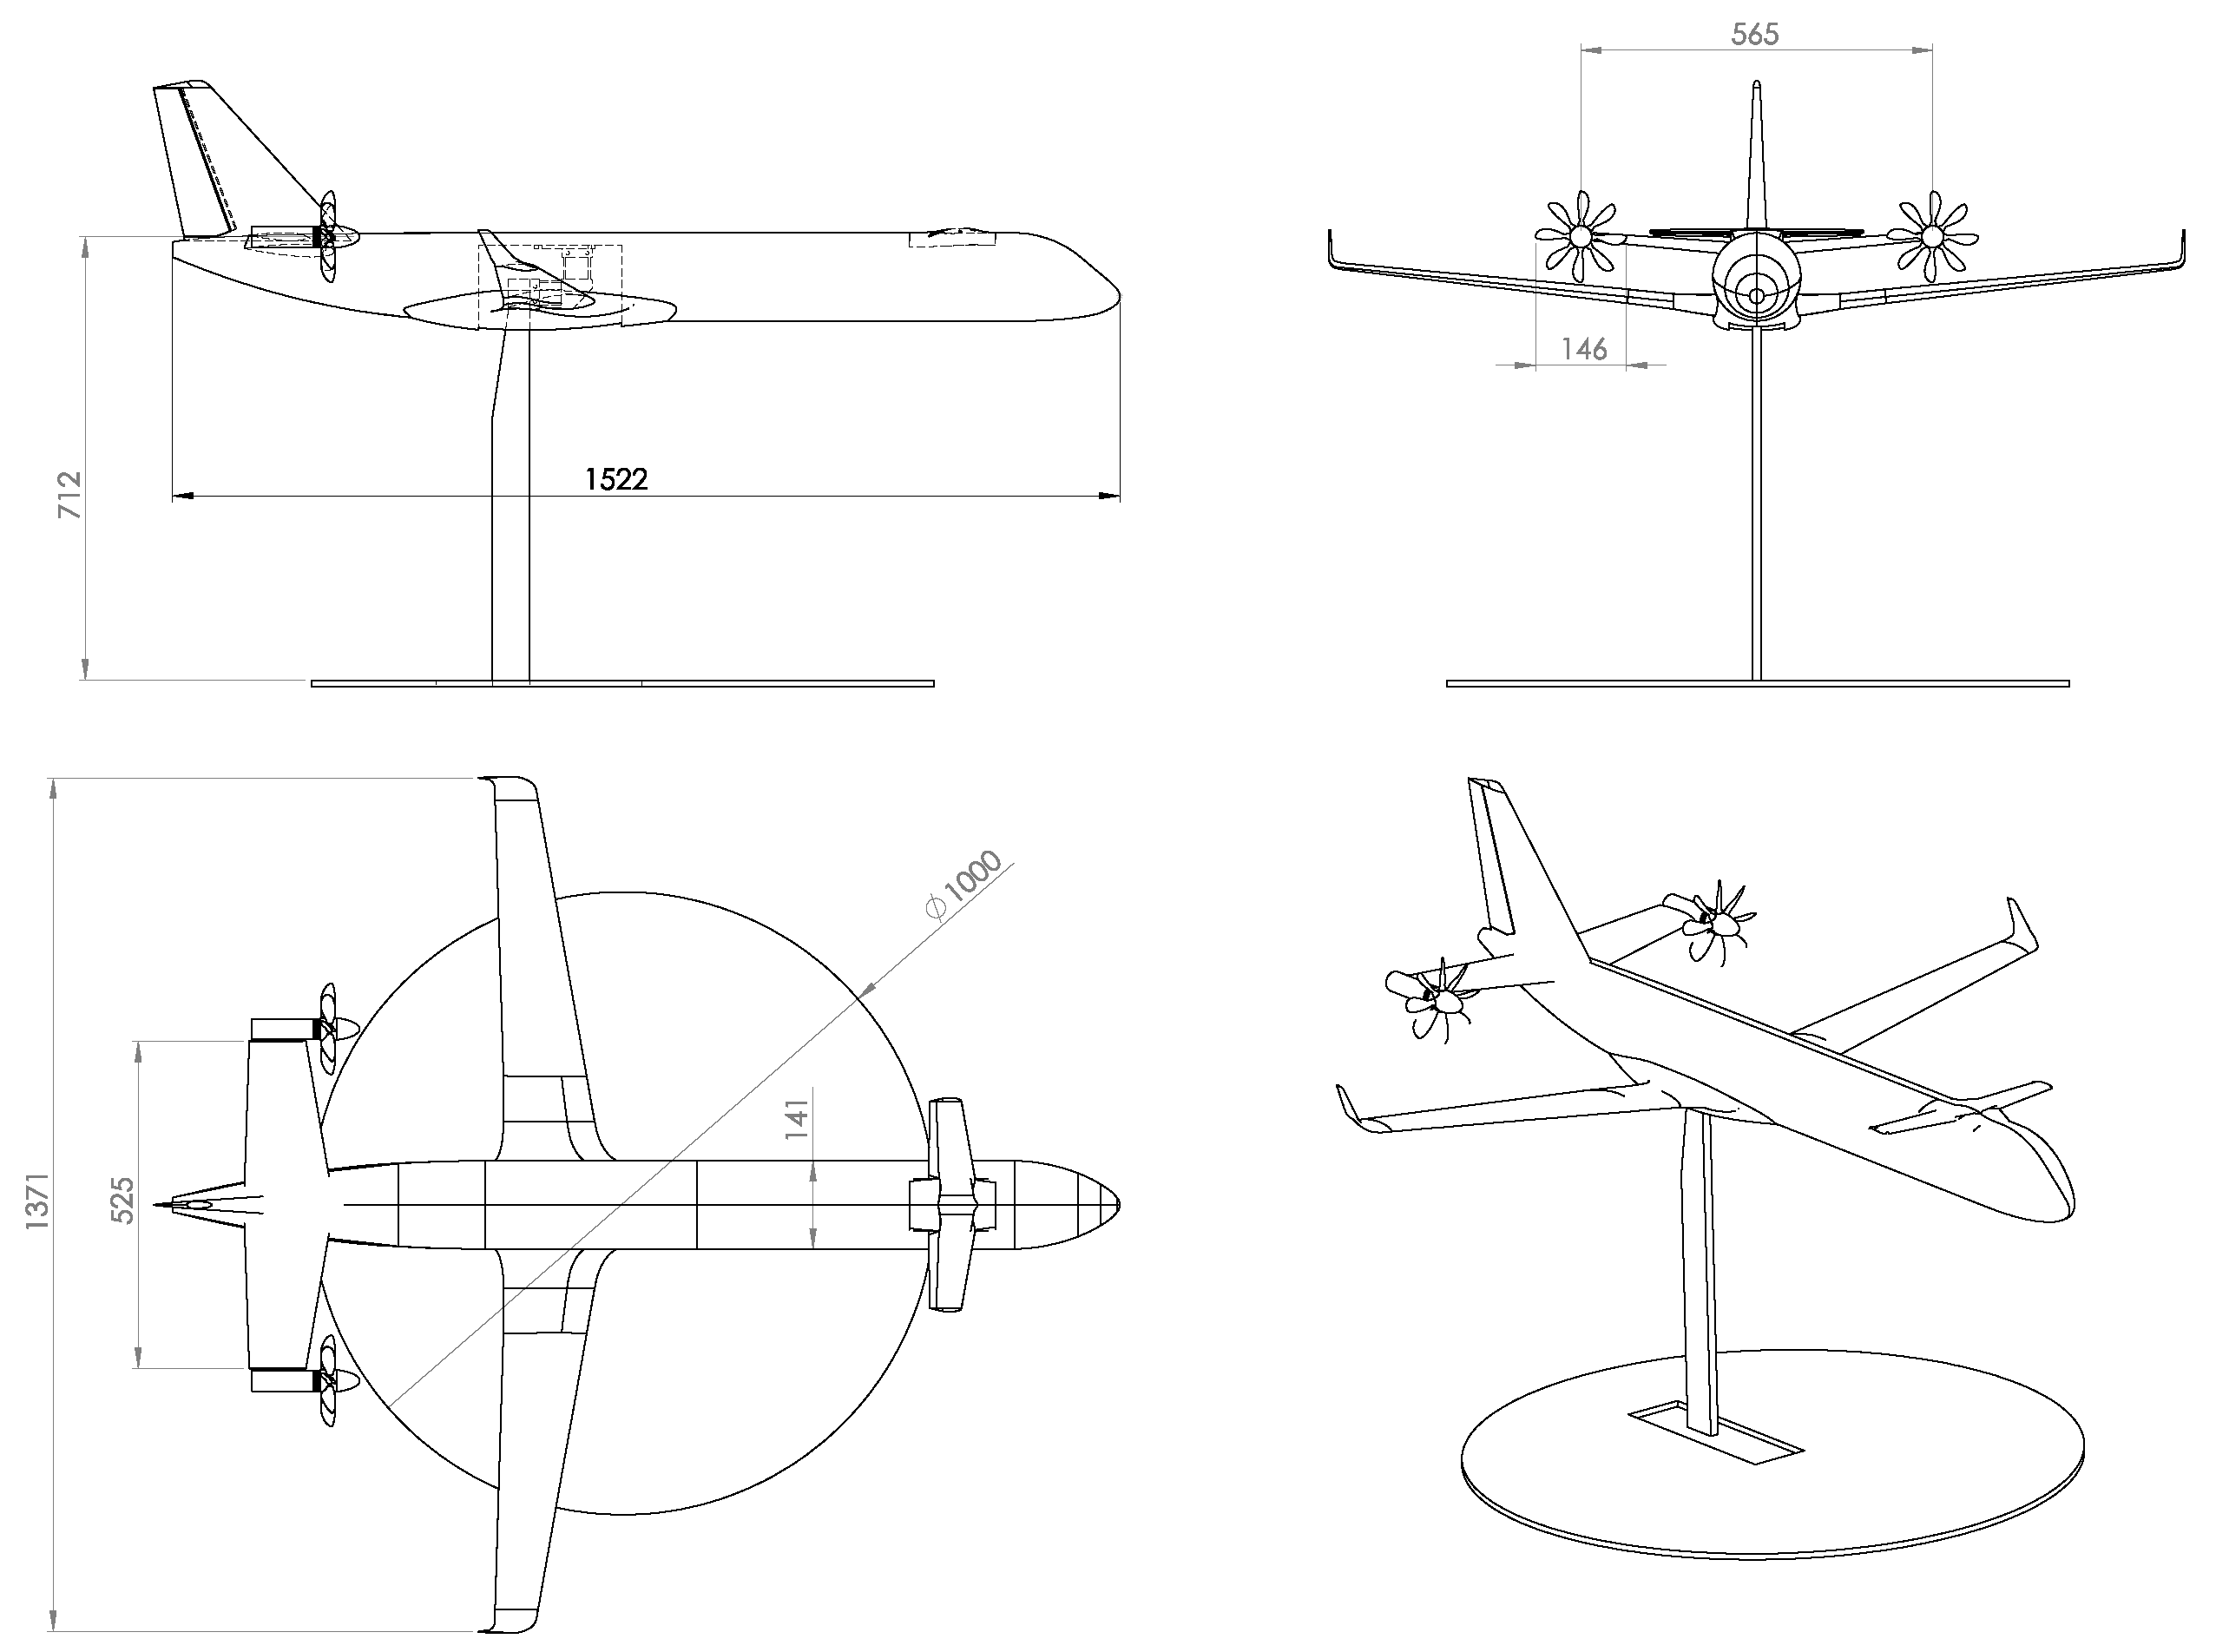
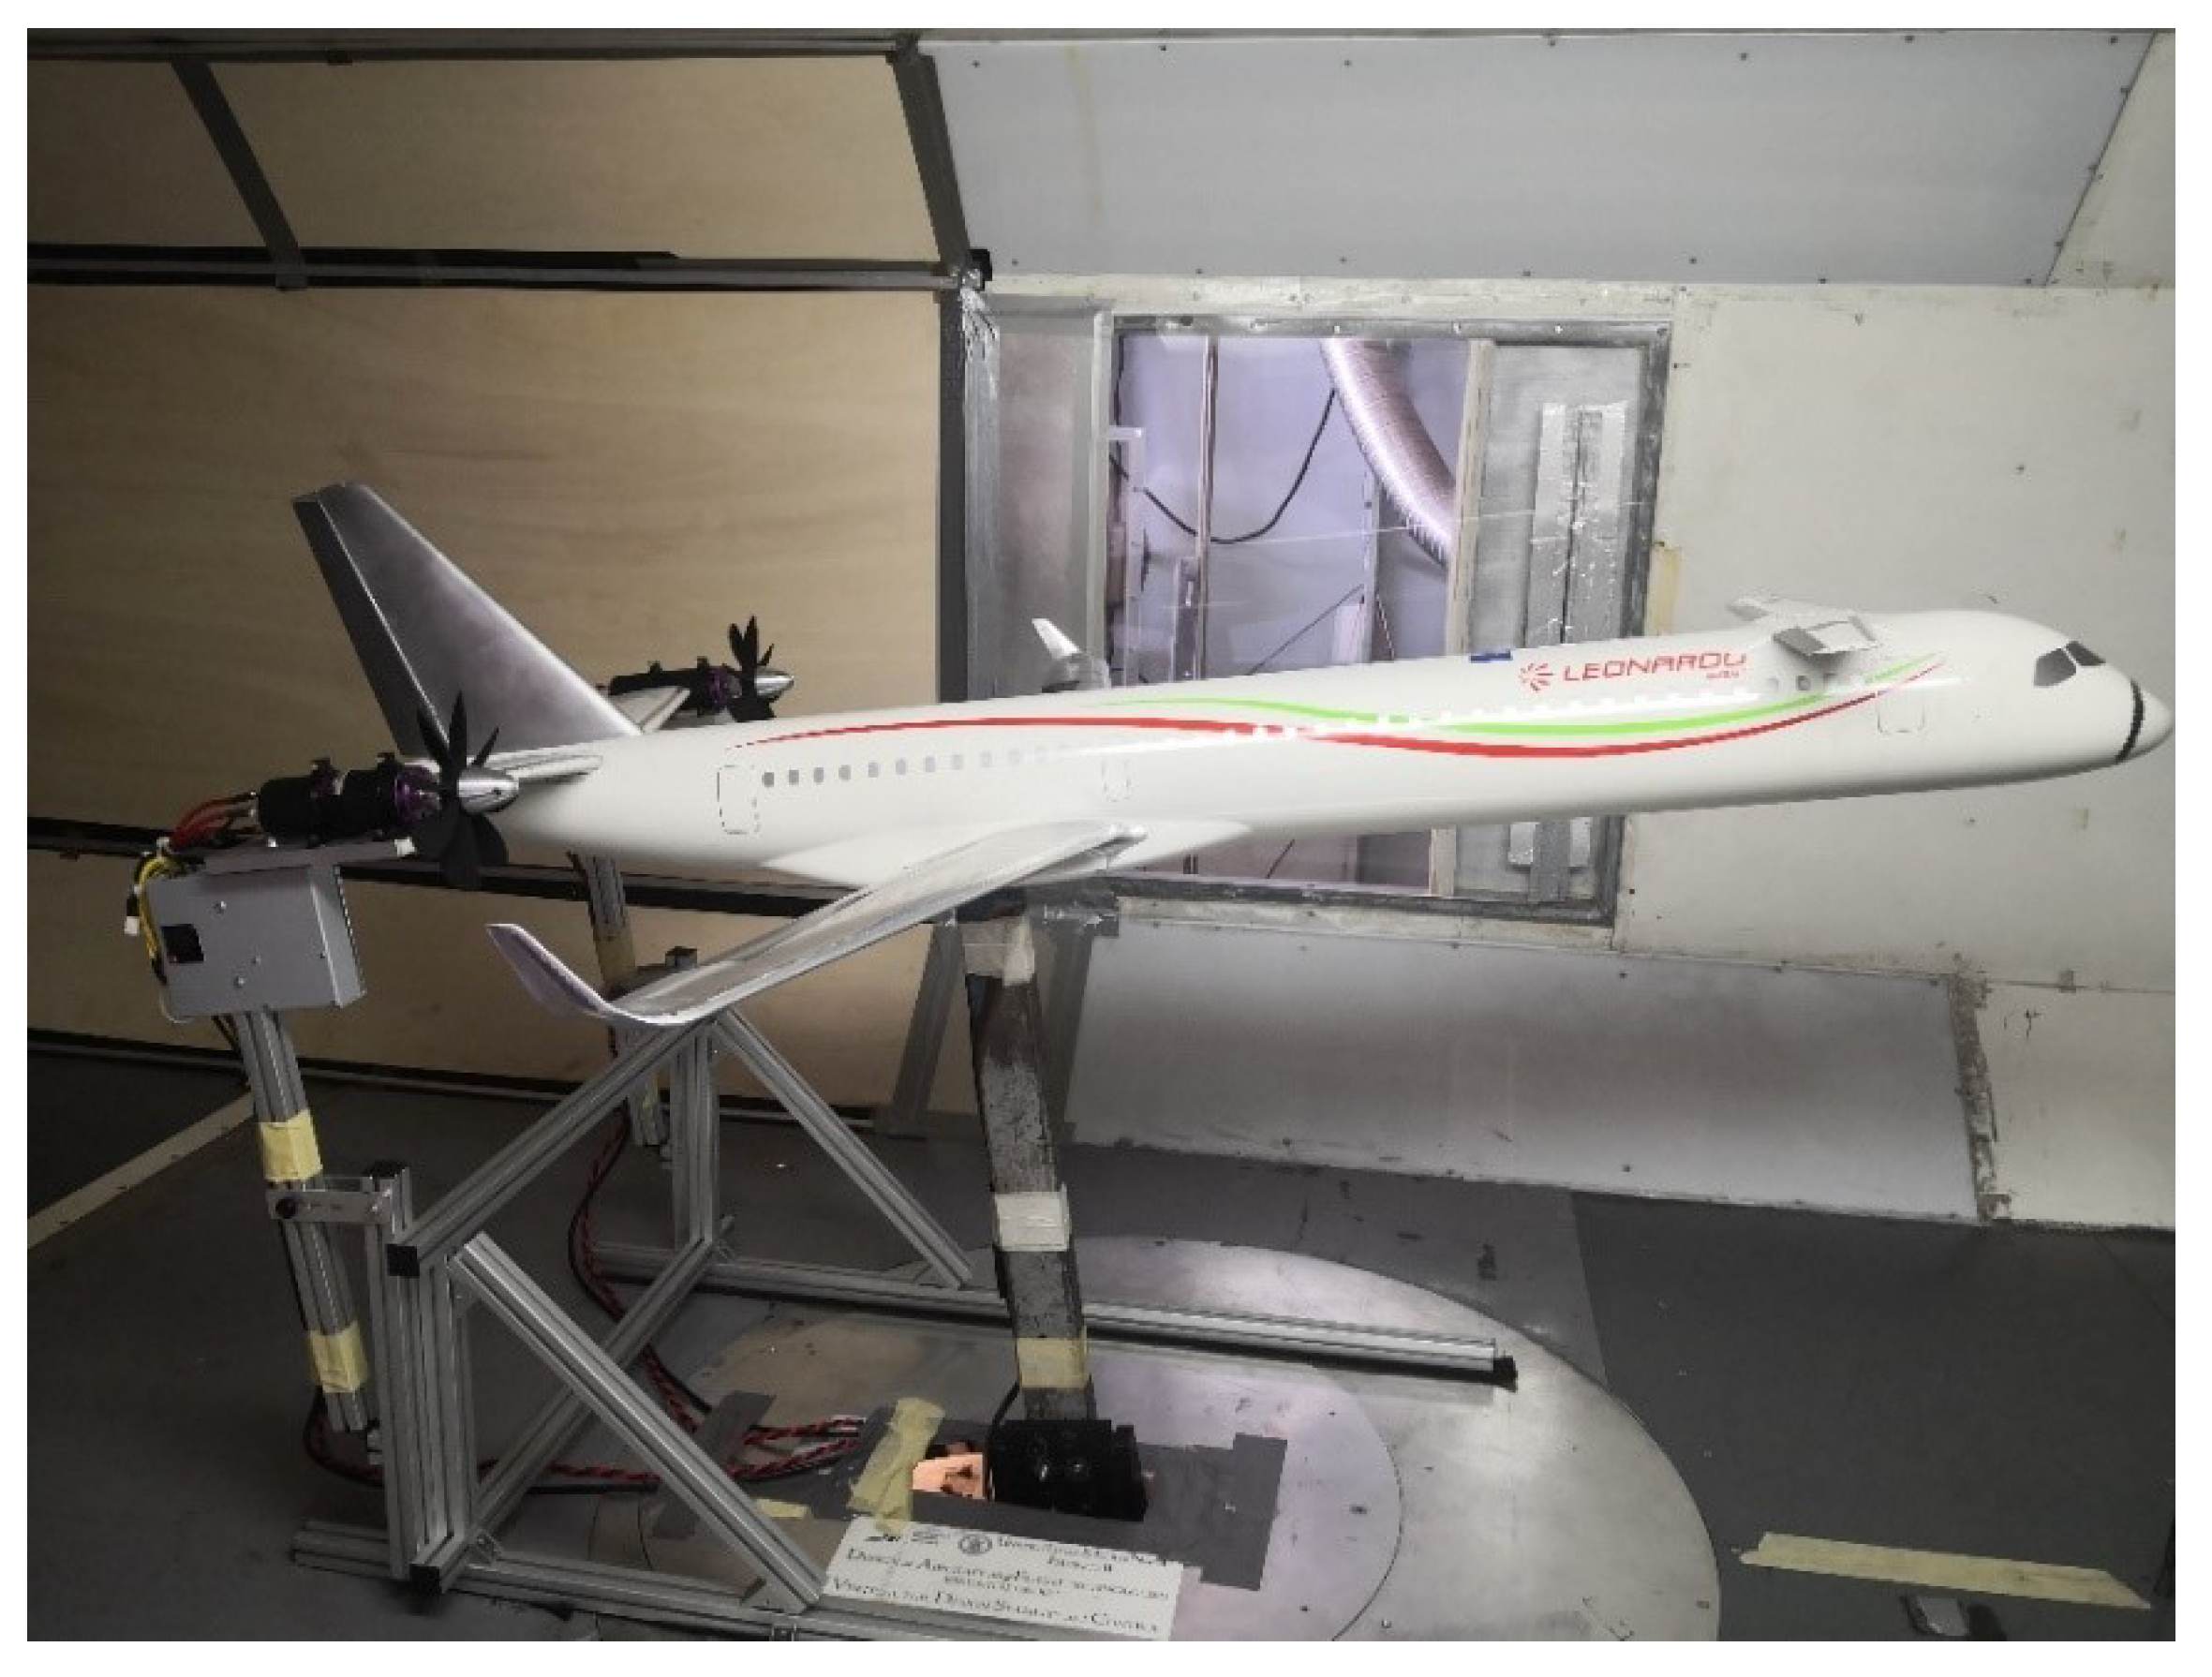
Figure 7.
IRON scaled model with the main balance, motors, and propellers. Motor supporting frame not represented. Units in mm.
Figure 7.
IRON scaled model with the main balance, motors, and propellers. Motor supporting frame not represented. Units in mm.
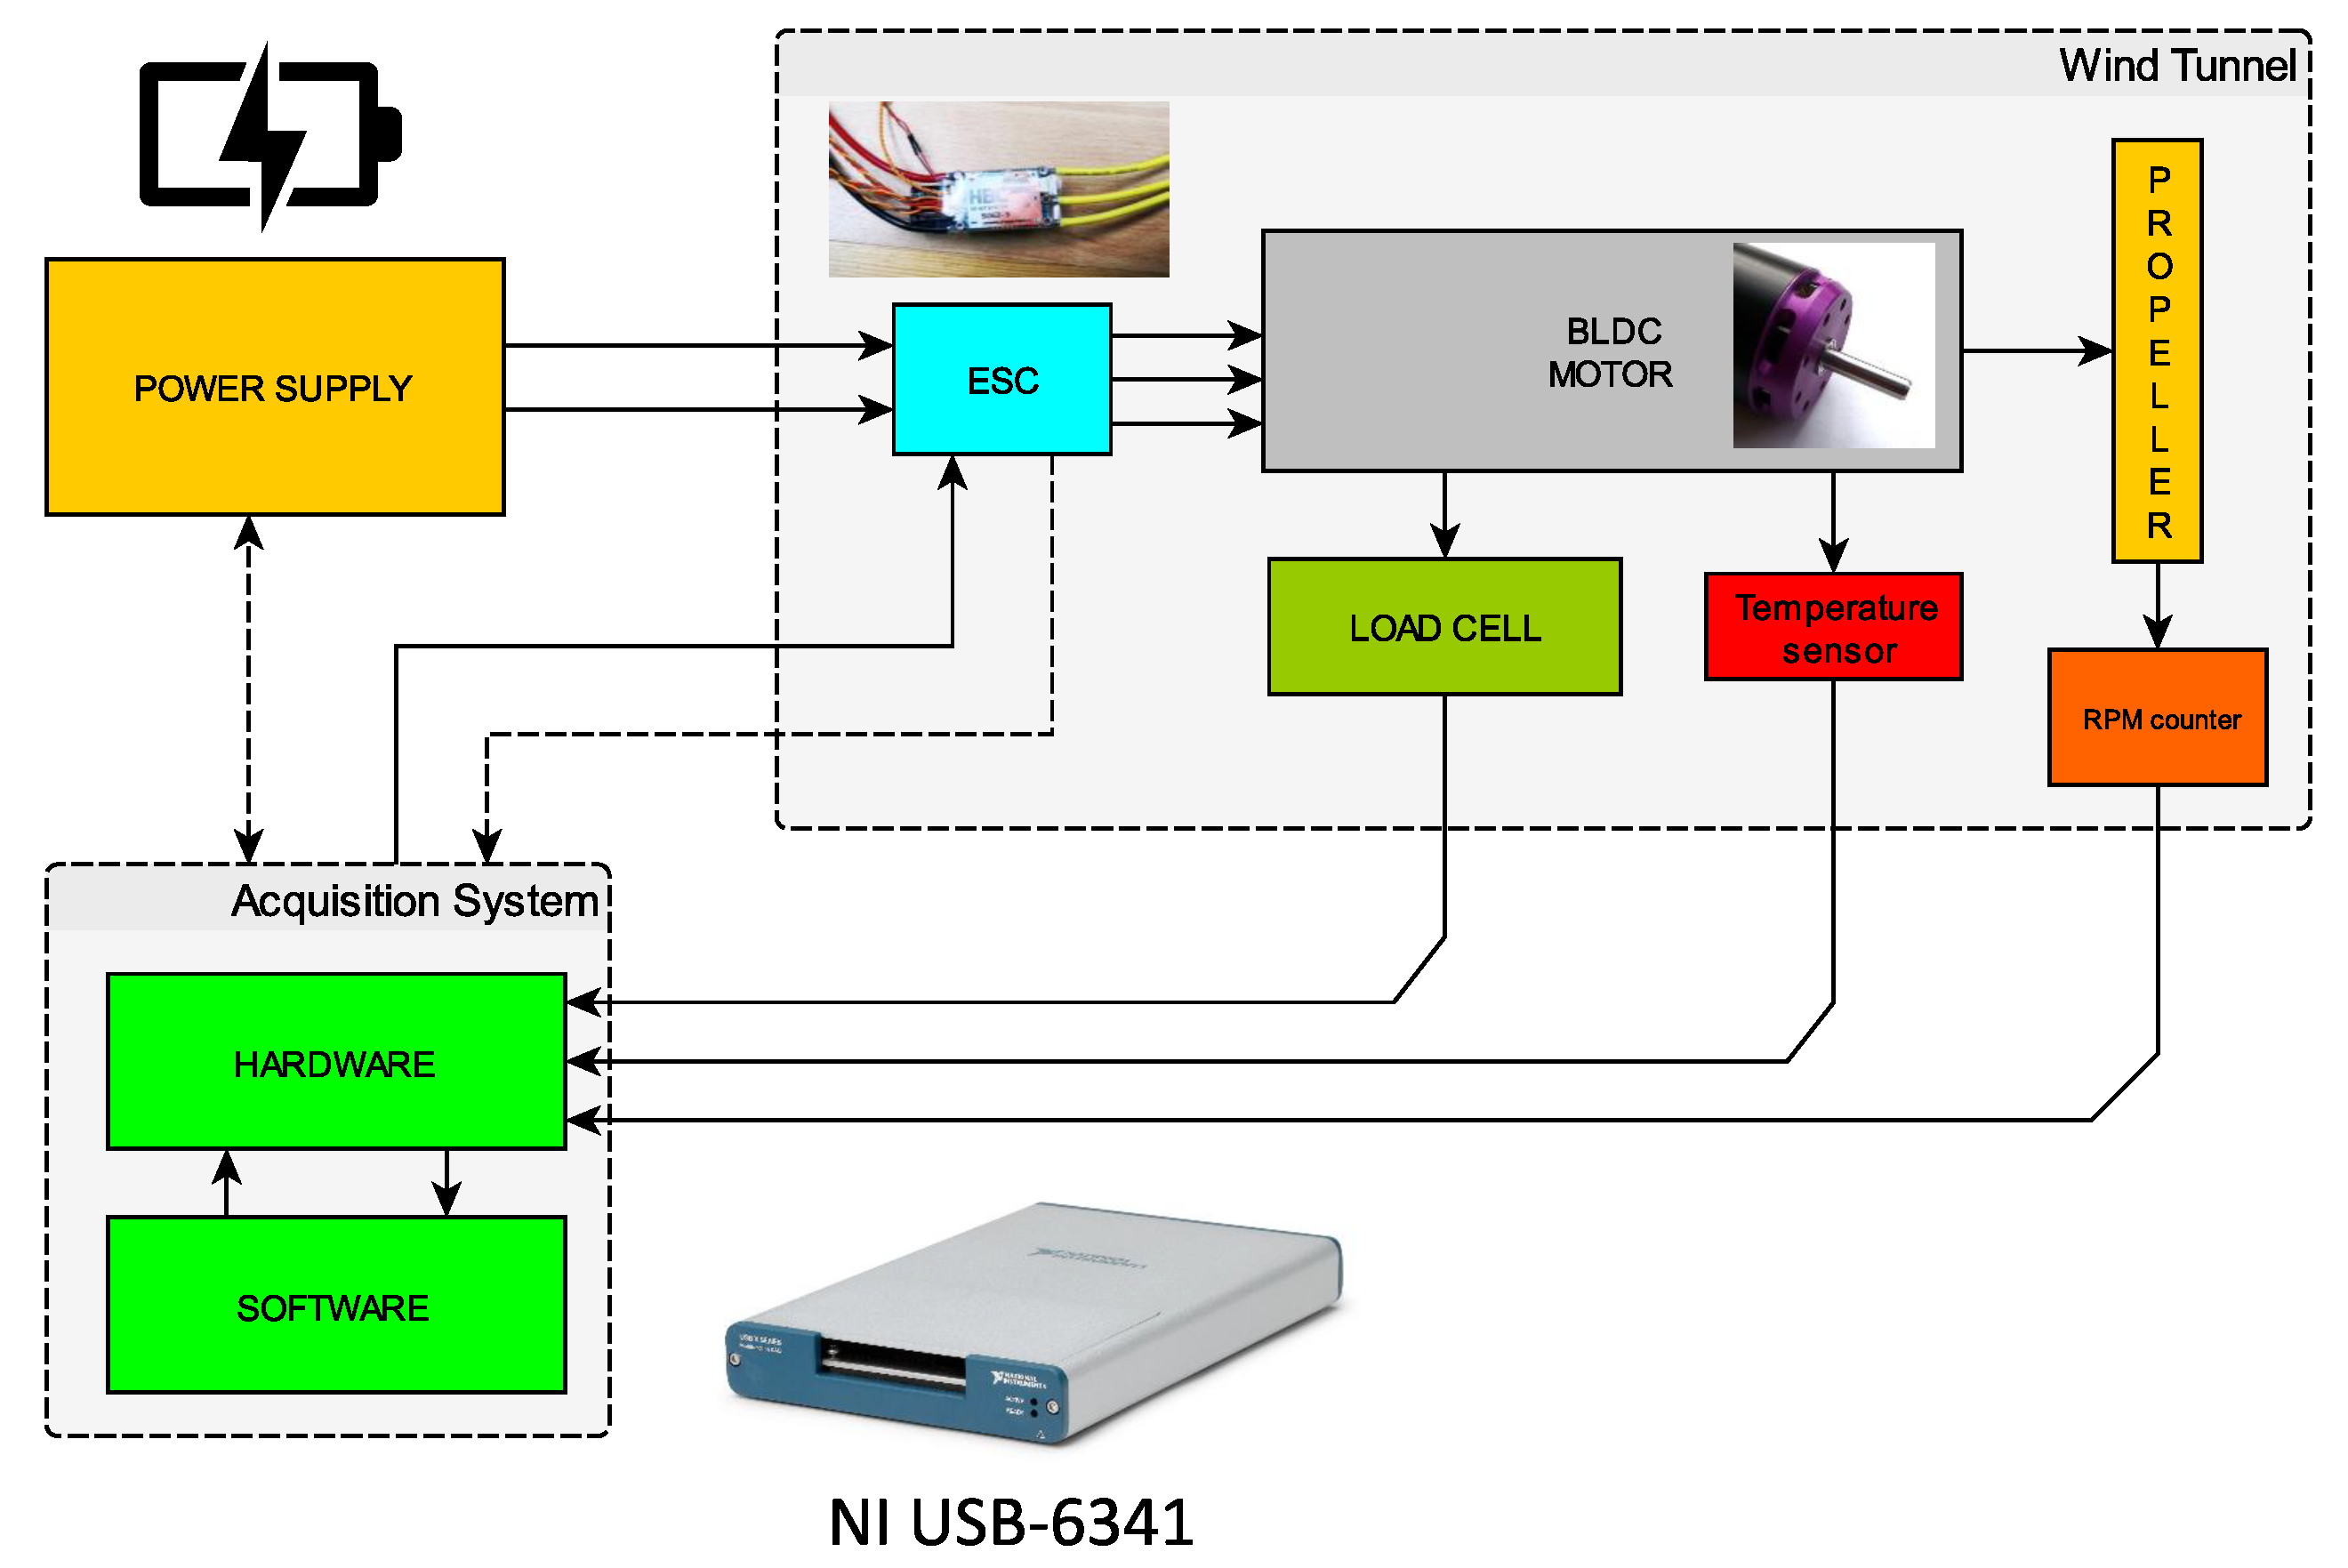
Figure 8.
Scheme of the wind tunnel system for propulsive tests.
Figure 8.
Scheme of the wind tunnel system for propulsive tests.
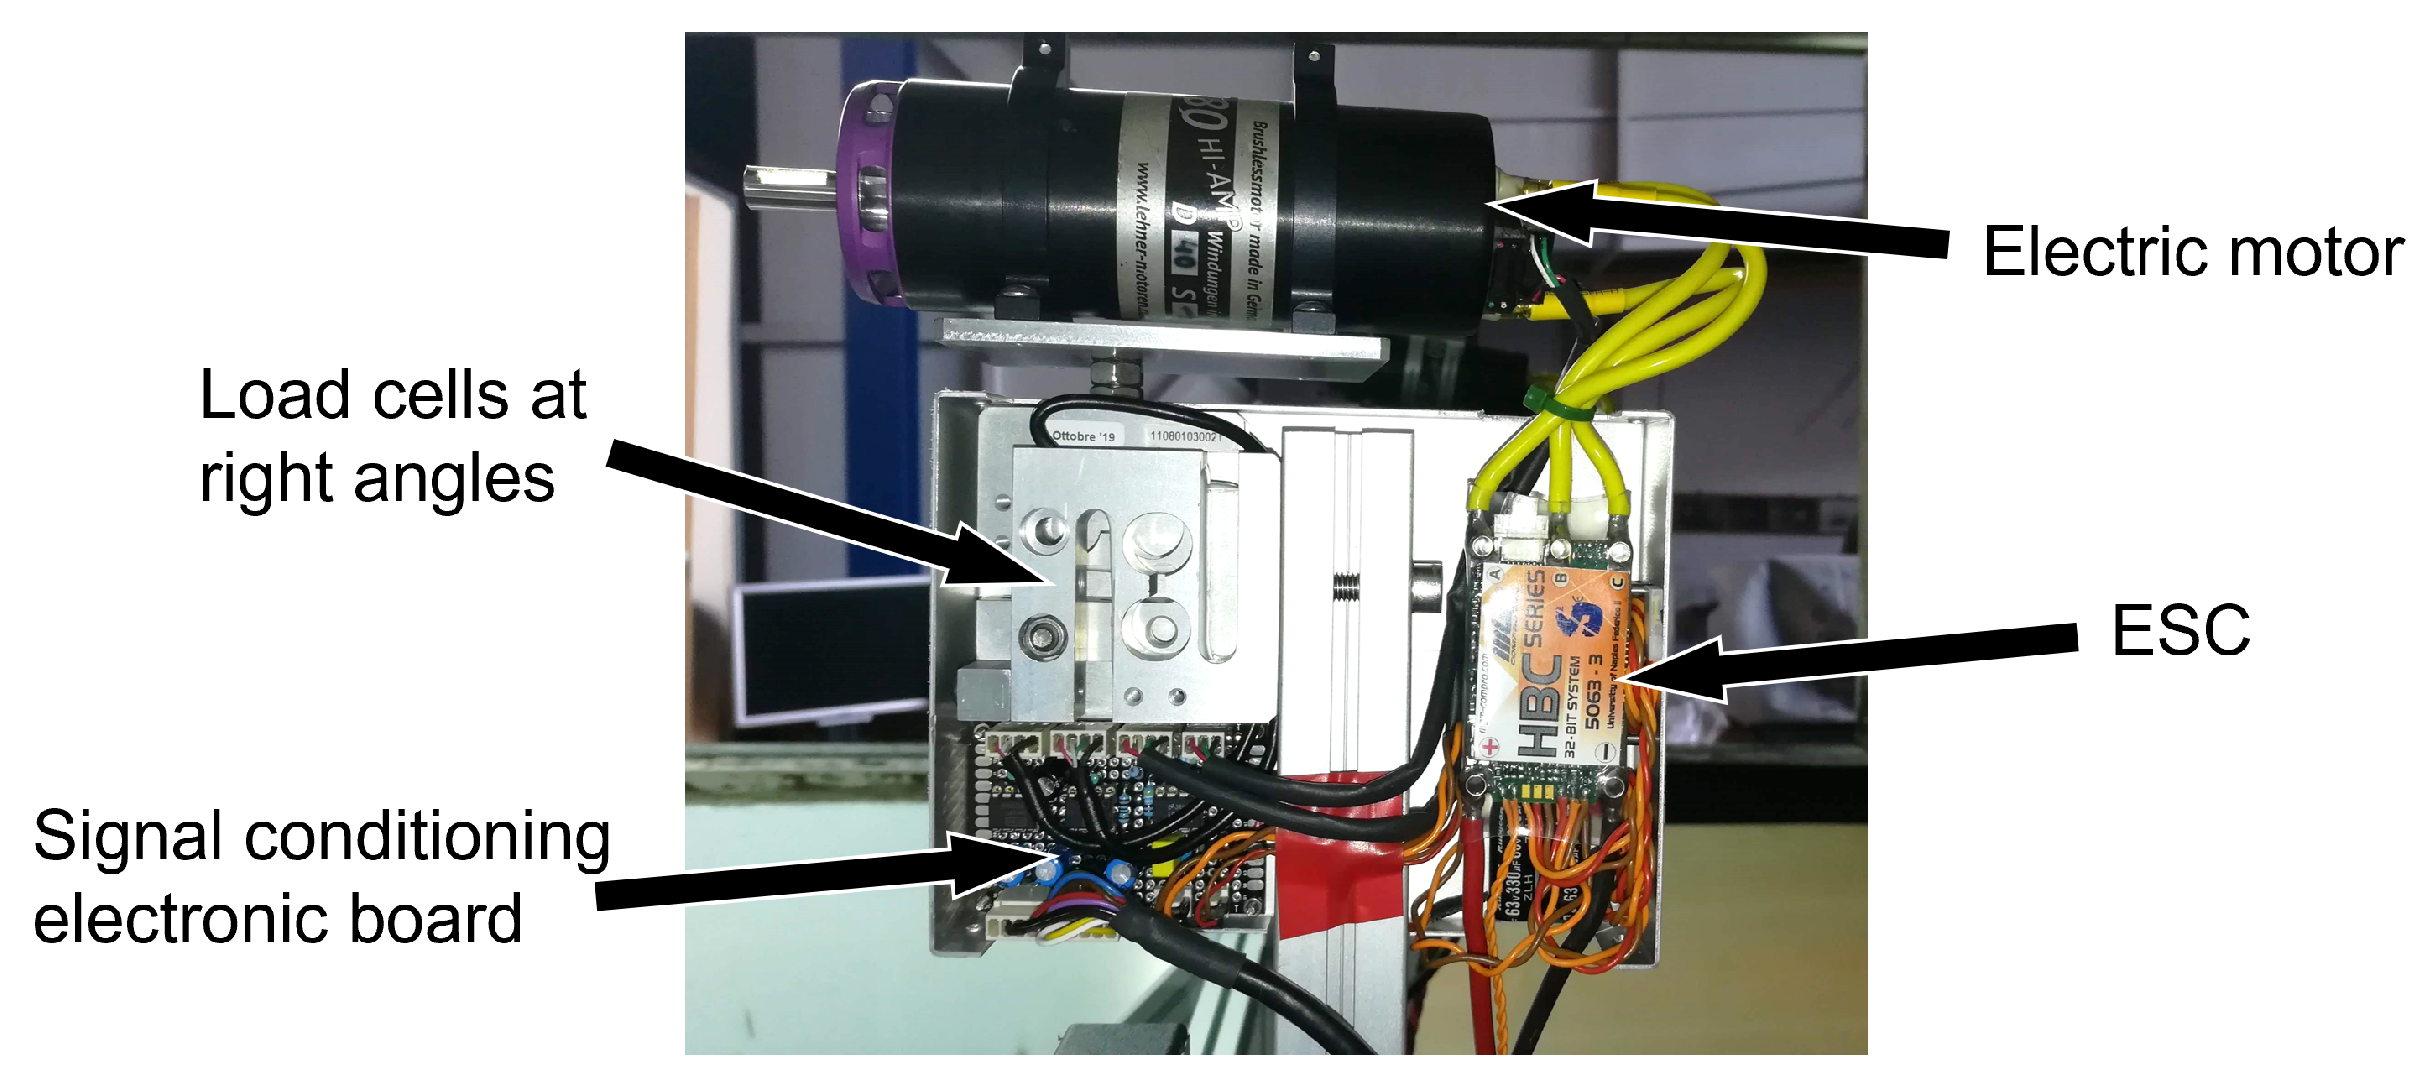
Figure 9.
Details of electronics for data acquisition of the propulsive forces and signal conditioning for motor control.
Figure 9.
Details of electronics for data acquisition of the propulsive forces and signal conditioning for motor control.
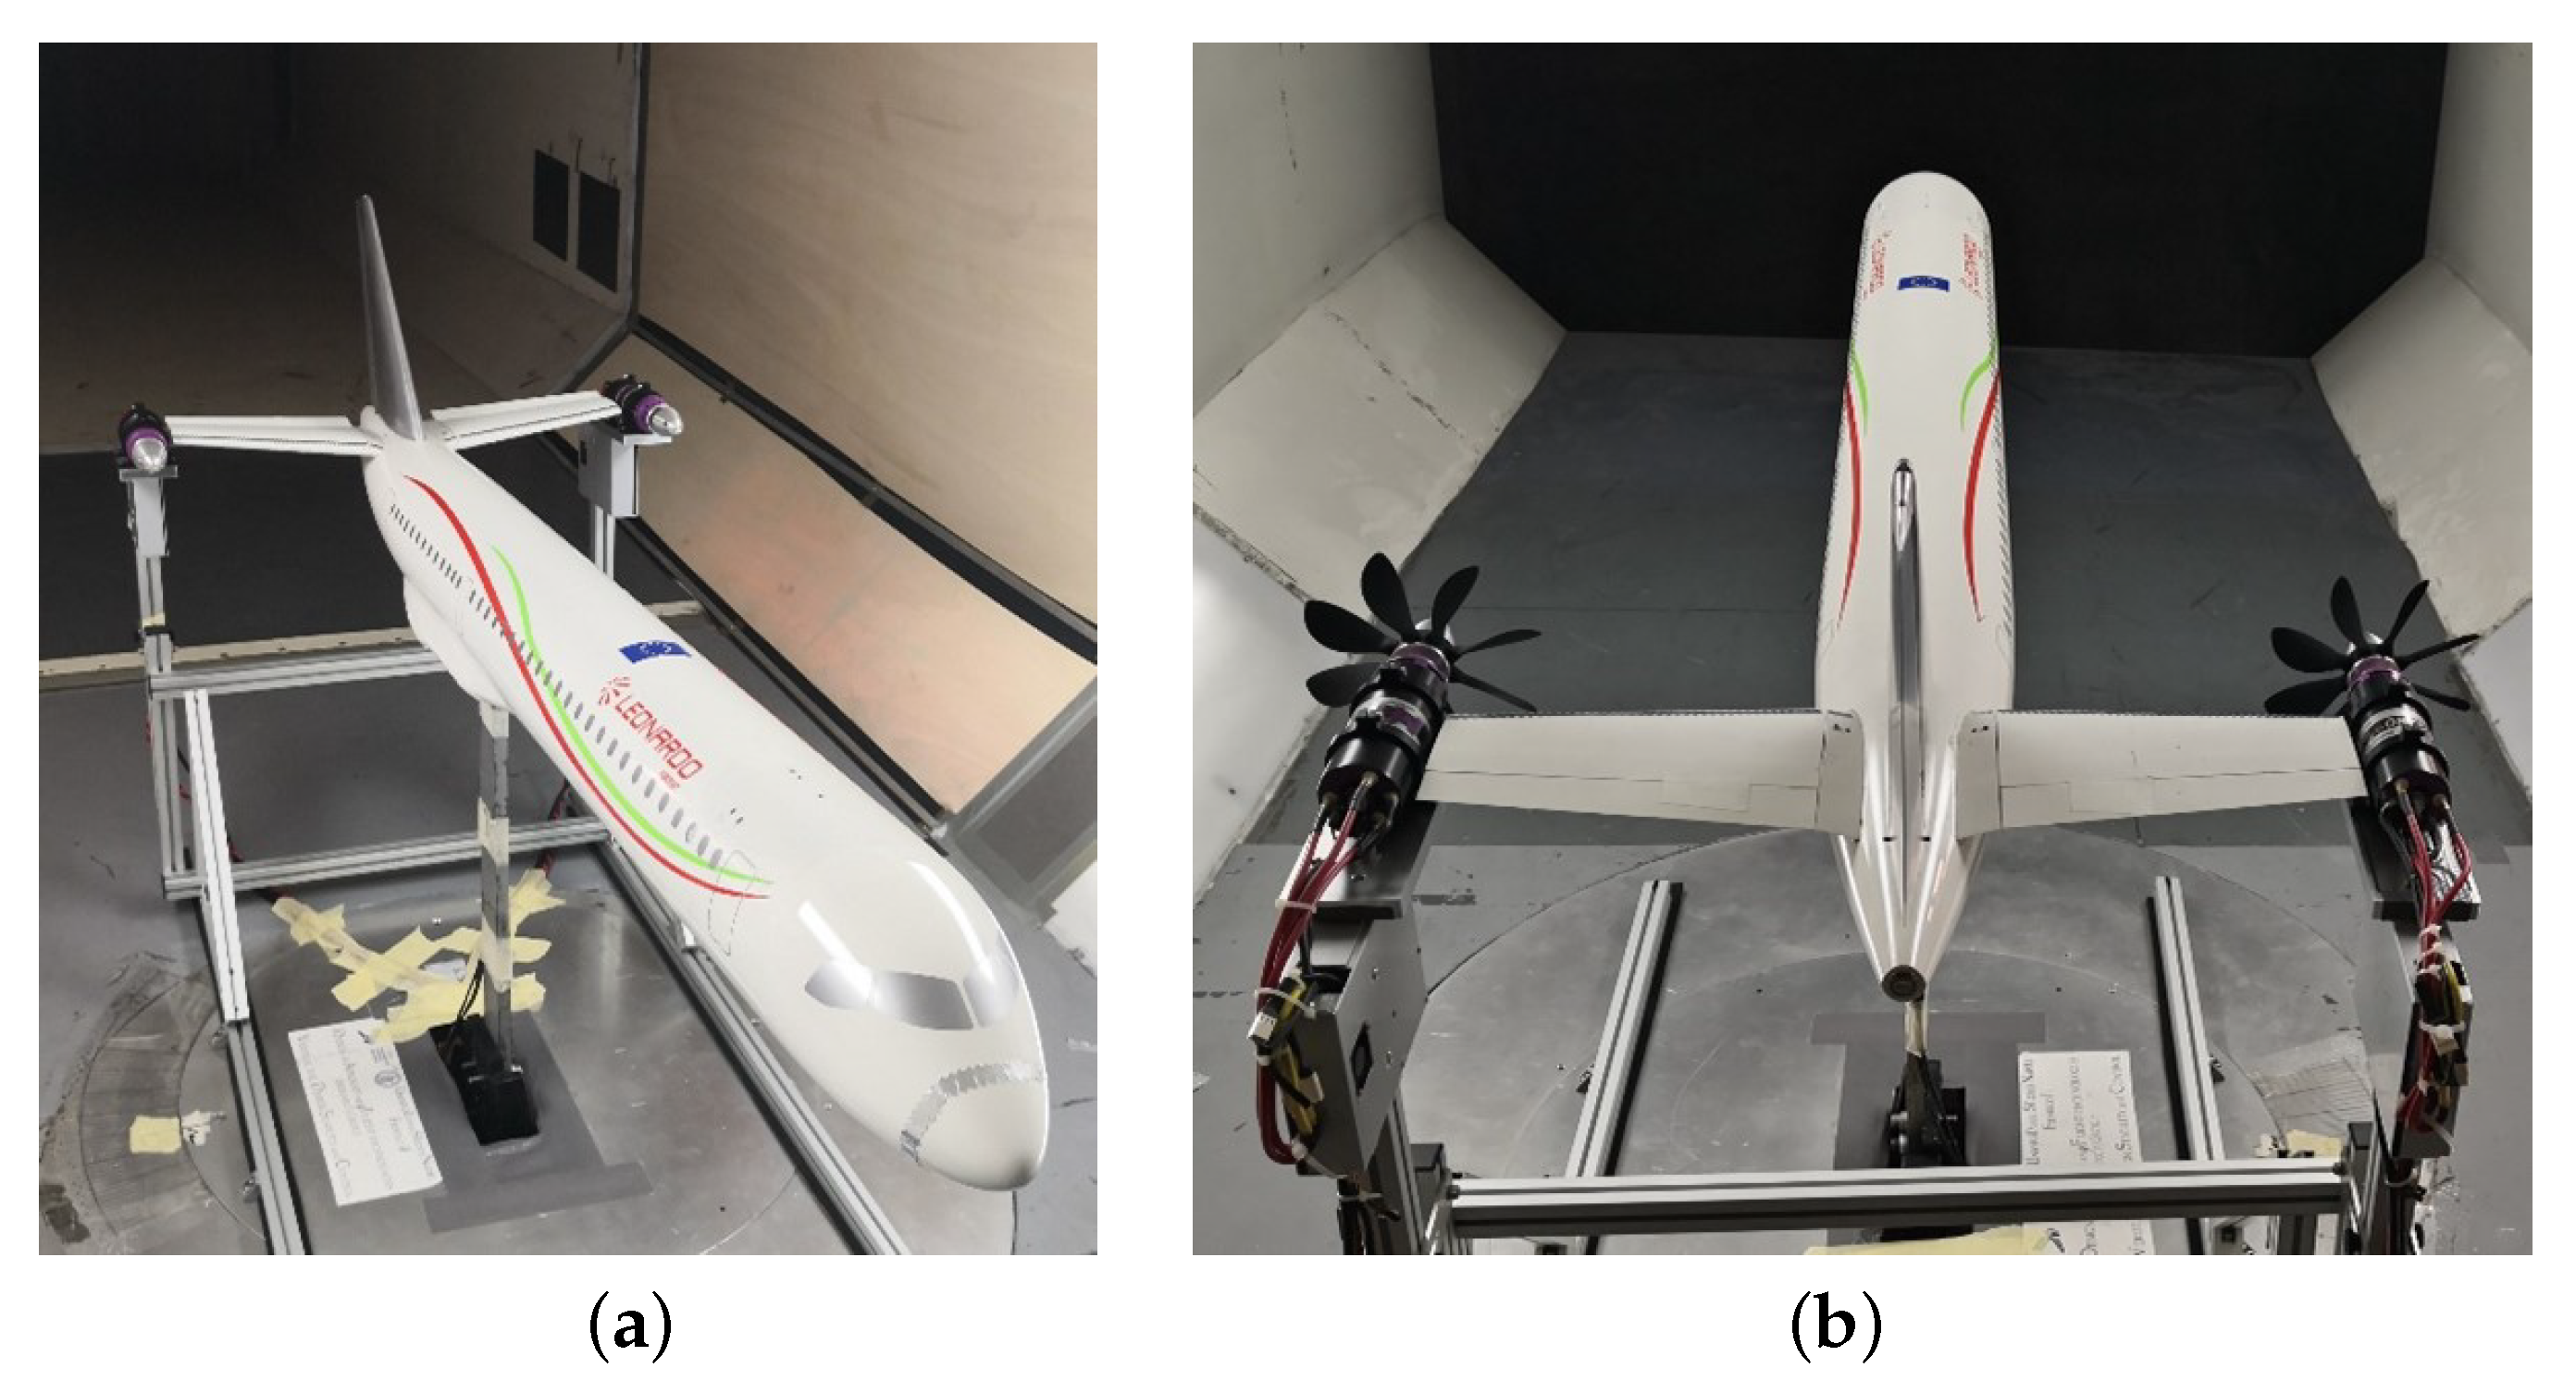
Figure 10.
Body-Horizontal-Vertical tail configuration tested in wind tunnel: (a) power-off BHV configuration; (b) power-on BHV configuration.
Figure 10.
Body-Horizontal-Vertical tail configuration tested in wind tunnel: (a) power-off BHV configuration; (b) power-on BHV configuration.
Figure 11.
Considered propeller rotation for the power-on experimental tests: (a) contra-rotating Inboard-Up (IU) propellers rotation; (b) co-rotating (CR) propellers rotation.
Figure 11.
Considered propeller rotation for the power-on experimental tests: (a) contra-rotating Inboard-Up (IU) propellers rotation; (b) co-rotating (CR) propellers rotation.
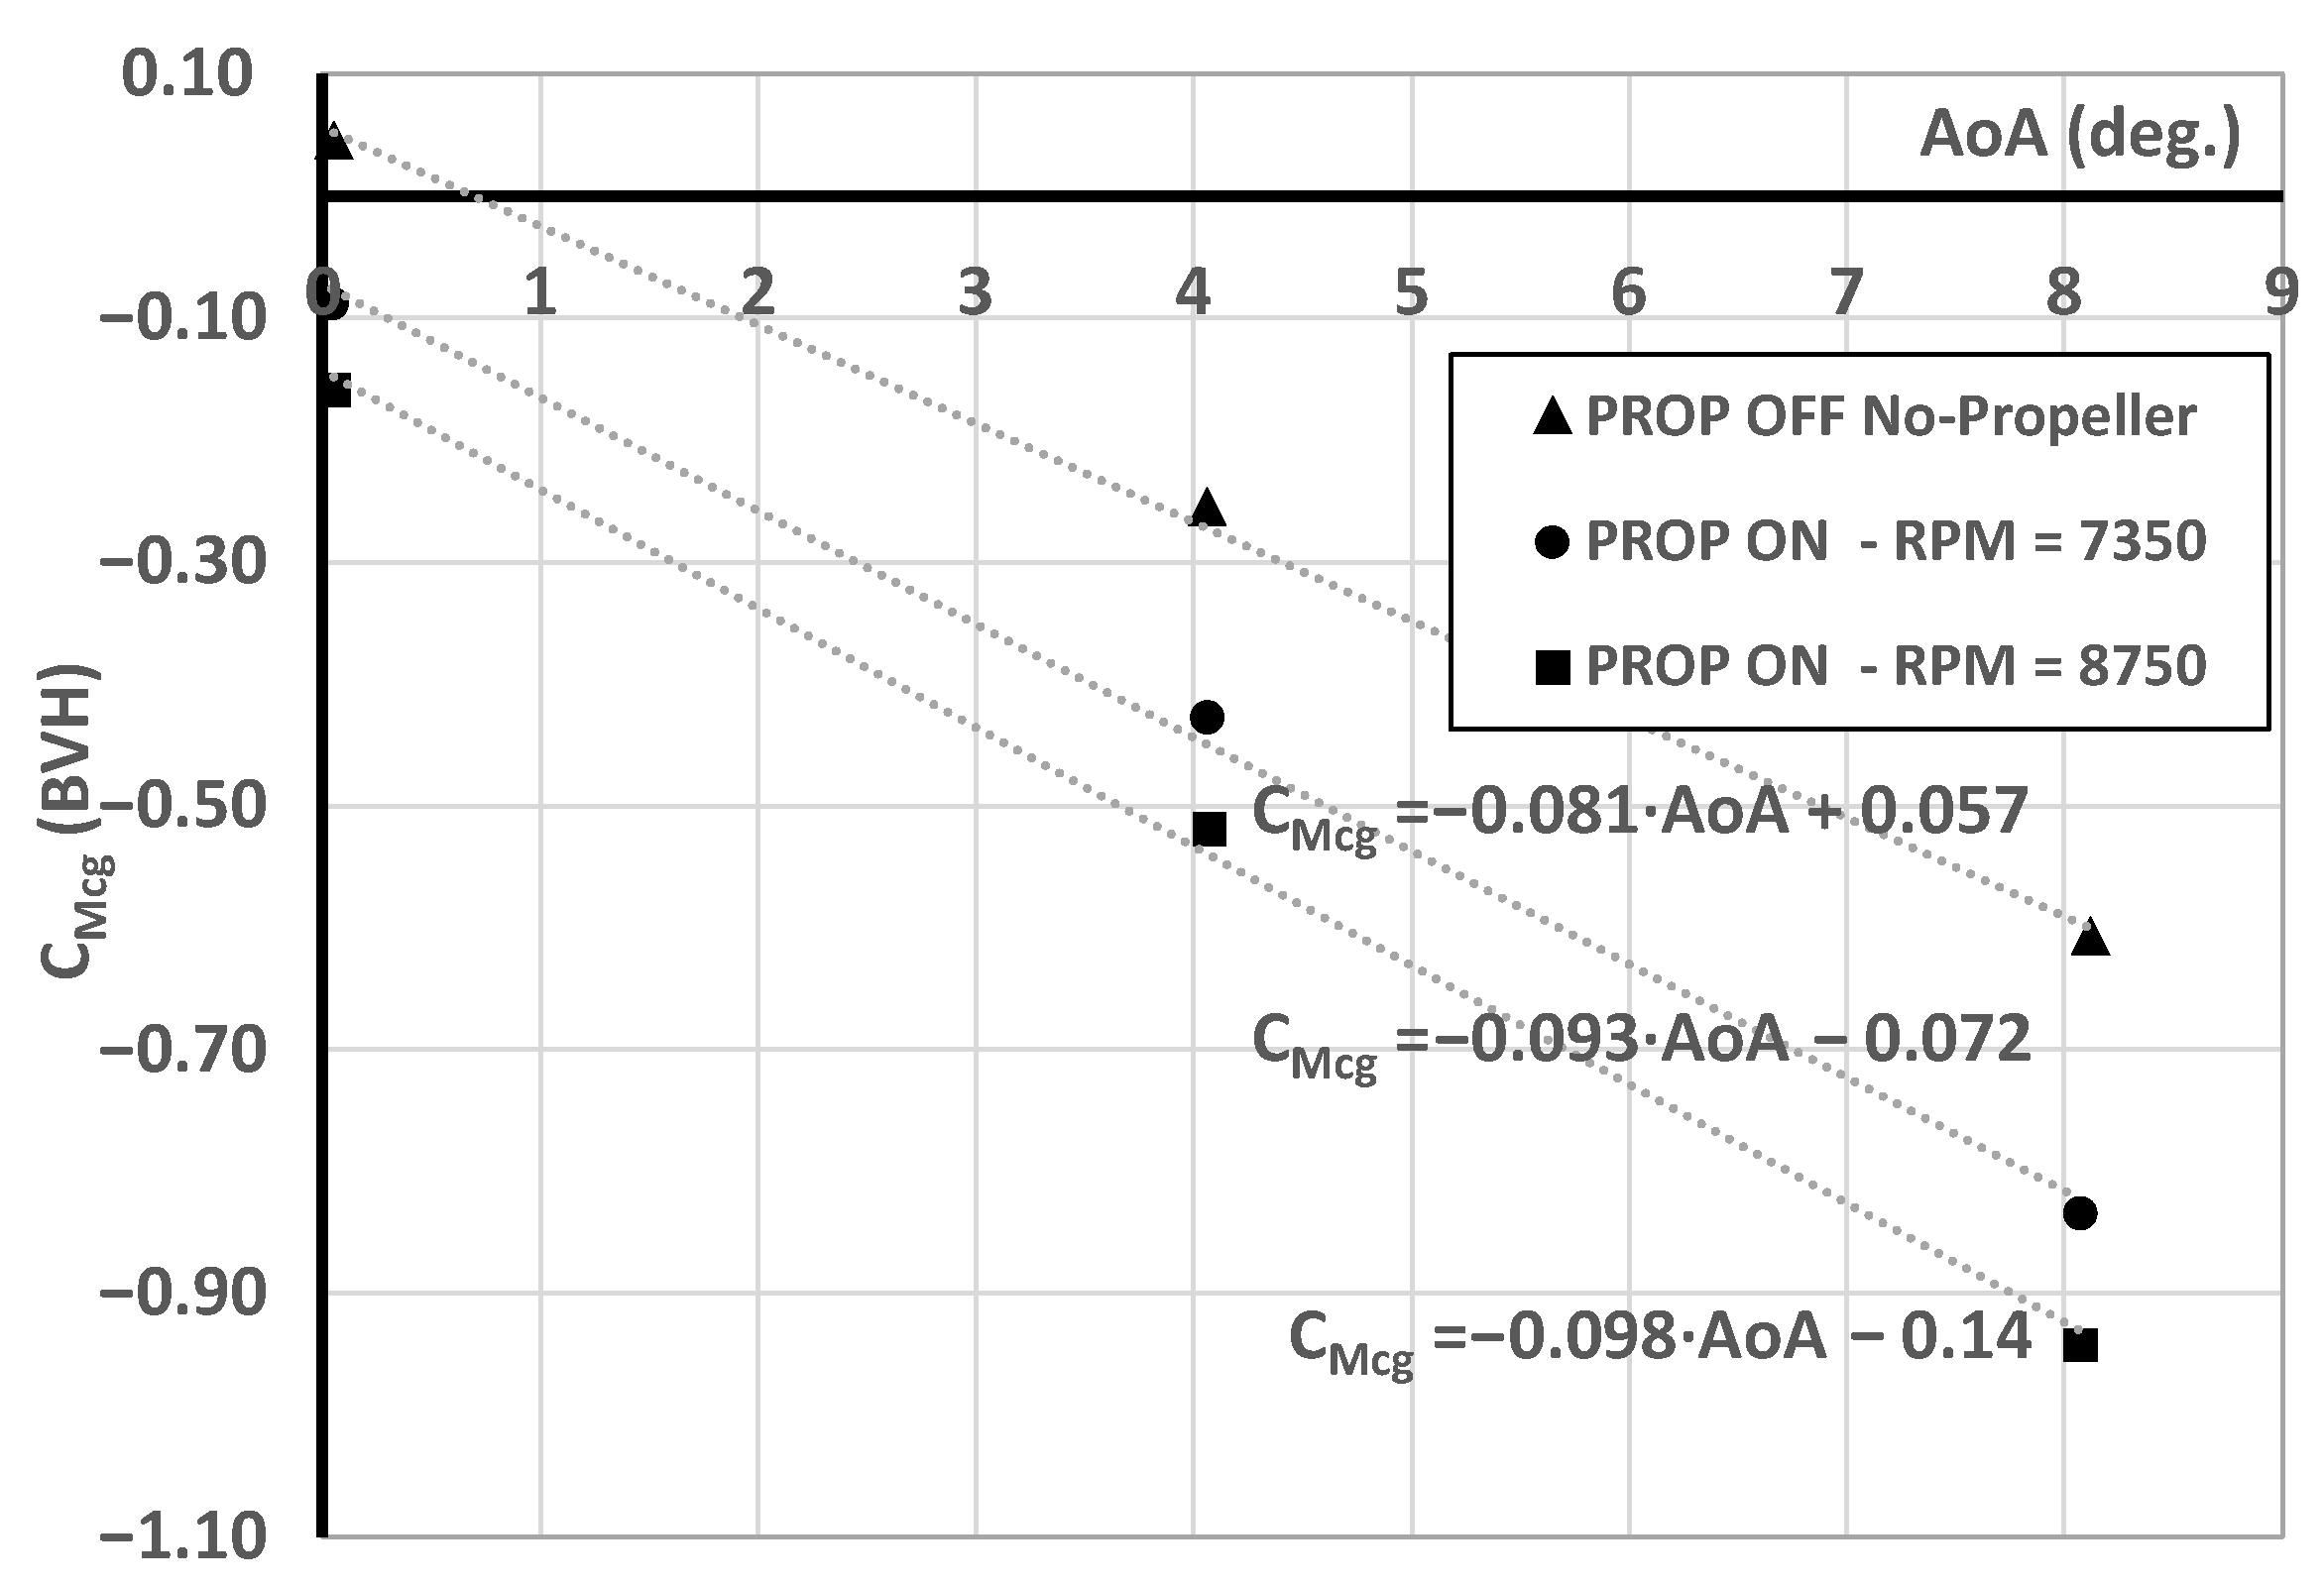
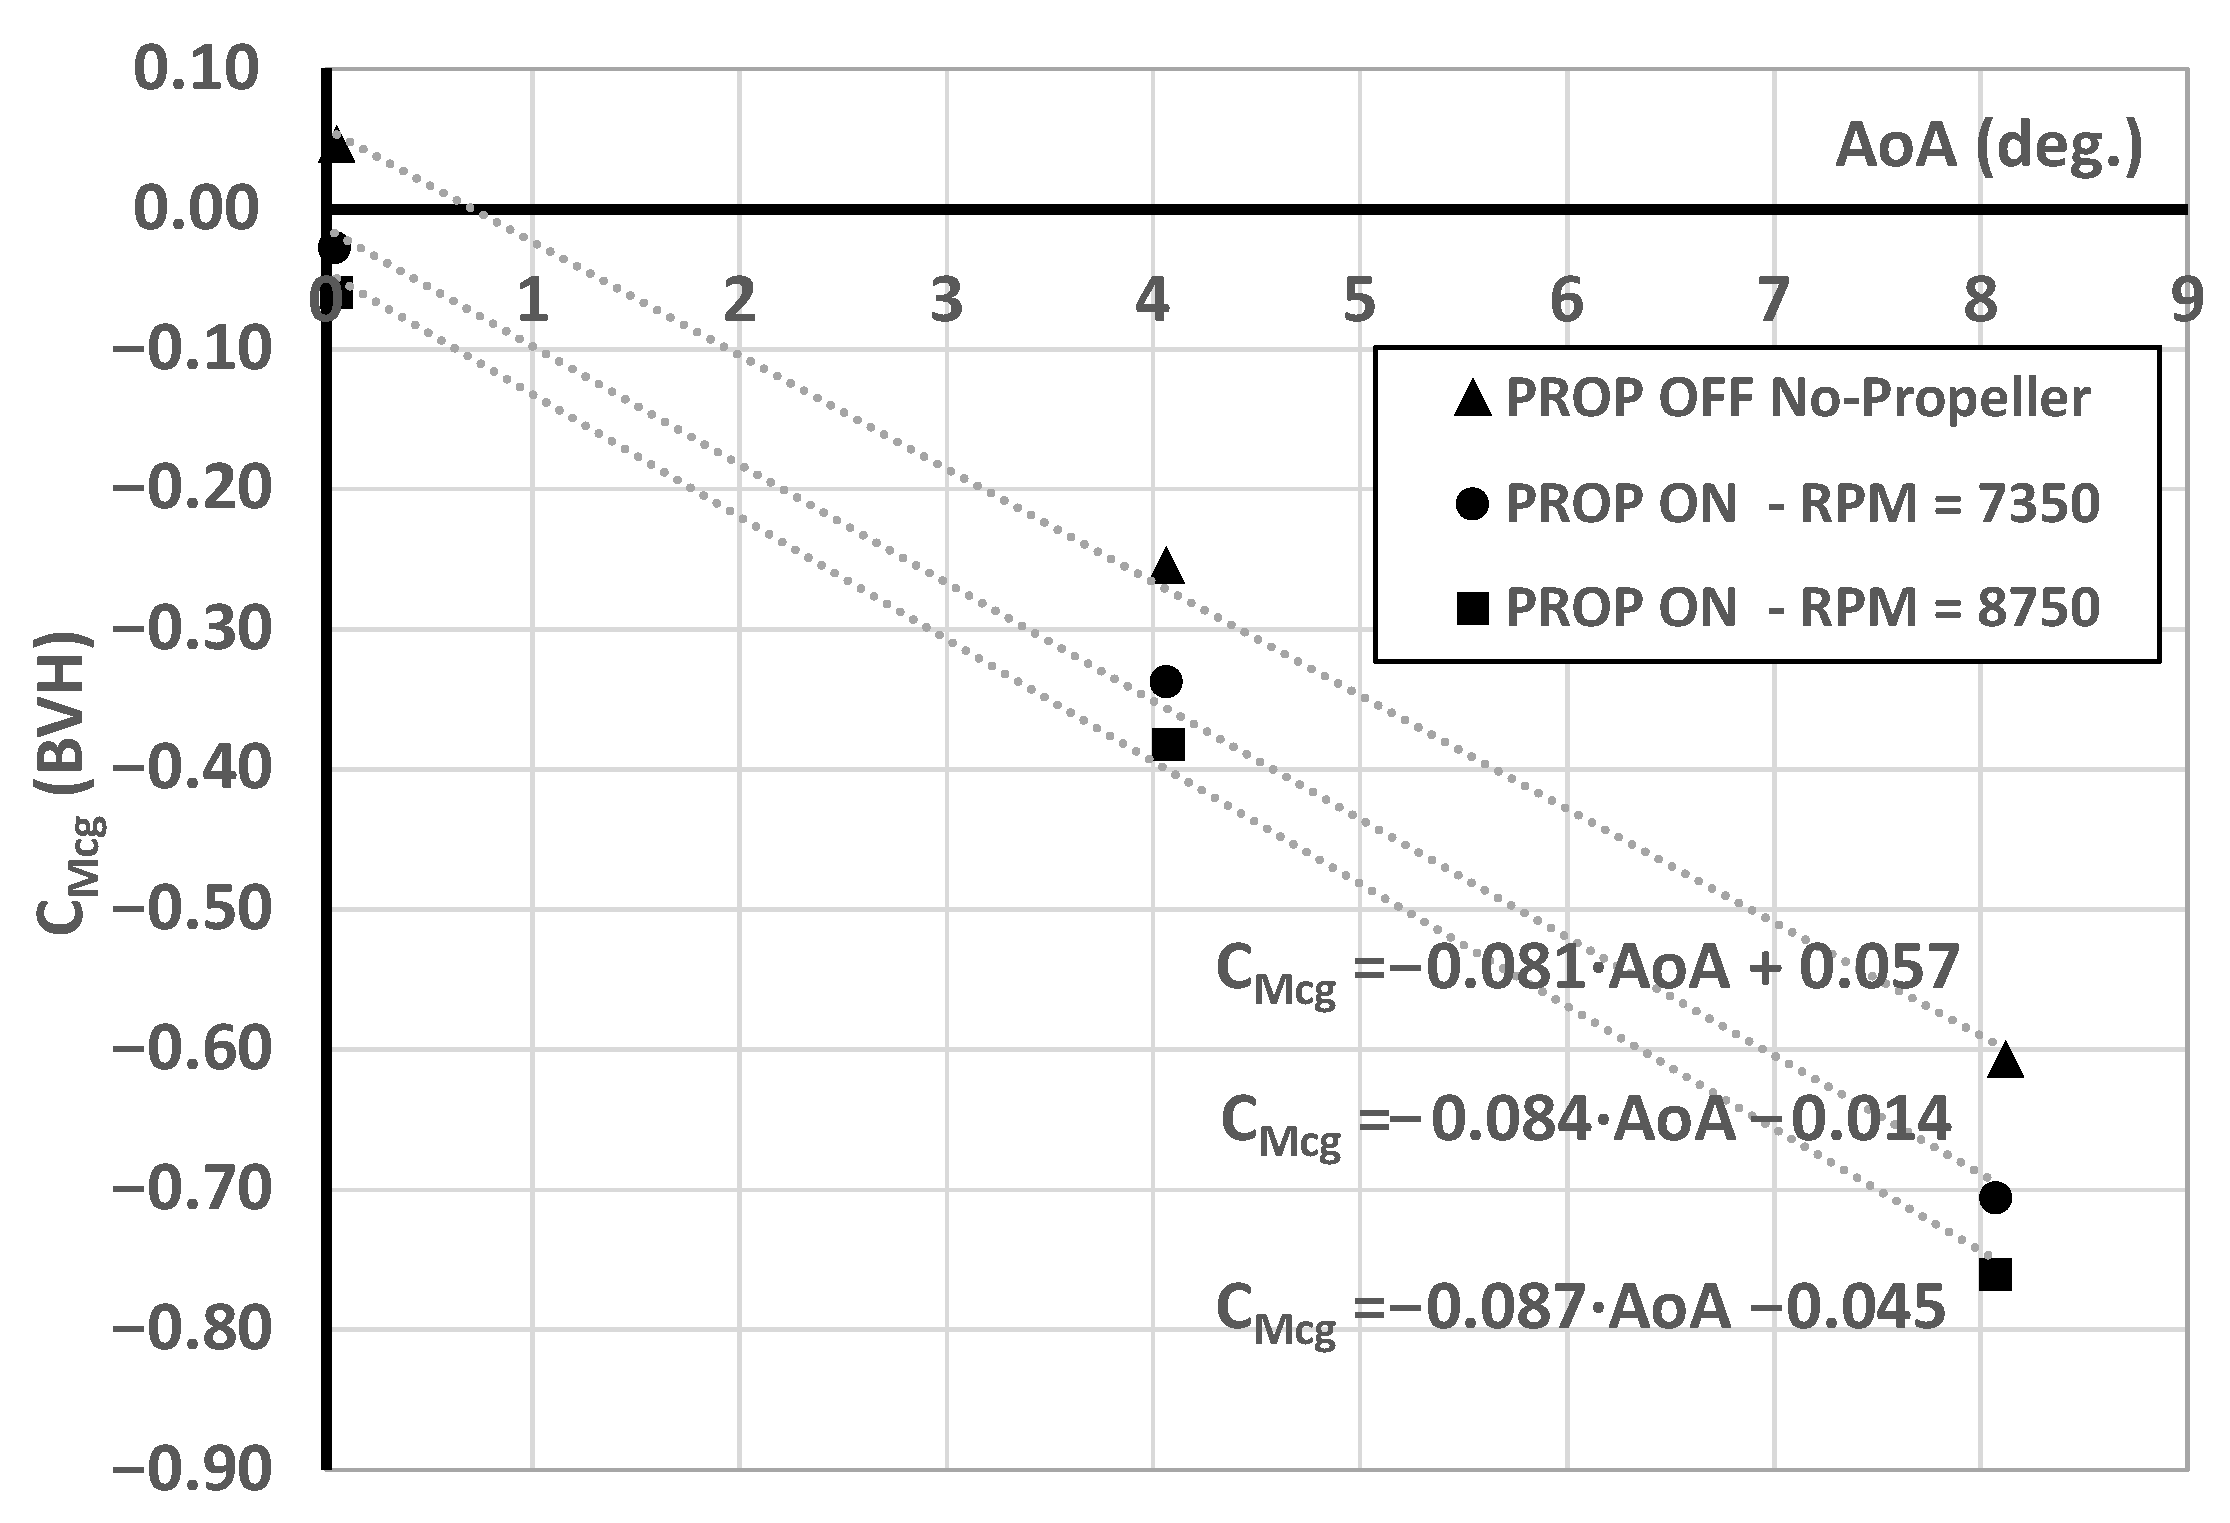
Figure 12.
Global propulsive effects (direct and indirect) on the pitching moment coefficient curves for two engine design points and power-off conditions, = 315,000, at LE MAC, IU rotation at two RPM settings.
Figure 12.
Global propulsive effects (direct and indirect) on the pitching moment coefficient curves for two engine design points and power-off conditions, = 315,000, at LE MAC, IU rotation at two RPM settings.
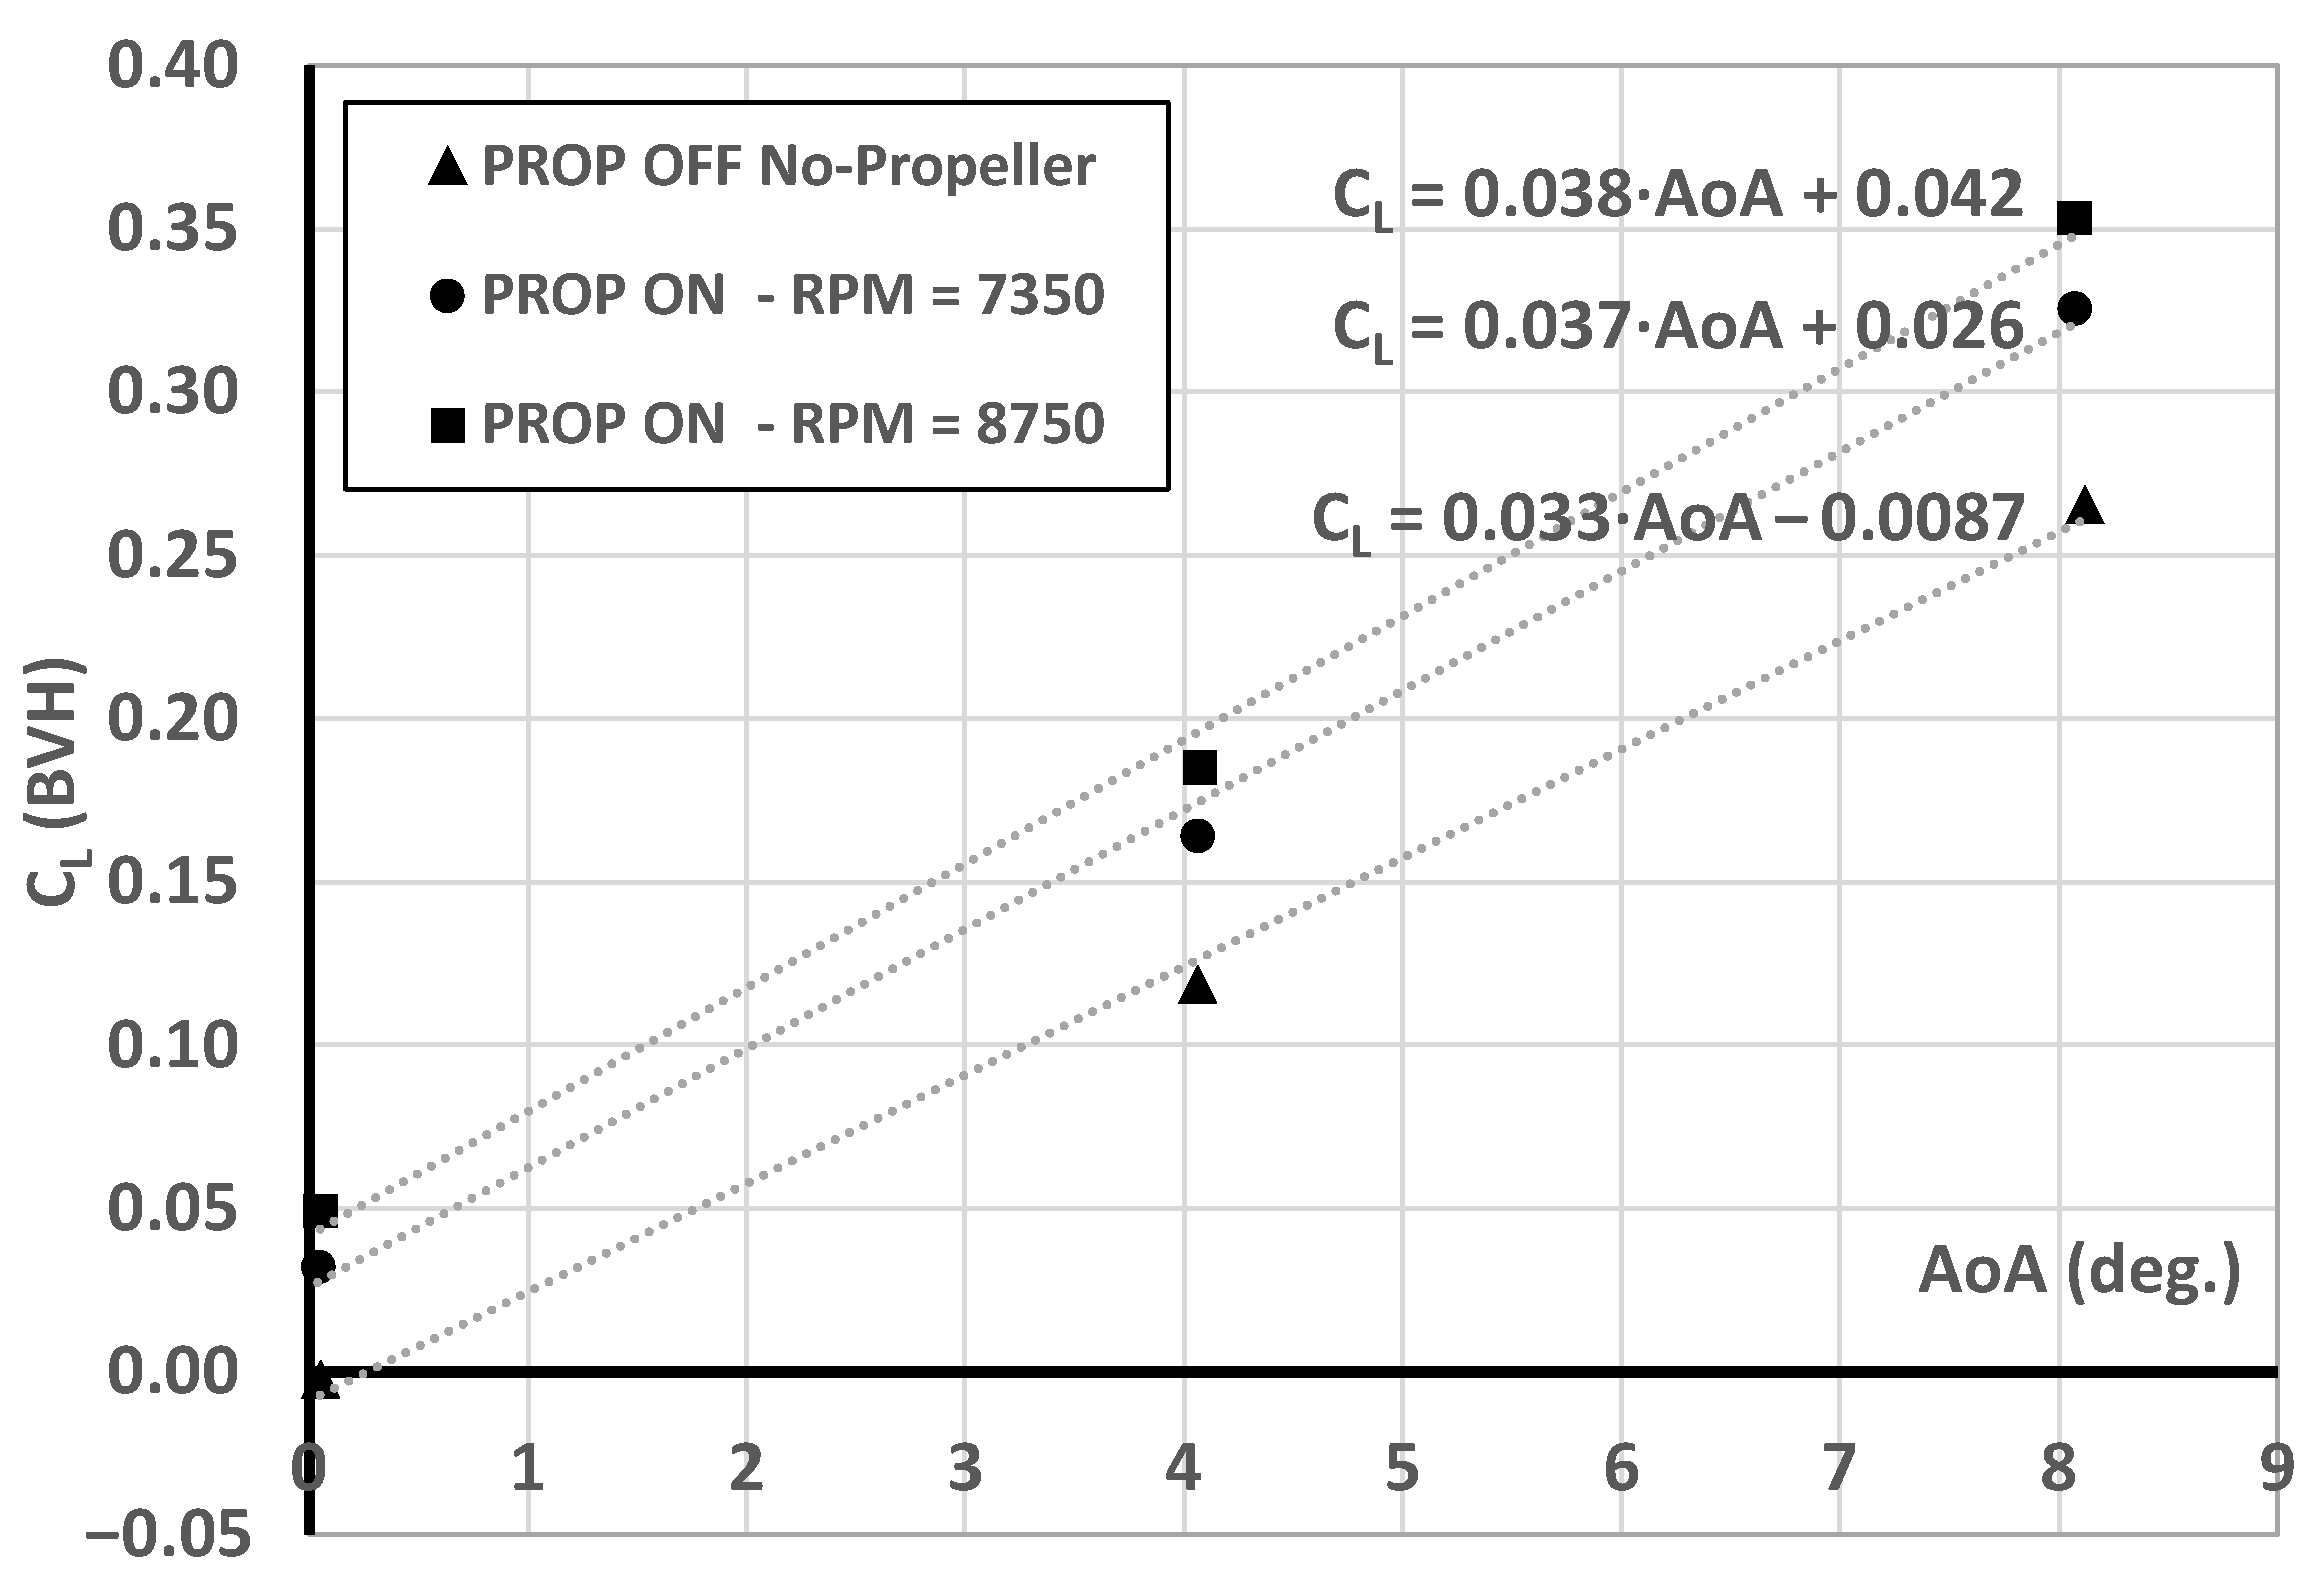
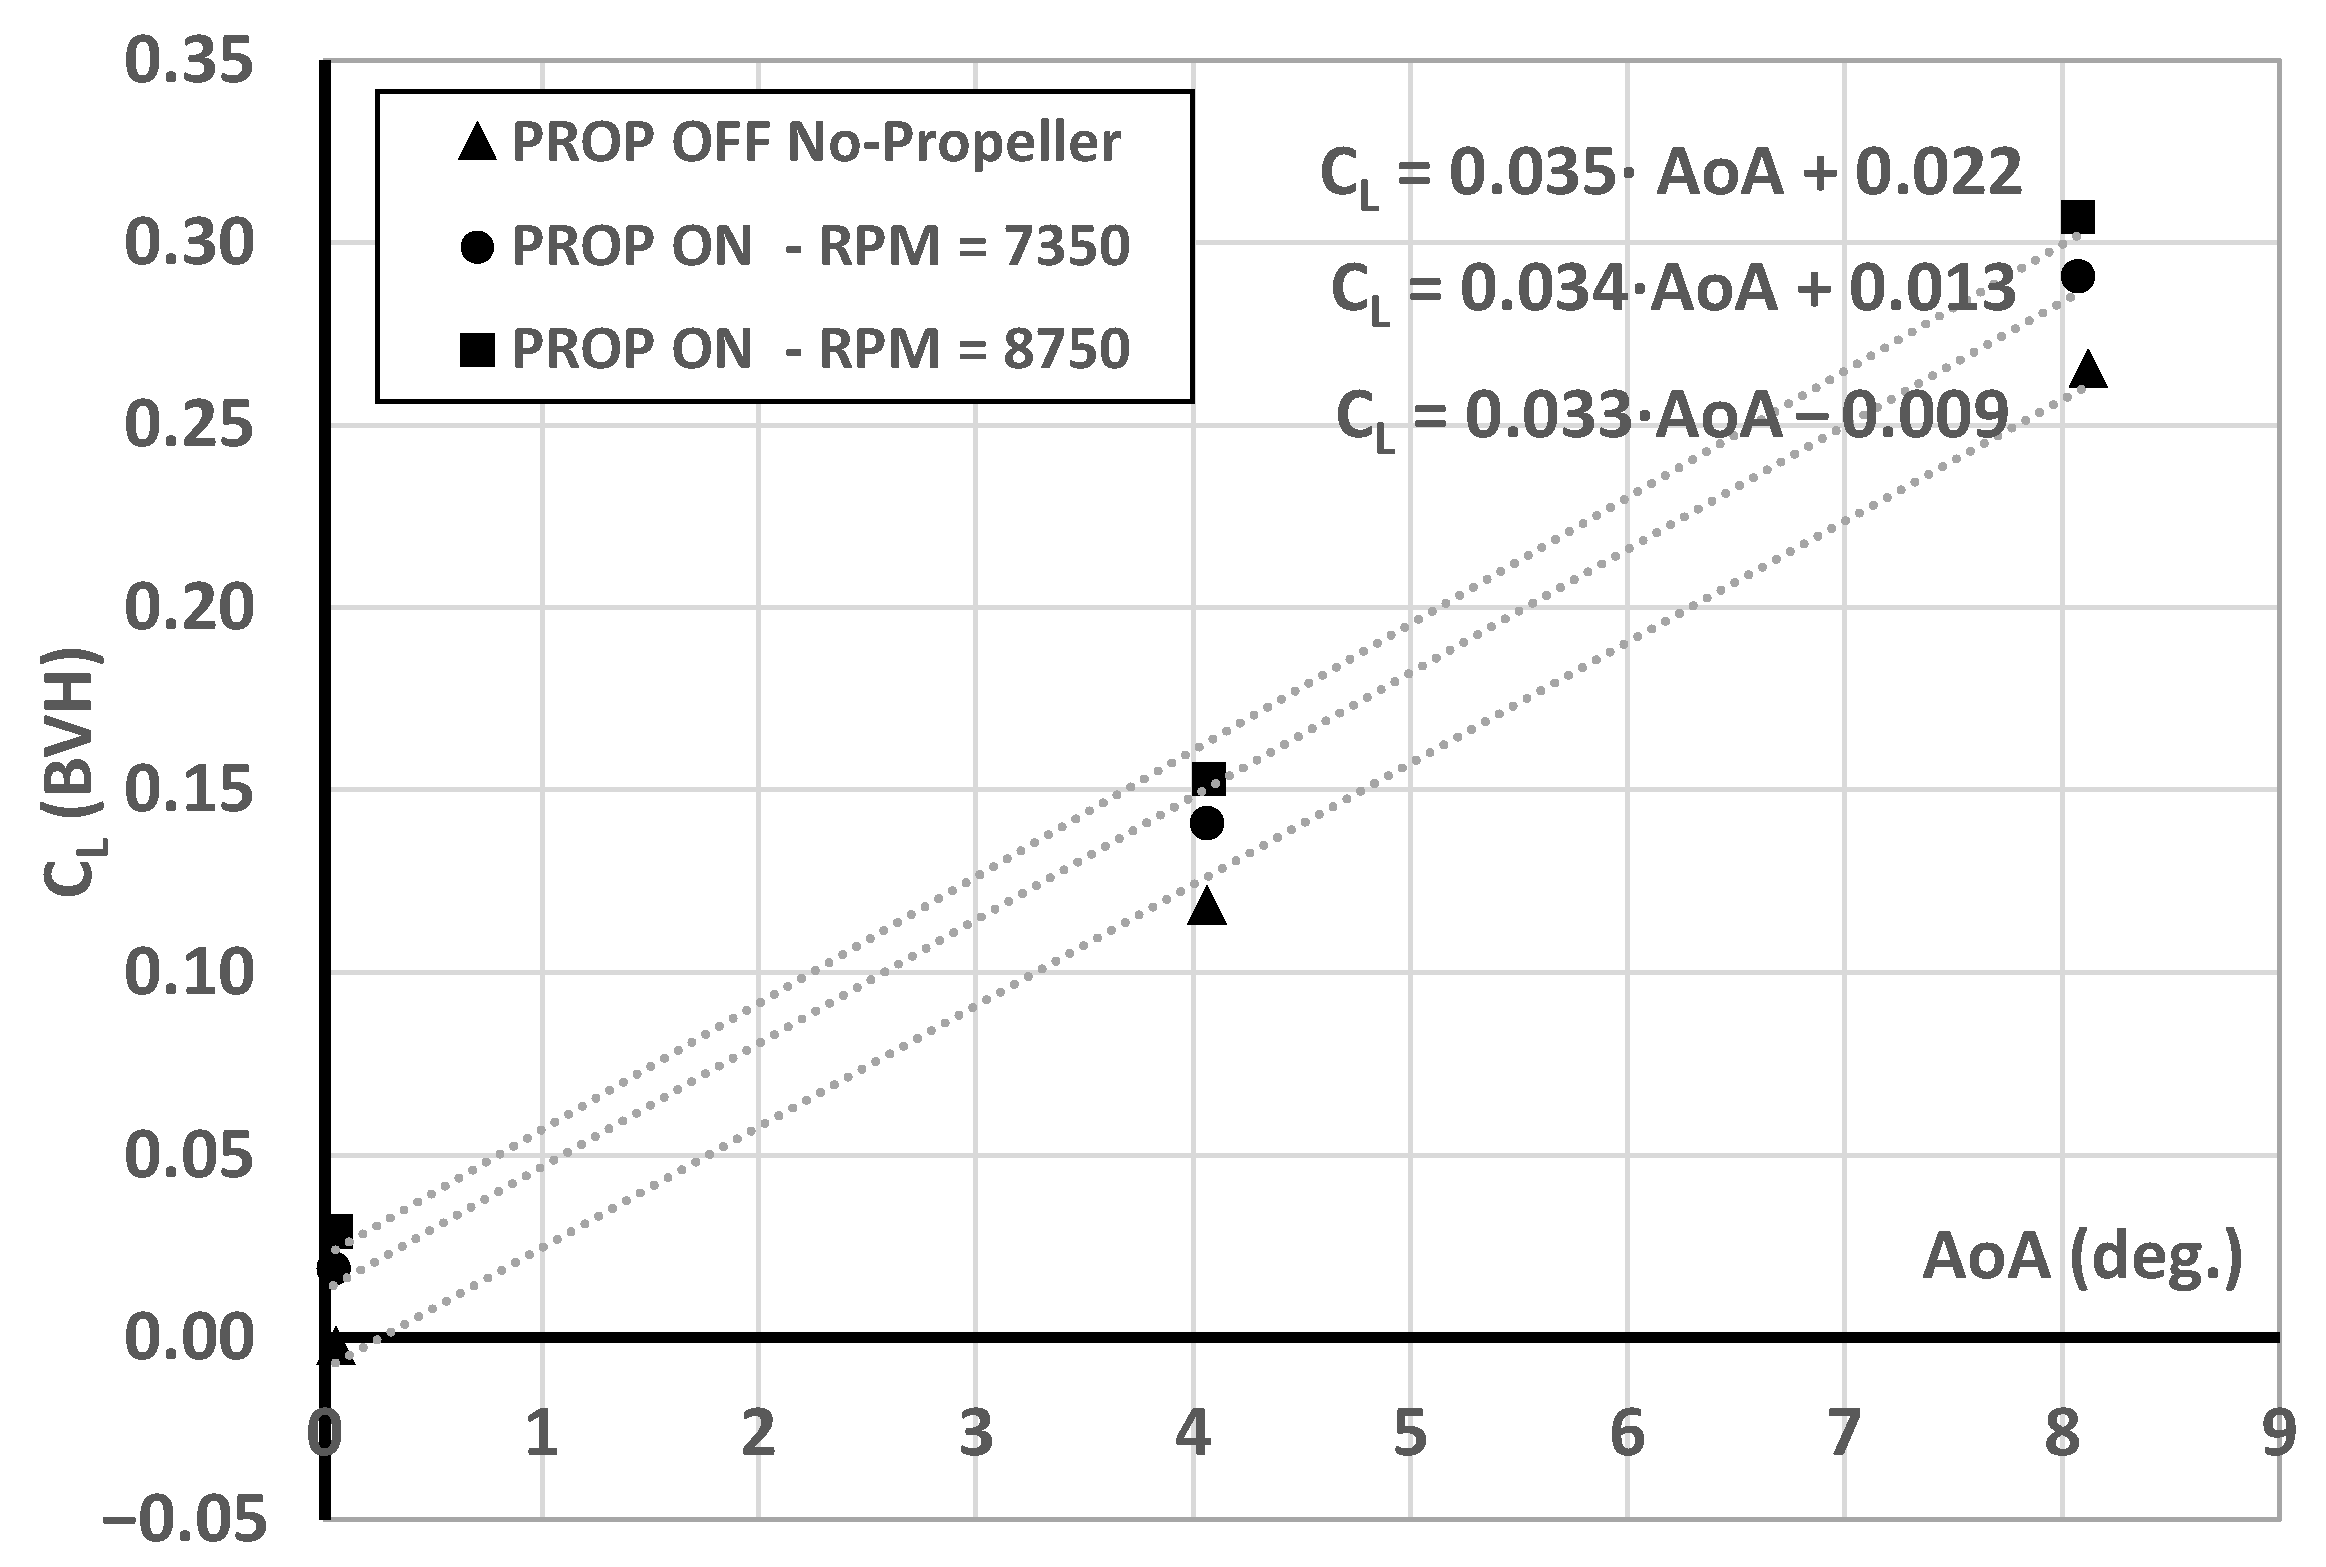
Figure 13.
Global propulsive effects (direct and indirect) on the lift coefficient curves for two engine design points and power-off conditions, = 315,000, IU rotation at two RPM settings.
Figure 13.
Global propulsive effects (direct and indirect) on the lift coefficient curves for two engine design points and power-off conditions, = 315,000, IU rotation at two RPM settings.
Figure 14.
Indirect propulsive effect on the lift coefficient, = 315,000, IU rotation at two RPM settings.
Figure 14.
Indirect propulsive effect on the lift coefficient, = 315,000, IU rotation at two RPM settings.
Figure 15.
Indirect propulsive effect on the lift coefficient, = 315,000, at LE MAC, IU rotation at two RPM settings.
Figure 15.
Indirect propulsive effect on the lift coefficient, = 315,000, at LE MAC, IU rotation at two RPM settings.
Figure 16.
Aircraft complete configuration with electric motors.
Figure 16.
Aircraft complete configuration with electric motors.
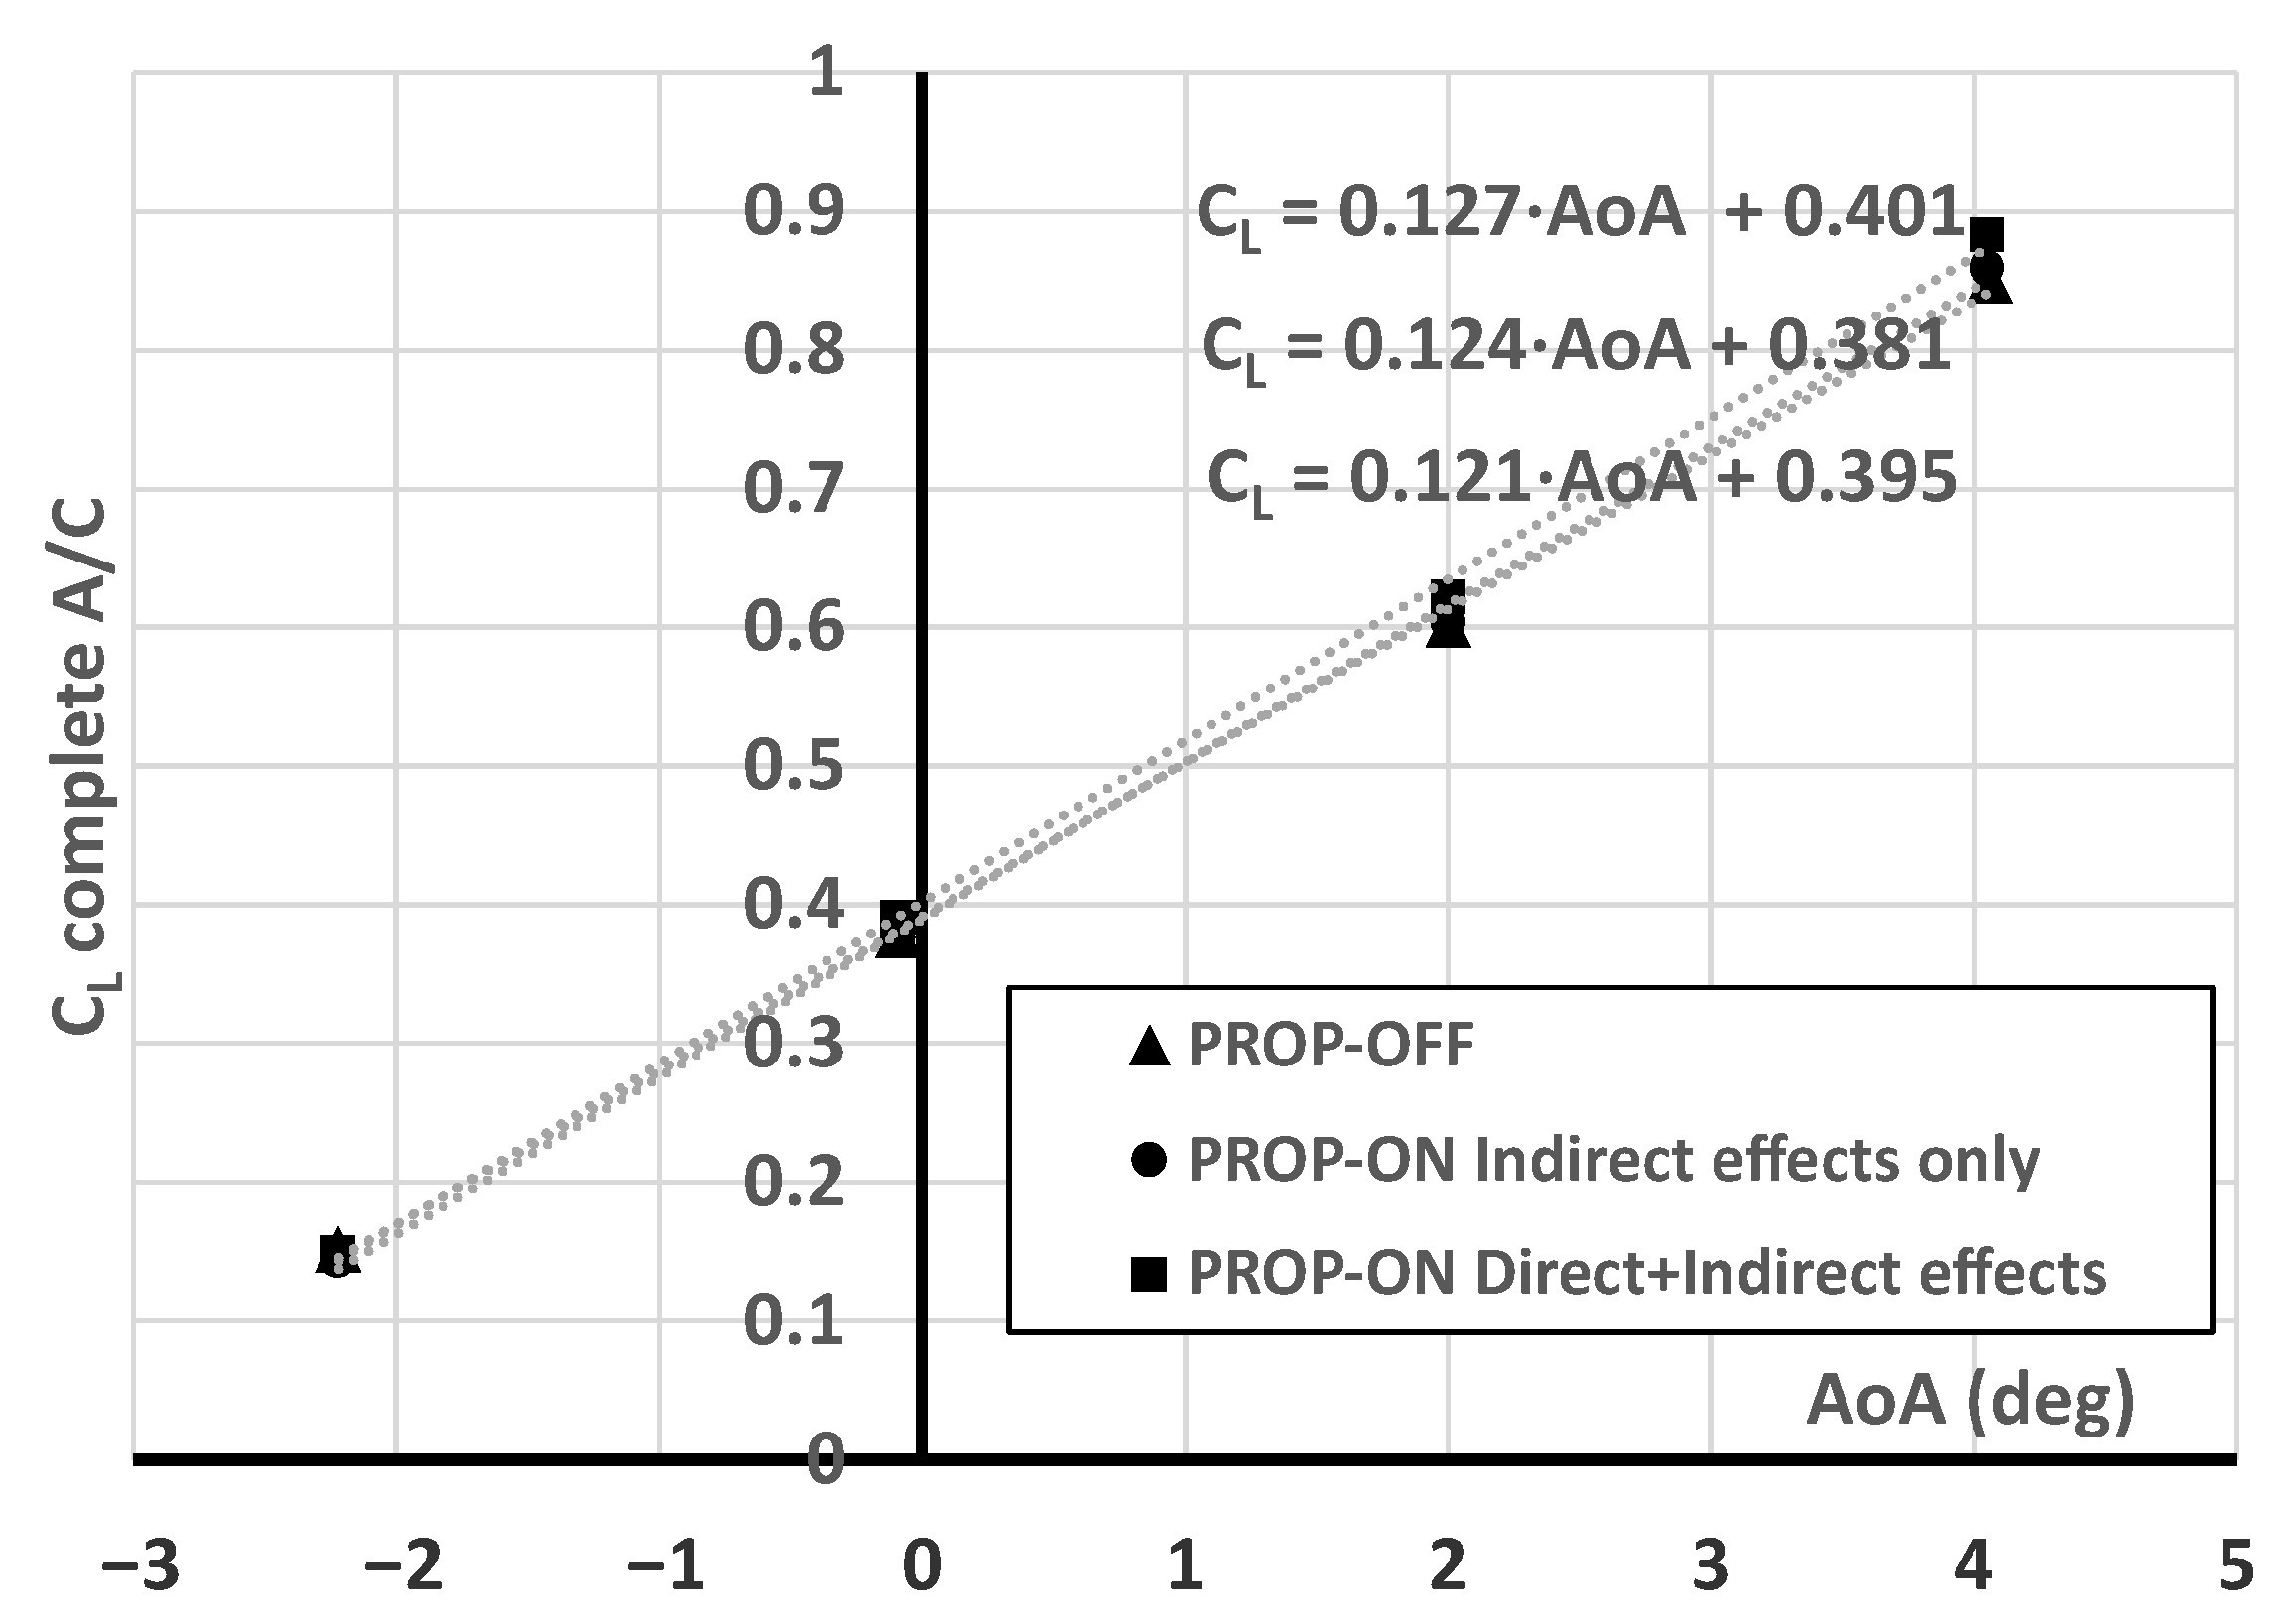
Figure 17.
Indirect and direct propulsive effects on lift coefficient curves, experimental results, = 315,000, (CR) RPM 8750, at LE MAC.
Figure 17.
Indirect and direct propulsive effects on lift coefficient curves, experimental results, = 315,000, (CR) RPM 8750, at LE MAC.
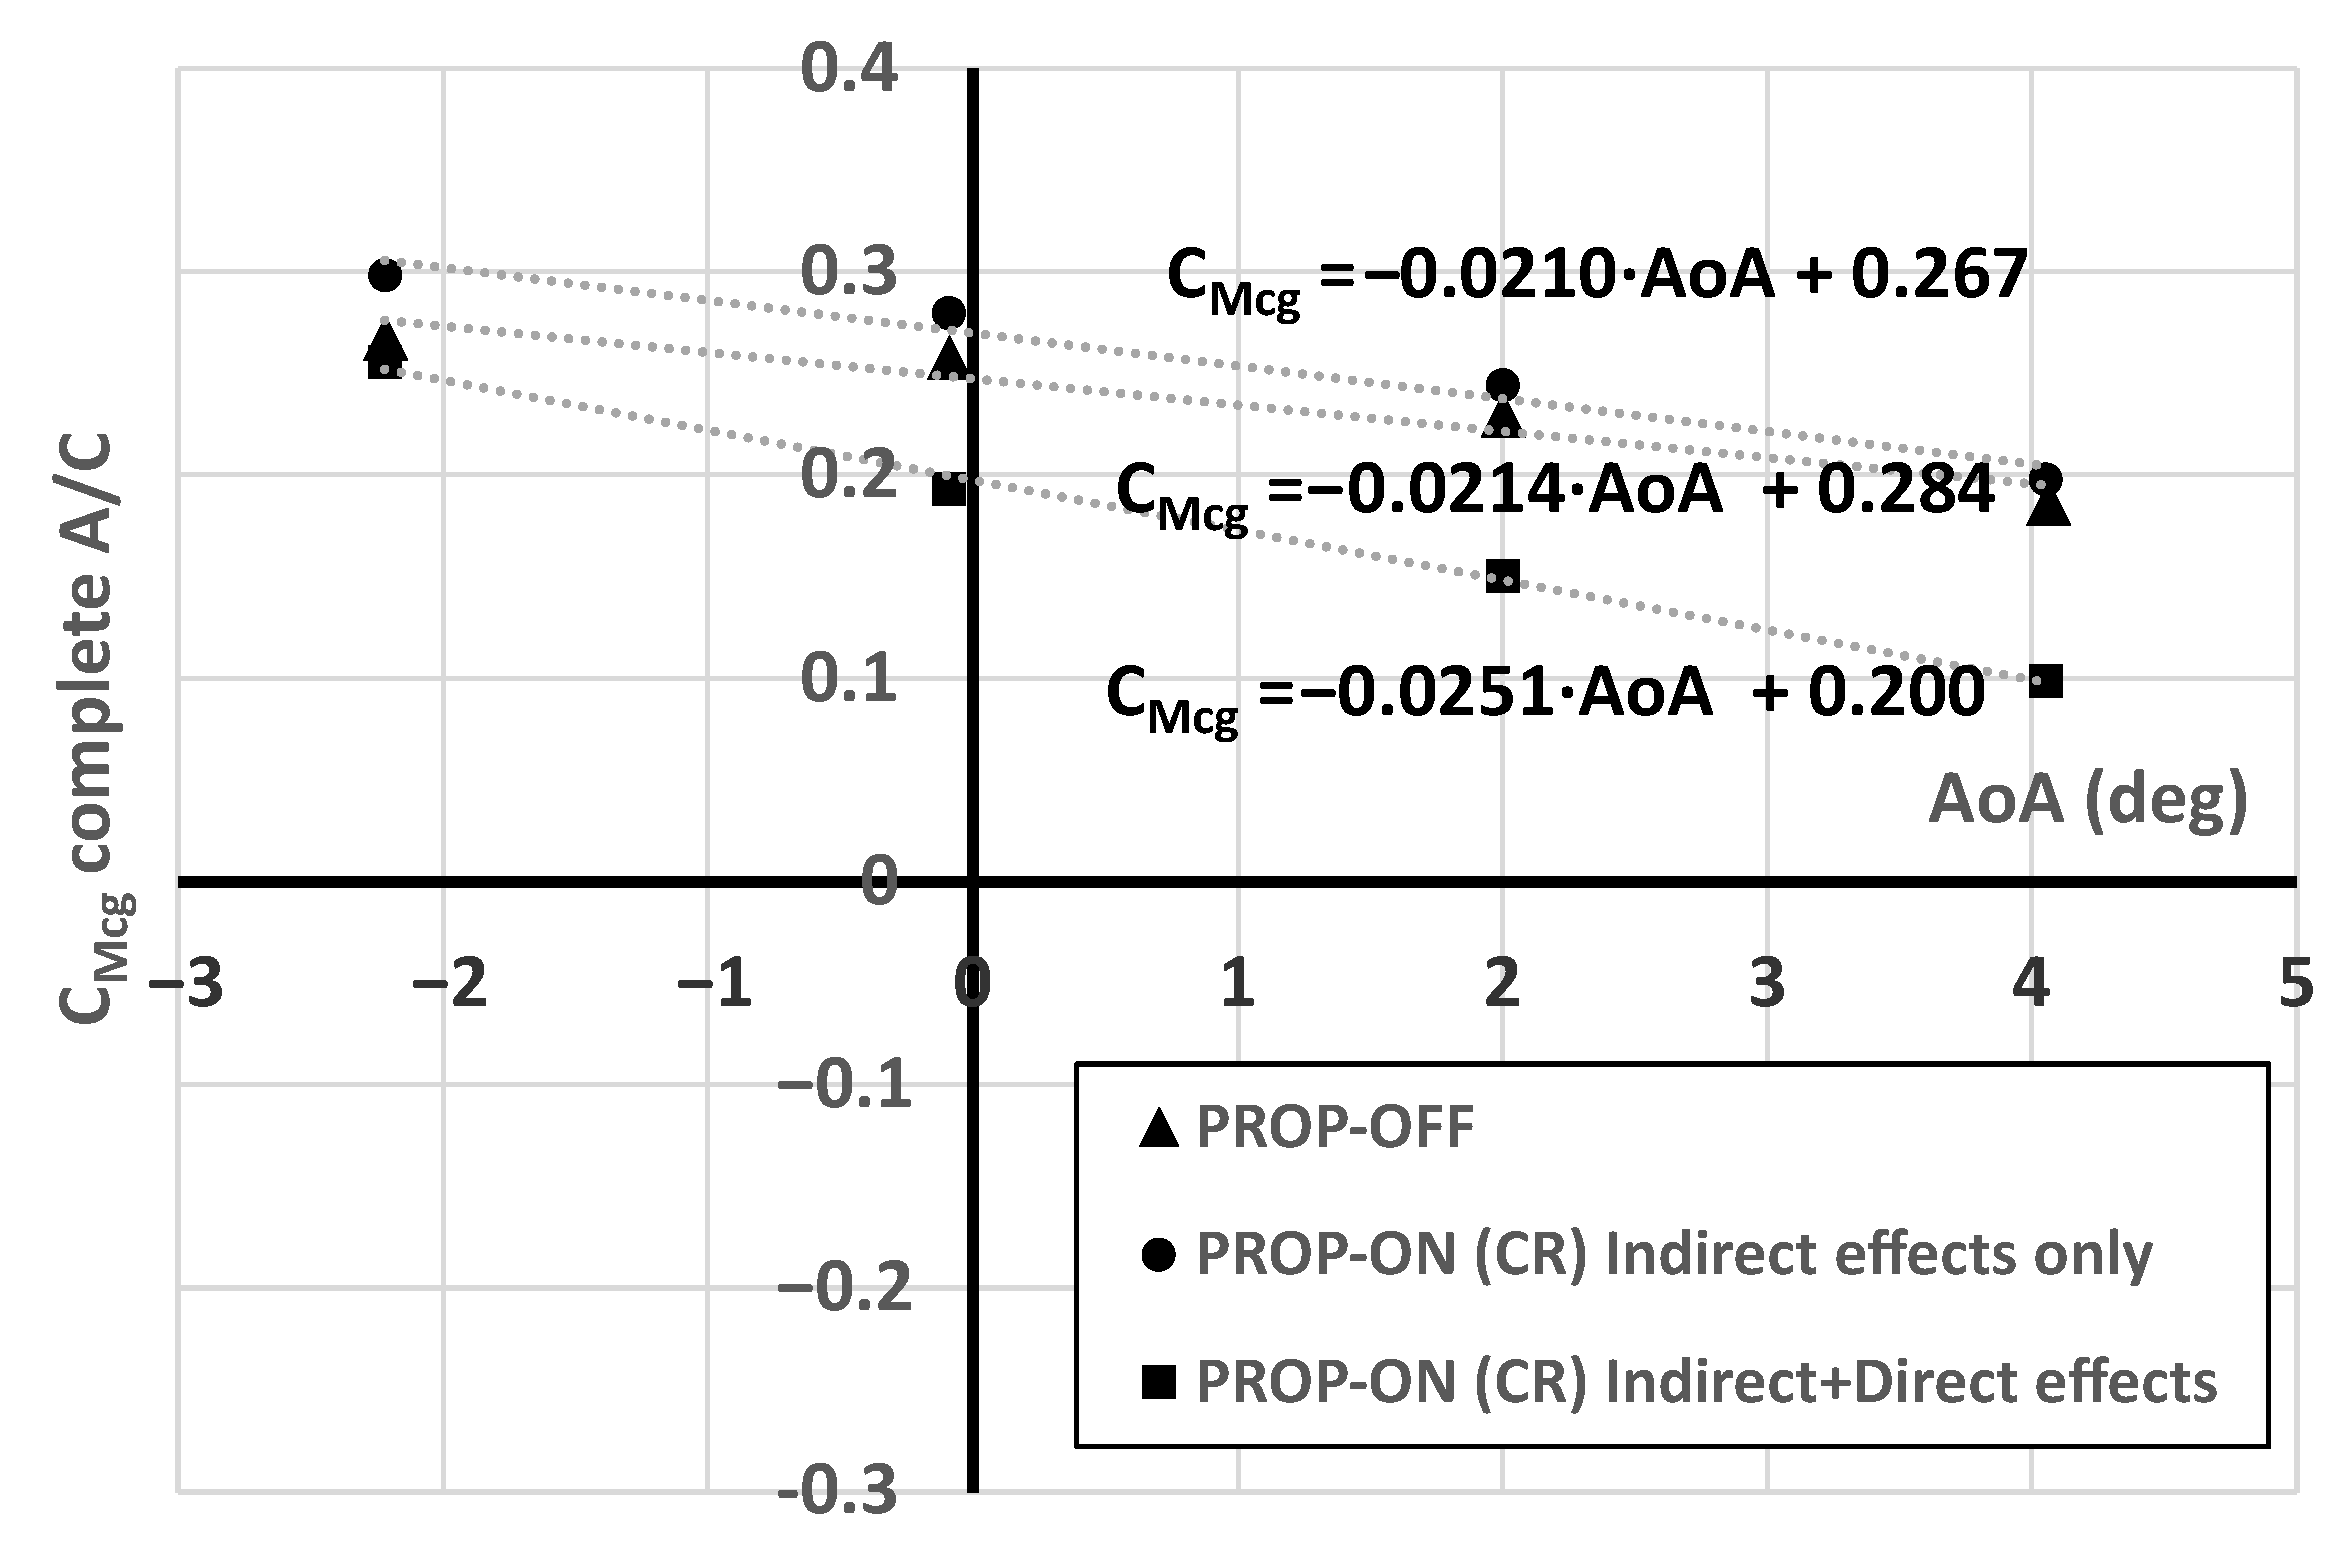
Figure 18.
Indirect and direct propulsive effects on pitching coefficient curves versus , experimental results, = 315,000, (CR) RPM 8750, at LE MAC.
Figure 18.
Indirect and direct propulsive effects on pitching coefficient curves versus , experimental results, = 315,000, (CR) RPM 8750, at LE MAC.
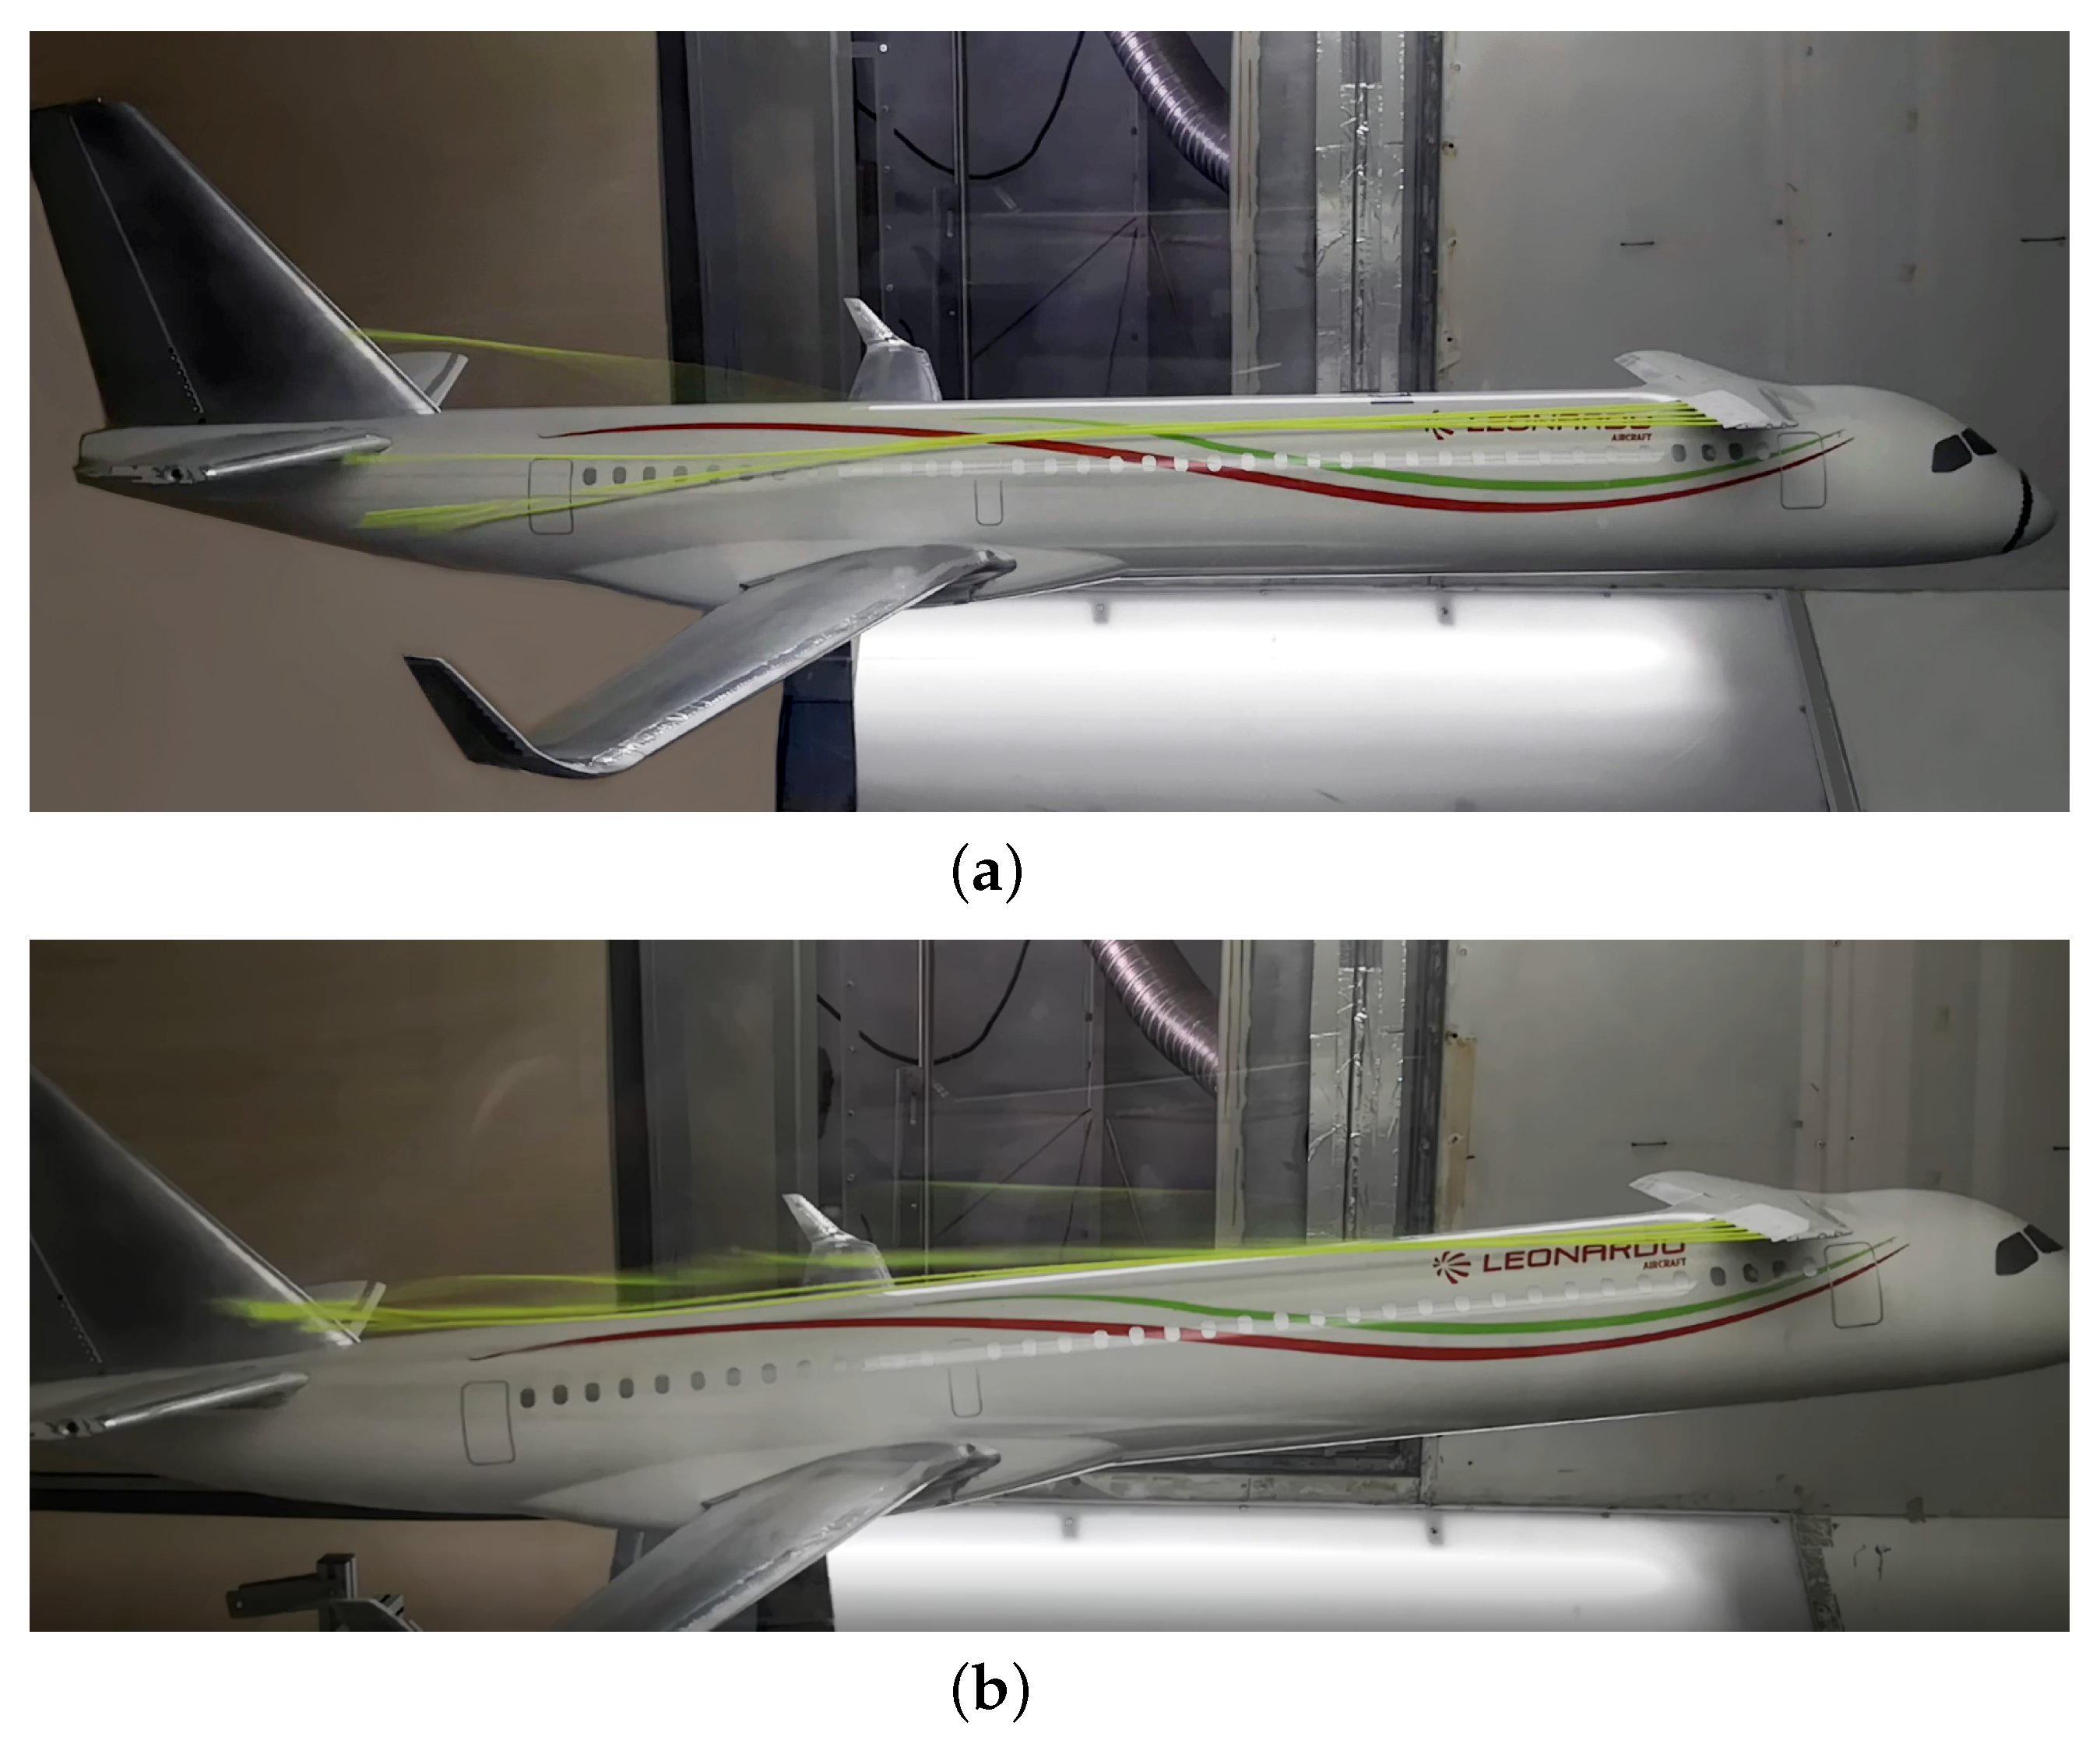
Figure 19.
Displacement of the canard wake with respect to the horizontal tailplane: visualisation test through wool yarns: (a) ; (b) .
Figure 19.
Displacement of the canard wake with respect to the horizontal tailplane: visualisation test through wool yarns: (a) ; (b) .
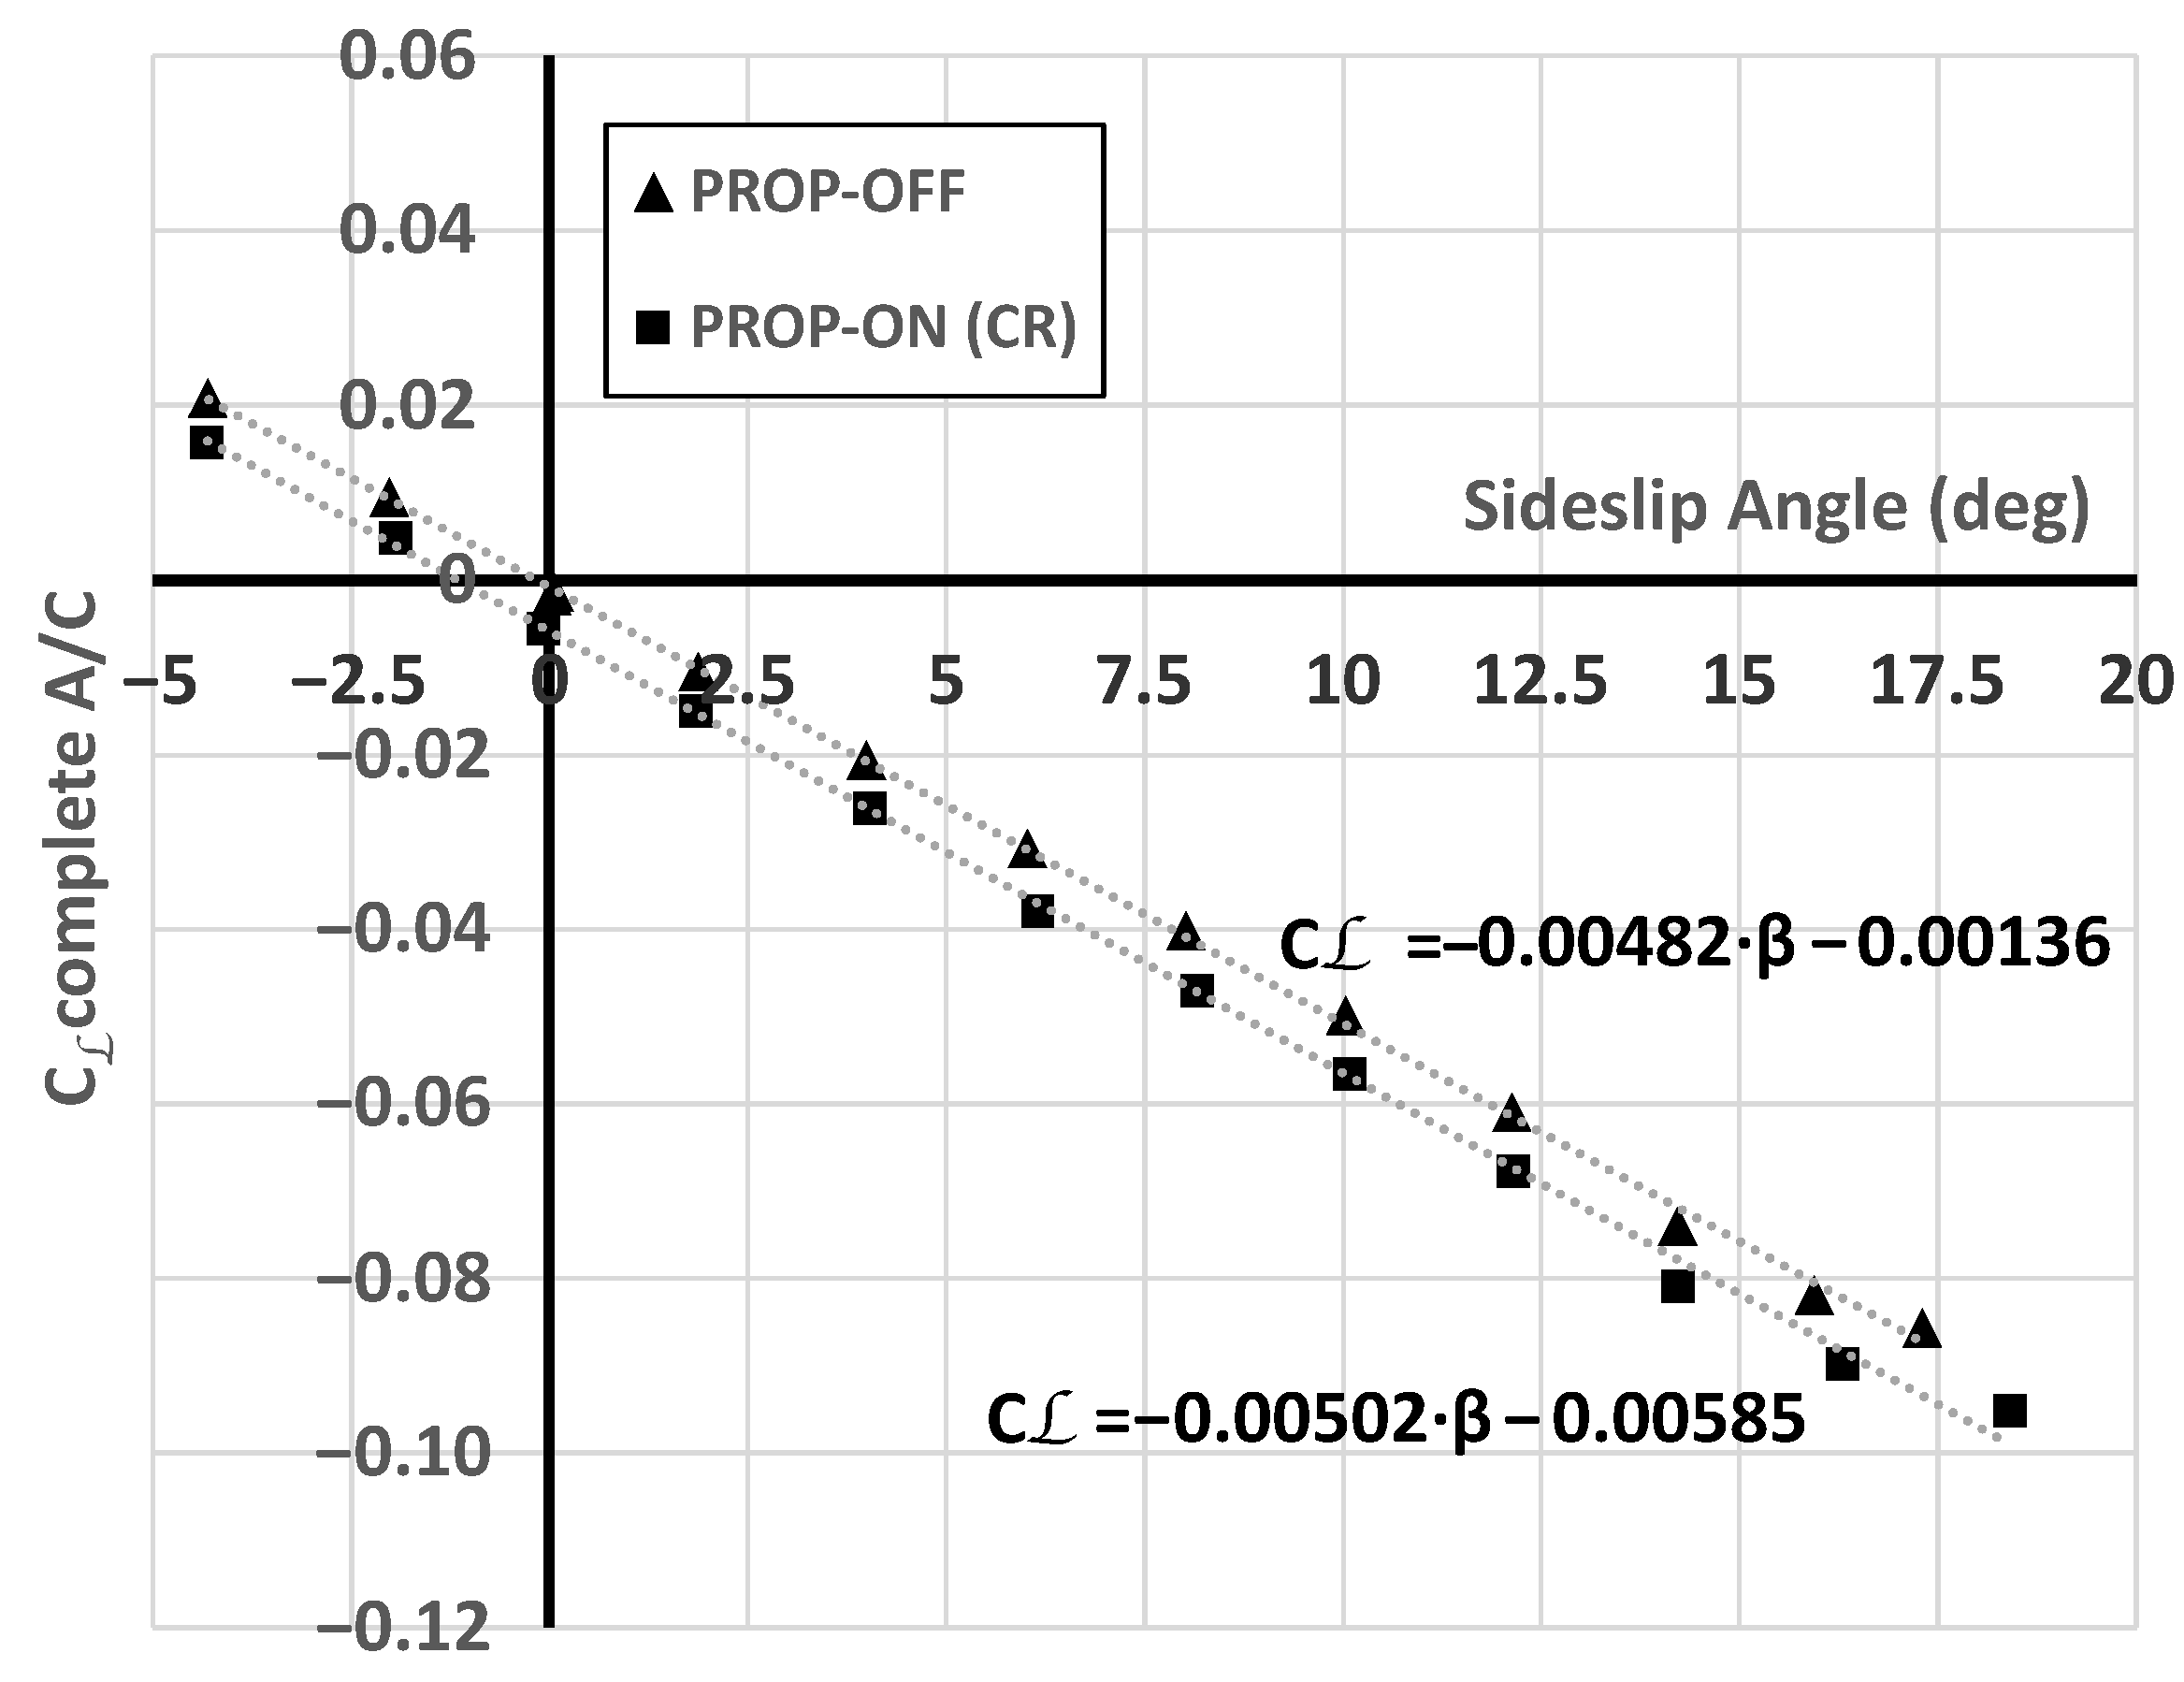
Figure 21.
Indirect propeller slipstream effects on complete aircraft rolling moment coefficient, experimental results, = 315,000, 8750 RPM (CR), at LE MAC, = 0 deg.
Figure 21.
Indirect propeller slipstream effects on complete aircraft rolling moment coefficient, experimental results, = 315,000, 8750 RPM (CR), at LE MAC, = 0 deg.
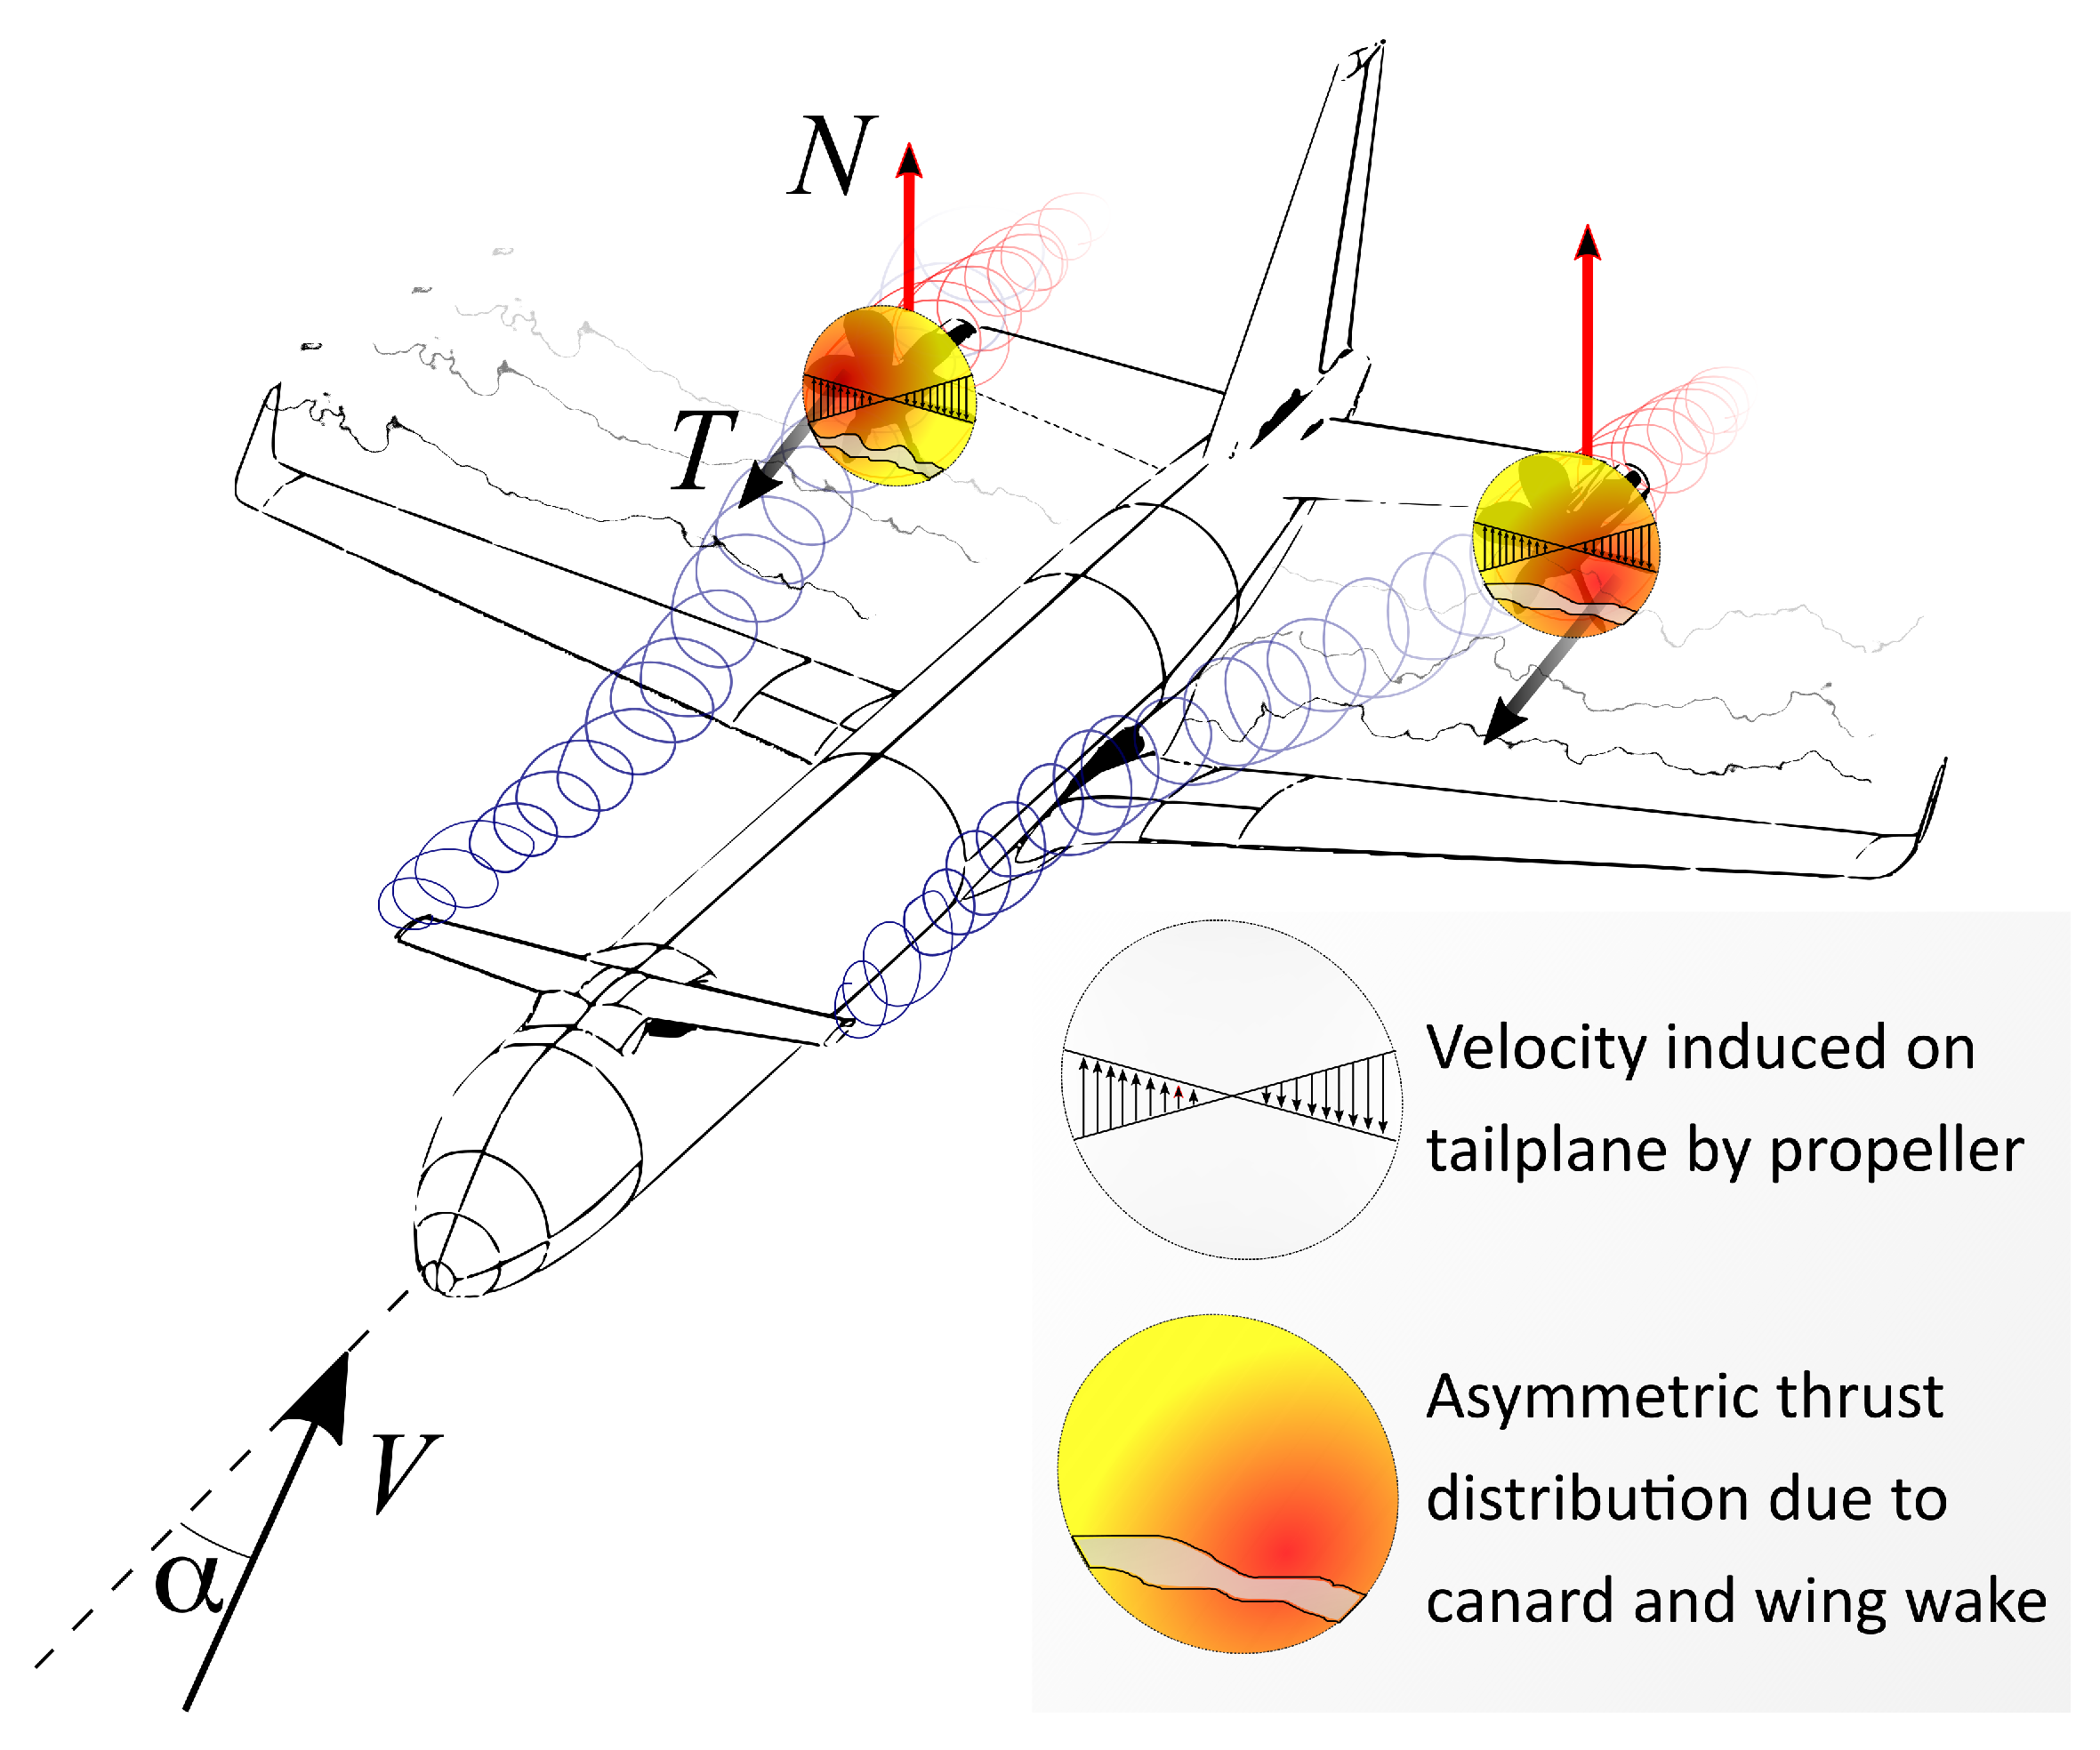
Figure 22.
Qualitative explanation of induced rolling moment due to propulsive effects (Co-Rotating propellers). Due to the propellers rotation, the tail lift distribution and the resultant lift force are modified. The blue curve and arrows are representative of the lift distribution and resultant force in in prop-off condition, whereas the red curve and arrows are representative of the prop-on condition. The green arrow indicates the direction of the resulting rolling moment in prop-on condition.
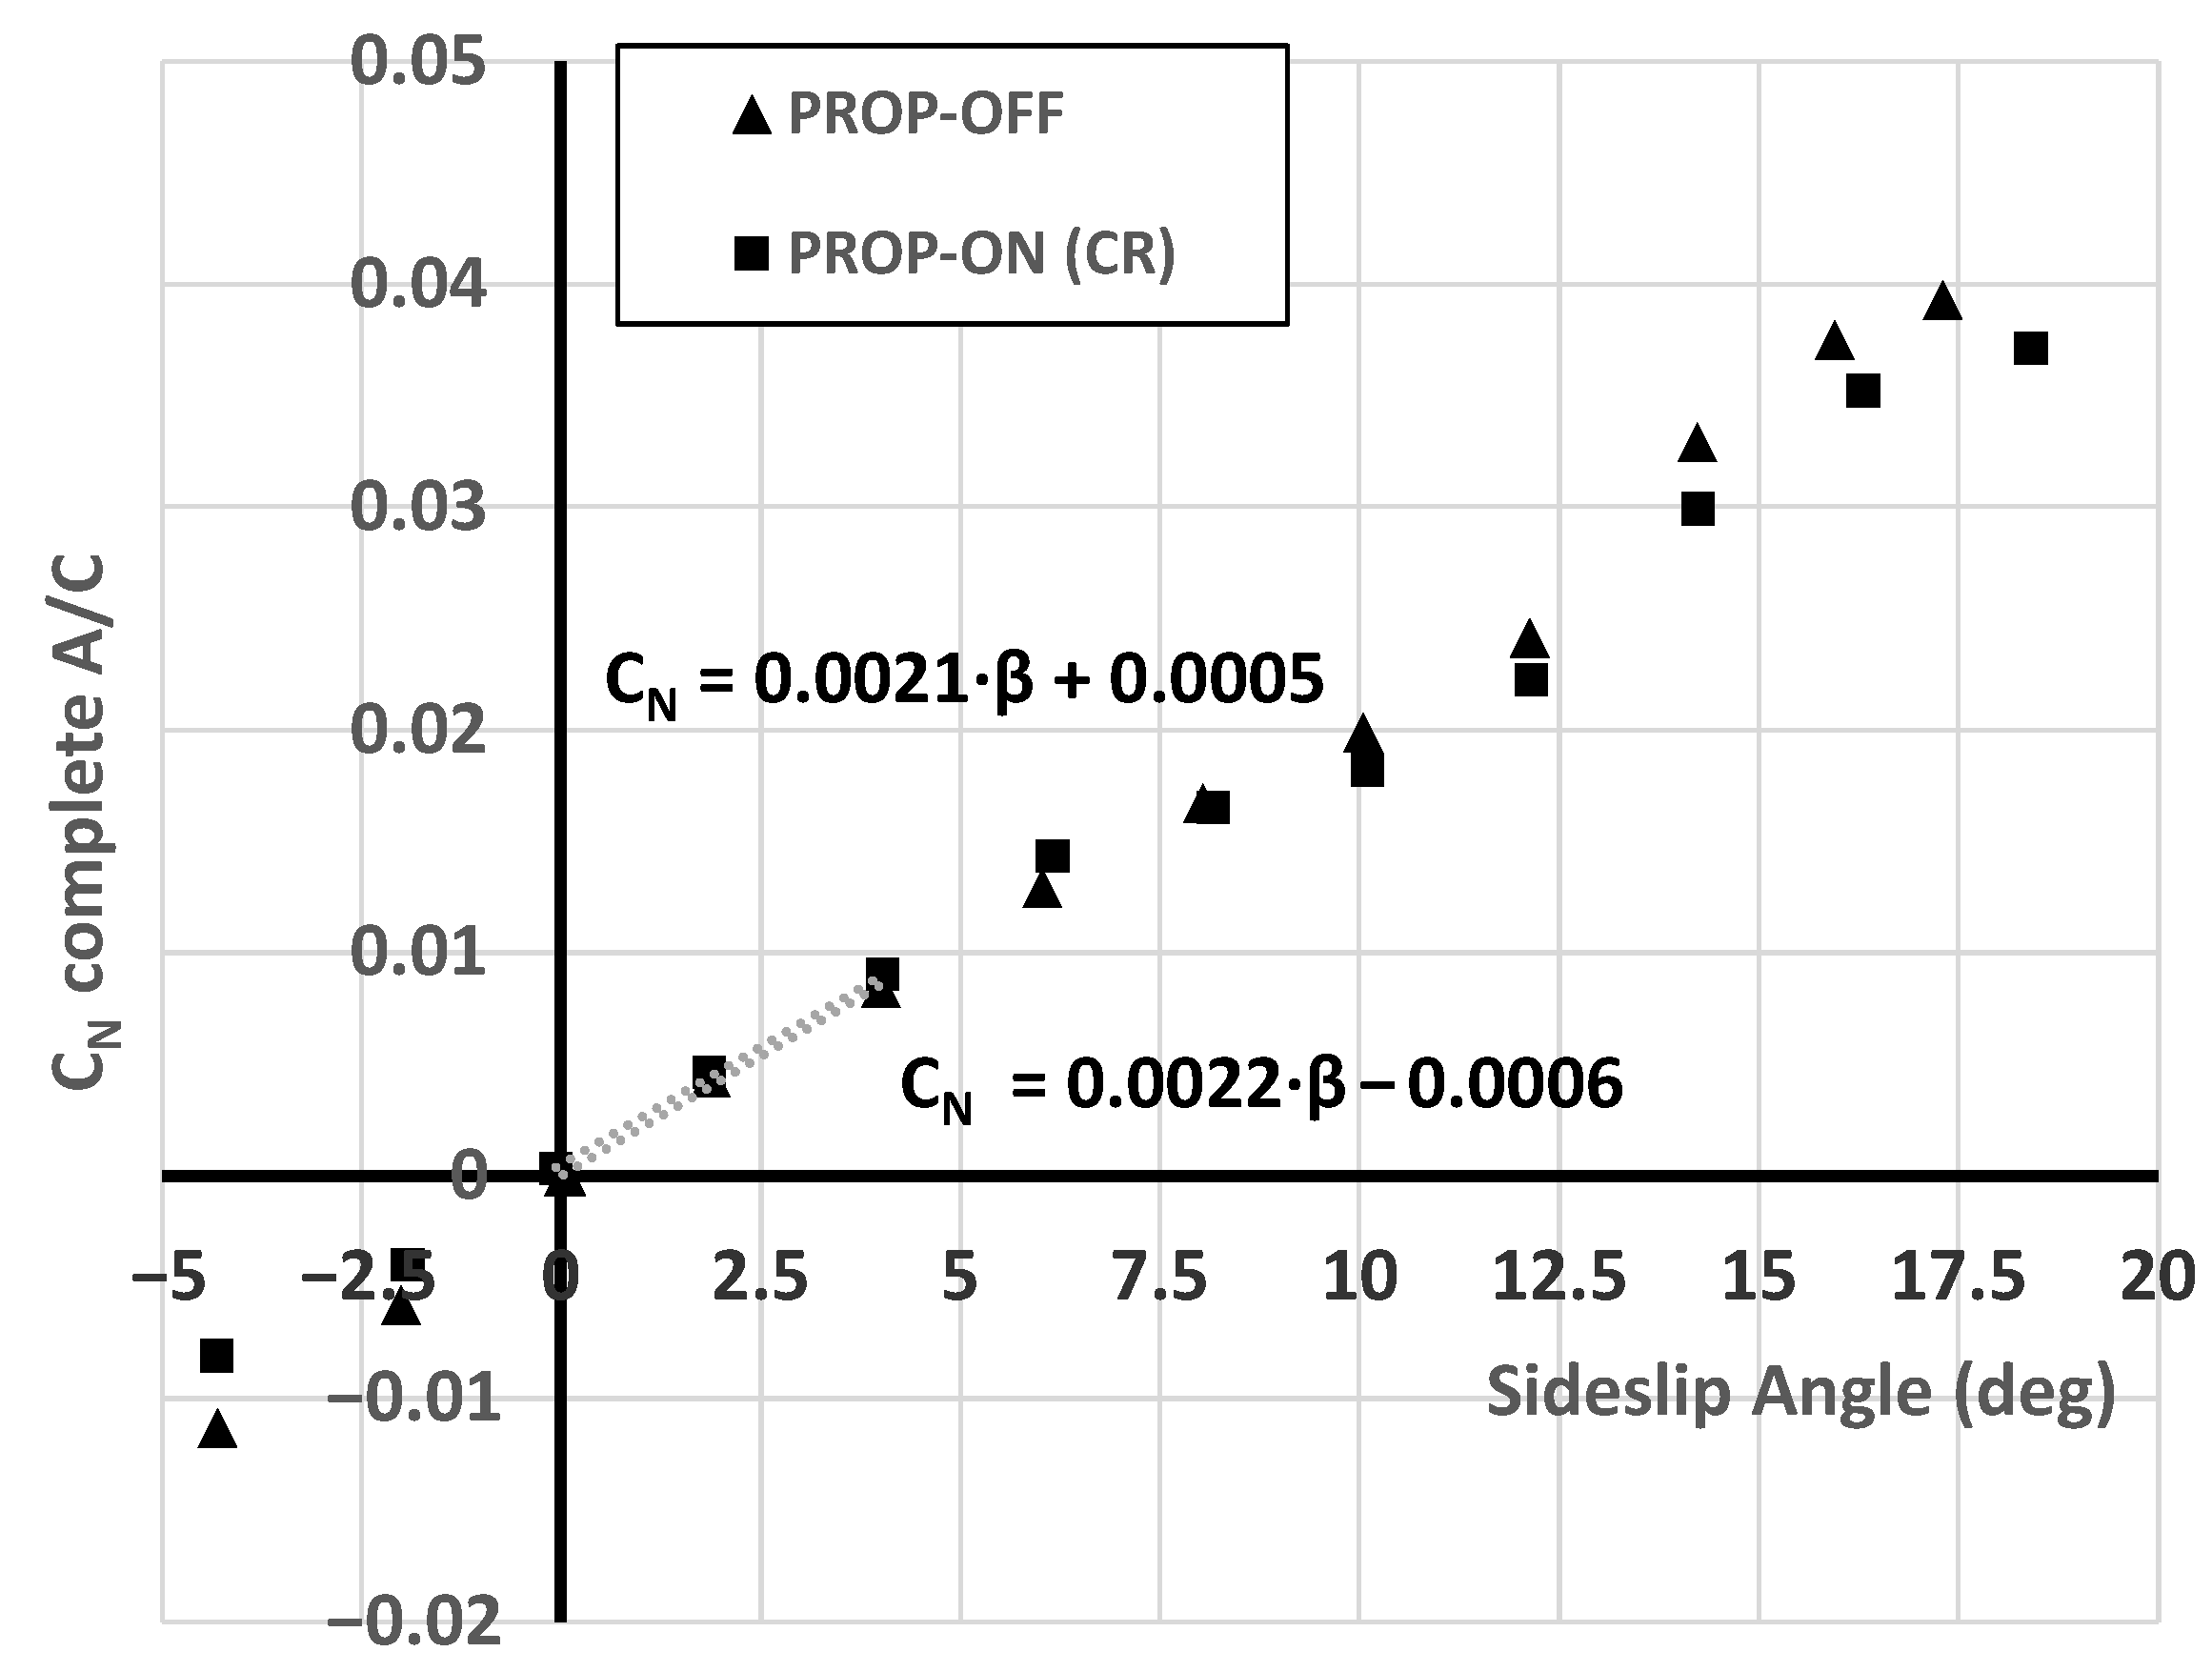
Figure 23.
Indirect propeller slipstream effects on complete aircraft yawing moment coefficient, experimental results (Re = 315,000, 8750 RPM (CR), at LE MAC), = 0 deg.
Figure 23.
Indirect propeller slipstream effects on complete aircraft yawing moment coefficient, experimental results (Re = 315,000, 8750 RPM (CR), at LE MAC), = 0 deg.
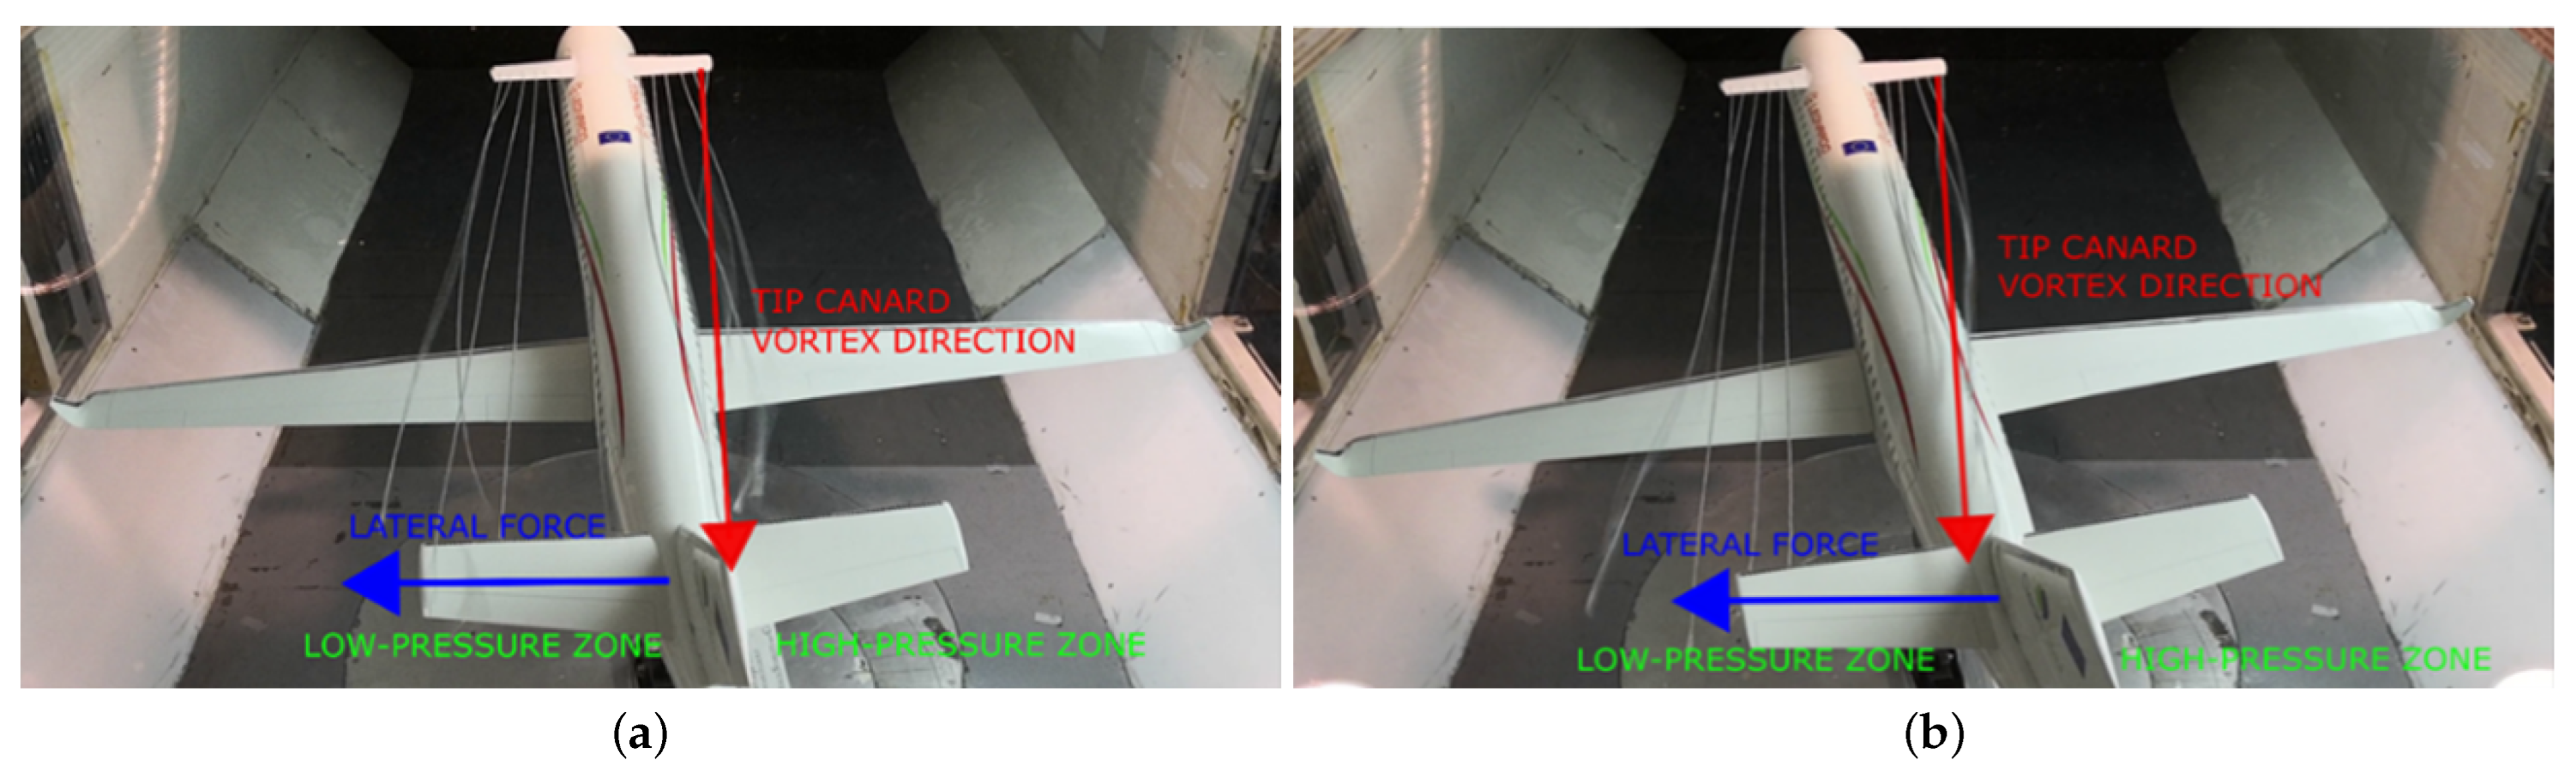
Figure 24.
Simple canard wake visualisation through wool yarns stitched to the canard trailing edge: (a) = 8 deg; (b) = 10 deg.
Figure 24.
Simple canard wake visualisation through wool yarns stitched to the canard trailing edge: (a) = 8 deg; (b) = 10 deg.
Table 1.
Strain gauge balances characteristics.
Table 1.
Strain gauge balances characteristics.
| Force/Moment | Max. Error | Full-Scale Value |
|---|
| Lift |
kgf (0.06%) | 80
kgf |
| Drag |
kgf (0.10%) | 20
kgf |
| Pitching moment |
kgf (0.10%) |
20
kgf |
| Side force |
kgf (0.10%) | 20
kgf |
| Yawing moment |
kgf (0.10%) |
20
kgf |
| Rolling moment |
kgf (0.10%) |
20
kgf |
Table 2.
Uncertainty in measurements of lift, drag, and pitching moment coefficients. WB configuration. Test conditions: , = 315,000 at .
Table 2.
Uncertainty in measurements of lift, drag, and pitching moment coefficients. WB configuration. Test conditions: , = 315,000 at .
| | | |
|---|
| Mean | SD | Mean | SD | Mean | SD |
|---|
| 0.457 | 1.21% | 0.0555 | 0.24% | | 0.58% |
| 0.81 | 0.541 | 1.14% | 0.0580 | 0.29% | | 0.62% |
| 3.88 | 0.803 | 0.83% | 0.0703 | 0.35% | | 0.53% |
| 5.91 | 0.952 | 0.59% | 0.0817 | 0.34% | | 0.50% |
Table 3.
Uncertainty in measurements of yawing moment coefficient. WBHVC configuration. Test conditions: , = 315,000 at .
Table 3.
Uncertainty in measurements of yawing moment coefficient. WBHVC configuration. Test conditions: , = 315,000 at .
| |
|---|
| Mean | SD |
|---|
| 0.0 | −0.0023 | 0.05% |
| 4.1 | 0.0067 | 0.08% |
| 6.2 | 0.0114 | 0.08% |
| 8.1 | 0.0152 | 0.08% |
| 9.9 | 0.0175 | 0.10% |
Table 4.
Uncertainty in measurements of standalone propeller forces. Test conditions: , , .
Table 4.
Uncertainty in measurements of standalone propeller forces. Test conditions: , , .
| J | Axial Force, N | Normal Force, N |
|---|
| Mean | SD | Mean | SD |
|---|
| 1.60 | 4.101 | 0.036 | 0.756 | 0.099 |
| 1.80 | 3.098 | 0.048 | 0.657 | 0.076 |
| 2.00 | 2.220 | 0.109 | 0.585 | 0.062 |
| 2.20 | 1.467 | 0.148 | 0.540 | 0.057 |
| 2.40 | 0.839 | 0.166 | 0.523 | 0.060 |
| 2.60 | 0.336 | 0.160 | 0.533 | 0.071 |
| 2.80 | | 0.133 | 0.571 | 0.091 |
| 3.00 | | 0.084 | 0.635 | 0.120 |
Table 5.
Scaled engine deck for power-on wind tunnel tests—average climb conditions at 5000 ft.
Table 5.
Scaled engine deck for power-on wind tunnel tests—average climb conditions at 5000 ft.
| J | | | | | RPM | T (N) | P (W) |
|---|
| 1.46 | 0.59 | 1.13 | 0.77 | 0.28 | 9801 | 8.8 | 403 |
| 1.95 | 0.48 | 1.15 | 0.81 | 0.12 | 7351 | 4.0 | 174 |
Table 6.
Global (direct and indirect) propulsive effects on lift and pitching moment coefficient curve slope, BHV aircraft configuration, = 315,000, CG at LE MAC.
Table 6.
Global (direct and indirect) propulsive effects on lift and pitching moment coefficient curve slope, BHV aircraft configuration, = 315,000, CG at LE MAC.
| Derivative | Power-Off | Power-On | Power-On | Power-On/Off |
|---|
| (deg | | 7350 RPM | 8750 RPM | (w.r.t. 8750 RPM) |
|---|
| | | | 21% |
| | | | 14% |
Table 7.
Direct and indirect propeller effects breakdown, BHV aircraft configuration, = 315,000, at LE MAC, 8750 RPM (IU).
Table 7.
Direct and indirect propeller effects breakdown, BHV aircraft configuration, = 315,000, at LE MAC, 8750 RPM (IU).
| | Power-Off | Power-On | Power-On | Propeller Forces |
|---|
| | (No Propellers) | (Indirect Effects) | (Overall Effects) | (at 8750 RPM) |
|---|
| AoA (deg.) | | | | | | | (N) | (N) |
| 0.04 | | 0.045 | 0.029 | | 0.049 | | 3.908 | 1.213 |
| 4.06 | 0.118 | | 0.153 | | 0.185 | | 3.994 | 1.914 |
| 8.07 | 0.265 | | 0.307 | | 0.353 | | 4.128 | 2.768 |
Table 8.
Breakdown of direct and indirect propulsive effects on lift and pitching moment coefficient curve slope, BHV aircraft configuration, experimental results, = 315,000, 8750 RPM (IU), at LE MAC.
Table 8.
Breakdown of direct and indirect propulsive effects on lift and pitching moment coefficient curve slope, BHV aircraft configuration, experimental results, = 315,000, 8750 RPM (IU), at LE MAC.
| Derivative (deg) | Power-Off | Indirect Effects | Direct + Indirect Effects |
|---|
| | (+7%) | (+21%) |
| 0.033 | 0.035 (+6%) | 0.038 (+14%) |
Table 9.
Effect of propeller rotation on overall (direct + indirect) propulsive effects on lift and pitching moment coefficient curve slope, BHV aircraft configuration, experimental results, = 315,000, RPM 8750, at LE MAC.
Table 9.
Effect of propeller rotation on overall (direct + indirect) propulsive effects on lift and pitching moment coefficient curve slope, BHV aircraft configuration, experimental results, = 315,000, RPM 8750, at LE MAC.
| Derivative (deg) | Power-Off | Power-On (IU) | Power-On (CR) |
|---|
| | (+21%) | (+19%) |
| 0.033 | 0.038 (+14%) | 0.037 (+13%) |
Table 10.
Breakdown of direct and indirect propulsive effects on lift and pitching moment coefficient curve slope, complete aircraft configuration, experimental results. = 315,000, RPM = 8750 (CR), at LE MAC.
Table 10.
Breakdown of direct and indirect propulsive effects on lift and pitching moment coefficient curve slope, complete aircraft configuration, experimental results. = 315,000, RPM = 8750 (CR), at LE MAC.
| Derivative (deg) | Power-Off | Indirect Effects | Direct + Indirect Effects |
|---|
| | (+2%) | (+20%) |
| 0.121 | 0.124 (+3%) | 0.127 (+5%) |
Table 11.
Direct and indirect propeller effects breakdown, on the complete aircraft configuration, = 315,000, at LE MAC, 8750 RPM (CR).
Table 11.
Direct and indirect propeller effects breakdown, on the complete aircraft configuration, = 315,000, at LE MAC, 8750 RPM (CR).
| | Power-Off | Power-On | Power-On | Propeller Forces |
|---|
| | (No Propellers) | (Indirect Effects) | (Overall Effects) | |
|---|
| AoA (deg.) | | | | | | | T (N) | N (N) |
| 0.152 | 0.267 | 0.144 | 0.2982 | 0.149 | 0.256 | 3.809 | 0.093 |
| 0.378 | 0.258 | 0.376 | 0.2793 | 0.391 | 0.193 | 3.548 | 0.939 |
| 2.00 | 0.602 | 0.230 | 0.604 | 0.2441 | 0.622 | 0.150 | 3.525 | 1.118 |
| 4.05 | 0.850 | 0.186 | 0.859 | 0.1975 | 0.882 | 0.099 | 3.848 | 1.225 |
Table 12.
Indirect propulsive effects on directional and lateral stability derivatives, experimental results (Re = 315,000, V = 35 m/s, 8750 RPM (CR), @LE MAC), = 0 deg.
Table 12.
Indirect propulsive effects on directional and lateral stability derivatives, experimental results (Re = 315,000, V = 35 m/s, 8750 RPM (CR), @LE MAC), = 0 deg.
| | Power-Off | Power-On CR |
|---|
| deg | 0.0022 | 0.0021 () |
| deg | | () |


