1. Introduction
Due to large-scale use of turbomachinery in different industries such as aviation, marine and terrestrial propulsion, power generation, gas pumping etc. and due to constant tightening of regulations regarding greenhouse, these systems have been constantly improved. Modern axial flow turbines are capable of withstanding high temperatures and mechanical loads achieving high performances without sacrificing reliability. In a modern gas turbine engine, it is common that the service life of the axial turbines should match those of the respective engines. As the turbines are designed for nominal regimes, thus for a set of input parameters and requirements, the performances at different regimes (different input parameters) may be less than desirable. Connecting the turbine with the compressor in a gas turbine engine assembly or with a power consumer (in the case of a power turbine) which can have different power requirements depending on the rotational speed, results in low efficiencies at partial regimes. Thus, a need to adjust the flow through the turbine, to better adapt at the respective requirements and inlet parameters, can be identified. In order to achieve this, it is necessary to introduce a regulation factor through which the flow regime and implicitly the performance of the turbine can be controlled depending on the engine regime or the requirements of the mechanical power consumer. One such control system was proposed as early as 1966 in form of variable vanes [
1]. By controlling the vane angle it is possible to modify the minimal section and the exit flow angles, thus modifying the flow through the vanes to obtain higher performances for the respective inlet parameters. A solution such as this has yet to be implemented on a modern high temperature engine due to issues regarding the reliability of a movable mechanism in an extreme temperature environment.
The method discussed in this paper targets the same control of the flow through the vanes but using an injection system instead of mobile elements. By specific fluid injection, a deviation of the main flow through the vane near the minimal section is anticipated, thus reducing the flow section.
The use of injection in turbine profiles is not a new concept, this process being used for long time for cooling purposes. Due to the extreme temperature environment (modern gas turbines work at a turbine inlet temperature around 1800 °C [
2], which is significantly higher than the melting point of the blades’ material), an efficient cooling is needed. The methods currently in use are classified as internal and external cooling. The cooling fluid that passes through cooling channel inside the profiles (a process known as internal cooling) is injected in the boundary layer on the profile exterior in order to form a fluid film that protects the blades material from the high temperature gases of the main stream (process known as external cooling or film cooling). The difference in temperature of the blade material respective to the hot gases is a few hundred degrees. The flow structure complexity of coolant ejected from the film holes is determined by the blowing ratio, distribution of the film holes, direction of the film holes and the pressure gradient in the main stream direction [
2]. The film cooling method was the subject of many studies (e.g., [
3,
4,
5,
6,
7,
8]) which analyzed the cooling efficiency, the flow around the injection orifices, and the interaction of cooling flow with the hot gases.
Another related application of fluid injection in the boundary layer is the system applied for aircraft wings in order to increase lift and decrease the aerodynamic drag. By injecting a fluid with a specific momentum, it is possible to delay or even entirely remove the separation phenomena. This method of fluid injection near the leading edge followed by suction in the boundary layer is called the co-flow jet active control method. The results [
9] showed that the wing efficiency can be increased by more than 30% using this method.
A number of studies have been conducted on the active flow control for axial turbines. These studies have been focused on a reduction of turbine losses at low Reynolds numbers [
10,
11,
12,
13,
14,
15]. At high attitudes a large drop in Reynolds number results when compared to take-off conditions which causes the flow through the low-pressure turbine to become laminar, thus separates more quickly form the suction sides of the blades. This phenomenon leads to a considerable reduction in turbine efficiency and aircraft engine performances. A number of different flow control methods have been proposed to prevent boundary layer separation, such as dielectric barrier discharges, synthetic jets and vortex generators. In the paper Optimisation in Active Flow Separation Control in Low-Pressure Turbines [
11] the authors showed that using flow injection at the right axial distance the boundary layer detachment process can be completely mitigated with minimal pressure losses. The paper also finds that the efficiency of the reattachment process is strongly dependent on the injection location and the blow rate. Use of pulsating injection in the turbine flow was studied in the paper Efficiency of Pulsating Base Bleeding to Control Trailing Edge Flow Configurations[
16], the authors showed, using numerical simulations, that a pulsed injection configuration can result in similar gains but with a more efficient use of the energy compared with steady blowing.
The use of fluid injection can also be used as a method of reducing endwall losses for high-lift aft loaded profiles. In the paper Secondary Flow Loss Reduction Through Blowing for a High-Lift Front-Loaded Low Pressure Turbine Cascade a row of injection jets are used on the suction side of the blade near the endwall. The injection jets were designed with a 30° angle respective to blade surface in order to reduce mixing losses. This flow control method was studied at high Reynolds number resulting in a maximum reduction of 42% in the area averaged total pressure loss coefficient. The same blade has been tested with midspan vortex generator jets resulting in a 21% reduction in the area averaged total pressure loss for a Reynolds number of 20,000 [
17]. In a similar study [
18], the authors showed that similar reductions are possible but using a lower mass flow rate (up to 22%) by using unsteady injection jets.
The use of fluid injection to increase turbine performances at off design regimes is a less studied domain with few articles describing this technology. Rohr and Yang [
19] described in their paper a method of turbine efficiency enhancement at partial load through fluid injection into boundary layer on the pressure side of the vanes near the trailing edge. The numerical study was conducted with STAR-CCM+ software on a Pak-B LPT blade, two configurations of the injection jet being tested. The first case numerically simulated was with the injection jet normally to blade with the second configuration using a 45° tilt injection jet relative to blade pressure side. Tilting the injection jet yields considerable advantages in loss reduction.The previous best case of 14.3% total pressure loss for the right-angled jet can be almost reduced to zero for aninjection jet mass flow rate of 3.5%.
In this paper the study of a new injection system, designed as a method of enhancing the turbine performances at partial regimes, is presented. This study represents a continuation on the work started in paper [
20], where the influence of a number of parameters was determined on a simplified 2D model and aims at determining the influence of geometrical parameters as well as the influence of the injection system at different regimes across the turbine working line. The 3D numerical model construction and the definition of the injection system are presented, and analyses are conducted to determine the influence of the number and dimension of injection orifices on the overall performances. The injection system is then applied for other partial regimes of lower respective higher power settings.
2. Materials and Methods
This chapter presents the research methodology used for this study, construction of the injection model, numerical grid parameters and influence as well as the boundary conditions and numerical model.
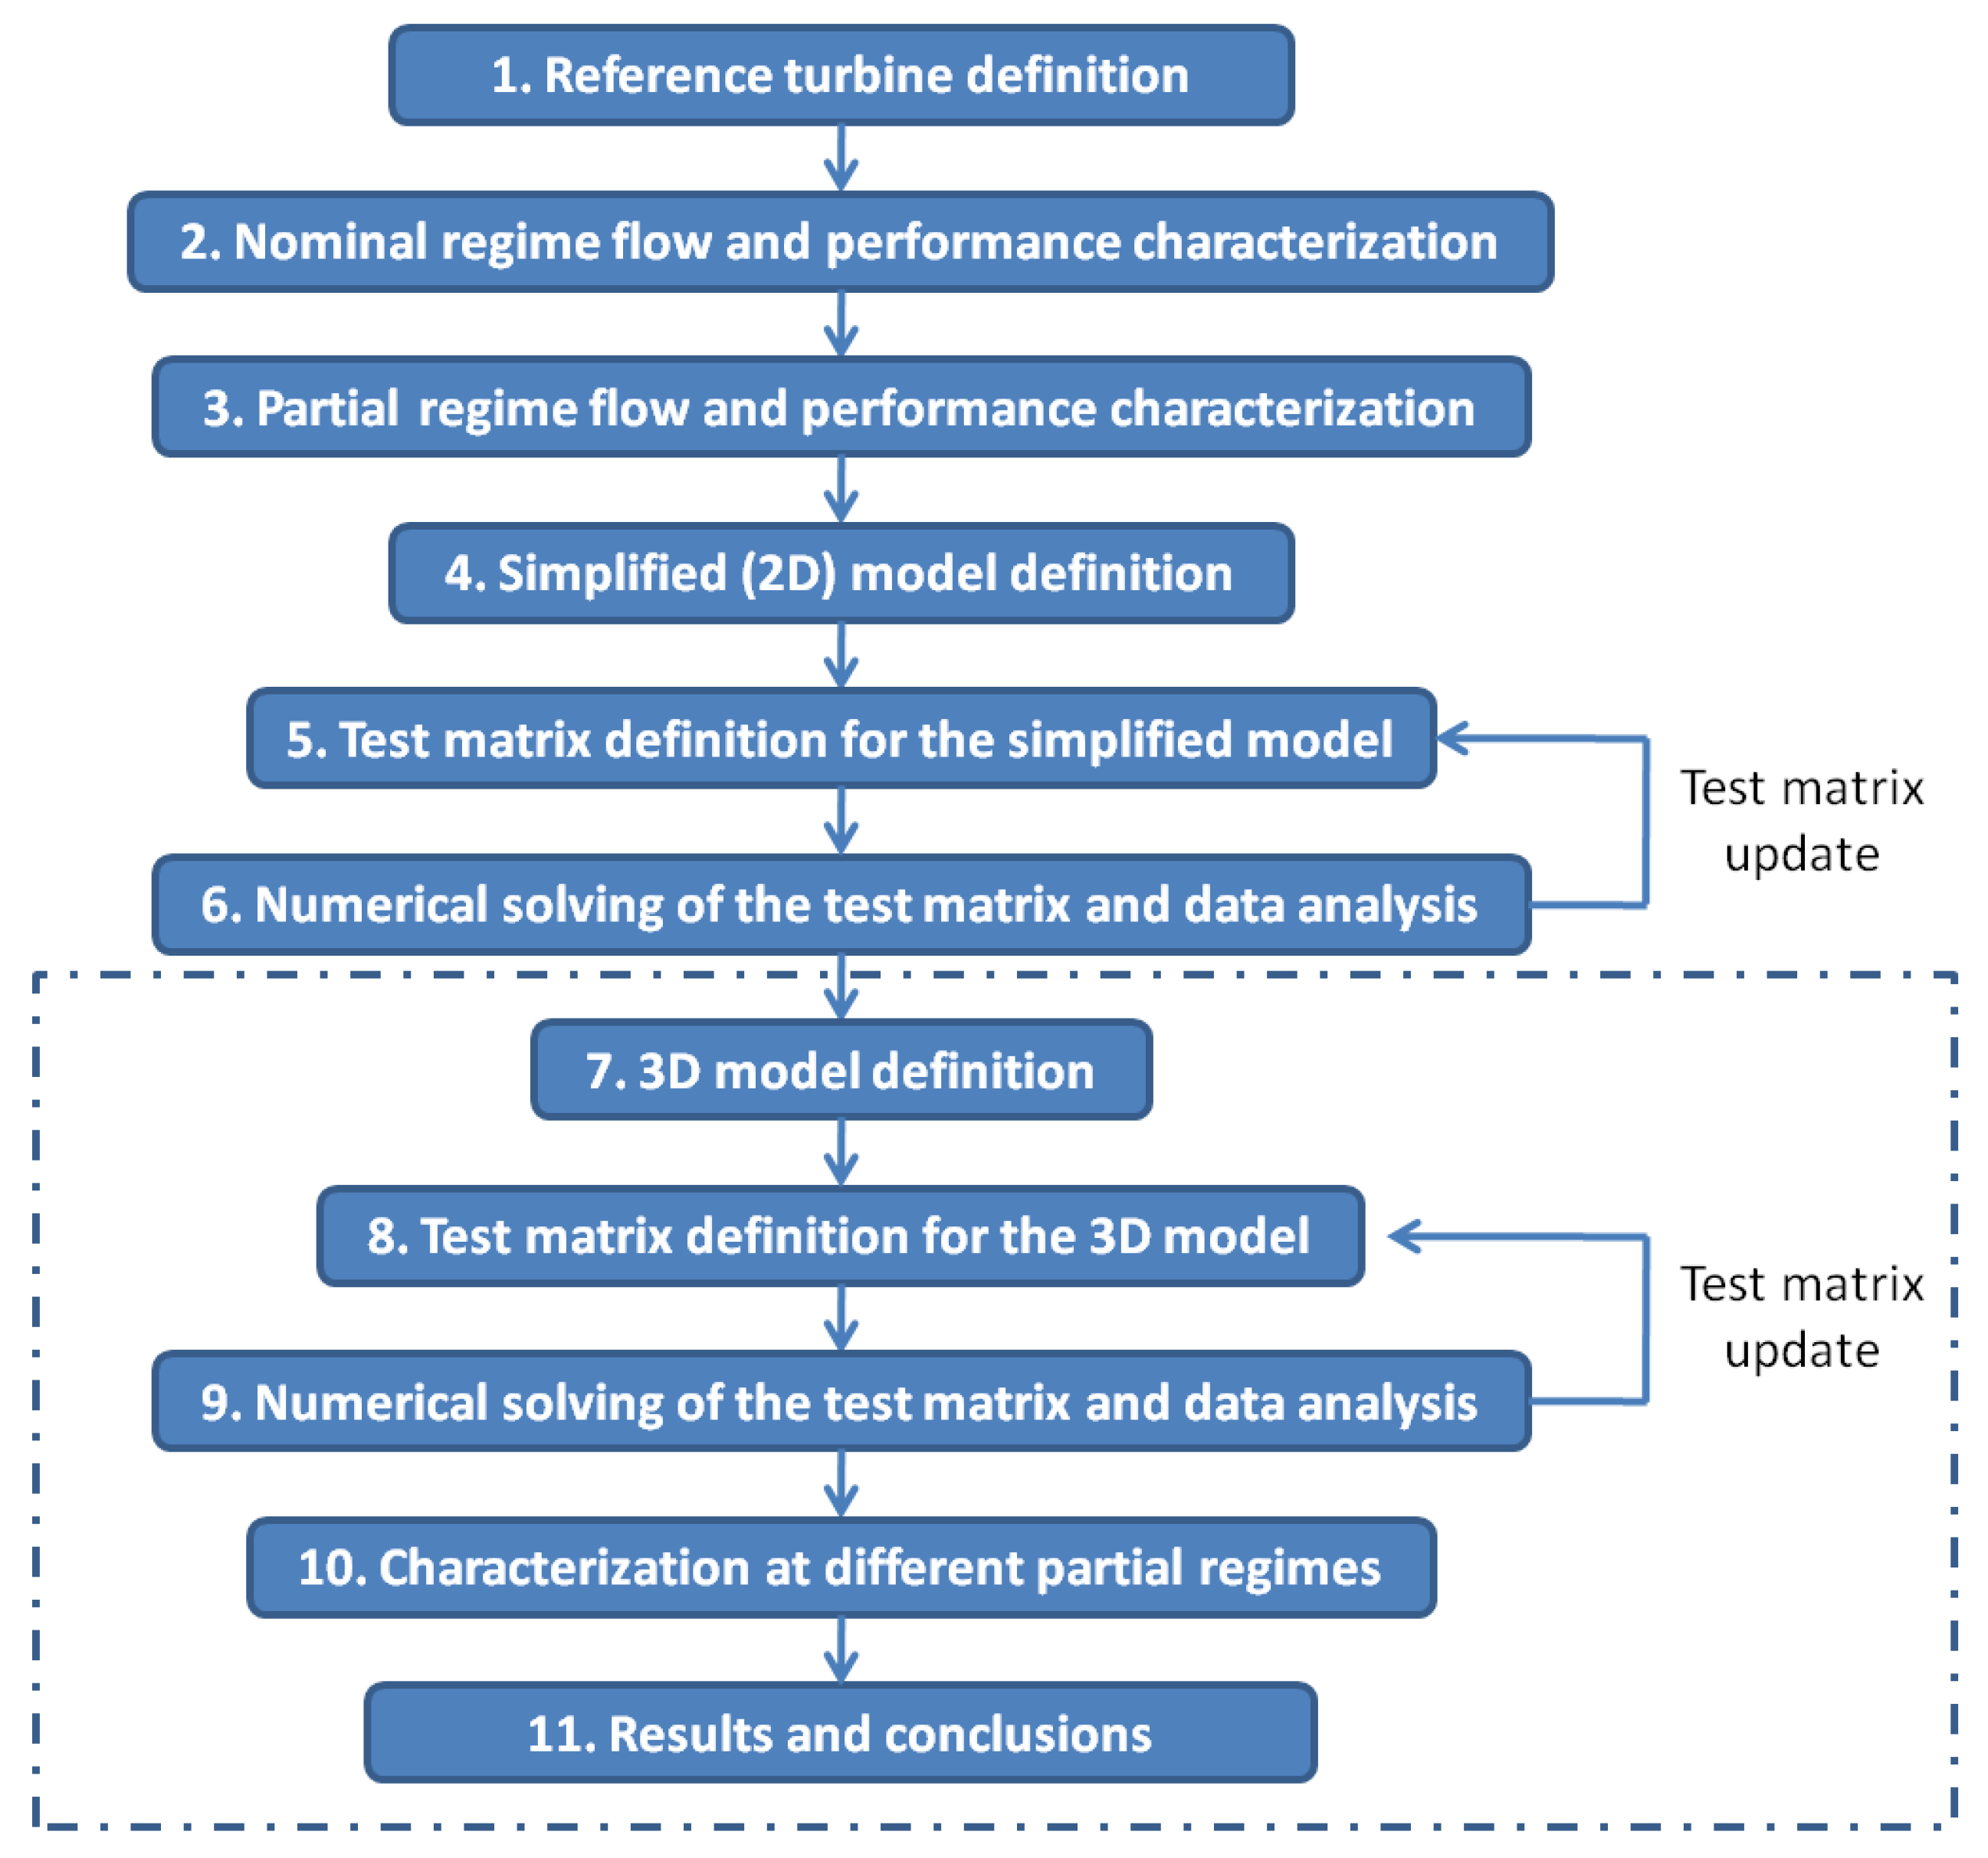
In order to study the influence of various geometrical and gas dynamic parameters on the performances of the injection system and the overall performances of the turbine a study methodology has been created. For this study an axial turbine for which the geometry and performances are known was defined and the flow field was determined by numerical simulation for both nominal and a partial regime. A simplified 2D model was created and the influence of a number of parameters (i.e., angle of injection, axial position on the suction side of the blade, mass flow and orifice diameter) was determined. This paper focuses on the analysis on a 3D model and the influence of related parameters such as orifice dimensions, number of orifices and axial distances as well as performances at different partial regimes. The study methodology for the entire work on the injection method is presented in
Figure 1, the work presented in this paper being described by the steps 7–11.
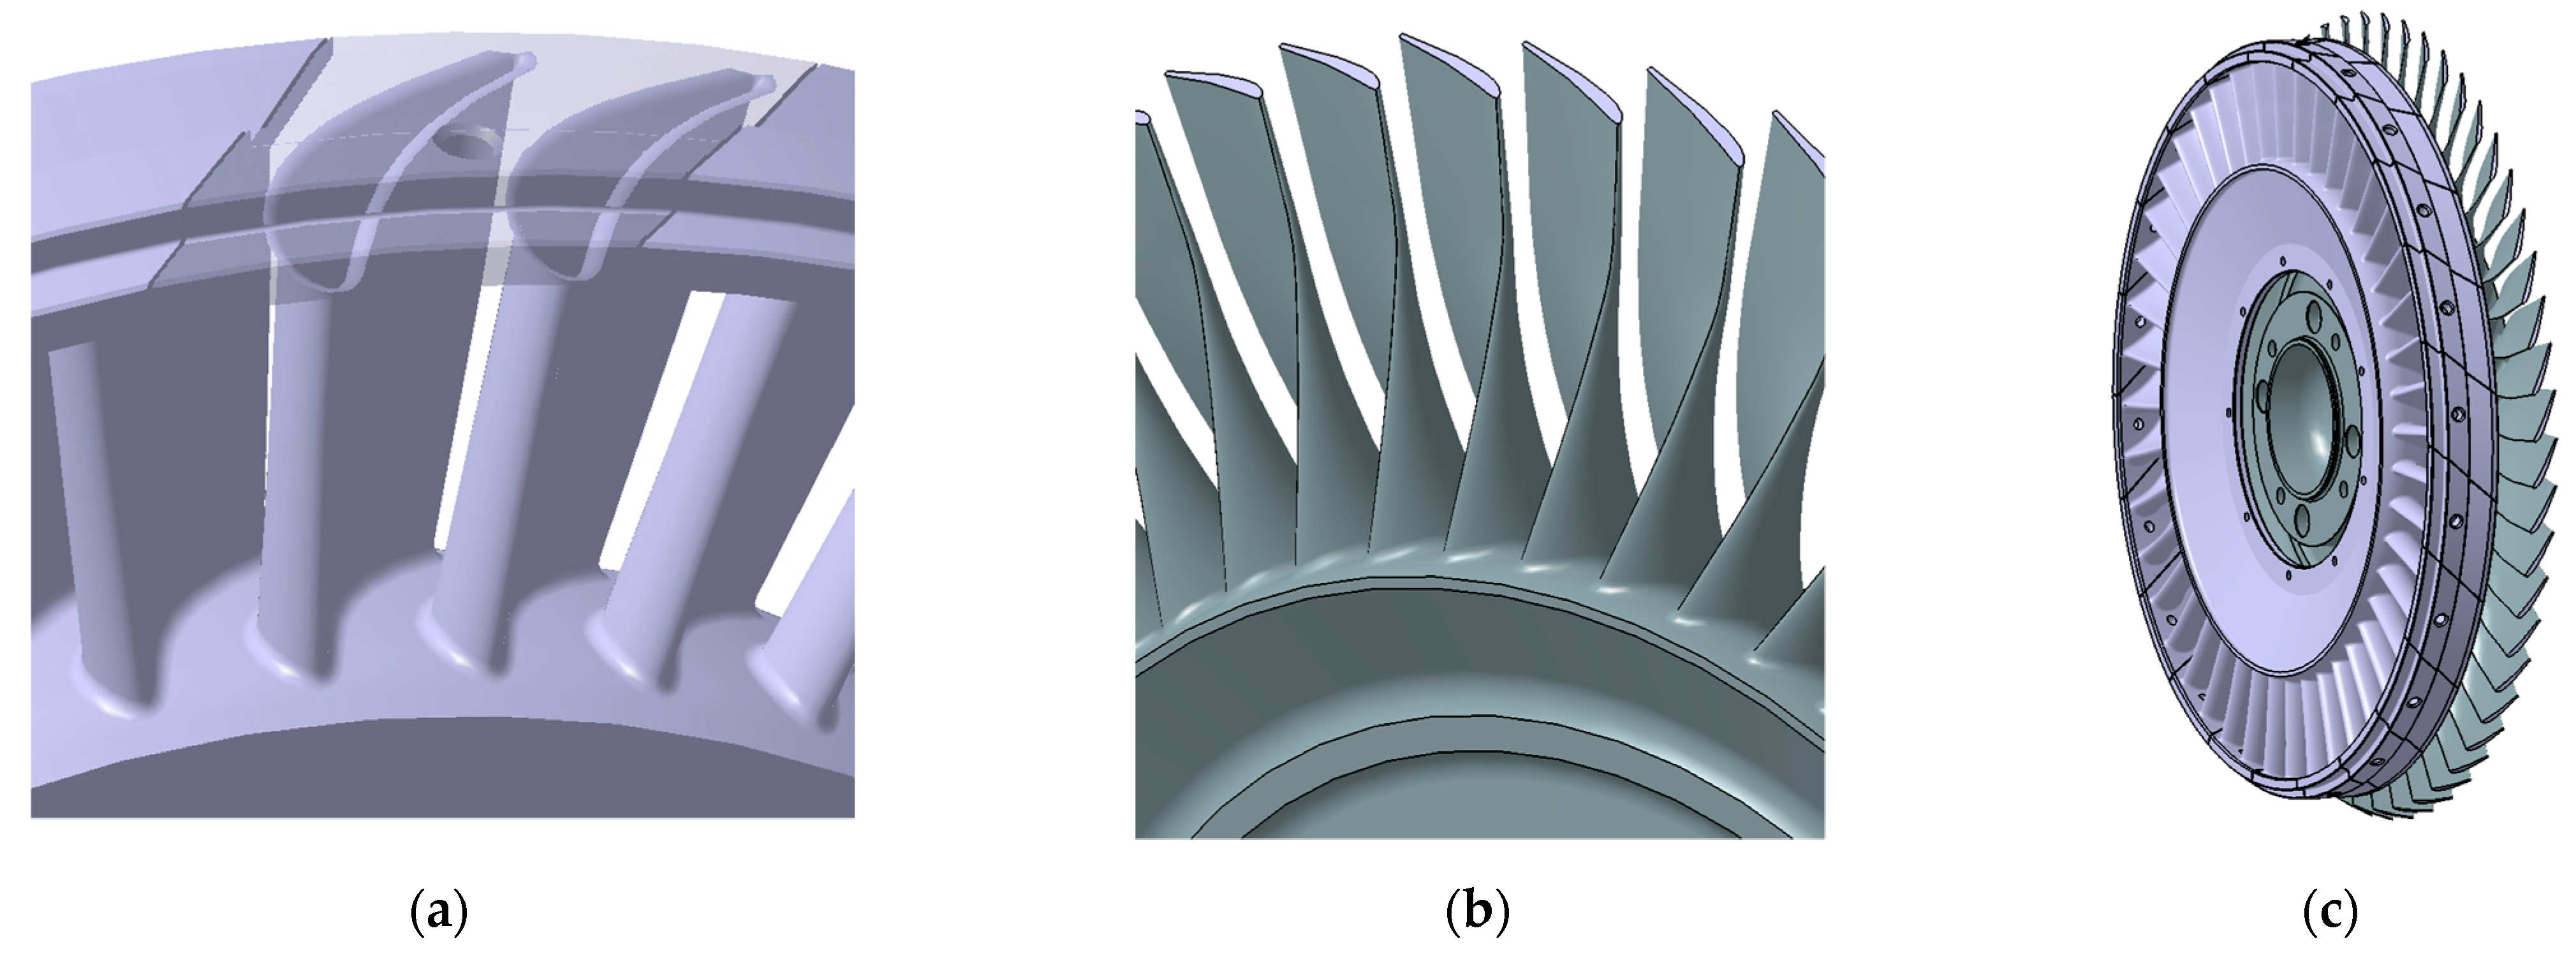
The reference turbine used in this study is a single stage free power turbine with a nominal mass flow of 8 kg/s and a rated power of approximately 1350 KW. The profile of the vane and the rotor are presented in
Figure 2 and the turbine parameters in
Table 1.
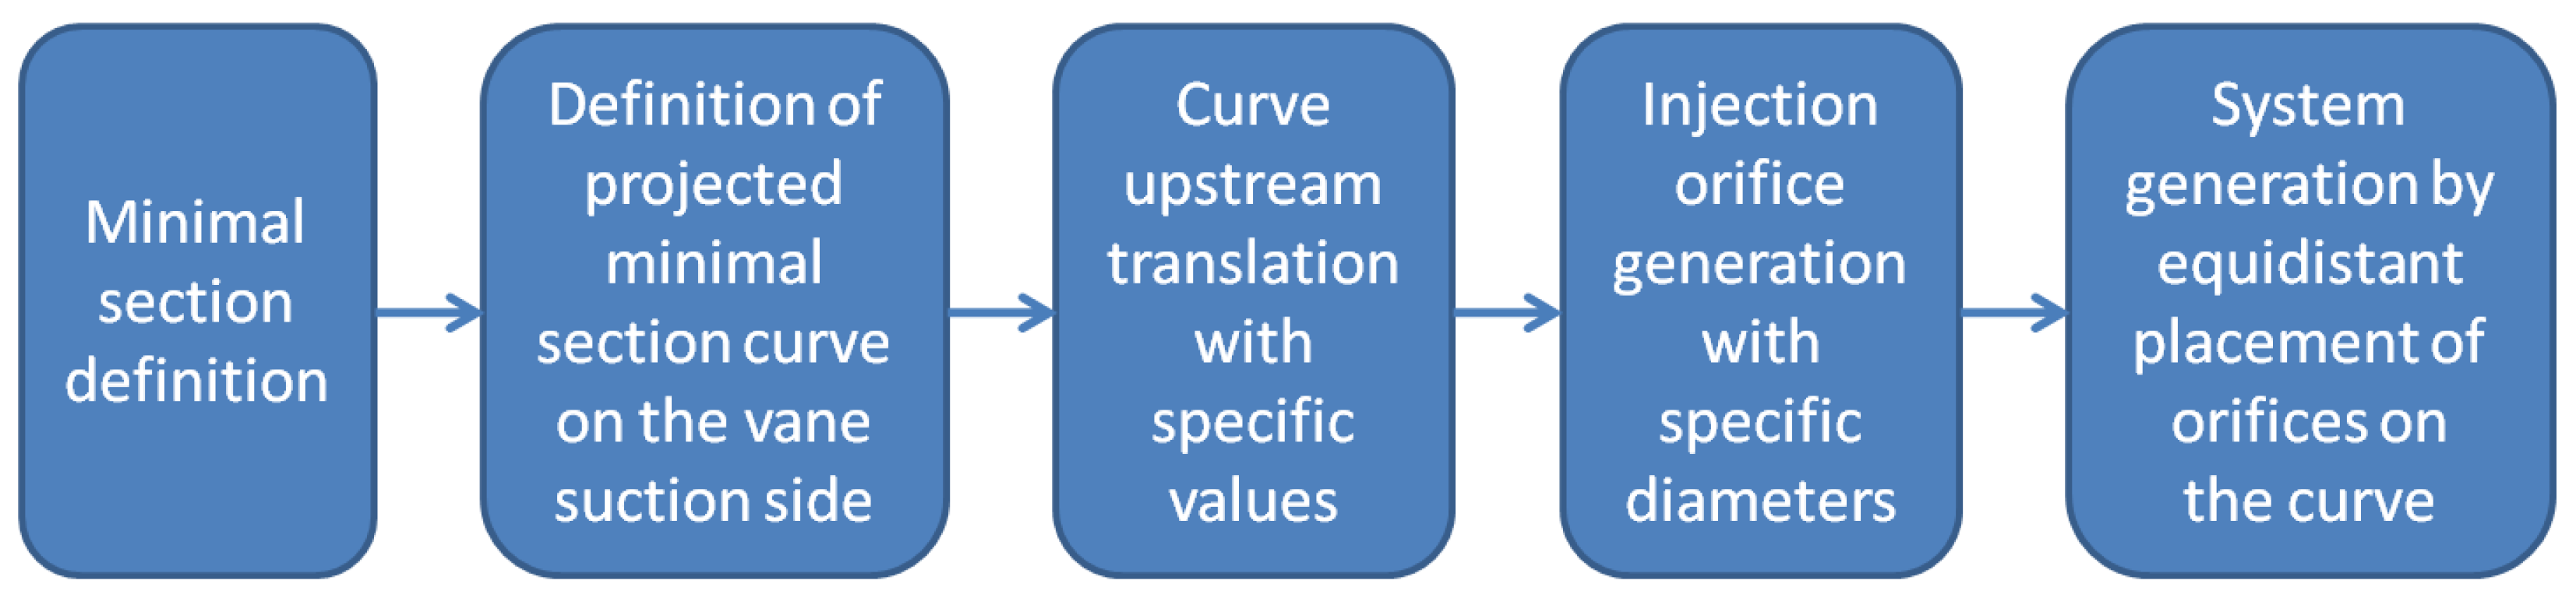
In order to construct the turbine 3D model which incorporates the injection system it is necessary to determine the dimension and position of the critical section. For the reference turbine the critical section was determined by geometrical measurements at 7 different radiuses along the vane height and by joining these 7 points the minimal section projection curve on the vanes suction sidewas generated. The curve was then translated upstream with a specific value (depending on the studied case). For the injection orifices, a circular injection surface with a specific diameter was generated perpendicular to the suction side. For this study the injection angle was 90° as it was found that the best results were obtained in the case of perpendicular injection [
20]. The orifices were displaced equidistant on the translated curve, the number of orifices being different from case to case. The logical steps for injection system generation are presented in
Figure 3.
Numerical simulations were conducted to determine the influence of the injection system on the turbine flow and performances using ANSYS CFX software. The flow through the turbine was considered uniform, thus a single channel was used for vane and rotor respectively, using periodic conditions. The numerical grid, generated using ANSYS Mesh, is unstructured. A grid dependency analysis was conducted using 4 configurations with the number of elements increasing with a factor of approximately 2.5 between the first and the last configuration. The results of the analysis are presented in
Table 2. The influence of the numerical grid is negligible as the power generated, the main parameter for this study, and the isentropic efficiencies for all the configurations are similar.
The second configuration was chosen in order to lower the computational demands and because, for this configuration, the values of the y
+ parameter are in the recommended interval [
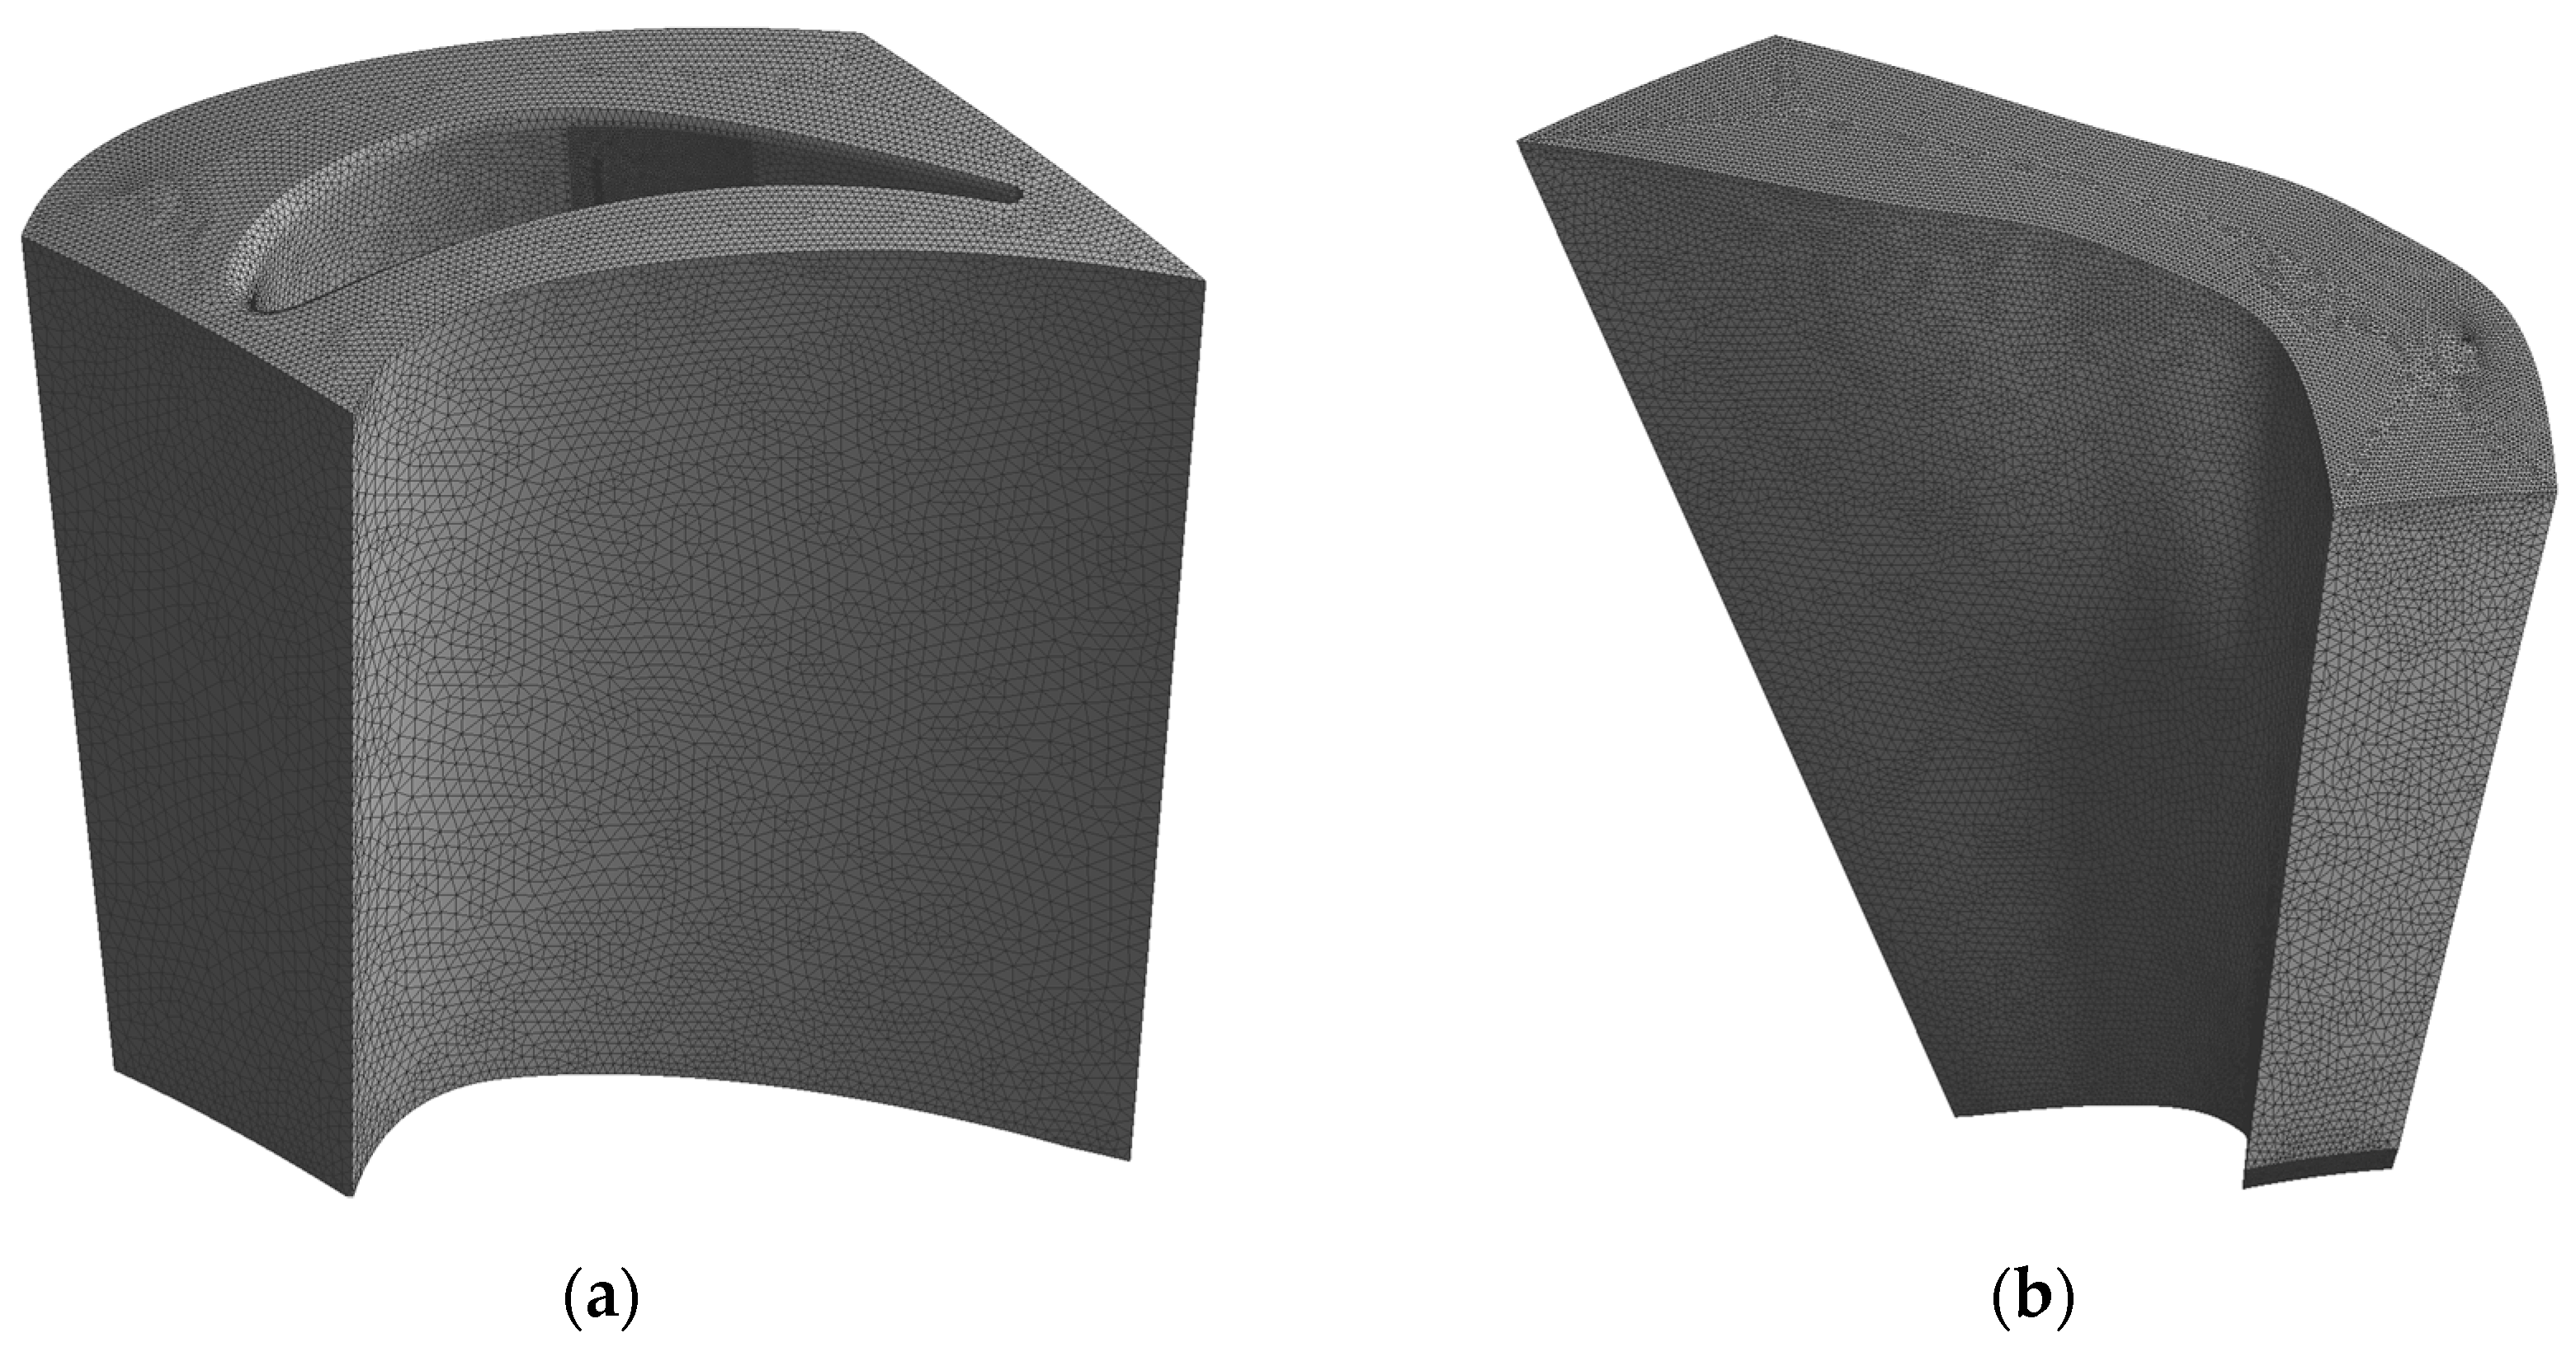
21]. The numerical volumes and grid for both the vane and the rotor are presented in
Figure 4. The general mesh size is 1 mm with 0.5 mm near the walls, 0.2 mm in the vicinity of the injection orifices and 0.05 mm for injection orifices. The maximum values of the y
+ parameter are below 150, with an average value of 80.
The numerical case is typical for axial turbine simulations; with the mass flow being set at the rotor exit, using outlet boundary conditions, and the pressure and temperature set at the vane inlet, using inlet boundary conditions. For the turbine walls, adiabatic no slip conditions were assumed.At the vane-rotor interface stage conditions were selected, as well as periodic condition for rotational periodicity for both vane and rotor blade. Furthermore, for the injection sections, inlet boundary conditions were selected, fixing the temperature and the injection mass flow. The turbulence model used for these simulations is the k–ε. The model is used many industrial processes to predict the flow in turbulent conditions due to its robustness, lower computational cost and reasonable accuracy. The superior performances of the k–ε model in turbulent flows are of particular interest for the presented study due to the turbulent nature of fluid interactions near the injection sections [
21,
22,
23,
24].
For the convergence criteria 3 parameters were monitored: residuals, mass flow imbalance and the rotor blade torque. The residual target was fixed at1 × 10−6 reaching at least 1 × 10⁻⁴ for each case (with mass flow residuals achieving smaller values). In terms of mass flow imbalance, the values were smaller than 0.1% for both stator and rotor volumes at each of the simulated cases. The blade torque represents the final parameter that was monitored, the torque curve flattened with the criteria being a variation smaller than 0.2% at 300 iterations.
For the boundary conditions, these were set identically for all the studied cases.Verification was completed at the nominal point, the parameters at this point being similar with those for which the turbine was designed.
The influence of the injection system on the turbine performances was determined at a partial regime of approximately 89% of the engine speed. The input parameters for this regime were determined using the turbine map and working line; the parameters for both nominal and partial regime are presented in
Table 3.
3. Results and Discussion
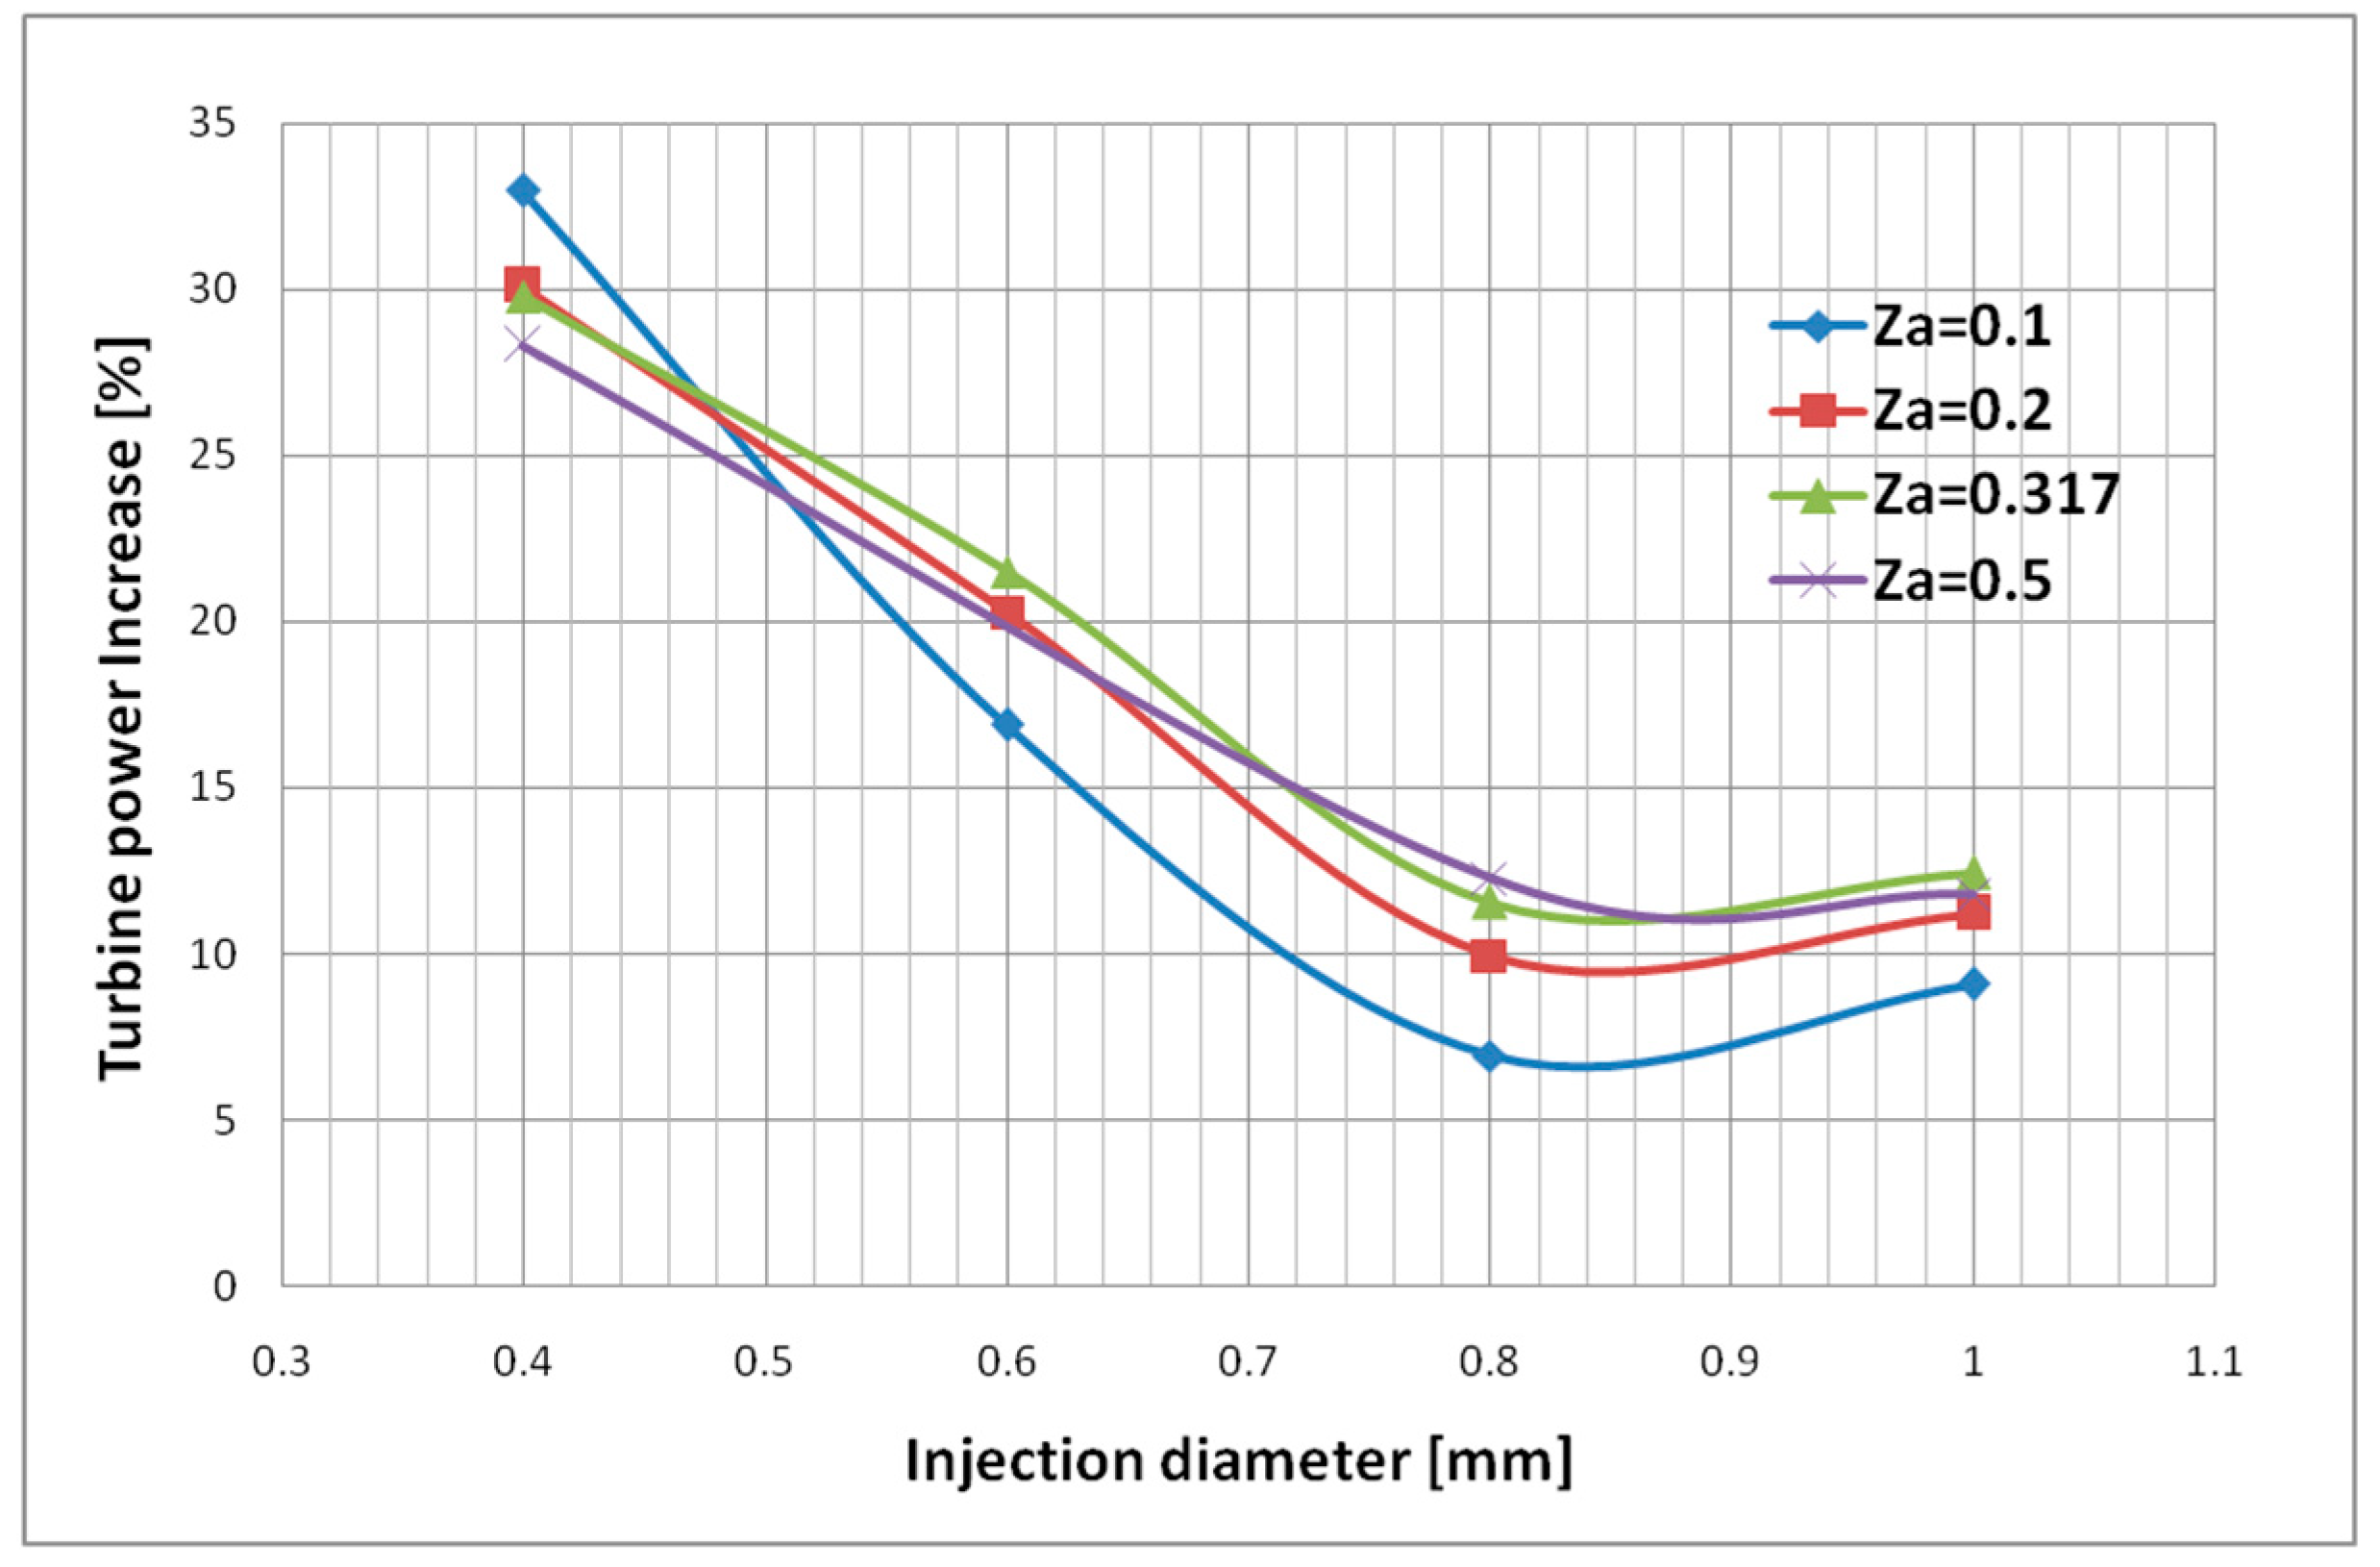
This study will focus on the influence of the injection section diameter and number of orifices on the turbine performances. For the orifice diameter four values were studied (0.4, 0.6, 0.8 and 1 mm) and different axial distances. As it was determined in previous studies that the lower values of the diameter lead to better results, lower than 1 mm dimensions were considered. The diameter was limited to 0.4 mm as lower values will not be feasible from a construction point of view. In case of the number of injection sections these values were determined respectively to orifice dimensions raging from 19 to 100. The injection mass flow was also limited to 2.5% of the working fluid as the fluid is considered to be drawn from the engine compressor.Using outlet boundary condition and fixing the mass flow at the rotor outlet leads to a decrease of the inlet mass flow with the respective injected mass flow.
3.1. Orifice Diameter Influence
In order to compare the influence of the injection diameter on the axial turbine performance, it is essential to maintain the inlet conditions constant for each injection section. Thus, for each diameter studied, a number of orifices were determined in order to achieve approximately the same speed and Mach number at the injection section. The Mach number values in the injection orifices for each diameter and axial distance are presented in
Table 4.
The axial distance ( represents a dimensionless parameter that describes the axial position of the injection orifice on the suction side of the blade. It is defined as the axial distance between the injection orifice center and the projection of the minimal section of the vane on the suction side divided by the length of the minimal section.
From the result analysis it was determined that the power generated by the turbine has increased by as much as 33% after the injection process, with the best result obtained for a smaller diameter and a higher number of orifices. The injection system influence on the axial turbine performances decrees for higher dimension of the orifices, as can be determined from
Figure 5.
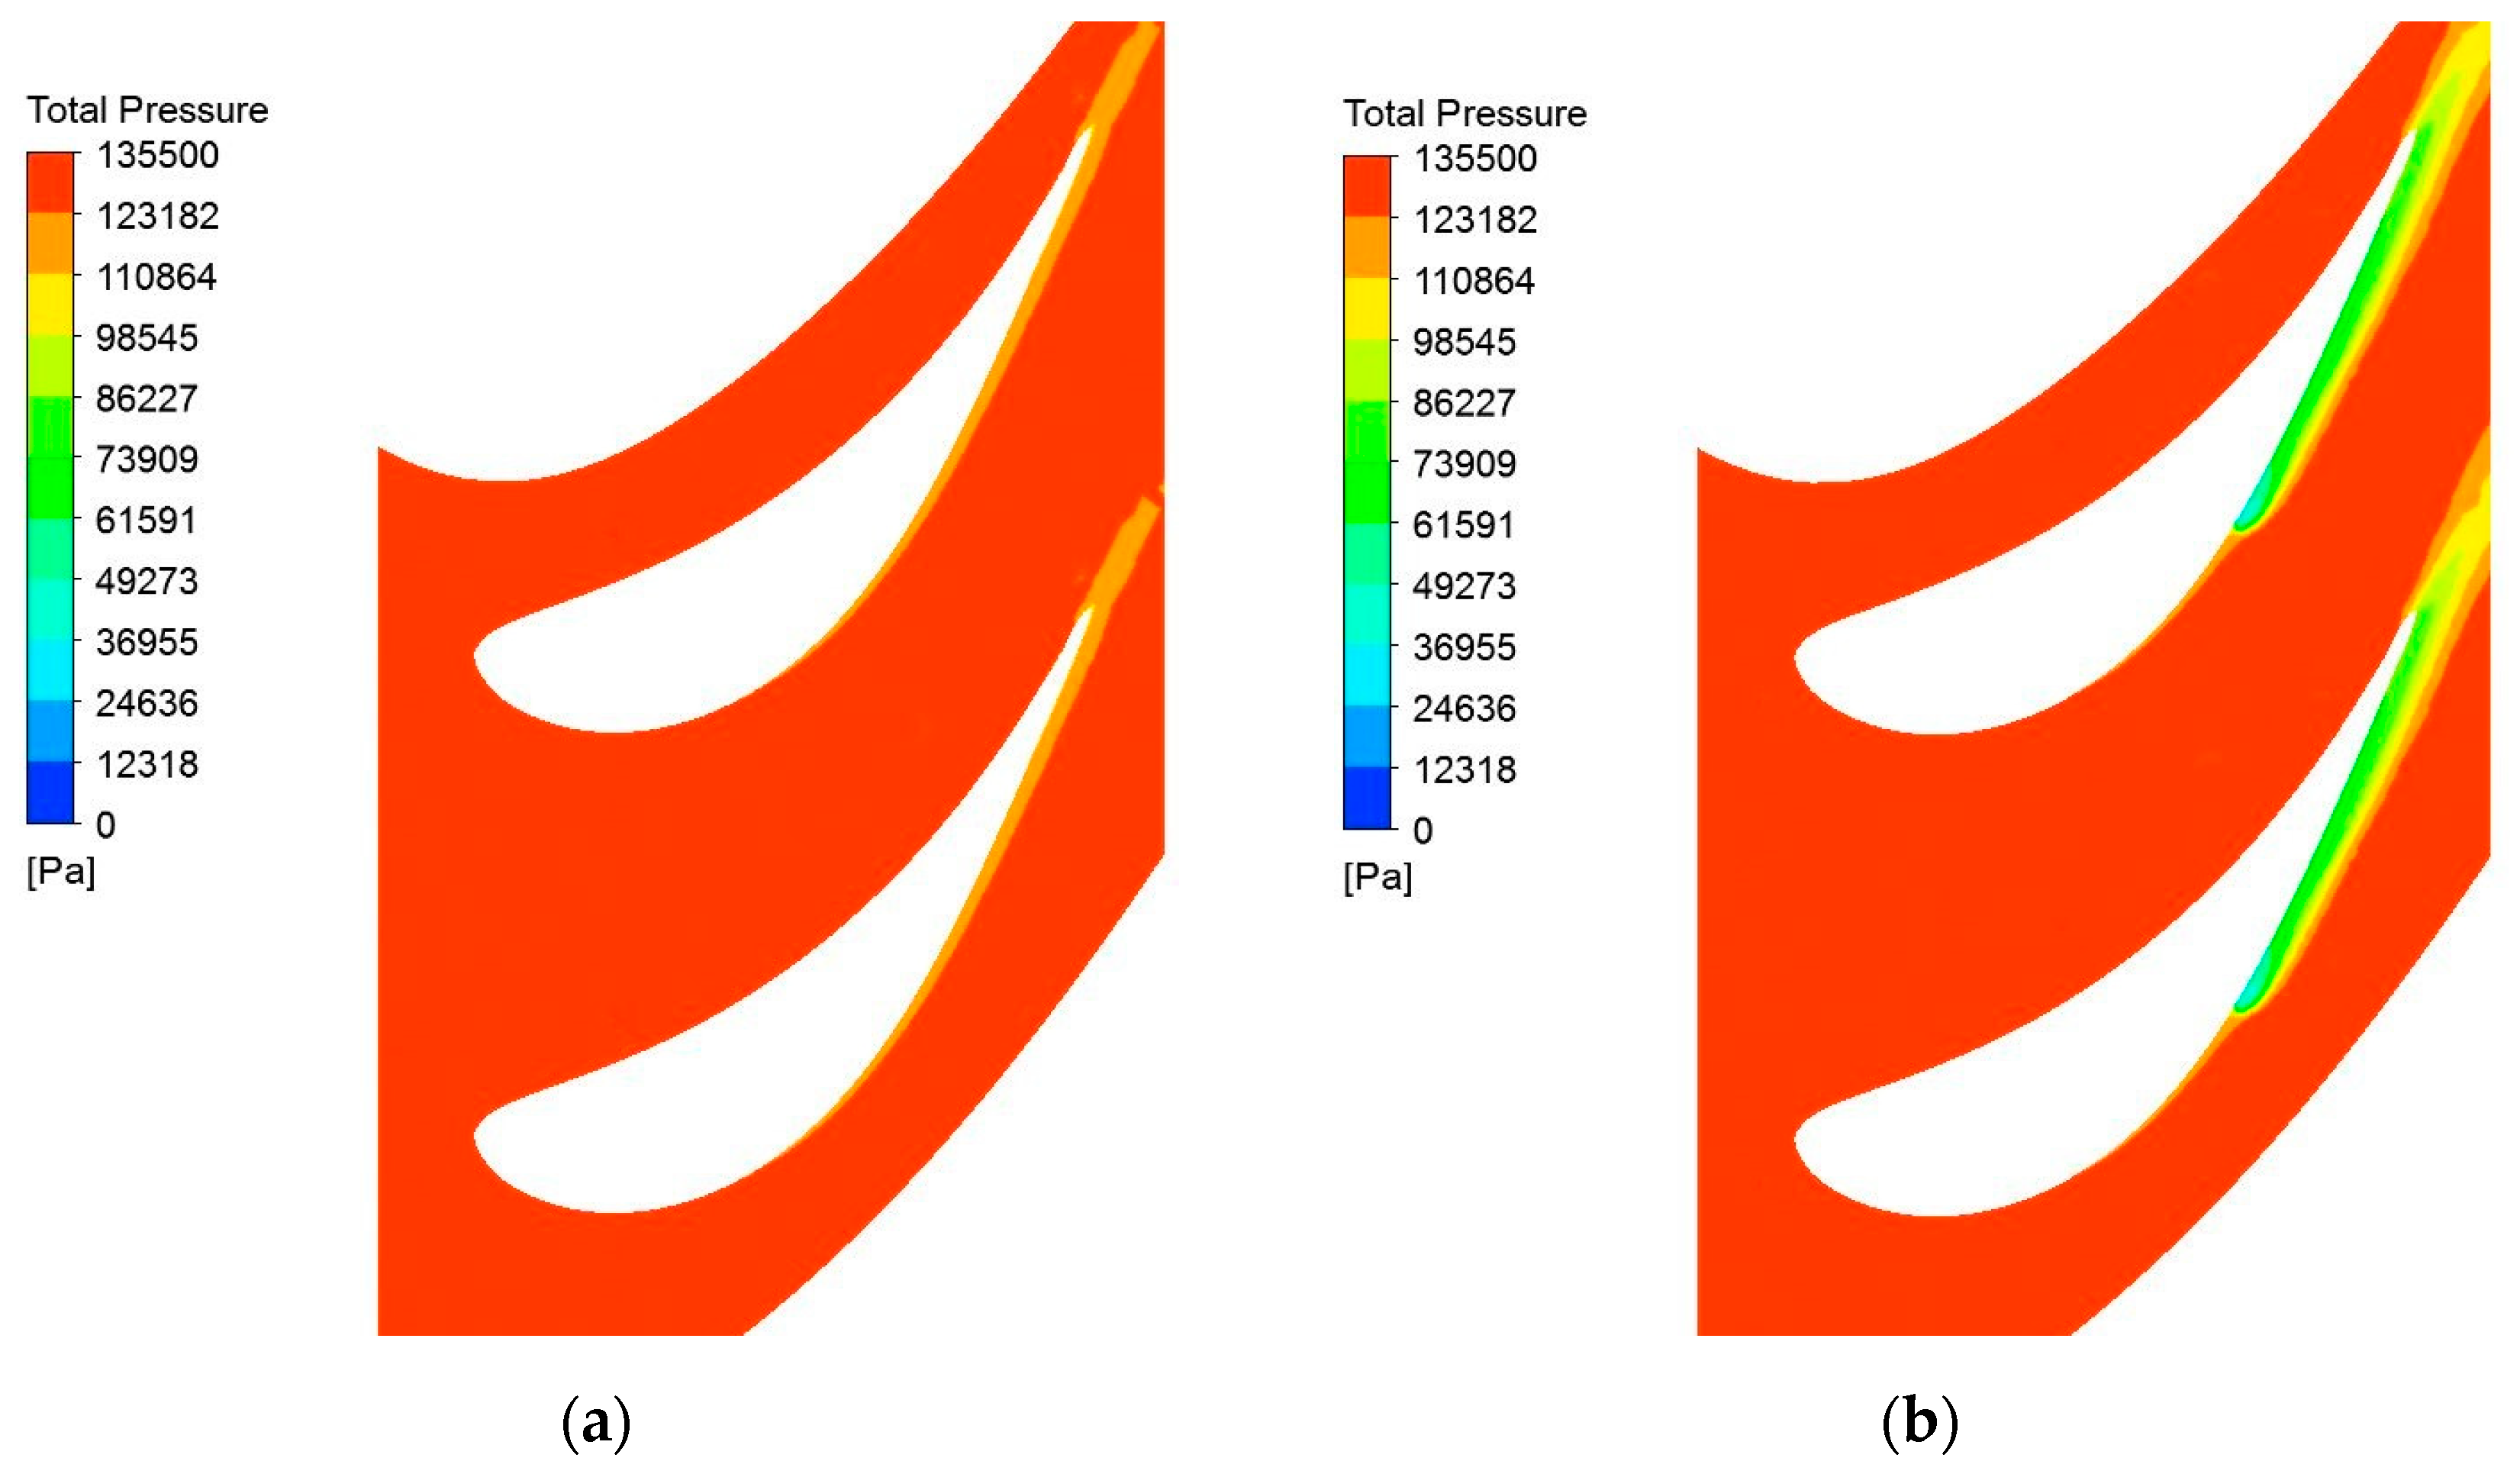
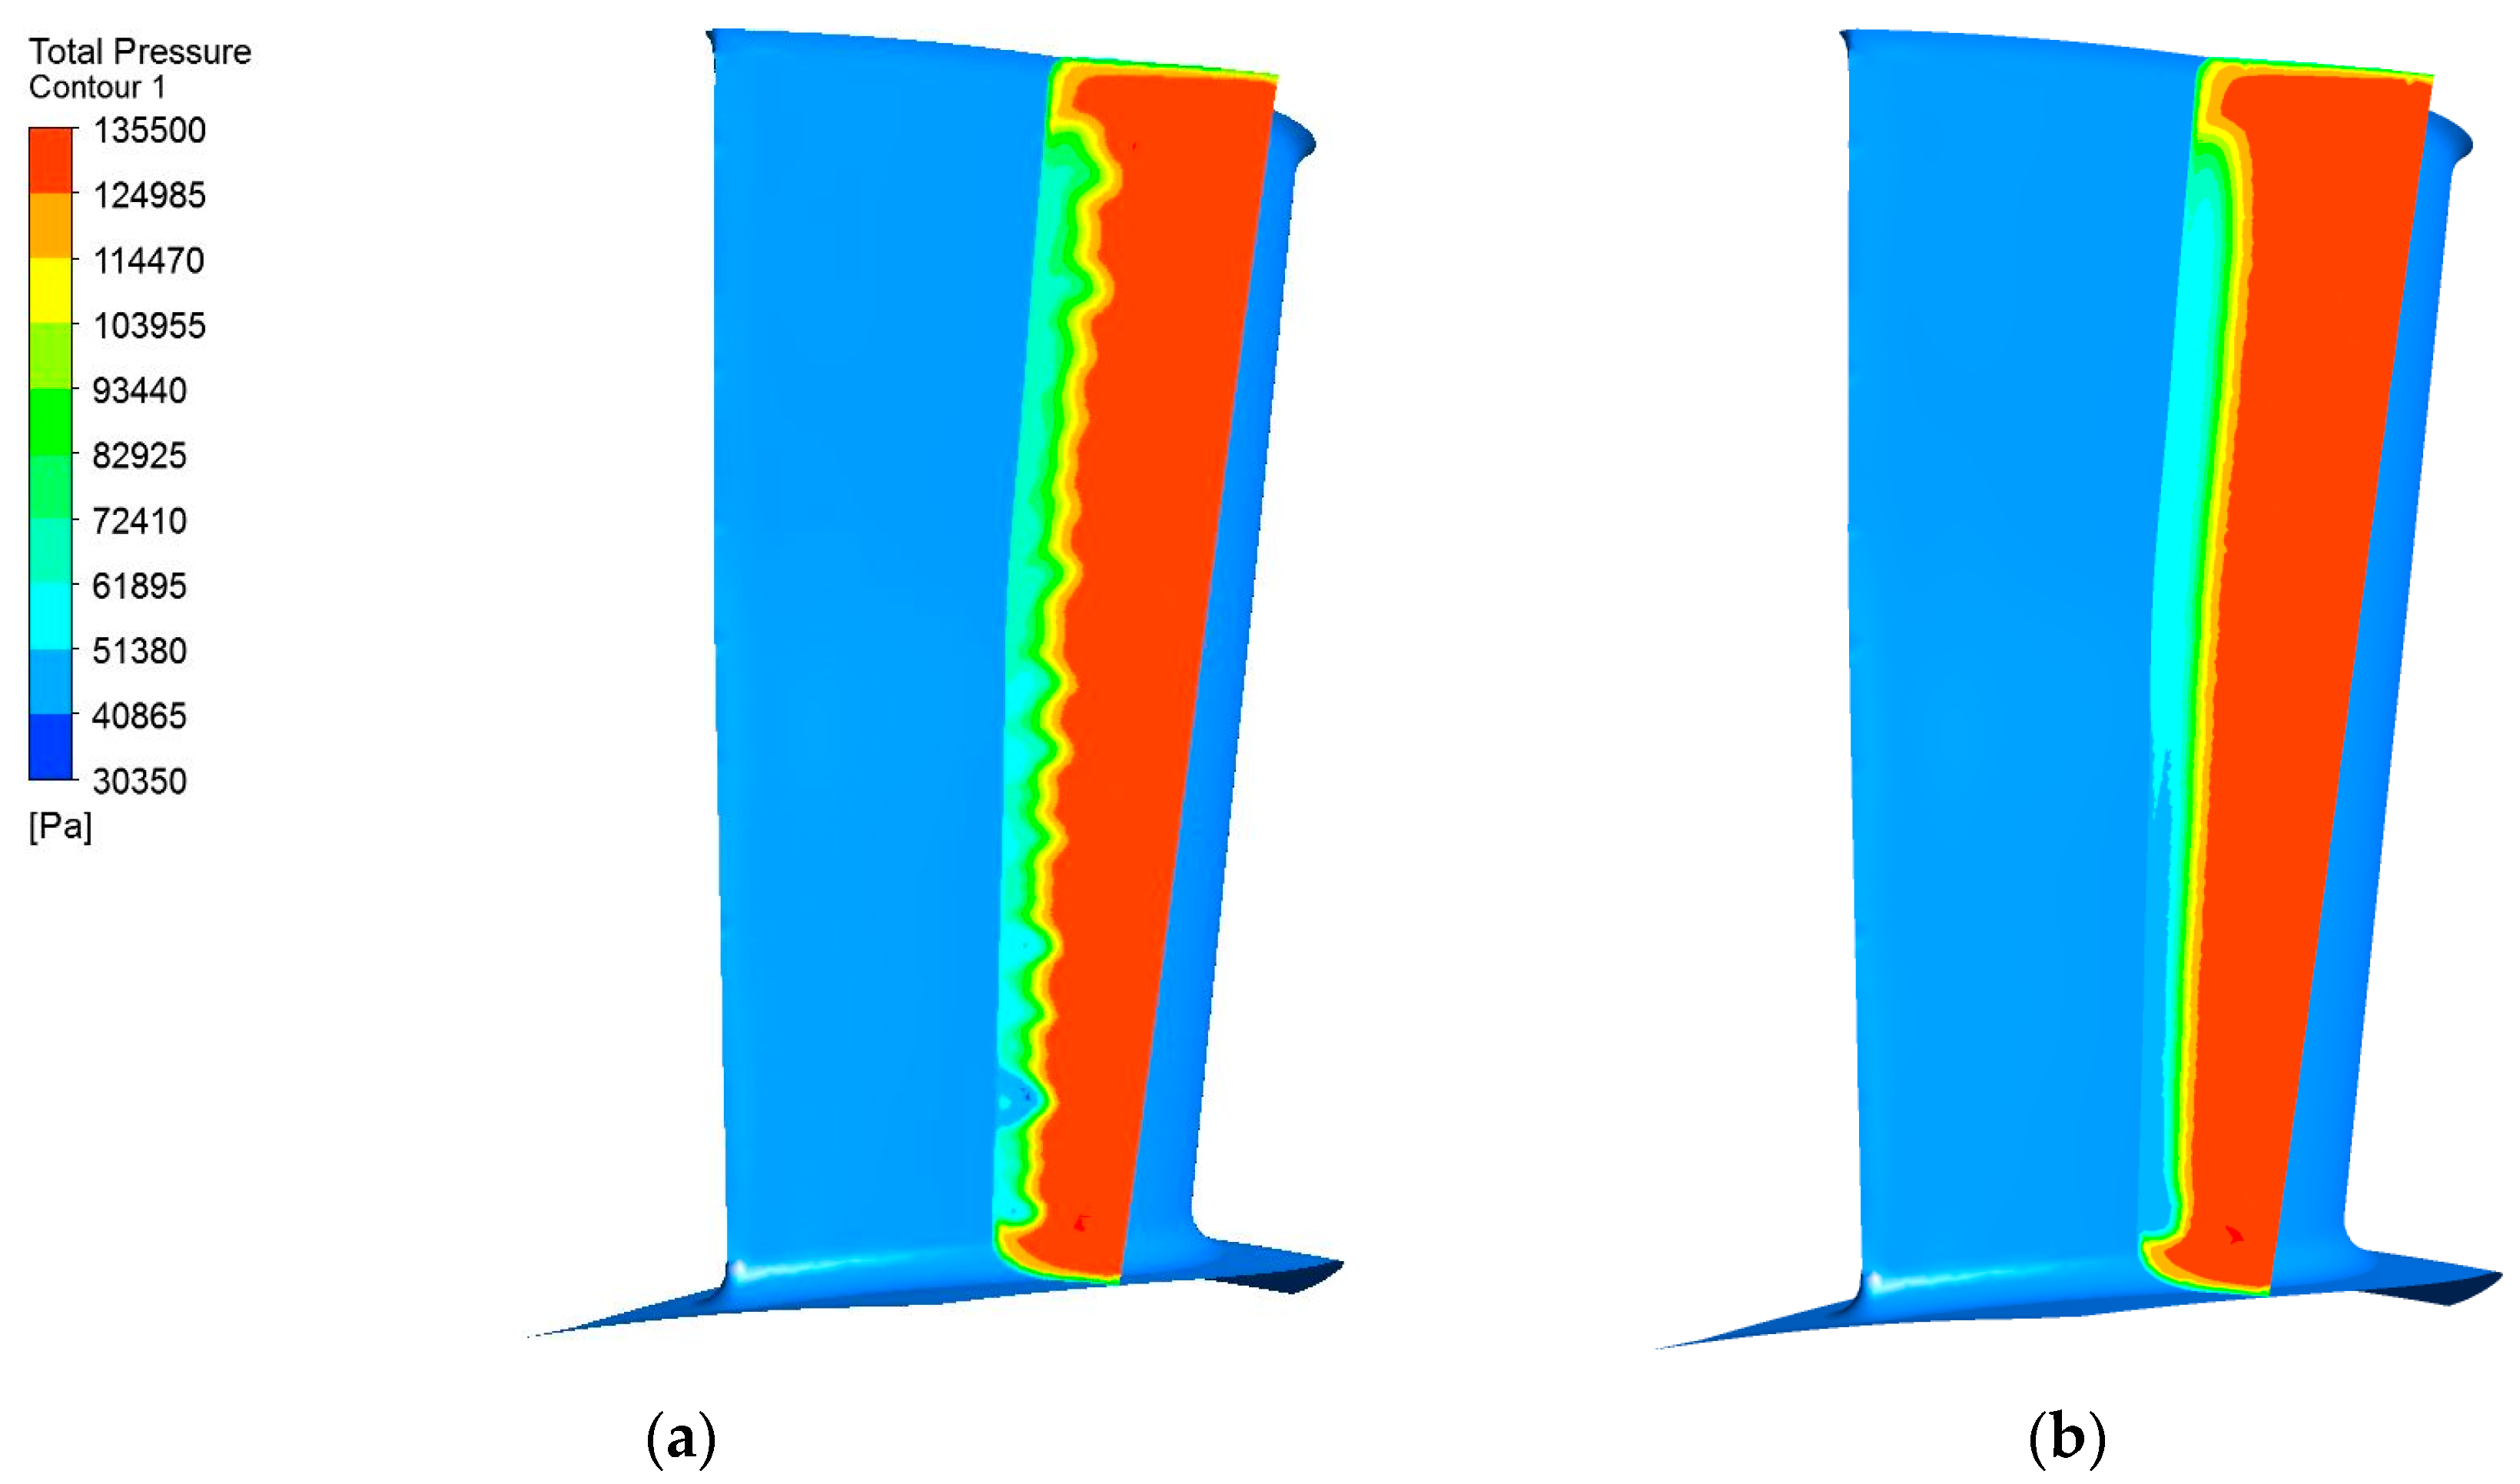
The injected fluid acts as a barrier which diverts the working fluid from the suction side of the vane near the injection section. This deviation in the near vicinity of the critical section leads to a smaller flow section for the working fluid which translates into a higher speed and a higher power generated by the rotor. After the interactions between the fluids, the injected fluid assumes the direction of the main flow and attaches to the suction side of the blade. As a result of the injection process, a low-pressure zone downstream of the injection section is created due to the main fluid deviation. This effect can be observed in
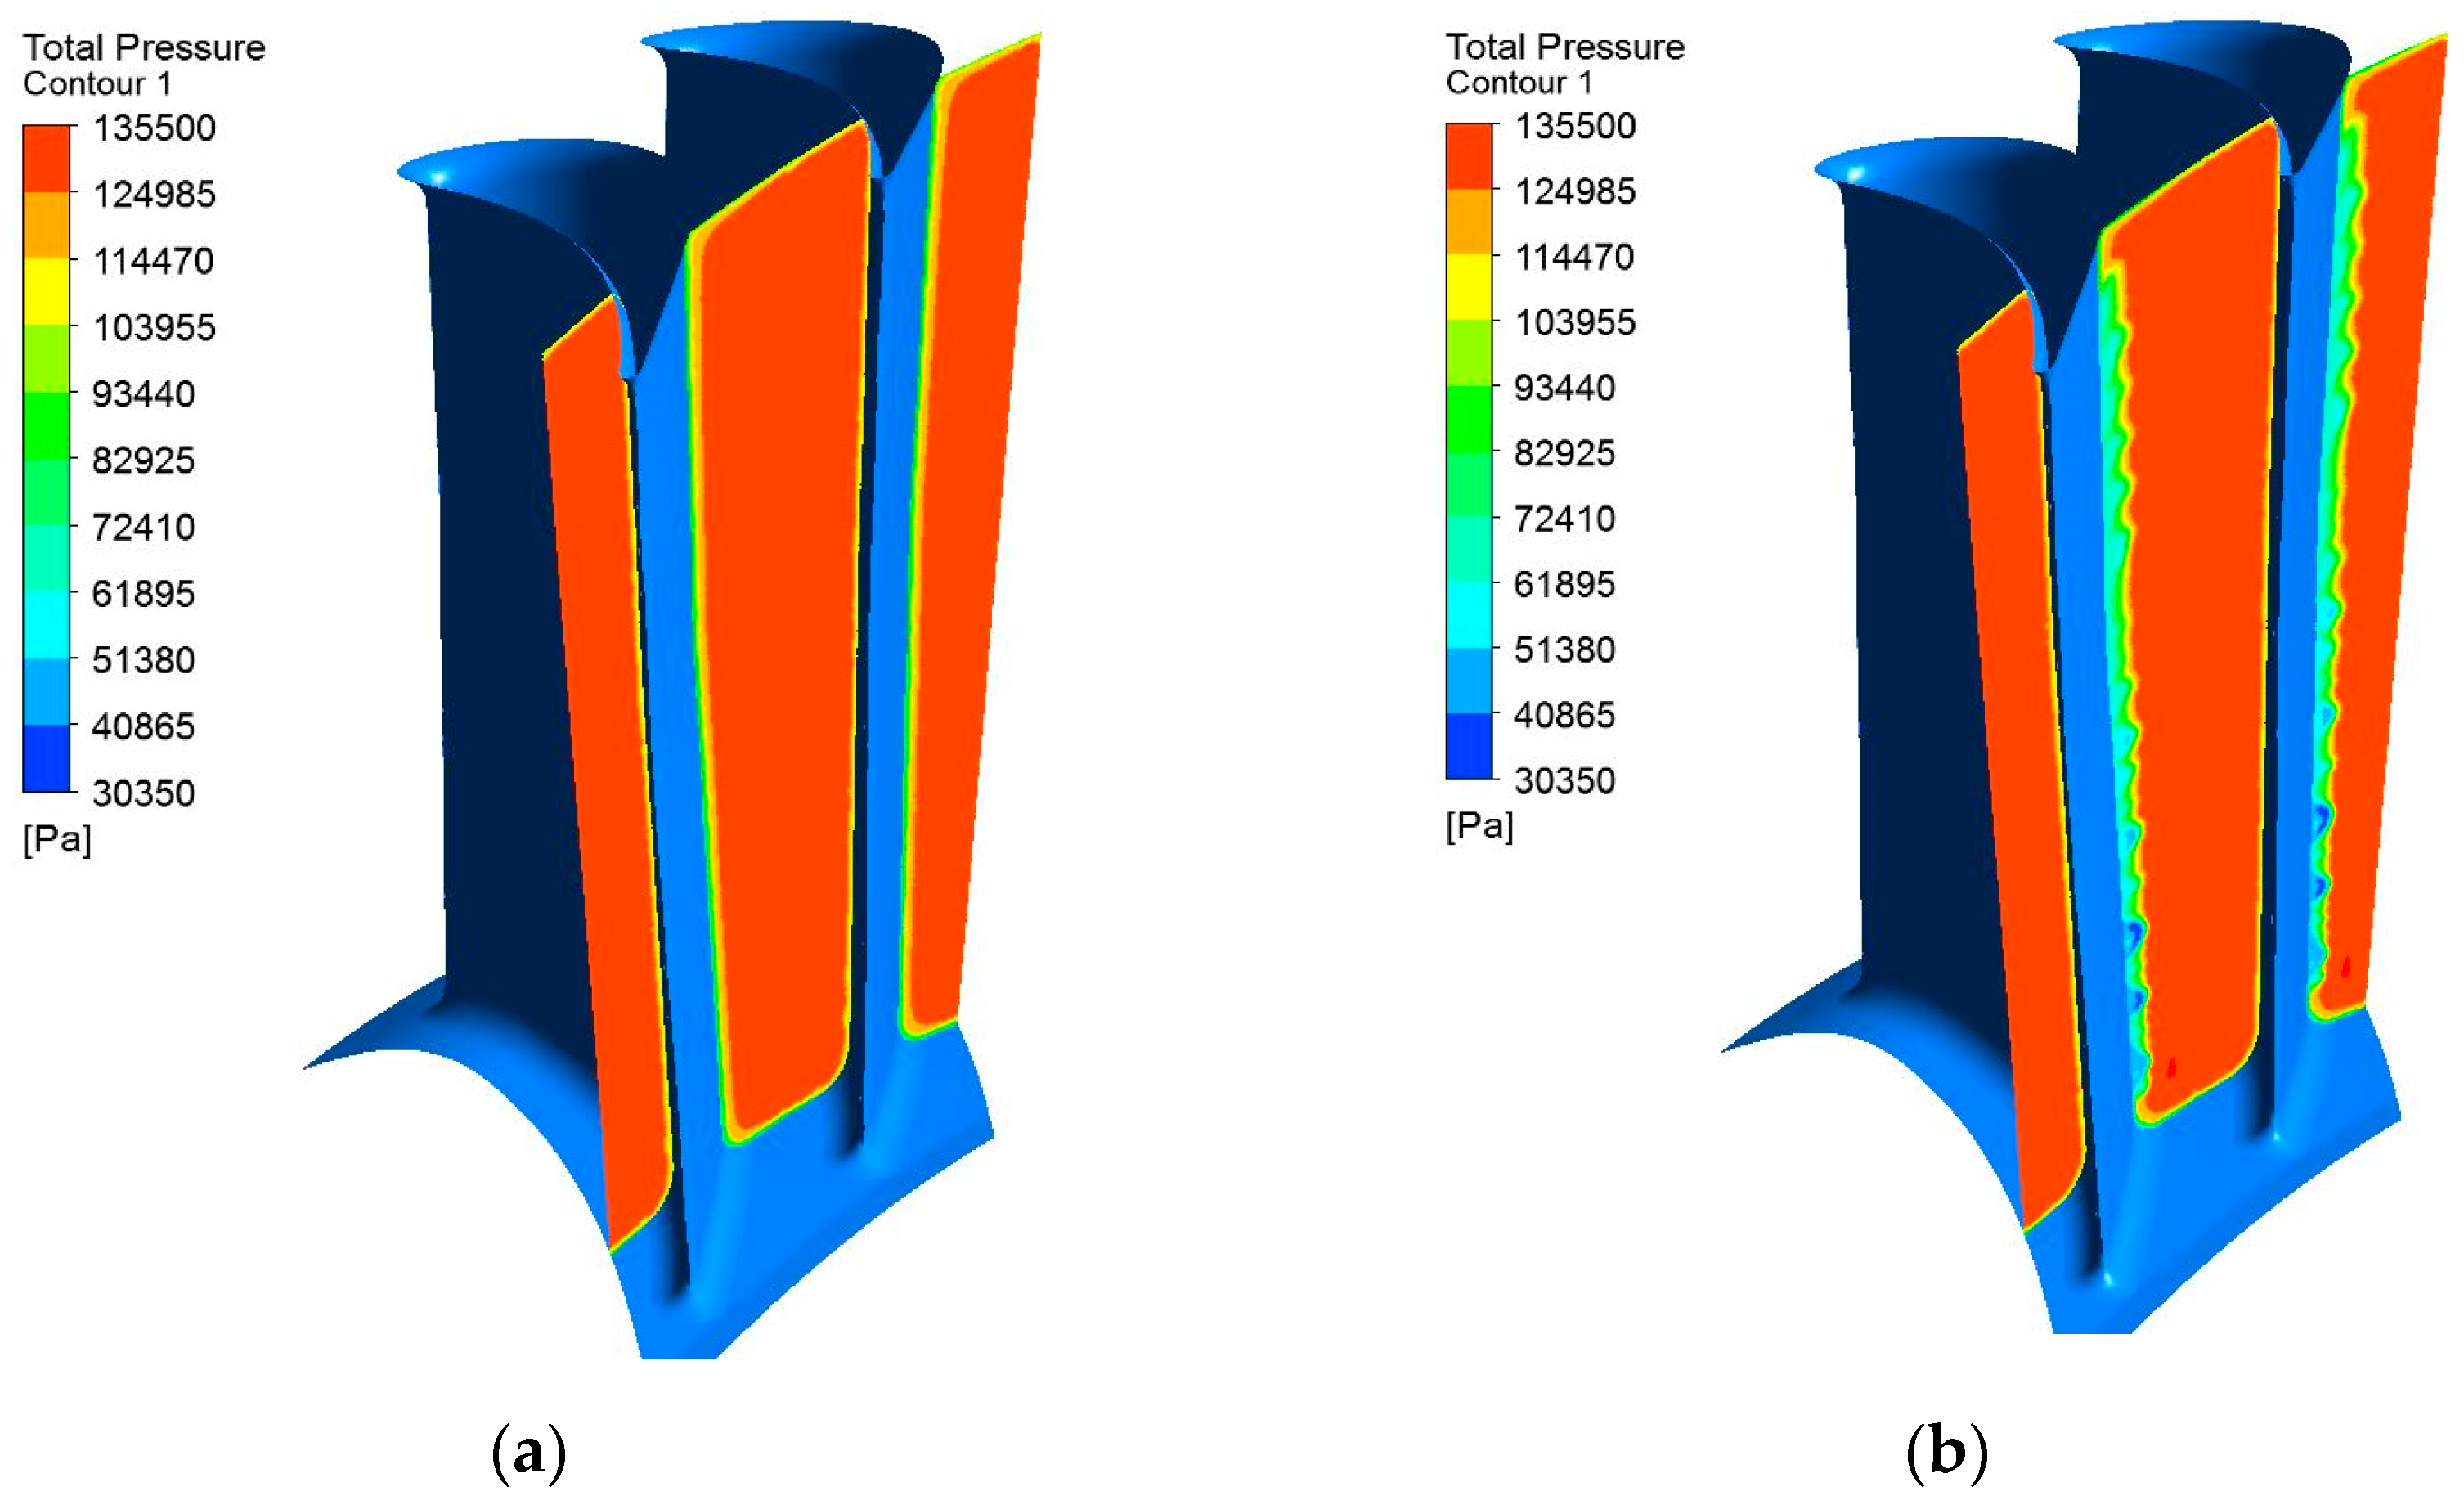
Figure 6, which presents the total pressure distribution at the mean radius of the vane for the cases with and without injection. Without the injection process the flow section of the vanes is approximately equal to the geometrical section, a small low-pressure zone being created by the boundary layer on the suction side. After the injection process the low-pressure zone is greatly enhanced which determines a noticeable smaller flow section. As a result, the effective geometry of the flow channel is modified. This effect is obtained across the vane height where the system is active, as can be determined from
Figure 7. As the boundary conditions were set with a fixed mass flow at the rotor outlet, the power enhancement is not a result of a mass flow increase but a result of different flow geometry.
3.2. Number of Orifices Influence
With the increase in injection diameter and the decrease in number of orifices (as previously explained) the distance between adjacent injection sections grows. This leads to lower effectiveness of the injection system as working fluid passes between the orifices.This effect is visible in
Figure 8, for the 0.8 and 1 mm diameters, where the number of injection sections is not adequate for the vane height.
In order to determine the influence of the number of orifices, the diameter and the inlet parameters of the injection fluid were maintained constant. The number of injection sections was increased from 50 to 70 for a diameter of 0.6 mm and from 30 to 45 for a diameter of 0.8 mm. The results showed, in both cases, a steady increase in the effectiveness of the injection system with the increase in number of injection sections. To better quantify the influence of the number of injection sections, relative to vane dimensions, a new dimensionless parameter, named coverage degree, has been introduced. The parameter, described by Equation (1), represents the percent of the vane height covered by injection sections.
where:
—coverage degree,
—number of injection orifices,
—orifice diameter,
—shroud radius,
—hub radius.
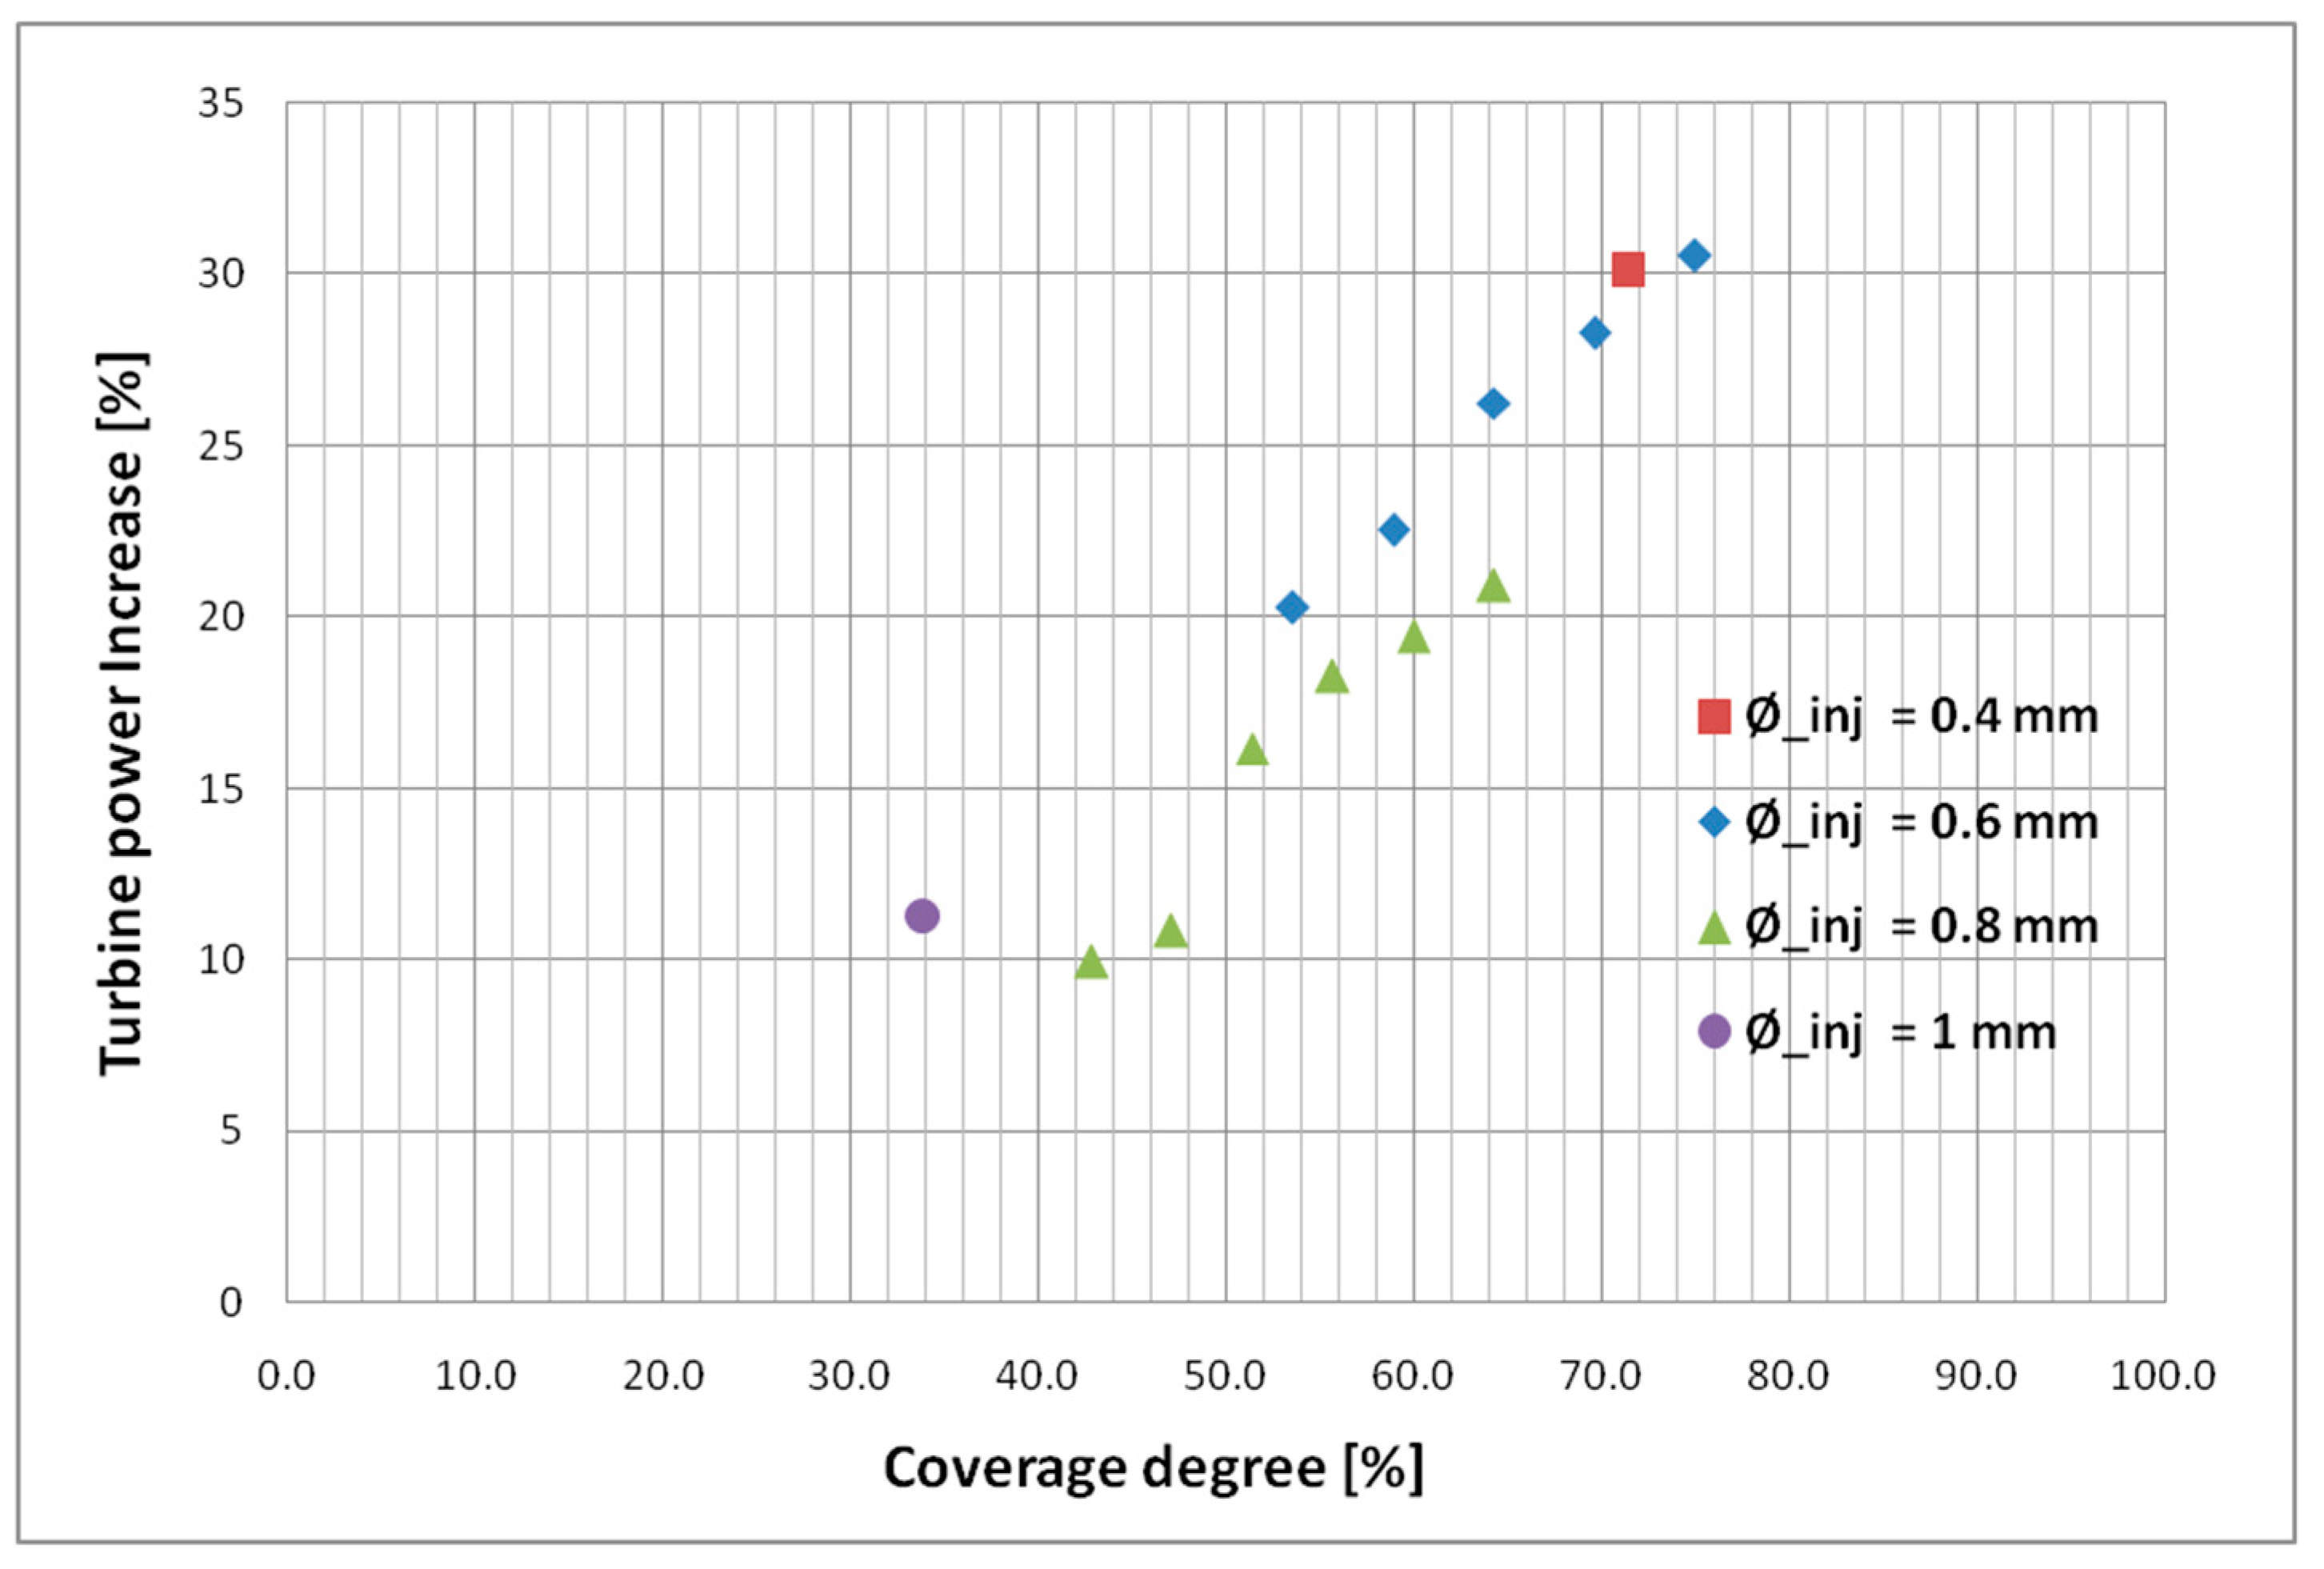
Applying the coverage degree to cases studied in this paper enables the comparison of cases with different dimensions and number of injection orifices. By plotting these results,
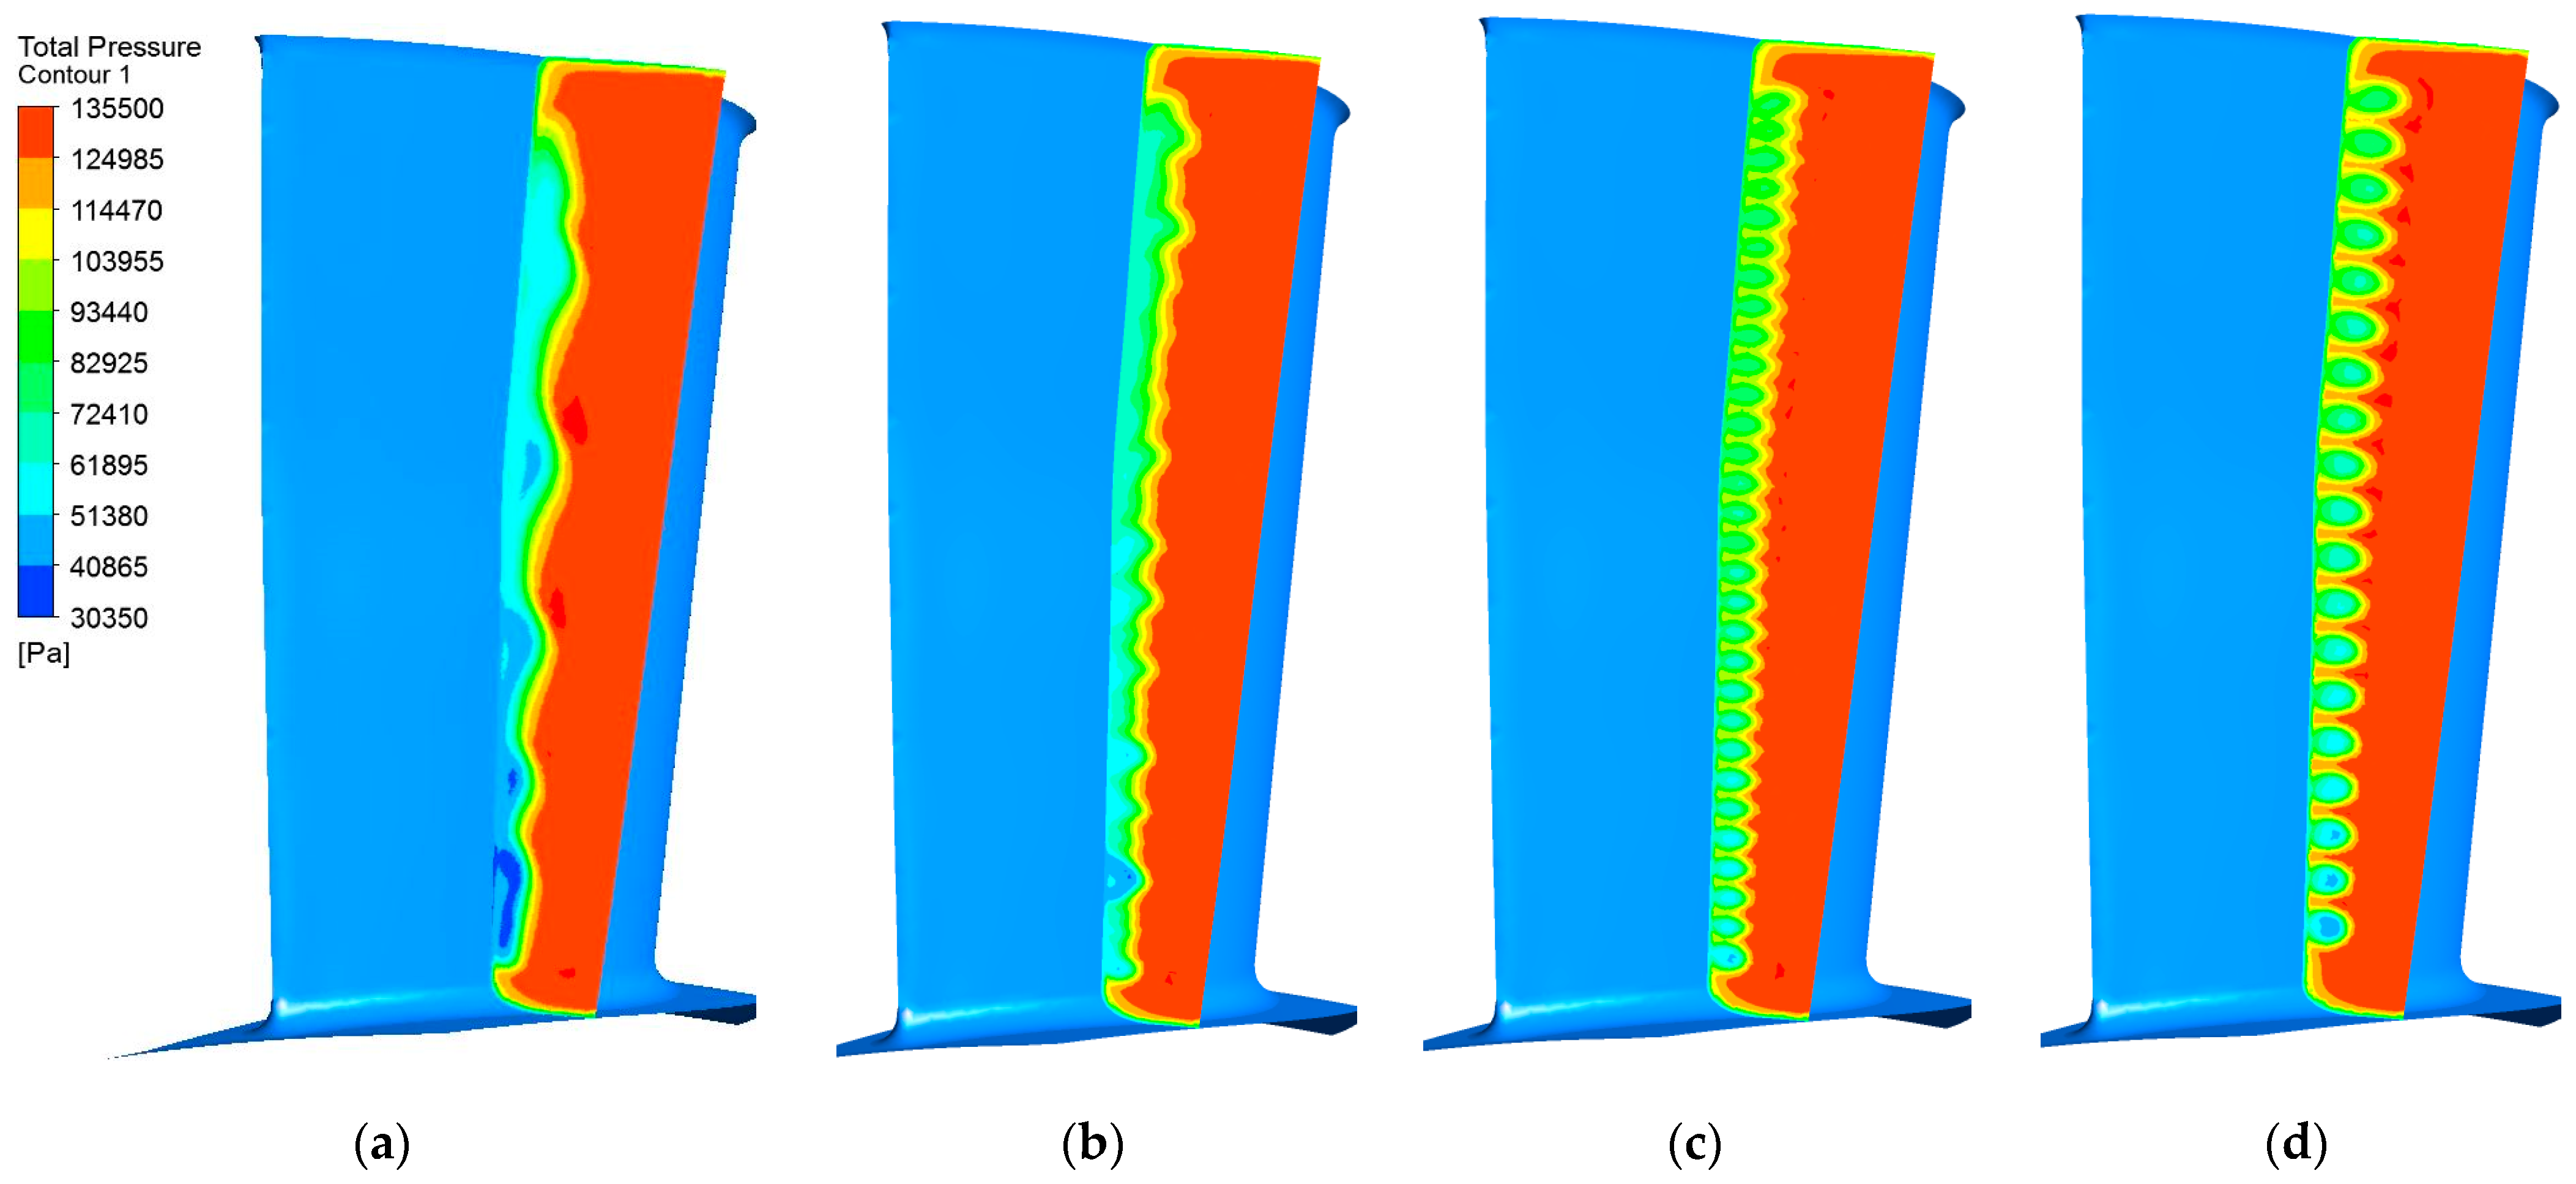
Figure 9, a linear tendency can be observed. The increase effectiveness of the injection system at higher values of the coverage degree can be explained by a better isolation of the gap between two adjacent injection sections. This effect is visible in
Figure 10 where a homogenization of the low-pressure zone across the vane height can be observed at the increase of the coverage degree. With the increase of this parameter from 53.6% to 75%, the influence of the injection system has grown from +20% to +30% in generated power.
3.3. Injection System Influence at Different Partial Regimes
The influence of the injection system on the turbine performances has been determined at different partial regimes by calculating the flow and the performances before and after injection for other regimes, regimes of lower respective higher power. The results previously presented have been determined for a partial regime of 89%, named “partial 1”. Using the turbine map and working line, the inlet parameters for lower power regimes of approximately 84.5% and 80% and higher regimes of 91% and 92.5% have been determined. With these inlet parameters the flow and performances of the axial turbine were calculated using the same numerical model as the one previously discussed. The parameters for the partial regimes are presented in
Table 5.
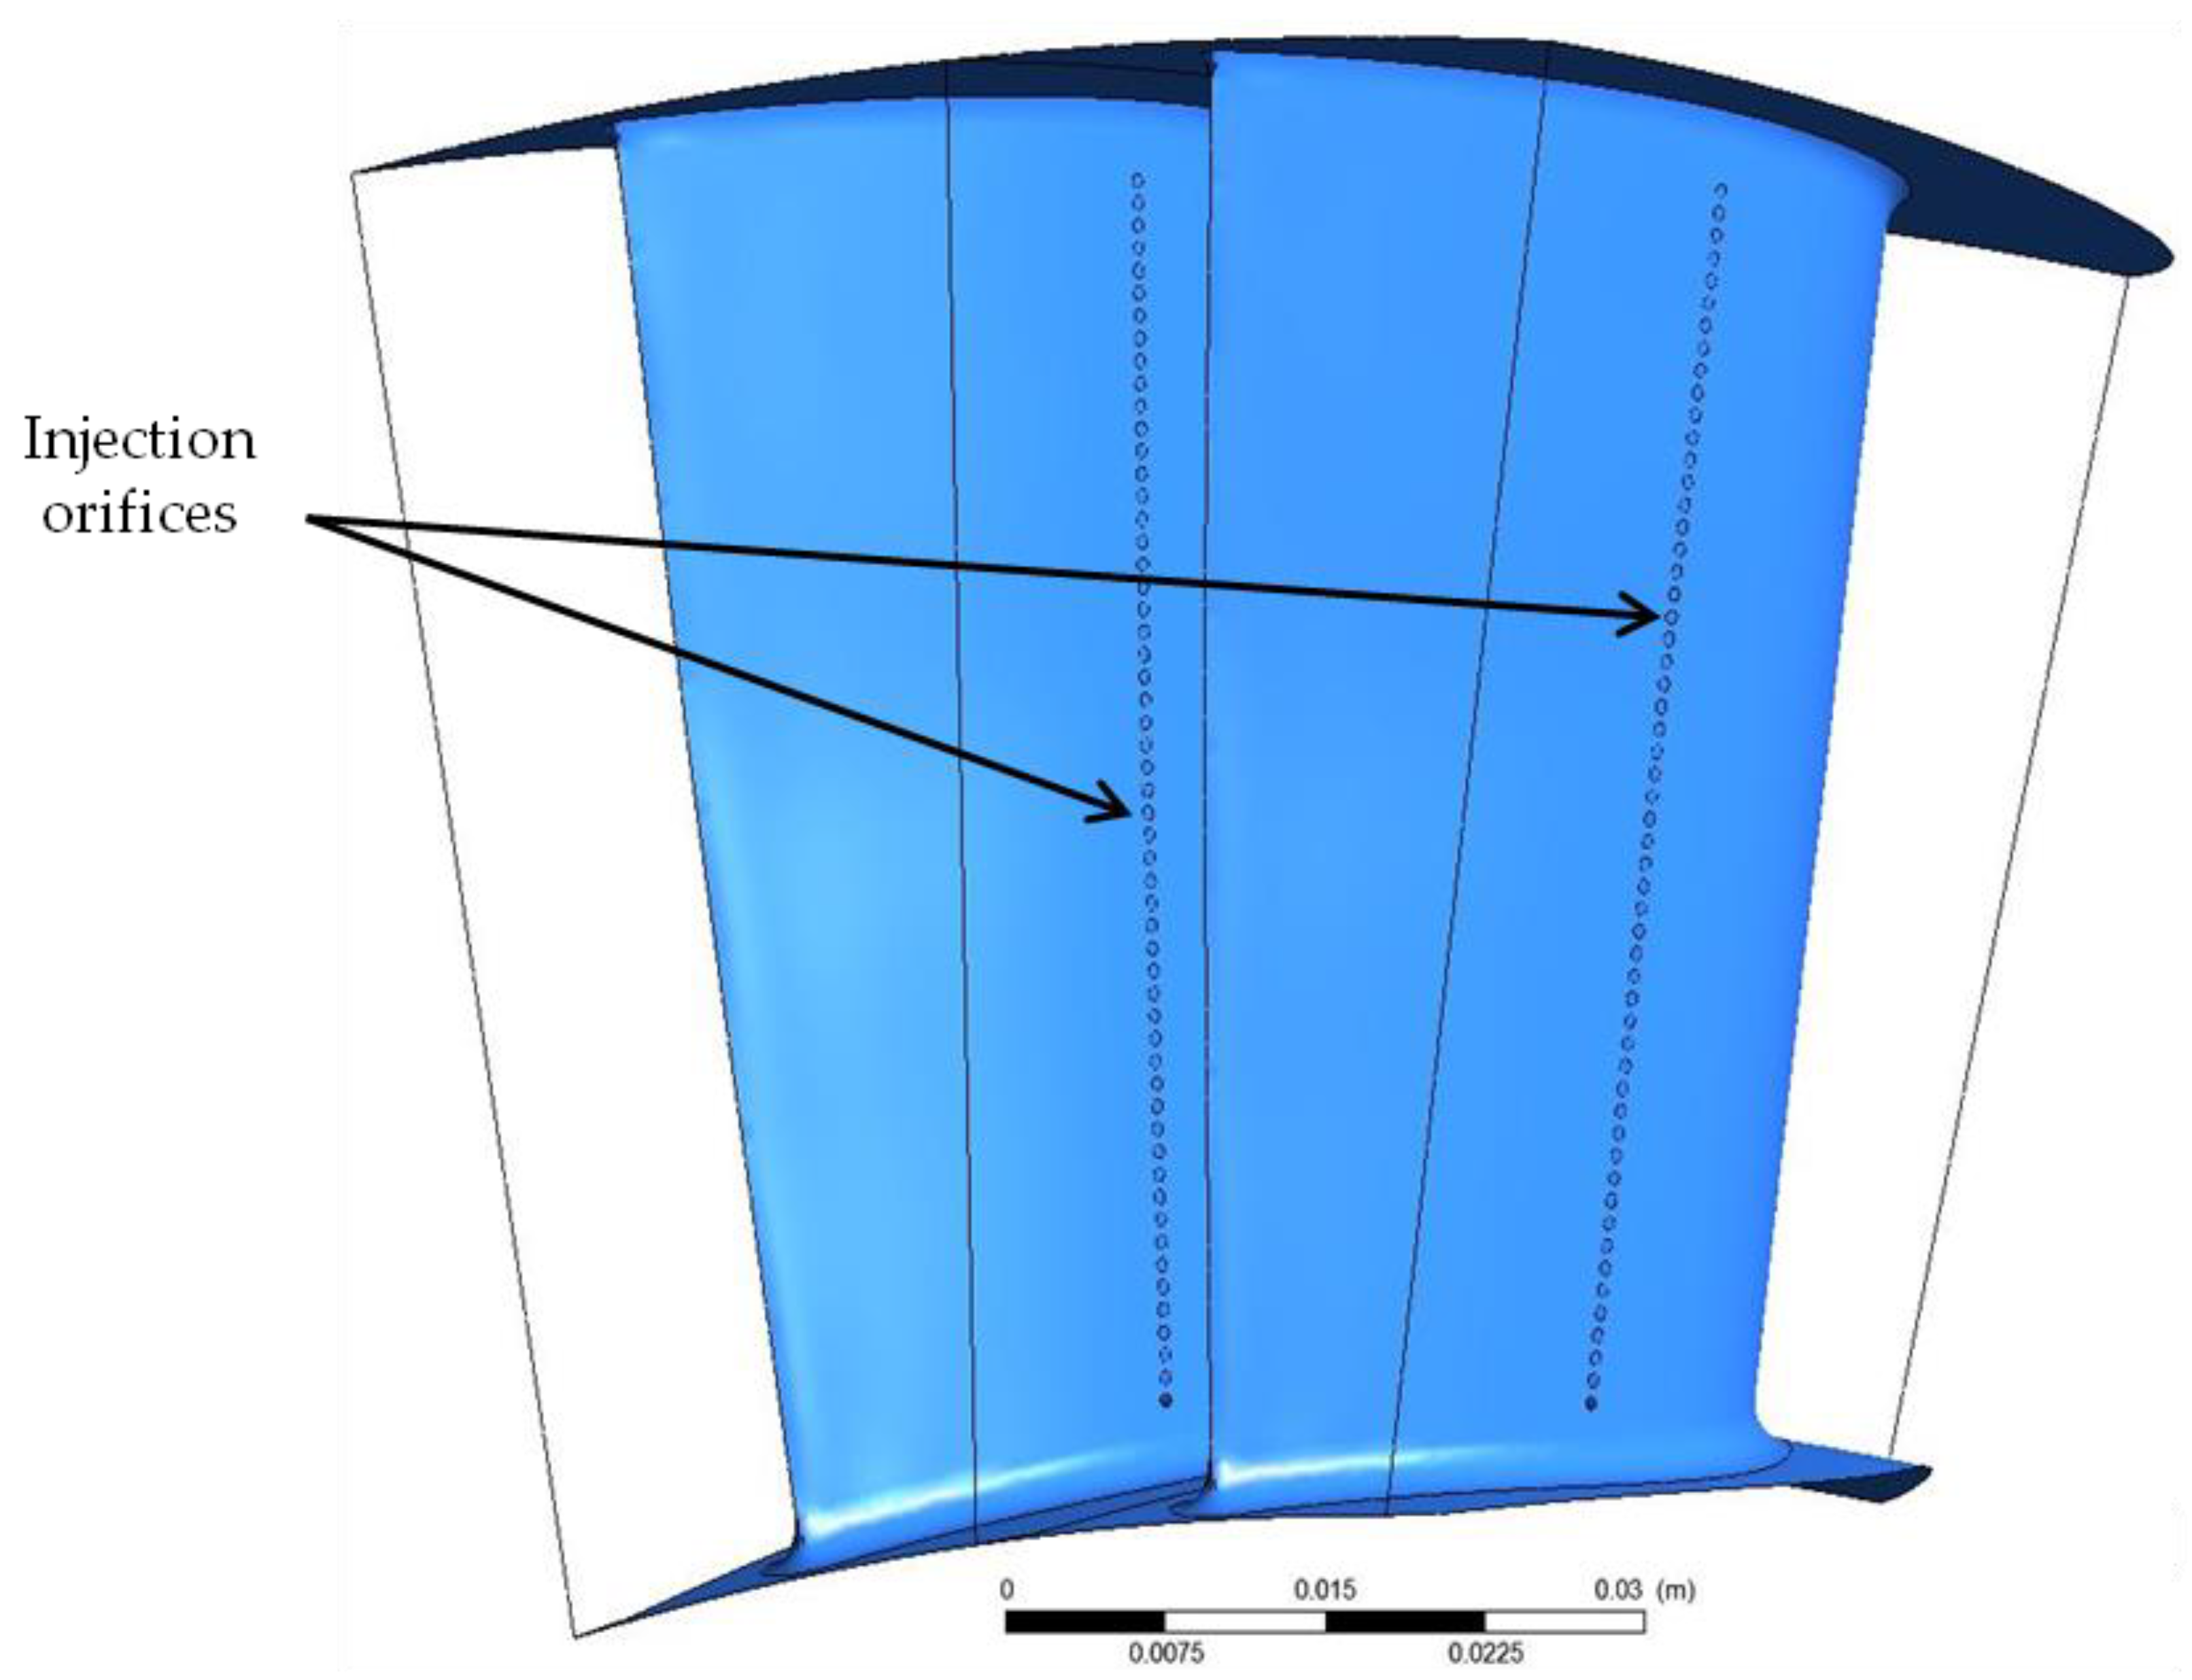
The injection system used for this analysis consists of 55 injection orifices with a diameter of 0.6 mm resulting in a coverage degree of approximately 59%. The axial distance is 0.2, the injection temperature is similar to the turbine inlet temperature and the injection mass flow represents 2.5% of the working flow, the injection system configuration is presented in
Figure 11. The injection fluid is considered to be extracted from the engine compressor and injected in the turbine vane, thus the rotor outlet mass flow (set in the numerical case with the outlet boundary conditions) is constant for the cases with and without injection.
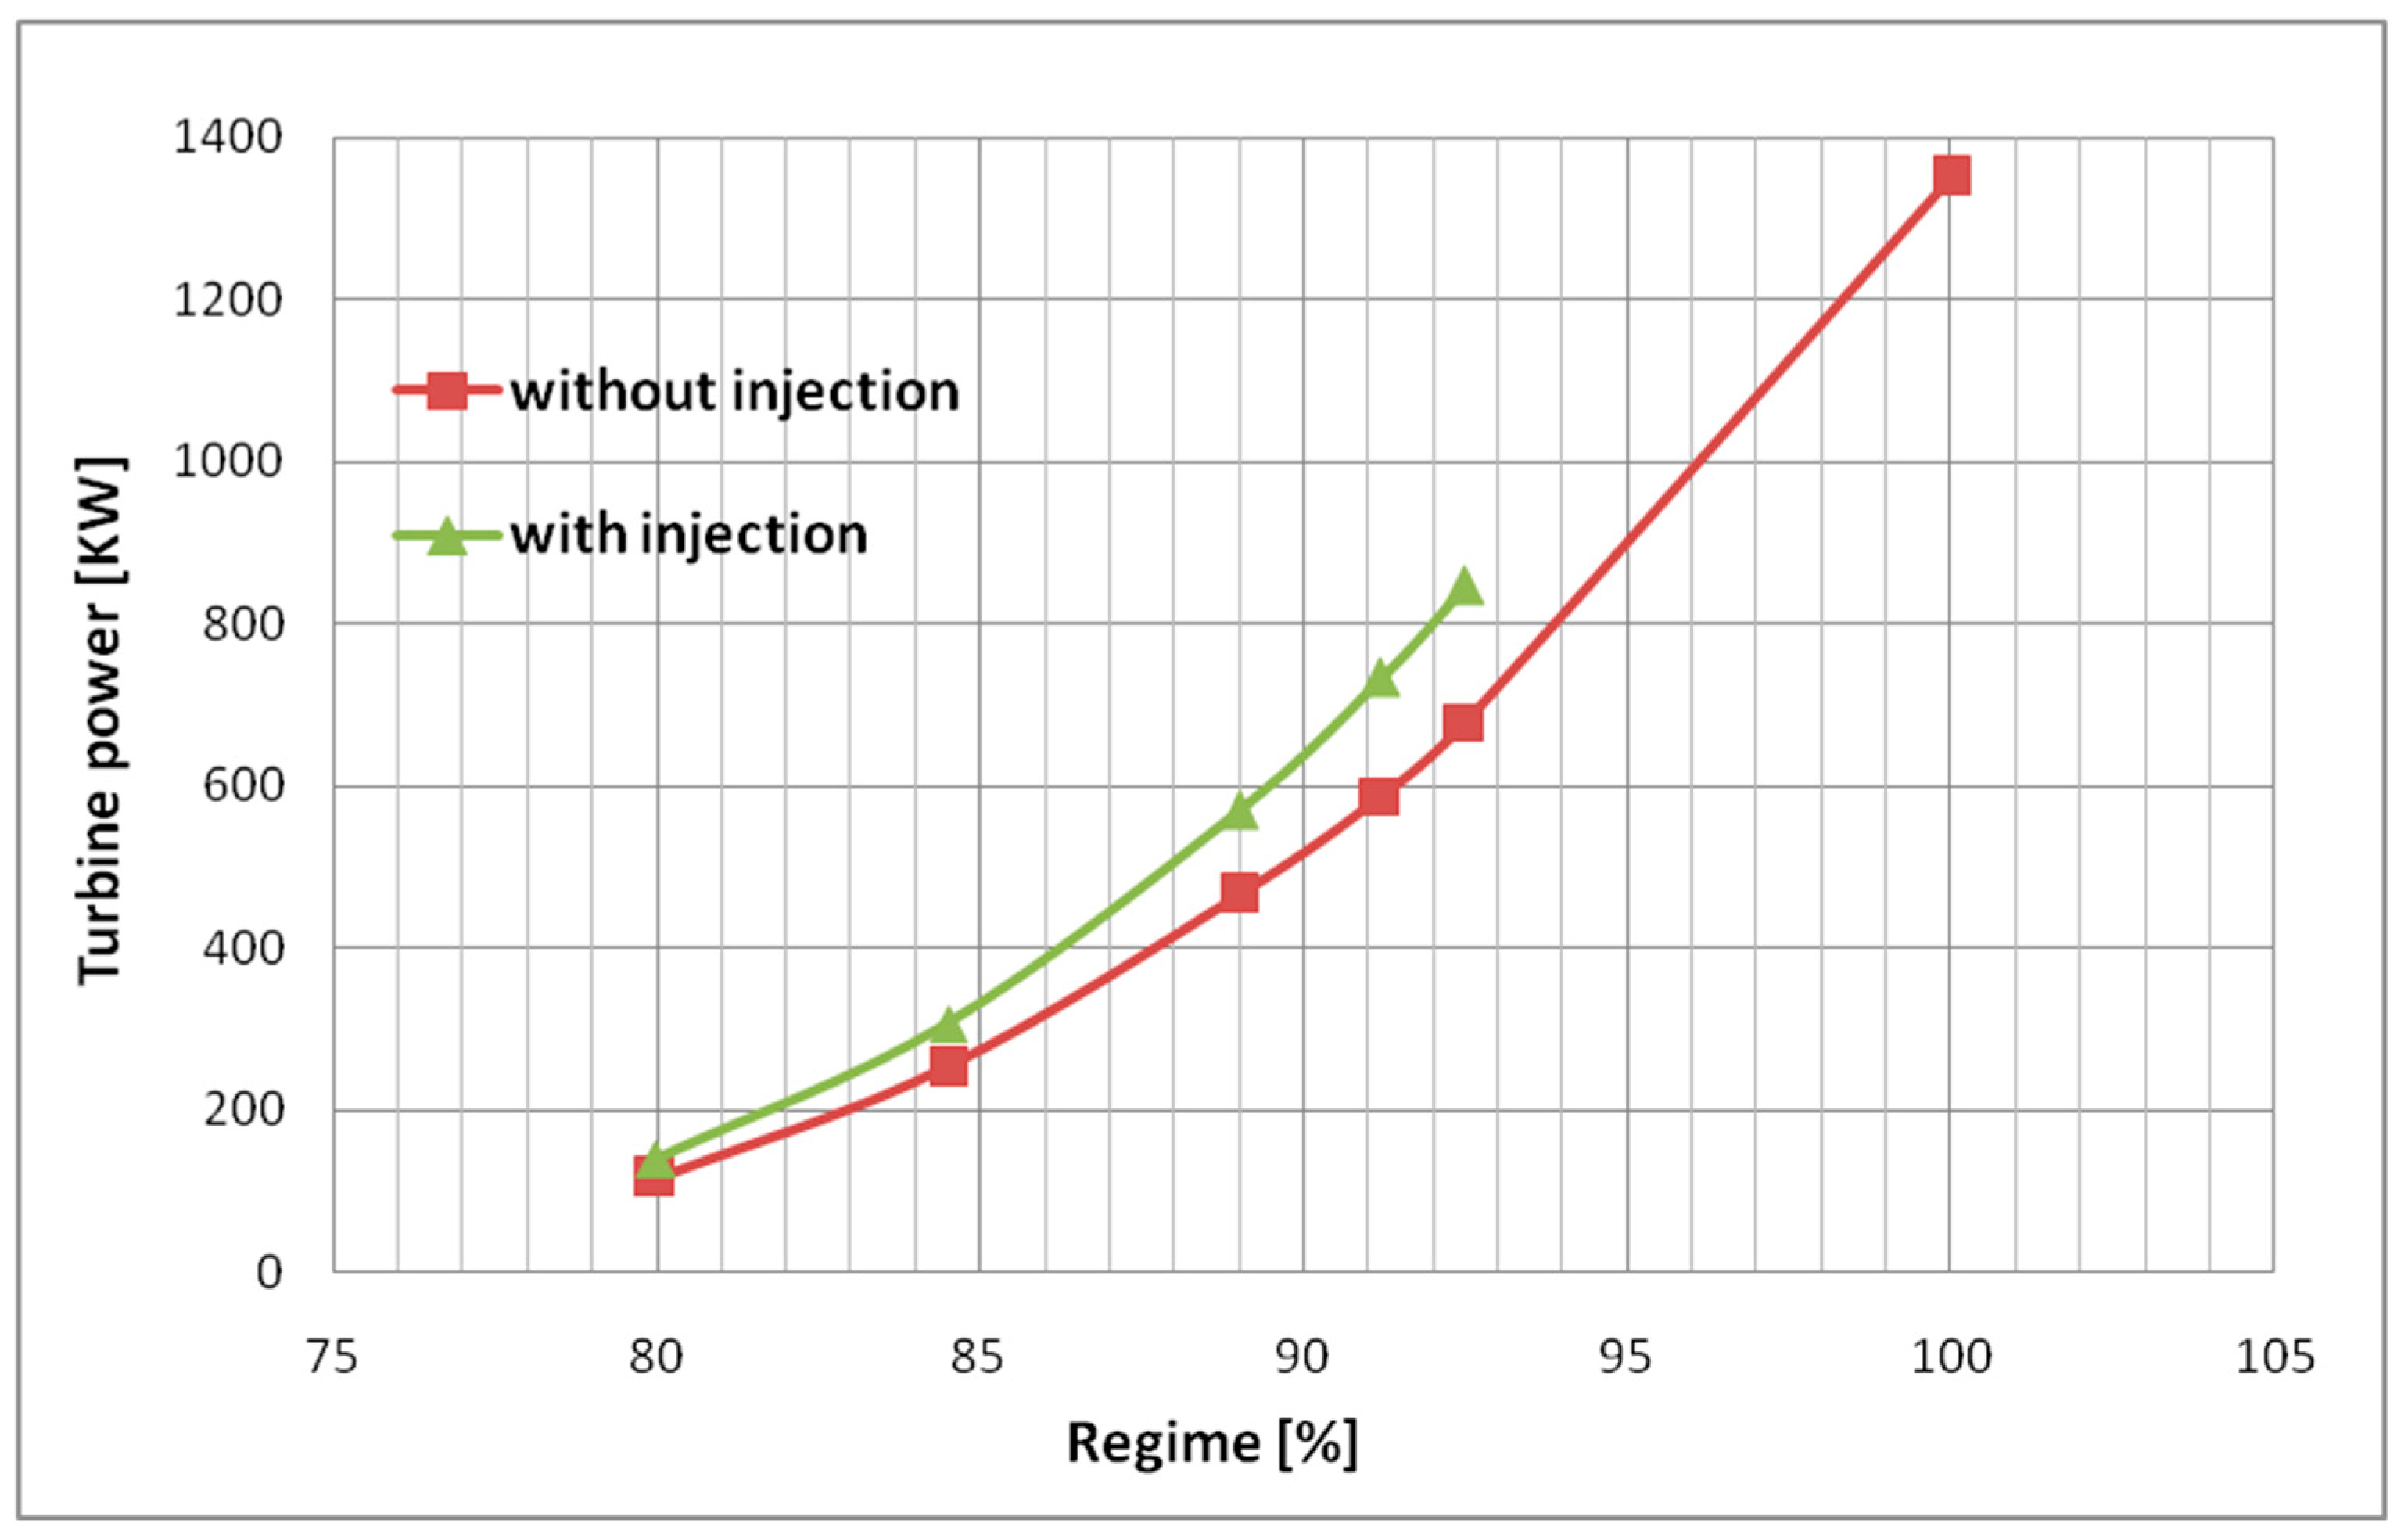
For all the partial regimes studied the generated power has increased by approximately 23% with slightly higher values at higher regimes. These increases lead to equivalent levels of power 1.5% to 2% higher.The results of the partial regimes analysis are presented in
Table 6 and by plotting the results,
Figure 12, it can be determined that the injection process leads to an increase of curve slope.
From this analysis it can be determined that the performance of the injection system is not limited to certain regimes but can be used for multiple power settings. The influence of the system is slightly smaller at lower power settings and increases with the engine regime.
The results of the present study are not easily comparable with other studies on performance enhancement at partial regimes as the injection system presented in this study focuses on increasing the power output of the turbine by modifying the flow geometry and not by reducing specific flow losses in the turbine by injection. The studies identified in the literature focus on loss reductions by increasing the flow momentum in certain areas of the blades using fluid injection. Thus, the injection jets are places at a low angle to reduce the resulting mixing loses. The main effect of these jets is the reattachment of the boundary layer on the suction side. The system presented in this paper focuses on changing the flow geometry of the vanes working channel to better adapt the turbine to inlet conditions for the respective partial regime. The injection angle is high, when compared with existing studies, in order to obtain an increased flow deviation in specific locations.
The placement of injection jets is also different from the studies discussed in this paper. For loss reduction, the studies showed that the injection jets should be positioned near the separation inception as for the performance enhancement, the injection orifices are placed close to the critical section. The placement of injection orifices upstream of the critical section ensures that the low-pressure bubble, formed as a result of injection, determines a decrease in minimal flow section leading to an acceleration of the main fluid.
The overall effect of the injection system can be determined in terms of fuel consumption. Thus, for the 89% partial regime presented (“partial 1”) and an 22% power increase, by injection the flow consumption for the respective regime has decreased by approximately 11.5% and can reach 15% when calculated for higher partial regimes.
The results of this study should be of great interest especially for industries where long duration partial regimes operation are common. For marine propulsion the cruise gas turbine engines could operate for long periods of time (i.e., tens of hours) at these regimes, thus the 11.5% fuel savings represents an important reduction in cost of operation and an increase in ship operational range. For aviation gas turbines, the injection system can be used at partial regimes even that these regimes are reduced in term of time of operation. Furthermore, the use of the injection system could offset the impact of high ambient temperature on the engine performances.
Future research should concentrate on using multiple injection curves to simplify the manufacturing complexity of the system. By using curves to position the orifices it may be possible to obtain the same results with higher distances between the injection sections. The influence of the injection system on the engine cycle should also be studied, as by modifying the minimal section of the turbine other elements, such as the compressor, other turbine stages and burning chamber, could be affected. Another interesting topic is the interaction between the injection fluid and the cooling flow (if the turbine requires film cooling).
4. Conclusions
The purpose of this paper is to continue the research into the novel performance enhancement method by determining the influence of geometrical parameters as well as the influence of the injection system at different partial regimes. The specific fluid injection in the axial turbine flow was found to be a possible method to enhance the performances at partial regimes. The injection process leads to a deviation of the working fluid flow through the turbine vanes, which determines a decrease in the minimal flow section, thus an acceleration of the flow in the vanes and an increase power output.
From the orifice dimensions analyses it was determined that the influence of the injection system decreases at higher values of the orifices diameter for the same mass flow, as a result of higher spacing between injection sections which limits the flow deviation across the vane height. For the cases studied in this paper, the turbine power increase varied from approximately 30% for small diameter orifices (0.4 mm) to around 10% for larger orifices (0.8 and 1 mm).
From the number of injection orifices analyses it was determined that high numbers of injection sections lead to higher powers. The power increase was found to be as much as 33%, depending on the injection system configuration, with smaller dimensions and high number of injection section having the greatest influence. The number and dimensions of the injection sections must be analyzed together when designing the injection system, thus a new parameter, named the coverage degree, was introduced to incorporate both. The parameter was found to have a linear tendency when plotting against the power increase. A high value of this parameter leads to closer injection sections which limits the working fluid flow between the orifices, thus the system acts as a barrier which deviates the flow near the minimal section of the vanes leading to a lower flow section.
From a technological point of view the injection system is similar to film cooling systems. The orifice dimensions do not pose a considerable challenge but the high number of injection sections and the higher values of the coverage degree may be difficult to achieve, due to high number and close proximity of the injection orifices. This system is most suited to low-pressure turbines and free power turbines as these elements are usually not cooled and the necessary injection pressures are lower. Furthermore, the injection system can better adapt the generated power to the consumer needs with minimum influence on the gas generator. The injection system can be used for high-pressure turbines but further studies on interactions between injection flow and cooling flow, engine control and stability and available injection pressures are needed.
The injection system is not limited to a specific partial regime and can be applied to multiple power settings with similar performances in terms of percentage power increase. The power increase was determined to be around 22% achieving approximately 25% at higher regimes.
The results of the studies conducted in this paper suggest that the turbine mass flow is better used at partial regimes in an injection configuration (97.5% turbine inlet mass flow and 2.5% injection mass flow, values used in this study) than a no injection configuration (100% turbine inlet mass flow). Thus, additional power is extracted from the available energy at the turbine inlet by using a more efficient turbine geometry for the respective partial regime, geometry obtained as a result of fluid injection. The additional power extraction leads to an increase in overall engine efficiency which can improve the inherent low efficiencies of the gas turbines engines at partial regimes.
The work presented in this paper contributes to further characterize the novel performance enhancement method by specific fluid injection. In theory, the results can be used to determine the influence variation for different parameters in order to further develop the method and achieve an optimum configuration. In practice the optimum configuration might not be technically feasible due to manufacturing limitations, thus the final configuration must take into account these limitations.


