
Regional Climate Change Adaptation Based on the PSR Model—Multi-Case Comparative Analysis on a Global Scale


Abstract
:1. Introduction
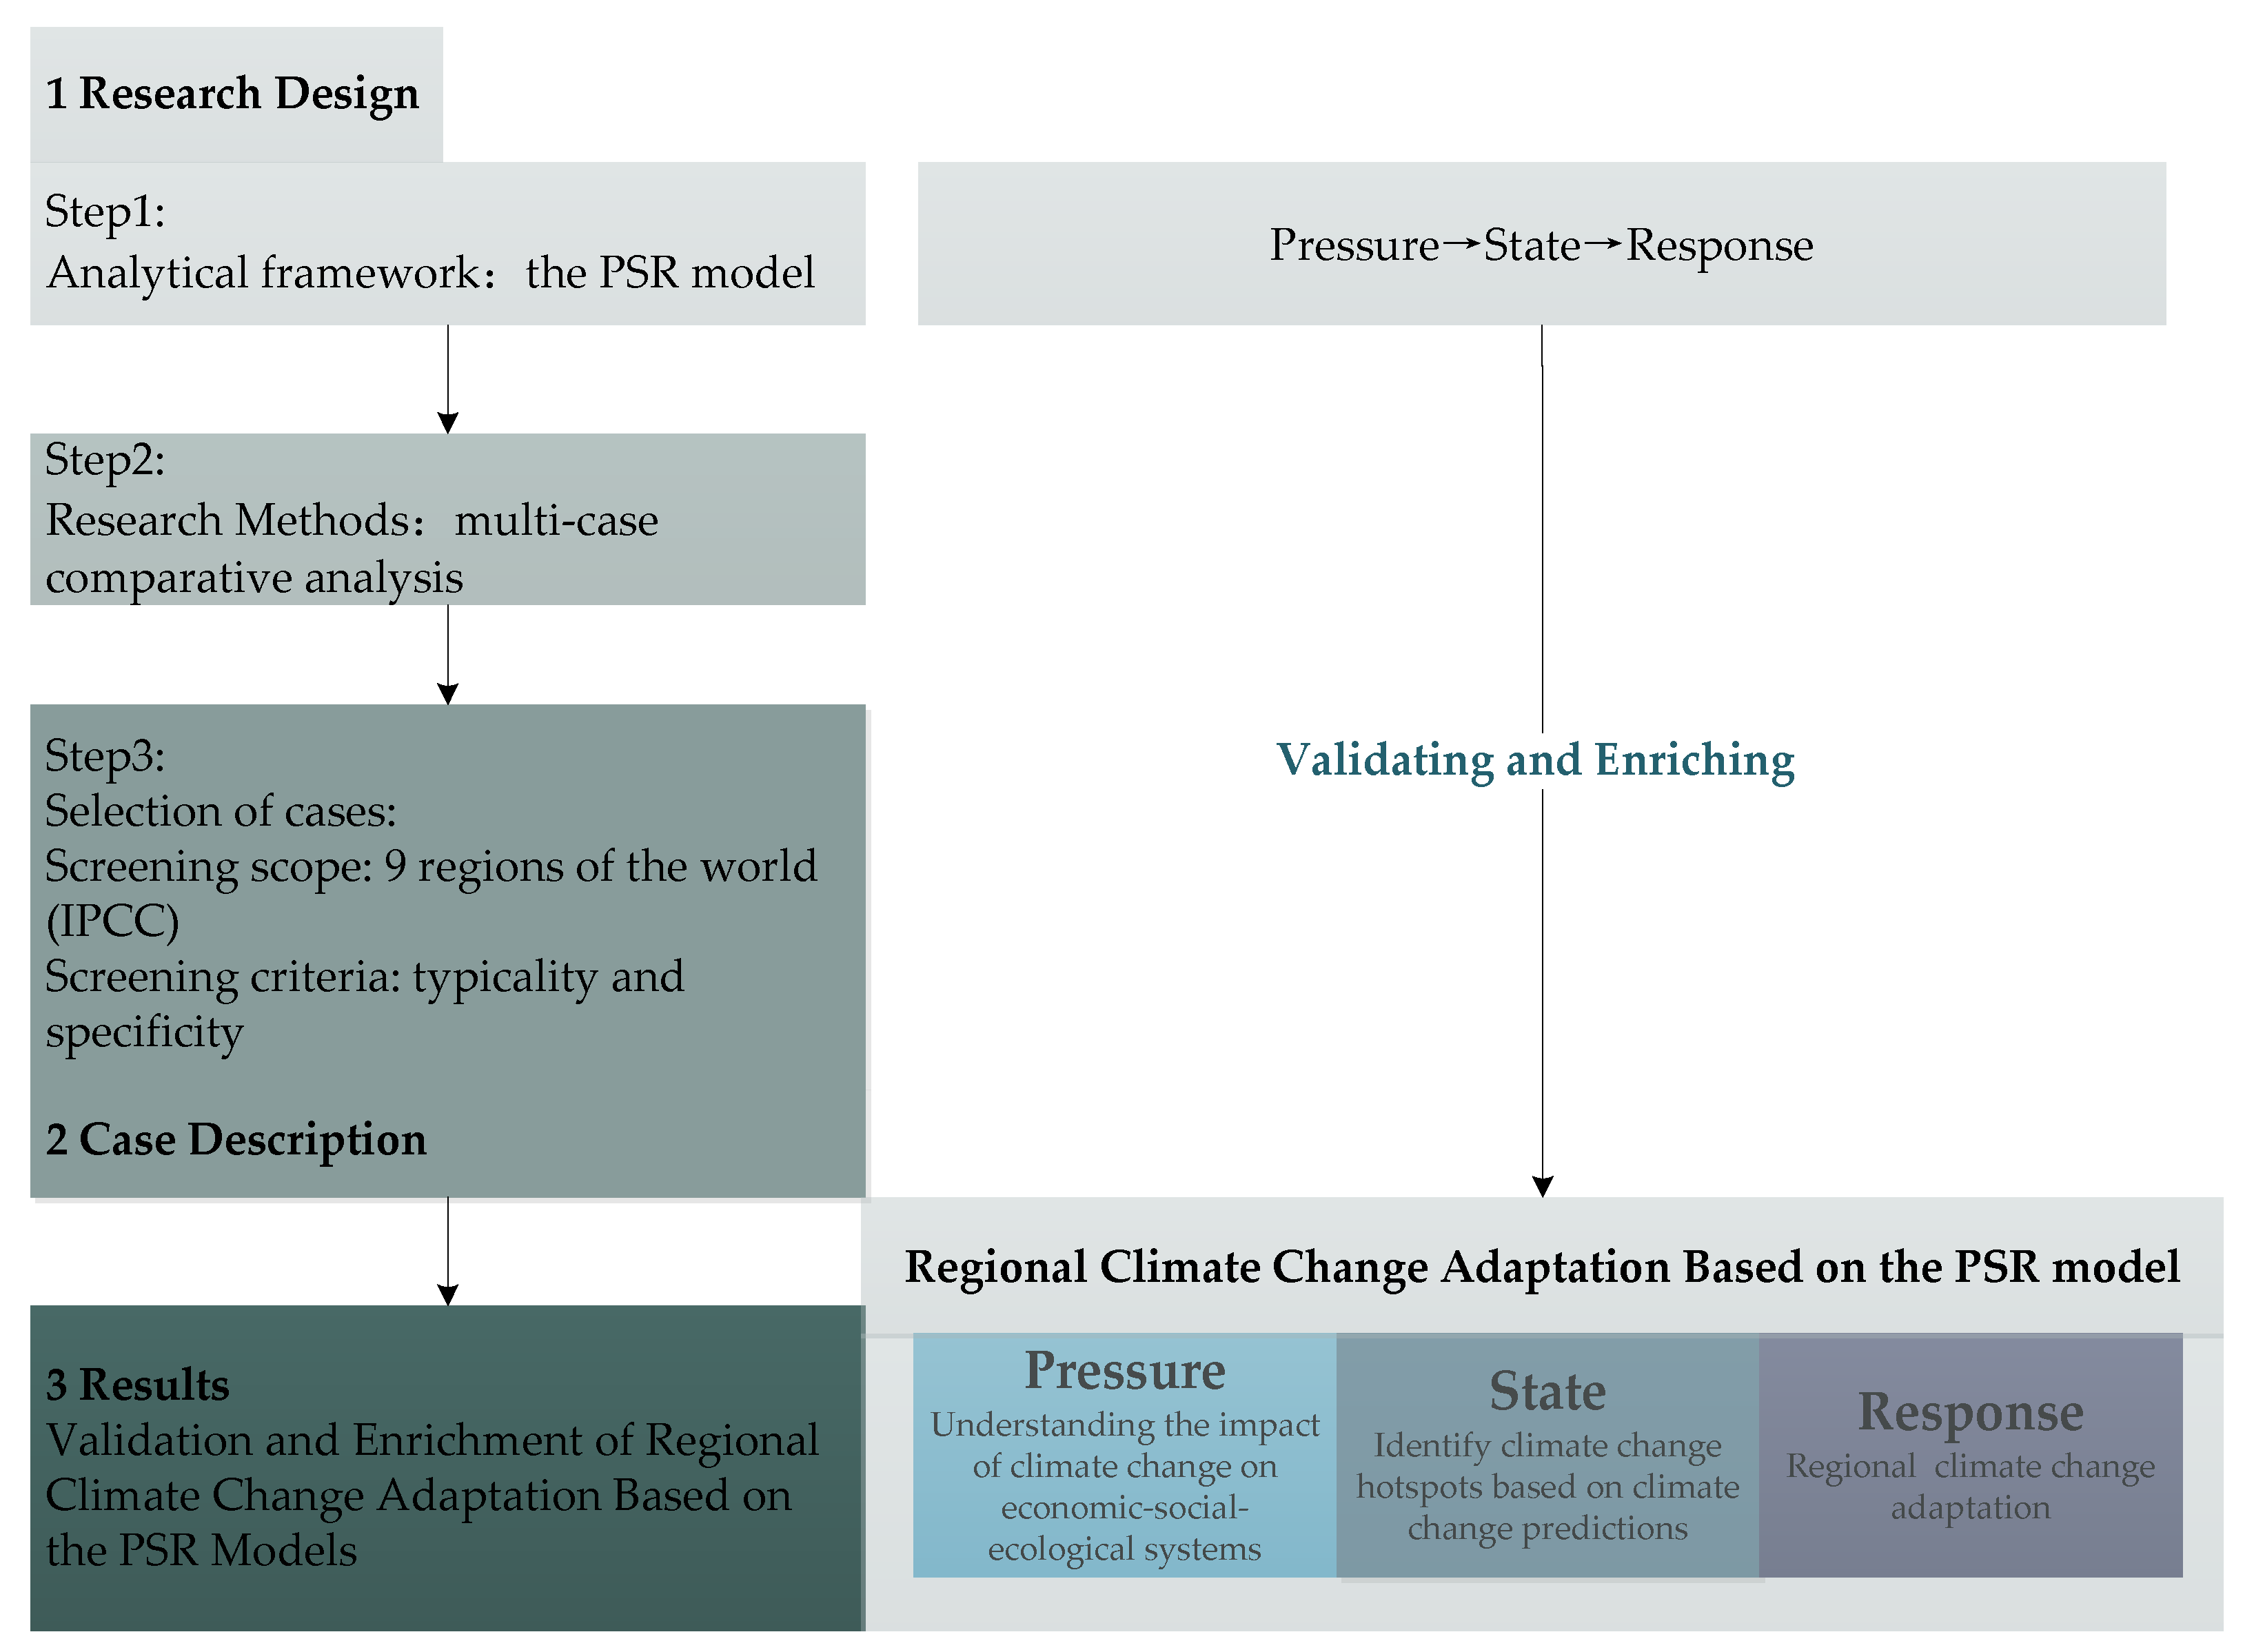
2. Research Design
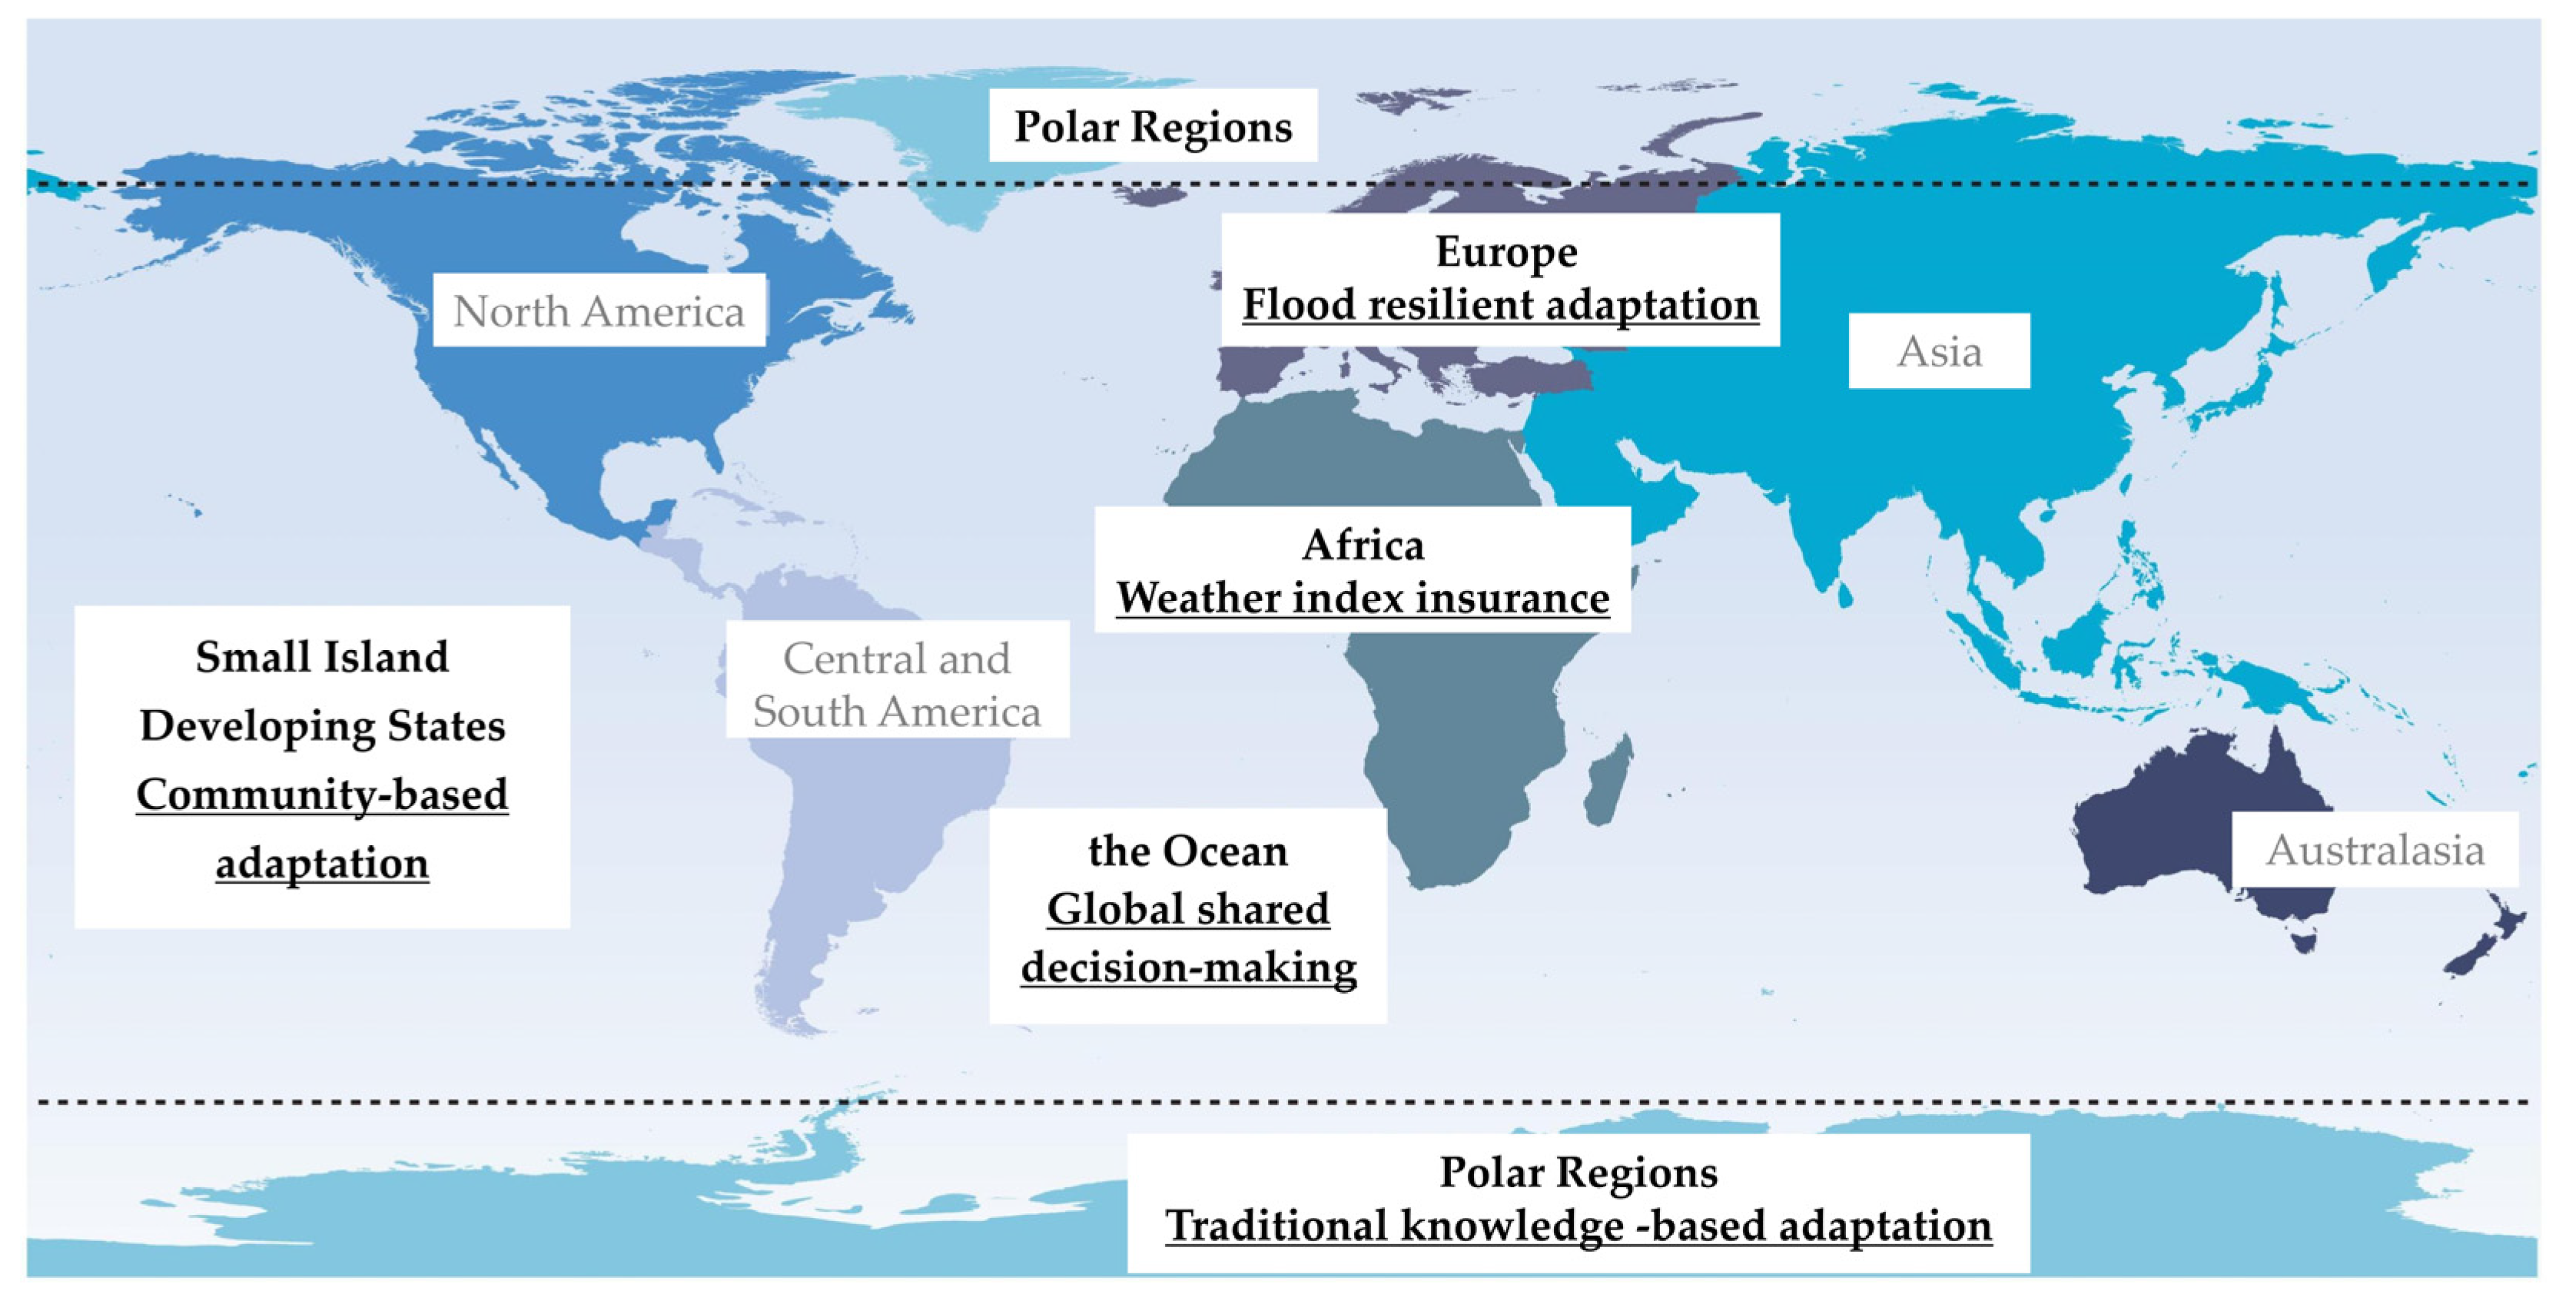
3. Case Description
3.1. Community-Based Adaptation in SIDS
3.2. Enhancing Flood Resilience in Europe
3.3. Promotion of Weather Index Insurance in Africa
3.4. Traditional Knowledge-Based Adaptation in Polar Regions
3.5. Global Shared Decision-Making in the Ocean
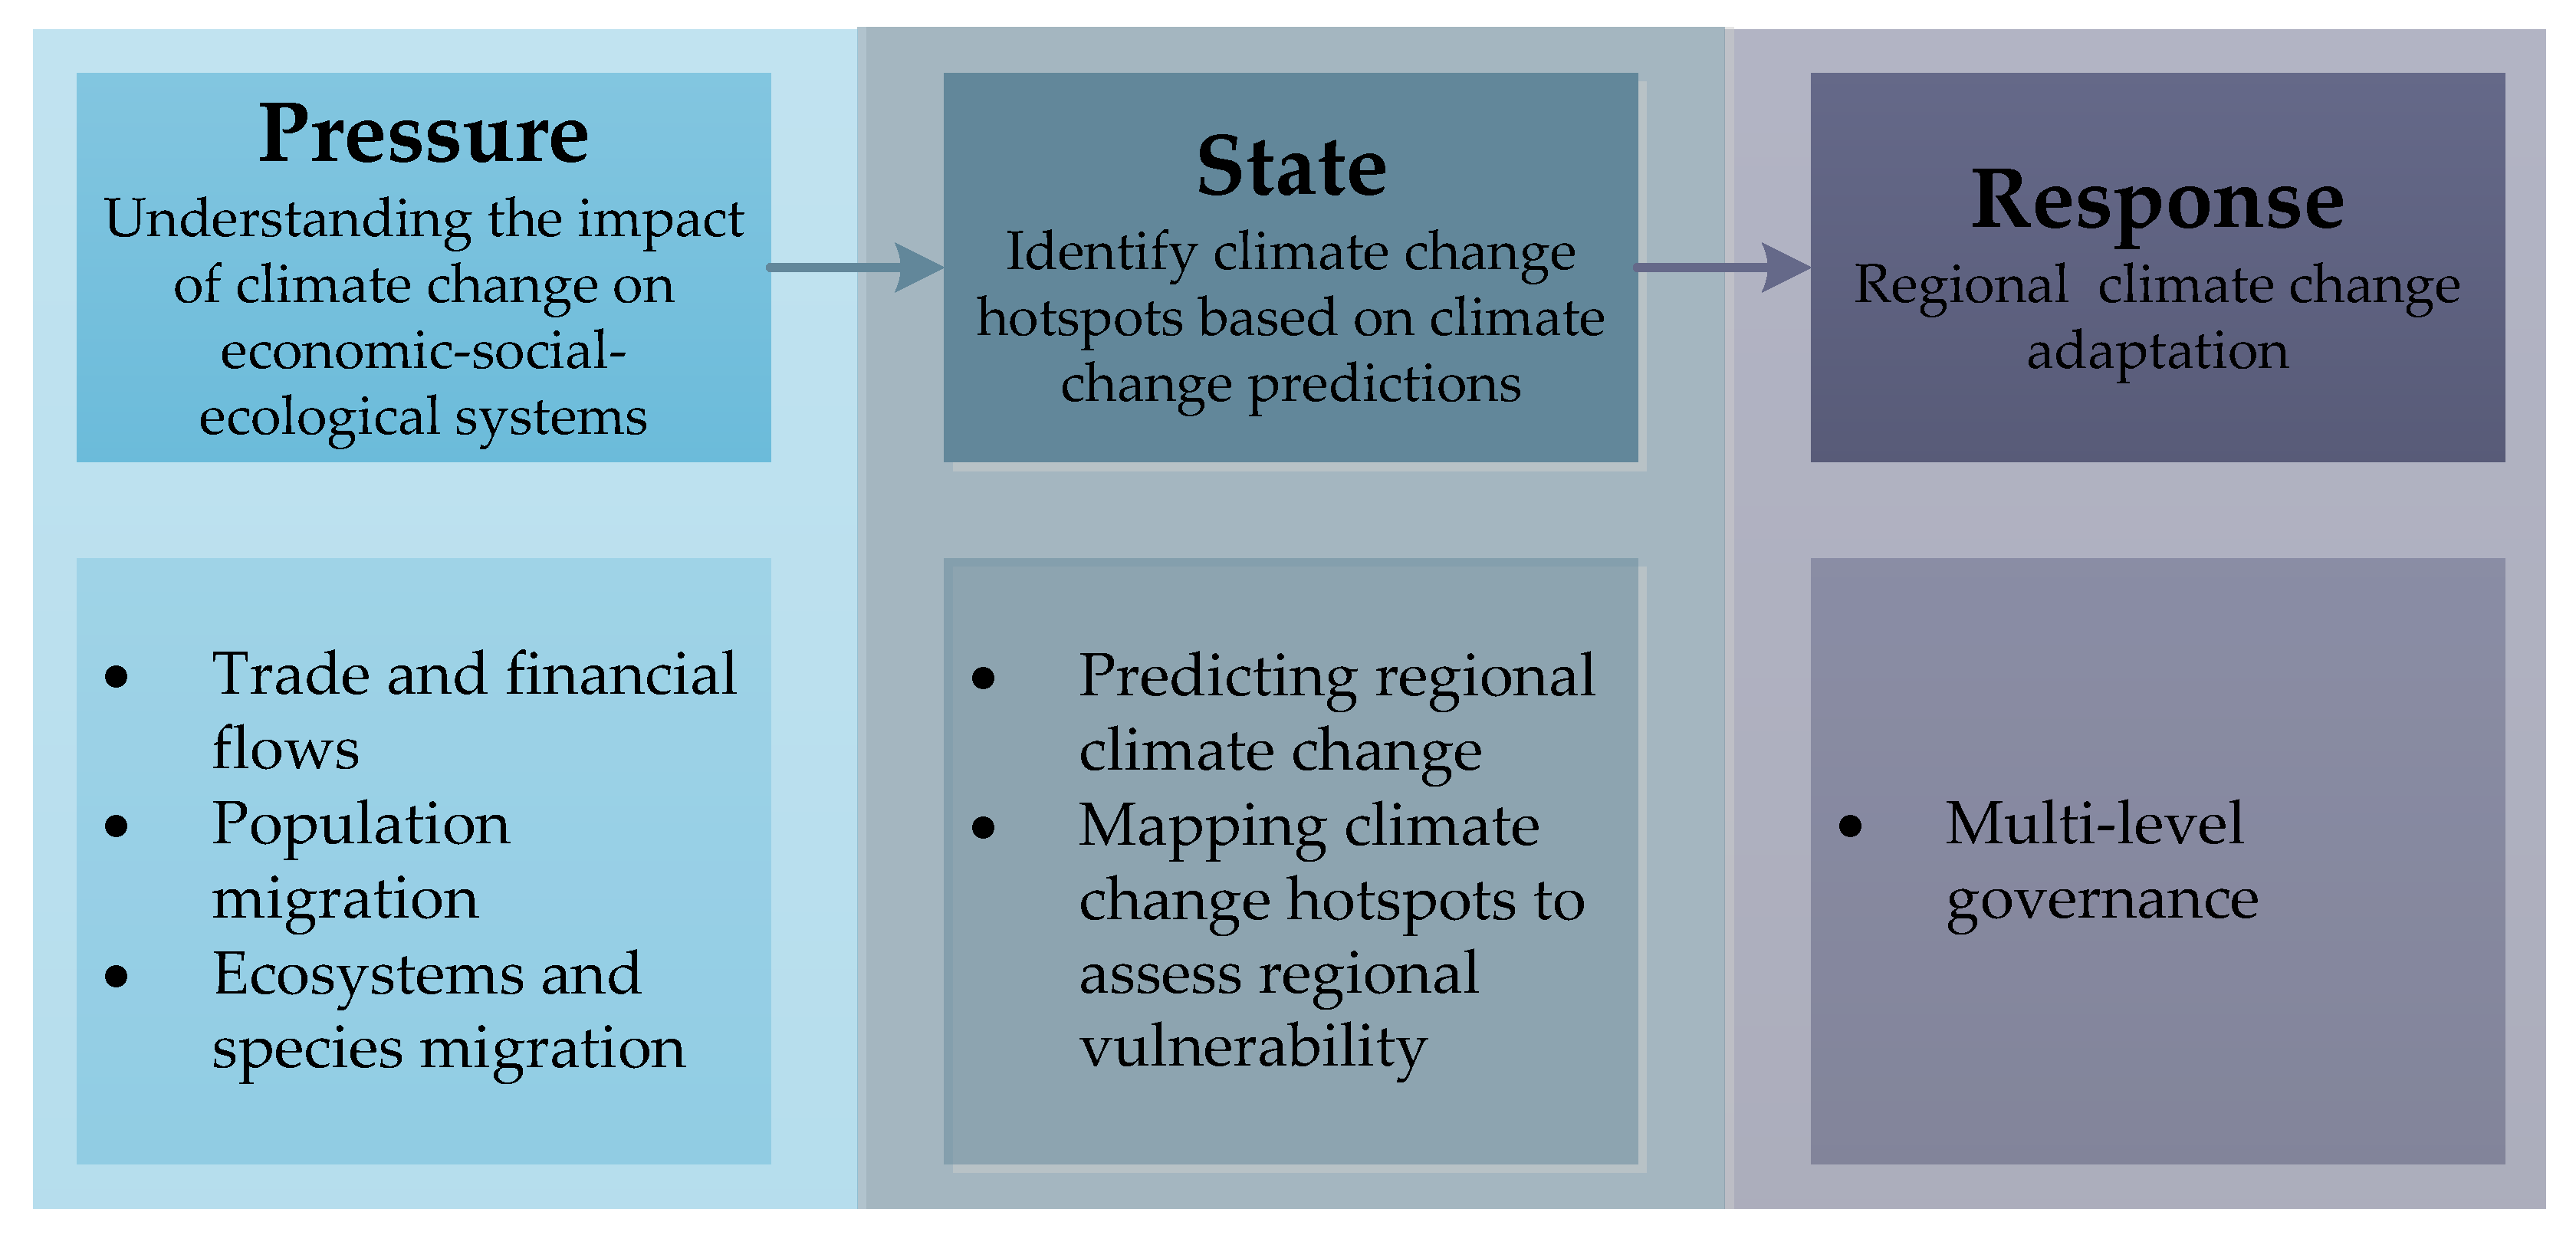
4. Results
4.1. Pressure: Understanding the Impact of Climate Change on Economic–Social–Ecological Systems
4.1.1. Trade and Financial Flows
- Climate change alters trade routes. The IPCC Fifth Assessment Report, which analyzed the impact of climate change on the Arctic sea ice, found that medium icebreakers were able to reach only 36% of the Arctic ice sea area in 1980–1999 and are expected to reach 45% to 48% of the area in 2011–2030, and this increases to 58% to 69% in 2046–2065 [4]. Warming increases the navigable area, and three more routes will be added through the Arctic, which means shorter intercontinental transport distances and lower trade costs compared to the Panama and Suez Canal routes, which is beneficial to the development of international trade [44].
- Climate change changes the investment environment and increases the vulnerability of less developed regions. On the one hand, capital markets take adaptive measures based on risk expectations of adverse climate change, which in turn affects commodity and land lease market prices; less developed regions will face more unfavorable market competition and lack of financial support to cope with climate change as a result. On the other hand, global warming pressures prompt manufacturing industries to shift net emissions from developed to less developed regions, and this regional shift in emissions (i.e., carbon leakage) makes less developed regions more vulnerable [45].
- Extreme weather events expose regional resource development and international trade flows to frequent shocks of uncertainty. The year 2010 saw the worst flooding in 50 years in eastern Australia, which significantly reduced mining operations and damaged transport networks, resulting in a significant drop in coking coal exports [46]. Unfortunately, the intensity and frequency of extreme climate events are expected to increase in the future, enhanced by the use of fossil fuels [47,48].
4.1.2. Population Migration
4.1.3. Ecosystems and Species Migration
4.2. State: Identify Climate Change Hotspots Based on Climate Change Predictions
4.2.1. Predicting Regional Climate Change
4.2.2. Mapping Climate Change Hotspots to Assess Regional Vulnerability
- The different types of climate change hotspot assessments require different climate parameters, which require specialized expertise in data collection and analysis. For example, for agricultural systems, water management, or natural disasters, the most important variables are the anticipated changes at the beginning of the rainy season, rainfall deficits during the growing season, changes in rainfall duration and intensity, changes in drought cycles, and temperature increases above crop-specific thresholds.
- The specificity of the policy audience is troubling. Some regions may use hotspot maps to prioritize plans, but many national policymakers do not trust global/regional mapping efforts because they question the veracity and objectivity of the data unless the data come from their own institutions.
- There are ethical risks associated with hotspot map applications. As more and more money is invested in climate adaptation development, financial incentives drive countries to portray themselves as climate-vulnerable [72], which will affect the objective neutrality of hotspot maps. If donors guide investments accordingly, poorly governed countries may be identified as the most vulnerable and thus receive funding support.
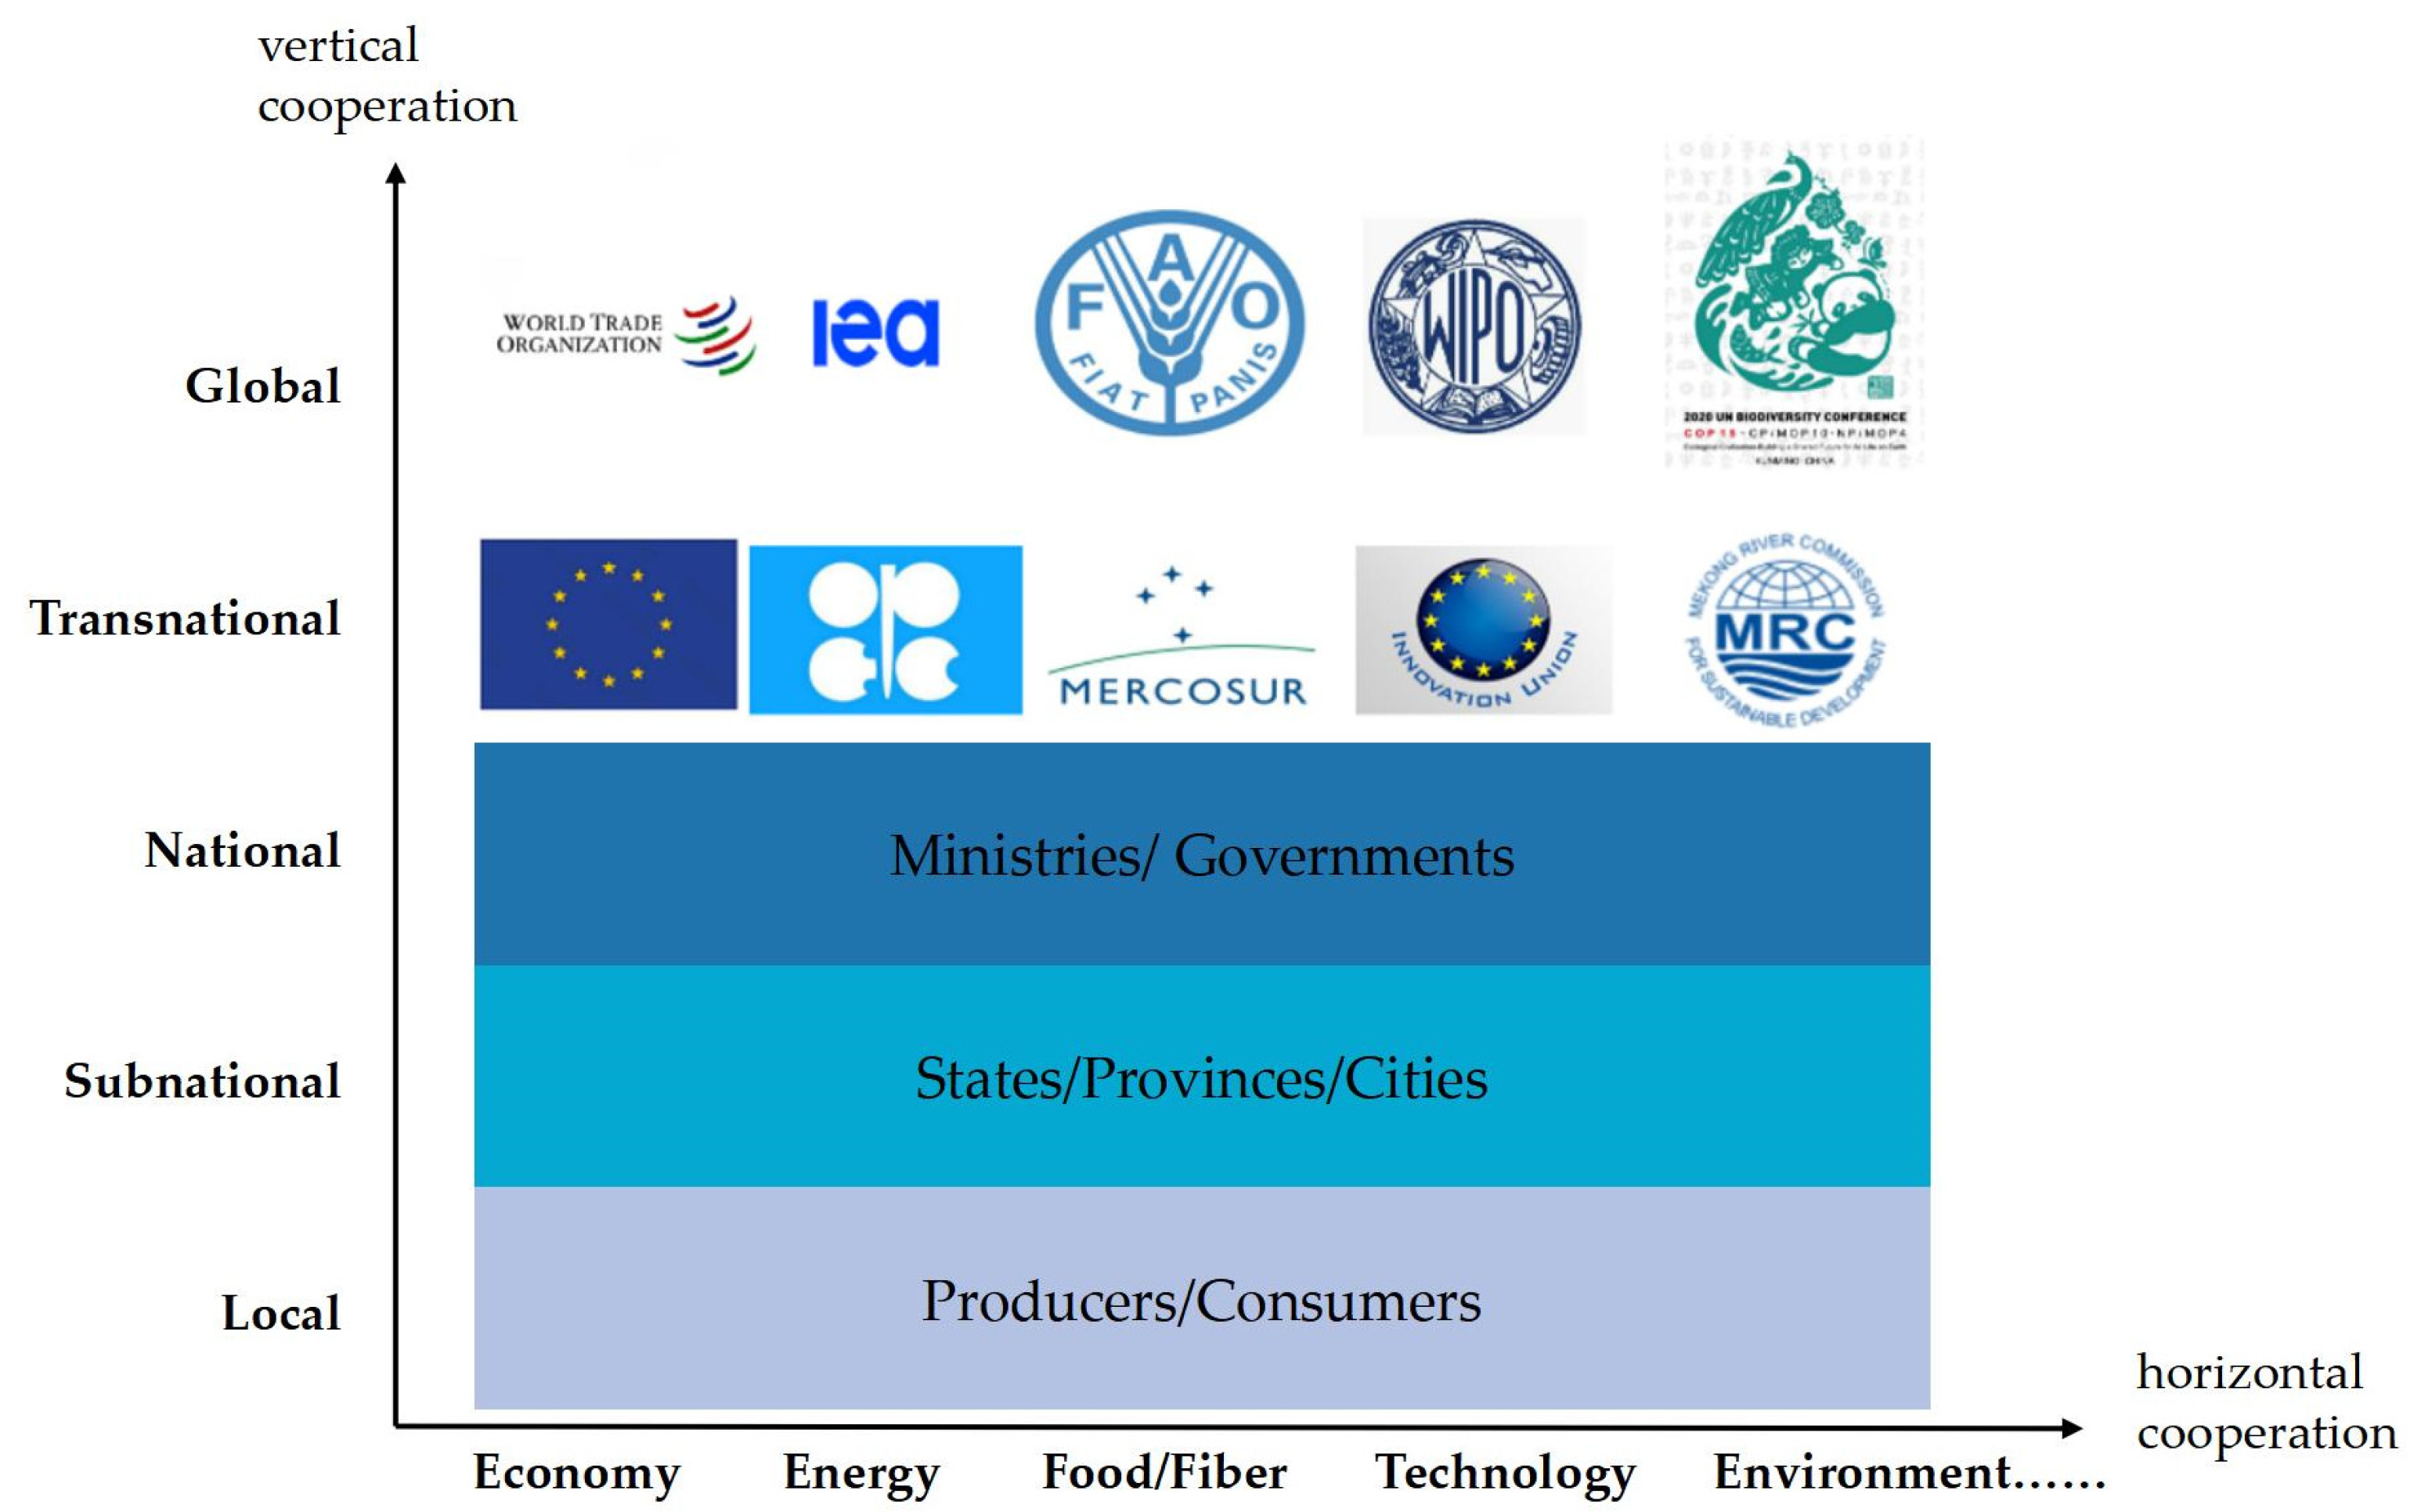
4.3. Response: Multi-Level Governance
5. Conclusions and Prospect
5.1. Conclusions and Limitations
- Climate change at different scales has profound and irreversible impacts on regional economies, politics, ecology, and societies. Regional climate change adaptation varies according to ecological, economic, and social conditions, with SIDS focusing on community-based adaptations, Europe on enhancing flood resilience, Africa promoting weather index insurance, indigenous communities in Polar Regions relying on traditional knowledge to cope with climate change, and the Ocean calling for global decision-making.
- Regional climate change adaptation analysis based on the PSR model framework finds that regional climate change adaptation faces significant pressure from cross-regional flows of finance, population, and species under climate change. Climate change hotspot maps assess the vulnerability of regional climate change adaptation based on climate change projections, and regional climate change adaptation response strategies take advantage of decision-making and implementation through horizontal and vertical cooperation at multiple levels of governance.
- The research process is susceptible to the ideas of the researcher and ignores some important information.
- It is hard to accurately measure the degree of interaction between the elements.
- In terms of the multi-case comparison, while emphasizing typicality and specificity, the cases lack in-depth exploration. In addition, although the cases were chosen to be as representative as possible, the findings are, after all, based on only five typical regions, and whether the conclusions are applicable to climate change adaptation in other regions needs to be further verified by more studies.
5.2. Prospect
- Regional cooperation on climate change adaptation faces international and domestic challenges of climate justice and equal development. As the hardest hit by exposure to climate change risks, less developed regions lack adequate financing for climate change adaptation and are in urgent need of official assistance from developed regions. From the perspective of the international community, the principle of Common But Different Responsibility (CBDR), which requires developed countries to provide official assistance to developing countries for climate adaptation funding, has been widely recognized but not practiced. For example, the 2009 Copenhagen Climate Conference produced a draft agreement that called for developed countries to provide at least USD 100 billion in annual financial support to developing countries by 2020. However, according to the aid information provided by the UNFCCC secretariat, Japan provided JPY 1.3 trillion (about USD 10.5 billion), and France provided EUR 5 billion (about USD 5.4 billion) per year until 2020 [79]. The huge financial gap seriously affects developing countries’ adaptation to climate change, so there is an urgent need to advocate for a basic consensus on climate justice to be formed and practiced globally in the future.
- In terms of optimizing regional climate change adaptation pathways, future regional climate projections need to further understand ocean–atmosphere–land interactions to enable the reduction of atmospheric circulation uncertainties [59]. Climate change hotspot maps emphasize objectivity and focus on their role in political discourse and guidance for policy-making; regional multi-level governance pays more attention to building trust and making political commitment among leaders, providing adequate financial resources, enhancing institutional implementation capacity, promoting the participation of the private sector and civil society organizations, and strengthening policy dialogue in key sectors [80].
- The method of starting from regional climate change adaptation pathways, combining their own characteristics, and taking typical regional adaptation actions as references has a strong significance for countries globally to adapt to climate change. For example, community-based adaptation in SIDS can be an inspiration for policy formulation in coastal areas to adapt to sea level rise and typhoons; Europe’s resilience to floods can be a reference for regions prone to flash floods; the promotion of weather index insurance in Africa is also an important way for agriculture to adapt to climate change; and the experience of Arctic indigenous communities in relying on traditional knowledge to adapt to climate change illustrates the important role of traditional knowledge and values in climate adaptation. The ocean region’s call for global shared decision-making could provide a model for climate adaptation in other areas where international cooperation is urgently needed.
Author Contributions
Funding
Data Availability Statement
Conflicts of Interest
References
- Hawkins, E.; Ortega, P.; Suckling, E.; Schurer, A.; Hegerl, G.; Jones, P.; Joshi, M.; Osborn, T.J.; Masson-Delmotte, V.; Mignot, J.; et al. Estimating Changes in Global Temperature since the Preindustrial Period. Bull. Am. Meteorol. Soc. 2017, 98, 1841–1856. [Google Scholar] [CrossRef]
- Comyn-Platt, E.; Hayman, G.; Huntingford, C.; Chadburn, S.E.; Burke, E.J.; Harper, A.B.; Collins, W.J.; Webber, C.P.; Powell, T.; Cox, P.M.; et al. Carbon Budgets for 1.5 and 2 °C Targets Lowered by Natural Wetland and Permafrost Feedbacks. Nat. Geosci. 2018, 11, 568–573. [Google Scholar] [CrossRef] [Green Version]
- Steffen, W.; Rockström, J.; Richardson, K.; Lenton, T.M.; Folke, C.; Liverman, D.; Summerhayes, C.P.; Barnosky, A.D.; Cornell, S.E.; Crucifix, M.; et al. Trajectories of the Earth System in the Anthropocene. Proc. Natl. Acad. Sci. USA 2018, 115, 8252–8259. [Google Scholar] [CrossRef] [PubMed] [Green Version]
- Stocker, T.F.; Qin, D.; Plattner, G.K.; Tignor, M.M.; Allen, S.K.; Boschung, J.; Nauels, A.; Xia, Y.; Bex, V.; Midgley, P.M. IPCC, 2013: Climate Change 2013: The Physical Science Basis. Contribution of Working Group I to the Fifth Assessment Report of the Intergovernmental Panel on Climate Change; Cambridge University Press: Cambridge, UK; New York, NY, USA, 2014; ISBN 978-1-107-41532-4. [Google Scholar]
- Bronselaer, B.; Zanna, L.; Munday, D.R.; Lowe, J. Southern Ocean Carbon-Wind Stress Feedback. Clim. Dyn. 2018, 51, 2743–2757. [Google Scholar] [CrossRef] [Green Version]
- Betsill, M.M. Regional Governance of Global Climate Change: The North American Commission for Environmental Cooperation. Glob. Environ. Politics 2007, 7, 11–27. [Google Scholar] [CrossRef]
- Krahmann, E. National, Regional, and Global Governance: One Phenomenon or Many? Glob. Gov. 2003, 9, 323–346. [Google Scholar] [CrossRef]
- Chinese Vice Premier Han Zheng Attends the First Climate Adaptation Summit and Delivers a Speech. Available online: http://www.mofcom.gov.cn/article/i/jyjl/j/202101/20210103034057.shtml (accessed on 6 July 2023).
- Sun, J.Q.; Ma, J.H.; Chen, H.P.; Wang, J.; Yu, E.T.; Tian, B.Q. Application of downscaling method to climate prediction in East Asia. Chin. J. Atmos. Sci. 2018, 42, 806–822. [Google Scholar] [CrossRef]
- Elahi, E.; Khalid, Z. Estimating Smart Energy Inputs Packages Using Hybrid Optimisation Technique to Mitigate Environmental Emissions of Commercial Fish Farms. Appl. Energy 2022, 326, 119602. [Google Scholar] [CrossRef]
- Elahi, E.; Khalid, Z.; Zhang, Z. Understanding Farmers’ Intention and Willingness to Install Renewable Energy Technology: A Solution to Reduce the Environmental Emissions of Agriculture. Appl. Energy 2022, 309, 118459. [Google Scholar] [CrossRef]
- Elahi, E.; Khalid, Z.; Tauni, M.Z.; Zhang, H.; Lirong, X. Extreme Weather Events Risk to Crop-Production and the Adaptation of Innovative Management Strategies to Mitigate the Risk: A Retrospective Survey of Rural Punjab, Pakistan. Technovation 2022, 117, 102255. [Google Scholar] [CrossRef]
- Wang, Y.; Ma, S. Technology selection of regional agricultural adaptation to climate change in China. Chin. J. Arometeorol. 2009, 30, 51–56. [Google Scholar]
- Liu, X.F.; Qu, J.S.; Liu, L.N.; Li, H.J.; Pei, H.J.; Zeng, J.J. Assessment of urban adaptation to climate change in western China. Ecol. Econ. 2019, 35, 104–110. [Google Scholar]
- Zeng, J.J.; Qu, J.S. European Union climate change adaptation policy actions and their implications. World Reg. Stud. 2013, 22, 117–126. [Google Scholar]
- OECD. Framework of OECD Work on Environmental Data and Indicators. In Environment at a Glance 2013; Environment at a Glance; OECD: Paris, France, 2013; pp. 9–10. ISBN 978-92-64-18140-3. [Google Scholar]
- Mao, J.Y.; Chen, C. Theoretical Construction of Case Studies: Eisenhart’s New Insights: A Review of the 10th “China Enterprise Management Case and Qualitative Research Forum (2016)”. J. Manag. World 2017, 2, 135–141. [Google Scholar] [CrossRef]
- Tidström, A.; Rajala, A. Coopetition Strategy as Interrelated Praxis and Practices on Multiple Levels. Ind. Mark. Manag. 2016, 58, 35–44. [Google Scholar] [CrossRef]
- Global Islands Network International Links Directory. Available online: http://www.globalislands.net/links/international/international.php (accessed on 6 July 2023).
- Hernández-Delgado, E.A. The Emerging Threats of Climate Change on Tropical Coastal Ecosystem Services, Public Health, Local Economies and Livelihood Sustainability of Small Islands: Cumulative Impacts and Synergies. Mar. Pollut. Bull. 2015, 101, 5–28. [Google Scholar] [CrossRef] [PubMed] [Green Version]
- Jamero, M.L.; Onuki, M.; Esteban, M.; Chadwick, C.; Tan, N.; Valenzuela, V.P.; Crichton, R.; Avelino, J.E. In-Situ Adaptation against Climate Change Can Enable Relocation of Impoverished Small Islands. Mar. Policy 2019, 108, 103614. [Google Scholar] [CrossRef]
- Lauer, M.; Albert, S.; Aswani, S.; Halpern, B.S.; Campanella, L.; La Rose, D. Globalization, Pacific Islands, and the Paradox of Resilience. Glob. Environ. Chang. 2013, 23, 40–50. [Google Scholar] [CrossRef]
- McMillen, H.L.; Ticktin, T.; Friedlander, A.; Jupiter, S.D.; Thaman, R.; Campbell, J.; Veitayaki, J.; Giambelluca, T.; Nihmei, S.; Rupeni, E.; et al. Small Islands, Valuable Insights: Systems of Customary Resource Use and Resilience to Climate Change in the Pacific. Ecol. Soc. 2014, 19, art44. [Google Scholar] [CrossRef]
- Alfieri, L.; Dottori, F.; Betts, R.; Salamon, P.; Feyen, L. Multi-Model Projections of River Flood Risk in Europe under Global Warming. Climate 2018, 6, 6. [Google Scholar] [CrossRef] [Green Version]
- Haer, T.; Husby, T.G.; Botzen, W.J.W.; Aerts, J.C.J.H. The Safe Development Paradox: An Agent-Based Model for Flood Risk under Climate Change in the European Union. Glob. Environ. Chang. 2020, 60, 102009. [Google Scholar] [CrossRef]
- Kundzewicz, Z.W.; Lugeri, N.; Dankers, R.; Hirabayashi, Y.; Döll, P.; Pińskwar, I.; Dysarz, T.; Hochrainer, S.; Matczak, P. Assessing River Flood Risk and Adaptation in Europe—Review of Projections for the Future. Mitig. Adapt. Strat. Glob. Chang. 2010, 15, 641–656. [Google Scholar] [CrossRef]
- Paprotny, D.; Sebastian, A.; Morales-Nápoles, O.; Jonkman, S.N. Trends in Flood Losses in Europe over the Past 150 Years. Nat. Commun. 2018, 9, 1985. [Google Scholar] [CrossRef] [PubMed] [Green Version]
- Bubeck, P.; Kreibich, H.; Penning-Rowsell, E.C.; Botzen, W.J.W.; De Moel, H.; Klijn, F. Explaining Differences in Flood Management Approaches in Europe and in the USA—A Comparative Analysis: Differences in Flood Management Approaches. J. Flood Risk Manag. 2017, 10, 436–445. [Google Scholar] [CrossRef]
- Driessen, P.; Hegger, D.; Kundzewicz, Z.; Van Rijswick, H.; Crabbé, A.; Larrue, C.; Matczak, P.; Pettersson, M.; Priest, S.; Suykens, C.; et al. Governance Strategies for Improving Flood Resilience in the Face of Climate Change. Water 2018, 10, 1595. [Google Scholar] [CrossRef] [Green Version]
- Alfieri, L.; Feyen, L.; Di Baldassarre, G. Increasing Flood Risk under Climate Change: A Pan-European Assessment of the Benefits of Four Adaptation Strategies. Clim. Chang. 2016, 136, 507–521. [Google Scholar] [CrossRef] [Green Version]
- Carter, M.R.; de Janvry, A.; Sadoulet, E.; Sarris, A. Index-Based Weather Insurance for Developing Countries: A Review of Evidence and a Set of Propositions for Up-Scaling; FERDI Working Papers; FERDI: London, UK, 2014. [Google Scholar]
- Fonta, W.M.; Sanfo, S.; Kedir, A.M.; Thiam, D.R. Estimating Farmers’ Willingness to Pay for Weather Index-Based Crop Insurance Uptake in West Africa: Insight from a Pilot Initiative in Southwestern Burkina Faso. Agric. Econ. 2018, 6, 11. [Google Scholar] [CrossRef]
- Tadesse, M.A.; Shiferaw, B.A.; Erenstein, O. Weather Index Insurance for Managing Drought Risk in Smallholder Agriculture: Lessons and Policy Implications for Sub-Saharan Africa. Agric. Econ. 2015, 3, 26. [Google Scholar] [CrossRef] [Green Version]
- Greatrex, H.; Hansen, J.; Garvin, S.; Diro, R.; Blakeley, S.; Guen, M.L.; Rao, K.; Osgood, D. Scaling up Index Insurance for Smallholder Farmers; Consortium of International Agricultural Research Centers (CGIAR): Nairobi, Kenya, 2015. [Google Scholar]
- Stepien, A.; Koivurova, T.; Gremsperger, A.; Niemi, H. Arctic Indigenous Peoples and the Challenge of Climate Change. In Arctic Marine Governance; Tedsen, E., Cavalieri, S., Kraemer, R.A., Eds.; Springer: Berlin/Heidelberg, Germany, 2014; pp. 71–99. ISBN 978-3-642-38594-0. [Google Scholar]
- Cochran, P.; Huntington, O.H.; Pungowiyi, C.; Tom, S.; Chapin, F.S.; Huntington, H.P.; Maynard, N.G.; Trainor, S.F. Indigenous Frameworks for Observing and Responding to Climate Change in Alaska. Clim. Chang. 2013, 120, 557–567. [Google Scholar] [CrossRef]
- Voggesser, G.; Lynn, K.; Daigle, J.; Lake, F.K.; Ranco, D. Cultural Impacts to Tribes from Climate Change Influences on Forests. Clim. Chang. 2013, 120, 615–626. [Google Scholar] [CrossRef]
- Laidler, G.J.; Hirose, T.; Kapfer, M.; Ikummaq, T.; Joamie, E.; Elee, P. Evaluating the Floe Edge Service: How Well Can SAR Imagery Address Inuit Community Concerns around Sea Ice Change and Travel Safety?: Evaluating the Floe Edge Service. Can. Geogr. Le Géographe Can. 2011, 55, 91–107. [Google Scholar] [CrossRef]
- Ford, J.D.; Smit, B.; Wandel, J.; Allurut, M.; Shappa, K.; Ittusarjuat, H.; Qrunnut, K. Climate Change in the Arctic: Current and Future Vulnerability in Two Inuit Communities in Canada. Geogr. J. 2008, 174, 45–62. [Google Scholar] [CrossRef]
- Cheng, L.; Zhu, J.; Abraham, J.; Trenberth, K.E.; Fasullo, J.T.; Zhang, B.; Yu, F.; Wan, L.; Chen, X.; Song, X. 2018 Continues Record Global Ocean Warming. Adv. Atmos. Sci. 2019, 36, 249–252. [Google Scholar] [CrossRef] [Green Version]
- Fischer, A.S.; Hall, J.; Harrison, D.E.; Stammer, D. OceanObs’09 Conference Summary. In Proceedings of the OceanObs’09: Sustained Ocean Observations and Information for Society, Venice, Italy, 21–25 September 2009; European Space Agency: Paris, France, 2010. [Google Scholar]
- Warner, E.R.; Schofield, C. Climate change and the oceans, (gauging the legal and policy currents in the Asia Pacific and beyond). Energy Environ. 2013, 24, 1193–1199. [Google Scholar]
- Mahon, R.; Fanning, L. Regional Ocean Governance: Polycentric Arrangements and Their Role in Global Ocean Governance. Mar. Policy 2019, 107, 103590. [Google Scholar] [CrossRef]
- Stephenson, S.R.; Smith, L.C.; Agnew, J.A. Divergent Long-Term Trajectories of Human Access to the Arctic. Nat. Clim. Chang. 2011, 1, 156–160. [Google Scholar] [CrossRef]
- Metz, B.; Intergovernmental Panel on Climate Change (Eds.) Climate Change 2007: Mitigation of Climate Change: Contribution of Working Group III to the Fourth Assessment Report of the Intergovernmental Panel on Climate Change; Cambridge University Press: Cambridge, UK; New York, NY, USA, 2007; ISBN 978-0-521-88011-4.
- Australian Floods Sweep of Coking Coal Exports. Available online: http://epaper.gmw.cn/gmrb/html/2011-01/06/nw.D110000gmrb_20110106_8-08.htm?div=-1 (accessed on 6 July 2023).
- Abbas, A.; Waseem, M.; Ullah, W.; Zhao, C.; Zhu, J. Spatiotemporal Analysis of Meteorological and Hydrological Droughts and Their Propagations. Water 2021, 13, 2237. [Google Scholar] [CrossRef]
- Abbas, A.; Ullah, S.; Ullah, W.; Waseem, M.; Dou, X.; Zhao, C.; Karim, A.; Zhu, J.; Hagan, D.F.T.; Bhatti, A.S.; et al. Evaluation and Projection of Precipitation in Pakistan Using the Coupled Model Intercomparison Project Phase 6 Model Simulations. Int. J. Climatol. 2022, 42, 6665–6684. [Google Scholar] [CrossRef]
- Field, C.B.; Barros, V.; Stocker, T.F.; Dahe, Q. (Eds.) Managing the Risks of Extreme Events and Disasters to Advance Climate Change Adaptation: Special Report of the Intergovernmental Panel on Climate Change, 1st ed.; Cambridge University Press: Cambridge, UK, 2012; ISBN 978-1-107-02506-6. [Google Scholar]
- Luetz, J. Climate Change and Migration in the Maldives: Some Lessons for Policy Makers. In Climate Change Adaptation in Pacific Countries: Fostering Resilience and Improving the Quality of Life; Leal Filho, W., Ed.; Climate Change Management; Springer International Publishing: Cham, Switzerland, 2017; pp. 35–69. ISBN 978-3-319-50094-2. [Google Scholar]
- Droubi, A. Climate Change, Water and the Policy-Making Process in the Levant and North Africa; The Syria Case English Summary; American University of Beirut: Beirut, Lebanon, 2009. [Google Scholar]
- Laczko, F.; Aghazarm, C.; International Organization for Migration (Eds.) Migration, Environment and Climate Change: Assessing the Evidence; Organization for Migration: Geneva, Switzerland, 2009; ISBN 978-92-9068-454-1. [Google Scholar]
- McCarthy, J.J.; Intergovernmental Panel on Climate Change (Eds.) Climate Change 2001: Impacts, Adaptation, and Vulnerability: Contribution of Working Group II to the Third Assessment Report of the Intergovernmental Panel on Climate Change; Cambridge University Press: Cambridge, UK; New York, NY, USA, 2001; ISBN 978-0-521-80768-5.
- Li, D.; Wu, S.; Liu, L.; Zhang, Y.; Li, S. Vulnerability of the Global Terrestrial Ecosystems to Climate Change. Glob Chang. Biol. 2018, 24, 4095–4106. [Google Scholar] [CrossRef]
- Cox, P.M.; Betts, R.A.; Jones, C.D.; Spall, S.A.; Totterdell, I.J. Acceleration of Global Warming Due to Carbon-Cycle Feedbacks in a Coupled Climate Model. Nature 2000, 408, 184–187. [Google Scholar] [CrossRef] [PubMed]
- Rosenzweig, C.; Karoly, D.; Vicarelli, M.; Neofotis, P.; Wu, Q.; Casassa, G.; Menzel, A.; Root, T.L.; Estrella, N.; Seguin, B.; et al. Attributing Physical and Biological Impacts to Anthropogenic Climate Change. Nature 2008, 453, 353–357. [Google Scholar] [CrossRef]
- Parmesan, C.; Duarte, C.; Poloczanska, E.; Richardson, A.J.; Singer, M.C. Overstretching Attribution. Nat. Clim Chang. 2011, 1, 2–4. [Google Scholar] [CrossRef]
- Liu, H.B.; Zhang, D.L.; Wang, B. Regional climate modeling and its application. Clim. Environ. Res. 2006, 11, 649–668. [Google Scholar]
- Xie, S.-P.; Deser, C.; Vecchi, G.A.; Collins, M.; Delworth, T.L.; Hall, A.; Hawkins, E.; Johnson, N.C.; Cassou, C.; Giannini, A.; et al. Towards Predictive Understanding of Regional Climate Change. Nat. Clim. Chang. 2015, 5, 921–930. [Google Scholar] [CrossRef]
- Jing, C.; Tao, H.; Wang, Y.J.; Su, B.D.; Huang, J.L.; Jiang, T. Prediction of extreme precipitation events in China based on regional climate model CCLM. J. Nat. Resour. 2017, 32, 266–277. [Google Scholar] [CrossRef]
- Liu, G.Z.; Liang, X.Z. Application progress of the new generation regional climate model (CWRF) in China. Adv. Earth Sci. 2017, 32, 781–787. [Google Scholar] [CrossRef]
- Zhu, H.W.; Yang, S.; Zhao, X.Z.; Xiong, Y.C.; Wang, S.M.; Zhang, X. Research progress on statistical down scaling of regional climate change. Acta Ecol. Sin. 2011, 31, 2602–2609. [Google Scholar]
- De Sherbinin, A. Climate Change Hotspots Mapping: What Have We Learned? Clim. Chang. 2014, 123, 23–37. [Google Scholar] [CrossRef] [Green Version]
- Ho, H.; Knudby, A.; Huang, W. A Spatial Framework to Map Heat Health Risks at Multiple Scales. IJERPH 2015, 12, 16110–16123. [Google Scholar] [CrossRef] [Green Version]
- Trew, B.T.; Maclean, I.M.D. Vulnerability of Global Biodiversity Hotspots to Climate Change. Glob. Ecol. Biogeogr. 2021, 30, 768–783. [Google Scholar] [CrossRef]
- Leis, J.-L.; Kienberger, S. Climate Risk and Vulnerability Assessment of Floods in Austria: Mapping Homogenous Regions, Hotspots and Typologies. Sustainability 2020, 12, 6458. [Google Scholar] [CrossRef]
- Ericksen, P.; Thornton, P.; Notenbaert, A.; Cramer, L.; Jones, P.; Herrero, M. Mapping Hotspots of Climate Change and Food Insecurity in the Global Tropics; Climate Change, Agriculture and Food Security (CCAFS): Merritt Island, FL, USA, 2011. [Google Scholar]
- Tazzioli, M. Containment through Mobility: Migrants’ Spatial Disobediences and the Reshaping of Control through the Hotspot System. J. Ethn. Migr. Stud. 2018, 44, 2764–2779. [Google Scholar] [CrossRef] [Green Version]
- Dilley, M. Natural Disaster Hotspots: A Global Risk Analysis; Disaster Risk Management Series; World Bank: Washington, DC, USA, 2005; ISBN 978-0-8213-5930-3. [Google Scholar]
- Millennium Ecosystem Assessment (Program) (Ed.) Ecosystems and Human Well-Being: Synthesis; Island Press: Washington, DC, USA, 2005; ISBN 978-1-59726-040-4. [Google Scholar]
- Adger, W.N. Vulnerability. Glob. Environ. Chang. 2006, 16, 268–281. [Google Scholar] [CrossRef]
- Klein, R.J. Identifying Countries That Are Particularly Vulnerable to the Adverse Effects of Climate Change: An Academic or a Political Challenge? Carbon Clim. Law Rev. 2009, 3, 8. [Google Scholar] [CrossRef]
- Organisation for Economic Co-Operation and Development (OECD). Water Governance in OECD Countries: A Multi-Level Approach; IWA Publishing: London, UK, 2013; ISBN 978-1-78040-604-6. [Google Scholar]
- Gordon, D.J. Between Local Innovation and Global Impact: Cities, Networks, and the Governance of Climate Change. Can. Foreign Policy J. 2013, 19, 288–307. [Google Scholar] [CrossRef]
- European Environment Agency. Opportunities and Challenges of European Cities Adapting to Climate Change; China Environment Press: Beijing, China, 2014; ISBN 978-7-5111-1646-8.
- Welle, T.; Birkmann, J. The World Risk Index—An Approach to Assess Risk and Vulnerability on a Global Scale. J. Extrem. Events 2015, 2, 1550003. [Google Scholar] [CrossRef]
- Biermann, F. The Case for a World Environment Organization. Environ. Sci. Policy Sustain. Dev. 2000, 42, 22–31. [Google Scholar] [CrossRef]
- Young, O.R. The Institutional Dimensions of Environmental Change: Fit, Interplay, and Scale; The MIT Press: Cambridge, MA, USA, 2002; ISBN 978-0-262-28657-2. [Google Scholar]
- Paris Agreement Is Close at Hand: The Goal of Cooling Down the Lack of Capital in Developed Countries Is Blocked. Available online: http://dz.jjckb.cn/www/pages/webpage2009/html/2015-12/11/content_13240.htm (accessed on 6 July 2023).
- Özuyar, P.G. Lessons Learned About the Hindering Factors for Regional Cooperation Towards the Mitigation of Climate Change. In Addressing the Challenges in Communicating Climate Change Across Various Audiences; Leal Filho, W., Lackner, B., McGhie, H., Eds.; Climate Change Management; Springer International Publishing: Cham, Switzerland, 2019; pp. 101–114. ISBN 978-3-319-98294-6. [Google Scholar]


Disclaimer/Publisher’s Note: The statements, opinions and data contained in all publications are solely those of the individual author(s) and contributor(s) and not of MDPI and/or the editor(s). MDPI and/or the editor(s) disclaim responsibility for any injury to people or property resulting from any ideas, methods, instructions or products referred to in the content. |
© 2023 by the authors. Licensee MDPI, Basel, Switzerland. This article is an open access article distributed under the terms and conditions of the Creative Commons Attribution (CC BY) license (https://creativecommons.org/licenses/by/4.0/).
Share and Cite
Xu, M.; Li, J.; Luan, S. Regional Climate Change Adaptation Based on the PSR Model—Multi-Case Comparative Analysis on a Global Scale. Climate 2023, 11, 155. https://doi.org/10.3390/cli11070155
Xu M, Li J, Luan S. Regional Climate Change Adaptation Based on the PSR Model—Multi-Case Comparative Analysis on a Global Scale. Climate. 2023; 11(7):155. https://doi.org/10.3390/cli11070155
Chicago/Turabian StyleXu, Mengzhi, Jixia Li, and Shixin Luan. 2023. "Regional Climate Change Adaptation Based on the PSR Model—Multi-Case Comparative Analysis on a Global Scale" Climate 11, no. 7: 155. https://doi.org/10.3390/cli11070155