1. Introduction
During the past few decades, water crises have increased widely in various parts of India [
1,
2]. Water scarcity has escalated to become one of the annual hazards in the majority of the arid and semi-arid regions of the country [
3]. In Northwestern India, the water table is unremittingly declining due to overconsumption of ground water [
4], which is also evident in Maharashtra, where more than a thousand farmers have attempted suicide because of severe agrometeorological drought and unavailability of water in the years 2014–15 [
5]. In general, these hazardous effects due to water deficits have been attributed to the Indian summer monsoon vagaries or some other changing climatic events [
6,
7]. It is also observed that poor management of water resources, anthropogenic activities, and the absence of effective governmental policies hinder the water problems to a major extent [
8,
9].
The semi-arid part of Marathwada is one of the most drought-prone regions of India. In recent years, over the Marathwada region, the increasing severity of droughts and their adverse impacts on socioeconomic conditions have been of major concern [
10]. Due to Marathwada’s physiological state and undulating terrain properties, it has become highly vulnerable to agricultural production and monsoon rainfall. Pulses, wheat, oilseeds, jowar, and bajra, were the major crops over the past decades, which are now replaced with highly water-intensive crops such as cotton, maize/corn, sugarcane, and rice [
11,
12]. Nowadays, it is observed that farmers throughout the region of study prefer to grow easy-to-grow and cash crops, e.g., wheat, rice, corn, soybean, sugarcane, and cotton to increase their income. In the Marathwada region, over the last three decades, ground water withdrawal and drilling for agricultural activities have dried many of the freshwater sources and bore wells [
13]. Many of the villages of Marathwada are now called ‘Tanker villages’ due to the regular water supply by tankers, whereas freshwater politics has also become a critical issue [
9]. Most of the area of Marathwada is under rain-fed agriculture. Therefore, summer monsoon rainfall plays a major role (70 to 80%) in this region’s overall agricultural production and other agroeconomic conditions [
14].
In terms of long-term rainfall trends, a mixed trend in rainfall was noticed by various studies [
15,
16,
17] throughout the country, in which Marathwada has observed a non-significant decreasing rainfall trend (−2.05 mm) since 1981 [
17]. The study carried out by Raghavendra [
18] to understand long-term rainfall trends at smaller spatial scales of the Maharashtra state (after 1901) depicted the decreasing trends in rainfall every month, but these trends were not statistically significant. Some studies reflected this declining rainfall trend as a reason for brutal droughts and its crucial impacts on Marathwada [
3,
19]. On the other hand, some studies also claim that the shift in agricultural practices and poor management of water resources were the main reasons for high water scarcity and farmer suicides during the drought years [
8,
9,
20,
21].
Although 2014–15 was a brutal drought year in Marathwada, the cultivated area was almost 100% of the total normal [
22]. Kulkarni et al. [
8] studied that the aftermath of the water crises of the 2014–15 drought was harsher than the calamitous drought of the year 1972 over Marathwada. They also reported an increase in the total area growing sugarcane in Maharashtra from 1.67 lakh ha in 1970–71 to 10.48 lakh ha in 2014–15.
The studies by Kulkarni et al. [
8] and Bhat and Revi [
9] suggest that climatic variability is not the only reason behind the intensive drought, but the cultivation of high-water-requirement crops, its factory-based post-processing, and depletion of ground water levels also plays a significant role in the enhancement of drought effects. Therefore, the present study sheds light on the climatic and agricultural causes of enhancing the severity of droughts over Marathwada. In this study, we have thoroughly analyzed the various significant roots of drought severities, i.e., the summer monsoon rainfall cycle, ground water levels, and crop yield over the ‘Marathwada’ region of Maharashtra, India. Through this study, for the first time, an attempt is made to correlate anthropological facts and climatic parameters together to analyze the increasing drought severities over the semi-arid regions of India. The current study can be referred to and implemented to come up with the actual reasons for the increasing brutality and effects of drought over the various parts of the drought-prone regions of the world.
2. Methodology
2.1. Study Area and Data
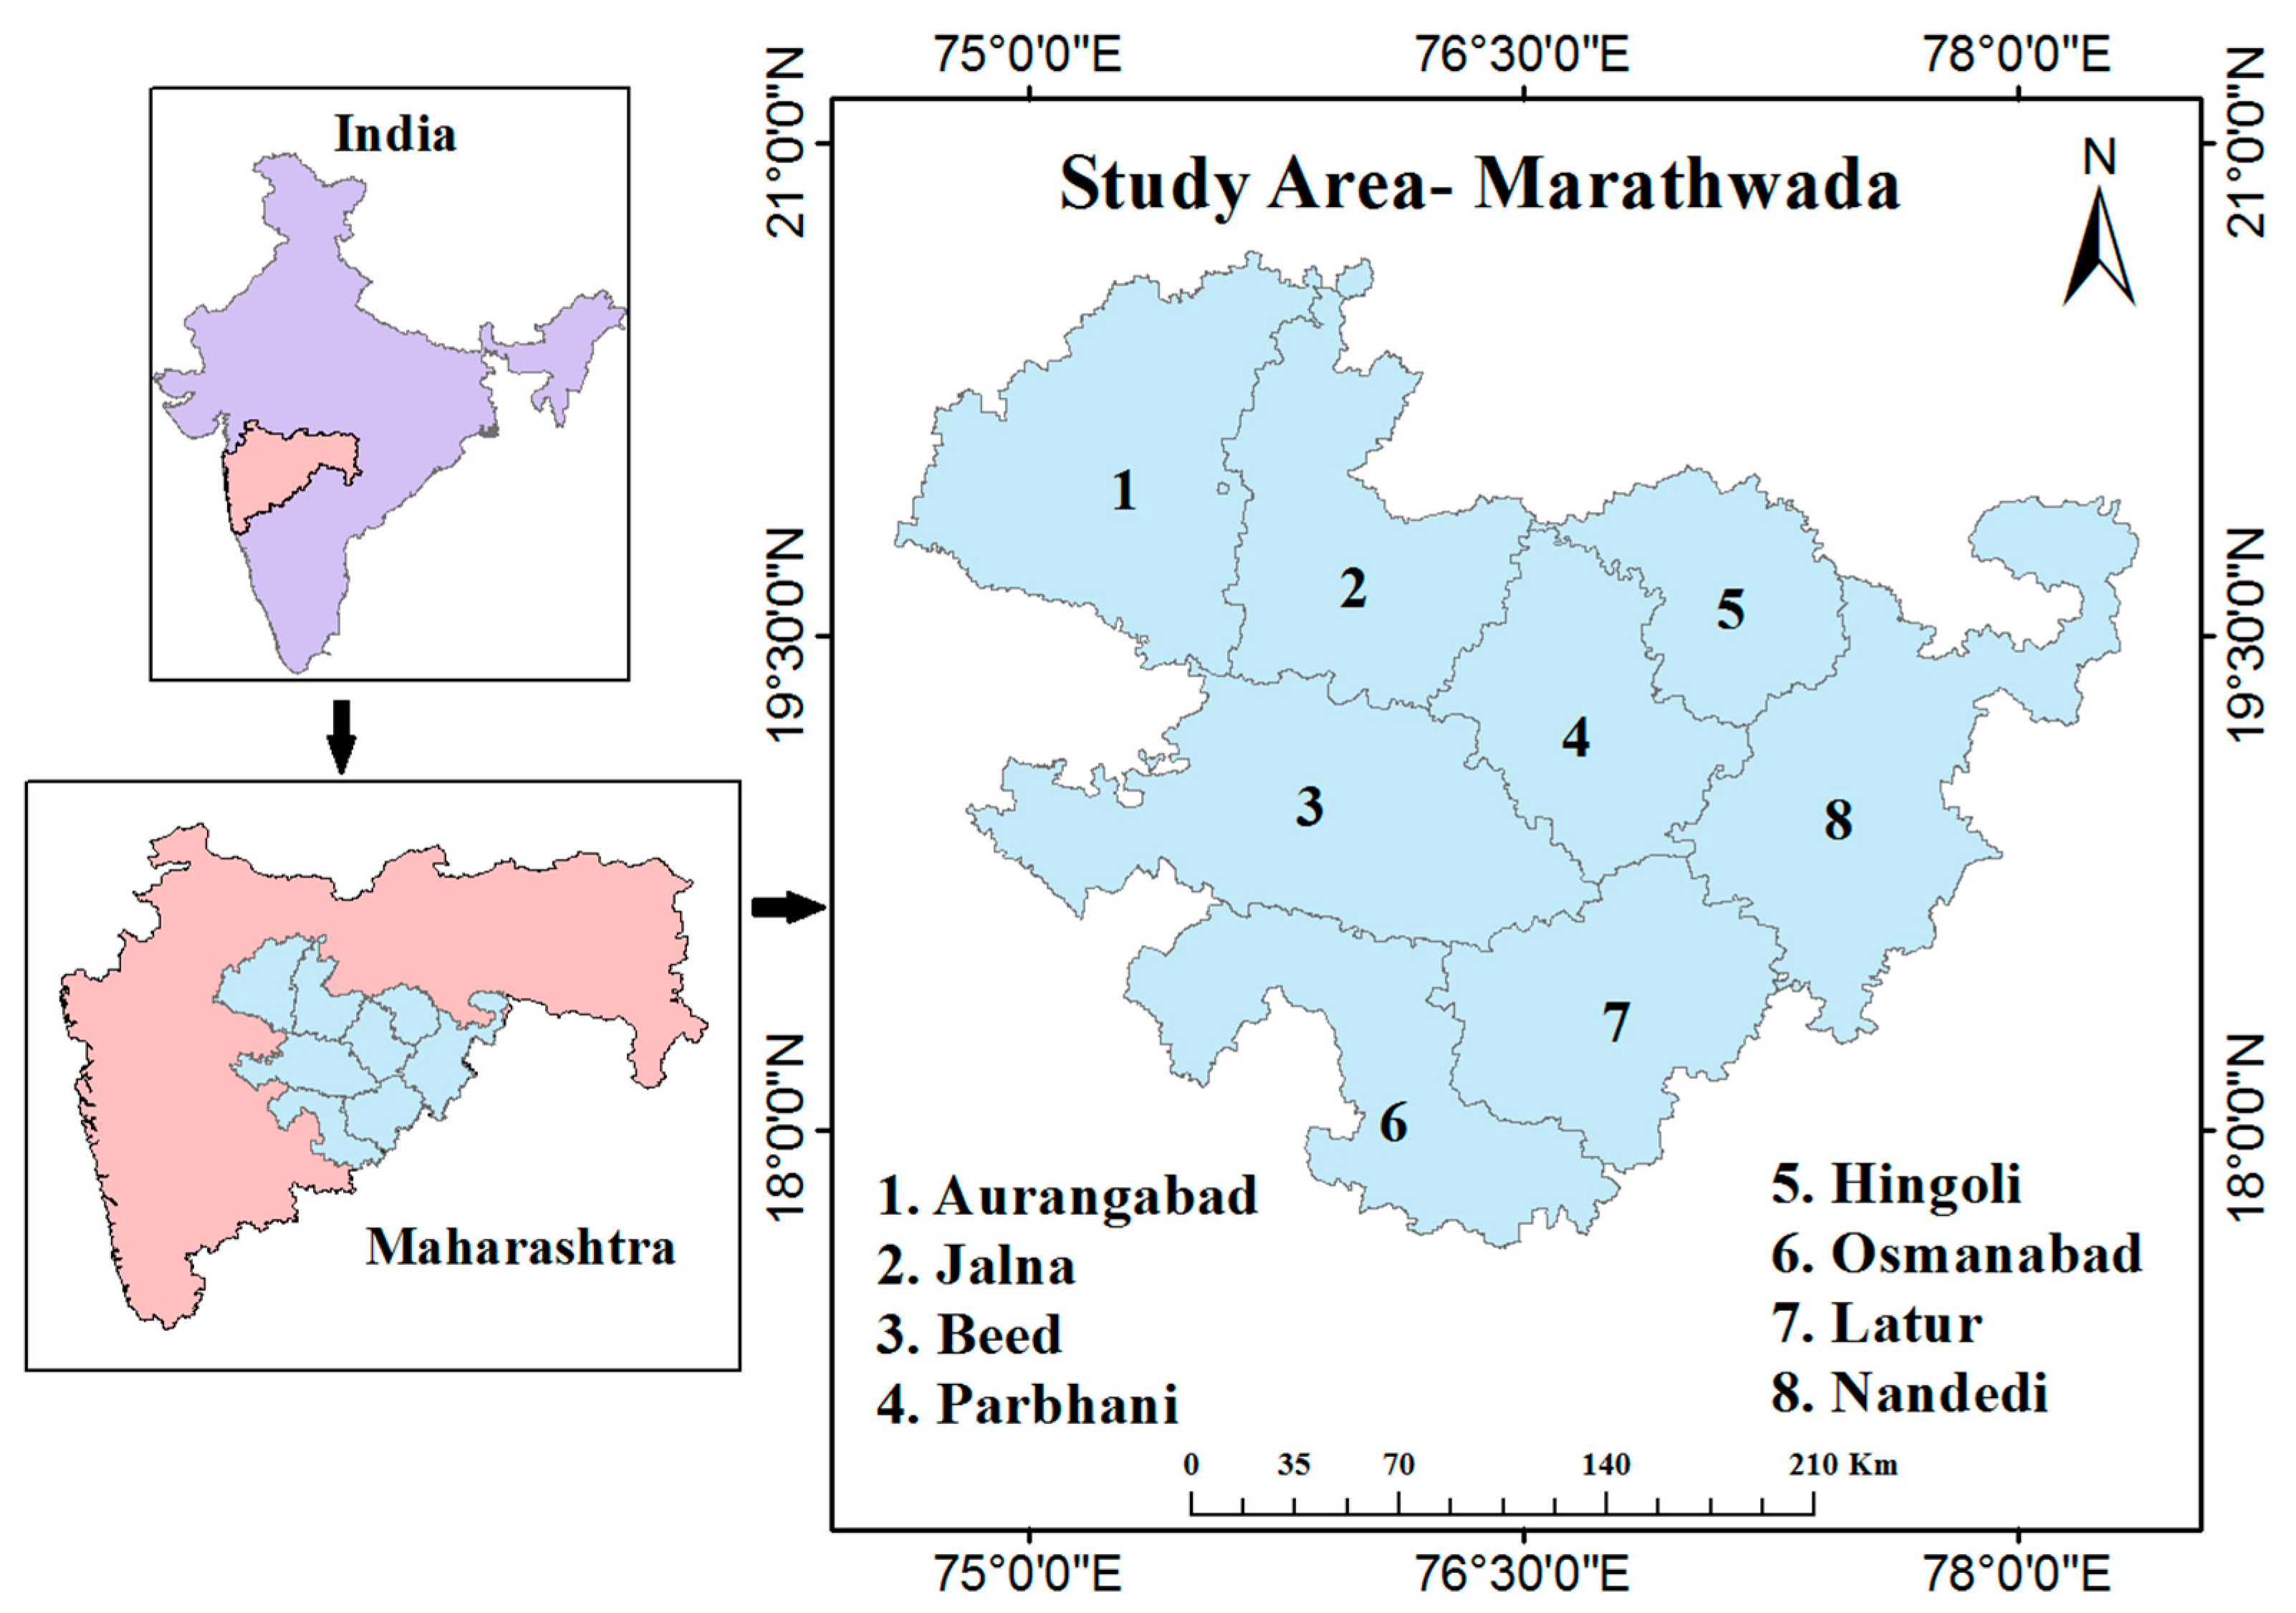
Marathwada is one of the driest semi-arid regions of India, infamously known for its farmer suicides due to extensive drought conditions. The Marathwada meteorological subdivision lies on the leeward side of the Western Ghats, Maharashtra, India. Therefore, due to its position on the leeward side and physiology, the rain shadow zone makes Marathwada highly vulnerable to rainfall.
Marathwada consists of eight districts named Aurangabad, Jalna, Beed, Parbhani, Hingoli, Osmanabad, Latur, and Nanded. The latitudinal extent of Marathwada is 17°35′ North to 20°41′ North while the longitudinal expand 74°40′ East to 78°16′ East (
Figure 1). The geographical area of the Marathwada is 64,590 km
2 with annual rainfall between 600 to 800 mm. Around 80% of the rainfall is received during the southwest monsoon season (June to September). The maximum temperature in the range of 41 °C to 44 °C is observed in May, while December is recorded with the minimum temperature in the range of 11 °C to 13 °C. Except for the monsoon season (June to September), the region observes extremely hot and dry weather throughout the year.
The present study analyzes district-wide monthly rainfall data from 1981 to 2018 for the rainfall trends. The rainfall data were collected from the Indian Meteorological Department (IMD) Pune, and missing values in the data were filled in from the Indian Institute of Tropical Meteorology (IITM) database. Standard normal homogeneity test [
23] and Double mass curve [
24] were adopted for the homogeneity testing of the rainfall data. The results of both tests confirmed the homogeneous and reliable nature of the data. Ground water data were collected from the water resources information system of India from 1996 to 2018. State- and national-level agricultural authorities released season-wide (Kharif, Rabi) crop production data sets which were the primary source of agricultural information for the different crops from 1996 to 2018.
2.2. Techniques Used
2.2.1. Trend Analysis
The trends in precipitation, crop pattern, and ground water have been computed using the linear regression model,
t-test, and Mann Kendal rank test [
25,
26]. These statistical tests are widely accepted and used by various researchers [
27,
28] to analyze the trends in different climatological parameters.
The linear regression model is expressed as Equation (1),
where
y is the dependent variable, and
x is the independent variable. ‘
a’ represents the intercept value, whereas ‘
b’ is the rate of change per unit of time. The non-parametric Mann–Kendal rank test shows the monotonic nature of increasing or decreasing trends, in which statistical significance was studied at 95% and 99.9% confidence levels.
2.2.2. Crop-Yield Analysis
The accurate analysis of crop yield is essential for farmers for crop delivery estimates, crop insurance, planning harvest, and financial budgeting [
29]. There are several methods to calculate crop yield, but it is generally defined and majored as production per unit of a specific area [
30], as shown in Equation (2).
In this study, we have considered ten highly cultivated and maximum-yield-producing crops from Marathwada for analysis. These crops were grouped concerning their water necessity under the high- and low-water-requirement categories (
Table 1) [
31,
32]. The variations in crop yield were studied using the linear regression method and the Mann–Kendal rank test.
3. Results
3.1. Summer Monsoon Rainfall Trends
The trend analysis methods analyzed the increasing and decreasing behavioral changes in rainfall. All over the world and India in particular, various trend analysis studies [
33,
34,
35] have noted climatic regime shifts in rainfall after the year 1980. Therefore, we have considered rainfall trends from 1980 onward. This study has been carried out at the district level and for the study area as a whole.
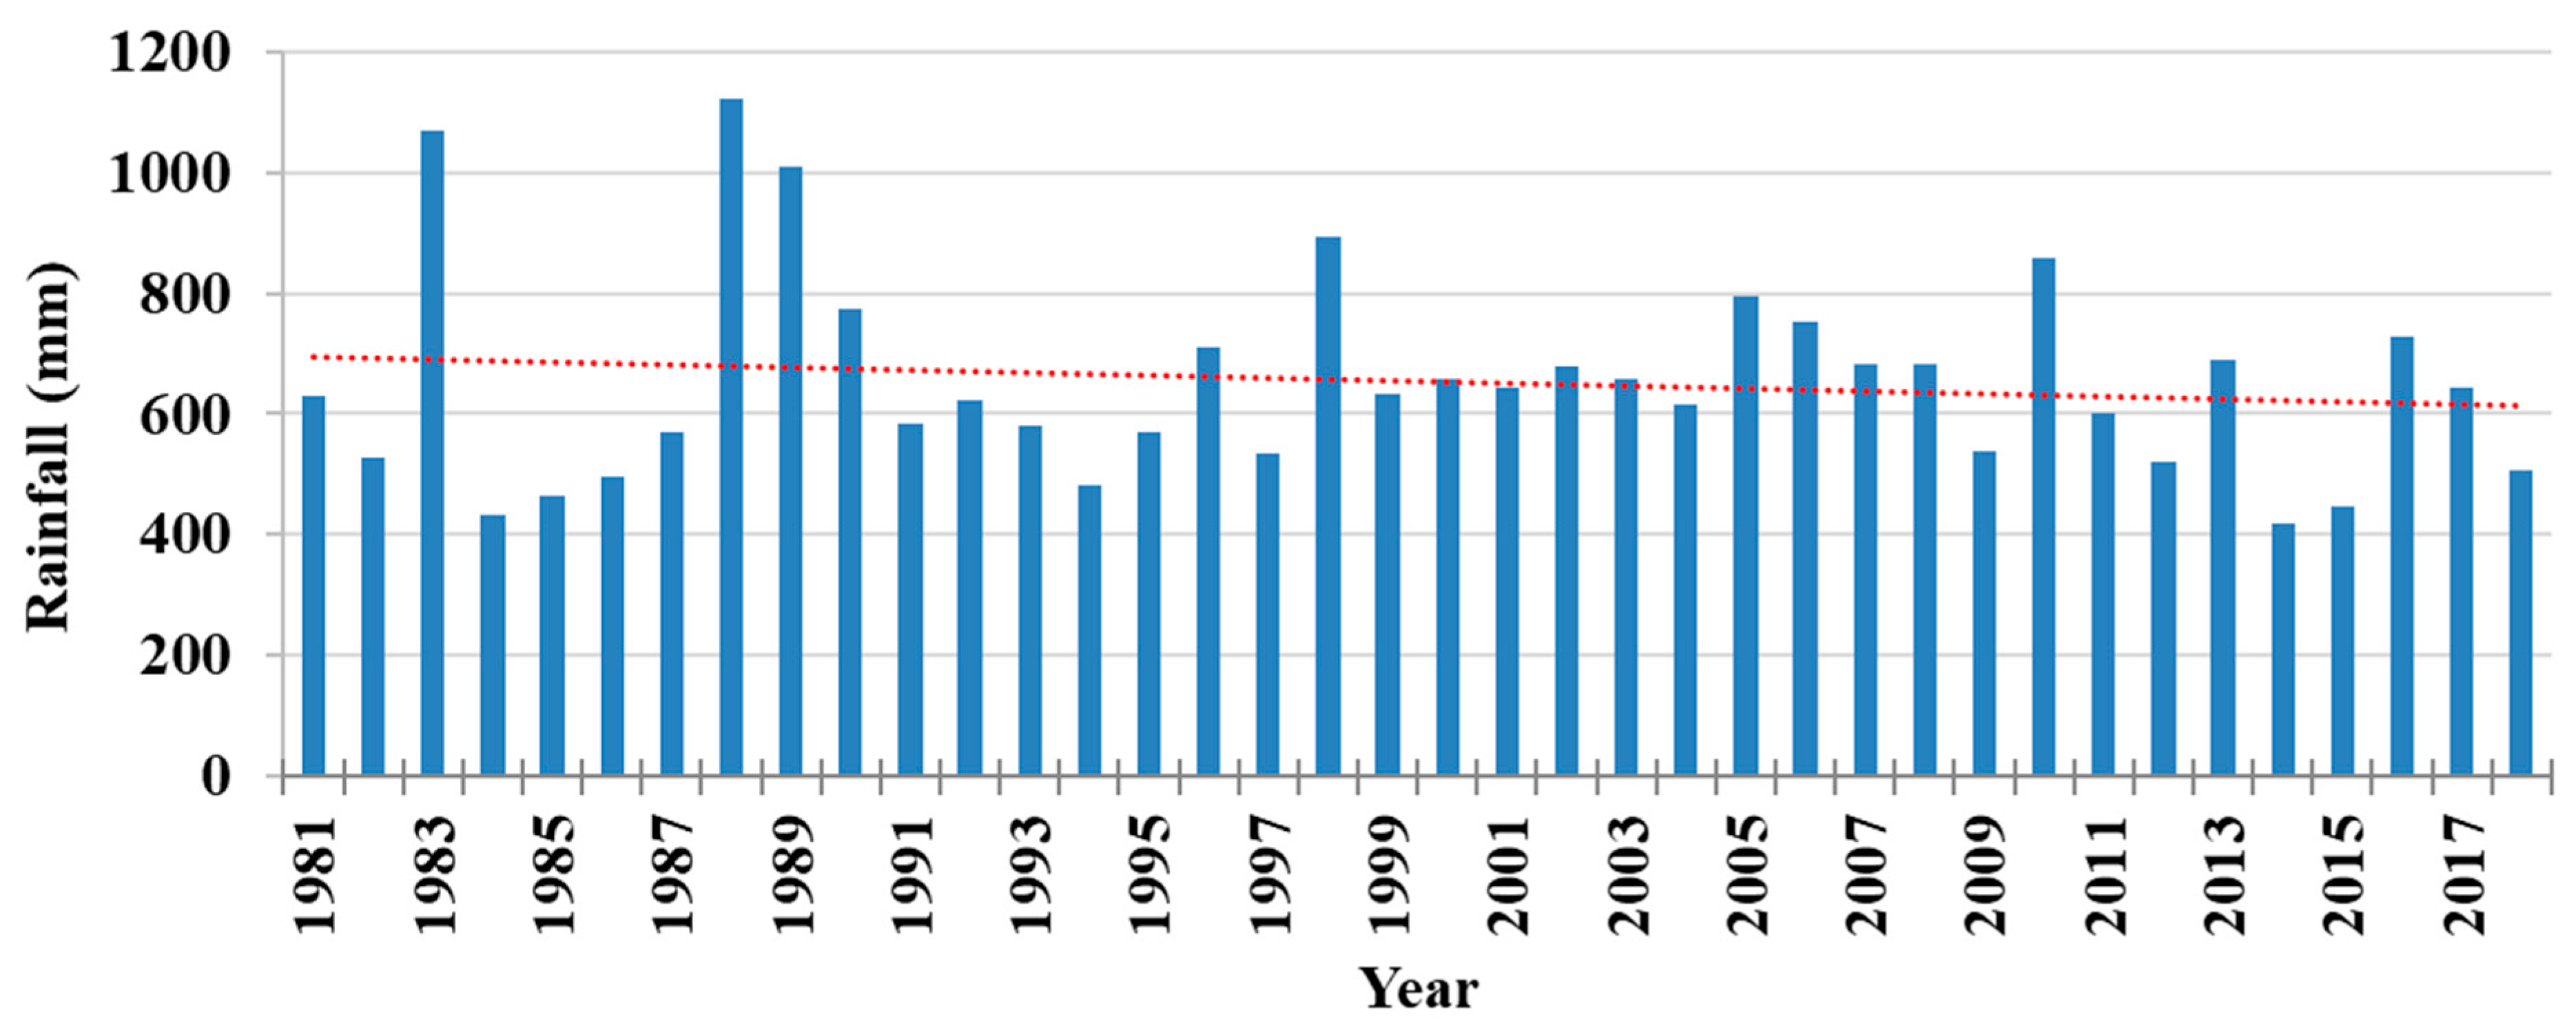
In general, a decreasing rainfall trend with an annual mean of 662.9 mm/year was noticed from 1981 to 2018 over the whole of Marathwada, but it is also observed that this declining rainfall trend was not statistically significant (
Table 2) (
Figure 2). Half of the districts of Marathwada witnessed a slight increase in the whole monsoon (JJAS) rainfall after the year 1981. The non-significant positively inclining trends in rainfall were detected over Latur (+0.74 mm/year) and Beed (+0.034), followed by Jalna (+0.021 mm/year) and Aurangabad (+0.021 mm/year). All other districts, i.e., Nanded, Parbhani, Osmanabad, and Hingoli, were under non-significant decreasing rainfall trends. For monsoons (JJAS), the maximum decrease in rainfall was noticed over the Nanded district (−0.306 mm/year), followed by Osmanabad (−0.041 mm/year) and Parbhani (−0.041 mm/year) (
Table 2). The years 1982, 1987, 2002, 2009, 2014, and 2015 were noticed as severe drought years from 1981 to 2018 (
Table 3).
The monthly variations in rainfall play a significant role in agricultural activities and society’s water demand [
36]. Therefore, we have also studied monthly (JJAS) disparities in monsoon rainfall over Marathwada. All the monsoon months (JJAS) examined the mixed nature of rainfall trends from 1980 to 2018. Compared to other monsoon months, July rainfall contributed more (28.29%) to the overall rainfall, whereas September (24.05%) and June (20.48%) months observed the highest rainfall variability. None of the districts for any monsoon month have experienced any significant increase or decrease in rainfall.
The month of June observed declining rainfall trends for all the districts, among which the maximum decrease was over Osmanabad (−0.302 mm/year), Parbhani (−0.246 mm/year), and Jalna (−0.244 mm/year) (
Table 2). Over Marathwada, most of the sowing activities are carried out in June. Therefore, these decreasing rainfall trends for all the districts in June are a significant concern for agriculture.
In July, except for Nanded (−0.020 mm/year), all other districts were under non-significant increase. The maximum increase was observed over Osmanabad and Latur, followed by Beed and Parbhani (
Table 2). Increasing rainfall in July is a good sign of water availability for agriculture in its growing stages.
Over August, five districts noticed increasing rainfall trends in which Beed (0.219 mm/year), Latur (0.156 mm/year), and Jalna (0.137 mm/year) were the districts with a maximum increase. Parbhani (−0.024 mm/year), Nanded (−0.280 mm/year), and Hingoli (−0.072 mm/year) were the districts with decreasing rainfall trends, but the rate of decreasing trends was negligible. In September, all the districts were under a decreasing rainfall trend. The maximum decreasing rate was observed over the districts of Beed (−0.209 mm/year) and Osmanabad (−0.209 mm/year) (
Table 2).
3.2. Variability in Agricultural Practices
3.2.1. Low-Water-Requirement Crops
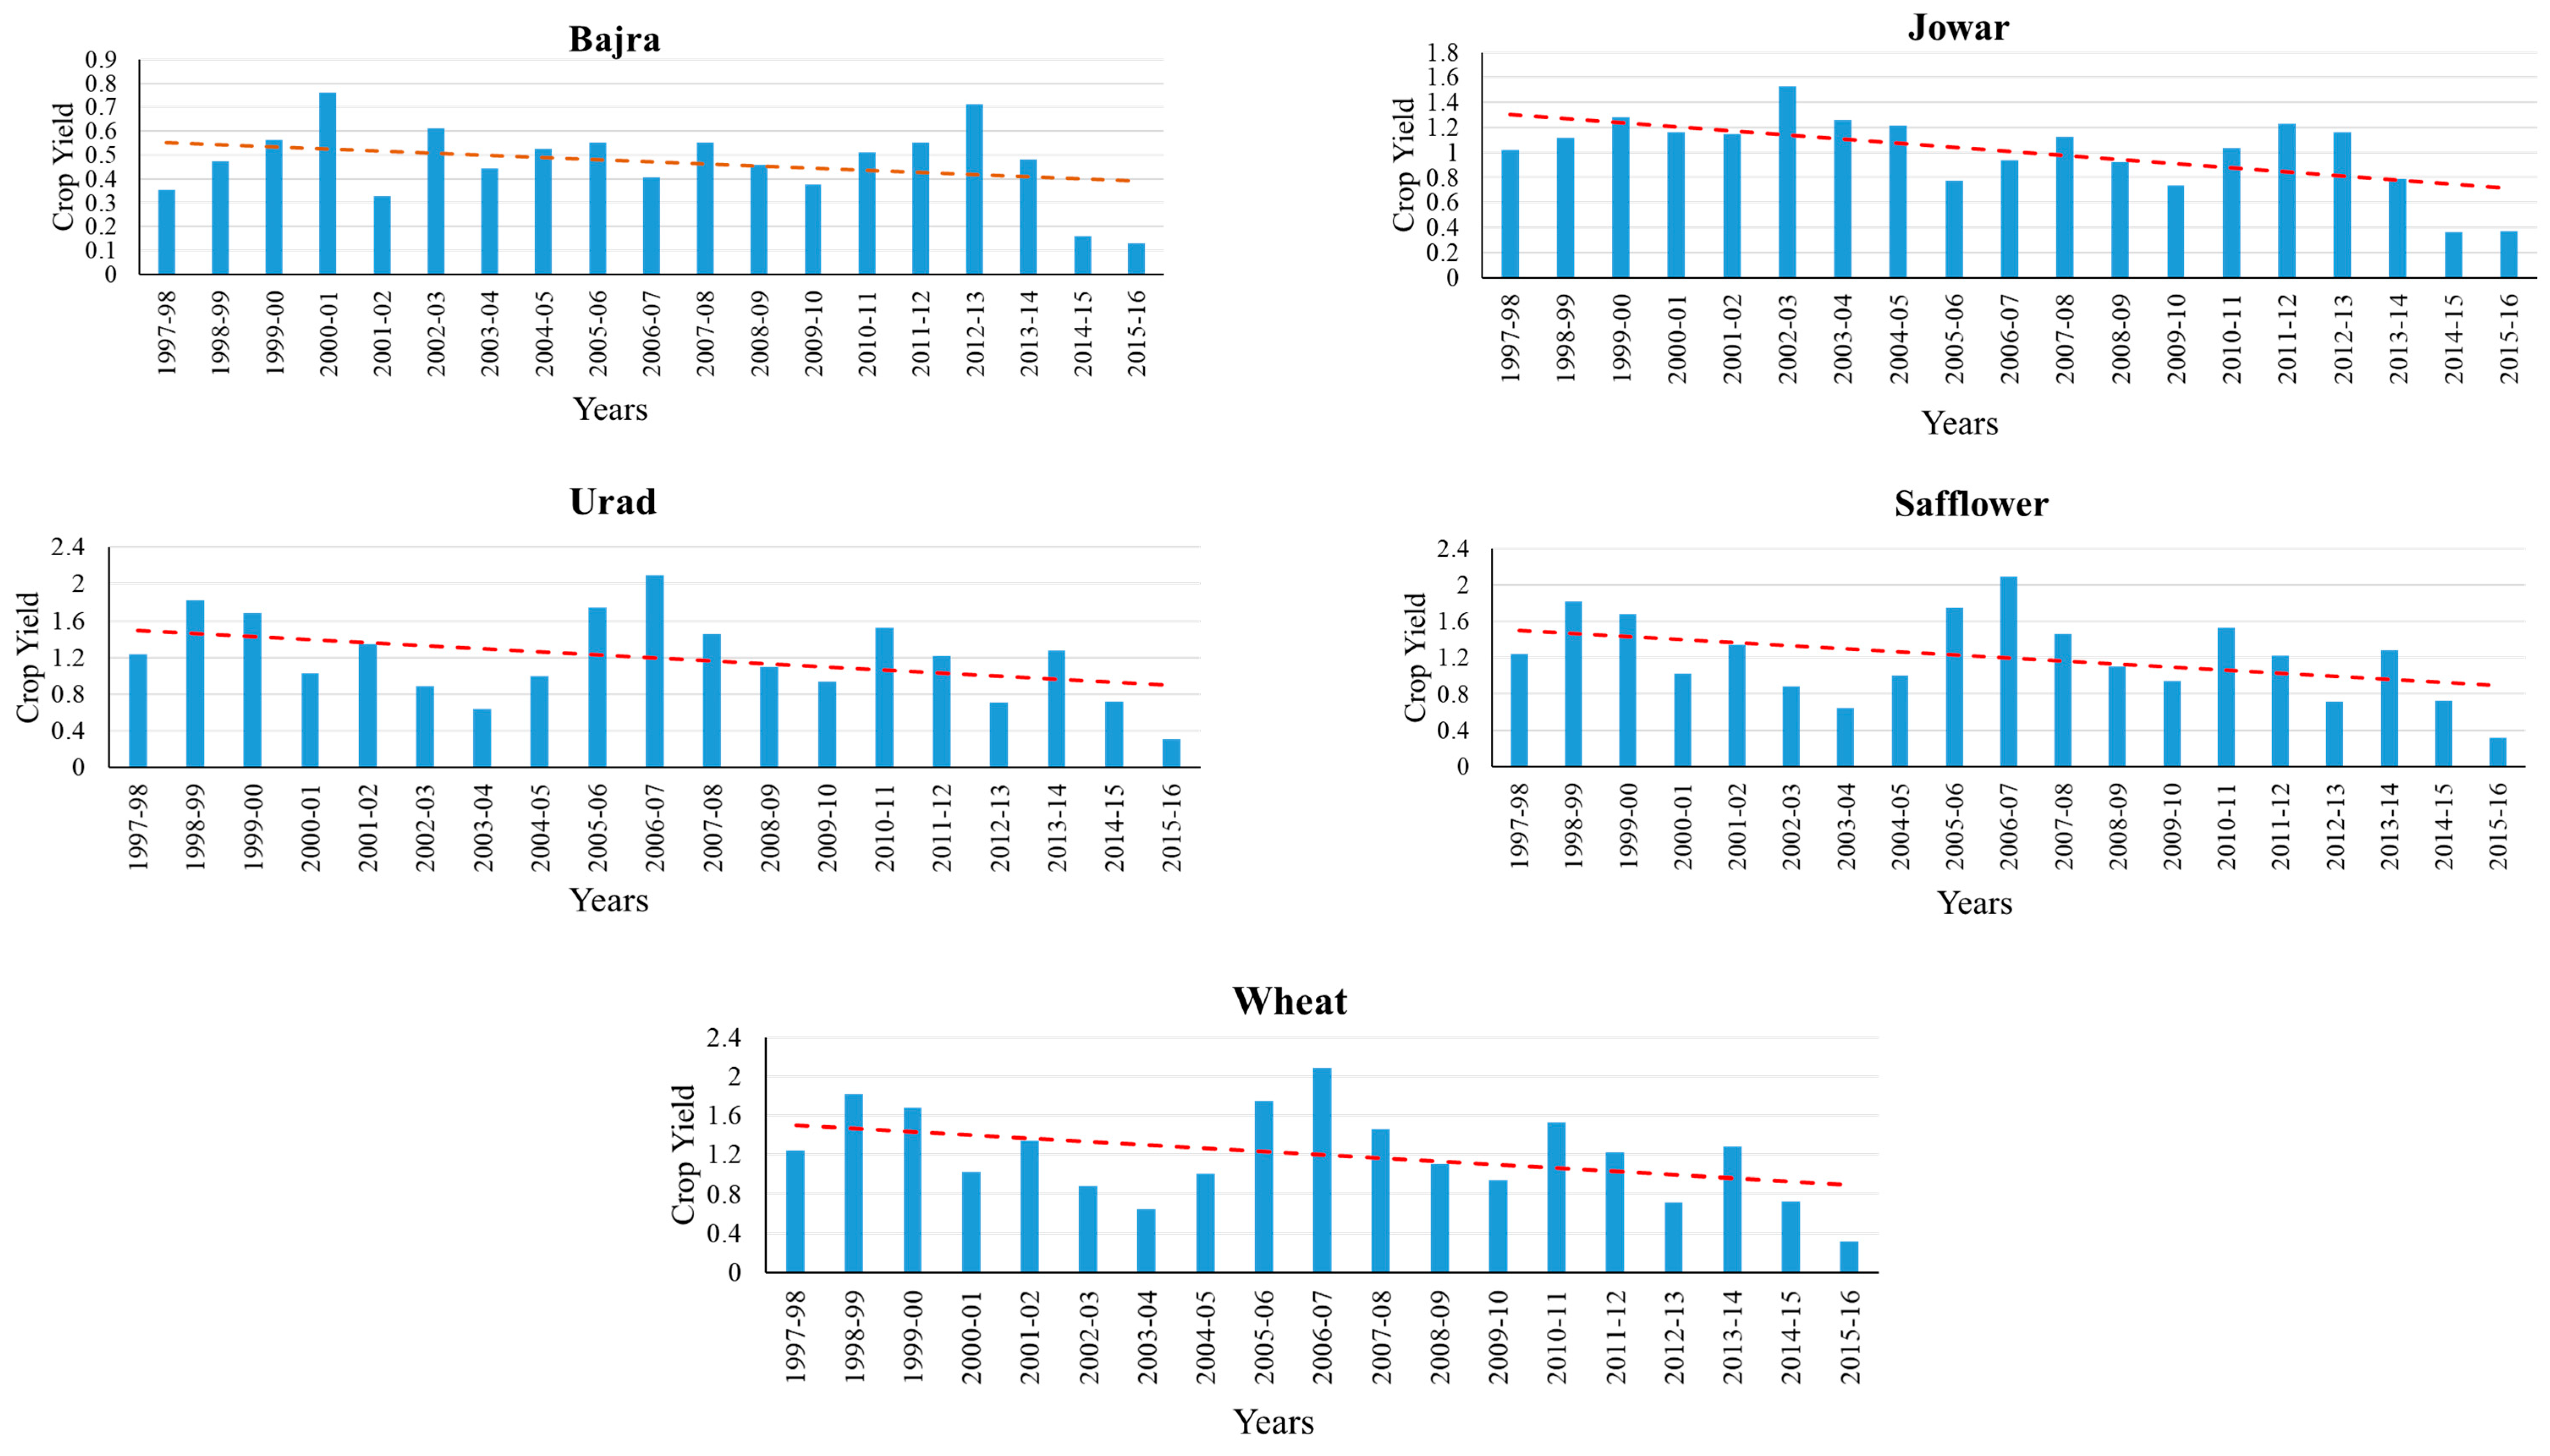
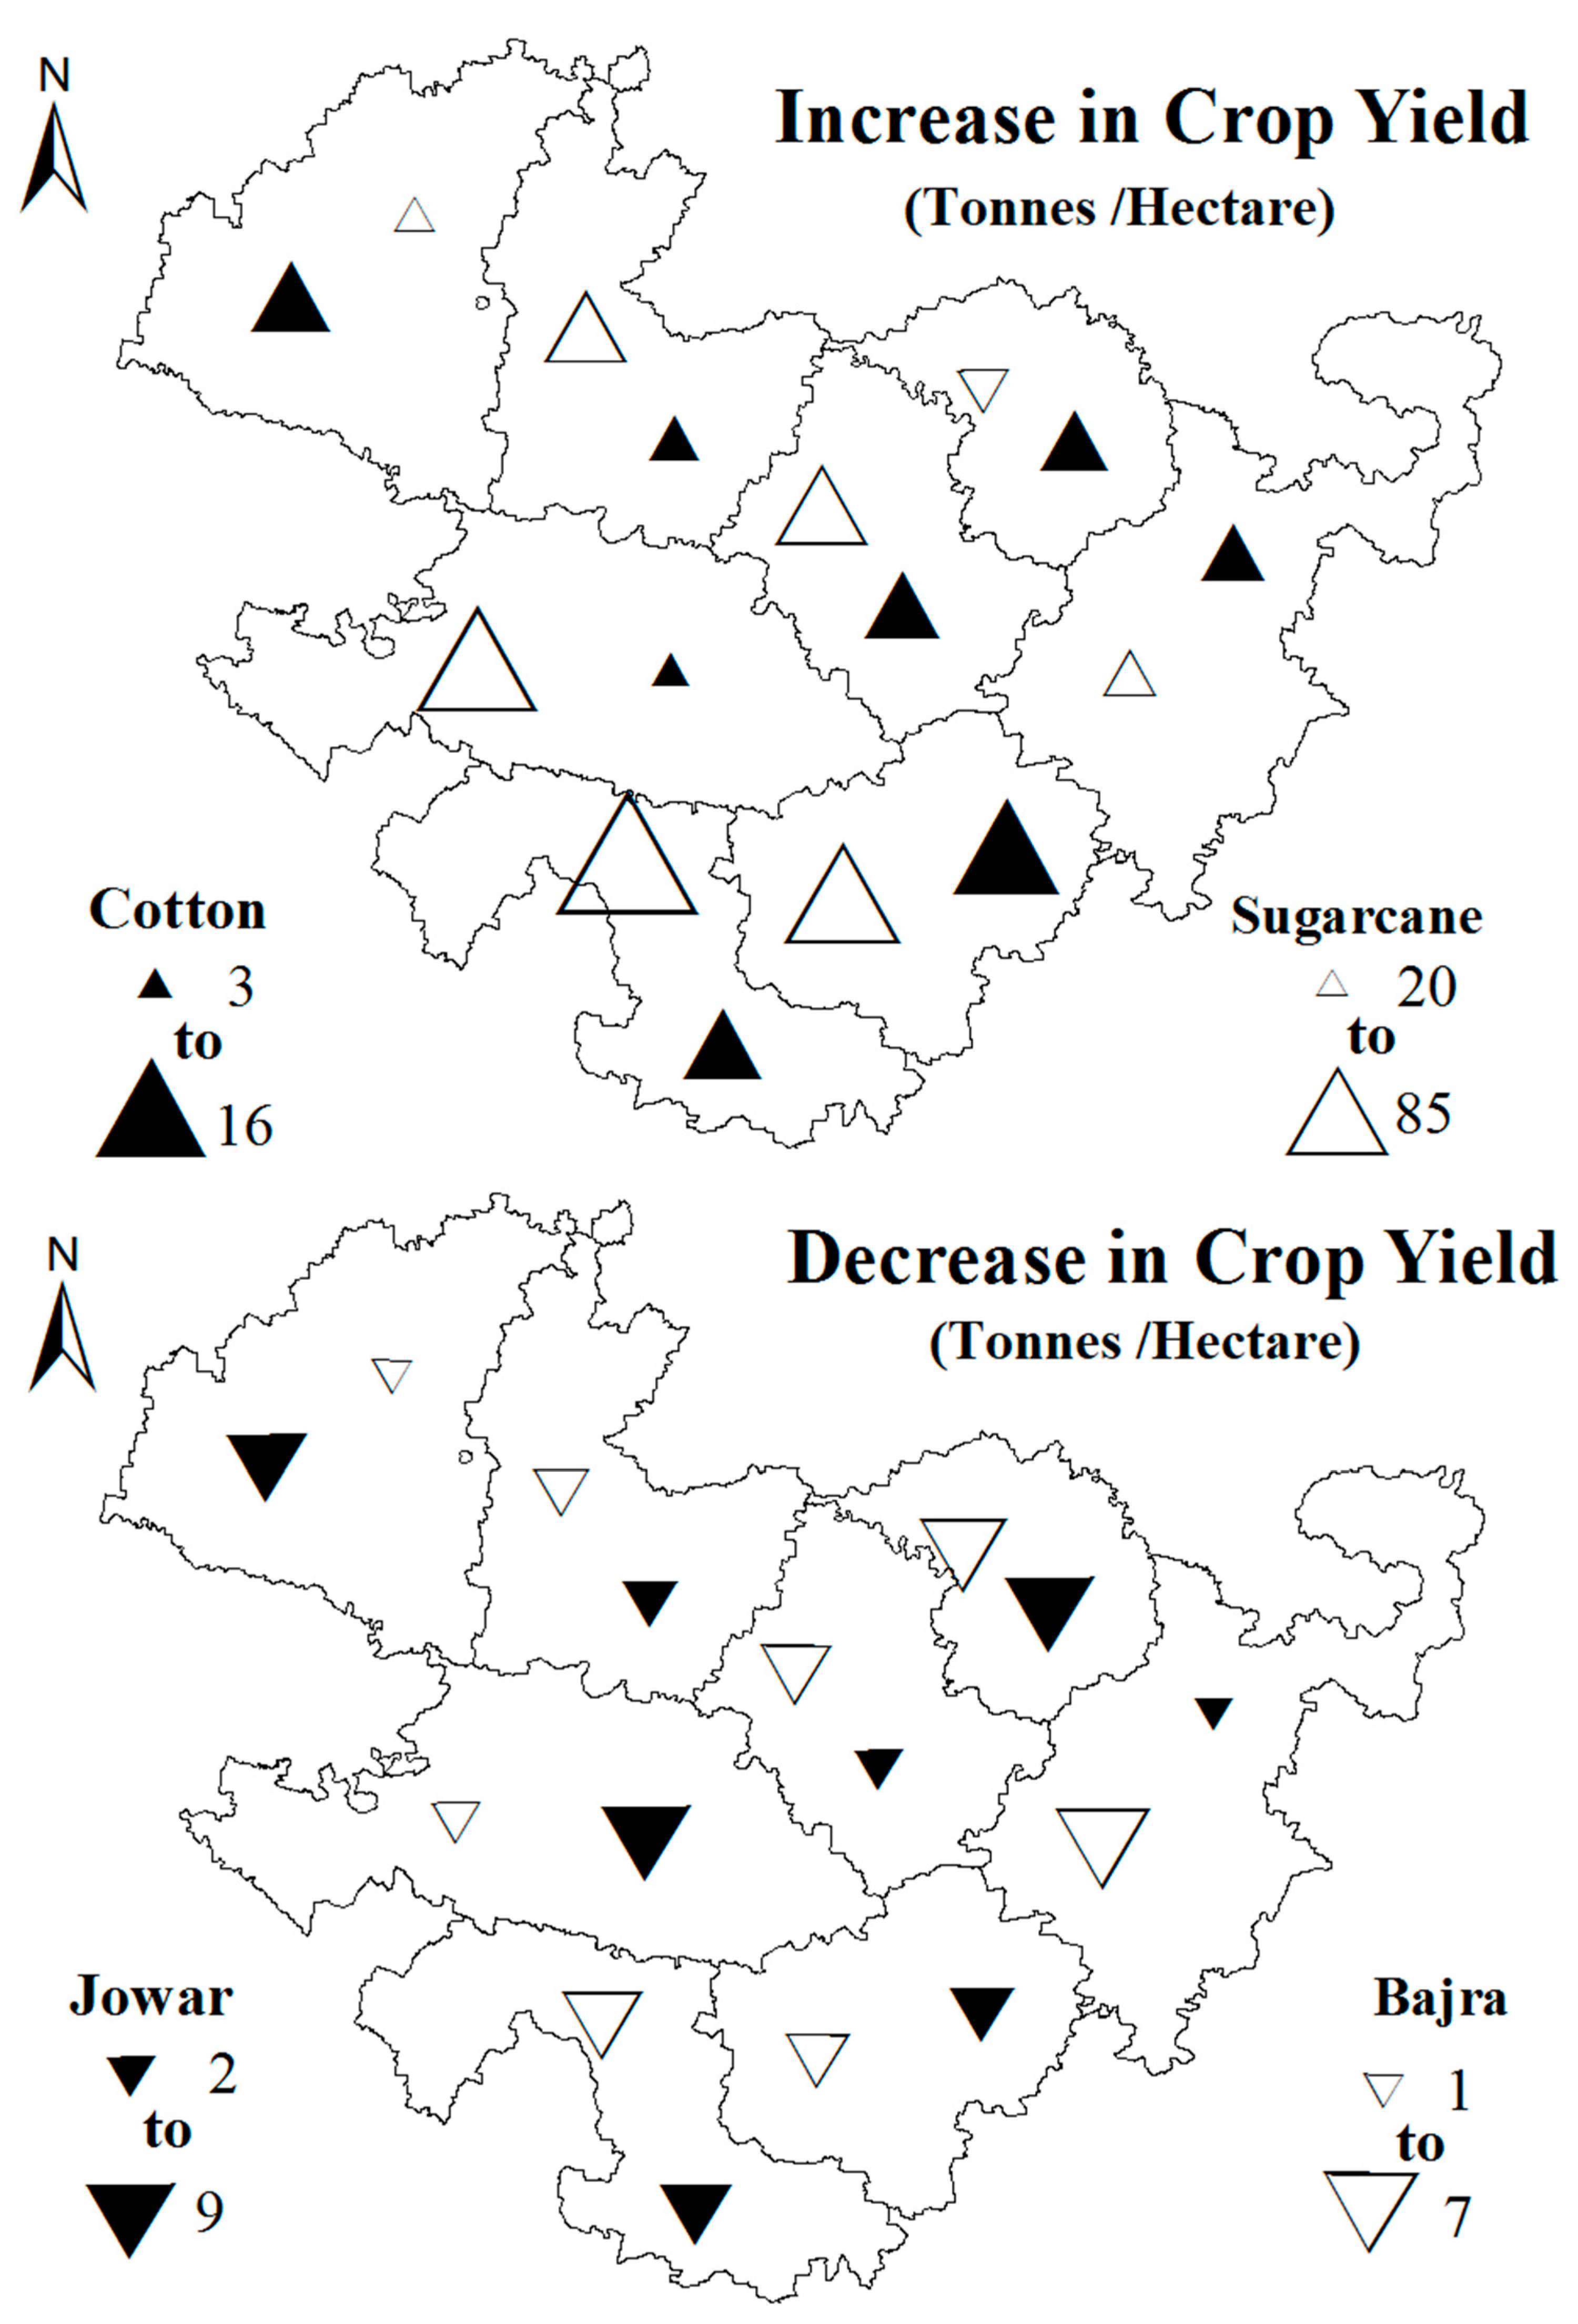
From the year 1996 onwards, decreasing and increasing over most districts in the yield of low-water-requirement crops (jowar, bajra, wheat, safflower, and udad) and high-water-requirement crops (Cotton, sugarcane, rice, soybean, and maize) were observed (
Figure 3 and
Figure 4). The maximum declining rate (−1210 tonnes/hectare) of jowar production was noticed over the Nanded district, followed by, Hingoli (−528.1 tonnes/hectare) and Parbhani (−469.5 tonnes/hectare) (
Figure 5). This decreasing trend of jowar production was statistically significant at a 95% confidence level. Jalna was the highest yield-depleting district for bajra, followed by Latur, Osmanabad, and Parbhani. A maximum non-significant decreasing crop yield of wheat was noticed over Beed, Nanded, and Osmanabad. The utmost reduction in udad crop yield was experienced over the Jalna, followed by Nanded, Parbhani, and Hingoli. It is also noticed that not only the crop yield of low-water-requirement crops has decreased, but the overall area under these crops is also declining.
3.2.2. High-Water-Requirement Crops
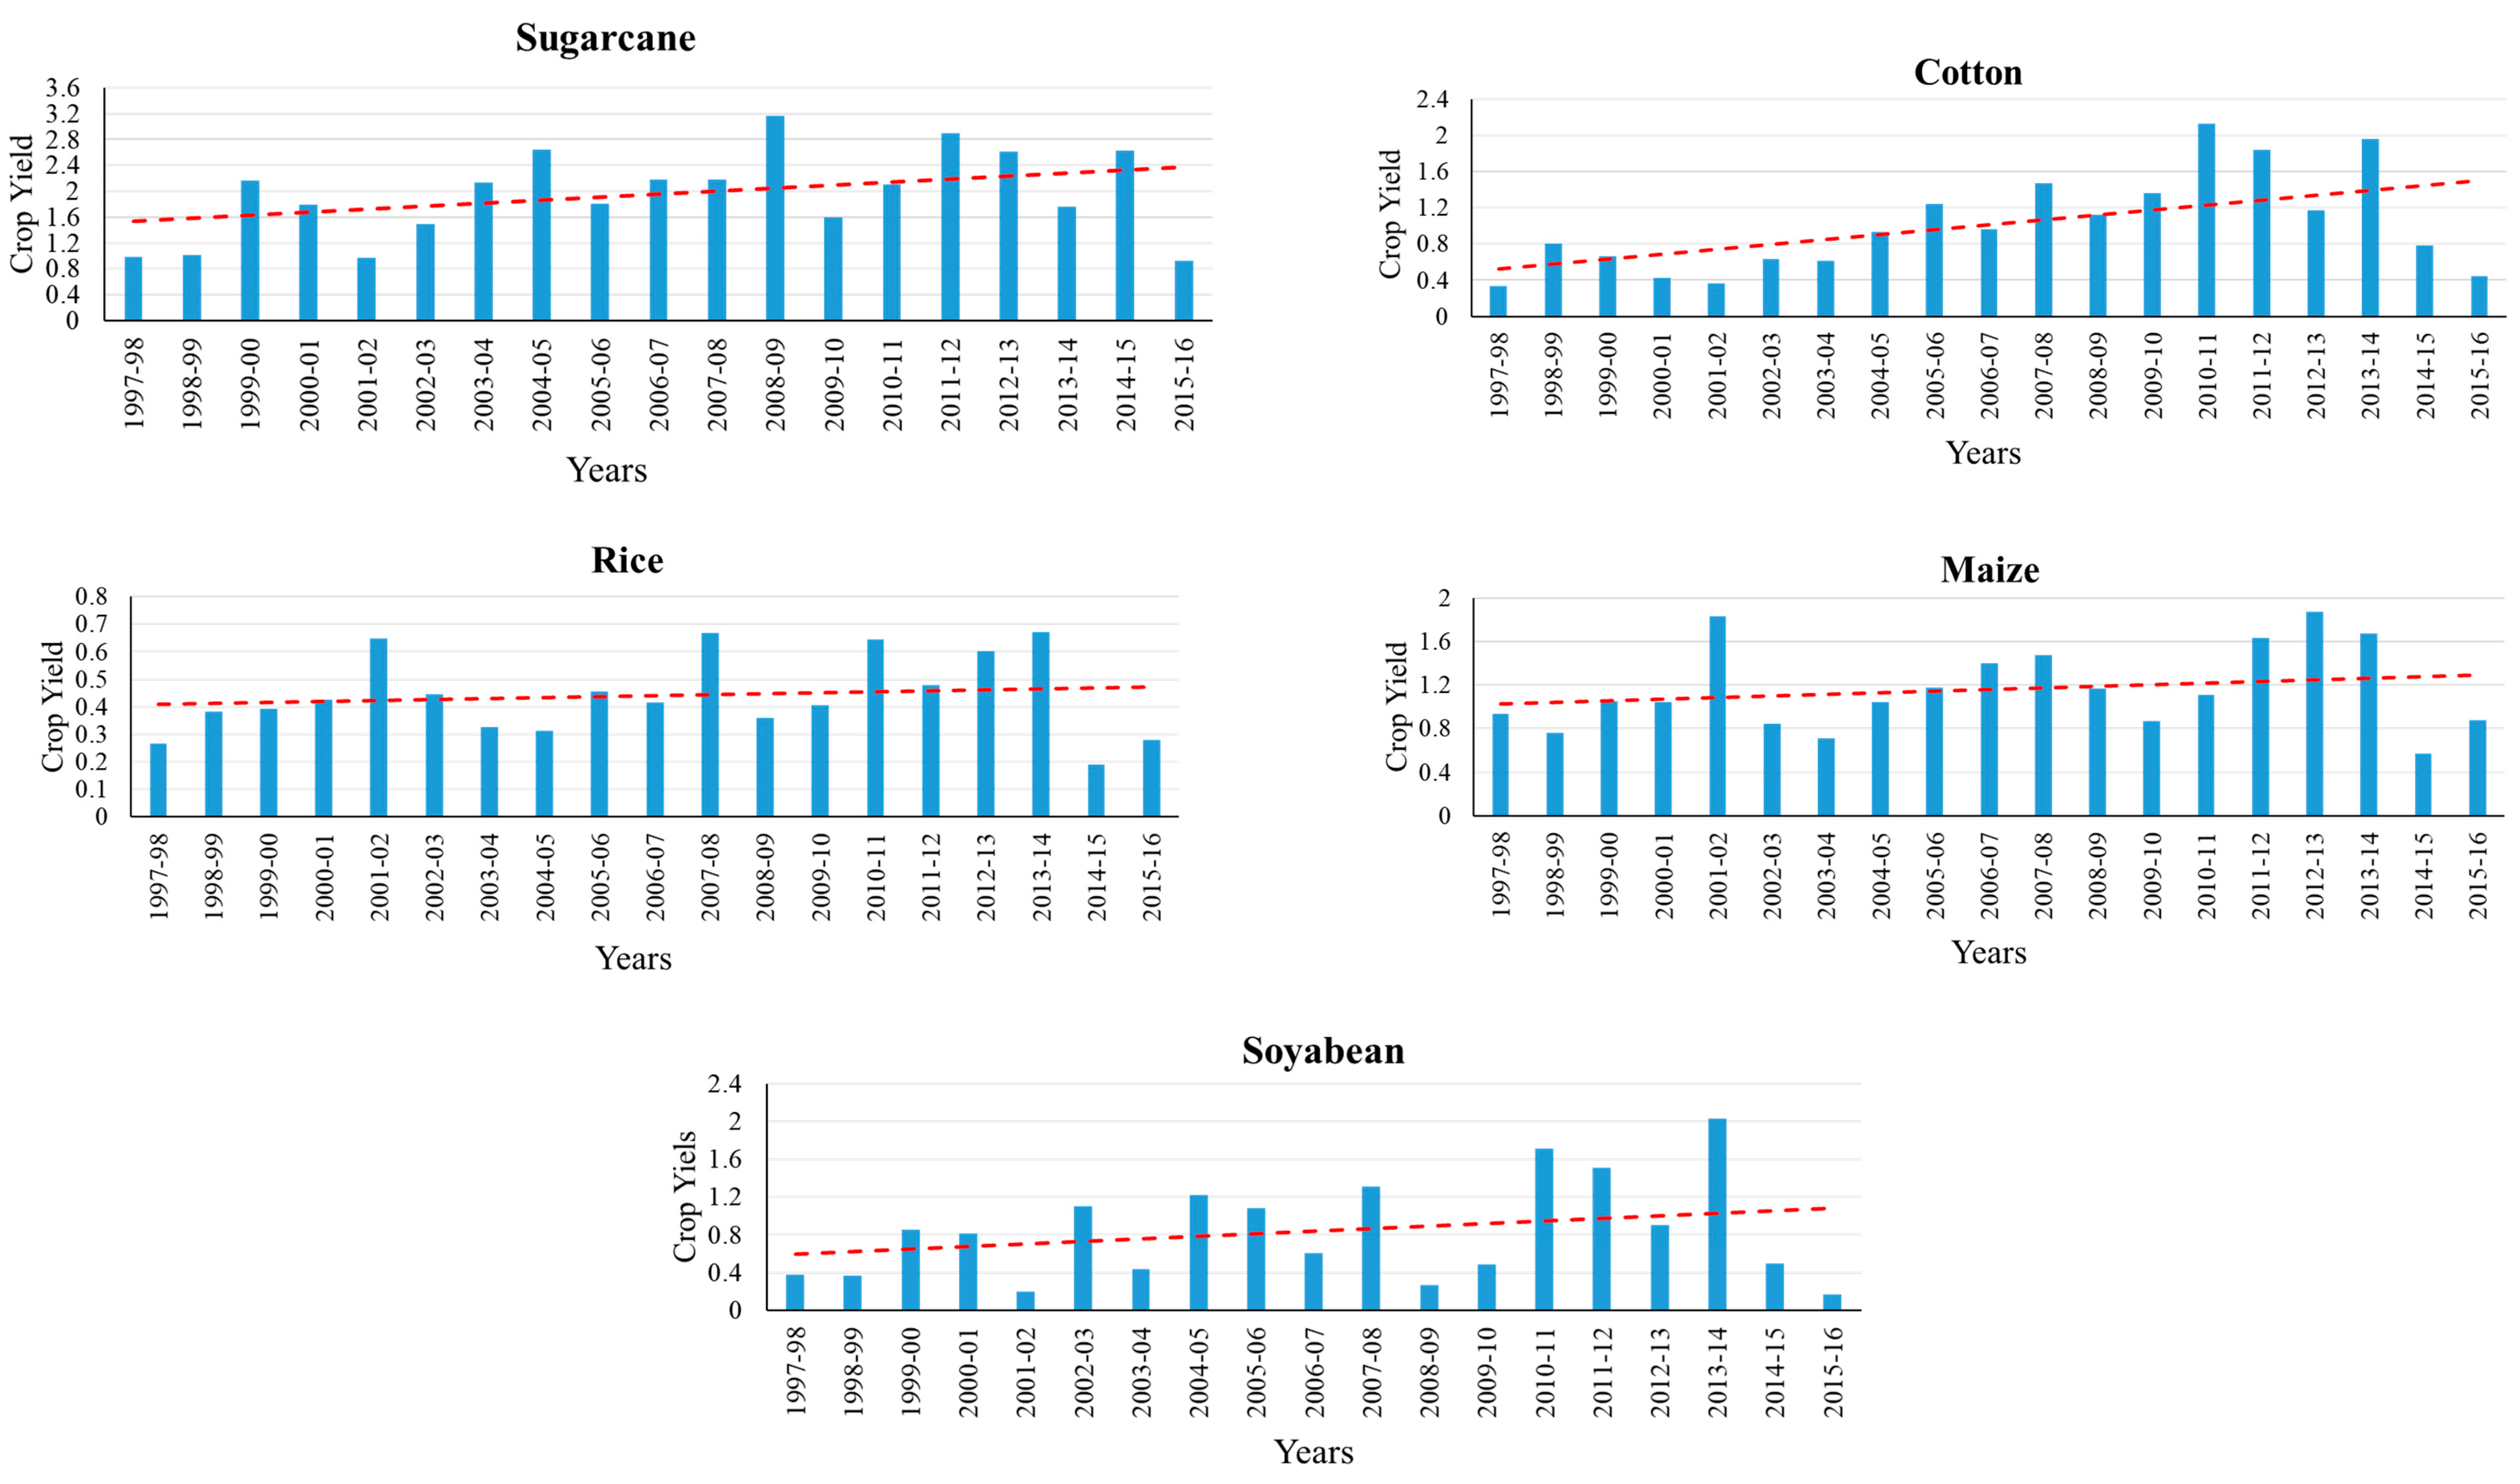
Cotton, sugarcane, rice, soybean, and maize are the main cultivated high-water-requirement crops in Marathwada and all the other districts. Per hectare, production and area growing high-water-requirement crops (mostly cotton and sugarcane, etc.) have remarkably increased in the last two decades (after the year 2000) throughout Marathwada (
Figure 4).
It was noticed that the Aurangabad district had the highest increasing rate (+2175.3 tonnes/hectare) of sugarcane which was followed by Jalna (+565.5 tonnes/hectare) and Latur (+51.93 tonnes/hectare) (
Figure 5). Per hectare, cotton production has risen over all the districts in which the maximum change (+0.092 tonnes/hectare) was examined in Latur. The yield of maize and soybean showed the highest increase of +0.055 tonnes/hectare in Aurangabad, while Jalna is under the maximum rice yield production (0.035 tonnes/hectare).
Figure 3.
Trends in low-water-requirement crops cultivation in Marathwada. Red dotted line shows the trend over entire period.
Figure 3.
Trends in low-water-requirement crops cultivation in Marathwada. Red dotted line shows the trend over entire period.
Figure 4.
Trends in high-water-requirement crops cultivation in Marathwada. Red dotted line shows the trend over entire period.
Figure 4.
Trends in high-water-requirement crops cultivation in Marathwada. Red dotted line shows the trend over entire period.
Figure 5.
District-wide trends in major crops and yield (Tonnes/Hectare) in Marathwada.
Figure 5.
District-wide trends in major crops and yield (Tonnes/Hectare) in Marathwada.
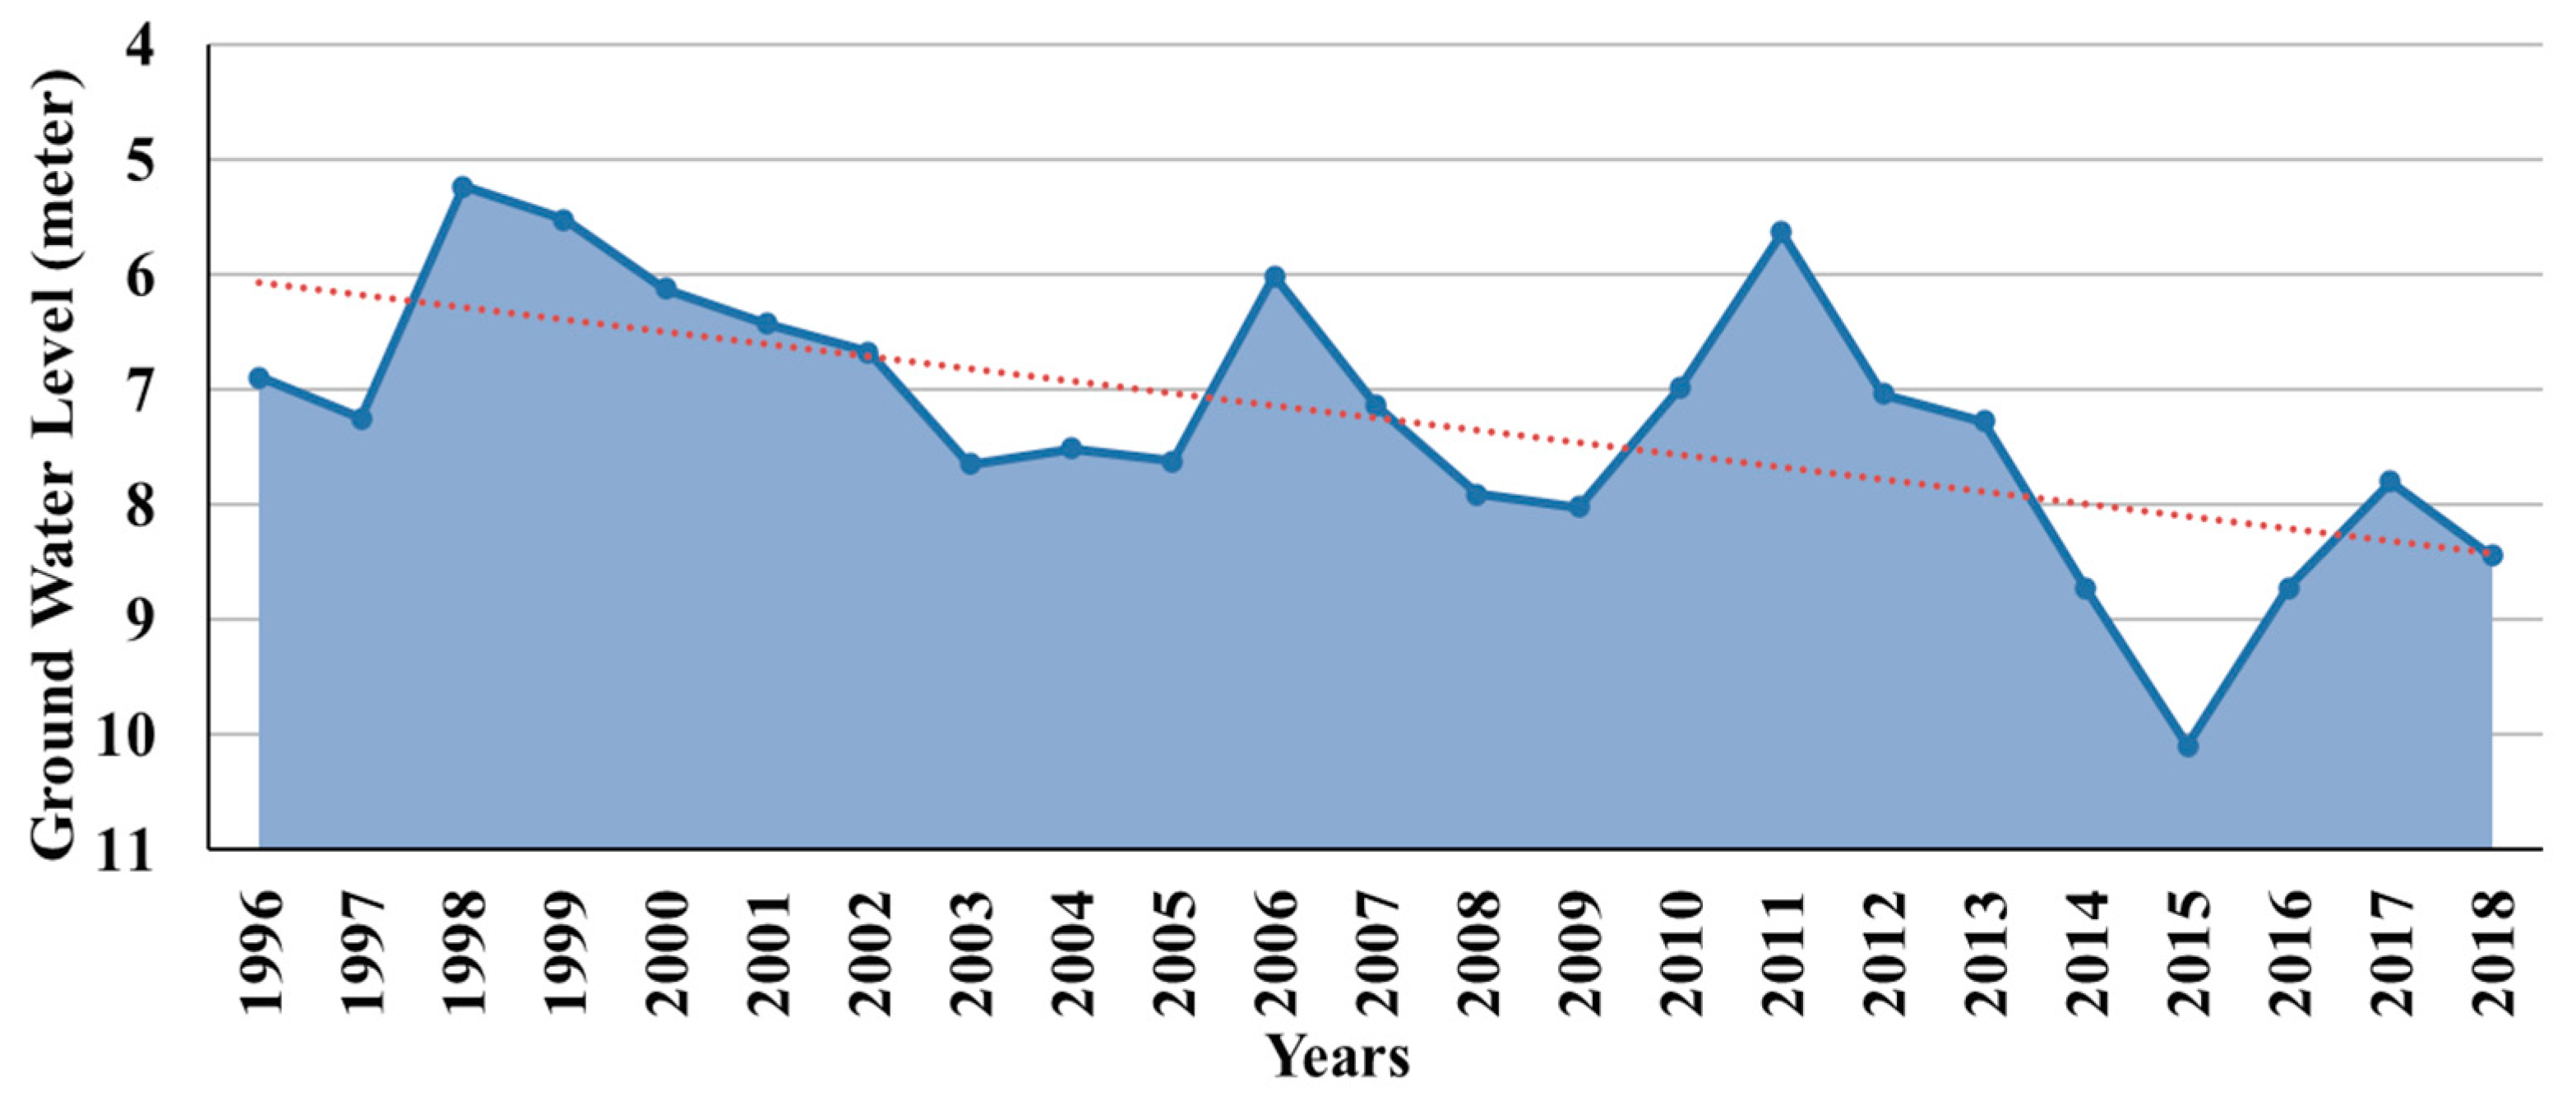
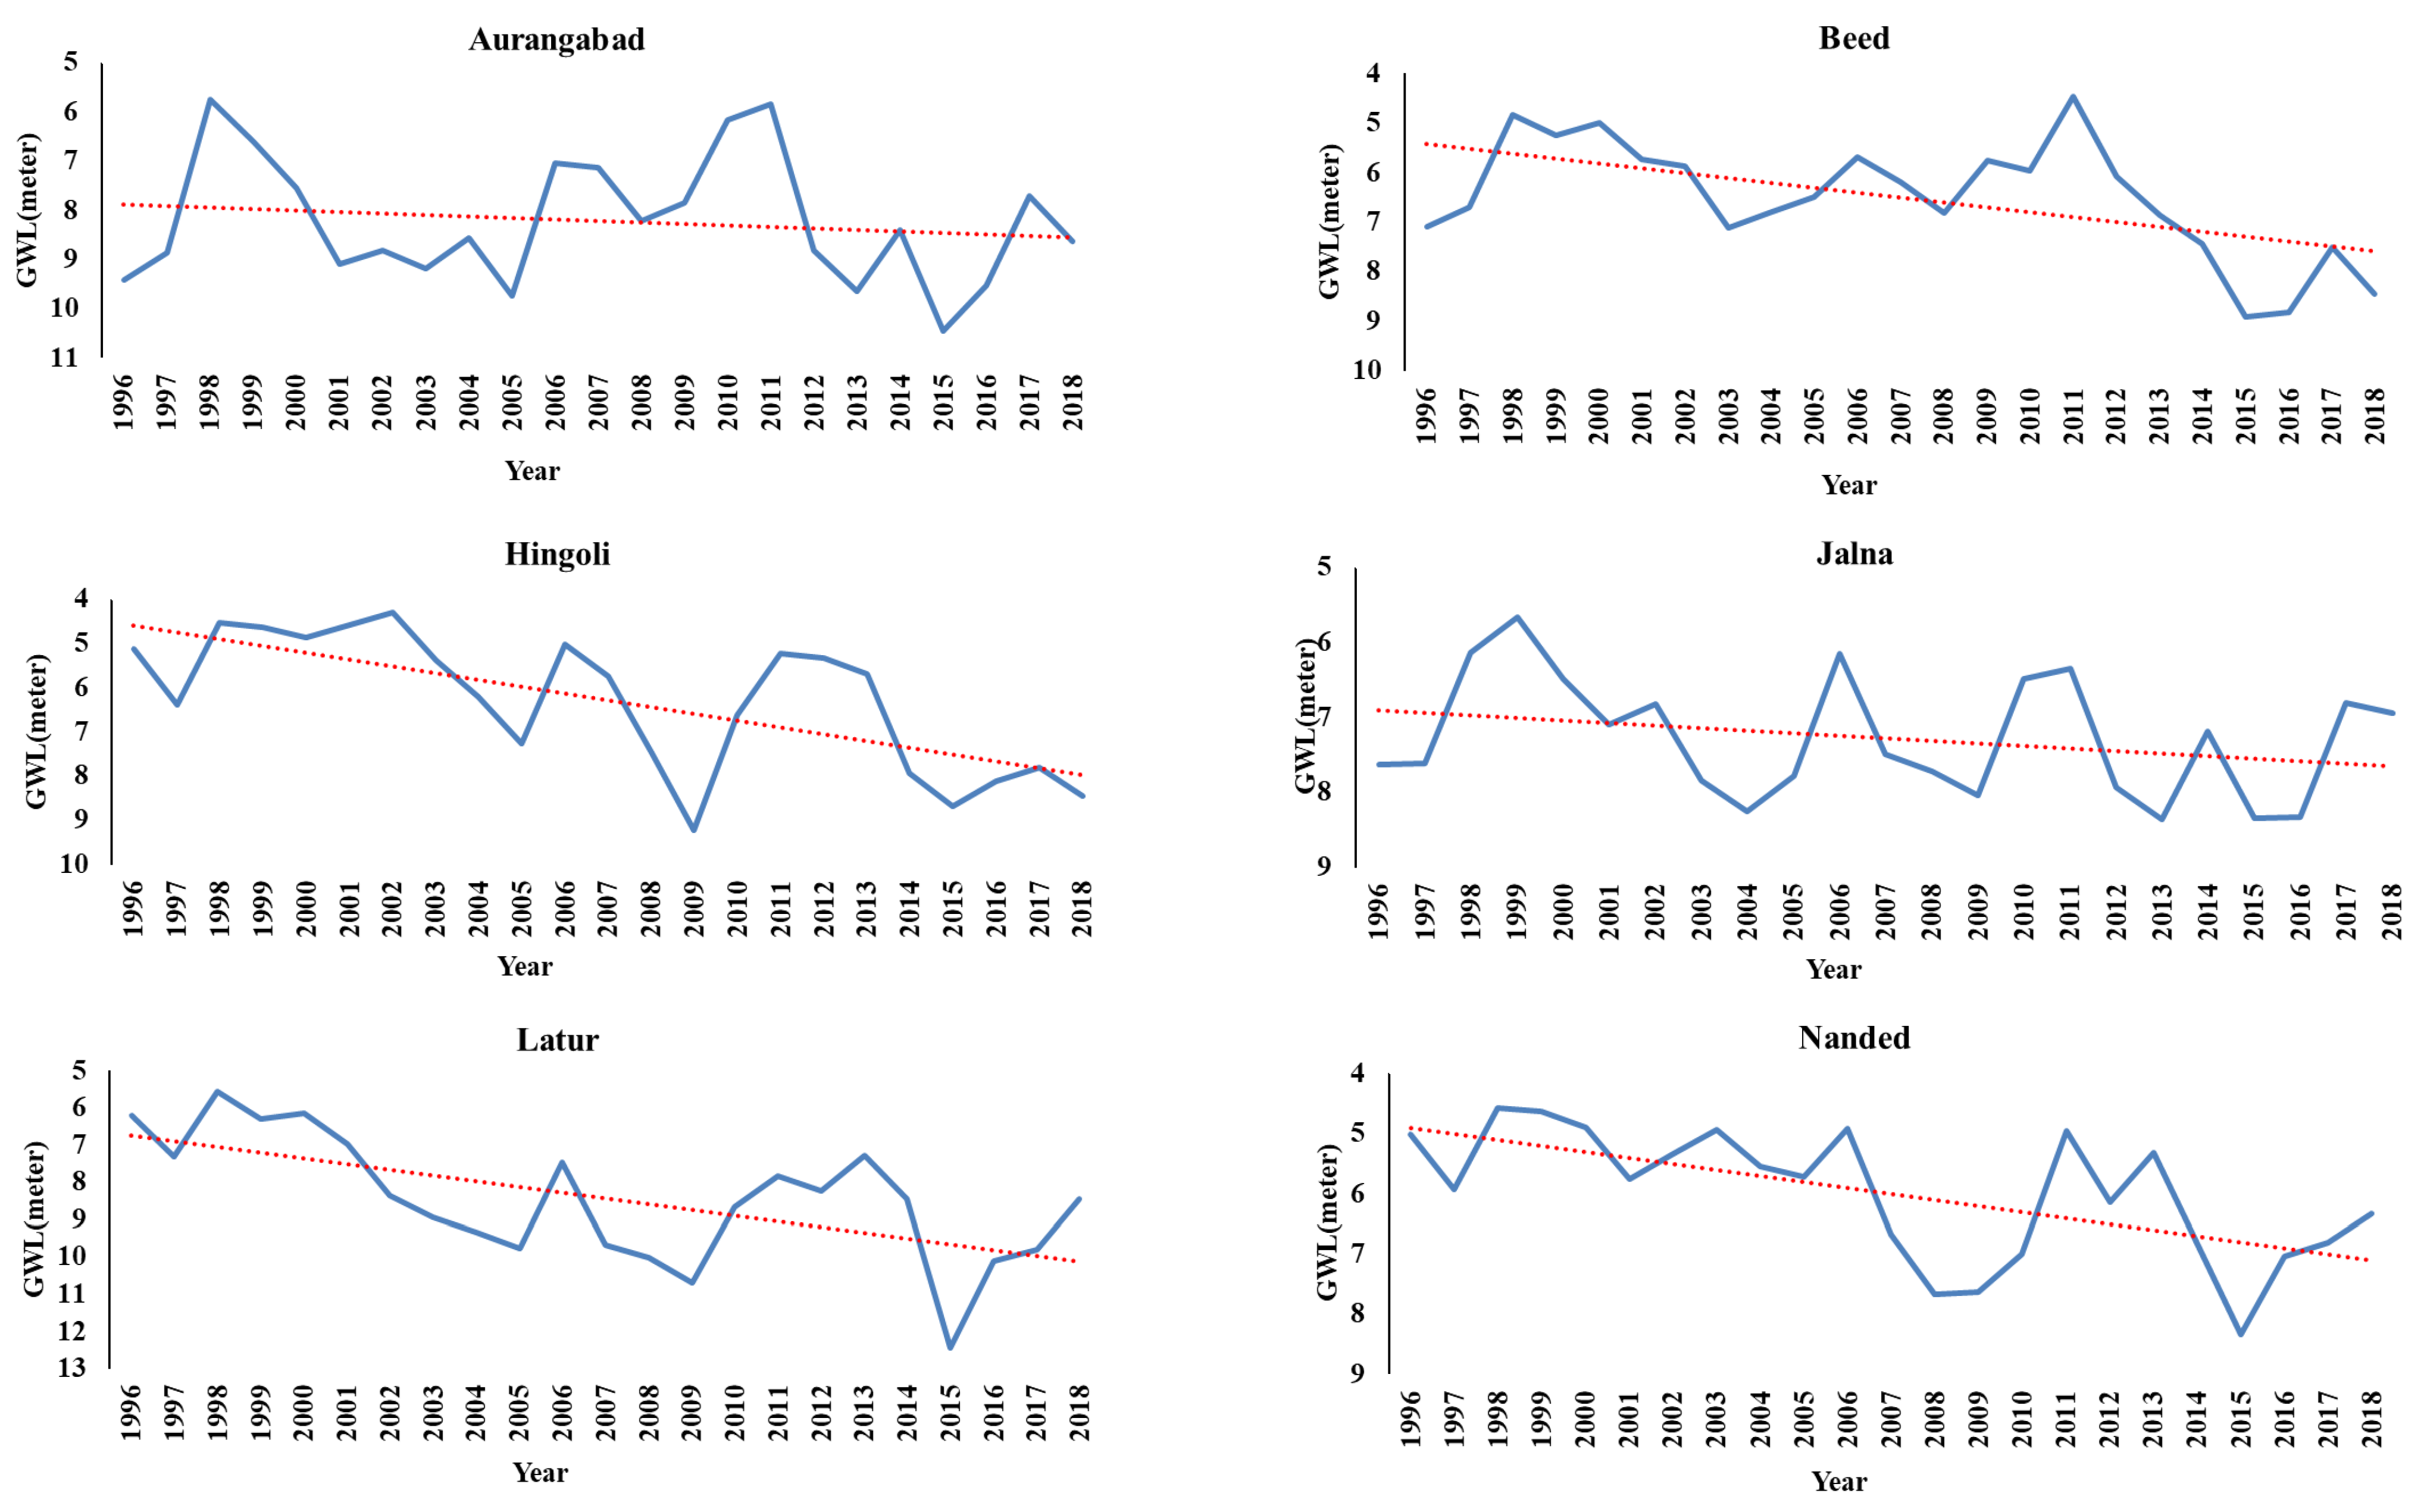
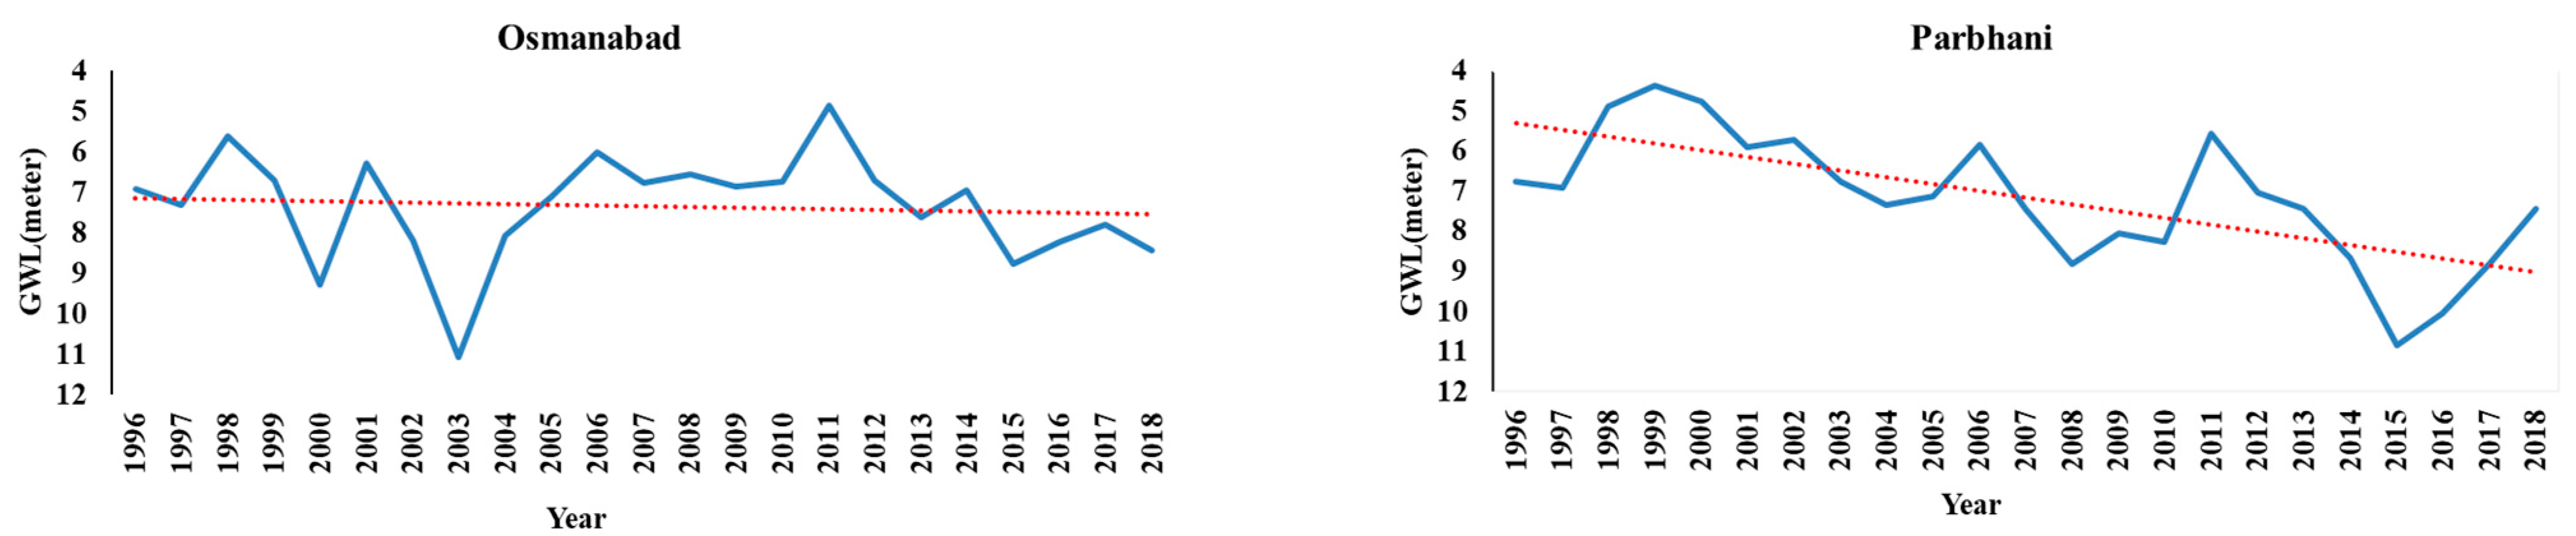
3.3. Ground Water Fluctuations
Ground water is one of the primary sources of fresh water in many parts of India. In recent years, regions such as Marathwada are becoming highly dependent on ground water for agricultural activities and daily human needs. As per the season, many variations are observed in the overall ground water level. Therefore, we have studied trends in ground water at different seasons, i.e., pre-monsoon, post-monsoon, and the year as a whole. From 1996 to 2018, most seasons observed declining trends in the ground water level for all the districts of Marathwada (
Figure 6).
From the last 22 years, the study area as a whole has experienced a significantly declining trend (3.5 m/considered period) in the annual ground water level. The maximum decrease in annual ground water level was noticed in Parbhani (5 m/considered period), Hingoli (4 m/considered period), Nanded, and Beed (4 m/considered period). Only the district of Osmanabad observed the slightly increasing trend in ground water level, but this rise is negligible (
Figure 7).
Seasonal analysis of ground water level reveals that, except for Osmanabad, in all the other districts of Marathwada, the ground water level declines in the pre- and post-monsoon season. During the monsoon season, a variable mix of ground water level trends has been observed. Increasing ground water level trends in the monsoon season were experienced over Beed, Jalna, and Osmanabad. These rising ground water level trends are promising signs of water availability, indicating the occurrence of good monsoon rains over those particulate districts.
3.4. Comparative Analysis of Trends in Rainfall, Agricultural Practices and Ground Water
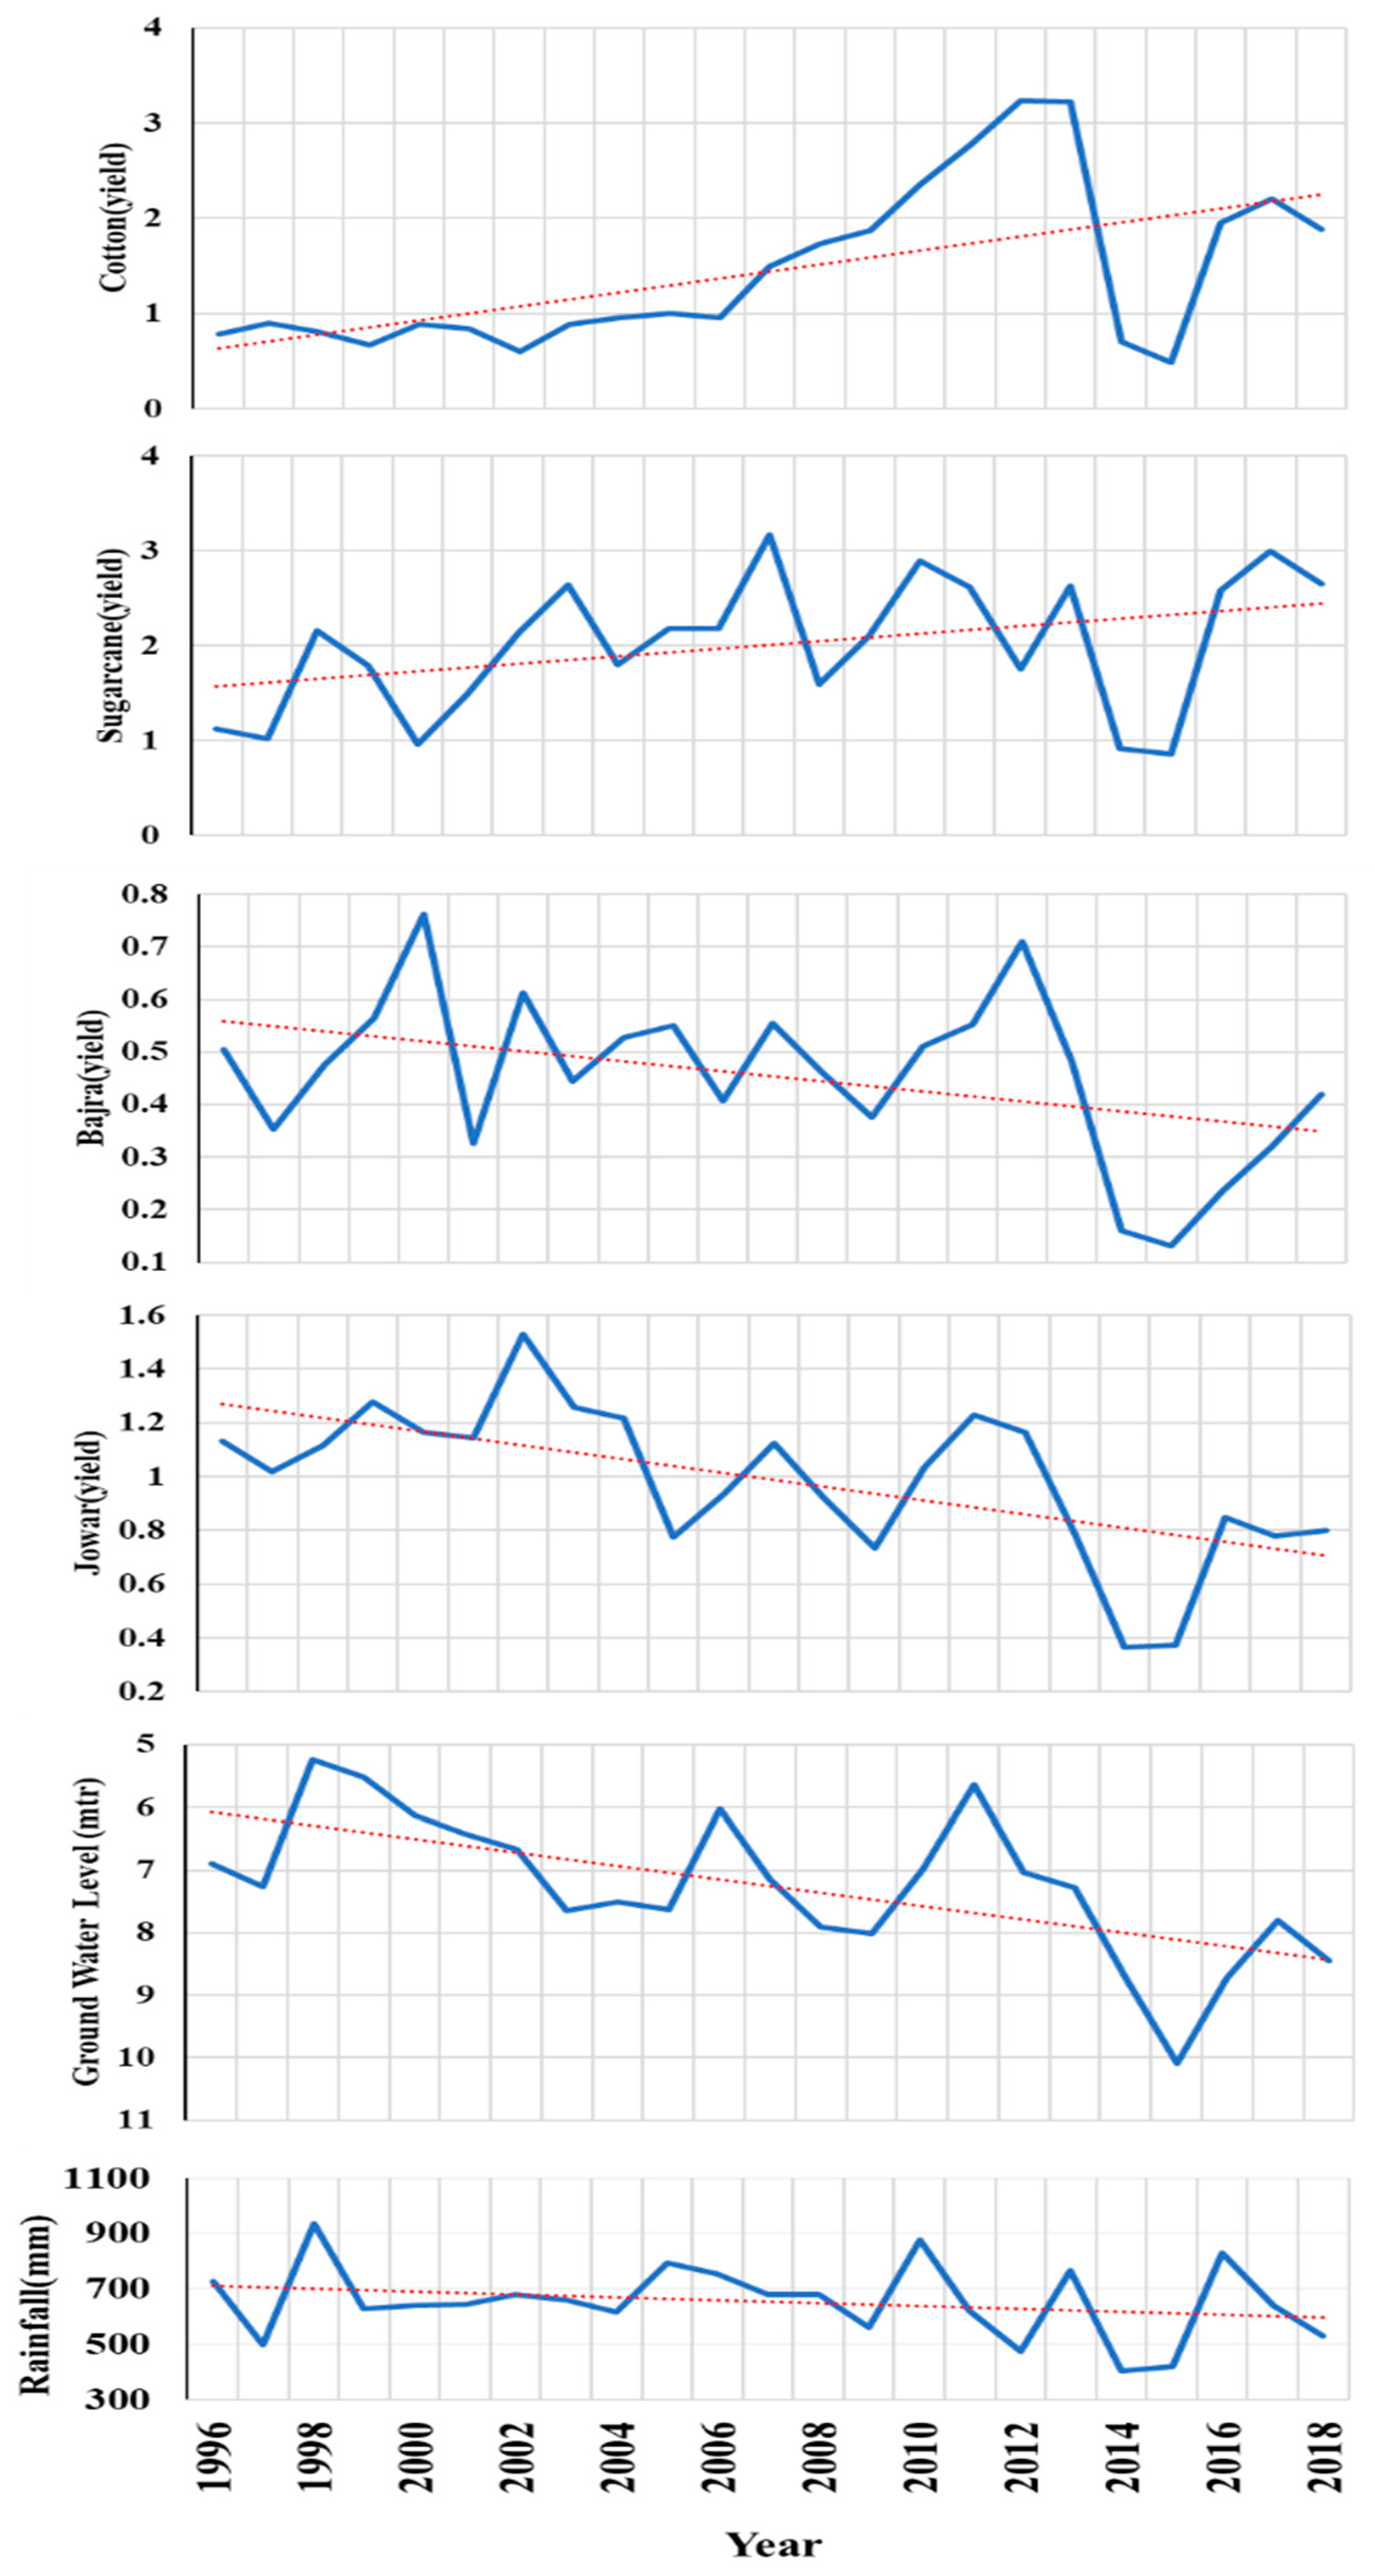
Figure 8 shows the comparative relationship between rainfall trends, ground-water-level changes, and trends in major cultivated crops in Marathwada. The rainfall trend line has highlighted 2002, 2009, 2012, 2014, and 2015 as prominent deficient years from 2001 to 2018. Additionally, it was noticed that over the same years, the ground water level was also significantly low. Conversely, except for some years, crop yield values over those times were comparatively higher. Identically increasing trends of high-water-requirement crops, i.e., cotton and sugarcane, were examined over the drought years (2002, 2012, 2014, and 2015).
These increasing trends and growing crop yield values of high-water-requirement crops (cotton and sugarcane) resulted in less rainfall over the specific year, during which production of such crops was always higher. As other irrigation sources were relatively few [
9], available ground water was the only possible source to fulfill the water demand of the crops. Therefore, extensive depletion in the ground water level may be due to the higher number of water-intensive crops over the drought years.
4. Discussion
In previous studies, the comparative analysis between rainfall vagaries, crop pattern changes, and their impacts on ground water depletion has been insufficient. There have been some research [
37,
38] on district-wide rainfall trends and monsoon variabilities in Marathwada, but this study was able to identify the potential impacts of rainfall vagaries and their association with crop-yield alterations. Prior studies indicate that ground water levels in Marathwada are declining at an alarming rate, and urgent action is needed to address this issue. Few studies reported that the ground water levels in Marathwada had declined by 3 m between 2001 and 2010 [
39,
40], which supports our findings. In addition to this, our work also deals with understanding the long-term (1996–2018) trends in ground water changes which were lacking in the earlier studies.
Several researchers provide significant perspectives into Marathwada’s agro-climatological and socio-economic vulnerability [
41,
42,
43,
44], whereas this study go a bit ahead of them and emphasize the relationship between agro-climatological parameters and their impact on socio-economic indicator, i.e., major cultivated crops in Marathwada. Our research provides valuable insights and documented evidence to the government, policymakers, and decision-makers to guide their strategies and area-specific policy formulation for Marathwada.
The current situation in Marathwada is in a complex phase. Hence, to deal with it, our study recommends implementing a multi-pronged approach (combined involvement of farmers, government, and communities) in the region. This approach involves promoting drought-tolerant crops, adopting precision irrigation techniques, implementing regulations, social awareness, and community involvement. Local government and farmers/local community are the two critical holders for the smooth running of the multi-pronged method.
Government Side—Government authorities and policymakers should focus on area-specific sustainable water management policies and their implementation. Awareness about the efficient use of water through proper water management practices will also help in minimizing water wastage and improve water-use efficiency.
Community/Farmers Side—Considering the rainfall scarcity and its erratic nature in Marathwada, rainwater harvesting can help farmers collect and store rainwater for crop irrigation. Simple rainwater harvesting structures (rooftop rainwater harvesting systems, farm ponds, etc.) could be constructed to capture and store rainwater.
Farmers should consider a holistic approach where soil health, soil erosion, and water management can be taken care of during crop cultivation. The use of mulch, compost fertilizer, conservation tillage, and crop rotation are a few to practice for water consumption according to rainfall availability. In the age of advanced technology, farmers should be provided rainfall forecast a season in advance to manage the crop they should go for. Using advanced agricultural tools, high-quality seeds, organic pesticides, and weather-tolerant crops (smaller in size) will provide profit and satisfaction to the farmers with whichever crop they will grow.
5. Conclusions
This study helped to investigate the reasons behind the increasing severity of droughts and their cumulative impacts on the districts of Marathwada. In general, it is noticed that in Marathwada, the uncertainty of monsoon rainfall and the mixed nature of summer monsoon trends enhance drought conditions, whereas changing agricultural activities and highly depleting ground water levels are the main responsible factors for the amplification of droughts.
From 1996 onwards, per-hectare production of low-water-requirement crops such as jowar, bajra, udad, etc., have decreased significantly; however, the yield, per-hectare production, and total area of crops such as sugarcane, cotton, moong, etc. (high-water-requirement crops) has highly increased, and the cost of water for processing is also high for these crops. In the case of sugarcane, it is a prime source of sugar and ethanol, which requires significant quantities of water, otherwise its production might reduce by a large number [
45].
In the case of annual ground water level, significantly declining trends are detected for most of the districts, but at the same time, there were some pockets of monsoon months in which increasing ground water level was observed in some of the districts. This increasing trend of short durations indicates an adequate ground water level due to the good rainfall in the monsoon season. However, in the post-monsoon season, high water requirements for agricultural activities demand irrigation from the ground water. As the other freshwater sources are negligible over Marathwada, the annual ground water level is vastly reduced and overused for irrigation and factory-based post-cultivation activities of sugarcane and cotton.
Comparative trend analysis of rainfall, crop yield, and ground water level depicts that the cultivation of water-intensive cash crops was high not only in the average monsoon year but also during the drought years, which leads to the unavailability of fresh water for daily social needs. On the other hand, water scarcity is projected to increase by over 80% of the croplands in the future as well [
46]. This concludes that compared to monsoon vagaries, the use of high-water-demanding crop types and anthropogenic activities largely influence the enhancement of severities and frequencies of droughts over Marathwada.
Therefore, this study suggests that the brutality of droughts and its impact on society, including farmer suicides, can be minimized only after properly managing agricultural practices, strictly controlling the over-exploitation of ground water, and implementing effective policy guidelines.
Author Contributions
Conceptualization, S.K. and S.G.; methodology, S.K. and V.B.; software, S.K.; validation, S.K., V.K. and V.B.; formal analysis, S.K.; investigation, S.K.; resources, S.G.; data curation, S.K.; writing—original draft preparation, S.K.; writing—review and editing, S.K., V.B. and V.K.; visualization, S.K.; supervision, S.G. and V.K.; project administration, S.G.; funding acquisition, V.K. All authors have read and agreed to the published version of the manuscript.
Funding
This research received no external funding.
Data Availability Statement
All the datasets are available online on public website for public.
Acknowledgments
The authors acknowledge IIT Bombay for providing all the necessary facilities to carry out this research. The authors thank the Indian Meteorological Department (IMD) and the Ministry of Earth Science for providing the rainfall data. All the authors are grateful to the editor and anonymous reviewers for their rigorous reviews, which greatly improved the quality of the manuscript.
Conflicts of Interest
Authors do not have conflicts of interest.
References
- Gupta, K.R. Water Crisis in India; Atlantic Publishers & Distributors: Delhi, India, 2008; pp. 6–11. [Google Scholar]
- Modi, K.; Polycarpou, L. Addressing the Water Crisis in Gujarat, India; Columbia Water Center: New York, NY, USA, 2011; pp. 12–14. [Google Scholar]
- Kumar, K.; Rajeevan, M.; Pai, D.S.; Srivastava, A.K.; Preethi, B. On the Observed Variability of Monsoon Droughts over India. Weather Clim. Extremes 2013, 1, 42–50. [Google Scholar] [CrossRef]
- Rodell, M.; Velicogna, I.; Famiglietti, J.S. Satellite-Based Estimates of Groundwater Depletion in India. Nature 2009, 460, 999–1002. [Google Scholar] [CrossRef] [PubMed]
- Kulkarni, A.; Gadgil, S.; Patwardhan, S. Monsoon Variability, the 2015 Marathwada Drought and Rainfed Agriculture. Curr. Sci. 2016, 111, 1182–1193. [Google Scholar] [CrossRef]
- Naidu, C.V.; Durgalakshmi, K.; Krishna, K.M.; Rao, S.R.; Satyanarayana, G.C.; Lakshminarayana, P.; Rao, L.M. Is Summer Monsoon Rainfall Decreasing over India in the Global Warming Era? J. Geophys. Res. Atmos. 2009, 114, D17301. [Google Scholar] [CrossRef]
- Mishra, A.K.; Singh, V.P. A Review of Drought Concepts. J. Hydrol. 2010, 391, 202–216. [Google Scholar] [CrossRef]
- Gadgil, S.; Gadgil, S. The Indian monsoon, GDP and agriculture. Econ. Political Wkly. 2006, 47, 4887–4895. Available online: https://www.jstor.org/stable/4418949 (accessed on 25 April 2023).
- Bhat, A.K.; Revi, A. Water Crisis in Earthquake-Affected Areas of Marathwada. Econ. Political Wkly. 2019, 30, 1826–1830. Available online: https://www.jstor.org/stable/4403014 (accessed on 25 April 2023).
- Bhardwaj, S. Climate Variability, Change and Extremes in Jalna; TERI Press: Delhi, India, 2014; pp. 23–25. [Google Scholar]
- Barnett, V.; Payner, R.; Steiner, R. Government of India, Agricultural Statistics at a Glance; Directorate of Economics and Statistics: Delhi, India, 2014; pp. 238–240. [Google Scholar]
- Maharashtra: Water-guzzling sugarcane cultivated on largest. Available online: https://timesofindia.indiatimes.com/city/mumbai/maharashtra-water-guzzling-sugarcane-cultivated-on-largest-area/articleshow/66397347.cms (accessed on 26 April 2023).
- Purandare, P. Droughts in Marathwada. Econ. Political Wkly. 2013, 48, 18–21. Available online: https://www.jstor.org/stable/23527966 (accessed on 25 April 2023).
- Udmale, P.; Ichikawa, Y.S.; Kiem, A.N.; Panda, S. Drought Impacts and Adaptation Strategies for Agriculture and Rural Livelihood in the Maharashtra State of India. Open Agric. J. 2014, 8, 41–47. [Google Scholar] [CrossRef]
- Guhathakurta, P.; Rajeevan, M. Trends in the Rainfall Pattern over India. Int. J. Climatol. 2008, 28, 1453–1469. [Google Scholar] [CrossRef]
- Parthasarathy, B.; Dhar, O.N. A Study of Trends and Periodicities in the Seasonal and Annual Rainfall of India. Indian J. Meteor. Hydrol. Geophys. 1976, 27, 23–28. [Google Scholar] [CrossRef]
- Kothawale, D.R.; Rajeevan, M. Monthly, Seasonal and Annual Rainfall Time Series for All-India, Homogeneous Regions and Meteorological Subdivisions: 1871–2016; Research Report; IITM: Pune, India, 2017; p. 138. [Google Scholar]
- Raghavendra, V.K. Trends and Periodicities of Rainfall in Subdivisions of Maharashtra State. Mausam 1974, 25, 197–210. [Google Scholar] [CrossRef]
- Pai, D.S.; Sridhar, L.; Guhathakurta, P.; Hatwar, H.R. District-wide drought climatology of the southwest monsoon season over India based on standardized precipitation index (SPI). Nat. Hazards 2011, 59, 1797–1813. [Google Scholar] [CrossRef]
- Ade, V.V. Trends and causes of farmers suicide in Maharashtra State, India. Int. J. Sci. Res. Sci. Eng. Technol. 2021, 8, 248–261. [Google Scholar] [CrossRef]
- Singh, D.; Ghosh, S.; Roxy, M.K.; Mcdermid, S. Indian Summer Monsoon: Extreme Events, Historical Changes, and Role of Anthropogenic Forcings. Wiley Interdiscip. Rev. Clim. Change 2019, 10, 547. [Google Scholar] [CrossRef]
- Marathwada’s dry story. Available online: https://www.downtoearth.org.in/news/natural-disasters/marathwada-s-dry-story-53792 (accessed on 26 April 2023).
- Alexandersson, H.; Moberg, A. Homogenization of Swedish temperature data. Part I: Homogeneity test for linear trends. Int. J. Climatol. 1997, 17, 25–34. [Google Scholar] [CrossRef]
- Buishand, T.A. Some Methods for Testing the Homogeneity of Rainfall Records. J. Hydrol. 1982, 58, 11–27. [Google Scholar] [CrossRef]
- Mann, H. Non-Parametric Test against Trend. Econometrica 1945, 13, 245–259. [Google Scholar] [CrossRef]
- Kendall, M. Rank Correlation Methods; Charles Griffin: London, UK, 1975. [Google Scholar]
- Zarenistanak, M.; Dhorde, A.G.; Kripalani, R.H. Temperature Analysis over Southwest Iran: Trends and Projections. Theor. Appl. Climatol. 2014, 116, 103–117. [Google Scholar] [CrossRef]
- Mukhopadhyay, S.; Kulkarni, S.; Kulkarni, P.; Dutta, S. Rainfall Statistics Change in West Bengal (India) from Period 1901–2000. In Geostatistical and Geospatial Approaches for the Characterization of Natural Resources in the Environment; Springer International Publishing: Berlin/Heidelberg, Germany, 2016; p. 29. [Google Scholar]
- Yang, Y.; Tao, B.; Liang, L.; Huang, Y.; Matocha, C.; Lee, C.D.; Sama, M.; Masri, B.E.; Ren, W. Detecting Recent Crop Phenology Dynamics in Corn and Soybean Cropping Systems of Kentucky. Remote Sens. 2021, 13, 1615. [Google Scholar] [CrossRef]
- Estimating Crop Yields and Crop Losses. Available online: https://agriculture.vic.gov.au/crops-and-horticulture/grains-pulses-and-cereals/crop-production/general-agronomy/estimating-crop-yields-and-crop-losses (accessed on 26 April 2023).
- Murthy, J.V. Watershed Management in India; Wiley Eastern: Delhi, India, 1995; pp. 26–28. [Google Scholar]
- IASRI (Indian Agricultural Statistics Research Institute). Agricultural Research Data Book; ACAR: Delhi, India, 2002; pp. 35–38. [Google Scholar]
- Terray, P.; Dominiak, S. Indian Ocean Sea Surface Temperature and El Niño-Southern Oscillation: A New Perspective. JCLI 2005, 18, 1351–1368. [Google Scholar] [CrossRef]
- Kothawale, D.R.; Rupa Kuamr, K. On the Recent Changes in Surface Temperature Trends over India. Geophys. Res. Lett. 2005, 32, 1–4. [Google Scholar] [CrossRef]
- Kothawale, D.R.; Munot, A.A.; Kumar, K.K. Surface Air Temperature Variability over India during 1901–2007, and Its Association with Enso. Clim. Res. 2010, 42, 89–104. [Google Scholar] [CrossRef]
- Brito, G.Q.; Murta, J.R.; Mendonça Filho, S.F. Can rainfall seasonality trigger soil water repellency in a tropical riparian forest? J. For. Res. 2022, 1–8. [Google Scholar] [CrossRef]
- Das, P.K.; Chakraborty, A.; Seshasai, M.V. Spatial analysis of temporal trend of rainfall and rainy days during the Indian Summer Monsoon season using daily gridded (0.5 × 0.5) rainfall data for the period of 1971–2005. Meteorol. Appl. 2014, 21, 481–493. [Google Scholar] [CrossRef]
- Kulkarni, S.S.; Gedam, S.S.; Dhorde, A.G. District Wise Comparative Analysis of Rainfall Trends in Konkan-Goa and Marathwada Meteorological Subdivision of India. Appl. Ecol. Environ. Sci. 2021, 9, 885–894. [Google Scholar] [CrossRef]
- Saha, D.; Ray, R.K. Groundwater Resources of India: Potential, Challenges and Management; Springer: Delhi, India, 2019; pp. 137–140. [Google Scholar]
- As Groundwater Depletes, Drought Looms over State. Available online: https://www.thehindu.com/news/states/as-groundwater-depletes-drought-looms-over-state/article25280470.ece (accessed on 25 January 2021).
- Bhanage, V.; Kulkarni, S.; Sharma, R.; Lee, H.S.; Gedam, S. Enumerating and Modelling the Seasonal alterations of Surface Urban Heat and Cool Island: A Case Study over Indian Cities. Urban Sci. 2023, 7, 38. [Google Scholar] [CrossRef]
- Todmal, R.S. Future Climate Change Scenario over Maharashtra, Western India: Implications of the Regional Climate Model (REMO-2009) for the Understanding of Agricultural Vulnerability. Pure Appl. Geophys. 2021, 178, 155–168. [Google Scholar] [CrossRef]
- Khetwani, S.; Singh, R.B. Drought vulnerability of Marathwada region, India: A spatial analysis. GeoScape 2020, 14, 108–121. [Google Scholar] [CrossRef]
- Kulkarni, S.S.; Wardlow, B.D.; Bayissa, Y.A.; Tadesse, T.; Svoboda, M.D.; Gedam, S.S. Developing a Remote Sensing-Based Combined Drought Indicator Approach for Agricultural Drought Monitoring over Marathwada, India. Remote Sens. 2020, 12, 2091. [Google Scholar] [CrossRef]
- Ferreira, T.H.; Tsunada, M.S.; Bassi, D.; Araújo, P.; Mattiello, L.; Guidelli, G.V.; Righetto, G.L.; Gonçalves, V.R.; Lakshmanan, P.; Menossi, M. Sugarcane Water Stress Tolerance Mechanisms and Its Implications on Developing Biotechnology Solutions. Front. Plant Sci. 2017, 8, 1077. [Google Scholar] [CrossRef]
- Liu, X.; Liu, W.; Tang, Q.; Liu, B.; Wada, Y.; Yang, H. Global agricultural water scarcity assessment incorporating blue and green water availability under future climate change. Earth’s Future 2022, 10, e2021EF002567. [Google Scholar] [CrossRef]
| Disclaimer/Publisher’s Note: The statements, opinions and data contained in all publications are solely those of the individual author(s) and contributor(s) and not of MDPI and/or the editor(s). MDPI and/or the editor(s) disclaim responsibility for any injury to people or property resulting from any ideas, methods, instructions or products referred to in the content. |
© 2023 by the authors. Licensee MDPI, Basel, Switzerland. This article is an open access article distributed under the terms and conditions of the Creative Commons Attribution (CC BY) license (https://creativecommons.org/licenses/by/4.0/).


