
Question of Liability for Emissions from Land Development in Relation to New York State Climate Change Plan

 , , ,
, , ,  , ,
, ,
Abstract
:1. Introduction
The Role of Soils in New York State’s Plan to Reduce Greenhouse Gas (GHG) Emissions

| Key Categories | Details |
|---|---|
| Targets | Status: in law |
| Interim first target: 2030 | |
| Interim target type: reduction of emissions | |
| Coverage | Greenhouse gases: CO2 + others |
| Consumption emissions: no | |
| Historical emissions: no | |
| All territorial emissions: yes | |
| Governance | Plan detail level: no plan |
| Includes reporting on an annual basis: less than annual | |
| Includes equity: yes | |
| Formal mechanisms for accountability: not provided | |
| Offsets and Sinks | Includes plans to utilize external offset credits: yes |
| Details separate emission targets for removals and reductions: no | |
| Includes conditions to utilize offset credits: high environmental integrity, avoid social harm, maximum % of emissions that can be offset, other conditions | |
| Plans for carbon dioxide removal (CDR): not specified |
| Stocks | Area (2016) | |
|---|---|---|
| Soil Order | General Characteristics and Constraints | (km2) (%) |
| Slightly Weathered | 75,956.9 (63.0) | |
| Entisols | Embryonic soils with ochric epipedon | 7307.3 (6.1) |
| Inceptisols | Young soils with ochric or umbric epipedon | 65,119.8 (54.0) |
| Histosols | Organic soils with ≥ 20% of organic carbon | 3529.9 (2.9) |
| Moderately Weathered | 21,519.6 (17.8) | |
| Alfisols | Clay-enriched B horizon with B.S. ≥ 35% | 20,648.1 (17.1) |
| Mollisols | Carbon-enriched soils with B.S. ≥ 50% | 871.6 (0.7) |
| Strongly Weathered | 23,173.3 (19.2) | |
| Spodosols | Coarse-textured soils with albic and spodic horizons | 22,584.7 (18.7) |
| Ultisols | Highly leached soils with B.S. < 35% | 588.5 (0.5) |

2. Materials and Methods
3. Results
3.1. Storage and Value of SOC by Soil Order and Region for New York State
3.2. Storage and Value of SIC by Soil Order and Region for New York State
3.3. Storage and Value of TSC (SOC + SIC) by Soil Order and Region for New York State
3.4. Land Use/Land Cover Change in New York State from 2001 to 2016
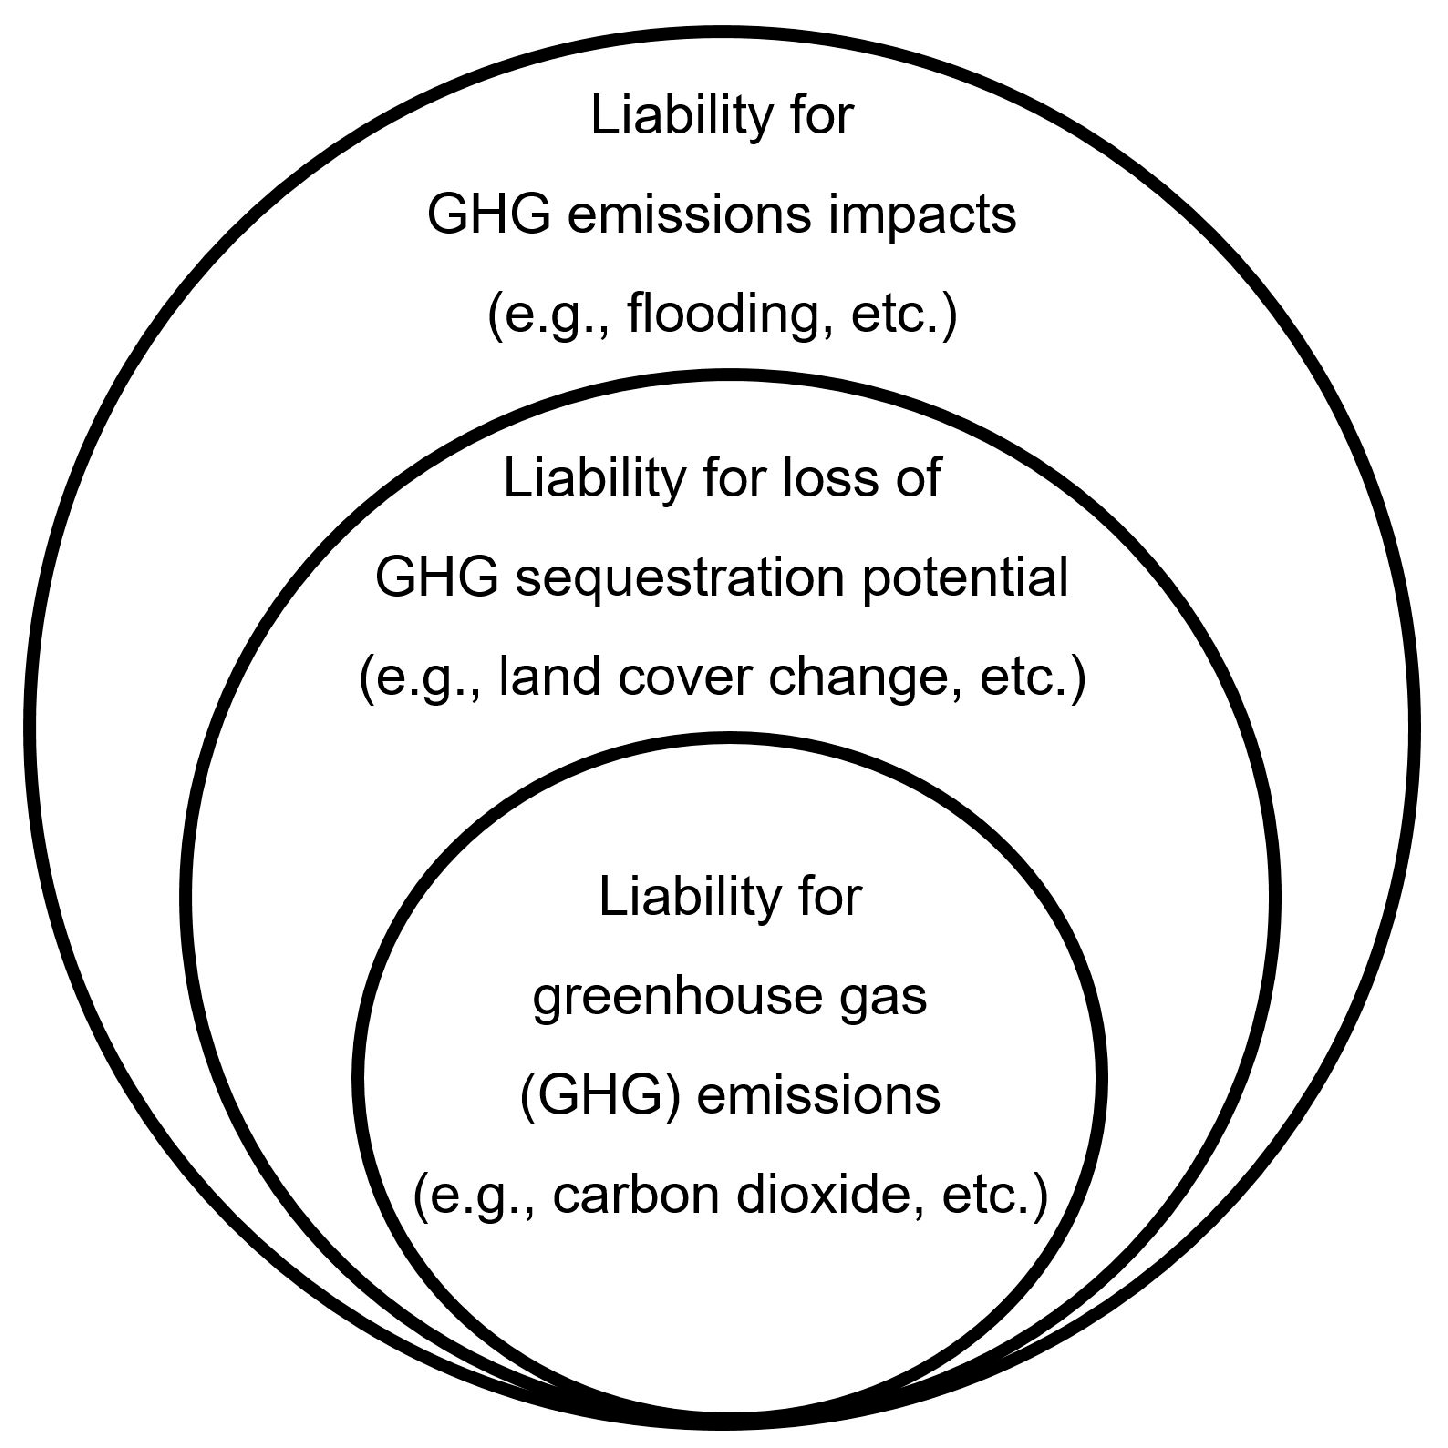
3.5. Liability for Greenhouse Gas (GHG) Emissions from Land Developments
3.6. Liability for Loss of Sequestration Potential from Land Developments
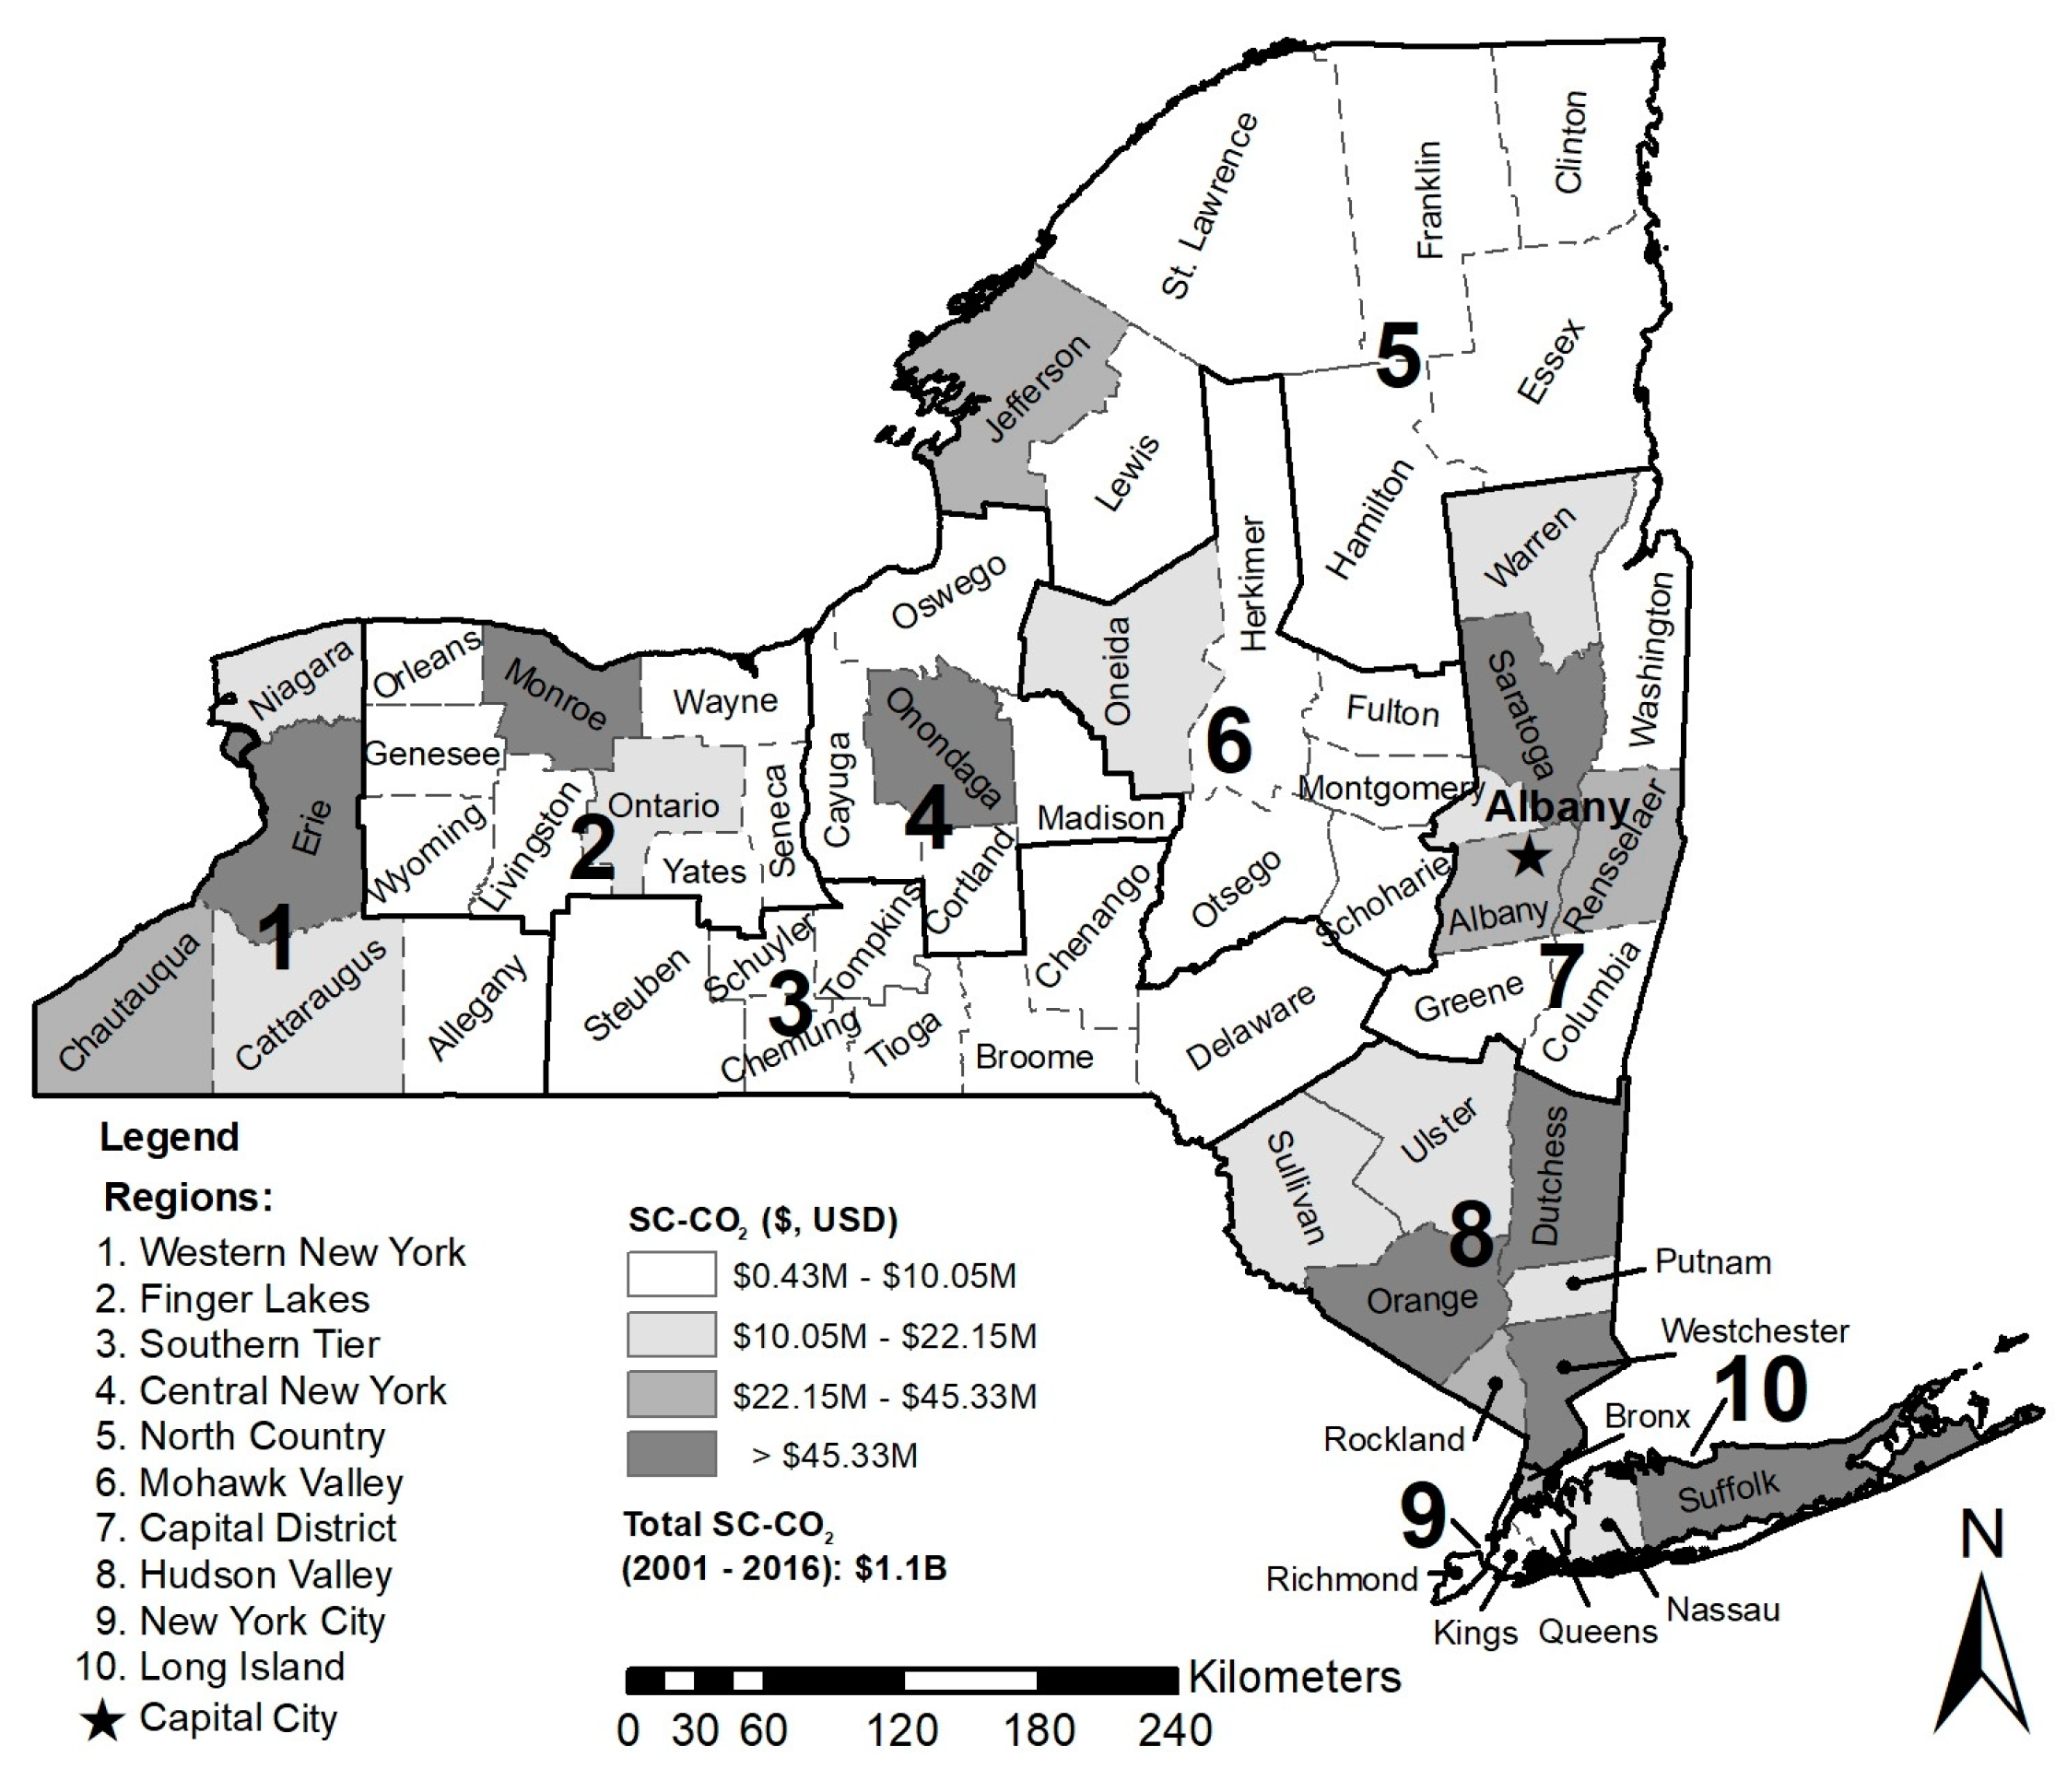
3.7. Liability for Social Costs of Greenhouse Gas (GHG) Emissions from Land Developments
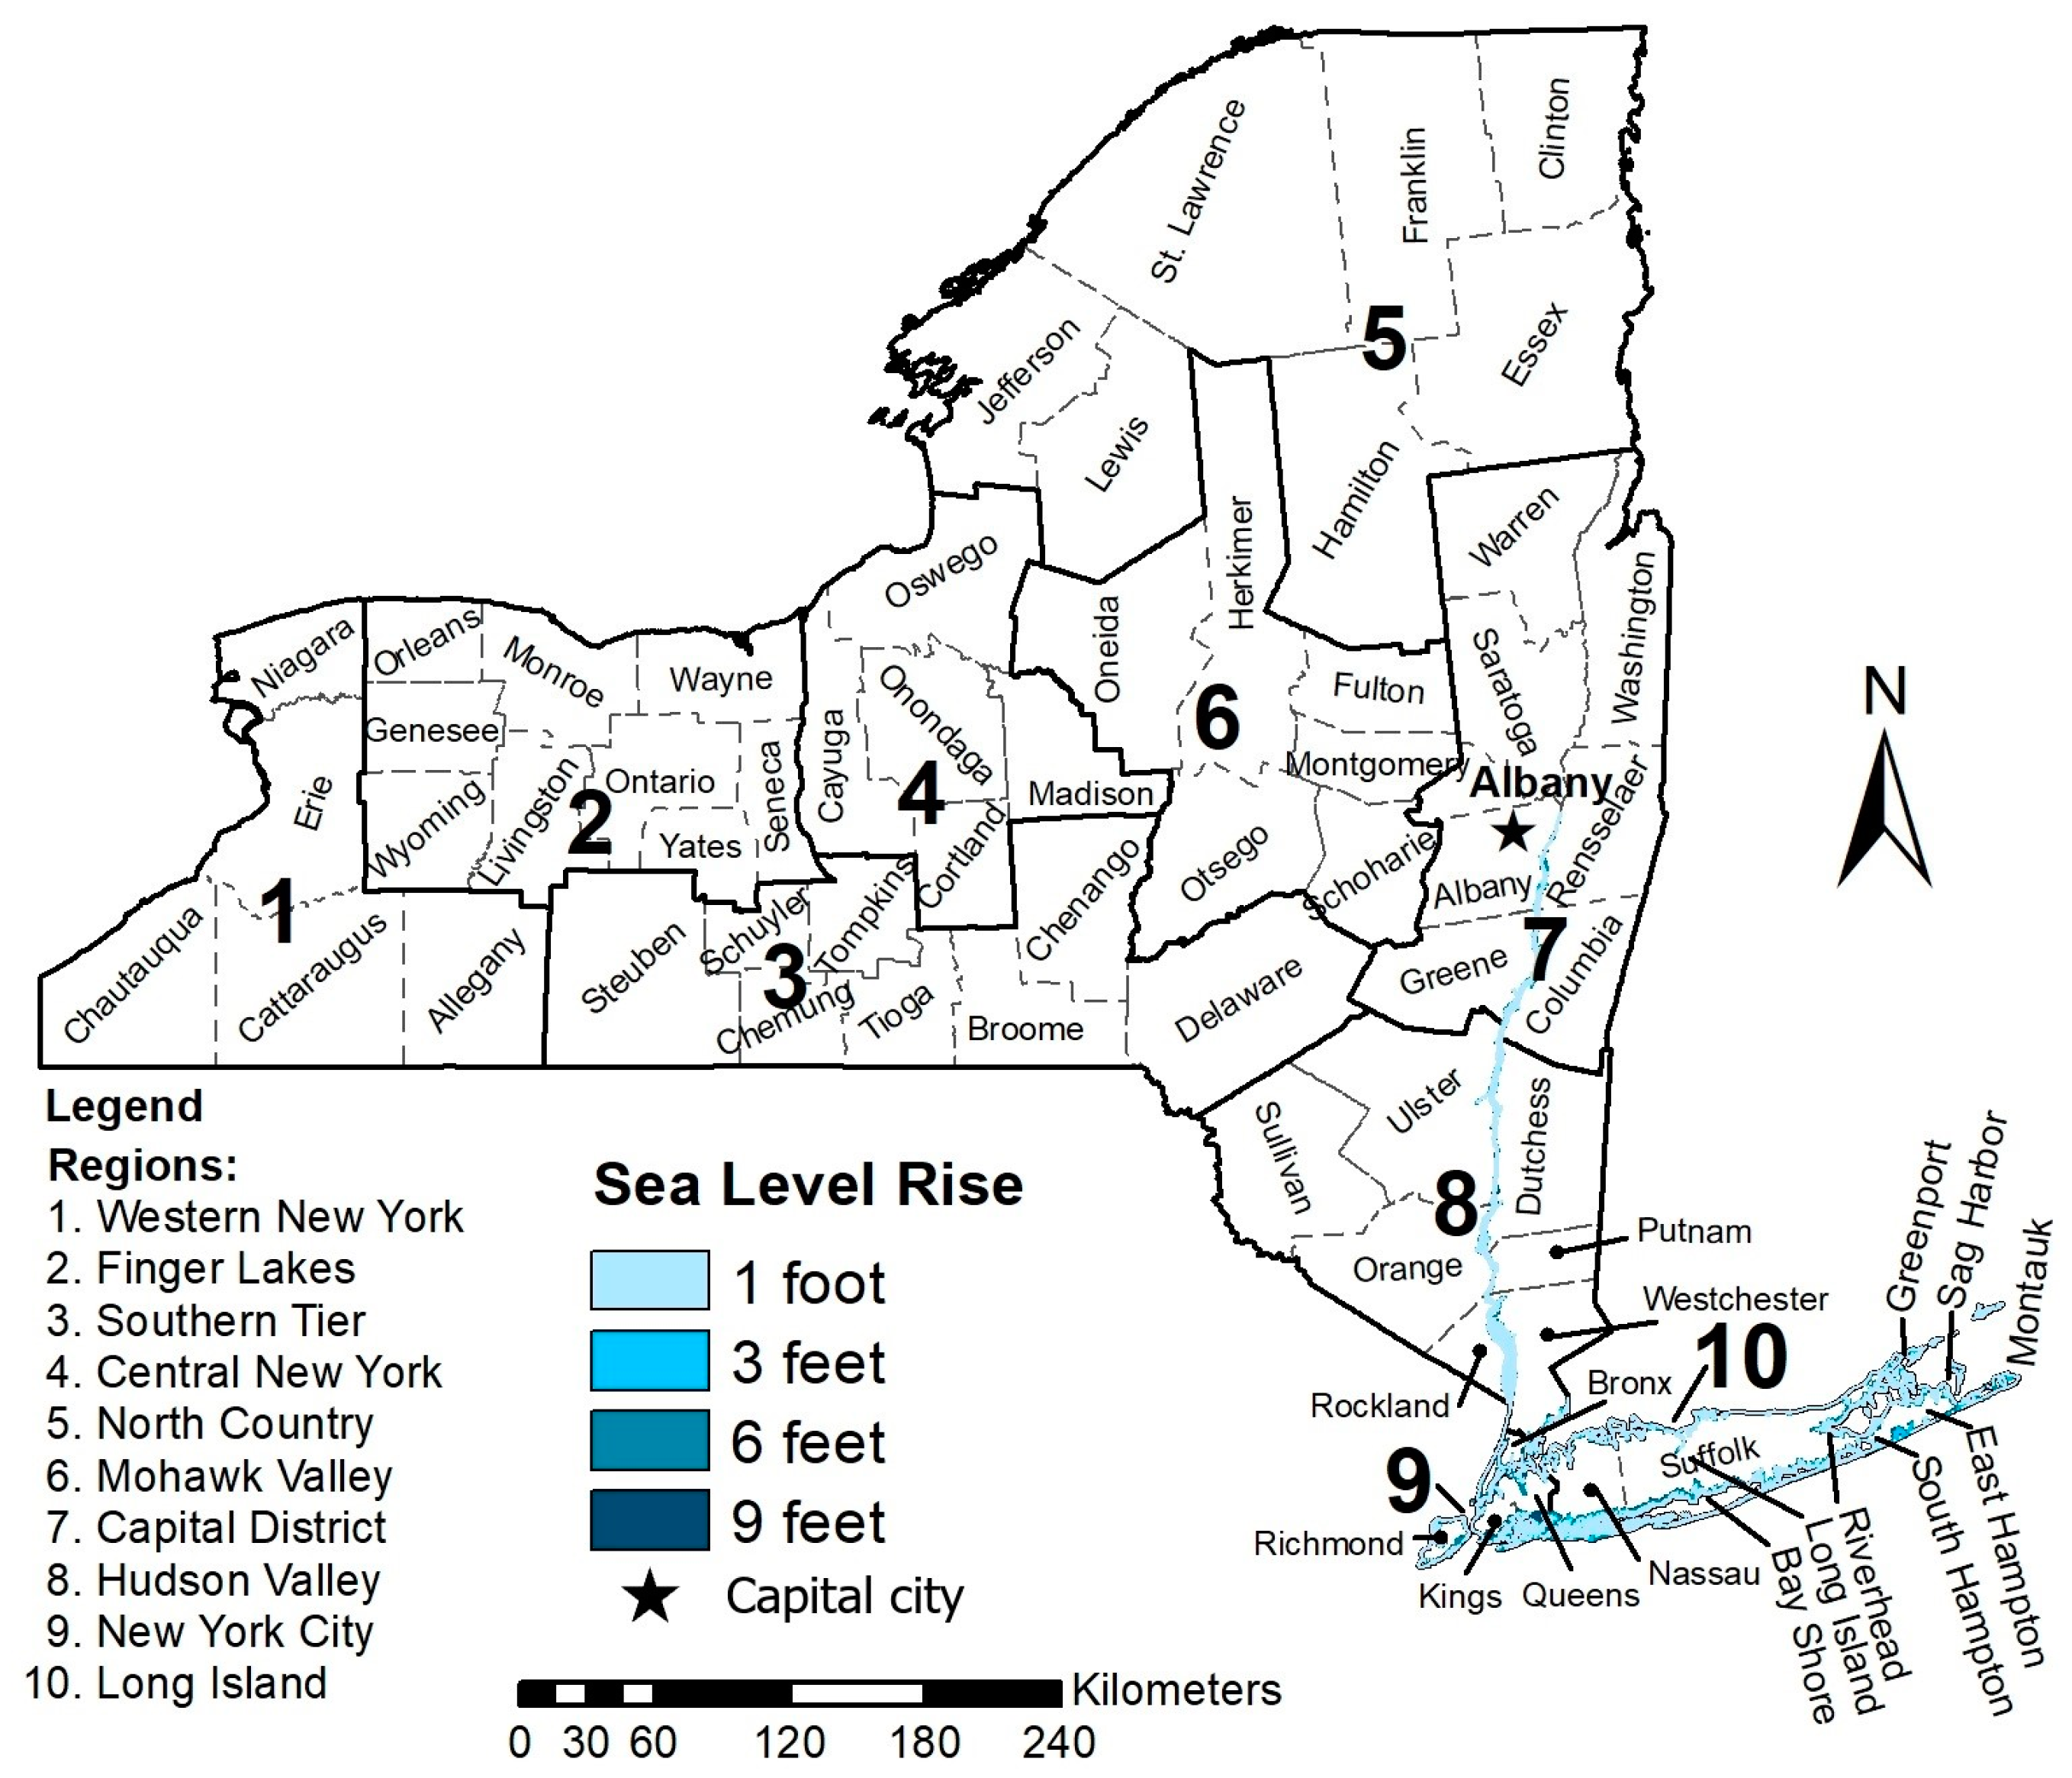
3.8. Example of Liability for Loss and Damage (L&D) from Climate Change Impacts
| Selected Counties (Affected by Sea Rise) | County Area Loss due to Sea Rise (%) | |||
|---|---|---|---|---|
| 1 Foot | 3 Feet | 6 Feet | 9 Feet | |
| Albany | 0.4 | 0.5 | 0.7 | 0.8 |
| Bronx | 3.0 | 3.6 | 6.4 | 10.5 |
| Columbia | 1.4 | 1.5 | 1.7 | 1.8 |
| Dutchess | 2.3 | 2.4 | 2.4 | 2.6 |
| Greene | 1.4 | 1.5 | 1.7 | 1.7 |
| Kings | 6.7 | 7.2 | 12.2 | 22.6 |
| Nassau | 6.2 | 8.3 | 14.3 | 18.2 |
| New York | 2.3 | 2.4 | 7.4 | 15.5 |
| Orange | 0.9 | 1.0 | 1.0 | 1.0 |
| Putnam | 1.1 | 1.2 | 1.2 | 1.2 |
| Queens | 4.2 | 5.1 | 11.9 | 21.8 |
| Rensselaer | 0.4 | 0.5 | 0.8 | 0.9 |
| Richmond | 6.6 | 8.9 | 14.0 | 20.9 |
| Rockland | 10.9 | 11.1 | 11.4 | 11.6 |
| Suffolk | 5.9 | 8.0 | 11.6 | 14.5 |
| Ulster | 1.1 | 1.2 | 1.2 | 1.2 |
| Westchester | 5.2 | 5.4 | 5.8 | 6.2 |
4. Discussion
4.1. Question of Responsibility for Liability for Land Development Emissions
- Measures of Damages under General Tort Law
- Application of General Tort Law to Damages from GHG Emissions
- The Lower Level of Damages Makes Sense
4.2. Significance of Results in a Broader Context
- SDG 2: Zero Hunger. 2.4 Ensure sustainable food production systems and implement resilient agricultural practices to progressively improve land and soil quality.
- -
- There was an increase in cultivated crops (5.5%) and a decrease in the land under hay/pasture (−6.0) between 2001–2016 in NYS (Table 7). This LULC change corresponds with the reduced use of productive soils such as Alfisols and Mollisols (Table 7). This represents a reduced production capacity, which is compounded by land degradation caused by an increase in all types of land development (Table 7).
- SDG 11: Sustainable cities and communities. 11.5 Decrease the direct economic losses caused by disasters which include water-related disasters.
- -
- This study shows that within NYS there is a spatial association between areas with high soil-based GHG emissions and climate change vulnerability. Table 10 shows projected permanent NYS land losses from future sea level rise by county. This sea level rise will affect some of the most populated and high-cost areas in NYS, causing likely displacement of people and damage to buildings and infrastructure.
- SDG 12: Responsible consumption and production. 12.2 By 2030, achieve sustainable management and efficient use of natural resources.
- -
- This study found that all seven soil orders in NYS experienced land conversions caused by land development (Table 7). Highly productive agricultural soils (e.g., Alfisols and Mollisols) experienced land development, while C-rich Histolsols also were developed at the expense of emergent herbaceous wetlands (−4.7%; Table 7). Land development affected C-sequestering and productive soils.
- SDG 13: Climate Action. Take urgent action to combat climate change and its impacts.
- -
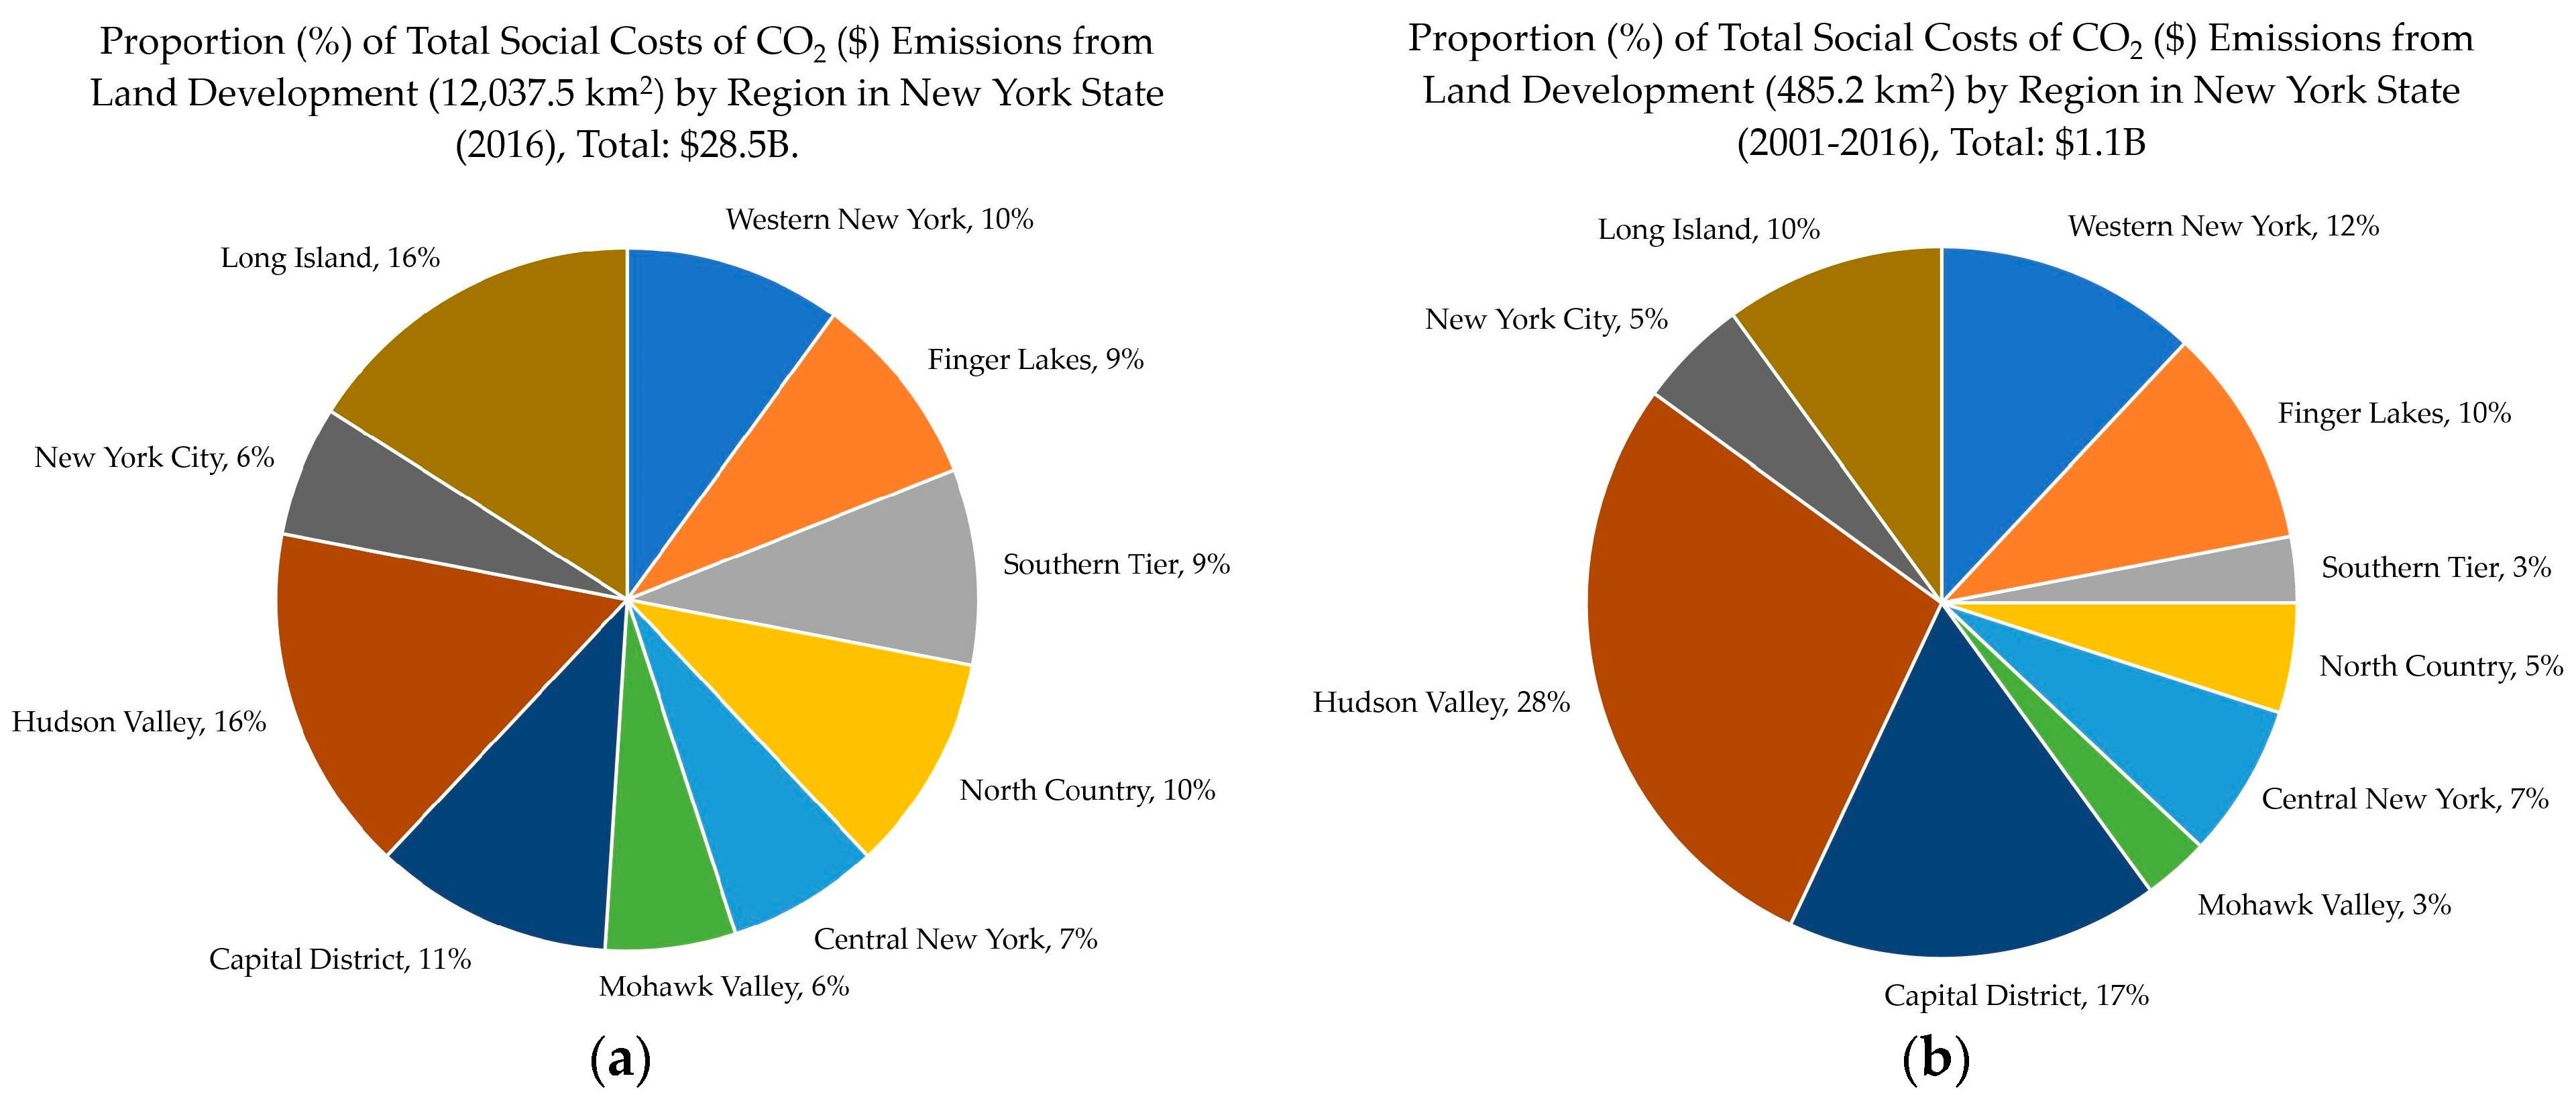
- Although NYS issued Senate Bill S6599, “New York State Climate Leadership and Community Protection Act” (CLCPA) [2], which sets GHG emission reduction targets from anthropogenic sources, it does not include soil-based emissions from land developments. This study provided quantitative estimates of soil-based GHG emissions from past and recent land conversions as well as associated monetary values of SC-CO2. In addition, it quantified the lost area for C sequestration in NYS. The “realized” social costs of CO2 (SC-CO2) emissions for NYS from all land developments (12,037.5 km2, midpoint 1.7 × 10¹¹ of total soil carbon (TSC) losses with midpoint $28.5B (where B = billion = 109, USD)) in social costs of carbon dioxide emissions, SC-CO2) and “new” land developments (485.2 km2) in the period from 2001 to 2016, which caused a complete loss of midpoint 6.6 × 10⁹ kg of TSC resulting in midpoint $1.1B SC-CO2. There is very little land (1.8% of total land area) available for nature-based [19,20] C sequestration methods (e.g., 0.2% barren land, 0.9% shrub/scrub, 0.7% herbaceous) (Table 9). State’s soils have inherently low C sequestration potential. Projected sea-level rise and urbanization will further reduce land availability for C sequestration.
- SDG 15: Life on land. Protect, restore, and promote sustainable use of terrestrial ecosystems, sustainably manage forests, combat desertification, halt and reverse land degradation and biodiversity loss.
- -
- There was an overall degradation in land and soil resources (pedodiversity) related to this goal. Results on LULC change for NYS (2001–2016) showed a reduction in forest area for the following categories: deciduous (−1.4%), and evergreen forest (−0.5%) (Table 7). This represents a reduced production capacity, which is compounded by land degradation caused by an increase in all types of land development (Table 7). This study found that all seven soil orders in NYS experienced land conversions caused by land development (Table 7).
5. Conclusions
Supplementary Materials
Author Contributions
Funding
Data Availability Statement
Acknowledgments
Conflicts of Interest
Glossary
| B | Billion |
| BS | Base saturation |
| CF | Carbon footprint |
| CCA | Climate Change Adaptation |
| CO2 | Carbon dioxide |
| CLCPA | Climate Leadership and Community Protection Act |
| ED | Ecosystem disservices |
| ES | Ecosystem services |
| EPA | Environmental Protection Agency |
| GHG | Greenhouse Gases |
| L&D | Loss and damage |
| LULC | Land use/land cover |
| LULCC | Land use/land cover change |
| M | Million |
| N | North |
| NOAA | National Oceanic and Atmospheric Administration |
| NRCS | Natural Resources Conservation Service |
| NY | New York |
| NYC | New York City |
| NYS | New York State |
| PPP | Polluter-pays-principle |
| RCCA | Reverse Climate Change Adaptation |
| SC-CO2 | Social cost of carbon emissions |
| SOC | Soil organic carbon |
| SIC | Soil inorganic carbon |
| SOM | Soil organic matter |
| SSURGO STATSGO | Soil Survey Geographic Database State Soil Geographic Database |
| TSC | Total soil carbon |
| USDA | United States Department of Agriculture |
| W | West |
| WIM | Warsaw International Mechanism |
References
- European Court of Auditors. 2021. The Polluter Pays Principle: Inconsistent Application across EU Environmental Policies and Actions. Special Report. Available online: https://www.eca.europa.eu/Lists/ECADocuments/SR21_12/SR_polluter_pays_principle_EN.pdf (accessed on 5 February 2023).
- State of New York Senate Bill S6599. New York State Climate Leadership and Community Protection Act (CLCPA). Available online: https://www.nysenate.gov/legislation/bills/2019/S6599 (accessed on 5 February 2023).
- Department of Environmental Conservation. 2022 Statewide GHG Emissions Report. Summary Report. Available online: https://www.dec.ny.gov/docs/administration_pdf/ghgsumrpt22.pdf (accessed on 5 February 2023).
- Soil Science Society of America. n.d. USDA. Honeoye—New York State Soil. Available online: https://www.soils4teachers.org/files/s4t/k12outreach/ny-state-soil-booklet.pdf (accessed on 5 February 2023).
- Net-zero Tracker. 2023. Available online: https://zerotracker.net/ (accessed on 5 February 2023).
- Mikhailova, E.A.; Zurqani, H.A.; Post, C.J.; Schlautman, M.A.; Post, G.C. Soil diversity (pedodiversity) and ecosystem services. Land 2021, 10, 288. [Google Scholar] [CrossRef]
- Soil Survey Staff, Natural Resources Conservation Service, United States Department of Agriculture. n.d.a. Soil Survey Geographic (SSURGO) Database. Available online: https://nrcs.app.box.com/v/soils (accessed on 10 September 2022).
- The United States Census Bureau. 2018. TIGER/Line Boundary Shapefiles. Available online: https://www.census.gov/cgi-bin/geo/shapefiles/index.php (accessed on 10 September 2022).
- The Nature Conservancy. Climate Change Impacts in New York. Available online: https://www.nature.org/media/initiatives/new_york_factsheet_5.pdf (accessed on 5 February 2023).
- EPA—United States Environmental Protection Agency. What climate change means for New York. EPA 430-F-16-034. August 2016. Available online: https://19january2017snapshot.epa.gov/sites/production/files/2016-09/documents/climate-change-ny.pdf (accessed on 5 February 2023).
- Paul, R.; Rajkovich, N.B.; Tuzzo, M.E.; Bohm, M.; Roberts, B. Regional Costs of Climate-Related Hazards for the New York State Building Sector. New York State Energy Research and Development Authority (NYSERDA), Albany, New York. 2018. Available online: https://archplan.buffalo.edu/content/dam/ap/PDFs/NYSERDA/Regional-Costs-of-Climate-Related-Hazards.pdf (accessed on 5 February 2023).
- EPA—United States Environmental Protection Agency, The Social Cost of Carbon. EPA Fact Sheet. 2016. Available online: https://19january2017snapshot.epa.gov/climatechange/social-cost-carbon_.html (accessed on 15 September 2022).
- Guo, Y.; Amundson, R.; Gong, P.; Yu, Q. Quantity and spatial variability of soil carbon in the conterminous United States. Soil Sci. Soc. Am. J. 2006, 70, 590–600. [Google Scholar] [CrossRef] [Green Version]
- Groshans, G.R.; Mikhailova, E.A.; Post, C.J.; Schlautman, M.A.; Zhang, L. Determining the value of soil inorganic carbon stocks in the contiguous United States based on the avoided social cost of carbon emissions. Resources 2019, 8, 119. [Google Scholar] [CrossRef] [Green Version]
- Multi-Resolution Land Characteristics Consortium—MRLC. Available online: https://www.mrlc.gov/ (accessed on 1 September 2021).
- ESRI (Environmental Systems Research Institute). ArcGIS Pro 2.6. Available online: https://pro.arcgis.com/en/pro-app/2.6/get-started/whats-new-in-arcgis-pro.htm (accessed on 1 March 2022).
- Mikhailova, E.A.; Groshans, G.R.; Post, C.J.; Schlautman, M.A.; Post, G.C. Valuation of total soil carbon stocks in the contiguous United States based on the avoided social cost of carbon emissions. Resources 2019, 8, 157. [Google Scholar] [CrossRef] [Green Version]
- Soil Survey Staff, Natural Resources Conservation Service, United States Department of Agriculture. Photos of Soil Orders. Available online: https://www.nrcs.usda.gov/wps/portal/nrcs/detail/soils/edu/?cid=nrcs142p2_053588 (accessed on 20 September 2022).
- Keesstra, S.; Nunes, J.; Novara, A.; Finger, D.; Avelar, D.; Kalantari, Z.; Cerdà, A. The superior effect of nature based solutions in land management for enhancing ecosystem services. Sci. Total Environ. 2018, 610–611, 997–1009. [Google Scholar] [CrossRef] [PubMed] [Green Version]
- Di Sacco, A.; Hardwick, K.A.; Blakesley, D.; Brancaliom, P.H.S.; Breman, E.; Rebola, L.C.; Chomba, S.; Dixon, K.; Elliot, S.; Ruyonga, G.; et al. Ten golden rules for reforestation to optimize carbon sequestration, biodiversity recovery and livelihood benefits. Glob. Chang. Biol. 2021, 27, 1328–1348. [Google Scholar] [CrossRef] [PubMed]
- Gasser, T.; Crepin, L.; Quilcaille, Y.; Houghton, R.A.; Cias, P.; Obersteiner, M. Historical CO2 emissions from land use and land cover change and their uncertainty. Biogeosciences 2020, 17, 4075–4101. [Google Scholar] [CrossRef]
- Vanhala, L.; Hestbaek, C. Framing climate change loss and damage in UNFCCC negotiations. Glob. Environ. Polit. 2016, 16, 111–129. [Google Scholar] [CrossRef]
- United Nations. Paris Agreement. 2015. Available online: https://unfccc.int/sites/default/files/english_paris_agreement.pdf (accessed on 30 November 2022).
- UN Climate Press Release. COP27 Reaches Breakthrough Agreement on New “Loss and Damage” Fund for Vulnerable Countries. 20 November 2022. Available online: https://unfccc.int/news/cop27-reaches-breakthrough-agreement-on-new-loss-and-damage-fund-for-vulnerable-countries (accessed on 30 November 2022).
- Bhandari, P.; Warszawski, N.; Cogan, D.; Gerholdt, R. What Is “Loss and Damage” from Climate Change? 6 Key Questions, Answered. World Resources Institute. 2022. Available online: https://www.wri.org/insights/loss-damage-climate-change (accessed on 30 November 2022).
- Gornitz, V.; Couch, S.; Hartig, E.K. Impacts of sea level rise in the New York City metropolitan area. Glob. Planet. Chang. 2002, 32, 61–88. [Google Scholar] [CrossRef]
- National Oceanic and Atmospheric Administration (NOAA). Climate.gov. Available online: https://www.climate.gov/maps-data (accessed on 2 October 2022).
- Hutton, P.C.; Mikhailova, E.A.; Lin, L.; Hao, Z.; Zurqani, H.A.; Post, C.J.; Schlautman, M.A.; Shepherd, G.B. Net-zero target and emissions from land conversions: A case study of Maryland’s Climate Solutions Now Act. Geographies 2023, 3, 40–59. [Google Scholar] [CrossRef]
- Heidari, N.; Pearce, J.M. A review of greenhouse gas emission liability as the value of renewable energy for mitigating lawsuits for climate change related damages. Renew. Sustain. Energy Rev. 2016, 55, 899–908. [Google Scholar] [CrossRef] [Green Version]
- Reimund, S. Liability for climate change: The benefits, the costs, and the transaction costs. Responses to Global Warming: The Law, Economics, and Science of Climate Change. Univ. Pa. Law Rev. 2007, 155, 1947–1952. [Google Scholar]
- Khan, M.R. Polluter-Pays-Principle: The cardinal instrument for addressing climate change. Laws 2015, 4, 638–653. [Google Scholar] [CrossRef] [Green Version]
- Catenacci, T. New York Climate Law Defines Ritzy Communities with Million-Dollar Homes as “Disadvantaged.” Fox News Published. 5 April 2023. Available online: https://www.foxnews.com/politics/new-york-climate-law-defines-ritzy-communities-million-dollar-homes-disadvantaged (accessed on 7 April 2023).
- Hattori, K. Responsibilities for Climate Damage within Borders: Reconciling Liability with Shared Responsibility. Philosophies 2021, 6, 65. [Google Scholar] [CrossRef]
- Grabar, H. What Happens When You Add a Hurricane Crisis to an Insurance Crisis? 2022. Slate. Available online: https://slate.com/business/2022/10/florida-hurricane-ian-insurance-homeowners-crisis.html (accessed on 10 December 2022).
- Bagenstose, K. A climate reckoning for US housing: Too many homes in harm’s way, ‘too many zeros’ in the costs. USA Today, 5 November 2022. [Google Scholar]
- Posner, R.A. Economic Analysis of Law; Little, Brown and Company: Boston, MA, USA, 1973. [Google Scholar]
- Restatement of the Law, Second, Torts § 211. Available online: https://scholarship.law.wm.edu/cgi/viewcontent.cgi?article=1116&context=wmblr (accessed on 10 December 2022).
- Dobbs, D.B. The Law of Torts (American Casebooks) Sec. 201; West Publishing Co.: St. Paul, MN, USA, 2000. [Google Scholar]
- Restatement of the Law, Second, Torts § 203. Available online: https://www.cobar.org/Portals/COBAR/Repository/Sections/UTC/UTC_Sept2016_Restat%202d%20of%20Trusts_%20_%20203.pdf (accessed on 10 December 2022).
- Restatement of the Law, Second, Torts § 215. Available online: https://h2o.law.harvard.edu/collages/9898 (accessed on 10 December 2022).
- James Hardie Gypsum, Inc. v. Inquipco, 112 Nev. 1397. Available online: https://casetext.com/case/james-hardie-gypsum-inc-v-inquipco (accessed on 10 December 2022).
- Dobbs, D.B. Preston v. Keith, 217 Conn 12 (1991). In The Law of Torts sec. 203; West Publishing Co.: St. Paul, MN, USA, 2000. [Google Scholar]
- UN. Transforming Our World: The 2030 Agenda for Sustainable Development, New York; UN: Geneva, Switzerland, 2015. [Google Scholar]
- Yin, C.; Zhao, W.; Pereira, P. Soil conservation service underpins sustainable development goals. Glob. Ecol. Conserv. 2022, 33, e01974. [Google Scholar] [CrossRef]
- Report of the Inter-Agency and Expert Group on Sustainable Development Goal Indicators. 2016. United Nations Economic and Social Council. Available online: https://digitallibrary.un.org/record/821651?ln=en (accessed on 9 May 2023).


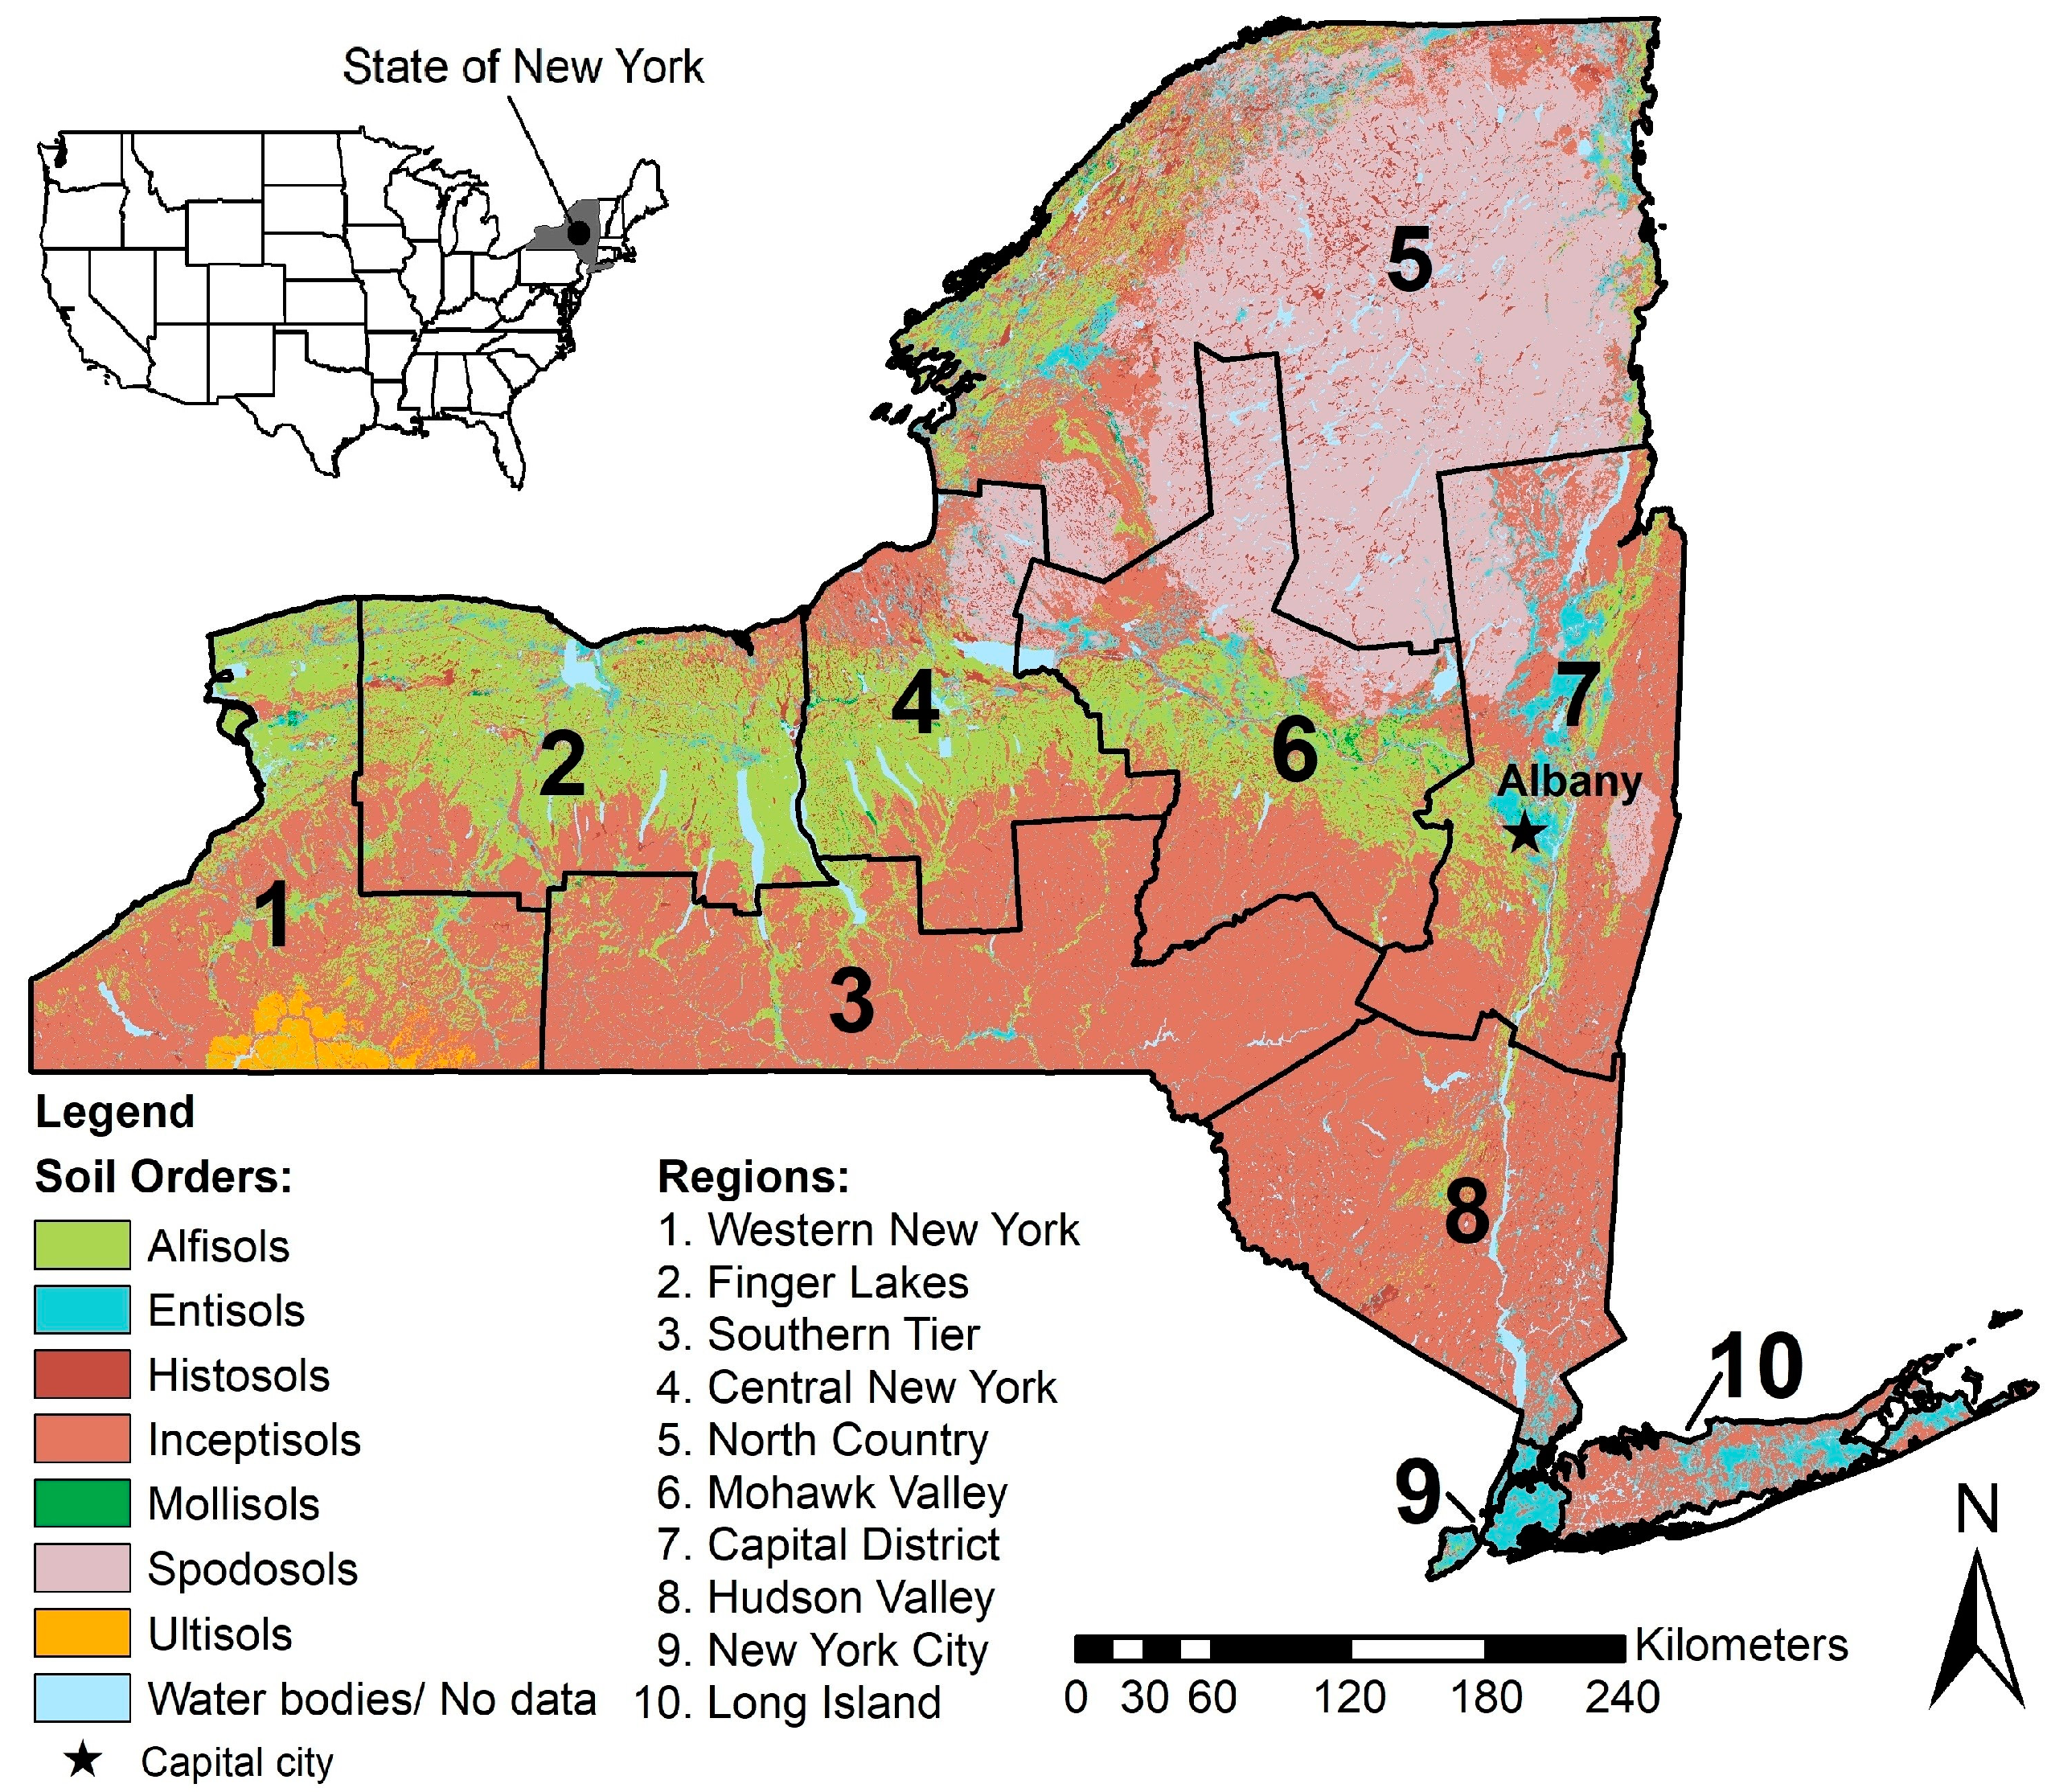
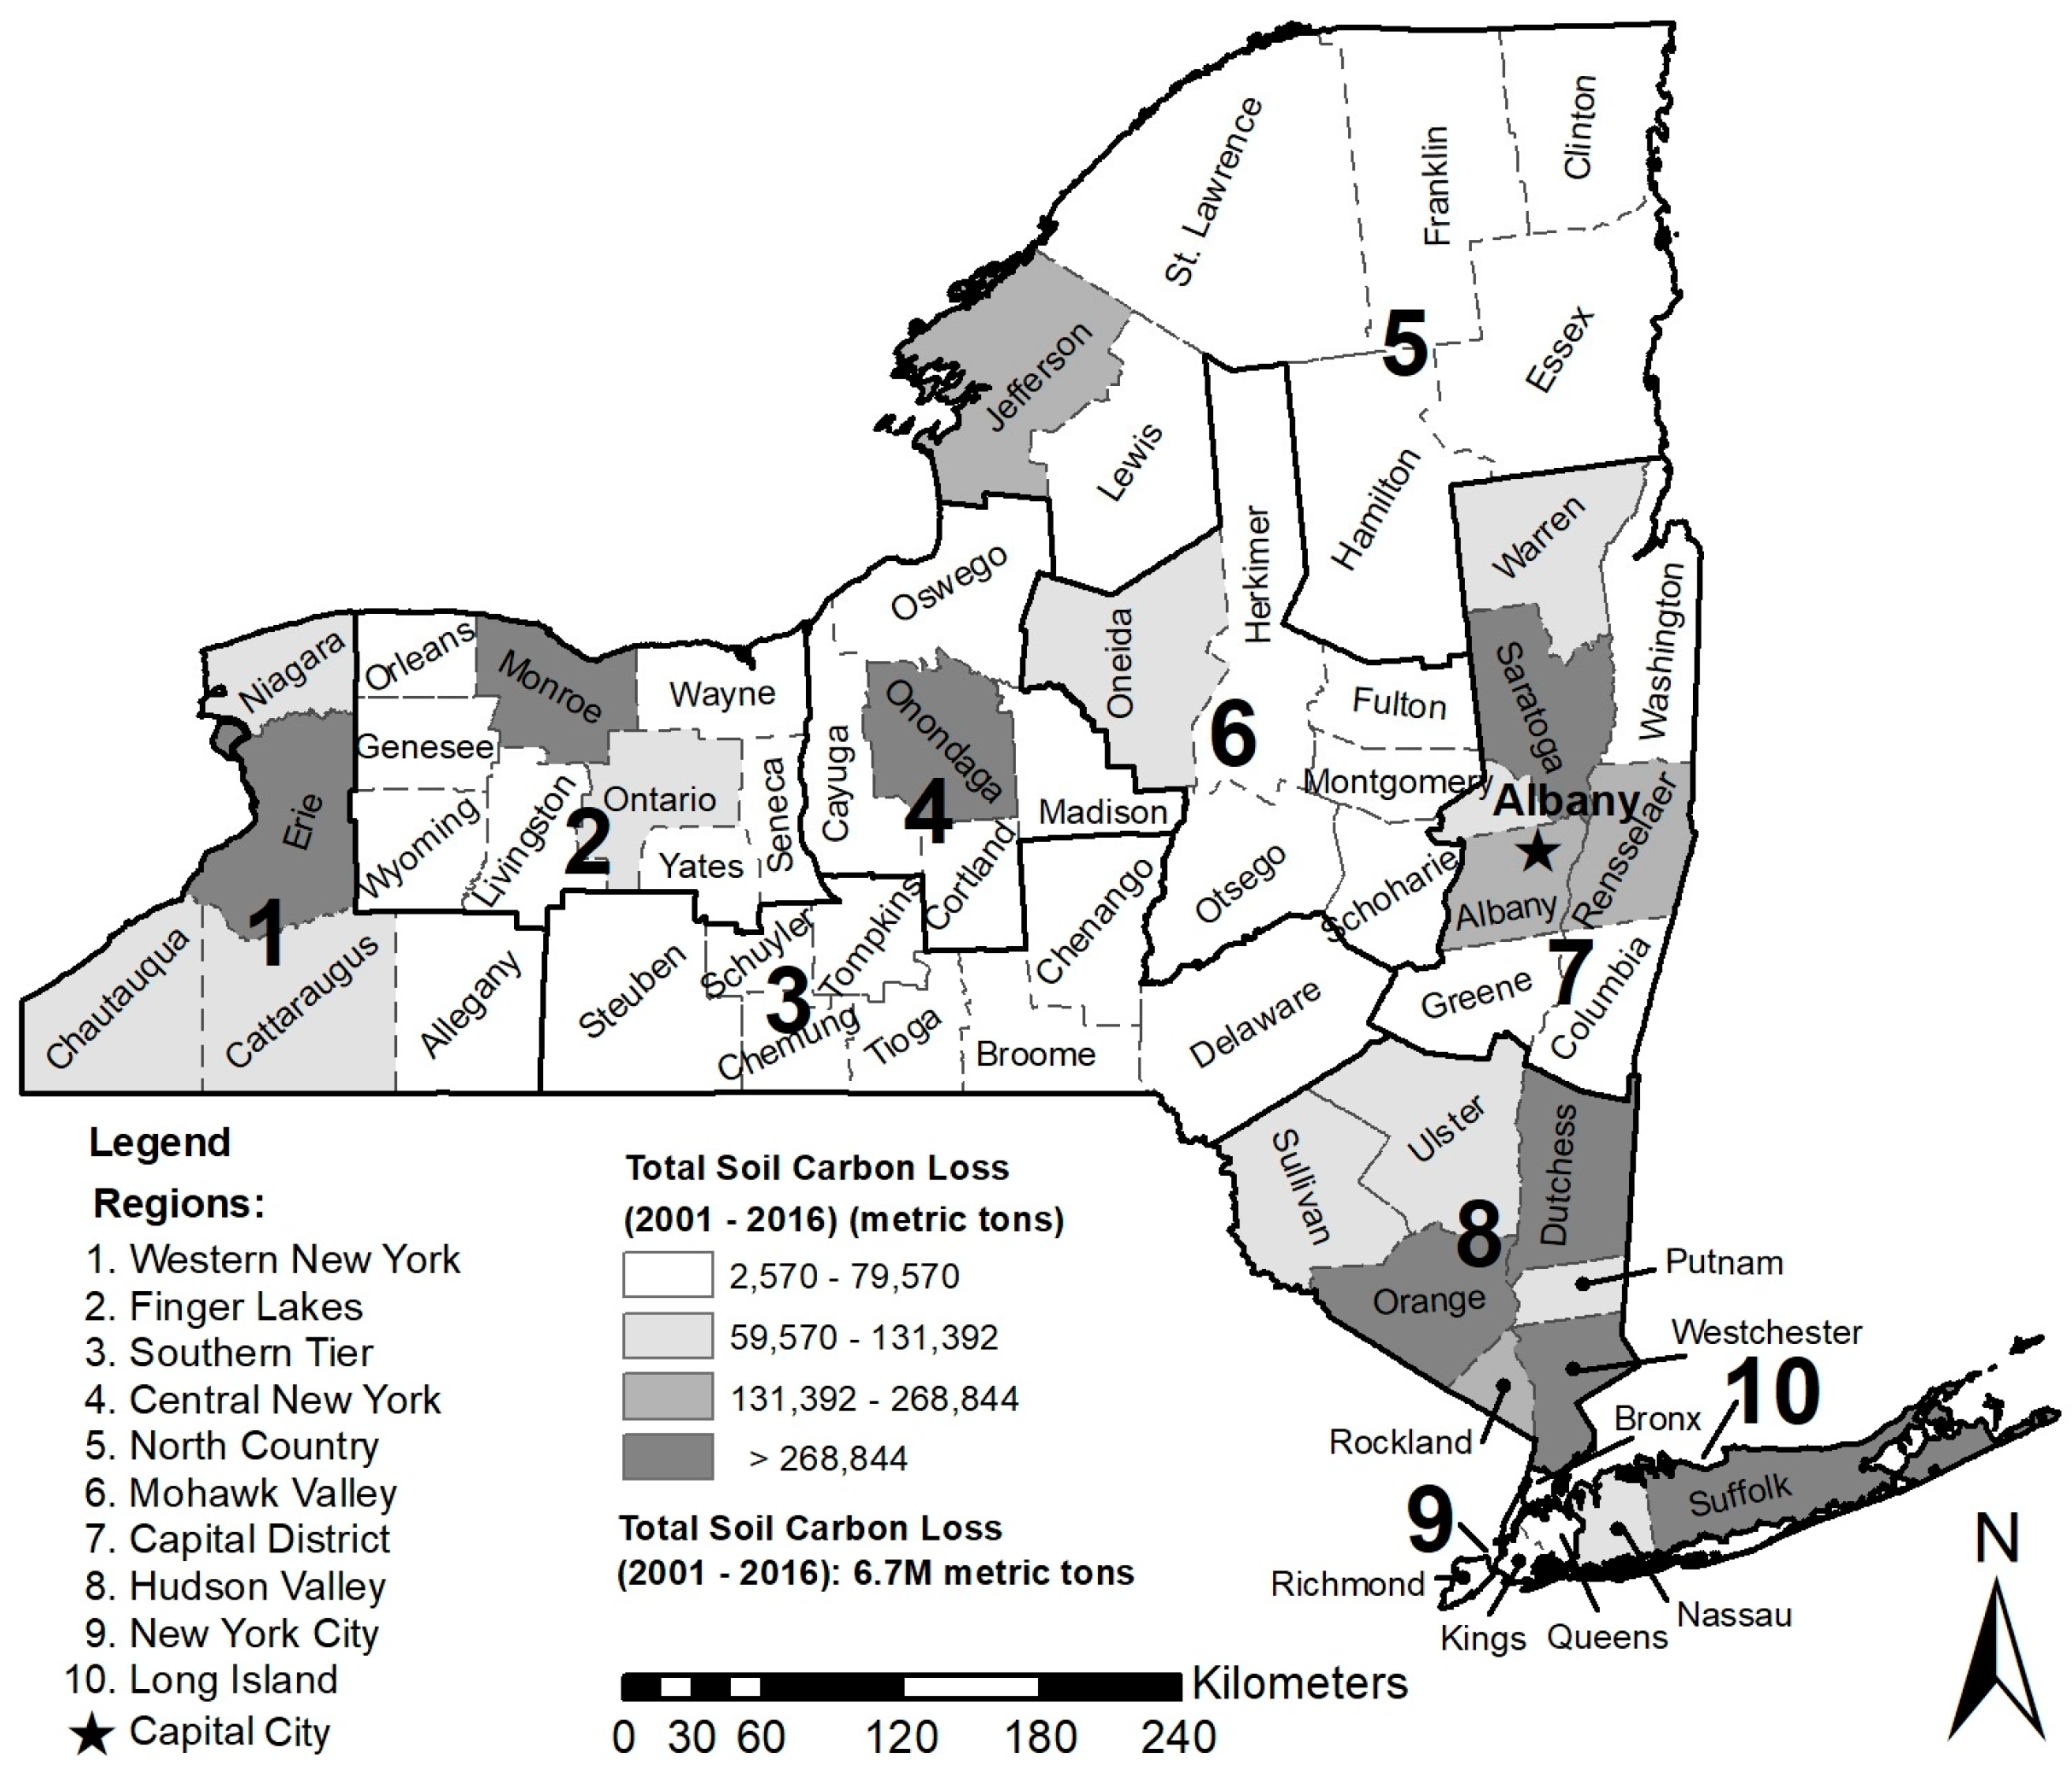
| Region | 2016 Total Soil Area (km2) | Degree of Weathering and Soil Development | ||||||
|---|---|---|---|---|---|---|---|---|
| Slight | Moderate | Strong | ||||||
| Entisols | Inceptisols | Histosols | Alfisols | Mollisols | Spodosols | Ultisols | ||
| 2016 Area by Soil Order (km2) | ||||||||
| Western New York | 12,635.6 | 409.9 | 8613.6 | 48.1 | 2923.0 | 52.5 | 0 | 588.5 |
| Finger Lakes | 11,857.8 | 521.1 | 4427.9 | 253.6 | 6598.0 | 57.5 | 0 | 0 |
| Southern Tier | 15,880.1 | 309.4 | 14,497.0 | 44.3 | 1017.6 | 12.0 | 0 | 0 |
| Central New York | 9125.1 | 382.9 | 4170.2 | 395.7 | 3197.2 | 114.2 | 865.0 | 0 |
| North Country | 29,320.6 | 1799.8 | 6546.1 | 2024.4 | 1929.6 | 479.0 | 16,541.8 | 0 |
| Mohawk Valley | 13,247.2 | 627.1 | 5914.3 | 377.9 | 2956.5 | 134.9 | 3236.3 | 0 |
| Capital District | 12,724.6 | 1383.4 | 7804.5 | 100.9 | 1508.4 | 14.6 | 1913.0 | 0 |
| Hudson Valley | 11,638.2 | 481.6 | 10,750.0 | 165.9 | 238.5 | 2.3 | 0 | 0 |
| New York City | 767.2 | 199.5 | 543.2 | 11.1 | 13.2 | 0.1 | 0 | 0 |
| Long Island | 2923.6 | 1102.3 | 1685.4 | 105.3 | 1.9 | 0 | 28.7 | 0 |
| Totals | 120,649.8 | 7307.3 | 65,119.8 | 3529.9 | 20,648.1 | 871.6 | 22,584.7 | 588.5 |
| OWNERSHIP (e.g., government, private, foreign, shared, single, etc.) | |||||
| Time (e.g., information disclosure, etc.) | STOCKS/SOURCE ATTRIBUTION | FLOWS | VALUE | ||
| Biophysical Accounts (Science-Based) | Administrative Accounts (Boundary-Based) | Monetary Account(s) | Benefit(s)/ Damages | Total Value | |
| Soil extent: | Administrative extent: | Ecosystem good(s) and service(s): | Sector: | Types of value (e.g., economic value, etc.): | |
| Composite (total) stock: Total soil carbon (TSC) = Soil organic carbon (SOC) + Soil inorganic carbon (SIC) | |||||
| Past (e.g., post-development disclosures) Current (e.g., status) Future (e.g., pre-development disclosures) | - Soil orders (Entisols, Inceptisols, Histosols, Alfisols, Mollisols, Spodosols, Ultisols) | - State (New York); - Region (10 regions); - County (62 counties) | - Regulation (e.g., carbon sequestration); - Provisioning (e.g., food production) | Environment: - Carbon gain (sequestration); - Carbon loss | “Avoided” or “realized” social cost of carbon (SC-CO2) emissions (carbon footprint, CF): - $46 per metric ton of CO2 applicable for the year 2025 (2007 U.S. dollars with an average discount rate of 3% [1]) |
| Conflicts of Interest (COI) | |||||
| Loss and Damage (L&D) | |||||
| Liability (Responsibility) | |||||
| Soil Order | SOC Content (kg m−2) SOC Value ($ m−2) | SIC Content (kg m−2) SIC Value ($ m−2) | TSC Content (kg m−2) TSC Value ($ m−2) |
|---|---|---|---|
| Minimum—Midpoint—Maximum Values | |||
| Entisols | 1.8—8.0—15.8 0.3—1.35—2.66 | 1.9—4.8—8.4 0.32—0.82—1.42 | 3.7—12.8—24.2 0.62—2.17—4.08 |
| Inceptisols | 2.8—8.9—17.4 0.47—1.50—2.93 | 2.5—5.1—8.4 0.42—0.86—1.42 | 5.3—14.0—25.8 0.89—2.36—4.35 |
| Histosols | 63.9—140.1—243.9 10.78—23.62—41.14 | 0.6—2.4—5.0 0.10—0.41—0.84 | 64.5—142.5—248.9 10.88—24.03—41.98 |
| Alfisols | 2.3—7.5—14.1 0.39—1.27—2.38 | 1.3—4.3—8.1 0.22—0.72—1.37 | 3.6—11.8—22.2 0.61—1.99—3.74 |
| Mollisols | 5.9–13.5–22.8 1.00—2.28—3.85 | 4.9–11.5–19.7 0.83—1.93—3.32 | 10.8–25.0–42.5 1.82—4.21—7.17 |
| Spodosols | 2.9—12.3—25.5 0.49—2.07—4.30 | 0.2—0.6—1.1 0.03—0.10—0.19 | 3.1—12.9—26.6 0.52—2.17—4.49 |
| Ultisols | 1.9—7.1—13.9 0.32—1.20—2.34 | 0.0—0.0—0.0 0.00—0.00—0.00 | 1.9—7.1—13.9 0.32—1.20—2.34 |
| Soil Regulating Ecosystem Services in New York State | ||||||
|---|---|---|---|---|---|---|
| Degree of Weathering and Soil Development | ||||||
| Slight 63.0% | Moderate 17.8% | Strong 19.2% | ||||
| Entisols | Inceptisols | Histosols | Alfisols | Mollisols | Spodosols | Ultisols |
| 6.1% | 54.0% | 2.9% | 17.1% | 0.7% | 18.7% | 0.5% |
 |  |  |  |  |  |  |
| Midpoint storage and social cost of soil organic carbon (SOC): 1.6× 10¹² kg C, $266.6B | ||||||
| 5.8 × 10¹⁰ kg | 5.8 × 10¹¹ kg | 4.9 × 10¹¹ kg | 1.5 × 10¹¹ kg | 1.2 × 10¹⁰ kg | 2.8 × 10¹¹ kg | 4.2 × 10⁹ kg |
| $9.9B | $97.7B | $83.4B | $26.2B | $2.0B | $46.8B | $706.2M |
| 3.7% | 36.6% | 31.3% | 9.8% | 0.7% | 17.5% | 0.3% |
| Midpoint storage and social cost of soil inorganic carbon (SIC): 4.9× 10¹¹ kg C, $82.2B | ||||||
| 3.5 × 10¹⁰ kg | 3.3 × 10¹¹ kg | 8.5 × 10⁹ kg | 8.9 × 10¹⁰ kg | 1.0 × 10¹⁰ kg | 1.4 × 10¹⁰ kg | 0 |
| $6.0B | $56.0B | $1.4B | $14.9B | $1.7B | $2.3B | $0 |
| 7.3% | 68.1% | 1.8% | 18.1% | 2.0% | 2.7% | 0% |
| Midpoint storage and social cost of total soil carbon (TSC): 2.1× 10¹² kg C, $348.8B | ||||||
| 9.4 × 10¹⁰ kg | 9.1 × 10¹¹ kg | 5.0 × 10¹¹ kg | 2.4 × 10¹¹ kg | 2.2 × 10¹⁰ kg | 2.9 × 10¹¹ kg | 4.2 × 10⁹ kg |
| $15.9B | $153.7B | $84.8B | $41.1B | $3.7B | $49.0B | $706.2M |
| 4.5% | 44.0% | 24.3% | 11.8% | 1.0% | 14.0% | 0.2% |
| Sensitivity to climate change | ||||||
| Low | Low | High | High | High | Low | Low |
| SOC and SIC sequestration (recarbonization) potential | ||||||
| Low | Low | Low | Low | Low | Low | Low |
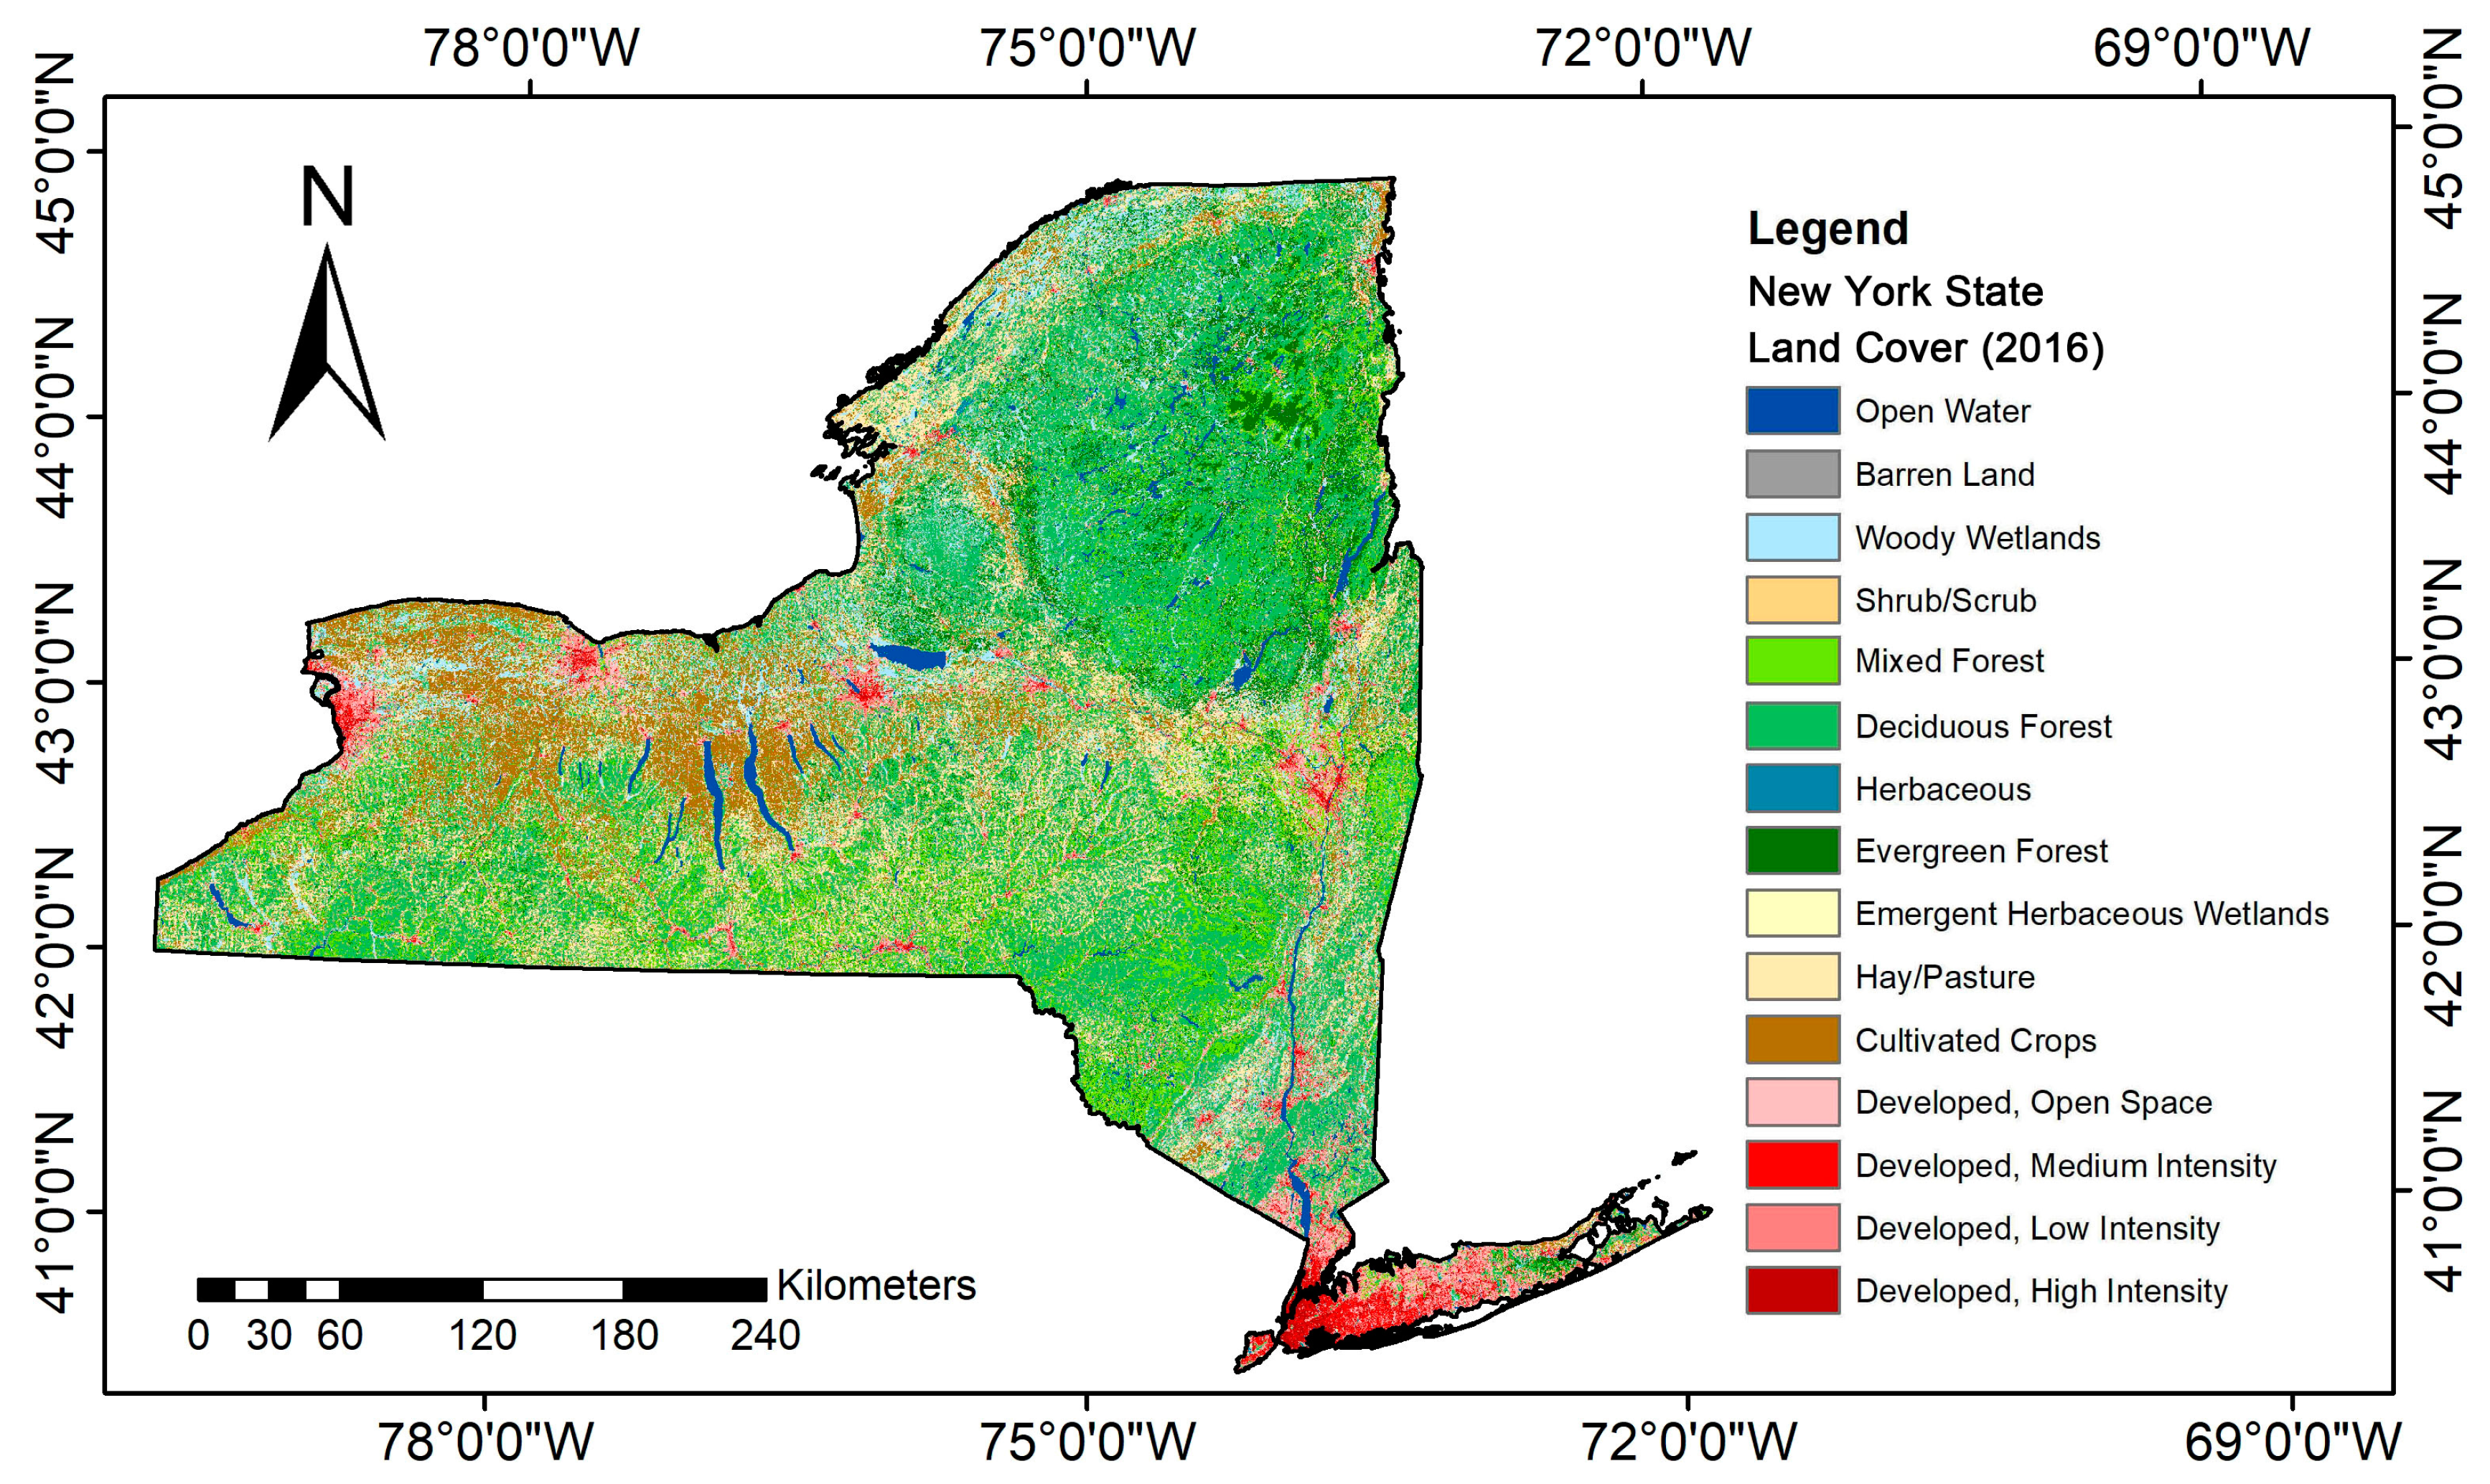
| NLCD Land Cover Classes (LULC) | Change in Area, 2001–2016 (%) | Degree of Weathering and Soil Development | ||||||
|---|---|---|---|---|---|---|---|---|
| Slight | Moderate | Strong | ||||||
| Entisols | Inceptisols | Histosols | Alfisols | Mollisols | Spodosols | Ultisols | ||
| Change in Area, 2001–2016 (%) | ||||||||
| Barren land | −3.9 | −4.7 | −3.2 | 11.2 | −7.4 | 4.6 | 0.1 | −2.4 |
| Woody wetlands | 0.7 | 1.4 | 0.3 | 2.2 | −0.7 | −0.4 | 0.8 | −0.7 |
| Shrub/Scrub | 33.2 | 5.9 | 50.7 | −2.5 | 11.9 | 46.2 | 36.5 | 203.2 |
| Mixed forest | 0.7 | −0.5 | 0.2 | 2.2 | 0.1 | 4.2 | 2.5 | 0.0 |
| Deciduous forest | −1.4 | −2.6 | −1.1 | −0.5 | −1.8 | −0.9 | −1.6 | −1.5 |
| Herbaceous | 89.7 | 40.3 | 125.1 | −7.8 | 87.2 | 170.1 | 58.2 | 171.8 |
| Evergreen forest | −0.5 | −2.3 | −0.8 | 0.9 | −0.4 | −1.8 | −0.2 | −1.2 |
| Emergent herbaceous wetlands | −2.8 | −9.4 | 1.3 | −4.7 | 2.5 | −5.0 | −10.8 | 10.4 |
| Hay/Pasture | −6.0 | −9.0 | −5.6 | −11.3 | −6.1 | −7.4 | −9.1 | −11.1 |
| Cultivated crops | 5.5 | 5.2 | 7.9 | 0.3 | 3.5 | 9.1 | 19.7 | 29.9 |
| Developed, open space | 1.6 | 1.1 | 1.4 | 0.7 | 2.7 | 2.3 | 0.2 | 0.5 |
| Developed, medium intensity | 12.7 | 10.6 | 12.0 | 15.4 | 17.5 | 23.5 | 25.1 | 2.4 |
| Developed, low intensity | 4.2 | 2.9 | 4.6 | 1.8 | 4.8 | 4.9 | 1.8 | 2.8 |
| Developed, high intensity | 11.4 | 9.3 | 9.3 | 18.0 | 25.2 | 24.5 | 38.7 | 25.0 |
| NLCD Land Cover Classes (LULC); Developed Area Increase between 2001 and 2016 (km2); Midpoint Complete Loss of Total Soil Carbon (kg); Midpoint SC-CO2 ($ = USD) | Degree of Weathering and Soil Development | ||||||
|---|---|---|---|---|---|---|---|
| Slight | Moderate | Strong | |||||
| Entisols | Inceptisols | Histosols | Alfisols | Mollisols | Spodosols | Ultisols | |
| Developed Area Increase between 2001 and 2016 (km2) Midpoint Complete Loss of Total Soil Carbon (kg) Midpoint SC-CO2 ($ = USD) | |||||||
| Developed, open space | 8.2 | 54.1 | 0.3 | 37.3 | 0.8 | 1.0 | 0.1 |
| 101.6 km2 (1.4 × 10⁹ kg C) | 1.0 × 10⁸ | 7.6 × 10⁸ | 4.3 × 10⁷ | 4.4 × 10⁸ | 2.0 × 10⁷ | 1.3 × 10⁷ | 7.1 × 10⁵ |
| $232.6M | $17.8M | $127.7M | $7.2M | $74.2M | $3.4M | $2.2M | $120,000.0 |
| Developed, medium intensity | 40.3 | 99.9 | 0.7 | 42.2 | 1.2 | 3.5 | 0.01 |
| 187.9 km2 (2.6 × 10⁹ kg C) | 5.2 × 10⁸ | 1.4 × 10⁹ | 1.0 × 10⁸ | 5.0 × 10⁸ | 3.0 × 10⁷ | 4.5 × 10⁷ | 7.1 × 10⁴ |
| $436.7M | $87.5M | $235.8M | $16.8M | $83.9M | $5.1M | $7.6M | $12,000.0 |
| Developed, low intensity | 16.6 | 68.5 | 0.3 | 36.0 | 0.8 | 1.1 | 0.02 |
| 123.3 km2 (1.7 × 10⁹ kg C) | 2.1 × 10⁸ | 9.6 × 10⁸ | 4.3 × 10⁷ | 4.2 × 10⁸ | 2.0 × 10⁷ | 1.4 × 10⁷ | 1.4 × 10⁵ |
| $282.3M | $36.1M | $161.6M | $7.2M | $71.6M | $3.4M | $2.4M | $24,000.0 |
| Developed, high intensity | 18.4 | 33.1 | 0.2 | 18.7 | 0.5 | 1.3 | 0.001 |
| 72.3 km2 (9.8 × 10⁸ kg C) | 2.4 × 10⁸ | 4.6 × 10⁸ | 2.9 × 10⁷ | 2.2 × 10⁸ | 1.3 × 10⁷ | 1.7 × 10⁷ | 7.1 × 10³ |
| $164.9M | $40.0M | $78.1M | $4.8M | $37.2M | $2.1M | $2.8M | $1200.0 |
| Totals | 83.6 | 255.6 | 1.4 | 134.2 | 3.3 | 7.0 | 0.1 |
| 485.2km2 (6.6× 10⁹kg C) | 1.1× 10⁹ | 3.6× 10⁹ | 2.0× 10⁸ | 1.6× 10⁹ | 8.3× 10⁷ | 9.0× 10⁷ | 7.1× 10⁵ |
| $1.1B | $181.4M | $603.2M | $33.6M | $267.1M | $13.9M | $15.2M | $120,000.0 |
| NLCD Land Cover Classes (LULC) | 2016 Total Area by LULC (km2) | Degree of Weathering and Soil Development | ||||||
|---|---|---|---|---|---|---|---|---|
| Slight | Moderate | Strong | ||||||
| Entisols | Inceptisols | Histosols | Alfisols | Mollisols | Spodosols | Ultisols | ||
| 2016 Area by Soil Order (km2) | ||||||||
| Barren land | 221.6 | 71.7 | 86.7 | 2.7 | 36.5 | 1.0 | 22.8 | 0.2 |
| Woody wetlands | 9355.6 | 1197.0 | 3898.3 | 1865.3 | 958.3 | 233.6 | 1202.8 | 0.2 |
| Shrub/Scrub | 1063.4 | 91.6 | 399.7 | 23.4 | 151.2 | 5.9 | 384.1 | 7.5 |
| Mixed forest | 13,623.1 | 542.7 | 8780.1 | 146.1 | 1293.0 | 41.4 | 2692.7 | 127.0 |
| Deciduous forest | 45,869.1 | 1585.9 | 26,149.7 | 556.9 | 4578.8 | 230.3 | 12,343.9 | 423.5 |
| Herbaceous | 877.6 | 89.9 | 452.0 | 10.0 | 166.3 | 6.9 | 149.3 | 3.1 |
| Evergreen forest | 10,258.8 | 630.9 | 3868.3 | 416.2 | 530.0 | 96.4 | 4704.5 | 12.6 |
| Emergent herbaceous wetlands | 987.2 | 147.2 | 381.2 | 305.8 | 95.0 | 18.3 | 39.6 | 0.0 |
| Hay/Pasture | 16,349.5 | 632.9 | 10,279.6 | 35.9 | 4909.5 | 117.2 | 370.7 | 3.8 |
| Cultivated crops | 10,006.4 | 324.3 | 4047.9 | 105.7 | 5343.9 | 59.5 | 124.9 | 0.1 |
| Developed, open space | 6622.8 | 769.0 | 3889.8 | 41.0 | 1416.2 | 34.6 | 462.8 | 9.4 |
| Developed, medium intensity | 1665.3 | 421.2 | 931.1 | 5.2 | 283.7 | 6.2 | 17.7 | 0.2 |
| Developed, low intensity | 3043.4 | 586.4 | 1567.3 | 14.5 | 792.5 | 17.7 | 64.2 | 0.8 |
| Developed, high intensity | 706.1 | 216.6 | 388.0 | 1.1 | 93.2 | 2.5 | 4.7 | 0.0 |
| Totals | 120,649.8 | 7307.3 | 65,119.8 | 3529.9 | 20,648.1 | 871.6 | 22,584.7 | 588.5 |
| Liability and Compensation Matched by Geographic Location | ||
|---|---|---|
| Liability for Greenhouse Gas (GHG) Emissions from Land Development | Liability for Loss and Damage (L&D) from Climate Change Impacts from GHG Emissions | Compensation Fund |
| Time dimensions (past, current, future). Location and scale (e.g., county, region, etc.) | ||
| Loss of land for sequestration potential (e.g., area, km2) | Damages (repairable damages such as hurricane property damage, $ USD, etc.) | Option A: The compensation fund is derived from payments for GHG emissions scaled to compensate for L&D in the same geographic area where the emissions occurred. Option B: A sum of estimates of the cost of GHG emissions + costs from climate change L&D in the same geographic area. |
| + | + | |
| GHG emissions from land development (e.g., metric tonnes of CO2) | Losses (permanent losses such as land loss from sea level rise, $ USD, etc.) | |
| + | + | |
| Social costs of emissions (e.g., carbon dioxide, SC-CO2, $ USD) | Non-economic L&D (e.g., trauma, loss of culture, etc.) | |
| = | = | |
| Total liability for GHG emissions | Total liability for L&D | Total compensation fund |
Disclaimer/Publisher’s Note: The statements, opinions and data contained in all publications are solely those of the individual author(s) and contributor(s) and not of MDPI and/or the editor(s). MDPI and/or the editor(s) disclaim responsibility for any injury to people or property resulting from any ideas, methods, instructions or products referred to in the content. |
© 2023 by the authors. Licensee MDPI, Basel, Switzerland. This article is an open access article distributed under the terms and conditions of the Creative Commons Attribution (CC BY) license (https://creativecommons.org/licenses/by/4.0/).
Share and Cite
Mikhailova, E.A.; Lin, L.; Hao, Z.; Zurqani, H.A.; Post, C.J.; Schlautman, M.A.; Post, G.C.; Shepherd, G.B. Question of Liability for Emissions from Land Development in Relation to New York State Climate Change Plan. Climate 2023, 11, 109. https://doi.org/10.3390/cli11050109
Mikhailova EA, Lin L, Hao Z, Zurqani HA, Post CJ, Schlautman MA, Post GC, Shepherd GB. Question of Liability for Emissions from Land Development in Relation to New York State Climate Change Plan. Climate. 2023; 11(5):109. https://doi.org/10.3390/cli11050109
Chicago/Turabian StyleMikhailova, Elena A., Lili Lin, Zhenbang Hao, Hamdi A. Zurqani, Christopher J. Post, Mark A. Schlautman, Gregory C. Post, and George B. Shepherd. 2023. "Question of Liability for Emissions from Land Development in Relation to New York State Climate Change Plan" Climate 11, no. 5: 109. https://doi.org/10.3390/cli11050109