

Impact of Climate Change on the Stability of the Miacher Slope, Upper Hunza, Gilgit Baltistan, Pakistan
 ,
,  ,
,
Abstract
:1. Introduction
2. Methodology
3. Results and Discussion
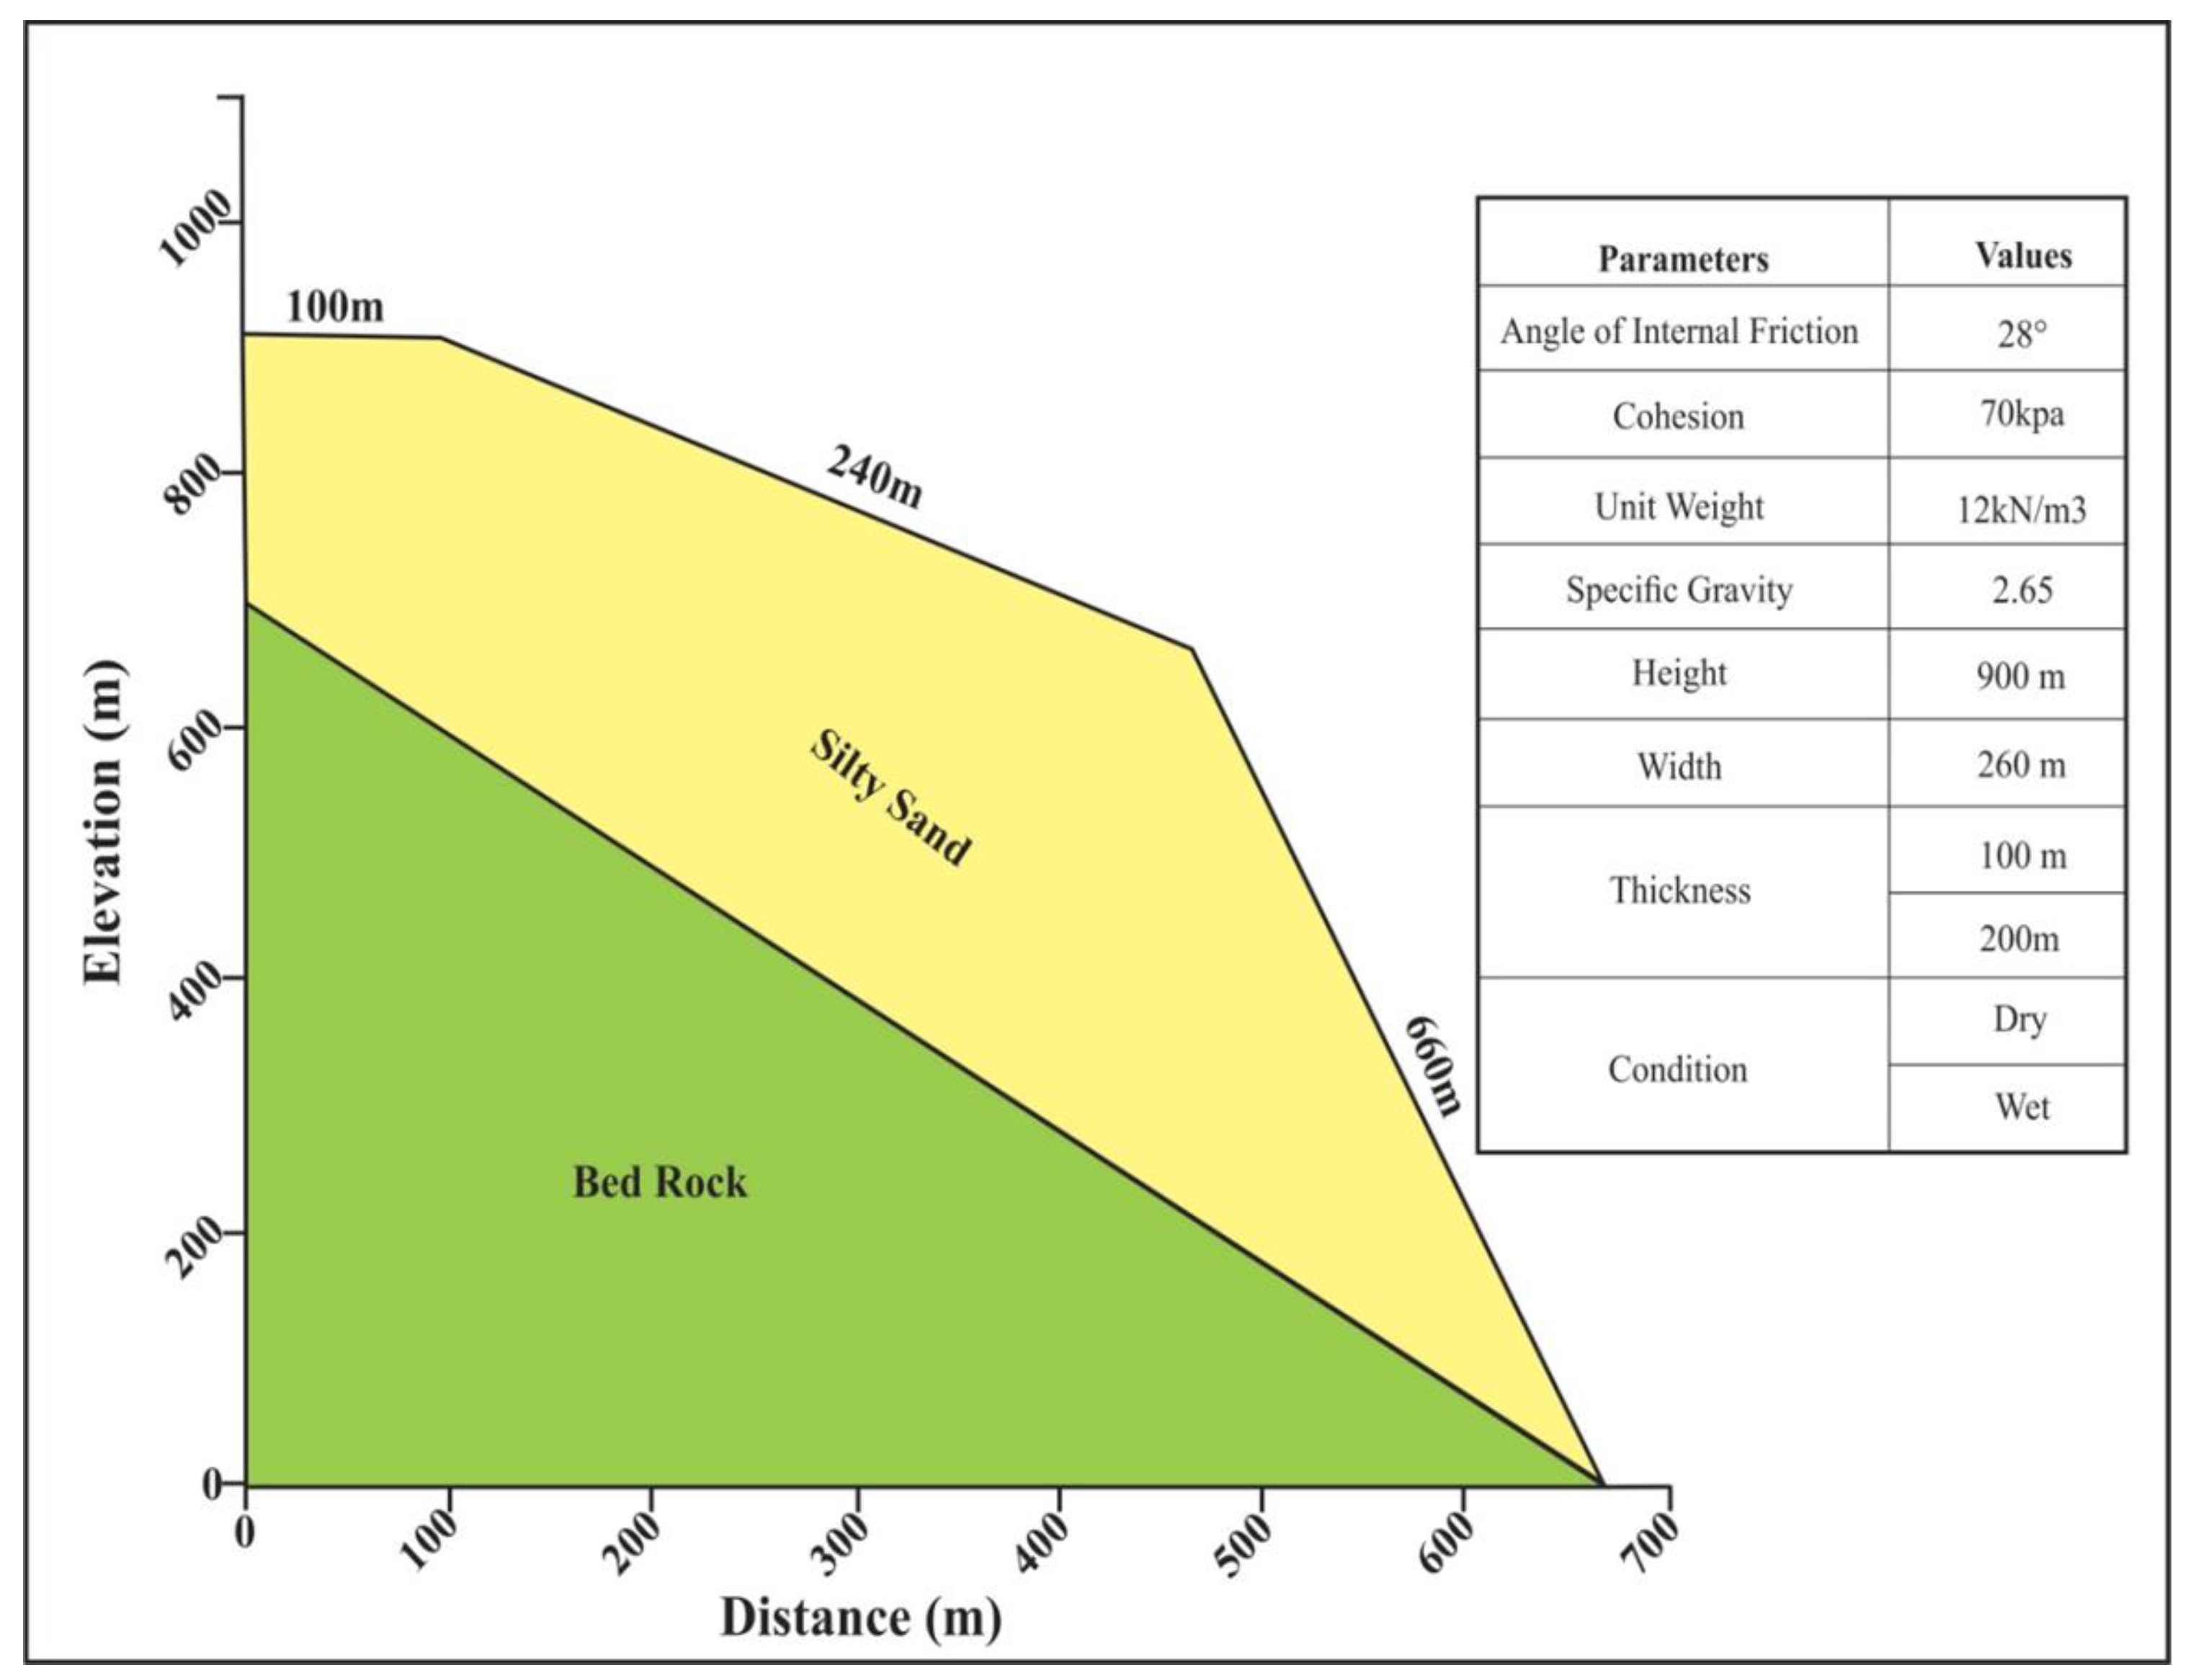
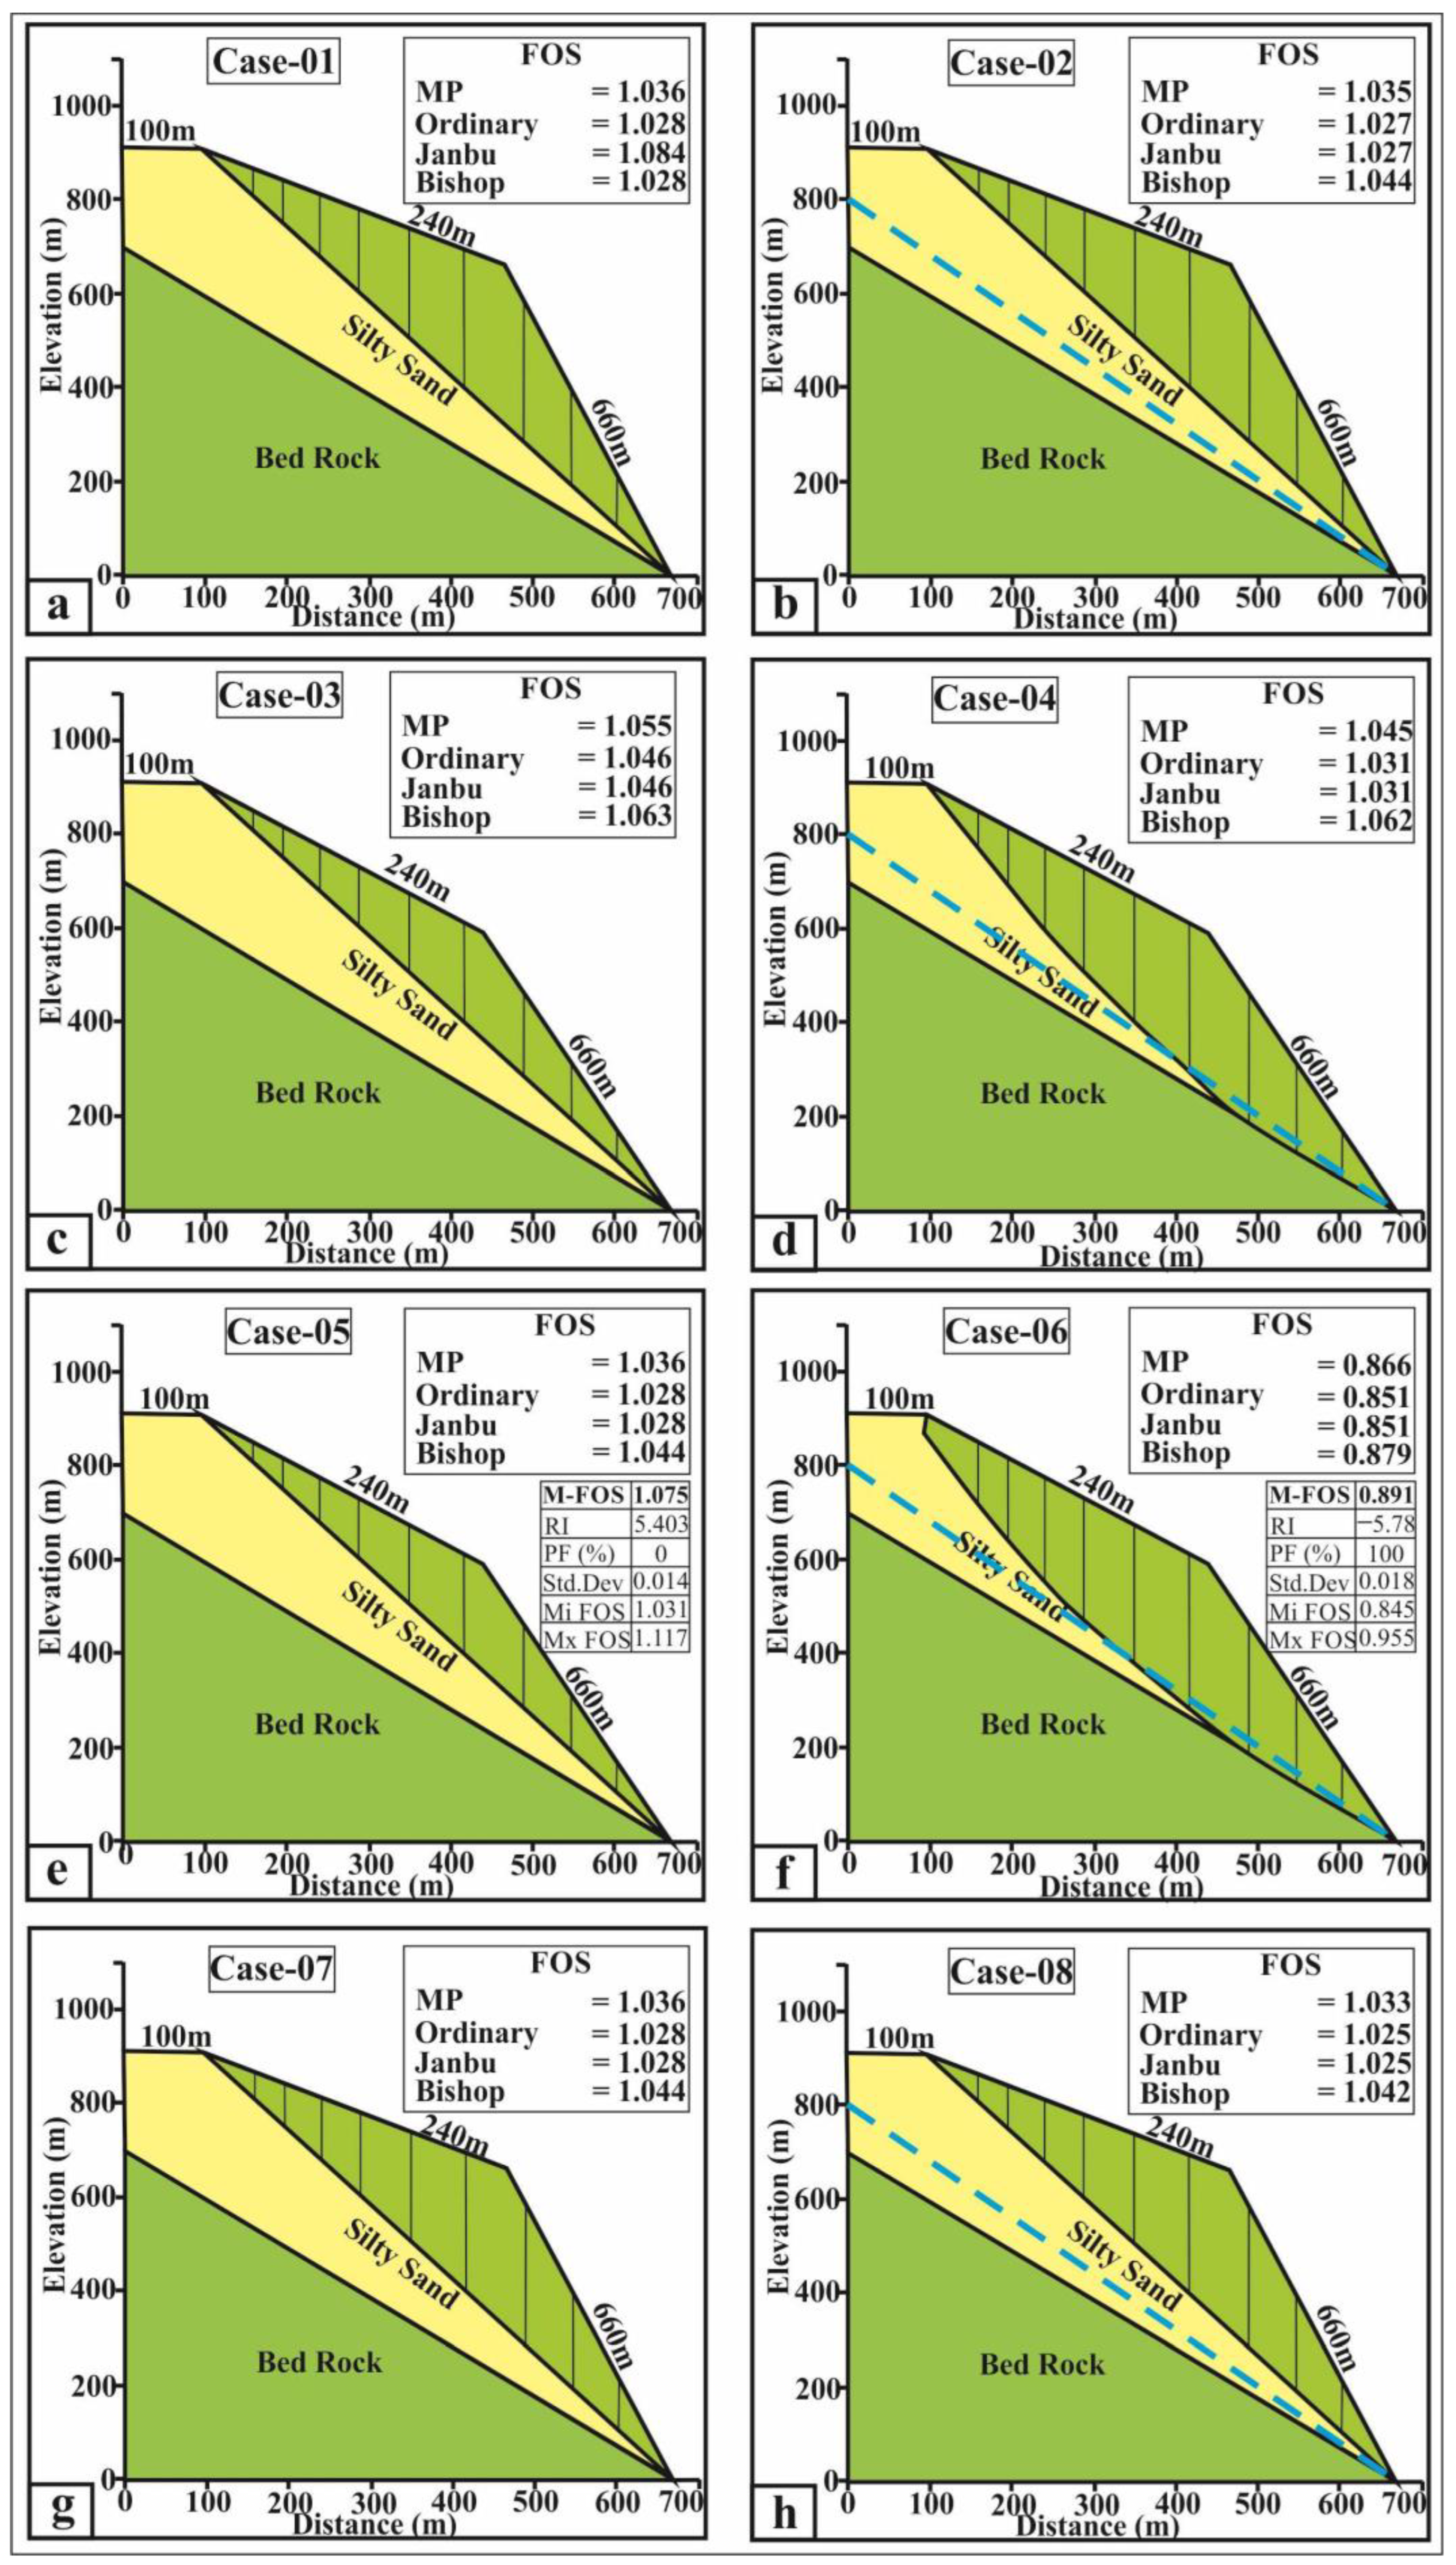
3.1. Slope Stability Evaluation
3.2. Analysis of Miacher Landslide
4. Geochemistry and Geological Analysis
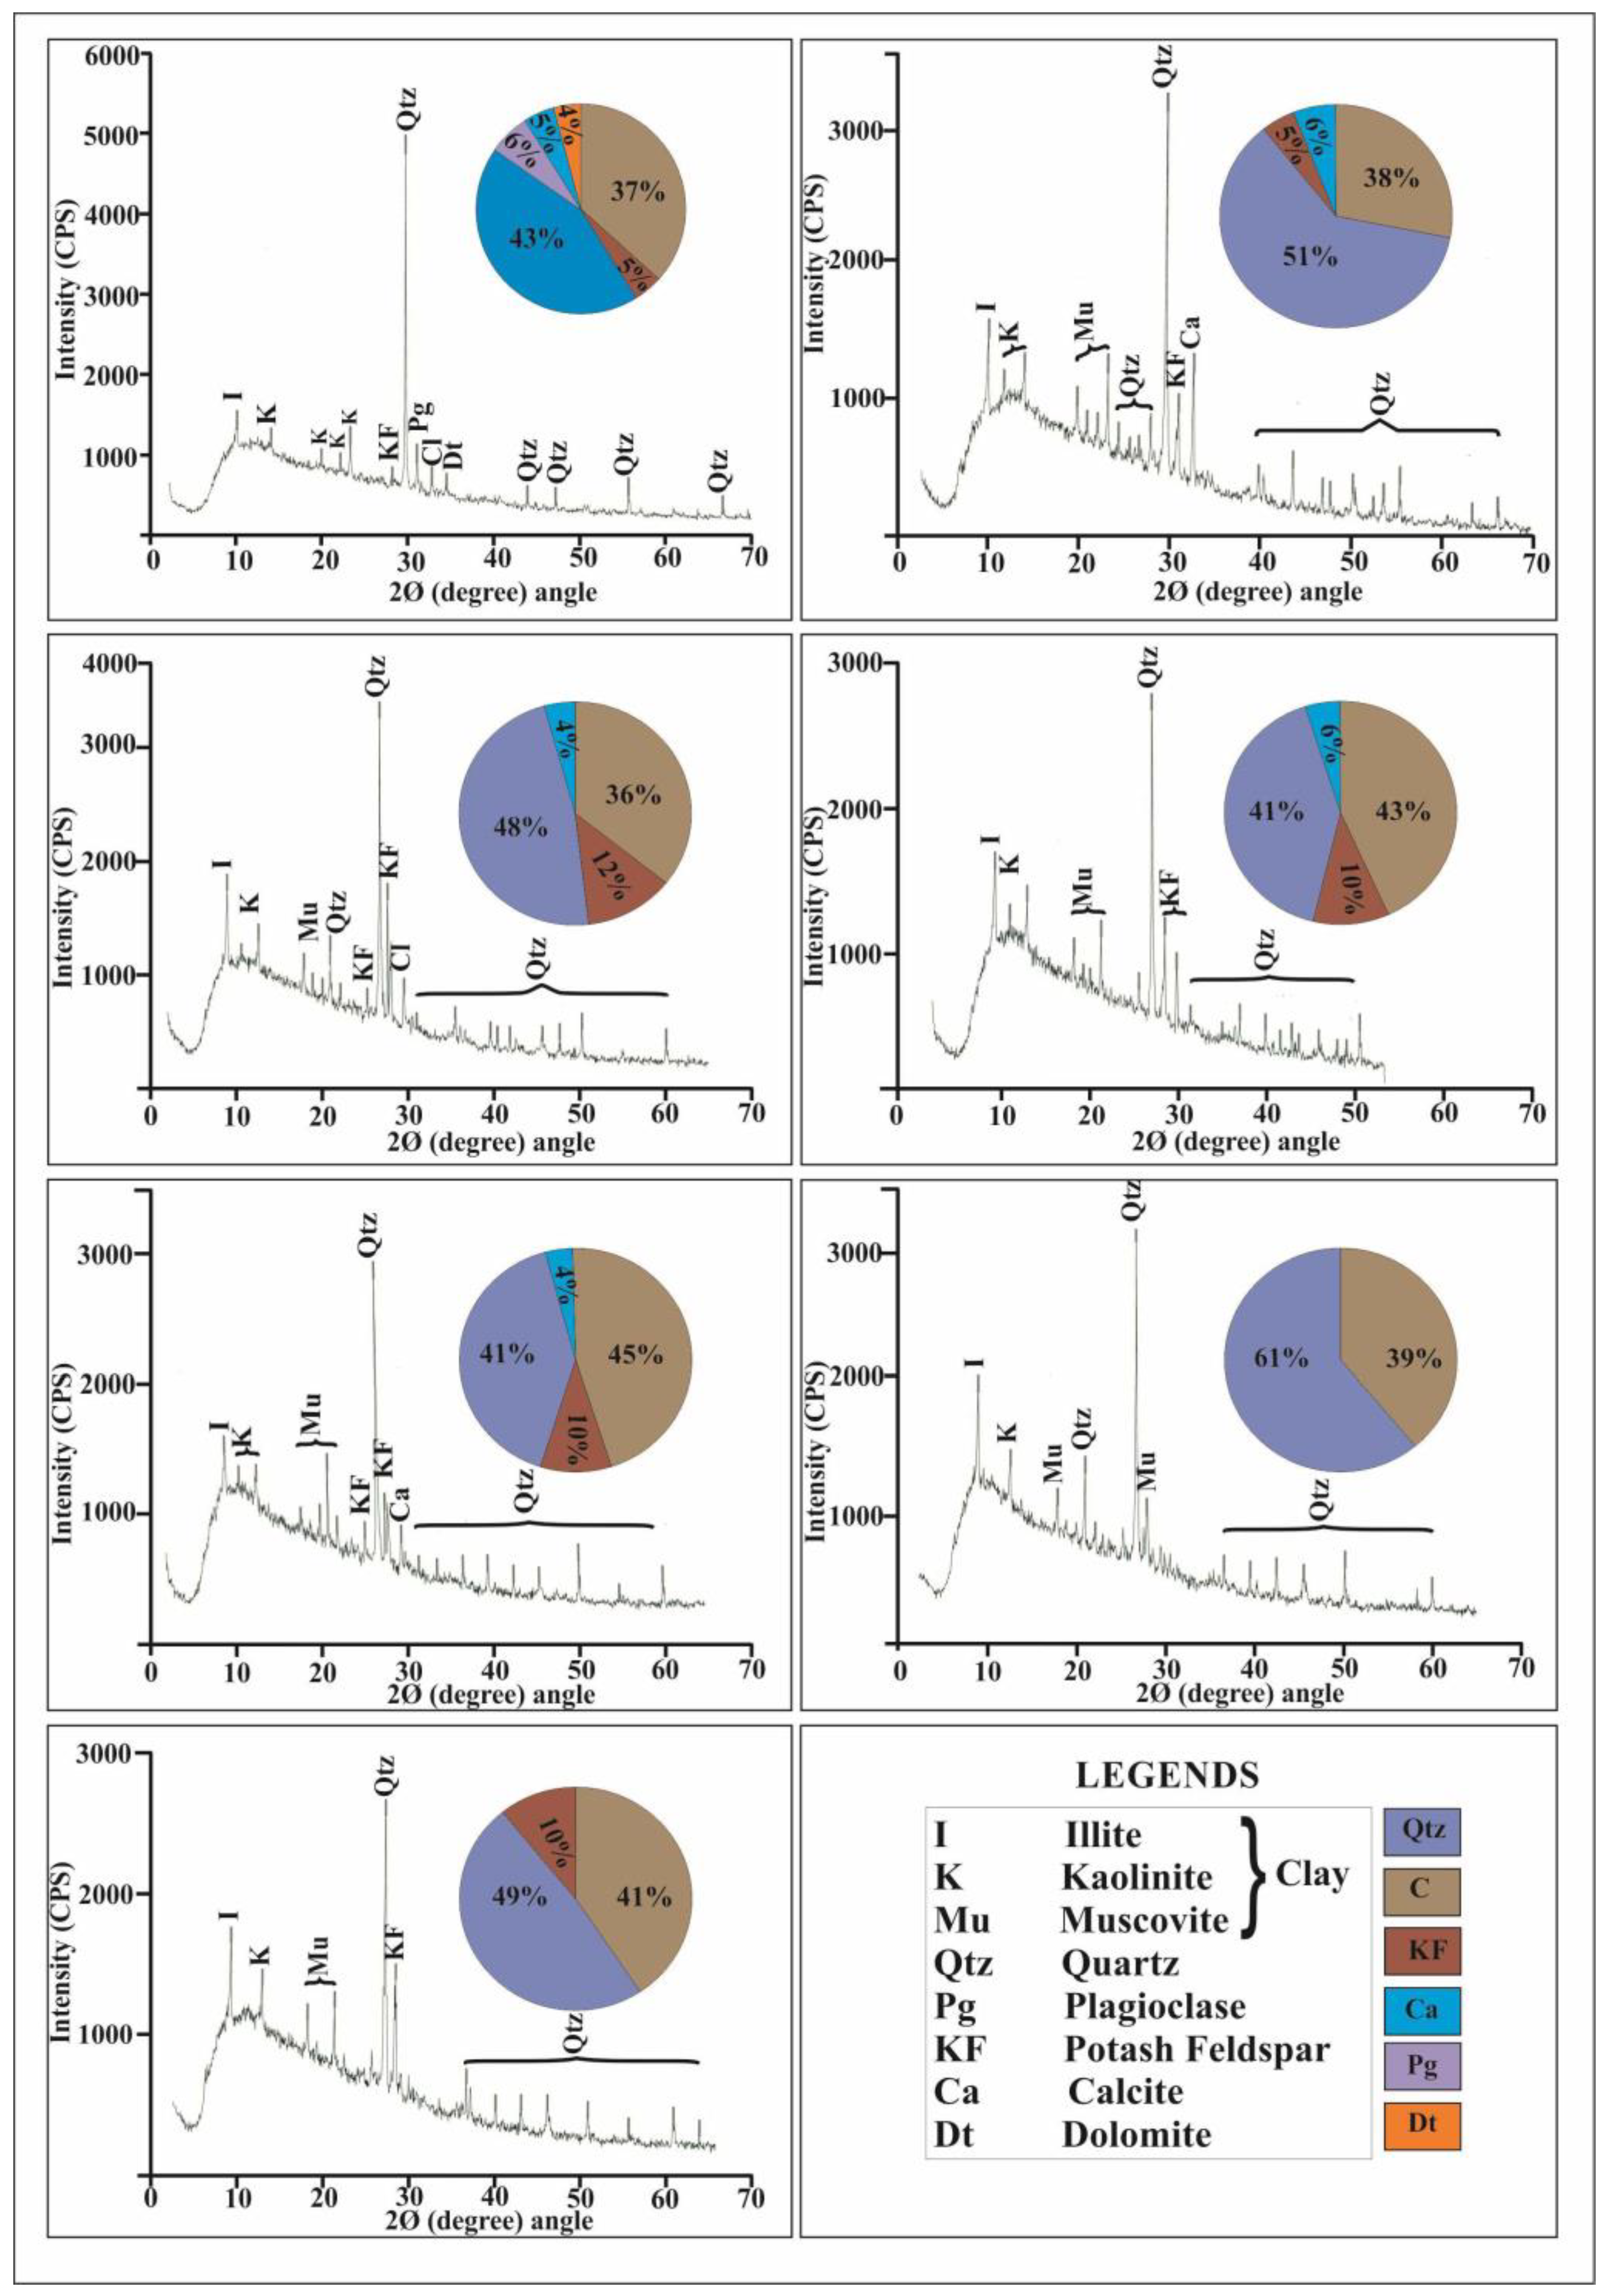
4.1. Effect of Mineralogy
4.2. Mineralogy
4.3. Effect of Geology on the Miacher Slope
4.3.1. Hunza River
4.3.2. Anthropogenic/Agricultural Activities
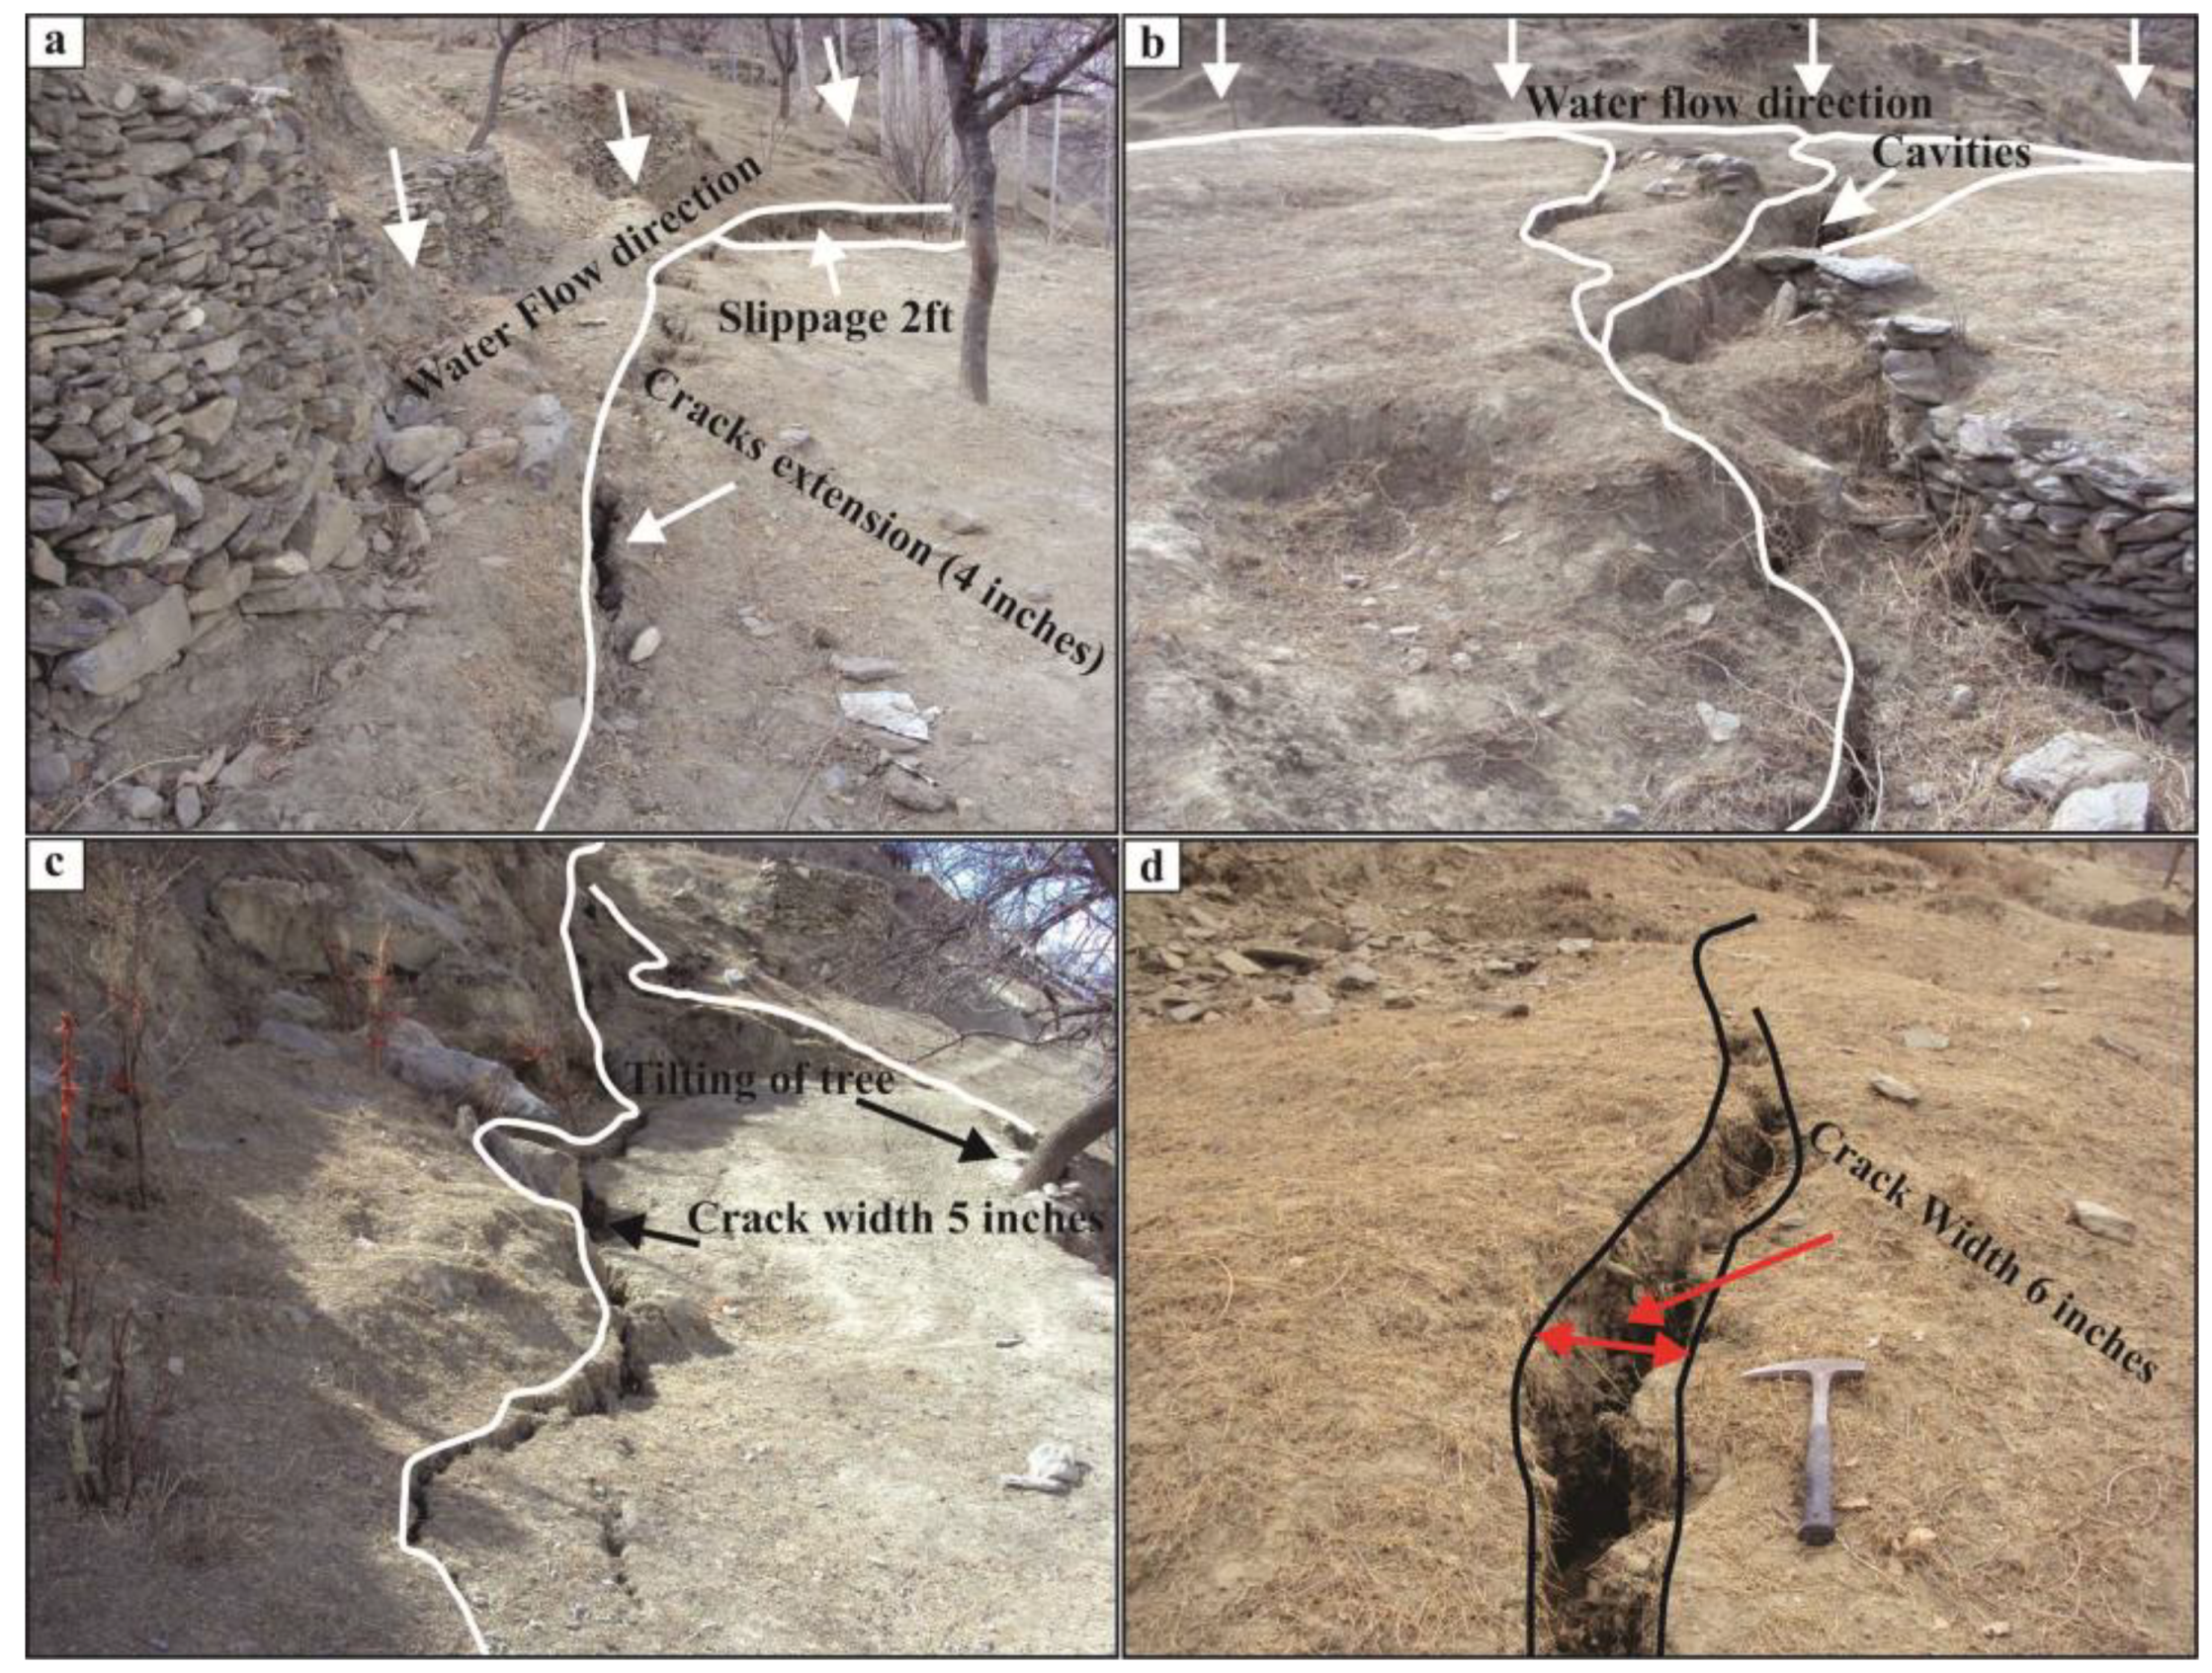
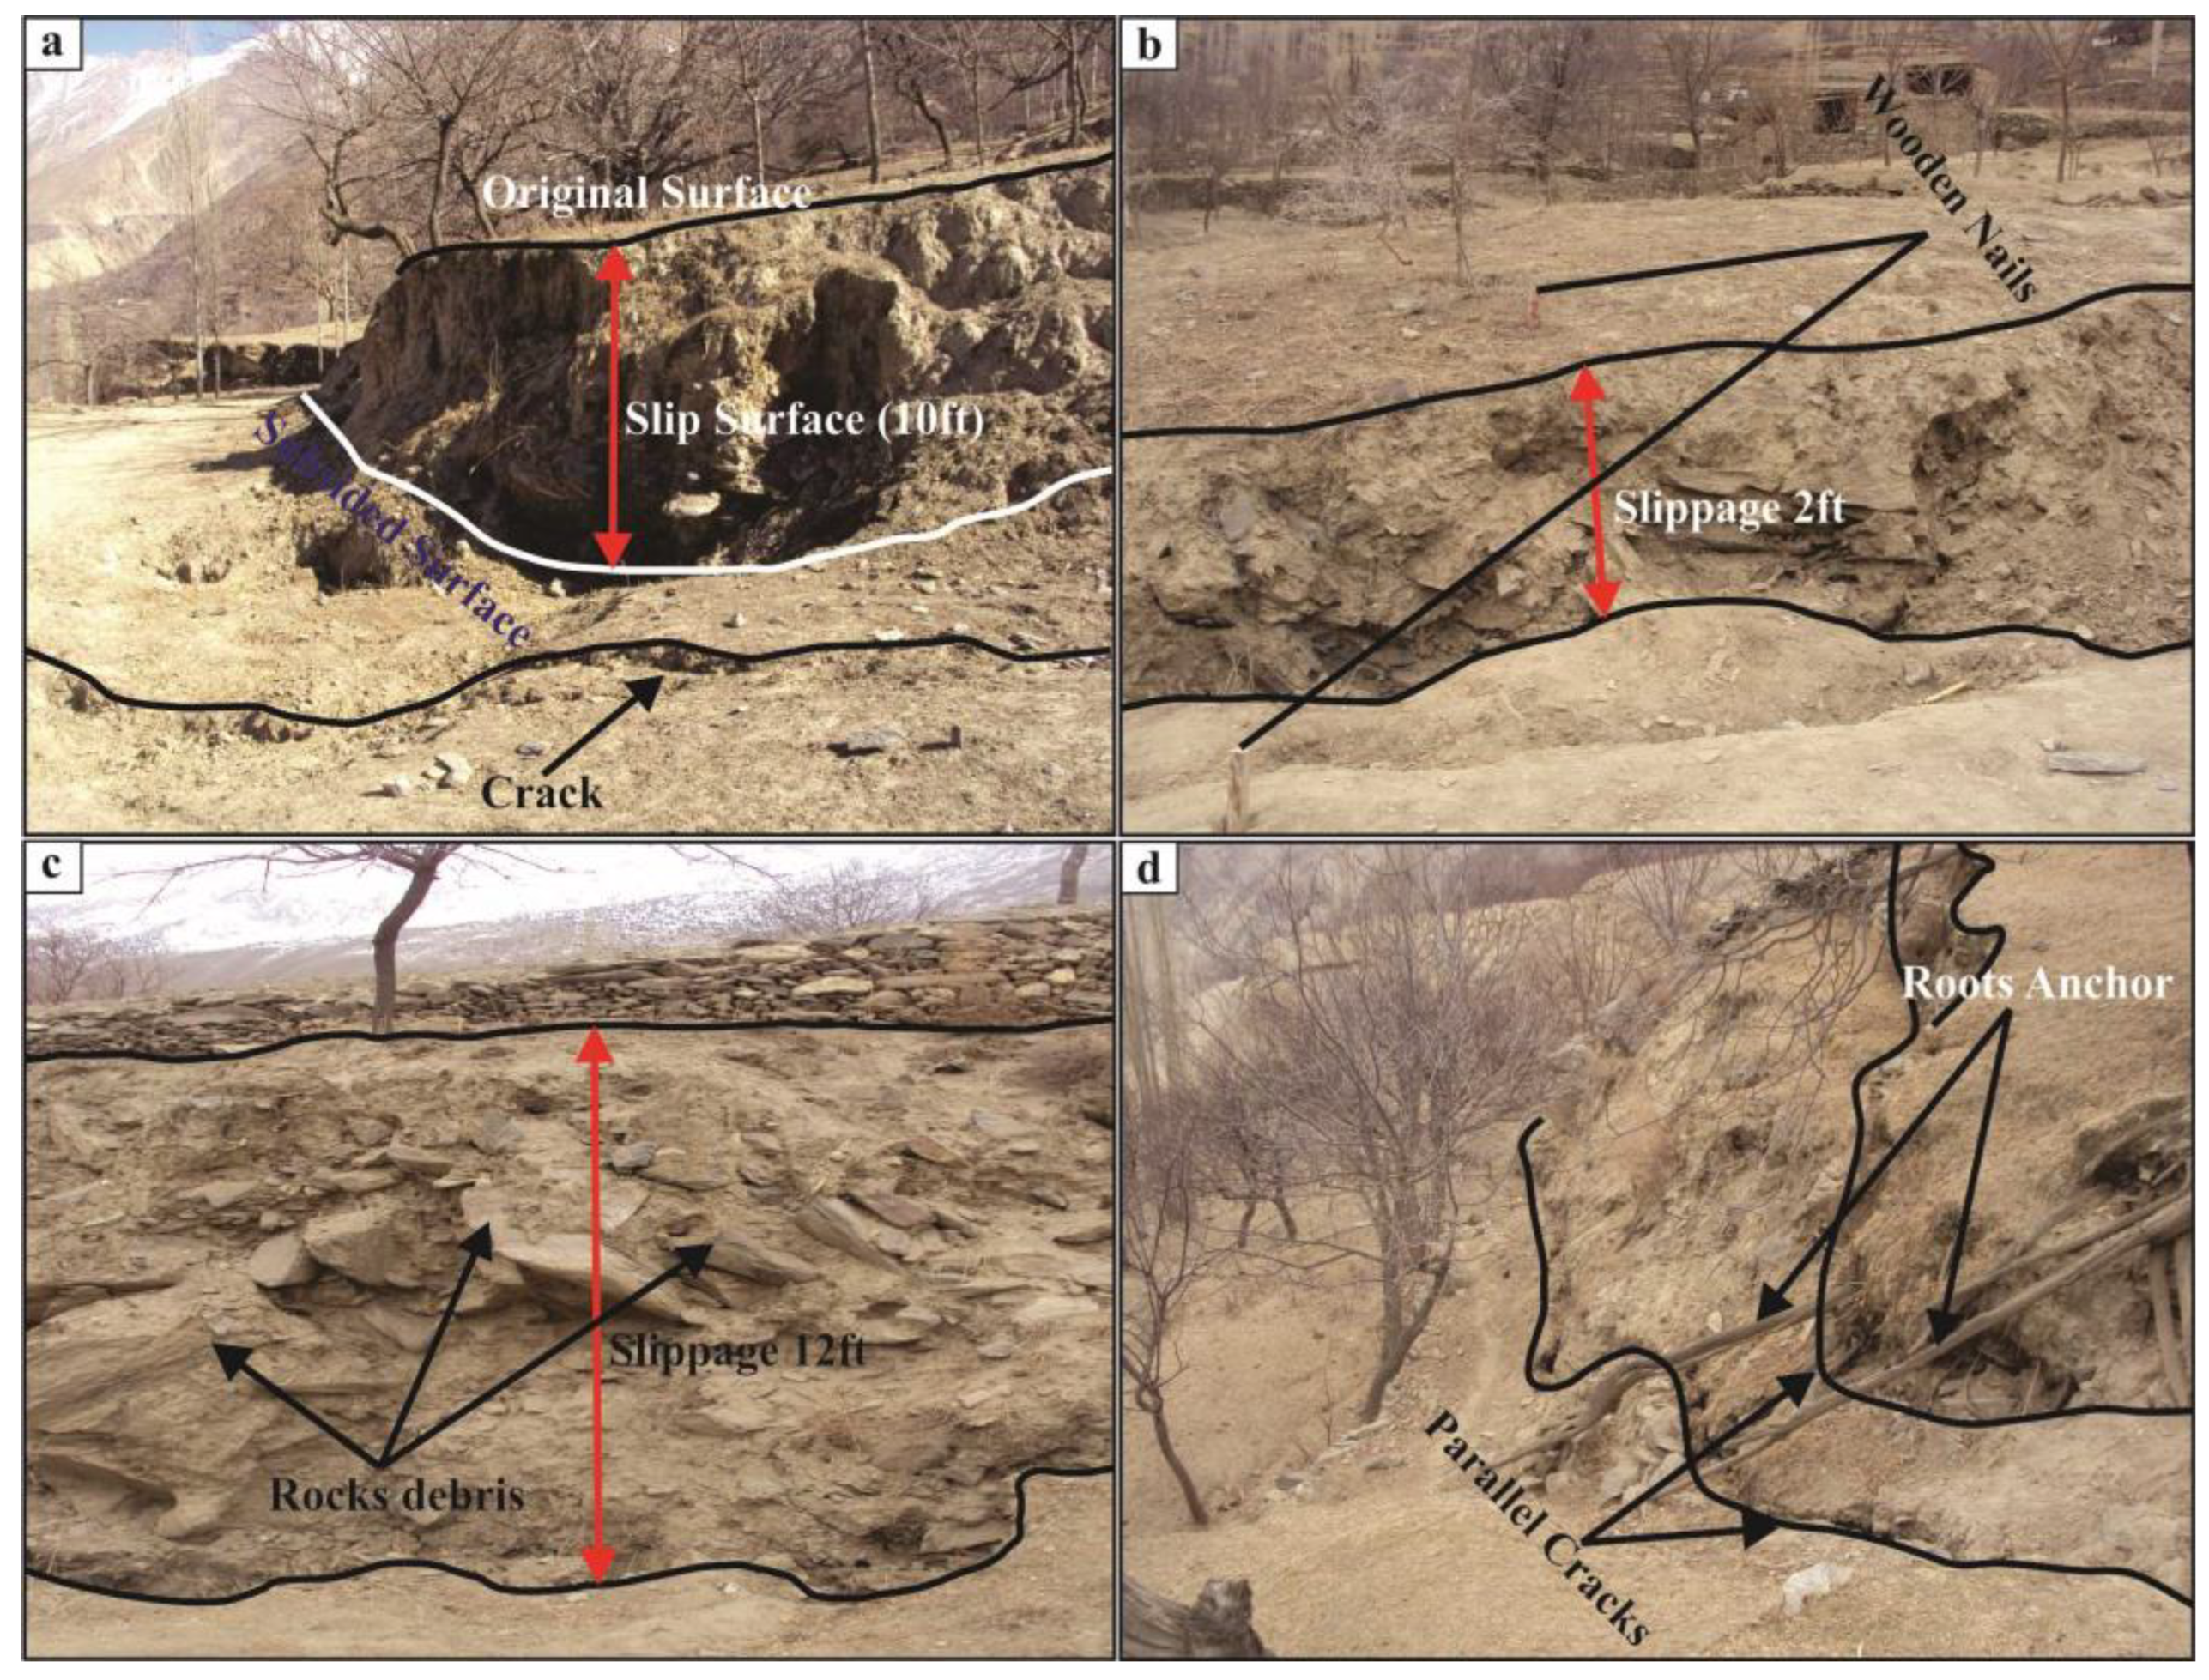
4.3.3. Cracks
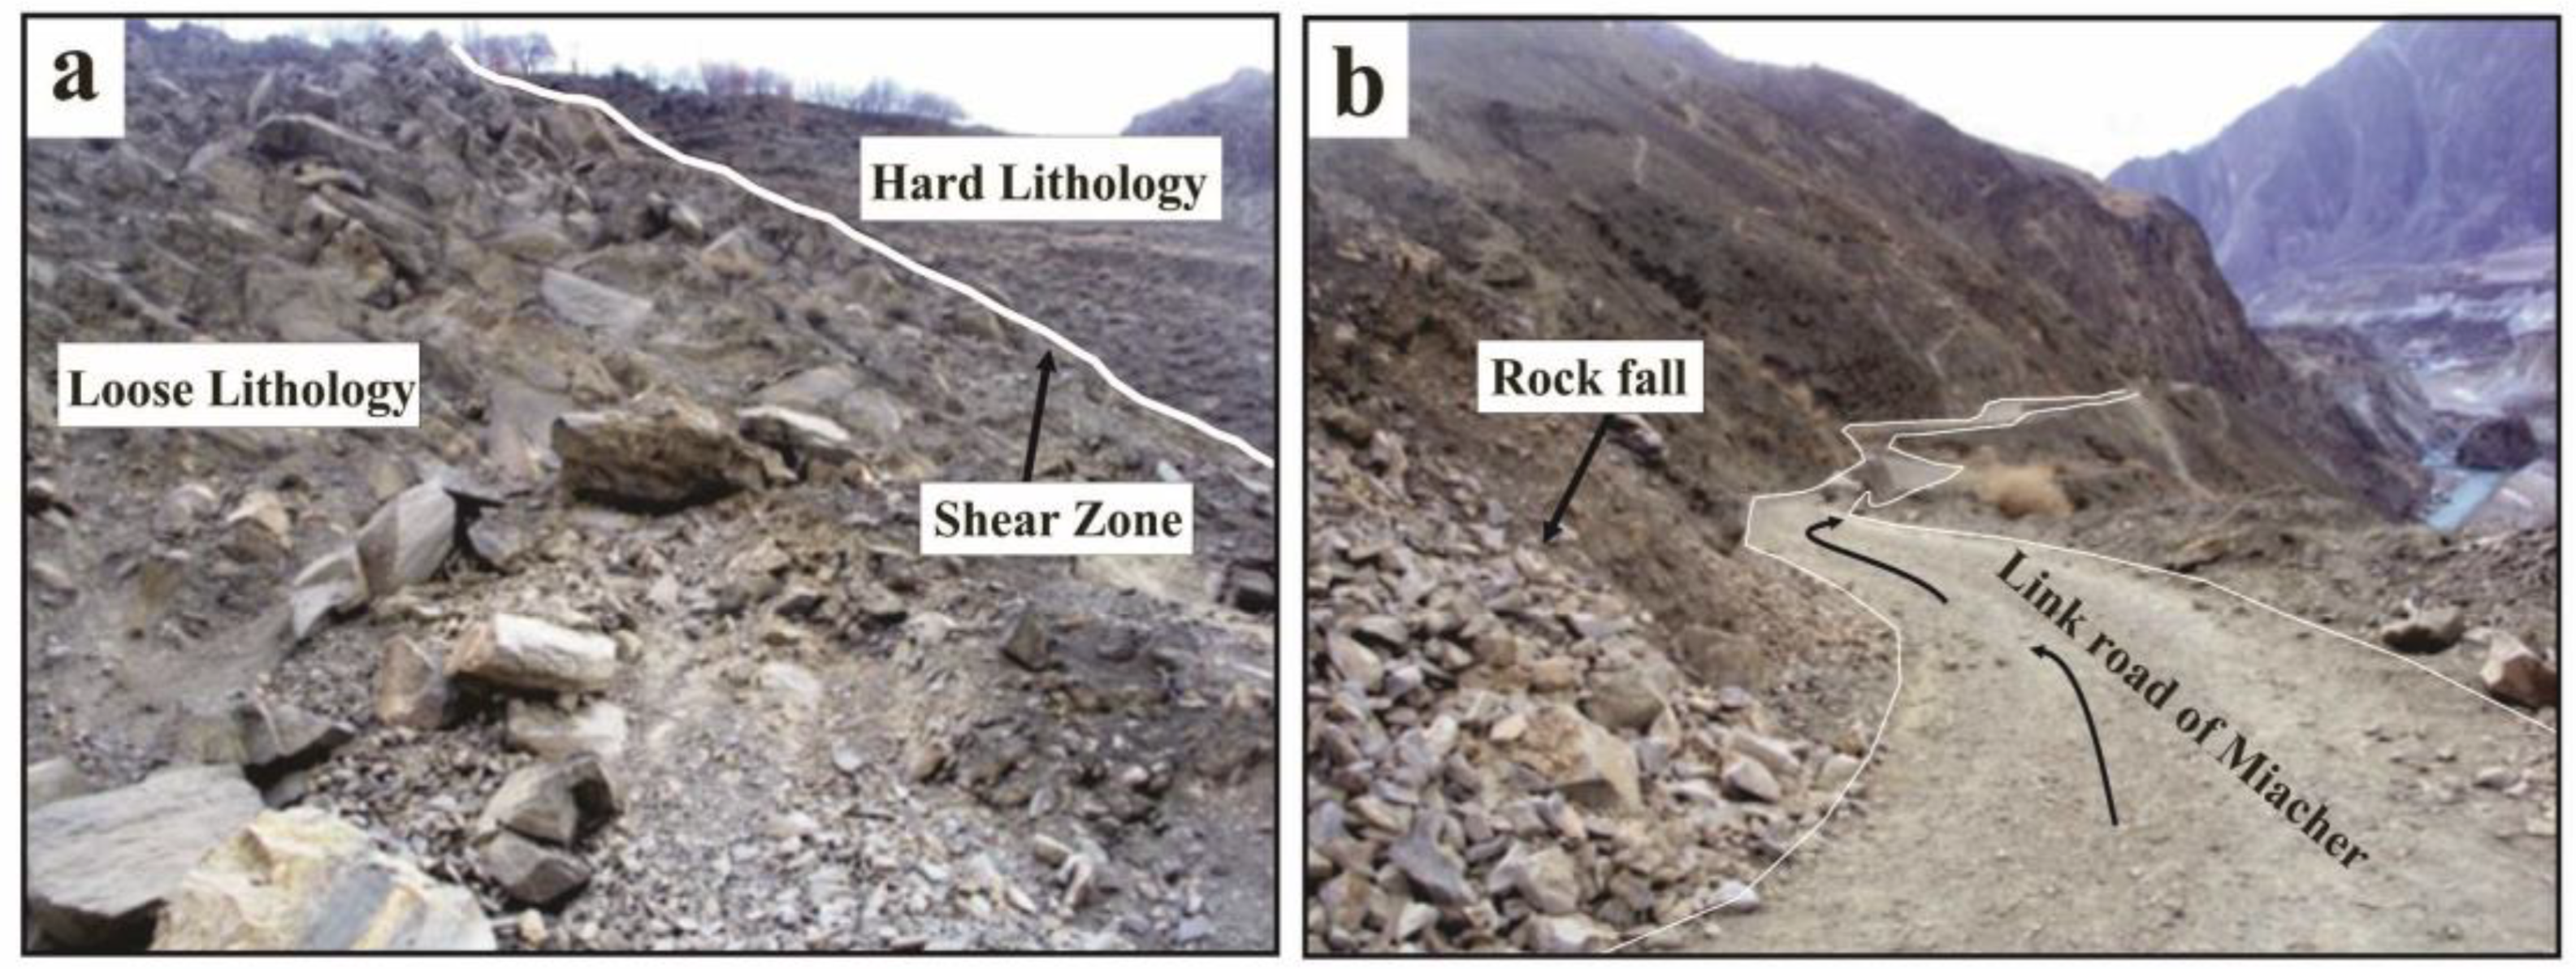
4.3.4. Shear Zones
4.3.5. Construction of Road
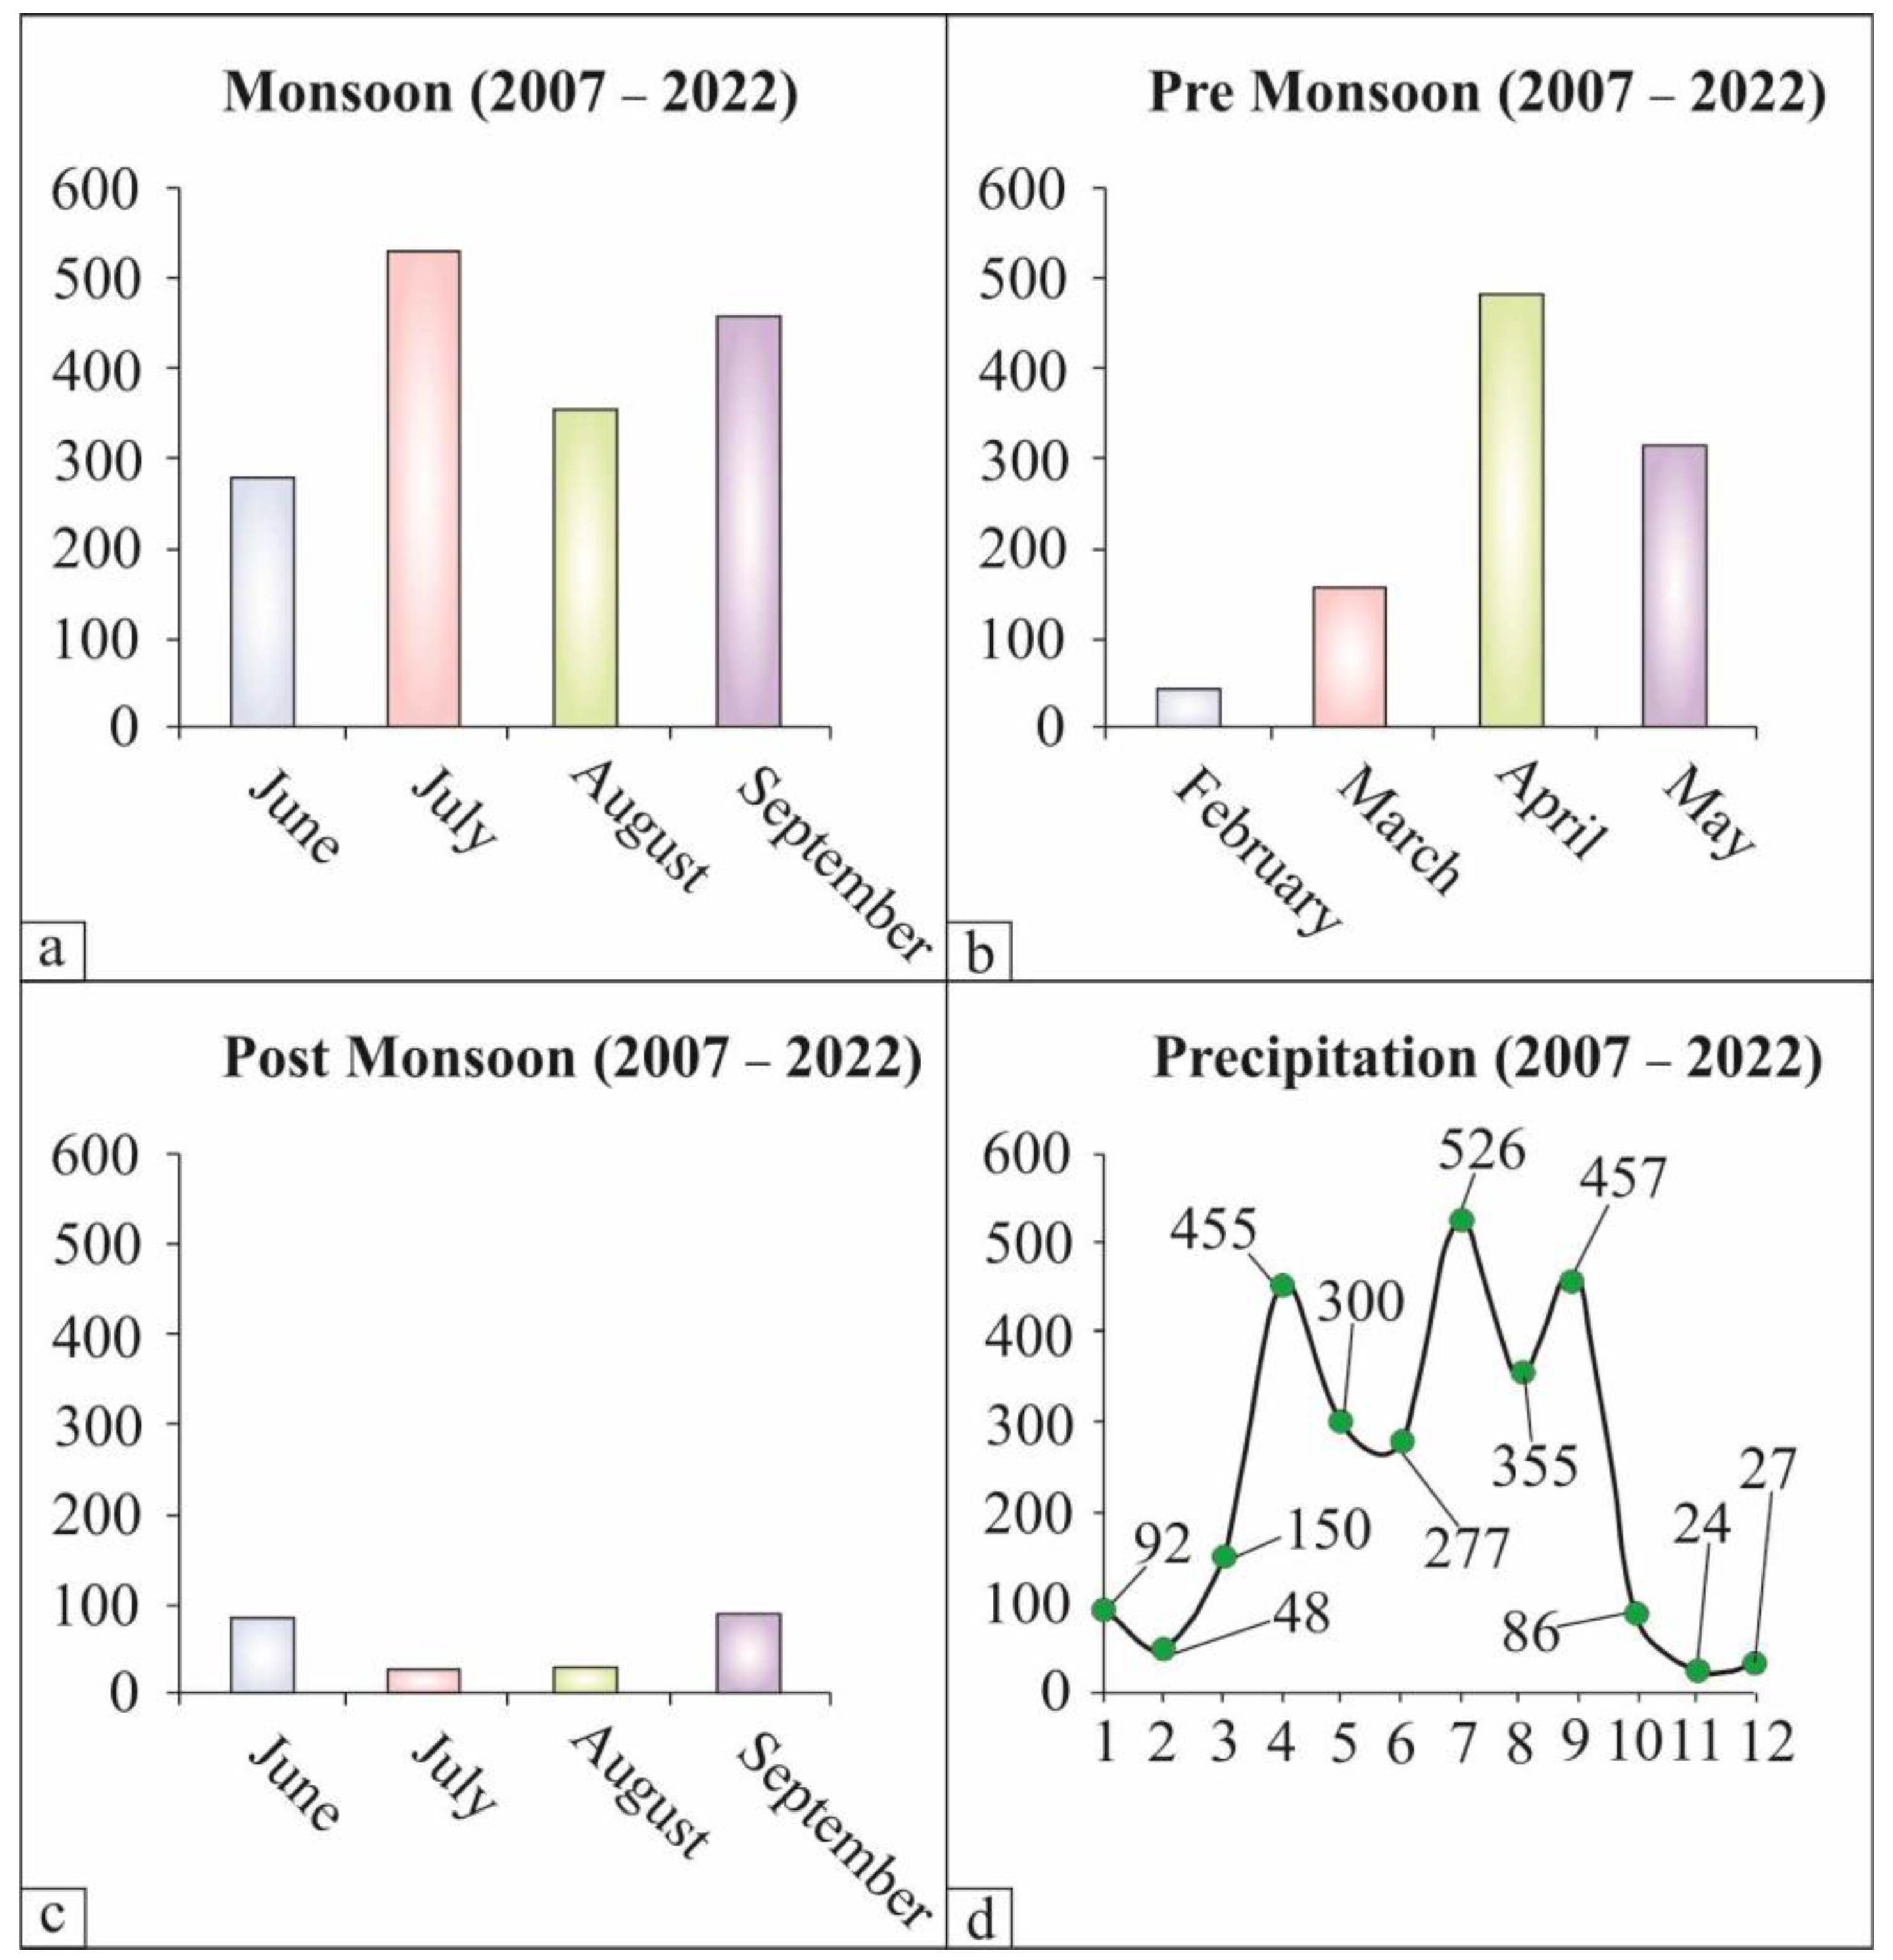
4.4. Effect of Precipitation on Slope Stability
4.4.1. Monsoon
4.4.2. Pre-Monsoon
4.4.3. Post-Monsoon
4.4.4. Interpretation
5. Conclusions
- Each and every manmade altercation as well as natural element substantially accelerates slope collapse. In this regard, the creation of a concrete channel should be used to manage the infiltration of sewage, irrigation and surface runoff water into the gaps and caves.
- Existing fractures should be filled and sealed with regional material, ideally impermeable clay, to improve the soil’s cohesiveness.
- Avoid base cutting on the grounds that it will reduce the slope angle and have a detrimental impact on the FOS.
- A detailed Geophysical survey including gravity, resistivity and GPR should be conducted to picture the 2D model of the landslide assisted by the installation of a GNSS receiver, particularly in the rainy season, to capture the rate of movement of incipient landslide.
Author Contributions
Funding
Data Availability Statement
Acknowledgments
Conflicts of Interest
References
- Zou, Q.; Jiang, H.; Cui, P.; Zhou, B.; Jiang, Y.; Qin, M.; Liu, Y.; Li, C. A new approach to assess landslide susceptibility based on slope failure mechanisms. Catena 2021, 204, 105388. [Google Scholar] [CrossRef]
- Crozier, M.J.; Glade, T. Landslide hazard and risk: Issues, concepts and approach. Landslide Hazard Risk 2005, 1–40. [Google Scholar] [CrossRef]
- Kundu, P.; Gupta, N. Impact of residual strength of soil in reactivated landslide: Case studies of a few landslides in different regions of the globe. In Earthquake Geotechnics: Select Proceedings of 7th ICRAGEE 2021; Springer: Singapore, 2022; pp. 249–258. [Google Scholar]
- Reale, C.; Gavin, K.; Prendergast, L.J.; Xue, J. Multi-modal reliability analysis of slope stability. Transp. Res. Procedia 2016, 14, 2468–2476. [Google Scholar] [CrossRef]
- Chirico, G.B.; Borga, M.; Tarolli, P.; Rigon, R.; Preti, F. Role of vegetation on slope stability under transient unsaturated conditions. Procedia Earth Planet. Sci. 2013, 19, 932–941. [Google Scholar] [CrossRef]
- Sur, C.; Jung, Y.; Choi, M. Temporal stability and variability of field scale soil moisture on mountainous hillslopes in Northeast Asia. Geoderma 2013, 207–208, 234–243. [Google Scholar] [CrossRef]
- Sorbino, G.; Nicotera, M.V. Unsaturated soil mechanics in rainfall-induced flow landslides. Eng. Geol. 2013, 165, 105–132. [Google Scholar] [CrossRef]
- L’Heureux, J.S.; Vanneste, M.; Rise, L.; Brendryen, J.; Forsberg, C.F.; Nadim, F.; Longva, O.; Chand, S.; Kvalstad, T.J.; Haflidason, H. Stability, mobility and failure mechanism for landslides at the upper continental slope off Vesterålen, Norway. Mar. Geol. 2013, 346, 192–207. [Google Scholar] [CrossRef]
- Kanungo, D.P.; Sharma, S. Rainfall thresholds for prediction of shallow landslides around Chamoli-Joshimath region, Garhwal Himalayas, India. Landslides 2013, 11, 629–638. [Google Scholar] [CrossRef]
- McKenna, J.; Santi, P.; Amblard, X.; Negri, J. Effects of soil-engineering properties on the failure mode of shallow landslides. Landslides 2012, 9, 215–228. [Google Scholar] [CrossRef]
- Ho, J.-Y.; Lee, K.T.; Chang, T.-C.; Wang, Z.-Y.; Liao, Y.-H. Influences of spatial distribution of soil thickness on shallow landslide prediction. Eng. Geol. 2012, 124, 38–46. [Google Scholar] [CrossRef]
- Butt, M.J.; Umar, M.; Qamar, R. Landslide dam and subsequent dam-break flood estimation using HEC-RAS model in Northern Pakistan. Nat. Hazards 2013, 65, 241–254. [Google Scholar] [CrossRef]
- Afzal, N.; Ahmad, A.; Shirazi, S.A.; Younes, I. GIS-based landslide susceptibility mapping using analytical hierarchy process: A case study of Astore region, Pakistan. EQA-Int. J. Environ. Qual. 2022, 48, 27–40. [Google Scholar] [CrossRef]
- Hussain, M.A.; Chen, Z.; Wang, R.; Shah, S.U.; Shoaib, M.; Ali, N.; Xu, D.; Ma, C. Landslide susceptibility mapping using machine learning algorithm. Civ. Eng. J. 2022, 8, 209–224. [Google Scholar] [CrossRef]
- Khaliq, A.H.; Basharat, M.; Riaz, M.T.; Riaz, M.T.; Wani, S.; Al-Ansari, N.; Le, L.B.; Linh, N.T.T. Spatiotemporal landslide susceptibility mapping using machine learning models: A case study from district Hattian Bala, NW Himalaya, Pakistan. Ain Shams Eng. J. 2023, 14, 101907. [Google Scholar] [CrossRef]
- Kamp, U.; Growley, B.; Khattak, G.; Owen, L. GIS-based landslide susceptibility mapping for the 2005 Kashmir earthquake region. Geomorphology 2008, 101, 631–642. [Google Scholar] [CrossRef]
- Ullah, I.; Aslam, B.; Shah, S.H.I.A.; Tariq, A.; Qin, S.; Majeed, M.; Havenith, H.-B. An integrated approach of machine learning, remote sensing, and GIS data for the landslide susceptibility mapping. Land 2022, 11, 1265. [Google Scholar] [CrossRef]
- Farooq, S.; Akram, M.S. Landslide susceptibility mapping using information value method in Jhelum Valley of the Himalayas. Arab. J. Geosci. 2021, 14, 824. [Google Scholar] [CrossRef]
- Khalil, U.; Imtiaz, I.; Aslam, B.; Ullah, I.; Tariq, A.; Qin, S. Comparative analysis of machine learning and multi-criteria decision making techniques for landslide susceptibility mapping of Muzaffarabad district. Front. Environ. Sci. 2022, 10, 1028373. [Google Scholar] [CrossRef]
- Khan, A.N.; Collins, A.E.; Qazi, F. Causes and extent of environmental impacts of landslide hazard in the Himalayan region: A case study of Murree, Pakistan. Nat. Hazards 2011, 57, 413–434. [Google Scholar] [CrossRef]
- Qasim, S.; Qasim, M.; Shrestha, R.P. A survey on households’ resilience to landslide hazard in Murree hills of Pakistan. Environ. Chall. 2021, 4, 100202. [Google Scholar] [CrossRef]
- Amin, M.N.; Umair Ashfaq, M.; Mujtaba, H.; Ehsan, S.; Khan, K.; Faraz, M.I. Computer-Aided Slope Stability Analysis of a Landslide—A Case Study of Jhika Gali Landslide in Pakistan. Sustainability 2022, 14, 12954. [Google Scholar] [CrossRef]
- Qasim, S.; Qasim, M.; Shrestha, R.P.; Khan, A.N. Socioeconomic determinants of landslide risk perception in Murree hills of Pakistan. Aims Environ. Sci. 2018, 5, 305–314. [Google Scholar] [CrossRef]
- Feng, H.; Lu, H.; Carrapa, B.; Zhang, H.; Chen, J.; Wang, Y.; Clift, P.D. Erosion of the Himalaya-Karakoram recorded by Indus Fan deposits since the Oligocene. Geology 2021, 49, 1126–1131. [Google Scholar] [CrossRef]
- Clift, P.D.; Shimizu, N.; Layne, G.; Blusztajn, J.; Gaedicke, C.; Schluter, H.-U.; Clark, M.; Amjad, S. Development of the Indus Fan and its significance for the erosional history of the Western Himalaya and Karakoram. Geol. Soc. Am. Bull. 2001, 113, 1039–1051. [Google Scholar] [CrossRef]
- Su, X.; Zhang, Y.; Meng, X.; Rehman, M.U.; Khalid, Z.; Yue, D. Updating Inventory, Deformation, and Development Characteristics of Landslides in Hunza Valley, NW Karakoram, Pakistan by SBAS-InSAR. Remote Sens. 2022, 14, 4907. [Google Scholar] [CrossRef]
- Rehman, Q.U.; Ahmed, W.; Waseem, M.; Khan, S.; Farid, A.; Shah, S.H.A. Geophysical investigations of a potential landslide area in Mayoon, Hunza District, Gilgit-Baltistan, Pakistan. Rud. -Geološko-Naft. Zb. 2021, 36, 127–141. [Google Scholar] [CrossRef]
- Rehman, M.U.; Zhang, Y.; Meng, X.; Su, X.; Catani, F.; Rehman, G.; Yue, D.; Khalid, Z.; Ahmad, S.; Ahmad, I. Analysis of landslide movements using interferometric synthetic aperture radar: A case study in Hunza-Nagar Valley, Pakistan. Remote Sens. 2020, 12, 2054. [Google Scholar] [CrossRef]
- Ahmed, M.F.; Ali, M.Z.; Rogers, J.D.; Khan, M.S. A study of knickpoint surveys and their likely association with landslides along the Hunza River longitudinal profile. Environ. Earth Sci. 2019, 78, 176. [Google Scholar] [CrossRef]
- Bacha, A.S.; Shafique, M.; van der Werff, H. Landslide inventory and susceptibility modelling using geospatial tools, in Hunza-Nagar valley, northern Pakistan. J. Mt. Sci. 2018, 15, 1354–1370. [Google Scholar] [CrossRef]
- Ahmed, M.F.; Rogers, J.D.; Bakar, M.Z.A. Hunza river watershed landslide and related features inventory mapping. Environ. Earth Sci. 2016, 75, 523. [Google Scholar] [CrossRef]
- Goudie, A.S.; Brunsden, D.; Collins, D.N.; Derbyshire, E.; Ferguson, R.J.; Jones, D.K.C.; Perrott, F.A.; Said, M.; Waters, R.S.; Whalley, W.B. The Geomorphology of the Hunza Valley Karakoram Mountains Pakistan; Cambridge University Press: Cambridge, UK, 1984; Volume 2, p. 410. [Google Scholar]
- Miller, K.J. The International Karakoram Project; Cambridge University Press: Cambridge, UK, 1984; Volume 1. [Google Scholar]
- Hewitt, K. Natural dams and outburst floods of the Karakoram Himalaya. IAHS 1982, 138, 259–269. [Google Scholar]
- Owen, L.A. Mass movement deposits in the Karakoram Mountains: Their sedimentary characteristics, recognition and role in Karakoram landform evolution. Z. Geomorphol. 1991, 35, 401–424. [Google Scholar] [CrossRef]
- Hewitt, K. Catastrophic landslides and their effects on the Upper Indus streams, Karakoram Himalaya, northern Pakistan. Geomorphology 1998, 26, 47–80. [Google Scholar] [CrossRef]
- Gardezi, H.; Bilal, M.; Cheng, Q.; Xing, A.; Zhuang, Y.; Masood, T. A comparative analysis of attabad landslide on january 4, 2010, using two numerical models. Nat. Hazards 2021, 107, 519–538. [Google Scholar] [CrossRef]
- Chen, X.; Cui, P.; You, Y.; Cheng, Z.; Khan, A.; Ye, C.; Zhang, S. Dam-break risk analysis of the Attabad landslide dam in Pakistan and emergency countermeasures. Landslides 2017, 14, 675–683. [Google Scholar] [CrossRef]
- Shi, Y.; Wang, W. Research on snow cover in China and the avalanche phenomena at Batura Glacier, Pakistan. Ann. Glaciol. 1980, 13, 289–293. [Google Scholar] [CrossRef]
- Hewitt, K. Catastrophic landslide deposits in the Karakoram Himalaya. Science 1988, 242, 64–67. [Google Scholar] [CrossRef]
- Kuo, Y.-S.; Tsai, Y.-J.; Chen, Y.-S.; Shieh, C.-L.; Miyamoto, K.; Itoh, T. Movement of deep-seated rainfall-induced landslide at Hsiaolin Village during Typhoon Morakot. Landslides 2013, 10, 191–202. [Google Scholar] [CrossRef]
- Comegna, L.; Picarelli, L.; Bucchignani, E.; Mercogliano, P. Potential effects of incoming climate changes on the behaviour of slow active landslides in clay. Landslides 2013, 10, 373–391. [Google Scholar] [CrossRef]
- Martelloni, G.; Segoni, S.; Fanti, R.; Catani, F. Rainfall thresholds for the forecasting of landslide occurrence at regional scale. Landslides 2012, 9, 485–495. [Google Scholar] [CrossRef]
- Prokešová, R.; Medveďová, A.; Tábořík, P.; Snopková, Z. Towards hydrological triggering mechanisms of large deep-seated landslides. Landslides 2013, 10, 239–254. [Google Scholar] [CrossRef]
- Shen, H.; Klapperich, H.; Abbas, S.M.; Ibrahim, A. Slope stability analysis based on the integration of GIS and numerical simulation. Autom. Constr. 2012, 26, 46–53. [Google Scholar] [CrossRef]
- Huang, C.-C.; Yuin, S.-C. Experimental investigation of rainfall criteria for shallow slope failures. Geomorphology 2010, 120, 326–328. [Google Scholar] [CrossRef]
- Schmertmann, J.H. Estimating slope stability reduction due to rain infiltration mounding. J. Geotech. Geoenviron. Eng. 2006, 132, 1219–1228. [Google Scholar] [CrossRef]
- Zhang, X.; Shi, Y. Changes of the Batura Glacier in the Quaternary and Recent Times; Sinica, S.P.A., Ed.; Lanzhou Institute of Glaciology and Geocryology: Beijing, China, 1980; pp. 83–89. [Google Scholar]
- Raschid, S. Between Two Burrs on the Map-Travels in Northern Pakistan; Vanguard Books Ltd.: Lahore, Pakistan, 1995. [Google Scholar]
- van Westen, C.J.; Castellanos, E.; Kuriakose, S.L. Spatial data for landslide susceptibility, hazard, and vulnerability assessment: An overview. Eng. Geol. 2008, 102, 112–131. [Google Scholar] [CrossRef]
- Corominas, J.; Moya, J. A review of assessing landslide frequency for hazard zoning purposes. Eng. Geol. 2008, 102, 193–213. [Google Scholar] [CrossRef]
- Glade, T. Linking debris-flow hazard assessments with geomorphology. Geomorphology 2005, 66, 189–213. [Google Scholar] [CrossRef]
- Kazmi, A.H.; Jan, M.Q. Geology And Tectonics Of Pakistan; Graphic Publishers: Karachi, Pakistan, 1997; p. 528. [Google Scholar]
- Gaetani, M. The Karakorum Block in Central Asia from Ordovician to Cretaceous. Sediment. Geol. 1997, 109, 339–359. [Google Scholar] [CrossRef]
- Desio, A. Geologic evolution of the Karakorum & Geodynamic of Pakistan; Milano, U.d.s.d., Ed.; Instituti di Geologica e Paleontologia: Milano, Italy, 1979; pp. 111–124. [Google Scholar]
- Le Fort, P.; Pêcher, A. An introduction to the geological map of the area between Hunza and Baltistan, Karakoram-Kohistan-Ladakh-Himalaya region, northern Pakistan, scale 1:150,000. Geologica 2002, 6, 1–199. [Google Scholar]
- Searle, M.P. Geological evolution of the Karakoram Ranges. Ital. J. Geosci. 2011, 130, 147–159. [Google Scholar] [CrossRef]
- Turner, A.; Schuster, R. Landslides: Investigation and Mitigation: Transportation Research Board Special Report 247; National Research Council: Washington, DC, USA, 1996; Volume 673. [Google Scholar]
- ASTM. Annual Book of ASTM Standards; ASTM: West Conshohocken, PA, USA, 2010; Volume 00.01, p. 1689. [Google Scholar]
- Stevens, J. Unified soil classification system. Civ. Eng. Mag. 1982, 52, 61–62. [Google Scholar]
- Spencer, E. A method of analysis of the stability of embankments assuming parallel interstice forces. Geotechnique 1967, 17, 11–26. [Google Scholar] [CrossRef]
- Swanson, H.E.; Morris, M.; Stinchfield, R.P.; Evans, E.H. Standard X-ray Diffraction Powder Patterns; National Bureau of Standards: Washington, DC, USA, 1962. [Google Scholar]
- Rocchi, G.; Vaciago, G.; Callerio, A.; Fontana, M.; Previtali, R. Description of soils based on geomechanical criteria for improved landslide classification. Landslides 2013, 11, 813–825. [Google Scholar] [CrossRef]
- Cook, D.; Santi, P.; Higgins, J. Prediction of piezometric surfaces and drain spacing for horizontal drain design. Landslides 2012, 9, 547–556. [Google Scholar] [CrossRef]
- Rashid, M.U. Slope Stability Analysis of Maicher Landslide Upper Hunza, Gilgit Baltistan, Pakistan. Master’s Thesis, University of Peshawar, Peshawar, KP, Pakistan, 2018. [Google Scholar]
- Bittelli, M.; Valentino, R.; Salvatorelli, F.; Rossi Pisa, P. Monitoring soil-water and displacement conditions leading to landslide occurrence in partially saturated clays. Geomorphology 2012, 173–174, 161–173. [Google Scholar] [CrossRef]


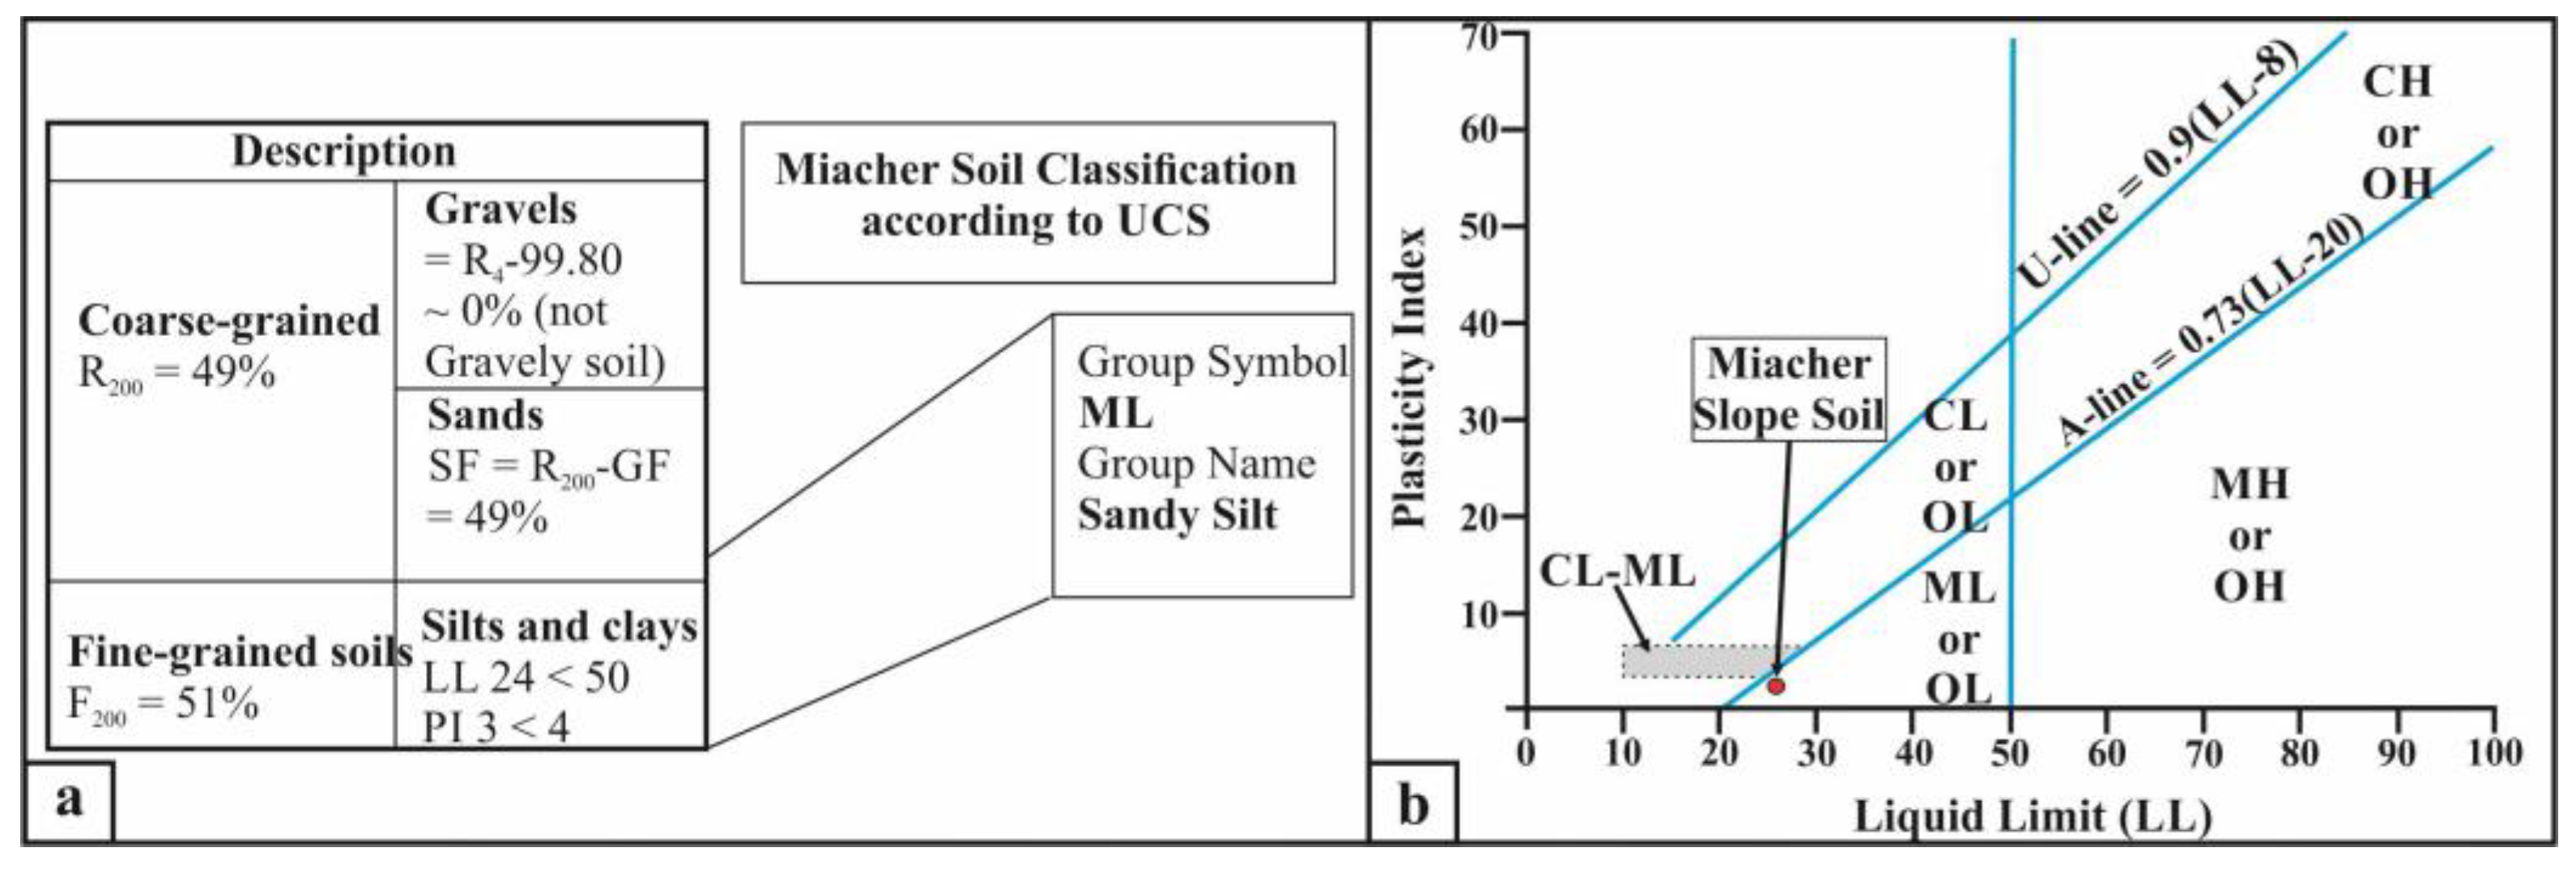
| Parameters | Sample 1 | Sample 2 | Sample 3 | ASTM |
|---|---|---|---|---|
| Moisture Content (%) | 1% | 1% | 3% | D2216 |
| Specific Gravity (Gs) | 2.65 | 2.54 | 2.68 | D854 |
| Liquid Limit (LL) | 23 | 24 | 25 | D4318 |
| Plastic Limit (PL) | 21 | 21 | 22 | D4319 |
| Plastic Index (PI) | 2 | 3 | 3 | D4320 |
| Unit weight (γ) | 12 KN/m3 | 12 KN/m3 | 13 KN/m3 | D2937 |
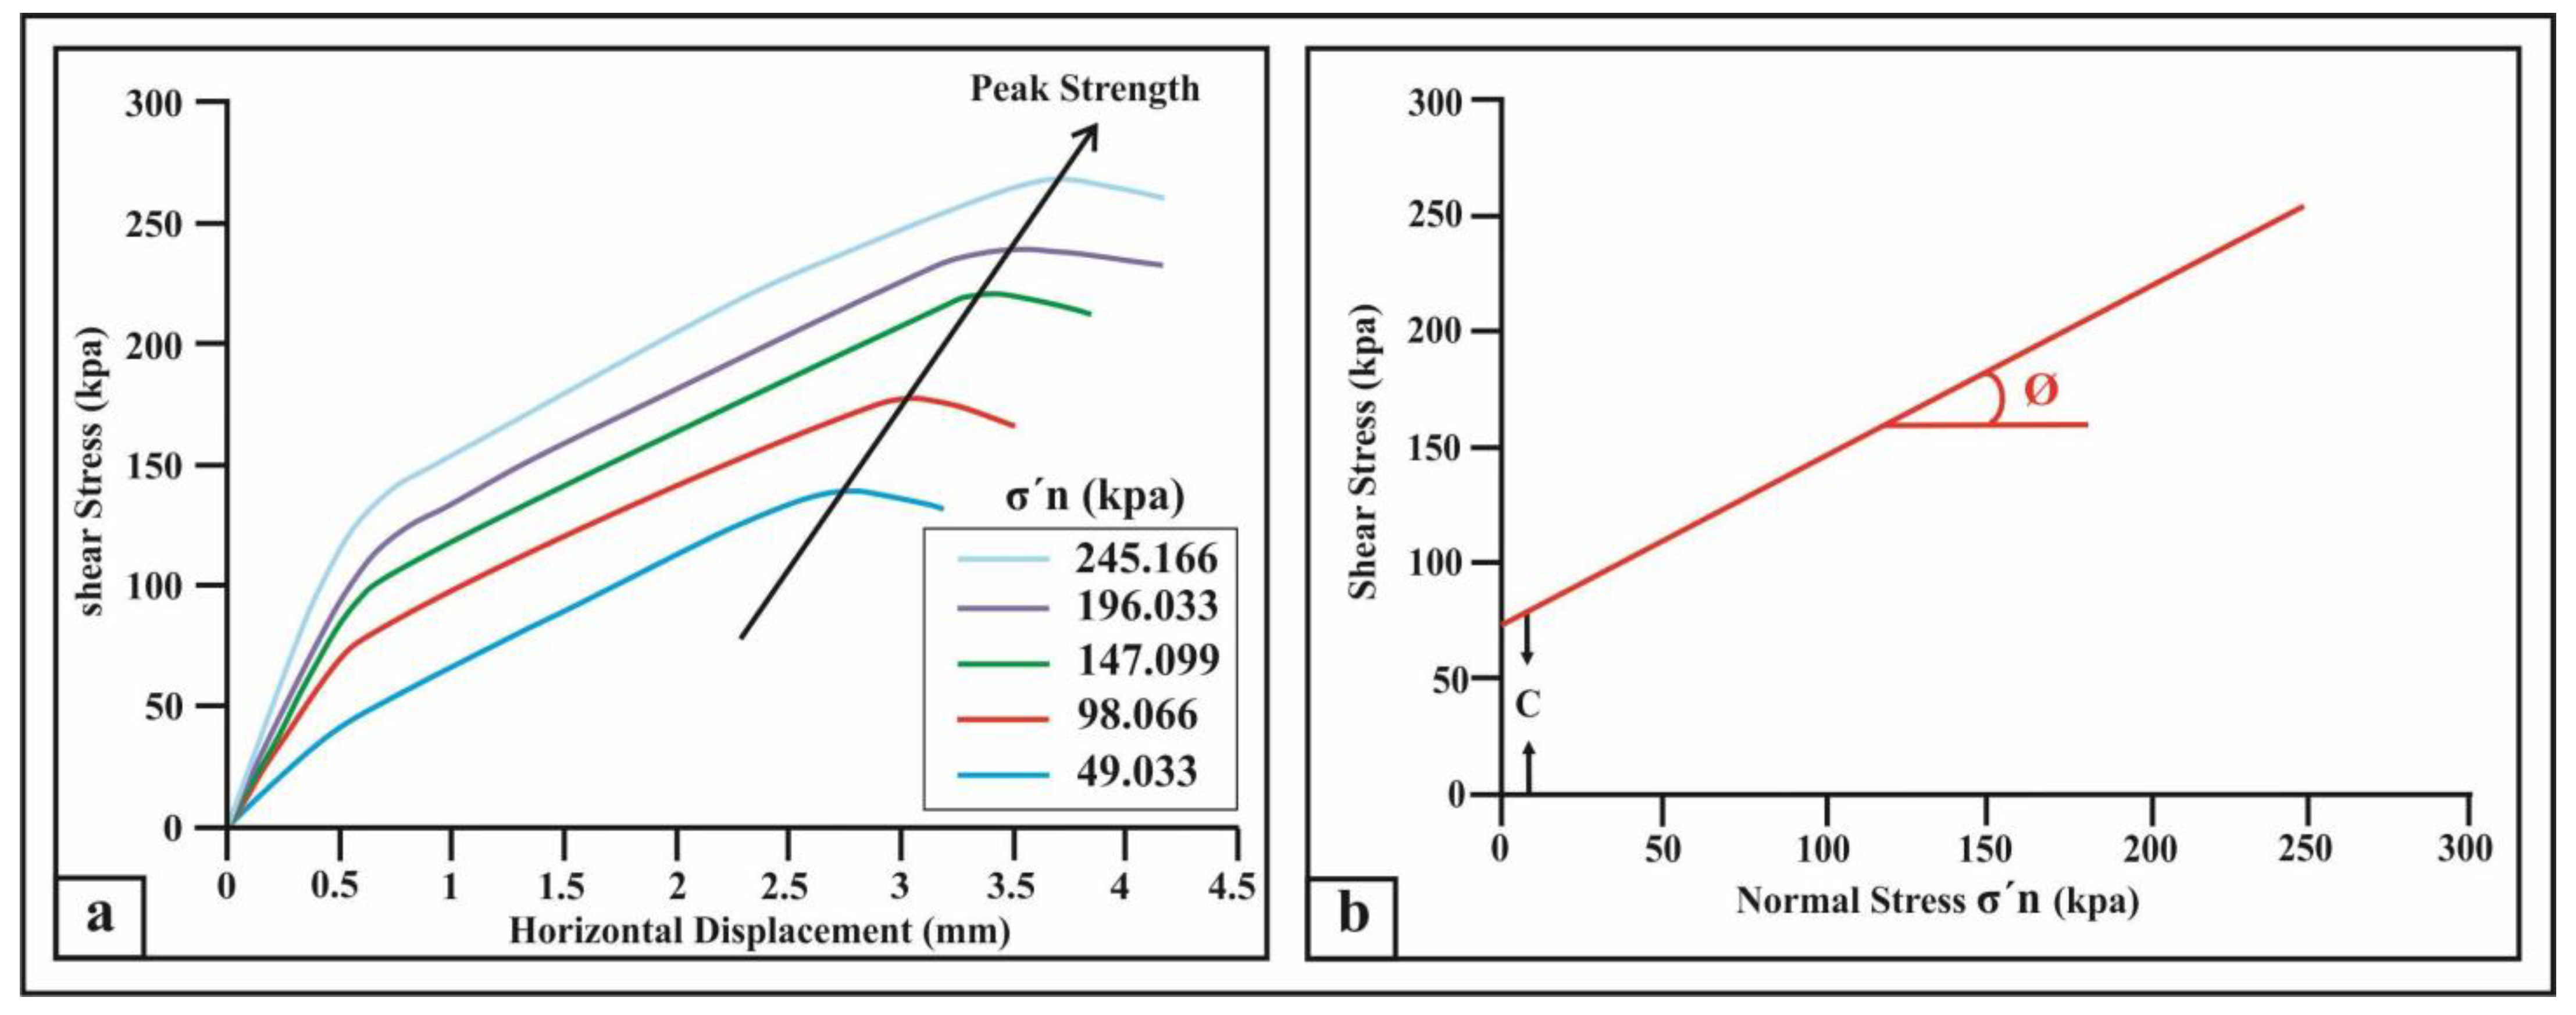
| Normal Stress (KPa) | Shear Stress (KPa) | Residual Stress (KPa) | Phi Angle (Φ) |
|---|---|---|---|
| 49 | 104 | 97 | 43 |
| 98 | 139 | 128 | 31 |
| 147 | 174 | 167 | 24 |
| 196 | 212 | 201 | 21 |
| 245 | 253 | 243 | 20 |
| Average | 28 | ||
| Description | Group Symbols | Group Name | ||
|---|---|---|---|---|
| Coarse grained Soil >50% soil retained (R) on Sieve # 200 | Gravels >50% Coarse fraction R on Sieve # 04 | Clean Gravel <5% fines | GW | Well graded gravel |
| GP | Poorly graded gravel | |||
| Gravel + Fines >12% fines | GM | Silty gravel | ||
| GC | Clayey Gravel | |||
| Sands ≥50% Coarse fraction Passes on Sieve # 04 | Clean Sand <5% fines | SW | Well graded sand | |
| SP | Poorly graded sand | |||
| Sand + Fines >12% fines | SM | Silty sand | ||
| SC | Clayey sand | |||
| Fine grained Soil ≥50% passes on Sieve # 200 | Silts & Clays Liquid Limit (LL) < 50 | ML | Inorganic | Low plasticity silt |
| CL | Low plasticity clay | |||
| OL | Organic | Low plasticity silt & clay | ||
| Silts & Clays Liquid Limit (LL) ≥ 50 | MH | Inorganic | Elastic silt | |
| CH | High plasticity clay | |||
| OH | Organic | High plasticity clay & silt | ||
| Highly Organic | Pt | Peat | ||
| Factor of Safety (FOS) | |||||||||
|---|---|---|---|---|---|---|---|---|---|
| Parameters | Unit Weight (γ) | Cohesion (C) | Angle of Internal Friction (Φ) | ||||||
| 11 | 12 | 13 | 50 | 60 | 70 | 26 | 28 | 30 | |
| MP | 1.046 | 1.036 | 1.026 | 1.026 | 1.031 | 1.036 | 1.016 | 1.036 | 1.056 |
| O | 1.032 | 1.028 | 1.024 | 1.020 | 1.024 | 1.028 | 1.010 | 1.028 | 1.046 |
| J | 1.032 | 1.028 | 1.024 | 1.020 | 1.024 | 1.028 | 1.010 | 1.028 | 1.046 |
| B | 1.048 | 1.044 | 1.041 | 1.039 | 1.041 | 1.044 | 0.944 | 1.044 | 1.168 |
| MP = Morgenstern & Price, O = Ordinary, J = Janbu, B = Bishop | |||||||||
| FOS | ||||||||||||||
|---|---|---|---|---|---|---|---|---|---|---|---|---|---|---|
| γ | MP | O | J | B | ɸ | MP | O | J | B | c | MP | O | J | B |
| 11 | 1.053 | 1.020 | 1.020 | 1.045 | 26 | 1.023 | 1.015 | 1.015 | 0.942 | 50 | 1.024 | 1.018 | 1.018 | 1.036 |
| 12 | 1.033 | 1.025 | 1.025 | 1.042 | 28 | 1.033 | 1.025 | 1.025 | 1.042 | 60 | 1.028 | 1.021 | 1.021 | 1.039 |
| 13 | 10.13 | 1.030 | 1.030 | 1.038 | 30 | 1.043 | 1.035 | 1.035 | 1.165 | 70 | 1.033 | 1.025 | 1.025 | 1.042 |
| (γ = Unit weight KN/m3, ɸ = Angle of Internal friction, c = Cohesion) MP = Morgenstern & Price, O = Ordinary, J = Janbu, B = Bishop | ||||||||||||||
Disclaimer/Publisher’s Note: The statements, opinions and data contained in all publications are solely those of the individual author(s) and contributor(s) and not of MDPI and/or the editor(s). MDPI and/or the editor(s) disclaim responsibility for any injury to people or property resulting from any ideas, methods, instructions or products referred to in the content. |
© 2023 by the authors. Licensee MDPI, Basel, Switzerland. This article is an open access article distributed under the terms and conditions of the Creative Commons Attribution (CC BY) license (https://creativecommons.org/licenses/by/4.0/).
Share and Cite
Rashid, M.u.; Ahmed, W.; Islam, I.; Petrounias, P.; Giannakopoulou, P.P.; Koukouzas, N. Impact of Climate Change on the Stability of the Miacher Slope, Upper Hunza, Gilgit Baltistan, Pakistan. Climate 2023, 11, 102. https://doi.org/10.3390/cli11050102
Rashid Mu, Ahmed W, Islam I, Petrounias P, Giannakopoulou PP, Koukouzas N. Impact of Climate Change on the Stability of the Miacher Slope, Upper Hunza, Gilgit Baltistan, Pakistan. Climate. 2023; 11(5):102. https://doi.org/10.3390/cli11050102
Chicago/Turabian StyleRashid, Mehboob ur, Waqas Ahmed, Ihtisham Islam, Petros Petrounias, Panagiota P. Giannakopoulou, and Nikolaos Koukouzas. 2023. "Impact of Climate Change on the Stability of the Miacher Slope, Upper Hunza, Gilgit Baltistan, Pakistan" Climate 11, no. 5: 102. https://doi.org/10.3390/cli11050102