Article

Impact of Stratospheric Geoengineering on Sea Surface Temperature in the Northern Gulf of Guinea

by
Francis F. B. K. Ayissi
1,*,
Casimir Y. Da Allada
1,2,3,
Ezinvi Baloïtcha
1,
Simone Tilmes
4 and
Peter J. Irvine
5
1
International Chair in Mathematical Physics and Applications (ICMPA–UNESCO CHAIR), University of Abomey-Calavi, Abomey-Calavi BP 2549, Benin
2
Laboratory of Geosciences, Environment and Applications (LaGEA), National University of Sciences Technology, Engineering and Mathematics (UNSTIM), Abomey-Calavi BP 2282, Benin
3
Institut de Recherches Halieutiques et Océanologiques du Bénin (IRHOB), Cotonou BP 1665, Benin
4
National Center for Atmospheric Research, Boulder, CO 80305, USA
5
Earth Sciences, University College London, London WC1E 6BT, UK
*
Author to whom correspondence should be addressed.
Climate 2023, 11(4), 87; https://doi.org/10.3390/cli11040087
Submission received: 19 February 2023 / Revised: 28 March 2023 / Accepted: 31 March 2023 / Published: 12 April 2023
(This article belongs to the Section Climate Adaptation and Mitigation)

Abstract

:
Among techniques proposed to limit global warming, there is Stratospheric Aerosol Geoengineering (SAG) which is aiming to increase Earth-atmosphere albedo by injecting sulfur dioxide into the stratosphere in order to reduce the solar radiation that reaches the earth. This study aims to assess the potential impact of SAG on Sea Surface Temperature (SST) in the Northern Gulf of Guinea and its causes using GLENS (Geoengineering Large Ensemble) simulations performed under a high anthropogenic emission scenario (RCP8.5). Here, we focus on two dynamically different regions: Sassandra Upwelling in Côte d’Ivoire (SUC, located east of Cape Palmas) and Takoradi Upwelling in Ghana (TUG, located east of Cape Three Points). Results show that in the SUC region, under climate change, there is an increase in SST (referred to as the current climate) all year long (by 1.52 °C on average) mainly due to an increase in net heat flux (lead by the decrease in longwave radiation) and also in weak vertical mixing (caused by strong stratification which dominates the vertical shear). Under SAG, SST decreases all the seasonal cycle with its maximum in December (−0.4 °C) due to a reduction in the net heat flux (caused by a diminution of solar radiation) and an increase in vertical advection (due to an increase in vertical temperature gradient and vertical velocity). In the TUG region, under climate change, SST warming is a little more intense than in the SUC region and SST changes are driven by an increase in the net heat flux and strong stratification. The cooling of the SST in TUG is similar to the SUC region, but contrary to this region, the cooling under SAG is not only explained by a decrease in the net heat flux but also by the remote forcing of wind changes at the western equatorial Atlantic.

1. Introduction

Global temperature keeps growing and efforts to reduce greenhouse gas emissions do not seem to be sufficient [1,2,3]. Additionally, Sub-Saharan Africa is the most vulnerable to the effects of climate change [4,5]. To limit global warming and probably its consequences, solar radiation management (SRM) has been proposed to reflect part of the solar radiation reaching the Earth [6,7,8]. One of the SRM methods capable of reducing the temperature increase quickly is Stratospheric Aerosol Geoengineering (SAG), which involves injecting sulfur into the stratosphere to increase its albedo [9,10,11,12]. While this technique could mitigate some of the effects of global warming, it may also have harmful effects on the climate. Indeed, it has been shown that this technique can modify the global hydrological cycle [9,13,14,15]. Regionally, using simulations with and without SAG from the GLENS (Geoengineering Large Ensemble) project under the Representative Concentration Pathway 8.5 (RCP8.5) scenario, previous studies show that under the SAG, monsoon rainfall is reduced in the West African region while it stays practically unchanged in the northern and southern Sahel [16]. These changes in monsoon precipitation are largely related to atmospheric circulation changes. Apart from rainfall, it is shown that SAG decreases Sea Surface Temperature (SST) in the equatorial Atlantic cold tongue and SST changes are predominantly associated with wind modification in the western equatorial Atlantic [17]. However, no study has examined the possible consequences of SAG in the northern Gulf of Guinea (NGG), which is known to have large variations in SST due to the presence of coastal upwelling. SST changes in the NGG influence, on the one hand, marine life [18] and therefore fishery activities [19], and on the other hand, coastal monsoon rainfall [20,21], impacting on agriculture, which is still rain-fed in West African countries.
SST in the NGG has important seasonal cycle which can be split into four seasons [22,23,24], namely (1) a short cold season (minor upwelling) between January and February; (2) a large warm season from March to June; (3) a large cold season (major upwelling) from July to September; and (4) a short warm season from November to December. The greatest seasonal variability of SST in the NGG is mainly located in the upwelling regions at Sassandra (east of Cape Palmas in Côte d’Ivoire) and at Takoradi (east of Cape Three Points in Ghana) [25,26,27,28]. Although the seasonal cycle variability of SST is dominant in the NGG, there are also significant inter-annual variations [28,29]. The mechanisms involved in SST variations are atmospheric processes (air–sea heat fluxes) and/or oceanic processes (advection, entrainment term, and vertical mixing at the base of the mixed layer) [30,31,32,33,34]. However, the processes related to SST modification in the Cape Palmas region have been shown to be different from those in Cape Three Points [33,35]. At the region of Cape Palmas (Côte d’Ivoire), the SST cooling is mainly due to Guinea Current detachment [33]. It is shown that the intensification of Guinea Current leads to an increase in vertical shear, which dominates the stratification of the water column and enables strong vertical mixing, inducing a cooling of the SST [31,32]. Contrary to the Cape Palmas region, in the Cape of Three Points (Ghana), it is essentially the Ekman transport due to the wind stress which is at the origin of the observed cooling [33,34,36,37,38,39,40,41,42]. A recent study based on an exceptional cooling that occurred in 2012 in these two regions reveals that east of Cape Palmas, strong vertical mixing in the presence of weak stratification explains anomalous SST cooling, whereas east of Cape Three Points it is mainly related to meridional Ekman current [29]. Besides the local processes mentioned above, remote forcing (non-local processes) can also lead to SST variability in the NGG. Indeed, wind changes in the western equatorial Atlantic induce Kelvin waves that propagate and in turn impact the SST in the NGG [18,43,44,45,46].
As SST in the NGG is a key parameter of the region’s climate due to its influence on the distribution of precipitation and the regulation of the monsoon onset [47,48], it is crucial to study the effect that SAG may have on SST in the NGG. Therefore, the goal of this study is to investigate the impact of SAG on the SST seasonal cycle in the NGG using GLENS simulations. In the remainder of this manuscript, the observation and model data used are described together with the methodology in Section 2. Section 3 exposes the main results found and finally, there are a conclusion and discussion in Section 4.

2. Data and Methods

To assess the impact of SAG on SST in the northern Gulf of Guinea, we used data from the GLENS project [12]. The GLENS simulations were obtained using the Community Earth System Model version 1, with the atmospheric component being the Whole Atmosphere Community Climate Model (WACCM) and the ocean component the Parallel Ocean Program version 2 (POP2). The WACCM model has a spatial resolution of 1.125° in longitude and 0.9° in latitude [49,50], while its ocean component POP2 has a horizontal resolution of 1.125° × 0.33° with 60 vertical levels [51,52]. The objective of the GLENS simulations is to maintain not only the global mean temperature but also the inter-hemispheric and equator–pole surface temperature gradients at 2020 values under the RCP8.5 greenhouse gas scenario (i.e., a high anthropogenic emission scenario) [53]. To achieve these objectives, the GLENS simulations were performed by injecting SO 2 at four different locations in the stratosphere (30° N, 30° S, 15° N, and 15° S, at 180° longitude) [10]. The RCP8.5 simulations (named control, without SAG) were performed with a set of 20 members over a reference period from 2010 to 2030, of which only three members were extended to 2097. The simulations with SO 2 injection (called feedback, with SAG) are based on the 20 members of RCP8.5 from 2020 to 2099.
Based on recent studies [16,17,54], “control” simulations over 2010–2029 (20 years) were used for current climate, referred to as baseline (BSL), “control”, simulations over 2050–2069 (20 years) for climate change without SAG (RCP8.5) and “feedback” simulations with SAG (GLENS) over 2050–2069 (20 years). Additionally in this study, the first three simulation members of the model were used with the monthly data like in recent studies. To evaluate the ability of the model to simulate the NGG SST, the model historical simulation (HIST) of SST was compared with the National Oceanic and Atmospheric Administration monthly Optimum Interpolation Sea Surface Temperature (OISST) available at 1/4° horizontal resolution [55] and the monthly SST from ERA-Interim data available at 0.75° horizontal resolution [56] over the common period 1990–2009 (20 years). Subsurface temperature of the model is also compared with those from the monthly ISAS (In Situ Analysis System) observations from IFREMER in Brest (France) provided on 0.5° × 0.5° horizontal resolution with 152 depth levels over the common period from 2002 to 2009 [57,58].
To evaluate changes under global warming and SAG (relative to current climate), differences (RCP8.5—BSL) and (GLENS—BSL) were computed respectively. In addition, statistical significance using a two-sided t-test was calculated for changes, and for evaluation of the error estimate of changes in SST, the standard error was calculated. To explain the possible causes of SST changes in the NGG, the mixed-layer heat budget was used like in previous studies [17,29,32]:
T t T O T = Q n e t Q p e n ρ C p h N H F V h . h T A D H w T z Z A D 1 h h t ( T T z = h ) E N T + R ,
with = 1 h h 0 d z .
T is the model potential temperature, ρ the surface reference density (set to 1021 kg m 3 as in [29]), C p the specific heat capacity (set to 3984 J kg 3 C 1 as in [29] or in [31]), h the mixed-layer depth (MLD), Q n e t the net surface heat flux, Q p e n the amount of shortwave radiation passing through the base of the mixed layer, V h ( u , v ) the horizontal current, w the vertical velocity, and R is the residual term that incorporates lateral diffusion, vertical mixing, and errors in the estimation of each term in the heat balance Equation (1). Q n e t is estimated as Q n e t = S W ( L W + L H + S H ) , where S W is the solar shortwave radiation, L W the net longwave radiation, L H the latent heat flux, S H the sensible heat flux, while the Q p e n is computed as Q p e n = 0.47 · S W · ( V 1 e h ε 1 + V 2 e h ε 2 ) with ε 1 and ε 2 representing the attenuation depths of long visible, short visible, and ultraviolet wavelengths. Values of V 1 , V 2 , ε 1 , and ε 2 are fixed at 0.39, 0.69, 1.52, and 18.9, respectively, as used in previous studies (e.g., [59]). In Equation (1), the term on the left is the total temperature tendency ( T O T ), N H F is the total air–sea heat flux in the mixed layer, A D H is the horizontal advection, Z A D is vertical advection, and E N T is the entrainment at the base of the mixed layer. Hereafter, we define the oceanic processes under the term O C P ( O C P = A D H + Z A D + E N T + R ), which could also be expressed as O C P = T O T N H F . Firstly, we qualitatively evaluated the changes in each term of Equation (1) to understand how these terms contribute to SST changes and then we completed this first analysis with a quantitative study by calculating the different terms of Equation (1). To assess the role of atmospheric heat fluxes in SST changes, changes in the different components of net heat flux (solar shortwave, latent heat flux, sensible heat flux, and longwave radiation) were examined. For the total advection, the changes in current and temperature gradient were analyzed. To explain the contribution of vertical mixing to SST changes, the vertical stratification of the region and the vertical shear were examined [32,60]. The vertical shear squared S h 2 is calculated following Da-Allada et al. [61]:
S h 2 = ( u z ) 2 + ( v z ) 2 ,
where u is the zonal current and v the meridional current. The Brunt–Väisälä frequency ( N 2 ) is used to obtain the density stratification and is determined as follows [61,62]:
N 2 ( T , S ) = g ρ ρ z g α T z g β S z ,
where T and S are the vertical profiles of temperature and salinity, respectively; α : the thermal expansion coefficient; β : the haline contraction coefficient; g: the gravity; and ρ : the density. Finally, it has also been shown that wind changes (intensification or diminution) in the western equatorial Atlantic basin also influence the SST of the NGG region [18]. Thus, in addition to the local causes, non-local processes are also investigated by calculating correlations between the zonal wind stress at the western equatorial Atlantic (WEA) and the depth of the thermocline (represented here by the 20 °C isotherm, D20) in the study area on the one hand, and the correlation of the thermocline depth with the SST on the other hand. The wind at the western Atlantic basin is taken from a region called WEA, between 2° S–2° N and 40° W–20° W, as in a recent study [17]. As explained above, upwelling mechanisms east of Cape Palmas (Côte d’Ivoire) are different from those east of Cape Three Points (Ghana), so in this paper we studied these two regions differently (Figure 1), which are defined as in previous studies [29,63]: Sassandra Upwelling in Côte d’Ivoire (SUC, 4° N–6° N, 4° W–7° W) and Takoradi Upwelling in Ghana (TUG, 4° N–6° N, 2° W–1° E).

3. Results

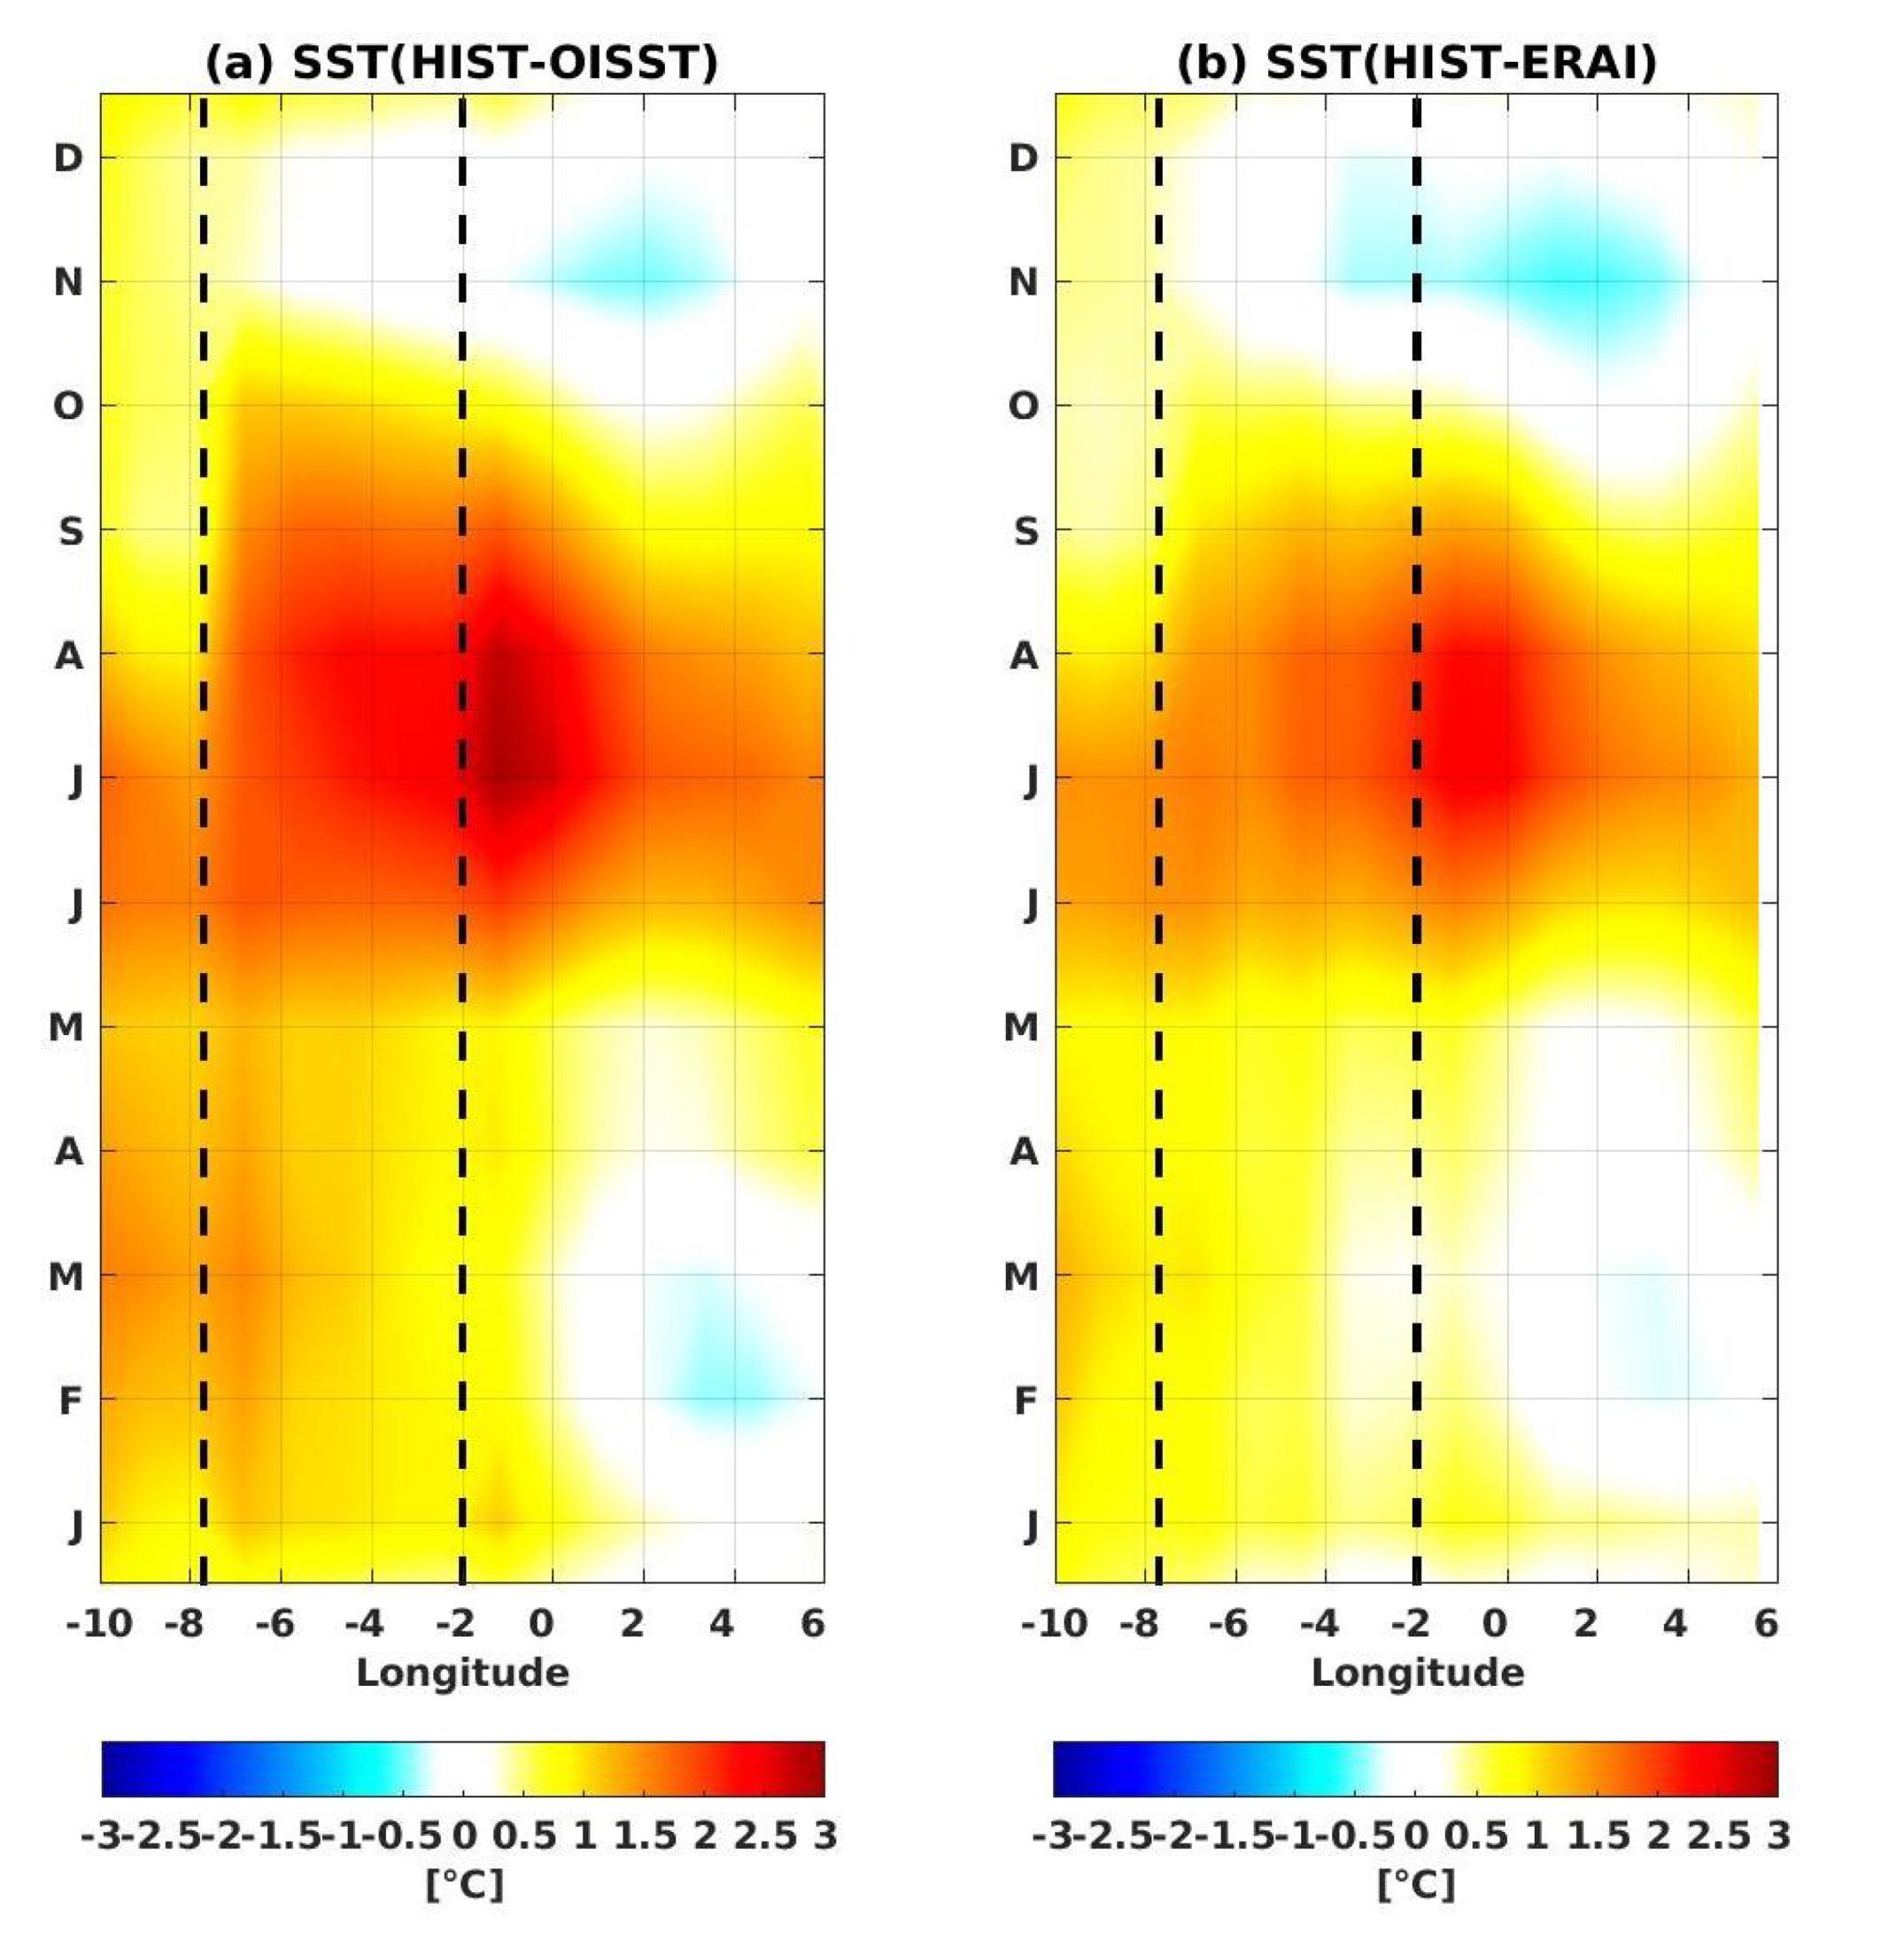
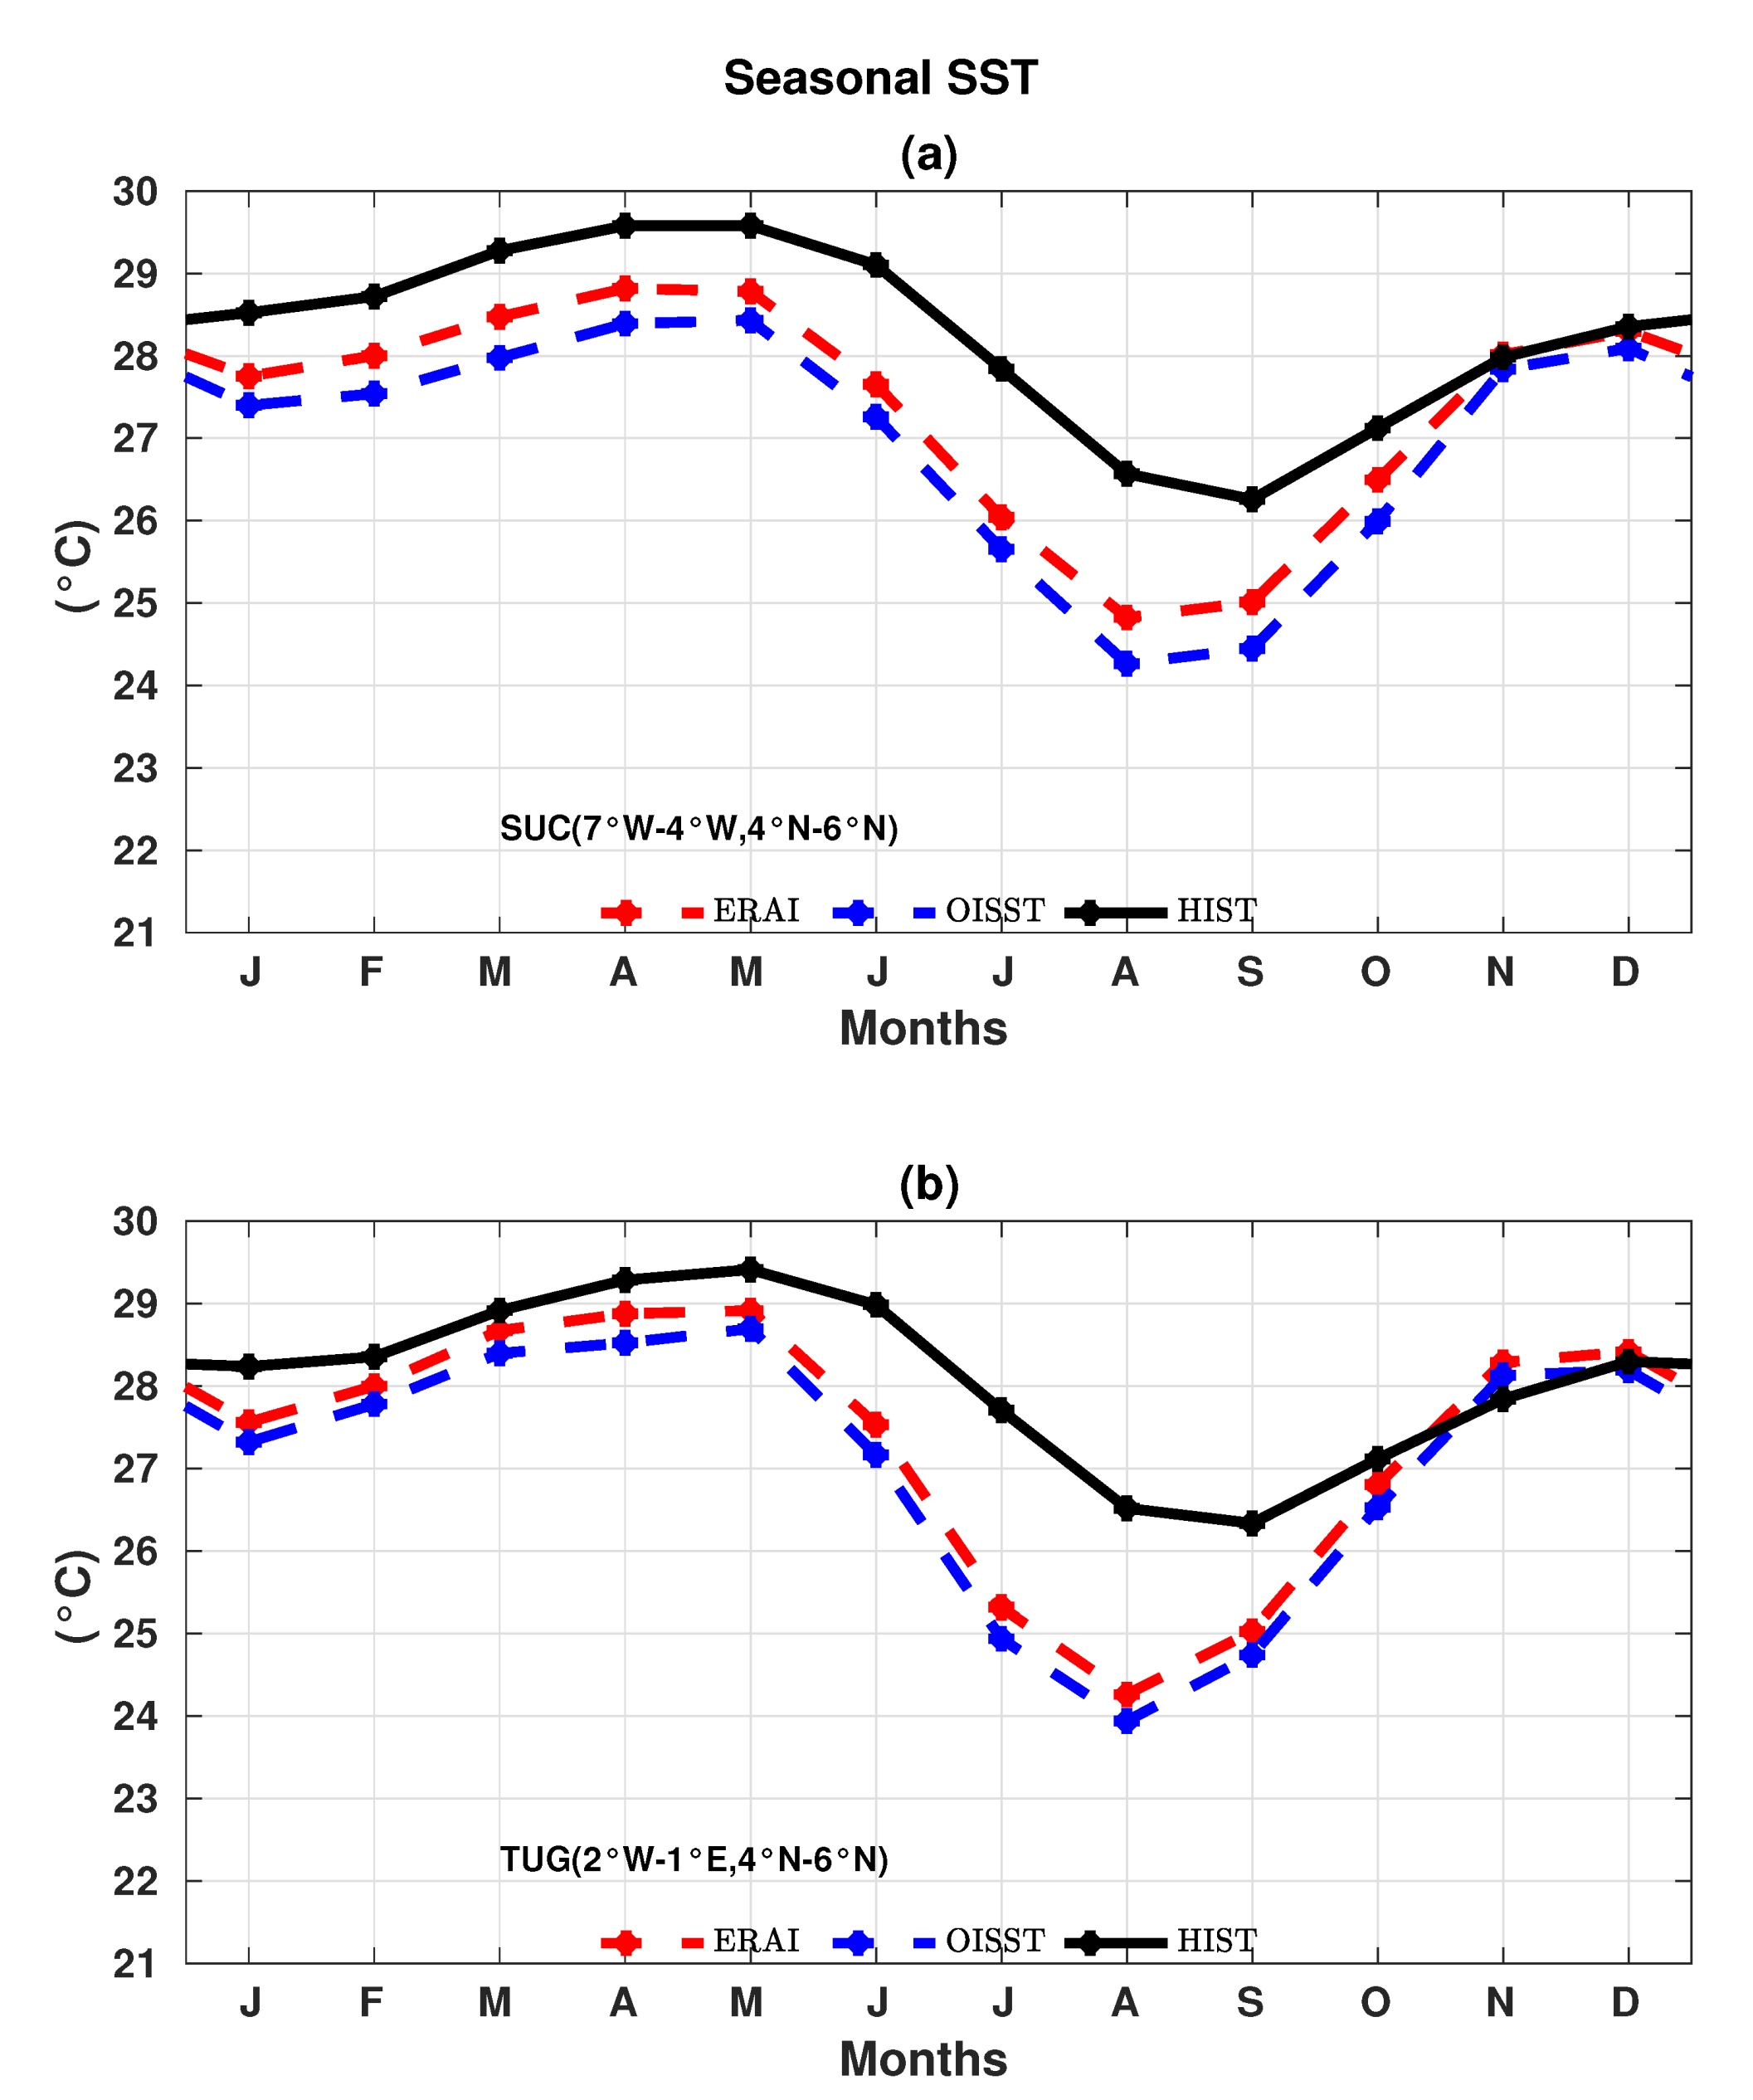
3.1. Evaluation of Model’s Ability to Simulate SST in NGG

OISST data show the lowest SST values near the NGG coast between Côte-d’Ivoire and Bénin during the boreal summer (upwelling season), while SST remains higher in the rest of the basin (Figure 1). The simulated SST exhibits a similar structure to OISST during the upwelling season; however, the SST values of the model are warmer than those of OISST. The hovmöller diagrams of SST averaged between 4° N and 6° N for the model, and observations (OISST and ERAI) display the major upwelling season, which starts in July and reaches its maximum in August–September and then begins to weaken until November (Figure 2). The minor upwelling season is from January to February in observations (OISST and ERAI) but is hardly detectable in the model (Figure 2). Note also that the observation and model highlight the discontinuity at the level of the capes with a more intense upwelling at their east side, which is consistent with the theory of Marchal and Picaut [64]. Compared to the observation, the model presents a warm bias of SST throughout most of the year with large bias values in SST (+3 °C; Figure 3) in boreal summer as shown earlier. This warm SST bias at the NGG is similar to the one usually found in models at the equatorial Atlantic cold tongue and Benguela regions [65]. A cold bias of −0.5 °C relative to observations (OISST and ERAI) is also located between 4° W and 4° E from October to December. These biases obtained at the NGG region are similar to those found in the SST reproduced by the HIST model at the equatorial Atlantic cold tongue [17]. It is probably the ocean dynamics and/or the parameterizations used in the model that are responsible for these SST biases. For example, Richter et al. [66] suggest that model equatorial easterlies that are weaker than those usually observed contribute remotely, via equatorial and coastal Kelvin waves, to the large warm SST biases along the southwest coast of Africa.
To continue this study, we focus on the two regions, SUC and TUG, defined above. The model SST seasonal cycle is similar to those in the observations (OISST and ERAI), but still with a larger warm bias in the model during the boreal summer upwelling (Figure 4). Apart from validating the SST, HIST model subsurface temperatures are also compared with ISAS observations (Figure 5). The HIST model reproduces well the vertical temperature structure in the SUC and TUG regions with an increase in the thermocline during the major upwelling period. As shown above, some differences also exist between model and observation (ISAS) temperatures. It can be also noted that the thermocline (D20) in the model does not rise sufficiently towards the surface during the main upwelling season as shown by the observations. During this period, compared to the thermocline position in the observation (ISAS), the model thermocline is about 20 m lower in the SUC region and about 12 m lower in the TUG region. Thus, the bias of the model could be partly explained by the weak upward movement of the thermocline.

3.2. Changes in SST of SUC Region and Associated Causes

In the SUC region (Côte d’Ivoire), the seasonal cycle of SST in the BSL increases from October to April, with a maximum of 30 °C obtained in April, and then SST decreases the rest of the year (May to September), with a minimum value of 26.8 °C reached in September (Figure 6a). Under climate change (RCP8.5) and SAG (GLENS), SST seasonal cycles display the same features as the BSL, but with differences in terms of amplitude. Compared to the BSL, under RCP8.5, SST increases throughout the year (an average of +1.52 °C in the region), with maximum warming of 1.7 °C recorded in February, whereas under GLENS, SST cools year round (average of −0.25 °C in the region) with a maximum cooling of −0.4 °C recorded in December (Figure 6b).
To understand the mechanisms behind SST changes, we start our investigations with air–sea heat flux changes. NHF in BSL dominated by solar shortwave radiation and latent heat flux is positive throughout the year, except for July, when it is negative (Figure 6c). The negative NHF in July is essentially due to the latent heat flux (Figure 6c). Under RCP8.5 (compared to BSL), NHF increases from November to January, and in May and July (Figure 6d) and this contributes to explaining the SST increase. The augmentation of NHF during these months results mainly from a decrease in net longwave radiation, which may be due to greenhouse gases in the atmosphere that block and reflect this radiation to the ocean [67,68]. From August to October, February to April, and in June, NHF decreases and does not explain the SST warming noted. Under GLENS, apart from July when the change in NHF is positive and the first 3 months of the year when it is almost zero, NHF for decreases for the rest of the year (from April to June and August to December), and this helps to explain the cooling noted (Figure 6e). The diminution of NHF is driven by the decrease in solar shortwave radiation which is explained by the use of SAG that prevents part of the solar radiation from reaching the Earth’s surface.
Although NHF changes contribute largely to understanding the warming under RCP8.5 and the cooling under GLENS, changes in this term do not explain SST changes throughout the year. This suggests that oceanic processes also participate in SST changes. Oceanic processes can be split into horizontal and vertical processes. For horizontal processes, changes in the horizontal gradient of temperature and surface current are analyzed. The results obtained indicate small changes in the horizontal gradient and surface current and therefore their contributions to SST changes are negligible under RCP8.5 and GLENS. For the vertical processes, we have mainly examined vertical mixing and vertical advection processes. As mentioned above, vertical mixing is driven by stratification and vertical shear, so changes in these two terms are investigated to understand the impact of vertical mixing on the SST changes. Under RCP8.5 (compared to BSL), stratification increases from November to March and June – July, whereas vertical shear changes are very low throughout the year (Figure 7a,c). This strong stratification limits the mixing between the thermocline cold waters and the warm waters at the surface and therefore leads to SST warming in the SUC region. Under GLENS, changes in vertical shear and stratification are minor and do not contribute to SST cooling (Figure 7b,d). Regarding the vertical advection, under RCP8.5, there is a decrease in both vertical velocity and vertical temperature gradient during April and from August to October (Figure 8a,c), which then contributes to surface water warming. Under GLENS, vertical velocity increases during the first three months of the year (January to March) and in June (Figure 8b), which contributes to bringing more cold water from below the thermocline to the surface. From February to July, there is also an increase in the vertical temperature gradient (Figure 8d), which leads to a further increase in the cooling by vertical advection. It is therefore the changes in vertical advection that explain the SST cooling during the months when the atmospheric fluxes do not explain it. In summary, strong NHF and stratification are the main drivers of SST warming under climate change (RCP8.5), while under SAG use, weakening NHF and vertical advection augmentation are mainly responsible for SST cooling.
To reinforce the above results with a quantitative study, the heat budget terms are evaluated in the SUC region. Figure 9a shows that the SST tendency in BSL is positive from September to April, corresponding to the period when the SST increases and from May to August there is a negative tendency of SST, corresponding to SST decrease. Net heat flux (NHF) contribution is positive all year long except in June and July, while oceanic processes (OCP) contribution is negative throughout the seasonal cycle. Therefore, SST increase is essentially due to an increase in NHF, whereas SST decrease will be related to a decrease in OCP and NHF. As mentioned above, NHF is found to depend largely on solar shortwave radiation and latent heat flux. OCP is dominated by the residual (R) term as the contribution of the total advection and entrainment terms are negligible (Figure 9b). As lateral diffusion is negligible in the SUC region [29,32], this R term is mainly due to vertical mixing. Under RCP8.5 (relative to BSL), changes in NHF are similar to those found above (Figure 6d), and thereby positive NHF contributes to SST warming (Figure 9c). OCP changes are mainly correlated with R (correlation of 0.92 significantly at 95% level), which is dominated by vertical mixing (Figure 9d). Then, positive changes in R contribute to explaining SST warming, and this is consistent with the result obtained. Under GLENS, NHF and OCP changes are relatively smaller than under RCP8.5. As explained above, changes in NHF and ZAD mostly contribute to SST cooling in this region (Figure 9e,f). ZAD contributions in SST cooling are most important in March and are explained by a strong vertical temperature gradient and an increase in vertical velocity. All these results are in agreement with the precedent results. To conclude on the processes that are responsible for SST changes, the role of non-local processes (remote forcing) in SST changes is investigated. Results reveal that there are no strong links between changes in the western equatorial Atlantic wind, SST, and D20 in the SUC region, under either RCP8.5 or SAG.
To complete this study, the mean efficacy ( S S T G L E N S S S T R C P 8.5 S S T R C P 8.5 S S T B S L ) of SAG to offset the effects of global warming is derived for SST in the SUC region following previous studies [16,17,69]. If the efficacy ratio is greater than −1 then climate change was under-compensated by geoengineering relative to baseline, while if the ratio is less than −1, geoengineering-induced changes over-compensated for climate change conditions. In this study, we find an efficacy ratio of −1.16 for SST, suggesting that SAG will be slightly over-compensated for SST in the SUC region.

3.3. Changes in SST of TUG Region and Associated Causes

In the Ghana region (TUG), the SST seasonal cycles of BSL, RCP8.5, and GLENS are similar to those of the SUC region with always higher SST under RCP8.5 (relative to BSL) and lower temperature under GLENS (Figure 10a). Under RCP8.5 (relative to BSL), there is an SST increase throughout the seasonal cycle, like in the SUC region, but warming is slightly stronger in the TUG region than SUC (SST average of 1.52 °C in SUC while it is 1.59 °C in TUG, Figure 10b). Under GLENS, the SST cooling is similar to the SUC region. The maximum cooling is obtained in December for the two regions (SUC and TUG).
To explain the possible causes responsible for SST changes in the TUG region, we apply the methodology used in the SUC region. The seasonal cycles of heat fluxes in BSL are close to those of the SUC region with NHF being positive all year long and reaching zero between June and July (Figure 10c). Under RCP8.5 (relative to BSL), NHF increases (due to net longwave radiation diminution as in the SUC region), which explains the SST warming throughout the year, except in March and April where the NHF decrease does not explain the SST warming (Figure 10d). Note that the NHF increase is slightly greater in the TUG region compared to SUC, which contributes to a large SST increase. Under GLENS, except in July, there is a diminution in NHF (caused by a reduction in solar shortwave radiation), which participates in SST cooling (Figure 10e). Although NHF changes play a major role in SST changes, they do not explain SST changes in March, April, and July, suggesting that oceanic processes also play a role in SST changes. In the TUG region, oceanic processes are dominated by vertical mixing and vertical advection because horizontal advection, lateral diffusion, and entrainment terms are negligible (not shown). Under RCP8.5, vertical mixing changes due to important stratification with a weak vertical shear contribute to SST warming in TUG, as in the SUC region (Figure 11a,c). However, under GLENS, the vertical shear is very weak with a small stratification, and does not explain SST cooling (Figure 11b,d). Regarding the vertical advection, under RCP8.5 (relative to BSL), there is a slight decrease in vertical velocity below the mixed layer in April and from July to September (Figure 12a), and a diminution in vertical temperature gradient in the same period (Figure 12c) contributing slightly to SST warming. Under GLENS, vertical velocity changes are small and vertical temperature gradients decrease below the mixed layer almost over the whole seasonal cycle, and thereby cannot explain SST cooling (Figure 12b,d).
Figure 13a shows the SST tendency at the TUG region in BSL which is decomposed by the contribution of NHF and OCP. NHF in BSL is positive through the seasonal cycle except in June–July, and thus contributes to SST increase. OCP contribution is negative all year and therefore leads to SST decrease. The decomposition of OCP in Figure 13b shows that it is dominated by the residual term, which is essentially related to vertical mixing. Under RCP8.5 (relative to BSL), NHF increases from December to February and in May, contributing to SST warming. This increase in NHF is caused by a decrease in net longwave radiation as shown above (Figure 10d). In March, April, and from August to December it is the oceanic processes dominated by vertical mixing that are responsible for SST warming. Note also that from July to September, vertical advection changes contribute slightly to SST warming. Under GLENS, NHF changes contribute to SST cooling as in the SUC region (Figure 13e) but OCP contribution to SST cooling is weak. As in the SUC region, non-local processes are also examined in the TUG region. Results obtained show that (Figure 14b,d) there is a strong correlation of 0.72 (significant at 95% level) between changes in the thermocline depth and zonal wind stress at the western equatorial Atlantic (WEA) on the one hand, and a correlation of 0.61 (significant at 95%) between changes in the thermocline depth and SST in the TUG on the other hand. Thus, SST changes (cooling) in the TUG region are also influenced by changes in the wind stress at WEA. So, the contribution of remote forcing to SST changes is weak under RPC8.5 (as the correlations are weak Figure 14a,c) for the SUC and TUG regions but plays an important role only in the TUG region under GLENS. To finish with the TUG region, the mean efficacy of SAG to offset the effects of global warming is estimated for SST. Like in the SUG region, the mean efficacy ratio (−1.16) suggests that SAG will be also slightly over-compensated for SST.

4. Conclusions and Discussion

In this paper, we examined the impact of Stratospheric Aerosol Geoengineering (or SAG) on SST seasonal variability in the northern Gulf of Guinea using GLENS simulations performed under the RCP8.5 scenario. The climate model used in the GLENS project has several components, including the atmospheric component (WACCM) and the oceanic component (POP2) used in this study. The GLENS project consists of the injection of aerosol into the stratosphere to reduce incoming solar radiation in order to reduce the effect of global warming. This study focuses on two dynamically different regions in the northern Gulf of Guinea: Sassandra Upwelling in the Côte d’Ivoire region (SUC) and Takoradi Upwelling in Ghana (TUG). SST changes under climate changes and under SAG (2050–2069) in relation to the current climate (2010–2029) were investigated, and mechanisms behind SST changes awere examined. Seasonal temperature variability in the NGG is well reproduced by the model, although biases exist between the model and observations. Similar biases are also present in the Atlantic equatorial cold tongue [17] and may result from parameterization errors in the model.
In SUC region, under RCP8.5 (compared to baseline), the results show that SST increases throughout the seasonal cycle (average 1.52 °C), and this warming is related to NHF increase and the weakening of the vertical mixing. NHF increase is due to a decrease in net longwave radiation and the weak vertical mixing is caused by the enhancement of stratification in the presence of a weak vertical shear. Under GLENS, SST decreases the whole year (average −0.25 °C), and its results from NHF decrease due to the diminution of incoming solar shortwave radiation as a consequence of SAG use and an increase in vertical advection below the mixed layer. In the TUG region, under RCP8.5, SST also increases all year long (average 1.59 °C), and the mechanisms behind this warming are similar to the SUC region. Under GLENS, there is also an SST decrease throughout the year (of −0.26 °C on average), and this SST cooling is due to a decrease in solar shortwave radiation and changes in zonal wind stress at the western equatorial Atlantic (remote forcing). Contrary to the SUC region, where the effect of remote forcing (non-local processes) is negligible, this term plays an important role in the SST changes in the TUG region under GLENS.
The findings of this study reveal that the mechanisms responsible for SST cooling in the SUC and TUG regions are different, which is consistent with the studies of Djakouré et al. [33] and Da-Allada et al. [29] who found different mechanisms that explain cooling events in these two regions. Additionally, the results obtained indicate an important role of atmospheric fluxes in SST changes, contrary to previous studies which suggest an important role of oceanic processes [29,32,33]. Using the GLENS simulation, a cooling of the SST is noted in the NGG under the use of SAG. Note that the SST cooling under SAG has also been highlighted by Pomalegni et al. [17] in the equatorial Atlantic cold tongue. As in the TUG region, the study of Pomalegni et al. [17] also reveals the important role of remote forcing in SST cooling. Finally, the results also show that SAG slightly overcompensates for the effects of climate change on SST in the NGG.

Author Contributions

All authors contributed to the work. Conceptualization, F.F.B.K.A., C.Y.D.A. and E.B.; methodology, F.F.B.K.A., C.Y.D.A. and E.B.; software, F.F.B.K.A.; formal analysis, F.F.B.K.A., C.Y.D.A. and E.B.; data curation, F.F.B.K.A., C.Y.D.A. and S.T.; writing—original draft preparation, F.F.B.K.A.; writing—review and editing, F.F.B.K.A., C.Y.D.A., E.B., S.T. and P.J.I.; supervision, C.Y.D.A. and E.B.; project administration, E.B. All authors have read and agreed to the published version of the manuscript.

Funding

This work was supported by the Degrees Modelling Fund (formerly DECIMALS), a partnership between the Degrees Initiative and The World Academy of Sciences (TWAS).

Institutional Review Board Statement

Not applicable.

Informed Consent Statement

Not applicable.

Data Availability Statement

The data used in this study are available to the community via the Earth System Grid (see information at https://www.cesm.ucar.edu/community-projects/glens (accessed on 1 January 2020)).

Acknowledgments

This study is part of the Ph.D. thesis of F.F.B.K.A. AYISSI, funded by DAAD in the framework of the “In-Country/In-Region Scholarship Programme” Sub-Saharan Africa. This work is also part of the Jeune Equipe Associée à l’IRD named Variabilité de la Salinité et Flux d’eau douce à Multi-échelles which is supported by the Institut de Recherche pour le Développement (IRD). The authors thank the National Center for Atmospheric Research (NCAR) for the provided GLENS data.

Conflicts of Interest

The authors declare no conflict of interest.

Abbreviations

The following abbreviations are used in this manuscript:
ADHHorizontal advection
ENTEntrainment at the base of the mixed layer
ERAIERA-Interim
GLENSGeoengineering Large Ensemble
HISTHistorical simulation
IFREMERInstitut français de recherche pour l’exploitation de la mer
ISASIn Situ Analysis System
LHLatent heat flux
LWNet longwave radiation
MLDMixed-layer depth
NGGNorthern Gulf of Guinea
NHFNet Heat Flux
OCPOceanic processes
OISSTOptimum Interpolation Sea Surface Temperature
POP2Parallel Ocean Program version 2
RResidual term
RCP8.5Representative Concentration Pathway 8.5
SAGStratospheric Aerosol Geoengineering
SHSensible heat flux
SRMSolar Radiation Management
SSTSea Surface Temperature
SUCSassandra Upwelling in Côte d’Ivoire
SWSolar shortwave radiation
TOTTotal temperature tendency
TUGTakoradi Upwelling in Ghana
WACCMWhole Atmosphere Community Climate Model
ZADHorizontal advection

References

  1. Peters, G.P.; Andrew, R.M.; Boden, T.; Canadell, J.G.; Ciais, P.; Le Quéré, C.; Marland, G.; Raupach, M.R.; Wilson, C. The Challenge to Keep Global Warming below 2 °C. Nat. Clim. Chang. 2013, 3, 4–6. [Google Scholar] [CrossRef]
  2. Rogelj, J.; den Elzen, M.; Höhne, N.; Fransen, T.; Fekete, H.; Winkler, H.; Schaeffer, R.; Sha, F.; Riahi, K.; Meinshausen, M. Paris Agreement Climate Proposals Need a Boost to Keep Warming Well below 2 °C. Nature 2016, 534, 631–639. [Google Scholar] [CrossRef] [PubMed] [Green Version]
  3. den Elzen, M.; Dafnomilis, I.; Forsell, N.; Fragkos, P.; Fragkiadakis, K.; Höhne, N.; Kuramochi, T.; Nascimento, L.; Roelfsema, M.; van Soest, H.; et al. Updated Nationally Determined Contributions Collectively Raise Ambition Levels but Need Strengthening Further to Keep Paris Goals within Reach. Mitig. Adapt. Strateg. Glob. Chang. 2022, 27, 33. [Google Scholar] [CrossRef] [PubMed]
  4. Mitchell, S.A. The Status of Wetlands, Threats and the Predicted Effect of Global Climate Change: The Situation in Sub-Saharan Africa. Aquat. Sci. 2013, 75, 95–112. [Google Scholar] [CrossRef]
  5. Niang, I.; Ruppel, O.C.; Abdrabo, M.A.; Essel, C.; Lennard, C.; Padgham, J.; Urquhart, P.; Descheemaeker, K.K.E. Chapter 22: Africa. In Climate Change 2014: Impacts, Adaptation, and Vulnerability. Part B: Regional Aspects. Contribution of Working Group II to the Fifth Assessment; Cambridge University Press: Cambridge, UK, 2014; pp. 1199–1265. [Google Scholar] [CrossRef]
  6. Crutzen, P.J. Albedo Enhancement by Stratospheric Sulfur Injections: A Contribution to Resolve a Policy Dilemma? Clim. Chang. 2006, 77, 211. [Google Scholar] [CrossRef] [Green Version]
  7. Ming, T.; de_Richter, R.; Liu, W.; Caillol, S. Fighting Global Warming by Climate Engineering: Is the Earth Radiation Management and the Solar Radiation Management Any Option for Fighting Climate Change? Renew. Sustain. Energy Rev. 2014, 31, 792–834. [Google Scholar] [CrossRef]
  8. Council, N.R. Climate Intervention: Reflecting Sunlight to Cool Earth; The National Academies Press: Washington, DC, USA, 2015; pp. 1199–1266. [Google Scholar] [CrossRef]
  9. Robock, A.; Oman, L.; Stenchikov, G.L. Regional Climate Responses to Geoengineering with Tropical and Arctic SO2 Injections. J. Geophys. Res. Atmos. 2008, 113. [Google Scholar] [CrossRef] [Green Version]
  10. MacMartin, D.G.; Kravitz, B.; Tilmes, S.; Richter, J.H.; Mills, M.J.; Lamarque, J.F.; Tribbia, J.J.; Vitt, F. The Climate Response to Stratospheric Aerosol Geoengineering Can Be Tailored Using Multiple Injection Locations. J. Geophys. Res. Atmos. 2017, 122, 12574–12590. [Google Scholar] [CrossRef]
  11. Smith, C.J.; Crook, J.A.; Crook, R.; Jackson, L.S.; Osprey, S.M.; Forster, P.M. Impacts of Stratospheric Sulfate Geoengineering on Global Solar Photovoltaic and Concentrating Solar Power Resource. J. Appl. Meteorol. Climatol. 2017, 56, 1483–1497. [Google Scholar] [CrossRef]
  12. Tilmes, S.; Richter, J.H.; Kravitz, B.; MacMartin, D.G.; Mills, M.J.; Simpson, I.R.; Glanville, A.S.; Fasullo, J.T.; Phillips, A.S.; Lamarque, J.F.; et al. CESM1(WACCM) Stratospheric Aerosol Geoengineering Large Ensemble Project. Bull. Am. Meteorol. Soc. 2018, 99, 2361–2371. [Google Scholar] [CrossRef]
  13. Bala, G.; Duffy, P.B.; Taylor, K.E. Impact of Geoengineering Schemes on the Global Hydrological Cycle. Proc. Natl. Acad. Sci. USA 2008, 105, 7664–7669. [Google Scholar] [CrossRef] [PubMed] [Green Version]
  14. Tilmes, S.; Fasullo, J.; Lamarque, J.F.; Marsh, D.R.; Mills, M.; Alterskjær, K.; Muri, H.; Kristjánsson, J.E.; Boucher, O.; Schulz, M.; et al. The Hydrological Impact of Geoengineering in the Geoengineering Model Intercomparison Project (GeoMIP). J. Geophys. Res. Atmos. 2013, 118, 11036–11058. [Google Scholar] [CrossRef] [Green Version]
  15. Irvine, P.; Emanuel, K.; He, J.; Horowitz, L.W.; Vecchi, G.; Keith, D. Halving Warming with Idealized Solar Geoengineering Moderates Key Climate Hazards. Nat. Clim. Chang. 2019, 9, 295–299. [Google Scholar] [CrossRef]
  16. Da-Allada, C.Y.; Baloïtcha, E.; Alamou, E.A.; Awo, F.M.; Bonou, F.; Pomalegni, Y.; Biao, E.I.; Obada, E.; Zandagba, J.E.; Tilmes, S.; et al. Changes in West African Summer Monsoon Precipitation Under Stratospheric Aerosol Geoengineering. Earth’s Future 2020, 8, e2020EF001595. [Google Scholar] [CrossRef]
  17. Pomalegni, Y.W.; Da-Allada, C.Y.; Sohou, Z.; Baloïtcha, E.; Alamou, E.A.; Awo, F.M.; Bonou, F.; Biao, I.; Obada, E.; Zandagba, J.E.; et al. Response of the Equatorial Atlantic Cold Tongue to Stratospheric Aerosol Geoengineering. Aerosol Sci. Eng. 2022, 6, 99–110. [Google Scholar] [CrossRef]
  18. Wiafe, G.; Nyadjro, E.S. Satellite Observations of Upwelling in the Gulf of Guinea. IEEE Geosci. Remote Sens. Lett. 2015, 12, 1066–1070. [Google Scholar] [CrossRef]
  19. Cury, P.; Roy, C. 18 Environmental Forcing and Fisheries Resources in Côte d’Ivoire and Ghana: Did Something Happen. In Large Marine Ecosystems; McGlade, J.M., Cury, P., Koranteng, K.A., Hardman-Mountford, N.J., Eds.; Elsevier: Amsterdam, The Netherlands, 2002; Volume 11, pp. 241–260. [Google Scholar] [CrossRef]
  20. Gu, G.; Adler, R.F. Seasonal Evolution and Variability Associated with the West African Monsoon System. J. Clim. 2004, 17, 3364–3377. [Google Scholar] [CrossRef]
  21. Ali, K.E.; Kouadio, K.Y.; Zahiri, E.P.; Aman, A.; Assamoi, A.P.; Bourles, B. Influence of the Gulf of Guinea Coastal and Equatorial Upwellings on the Precipitations along Its Northern Coasts during the Boreal Summer Period. Asian J. Appl. Sci. 2011, 4, 271–285. [Google Scholar] [CrossRef]
  22. Morlière, A. Les Saisons Marines Devant Abidjan. 1970. Available online: https://horizon.documentation.ird.fr/exl-doc/pleins_textes/divers11-11/20642.pdf (accessed on 18 February 2023).
  23. Lemasson, L.; Rebert, J.P. Les Courants Marins dans le Golfe Ivoirien. 1973. Available online: https://horizon.documentation.ird.fr/exl-doc/pleins_textes/cahiers/oceanographie/19646.pdf (accessed on 18 February 2023).
  24. Hardman-Mountford, N.J.; McGlade, J.M. Seasonal and Interannual Variability of Oceanographic Processes in the Gulf of Guinea: An Investigation Using AVHRR Sea Surface Temperature Data. Int. J. Remote Sens. 2003, 24, 3247–3268. [Google Scholar] [CrossRef]
  25. Bah, A. Upwelling in the Gulf of Guinea Results of A Mathematical Model. In Elsevier Oceanography Series; Nihoul, J.C.J., Ed.; Elsevier: Amsterdam, The Netherlands, 1981; Volume 32, pp. 99–140. [Google Scholar] [CrossRef]
  26. Koranteng, K.A.; Mcglade, J.M. Climatic Trends in Continental Shelf Waters off Ghana and in the Gulf of Guinea, 1963–1992. Oceanol. Acta 2001, 24, 187–198. [Google Scholar] [CrossRef] [Green Version]
  27. Alory, G.; Da-Allada, C.Y.; Djakouré, S.; Dadou, I.; Jouanno, J.; Loemba, D.P. Coastal Upwelling Limitation by Onshore Geostrophic Flow in the Gulf of Guinea Around the Niger River Plume. Front. Mar. Sci. 2021, 7, 1116. [Google Scholar] [CrossRef]
  28. Sohou, Z.; Koné, V.; Da-Allada, Y.C.; Djakouré, S.; Bourlès, B.; Racape, V.; Degbe, G.; Adje, C. Seasonal and Inter-Annual ONSET Sea Surface Temperature Variability along the Northern Coast of the Gulf of Guinea. Reg. Stud. Mar. Sci. 2020, 35, 101129. [Google Scholar] [CrossRef]
  29. Da-Allada, C.Y.; Agada, J.; Baloïtcha, E.; Hounkonnou, M.N.; Jouanno, J.; Alory, G. Causes of the Northern Gulf of Guinea Cold Event in 2012. J. Geophys. Res. Oceans 2021, 126, e2021JC017627. [Google Scholar] [CrossRef]
  30. Pople, W.; Mensah, M.A. Evaporation as the Upwelling Mechanism in Ghanaian Coastal Waters. Nat. Phys. Sci. 1971, 234, 18–20. [Google Scholar] [CrossRef]
  31. Wade, M.; Caniaux, G.; du Penhoat, Y. Variability of the Mixed Layer Heat Budget in the Eastern Equatorial Atlantic during 2005–2007 as Inferred Using Argo Floats. J. Geophys. Res. Oceans 2011, 116, 1–17. [Google Scholar] [CrossRef] [Green Version]
  32. Jouanno, J.; Marin, F.; du Penhoat, Y.; Sheinbaum, J.; Molines, J.M. Seasonal Heat Balance in the Upper 100 m of the Equatorial Atlantic Ocean. J. Geophys. Res. Oceans 2011, 116. [Google Scholar] [CrossRef] [Green Version]
  33. Djakouré, S.; Penven, P.; Bourlès, B.; Koné, V.; Veitch, J. Respective Roles of the Guinea Current and Local Winds on the Coastal Upwelling in the Northern Gulf of Guinea. J. Phys. Oceanogr. 2017, 47, 1367–1387. [Google Scholar] [CrossRef]
  34. Jouanno, J.; Hernandez, O.; Sanchez-Gomez, E. Equatorial Atlantic Interannual Variability and Its Relation to Dynamic and Thermodynamic Processes. Earth Syst. Dyn. 2017, 8, 1061–1069. [Google Scholar] [CrossRef] [Green Version]
  35. Djakouré, S.; Penven, P.; Bourlès, B.; Veitch, J.; Koné, V. Coastally Trapped Eddies in the North of the Gulf of Guinea. J. Geophys. Res. Oceans 2014, 119, 6805–6819. [Google Scholar] [CrossRef]
  36. Ekman, V.W. On the Influence of the Earth’s Rotation on Ocean-Currents. Arch. Math. Astron. Phys. 1905, 2, 1–53. [Google Scholar]
  37. Longhurst, A.R. A Review of the Oceanography of the Gulf of Guinea; Technical report; ORSTOM, Pointe-Noire; ORSTOM: Paris, France, 1962. [Google Scholar]
  38. Bakun, A. Guinea Current Upwelling. Nature 1978, 271, 147–150. [Google Scholar] [CrossRef]
  39. Colin, C. Coastal Upwelling Events in Front of the Ivory Coast during the FOCAL Program. Oceanol. Acta Spec. Issue 1988, 14, 223–240. [Google Scholar]
  40. Colin, C. Sur les upwellings équatorial et côtier (5° N) dans le Golfe de Guinée. Oceanol. Acta 1991, 14, 223–240. [Google Scholar]
  41. Verstraete, J.M. The Seasonal Upwellings in the Gulf of Guinea. Prog. Oceanogr. 1992, 29, 1–60. [Google Scholar] [CrossRef]
  42. Colin, C.; Gallardo, Y.; Chuchla, R.; Cissoko, S. Environnements climatique et océanographique sur le plateau continental de Côte d’Ivoire. In Environnement et Ressources Aquatiques de Côte d’Ivoire: 1. Le Milieu Marin; ORSTOM: Paris, France, 1993; pp. 75–110. [Google Scholar]
  43. Moore, D.; Hisard, P.; McCreary, J.; Merle, J.; O’Brien, J.; Picaut, J.; Verstraete, J.M.; Wunsch, C. Equatorial Adjustment in the Eastern Atlantic. Geophys. Res. Lett. 1978, 5, 637–640. [Google Scholar] [CrossRef]
  44. Clarke, A.J. On the Generation of the Seasonal Coastal Upwelling in the Gulf of Guinea. J. Geophys. Res. Oceans 1979, 84, 3743–3751. [Google Scholar] [CrossRef]
  45. Servain, J.; Picaut, J.; Merle, J. Evidence of Remote Forcing in the Equatorial Atlantic Ocean. J. Phys. Oceanogr. 1982, 12, 457–463. [Google Scholar] [CrossRef]
  46. Picaut, J. Propagation of the Seasonal Upwelling in the Eastern Equatorial Atlantic. J. Phys. Oceanogr. 1983, 13, 18–37. [Google Scholar] [CrossRef]
  47. Lamb, P.J. Large-Scale Tropical Atlantic Surface Circulation Patterns Associated with Subsaharan Weather Anomalies. Tellus 1978, 30, 240–251. [Google Scholar] [CrossRef] [Green Version]
  48. Eltahir, E.A.B.; Gong, C. Dynamics of Wet and Dry Years in West Africa. J. Clim. 1996, 9, 1030–1042. [Google Scholar] [CrossRef]
  49. Marsh, D.R.; Janches, D.; Feng, W.; Plane, J.M.C. A Global Model of Meteoric Sodium. J. Geophys. Res. Atmos. 2013, 118, 11442–11452. [Google Scholar] [CrossRef] [Green Version]
  50. Mills, M.J.; Richter, J.H.; Tilmes, S.; Kravitz, B.; MacMartin, D.G.; Glanville, A.A.; Tribbia, J.J.; Lamarque, J.F.; Vitt, F.; Schmidt, A.; et al. Radiative and Chemical Response to Interactive Stratospheric Sulfate Aerosols in Fully Coupled CESM1(WACCM). J. Geophys. Res. Atmos. 2017, 122, 13061–13078. [Google Scholar] [CrossRef]
  51. Danabasoglu, G.; Bates, S.C.; Briegleb, B.P.; Jayne, S.R.; Jochum, M.; Large, W.G.; Peacock, S.; Yeager, S.G. The CCSM4 Ocean Component. J. Clim. 2012, 25, 1361–1389. [Google Scholar] [CrossRef] [Green Version]
  52. Hong, Y.; Moore, J.; Jevrejeva, S.; Ji, D.; Phipps, S.; Lenton, A.; Tilmes, S.; Watanabe, S.; Zhao, L. Impact of the GeoMIP G1 Sunshade Geoengineering Experiment on the Atlantic Meridional Overturning Circulation. Environ. Res. Lett. 2017, 12, 034009. [Google Scholar] [CrossRef] [Green Version]
  53. Kravitz, B.; MacMartin, D.G.; Mills, M.J.; Richter, J.H.; Tilmes, S.; Lamarque, J.F.; Tribbia, J.J.; Vitt, F. First Simulations of Designing Stratospheric Sulfate Aerosol Geoengineering to Meet Multiple Simultaneous Climate Objectives. J. Geophys. Res. Atmos. 2017, 122, 12616–12634. [Google Scholar] [CrossRef]
  54. Pinto, I.; Jack, C.; Lennard, C.; Tilmes, S.; Odoulami, R.C. Africa’s Climate Response to Solar Radiation Management with Stratospheric Aerosol. Geophys. Res. Lett. 2020, 47, e2019GL086047. [Google Scholar] [CrossRef] [Green Version]
  55. Huang, B.; Liu, C.; Banzon, V.; Freeman, E.; Graham, G.; Hankins, B.; Smith, T.; Zhang, H.M. Improvements of the Daily Optimum Interpolation Sea Surface Temperature (DOISST) Version 2.1. J. Clim. 2021, 34, 2923–2939. [Google Scholar] [CrossRef]
  56. Dee, D.P.; Uppala, S.M.; Simmons, A.J.; Berrisford, P.; Poli, P.; Kobayashi, S.; Andrae, U.; Balmaseda, M.A.; Balsamo, G.; Bauer, P.; et al. The ERA-Interim Reanalysis: Configuration and Performance of the Data Assimilation System. Q. J. R. Meteorol. Soc. 2011, 137, 553–597. [Google Scholar] [CrossRef]
  57. Da-Allada, C.Y.; Gaillard, F.; Kolodziejczyk, N. Mixed-Layer Salinity Budget in the Tropical Indian Ocean: Seasonal Cycle Based Only on Observations. Ocean Dyn. 2015, 65, 845–857. [Google Scholar] [CrossRef] [Green Version]
  58. Gaillard, F.; Reynaud, T.; Thierry, V.; Kolodziejczyk, N.; von Schuckmann, K. In Situ–Based Reanalysis of the Global Ocean Temperature and Salinity with ISAS: Variability of the Heat Content and Steric Height. J. Clim. 2016, 29, 1305–1323. [Google Scholar] [CrossRef]
  59. Mohan, S.; Mishra, S.K.; Sahany, S.; Behera, S. Long-Term Variability of Sea Surface Temperature in the Tropical Indian Ocean in Relation to Climate Change and Variability. Glob. Planet. Chang. 2021, 199, 103436. [Google Scholar] [CrossRef]
  60. Planton, Y.; Voldoire, A.; Giordani, H.; Caniaux, G. Main Processes of the Atlantic Cold Tongue Interannual Variability. Clim. Dyn. 2018, 50, 1495–1512. [Google Scholar] [CrossRef] [Green Version]
  61. Da-Allada, C.Y.; Jouanno, J.; Gaillard, F.; Kolodziejczyk, N.; Maes, C.; Reul, N.; Bourlès, B. Importance of the Equatorial Undercurrent on the Sea Surface Salinity in the Eastern Equatorial Atlantic in Boreal Spring. J. Geophys. Res. Oceans 2017, 122, 521–538. [Google Scholar] [CrossRef] [Green Version]
  62. Maes, C.; O’Kane, T.J. Seasonal Variations of the Upper Ocean Salinity Stratification in the Tropics. J. Geophys. Res. Oceans 2014, 119, 1706–1722. [Google Scholar] [CrossRef] [Green Version]
  63. Roy, C. The Cote d’Ivoire and Ghana Coastal Upwellings: Dynamics and Changes; ORSTOM Editions; ORSTOM: Paris, France, 1995; pp. 346–361. [Google Scholar]
  64. Marchal, E.; Picaut, J. Répartition et Abondonce Évaluées par Échointégration des Poissons du Plateau Continental Ivoiro-Ghanéen en Relation Avec les Upwellings Locaux. J. Rech. Océanograph. 1977, 2, 39–57. [Google Scholar]
  65. Foltz, G.R.; Brandt, P.; Richter, I.; Rodríguez-Fonseca, B.; Hernandez, F.; Dengler, M.; Rodrigues, R.R.; Schmidt, J.O.; Yu, L.; Lefevre, N.; et al. The Tropical Atlantic Observing System. Front. Mar. Sci. 2019, 6, 1–36. [Google Scholar] [CrossRef] [Green Version]
  66. Richter, I.; Xie, S.P.; Wittenberg, A.T.; Masumoto, Y. Tropical Atlantic Biases and Their Relation to Surface Wind Stress and Terrestrial Precipitation. Clim. Dyn. 2012, 38, 985–1001. [Google Scholar] [CrossRef] [Green Version]
  67. Smith, A.P. Proof of the Atmospheric Greenhouse Effect. arXiv 2008, arXiv:0802.4324. [Google Scholar]
  68. Pierrehumbert, R. Infrared Radiation and Planetary Temperature. Phys. Today 2011, 64, 33. [Google Scholar] [CrossRef] [Green Version]
  69. Cheng, W.; MacMartin, D.G.; Dagon, K.; Kravitz, B.; Tilmes, S.; Richter, J.H.; Mills, M.J.; Simpson, I.R. Soil Moisture and Other Hydrological Changes in a Stratospheric Aerosol Geoengineering Large Ensemble. J. Geophys. Res. Atmos. 2019, 124, 12773–12793. [Google Scholar] [CrossRef]
Figure 1. Spatial pattern of mean monthly July to September SST (°C) computed for 1990–2009 in the NGG from OISST observation (color shading) and HIST simulation (contours). Boxes shown indicate the two regions of focus of this study.
Climate 11 00087 g001
Figure 2. Hovmuller diagram of SST, averaged over latitude 4° N–6° N for the period 1990–2009, computed with (a) HIST simulation, (b) OISST, and (c) ERAI. The dashed black line at 7.7° W (2° W) represents the longitude of Cape Palmas (Cape Three Points).
Climate 11 00087 g002
Figure 3. Hovmuller diagram of SST difference, averaged over latitude 4°N–6°N for the period 1990–2009, between model simulation (HIST) and observations (OISST and ERAI): (a) HIST- OISST and (b) HIST-ERAI. The dashed black line at 7.7° W (2° W) represents the longitude of Cape Palmas (Cape Three Points).
Climate 11 00087 g003
Figure 4. Seasonal cycle of SST over the period 1990–2009, obtained from ERAI (dashed red line), OISST (dashed blue line) observations, and HIST simulation (black line) in the (a) SUC and (b) TUG regions.
Climate 11 00087 g004
Figure 5. Seasonal cycle of vertical temperature structure over period 2002–2009 in (a) the HIST simulation (b) the ISAS observation and (c) their difference at SUC region; and in (d) the HIST simulation (e) the ISAS observation and (f) their difference at TUG region.
Climate 11 00087 g005
Figure 6. Seasonal cycles in SUC region of (a) SST from RCP8.5 (dashed red line), GLENS (dashed blue line), BSL (black) in SUC region; (b) SST changes under RCP8.5 (red) and under GLENS (blue); the shaded areas represent the standard error of changes in SST. Seasonal cycles in SUC region (c) of atmospheric flux (longwave (blue), shortwave (magenta), sensible heat flux (green), latent heat flux (cyan), net heat flux (red)); (d) change in fluxes under RCP8.5; (e) and change in fluxes under GLENS.
Climate 11 00087 g006
Figure 7. Seasonal evolution of changes relative to the baseline of vertical profiles at SUC (shaded colors) in terms of stratification: (a) under RCP8.5, (b) under GLENS and in vertical shear, (c) under RCP8.5 and (d) under GLENS. Stratification in baseline is plotted on Figures (a,b) by contours and vertical shear on Figures (c,d); the mixed-layer depth (dashed black diamond line for RCP8.5; magenta line for BSL and dashed black triangle line for GLENS) and the thermocline represented by D20(black line for RCP8.5, dashed blue line for BSL, and red line for GLENS.
Climate 11 00087 g007
Figure 8. Seasonal evolution of changes relative to the baseline of vertical profiles at SUC (shaded colors) in terms of vertical velocity: (a) under RCP8.5, (b) under GLENS and in vertical temperature gradient, (c) under RCP8.5, and (d) under GLENS. Vertical velocity in baseline is plotted in Figures (a,b), and by contours and vertical temperature gradient on figures (c,d); the mixed-layer depth (dashed black diamond line for RCP8.5; magenta line for BSL and dashed black triangle line for GLENS) and the thermocline represented by D20 (black line for RCP8.5, dashed blue line for BSL, and red line for GLENS).
Climate 11 00087 g008aClimate 11 00087 g008b
Figure 9. Seasonal cycle for 2050–2069 of the mixed layer heat budget in the SUC region: (a) baseline simulation, Total temperature tendency (TOT, black), net air-sea heat flux (NHF, red), oceanic processes (OCP, blue); (c) under RCP8. 5, changes in total temperature tendency (black), changes in net air-sea heat flux (NHF, red), changes in oceanic processes (OCP, blue); (e) same as previously but under GLENS. Decomposition of oceanic processes, (OCP, blue); Horizontal advection (ADH, dashed green), vertical advection (ZAD, dashed blue), Entrainment (ENT, cyan), Residual (R, dashed black) (b) in baseline simulation and changes (d) under RCP8.5 and (f) under GLENS.
Climate 11 00087 g009
Figure 10. Same as in Figure 6 but from TUG region.
Climate 11 00087 g010
Figure 11. Same as in Figure 7 but from TUG region.
Climate 11 00087 g011aClimate 11 00087 g011b
Figure 12. Same as in Figure 8 but from TUG region.
Climate 11 00087 g012
Figure 13. Same as in Figure 9 but from TUG region.
Climate 11 00087 g013
Figure 14. Seasonal cycles of the changes relative to the baseline in D20 at TUG (blue curve) versus wind stress at WEA (orange curve) (a) under RCP8.5 (b) under GLENS; in D20 (blue curve) versus SST (orange curve) at TUG, (c) under RCP8.5 and (d) under GLENS.
Climate 11 00087 g014
Disclaimer/Publisher’s Note: The statements, opinions and data contained in all publications are solely those of the individual author(s) and contributor(s) and not of MDPI and/or the editor(s). MDPI and/or the editor(s) disclaim responsibility for any injury to people or property resulting from any ideas, methods, instructions or products referred to in the content.

