Article

Monitoring the Meteorological and Hydrological Droughts in the Largest River Basin (Mahaweli River) in Sri Lanka

by
Udara Senatilleke
1,
Jeewanthi Sirisena
2,
Miyuru B. Gunathilake
3,4,
Nitin Muttil
5,6 and
Upaka Rathnayake
7,*
1
Department of Construction Technology, Faculty of Technology, Wayamba University of Sri Lanka, Kuliyapitiya 60200, Sri Lanka
2
Climate Service Center Germany, 20095 Hamburg, Germany
3
Hydrology and Aquatic Environment, Environment and Natural Resources, Norwegian Institute of Bioeconomy and Research, 1433 Ås, Norway
4
Water, Energy, and Environmental Engineering Research Unit, Faculty of Technology, University of Oulu, P.O. Box 8000, FI-90014 Oulu, Finland
5
Institute for Sustainable Industries & Liveable Cities, Victoria University, P.O. Box 14428, Melbourne, VIC 8001, Australia
6
College of Engineering and Science, Victoria University, P.O. Box 14428, Melbourne, VIC 8001, Australia
7
Department of Civil Engineering and Construction, Faculty of Engineering and Design, Atlantic Technological University, F91 YW50 Sligo, Ireland
*
Author to whom correspondence should be addressed.
Climate 2023, 11(3), 57; https://doi.org/10.3390/cli11030057
Submission received: 29 January 2023 / Revised: 24 February 2023 / Accepted: 25 February 2023 / Published: 2 March 2023

Abstract

:
This study assessed the meteorological and hydrological droughts and their relationship over 30 years from 1985 to 2015 in the largest river basin (Mahaweli River Basin (MRB)) in Sri Lanka. Data from 14 rainfall, 5 temperature, and 5 streamflow stations in and near the MRB were used in the present study. Universal drought indices including Standardized Precipitation Index (SPI) and Standardized Precipitation–Evapotranspiration Index (SPEI) were used to assess meteorological droughts. The Standardized Streamflow Index (SSI) was used in investigating hydrological droughts. Correlations between meteorological and hydrological droughts were obtained, annual variations were observed (in terms of SPI, SPEI, and SSI), and the spatial distributions of selected drought events were analyzed. Our results revealed that the highest correlation was found in long-term dry conditions in the wet zone. In addition, some negative correlations found showed the opposite behavior of correlations. Furthermore, in annual variations of droughts, extreme droughts were recorded in the dry zone as maximum values, while results were more prominent in the wet zone. In addition, the spatial distribution performed using SPI, SPEI, and SSI showed an extremely dry condition in 2004. Our findings are beneficial for policymaking and for the decision-makers in assessing meteorological and hydrological drought risks in the future.

1. Introduction

Drought is an innate circumstance in which the quantity of water for a specific region is lower than that under regular conditions for a lengthy period. It may last for weeks, months, years, or even decades [1]. It causes shortages in water resources, depletions in power generation, economic loss, and negative impacts on the environment and agriculture. Droughts are reported all over the world, both in dry and wet regions [2]. Previous studies have summarized that more recurrent and escalated droughts have been recorded in many regions of the world in the past few decades [3,4,5]. Specifically, in the equatorial and subtropics, the contingencies of strong droughts happening increased over larger land areas since the 1970s [6].
However, understanding spatial and temporal variations with drought characteristics such as intensity, magnitude, and duration and quantifying their link is challengeable because the drought is correlated with compound interlinkages among the weather system, including atmospheric and land-based processes such as rainfall, evaporation, runoff, and ocean processes [2,5,7]. Generally, droughts can be assorted under four main types: namely, meteorological, hydrological, agricultural, and socioeconomic [8]. The constitutive bond between the water cycle and operations causes the occurrence of hydrological and meteorological drought with regard to time and severity. Meteorological drought occurs expeditiously, and hydrological drought transpires after a meteorological drought. According to the purpose of analyzing the characteristics and variations, various drought indices are developed, which can be considered as a function of rainfall, temperature, streamflow, or any other hydro-meteorological variables such as evapotranspiration and soil moisture [9]. Among these indices, the Palmer Drought Severity Index (PDSI) [10], the Standardized Precipitation Index (SPI) [11], the Reconnaissance Drought Index (RDI) [12], and the Standardized Precipitation Evapotranspiration Index (SPEI) [13] have been widely used in meteorological drought studies. The Standardized Streamflow Index (SSI) and Streamflow Drought Index (SDI) are used in assessing hydrological droughts. These drought indices can be calculated in multiple time scales, which is useful to monitor and identify the characteristic of meteorological and hydrological droughts [14,15].
According to the context of weather changes, the spatial and temporal variation of drought has become a hot topic for researchers around the world. A study carried out to assess the meteorological and hydrological droughts in the Awash River basin in Ethiopia used SPI and river flow indices for the spatial and temporal analysis of droughts. Their results revealed that there was a seven-month lag in hydrological drought compared with the meteorological drought [16]. Furthermore, a study carried out by Wu et al. (2021) [17] found that reservoir operations led to significant changes in the relationship between the hydrological and meteorological droughts in the Dongjiang River Basin in southern China. The streamflow and precipitation data and the inflow and outflow of the Xinfengjiang Reservoir were used. The results of assessing propagation thresholds from meteorological to hydrological drought in multi-timescales using three different methods showed that there is a positive correlation between SPI (meteorological) and SSI (hydrological) on short-term (1 to 3 months) droughts. In addition, a study carried out in two basins of Poland showed that the meteorological drought has transformed into a hydrological drought in the same month, drought is no longer than two months, and two separate drought events were obtained in the same year [18]. A study conducted in the Jinjiang river basin in China to study the correlation between hydrological and meteorological drought using SPI and SSI to calculate the drought characteristics showed that there is a nonlinear relationship between the two types of droughts [19]. Impacts of warming characteristics of droughts were investigated in Spain, and it was shown that the precipitation and evapotranspiration increased and both SPI and SPEI indices had given the same results in the analysis [7]. In addition, a study performed in Greece to find out the connection between Reconnaissance Drought Index (RDI) and Streamflow Drought Index (SDI) for a 3–12-month period revealed that there is a strong correspondence between RDI-9 and SDI-12 [20]. According to the calculation of SPI and SDI, drought occurred in the Karaj Dam Basin in Iran, and it was also found that there is a strong correlation between drought and the streamflow of the Karaj Dam Basin and also there is a relationship between hydrological and meteorological drought for a significance level of 99% [21].
In Sri Lanka, drought occurrence is 4% of total disaster occurrence and damages caused by drought are about 1% of total recorded damages of 7 billion United State Dollars (USD) due to recurring disasters between 1990 and 2018 in Sri Lanka [22]. In addition, during 2001–2013, around 10% of Sri Lanka’s population was exposed to drought [23]. The rank of Sri Lanka based on the Climate Risk Index was 30 in 2019, and for the period of 2000 to 2019, the rank was 23 [24]. Therefore, the impacts of climate-related extreme weather events in Sri Lanka should be assessed. Although there are a reasonable number of studies performed on investigating the variation of drought characteristics and the associated mechanism, there are only a handful of studies carried out in Sri Lanka. Among those studies, Gunda et al. (2016) [25] used PDSI and SPI to identify the spatial–temporal distribution of drought in Sri Lanka. It was shown that the PDSI is correlated with the intermediate zone, SPI is correlated with the dry zone, and neither index is correlated with the wet zone. In addition, Lyon et al. (2009) [26] investigated the relationship between drought relief payments and meteorological drought in Sri Lanka from 1960 to 2000. Consequently, drought management in Sri Lanka is largely limited to consolation supply. Vigorous perception on the variability of drought at the basin scale is still lacking, which is important for the drought indications from seasonal to decadal time scales. A recent study [27] was shown that droughts were prominent between 2000 and 2015 in the wet region compared to 1985 and 1999 in Sri Lanka. The Mahaweli River Basin (MRB) is the largest river basin in Sri Lanka, providing a livelihood for 15% of the Sri Lankan population (2.8 million people). It covers one-sixth of the territory (55% dry zone) in Sri Lanka [28] and 1493 km2 of paddy fields, producing 21.3% of the total paddy production in Sri Lanka [27]. A further 17% of the total energy production, which means 775 Megawatts (MW) of hydropower, is added to the national grid annually by seven major hydropower stations in the MRB [27]. However, the focus of researchers is less on identifying drought characteristics and variations in the most important and largest river basin in Sri Lanka up to date.
This study monitored and assessed the meteorological and hydrological droughts in the MRB from 1985 to 2015. A comparative evaluation was performed by using the SPI vs. SSI indices and SPEI vs. SSI indices in the three climatic zones of dry, intermediate, and wet to achieve the objectives of this study. The correlations among these indices were tested to understand the nature of the relationship between the meteorological and hydrological droughts in these three climatic zones. Finally, the index results were validated using a spatial distribution with the drought events identified in previous studies, newspapers, books, and reports over the 30 years in the MRB. The remaining parts of the paper are arranged as follows. Section 2 describes the study area and methods used in the study. Section 3 and Section 4 comprise results and a discussion section, respectively. Finally, conclusions and recommendations are given in the fifth section.

2. Materials and Methods
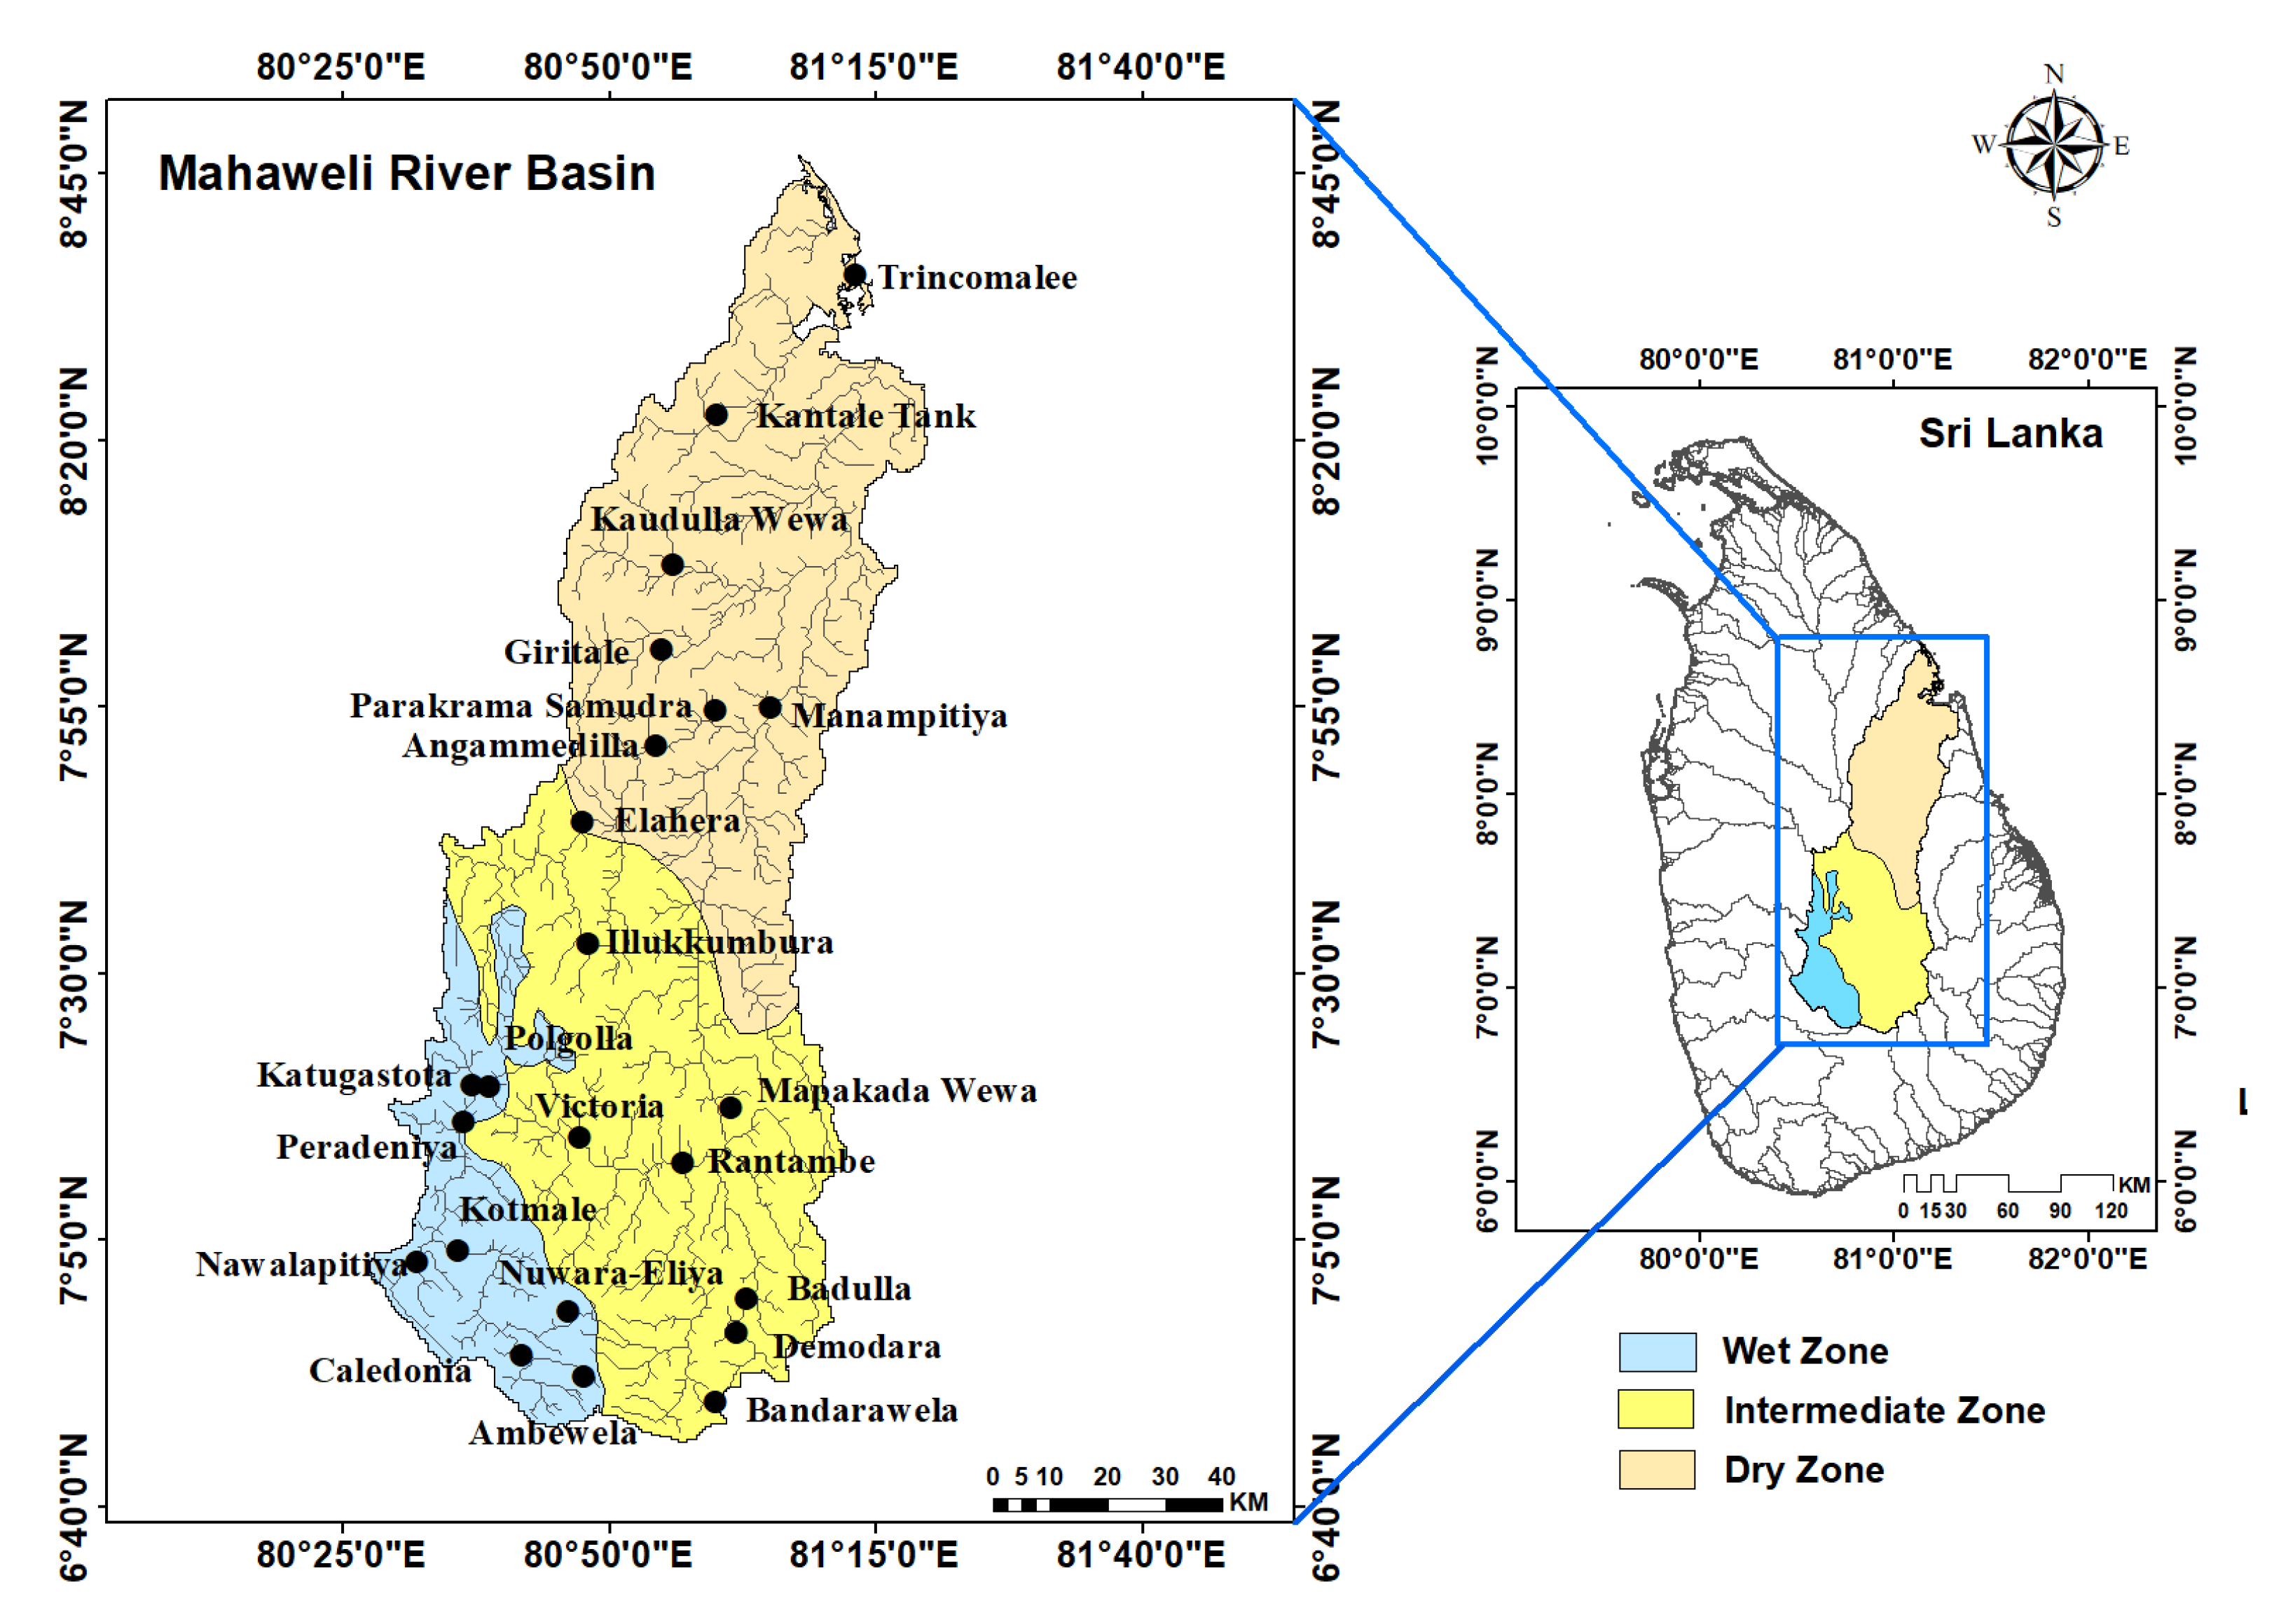
2.1. Study Area

The Mahaweli River flows for 335 km and is the longest river in Sri Lanka. The Mahaweli River Basin (MRB) covers an area of 10,448 km2, which is approximately 16% of Sri Lanka’s land area. The MRB collects annual rainfall of 28 × 109 m3 (2680 mm) while 9 × 10⁹ m3 is discharged to the sea annually [27]. It is 1/7th of the total runoff of all the rivers in Sri Lanka. The rainfall in the MRB is highly dependent on time and space. The MRB is located in the three climatic zones of Sri Lanka: the wet, the intermediate, and the dry zones (Figure 1). Hewawasam (2010) categorized the MRB into upper (UMRB) and lower (LMRB) basins. According to that classification, the UMRB belongs to the wet climatic zone and a small part of the intermediate zone. The UMRB extends to the western part of the central highlands, where the mean annual rainfall is 6000 mm. In the LMRB, mean annual rainfall varies between 1600 and 1900 mm. An area of 3650 km2 of paddy fields in the lowlands is cultivated by Mahaweli water through 10,049 km long canal networks. Furthermore, the MRB covers 40% of the potential of island-wide hydropower [29].

2.2. Materials

The stations were selected according to the hydro-meteorological variables used in the study such as rainfall, temperature, and streamflow. Mainly rainfall data from 14 stations and temperature data from 5 stations were chosen for assessing the meteorological droughts, while streamflow data from 5 stations were taken to evaluate the hydrological droughts (Figure 1). The 24 stations selected for corresponding drought indices in the study are mentioned in Table 1. The selected stations of Trincomalee for SPEI, Manampitiya for SSI and Kantale tank, Kaudulla Wewa, Giritale, Parakrama Samudra, and Angamadilla for SPI from the dry zone, Badulla for SPEI, Bandarawela for both SPEI and SPI Demodara for SSI and Rantambe, Elehara and Illukkumbura for SPI from the intermediate zone and Nuwara Eliya, Katugastota for SPEI, Nawalapitiya and Caledonia for SSI and Ambewela, Polgolla, Peradeniya, Victoria and Kotmale for SPI from the wet zone were considered in the analysis. Figure 1 shows the MRB map which comprises the selected 24 stations used in this study.

2.3. Data and Filling of Missing Data

There are more than 50 stations in the Mahaweli River Basin to record monthly rainfall data. Due to the unavailability of continuous data, only a certain number of stations were used for 1985 and 2015 (Figure 1). The daily rainfall and monthly average temperature data were collected from the Department of Meteorology, while the daily streamflow data were from the Department of Irrigation, Sri Lanka.
However, data were selected which have a smaller number of missing data (<5% of the total period). Missing data in rainfall were filled by using Asian Precipitation–Highly-Resolved Observational Data Integration Towards Evaluation (APHRODITE) data replacement (http://aphrodite.st.hirosaki-u.ac.jp/products.html) (accessed on 21 October 2022) in ArcGIS 10.5. The average temperature was calculated using maximum and minimum temperatures, and missing data were replaced by using the nearest neighbor approach. Streamflow data were selected in the stations having less than 5% of missing data between 1985 and 2015. Then, the rainfall and temperature data were used to calculate the SPI and SPEI indices, while the streamflow data were used to calculate the SSI.

2.4. Meteorological and Hydrological Drought Indices

The Standardized Precipitation Index (SPI) and Standardized Precipitation Evapotranspiration Index (SPEI) were used to assess the meteorological droughts, while the Standardized Streamflow Index (SSI) was utilized to assess the hydrological droughts in this study. The analyses were carried out at different time scales (1, 3, 6, 12 and 24 months) spanning from 1985 and 2015. The SPI and SSI were estimated using the precintcon package [30], and SPEI was estimated using SPEI package [31] perceived in the R studio [32].

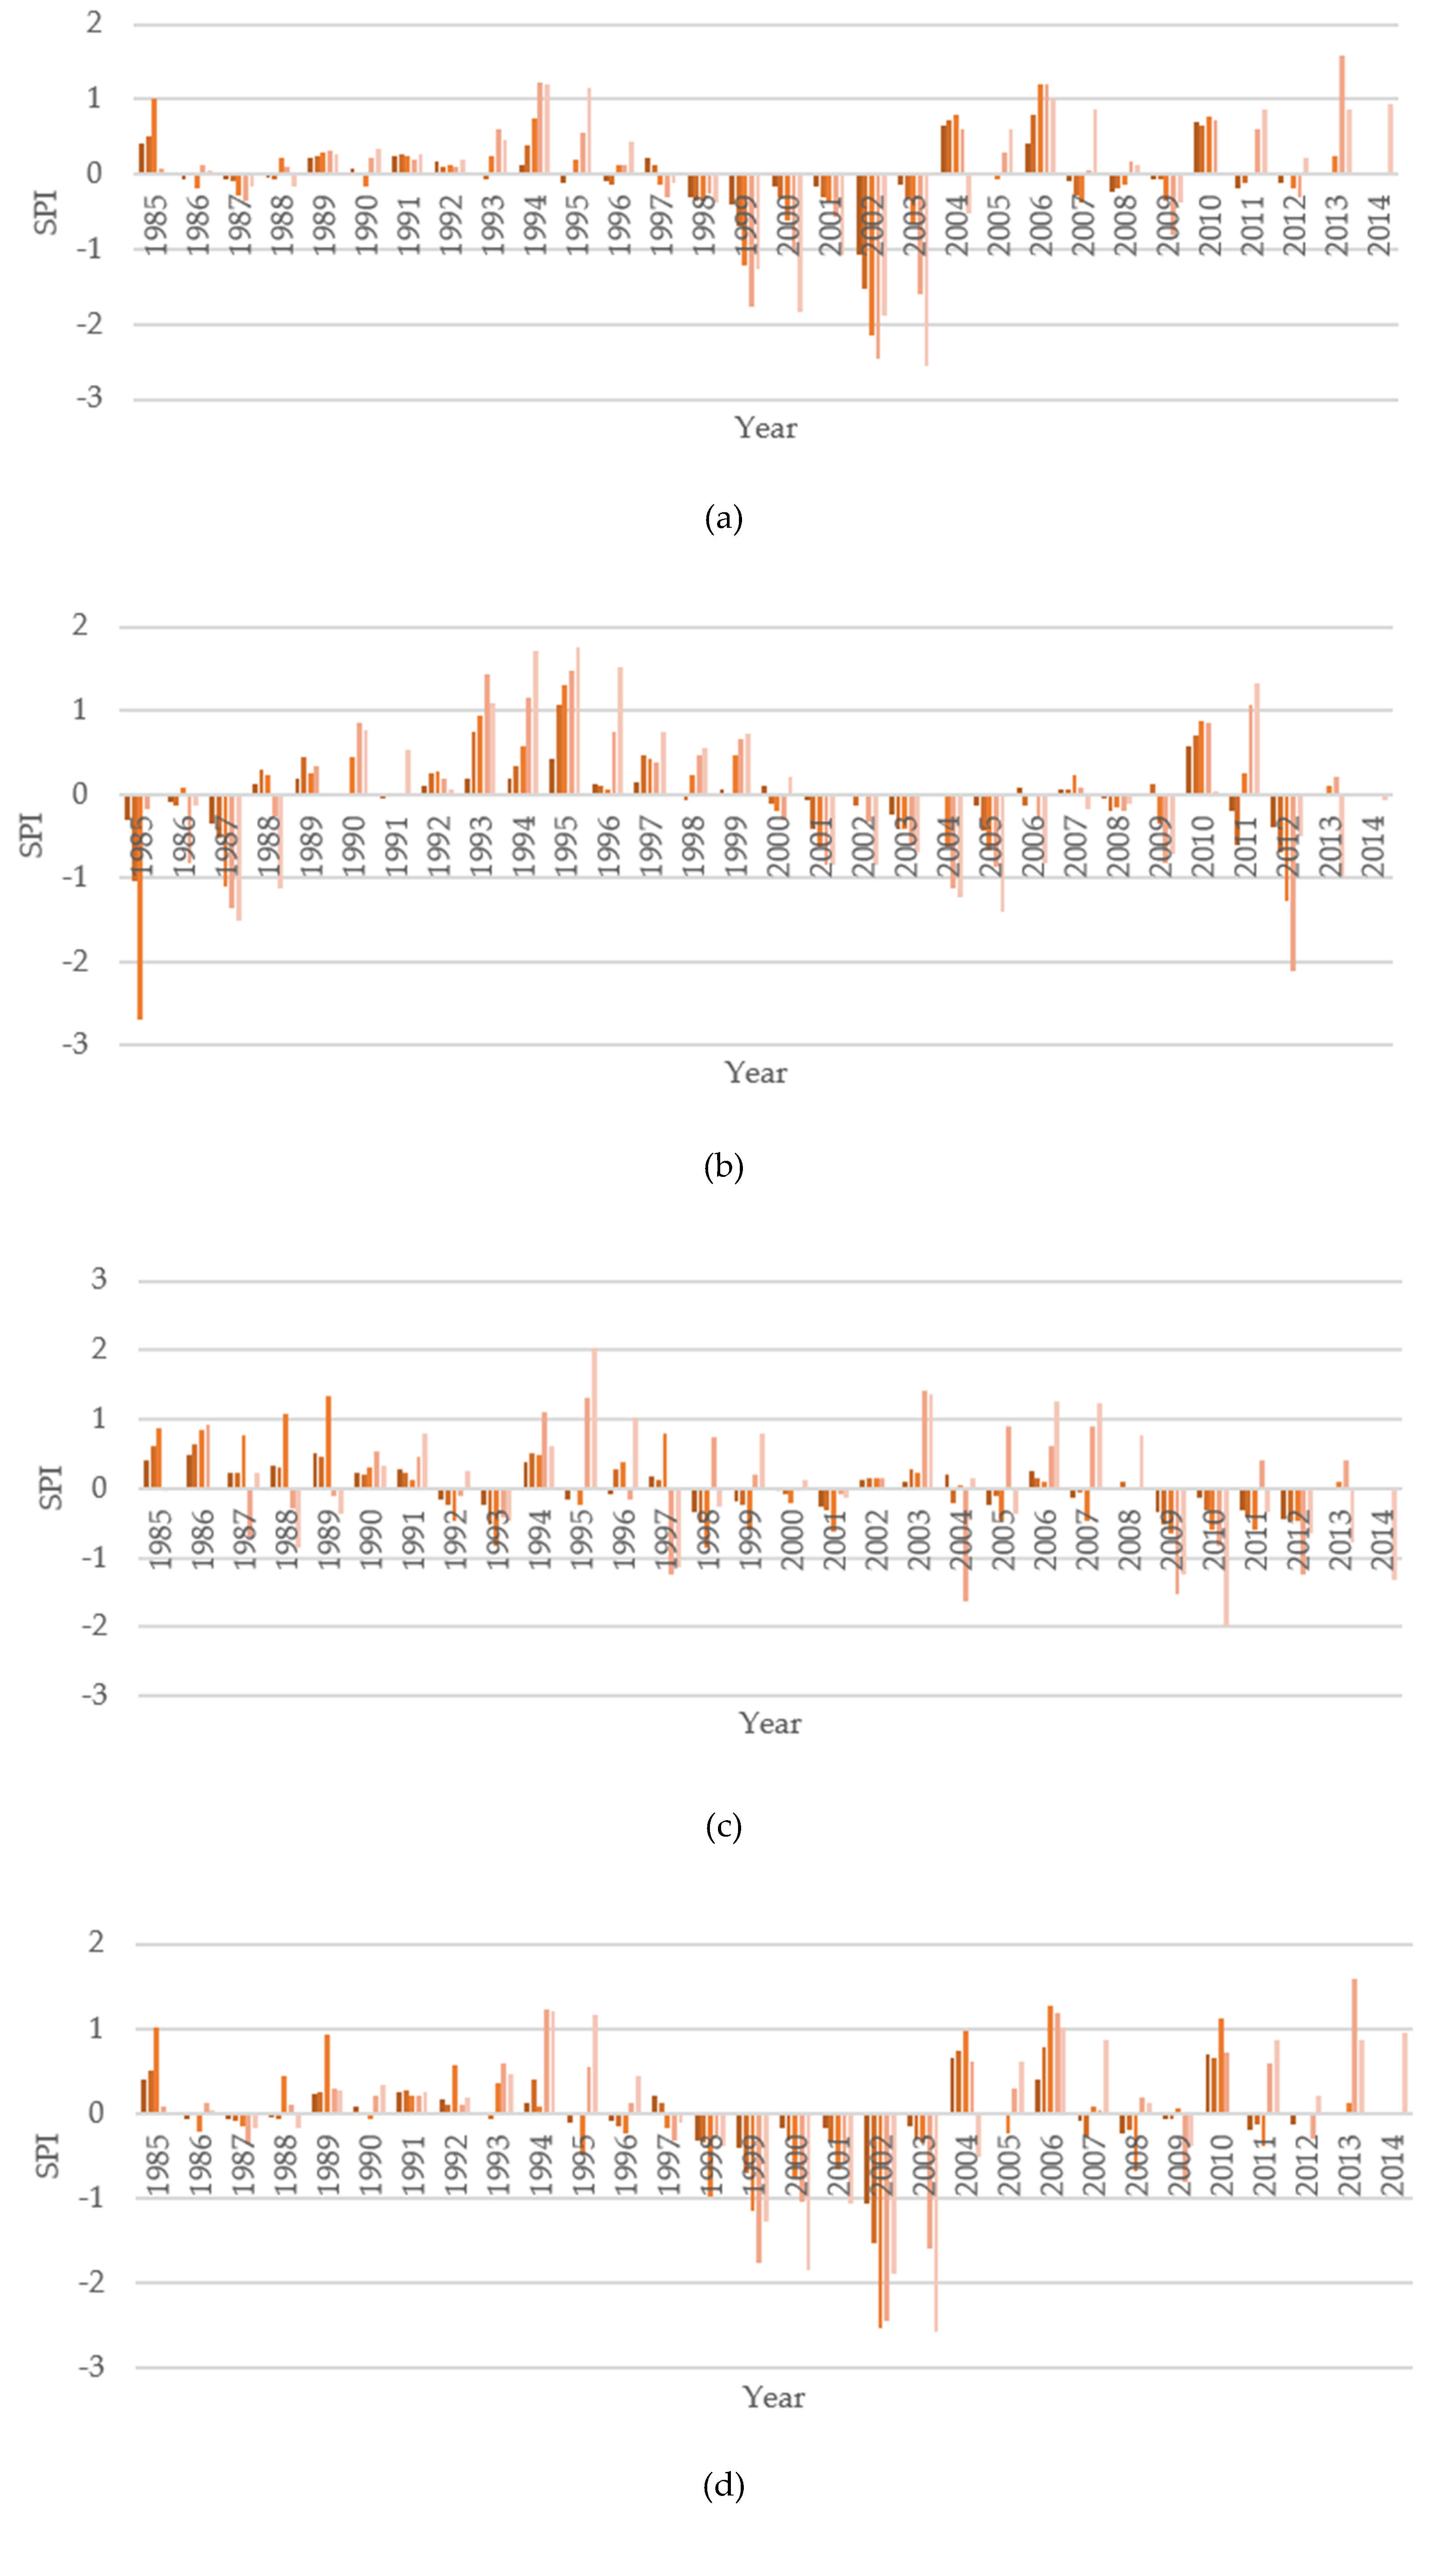
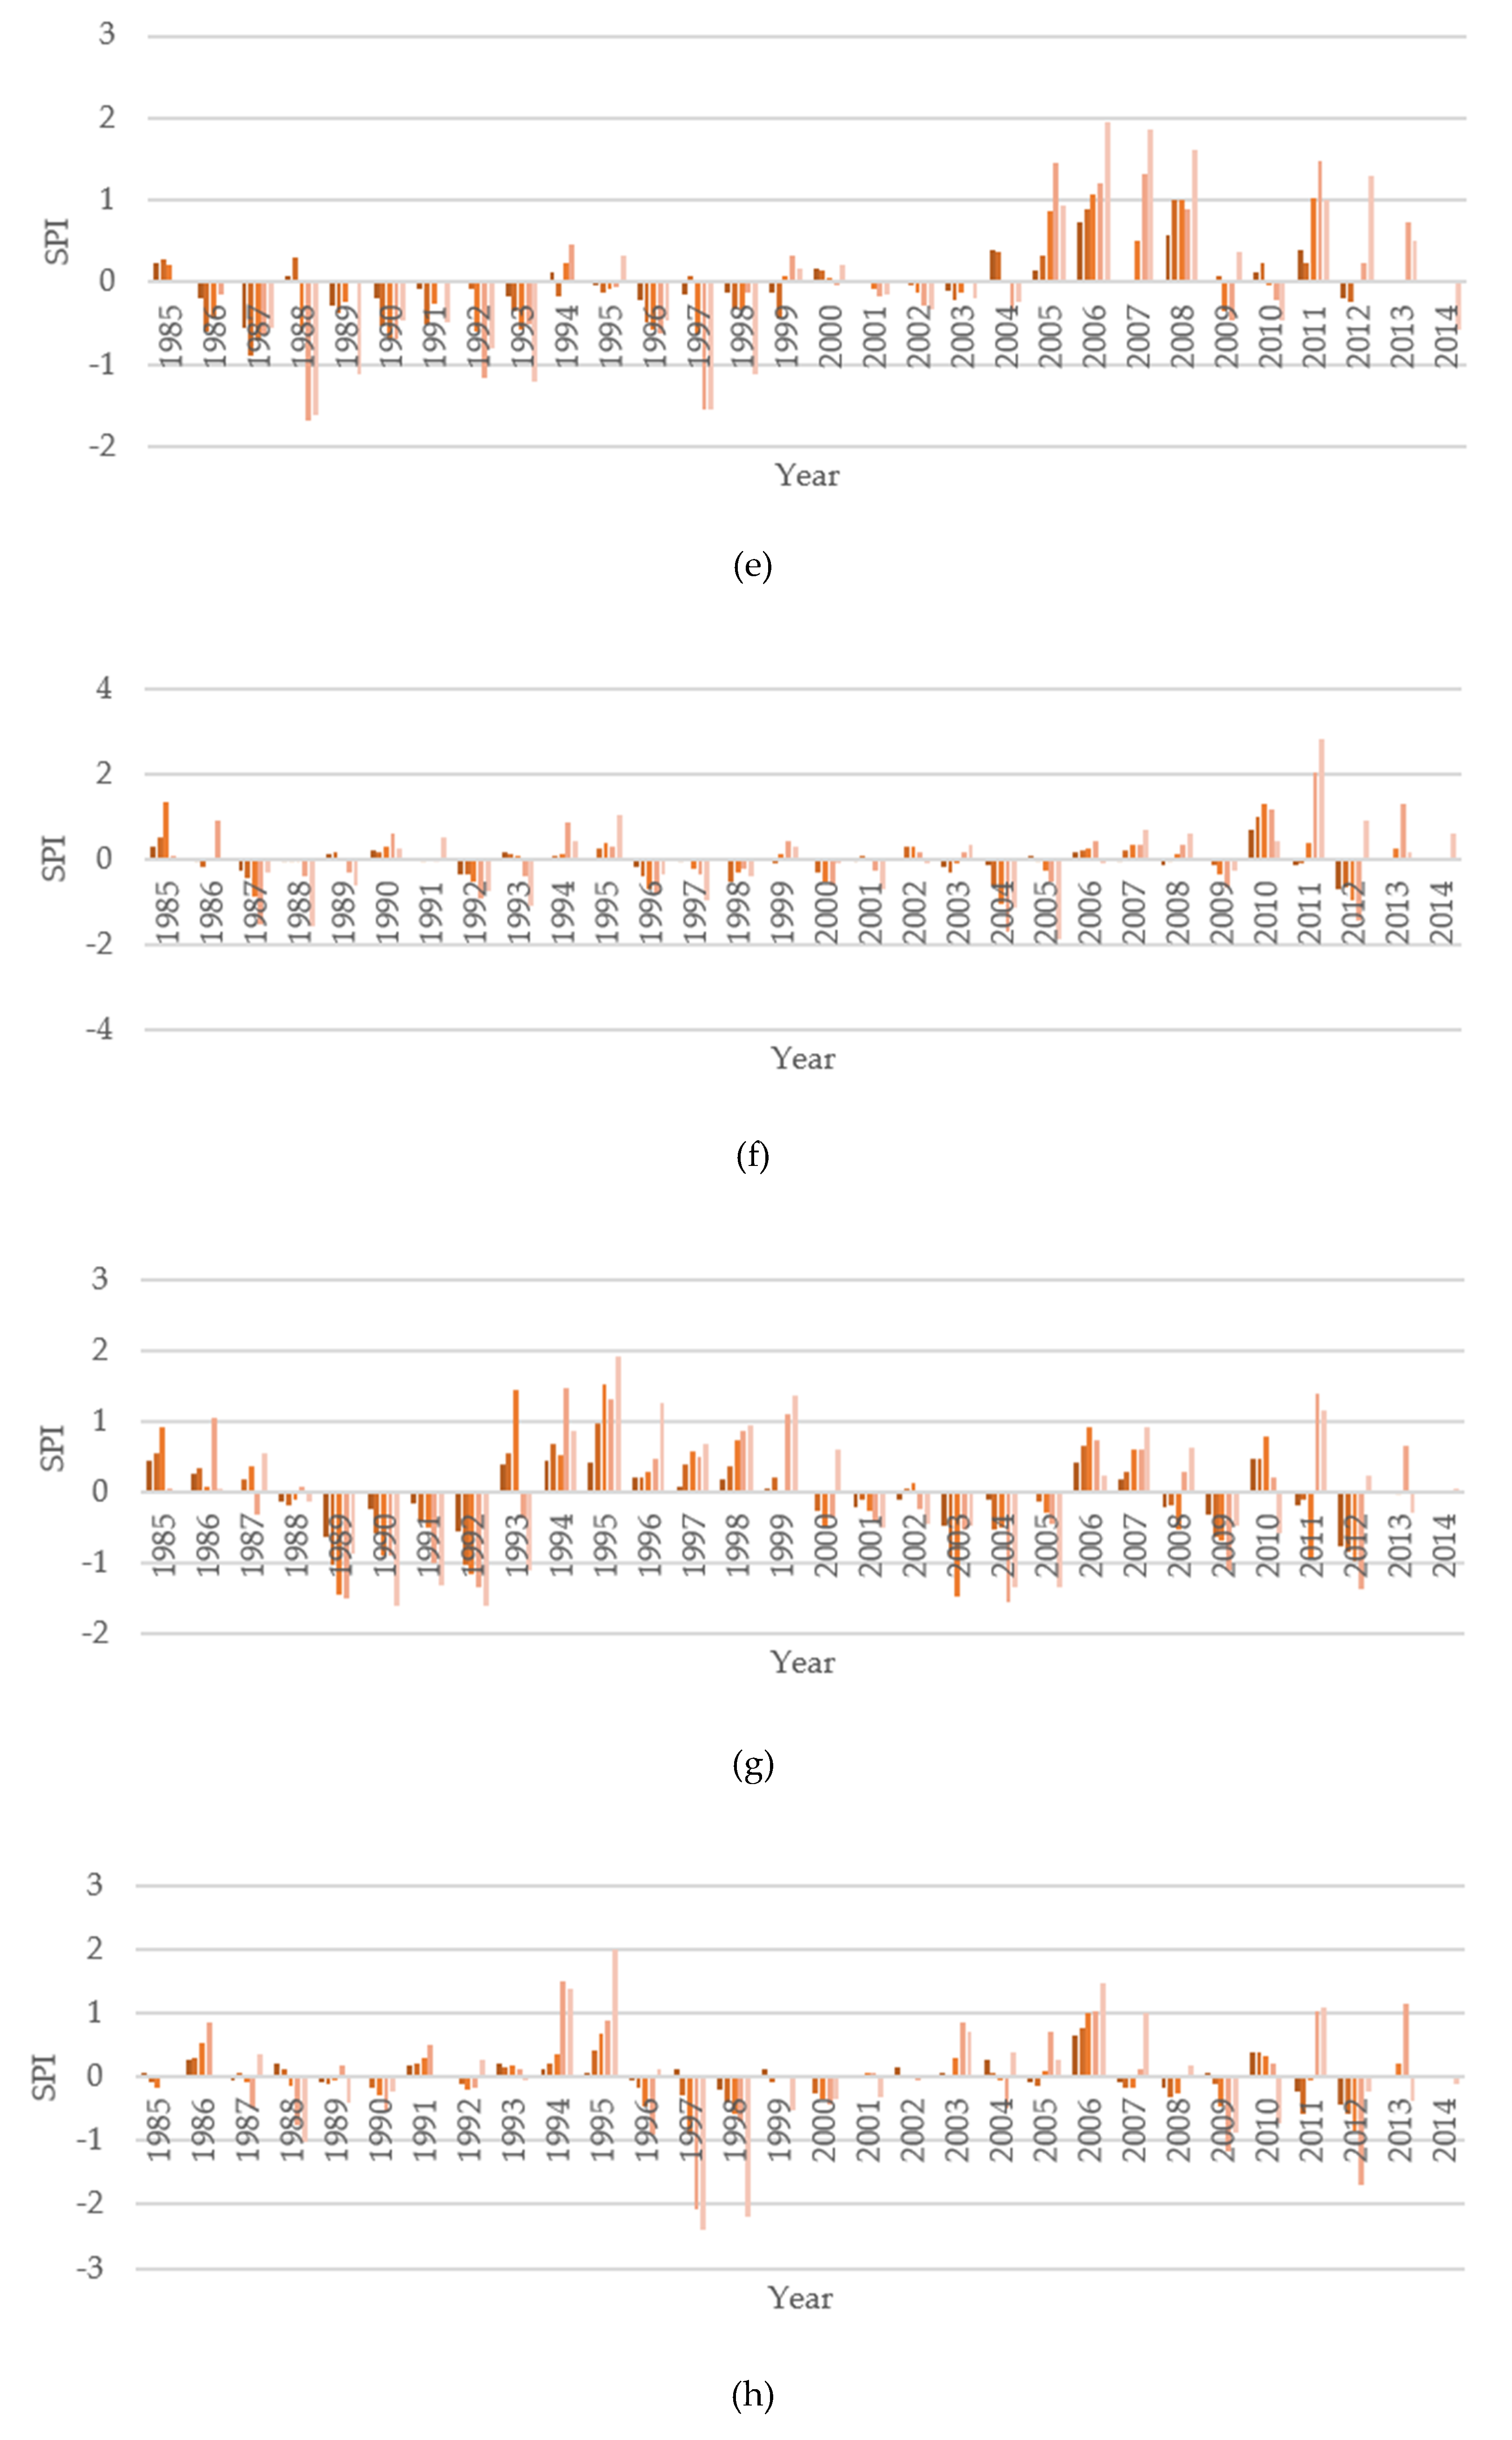
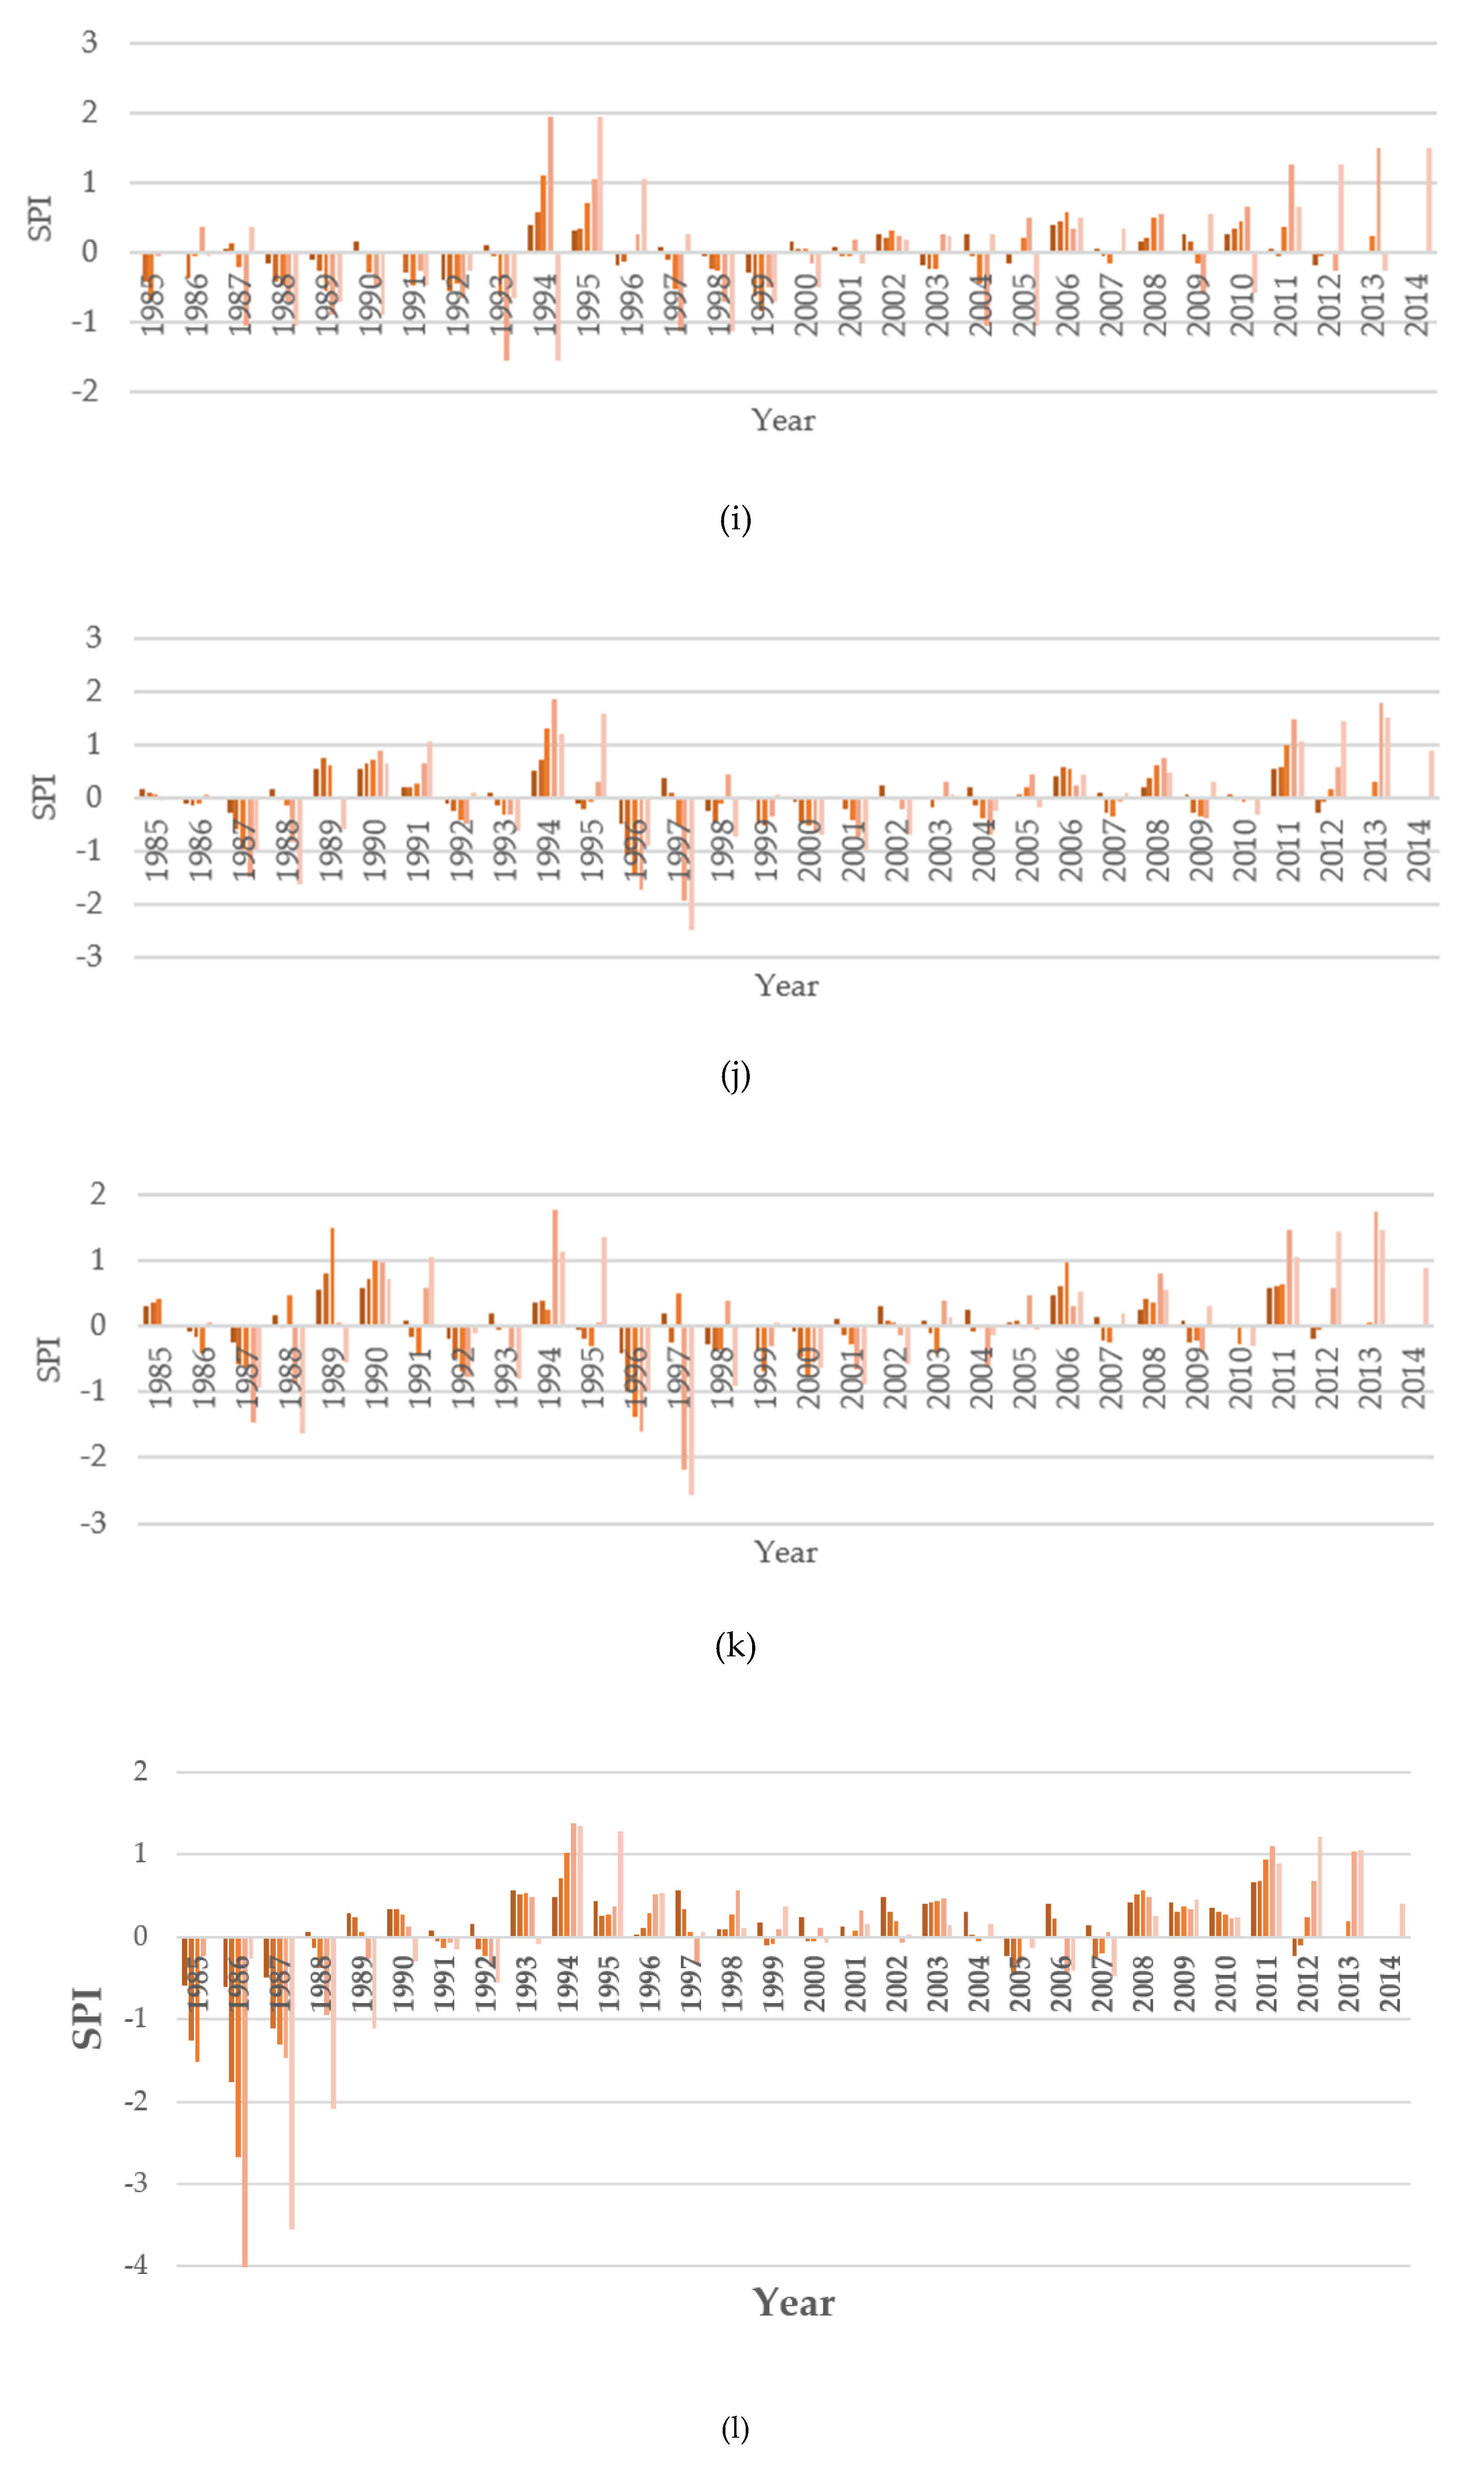
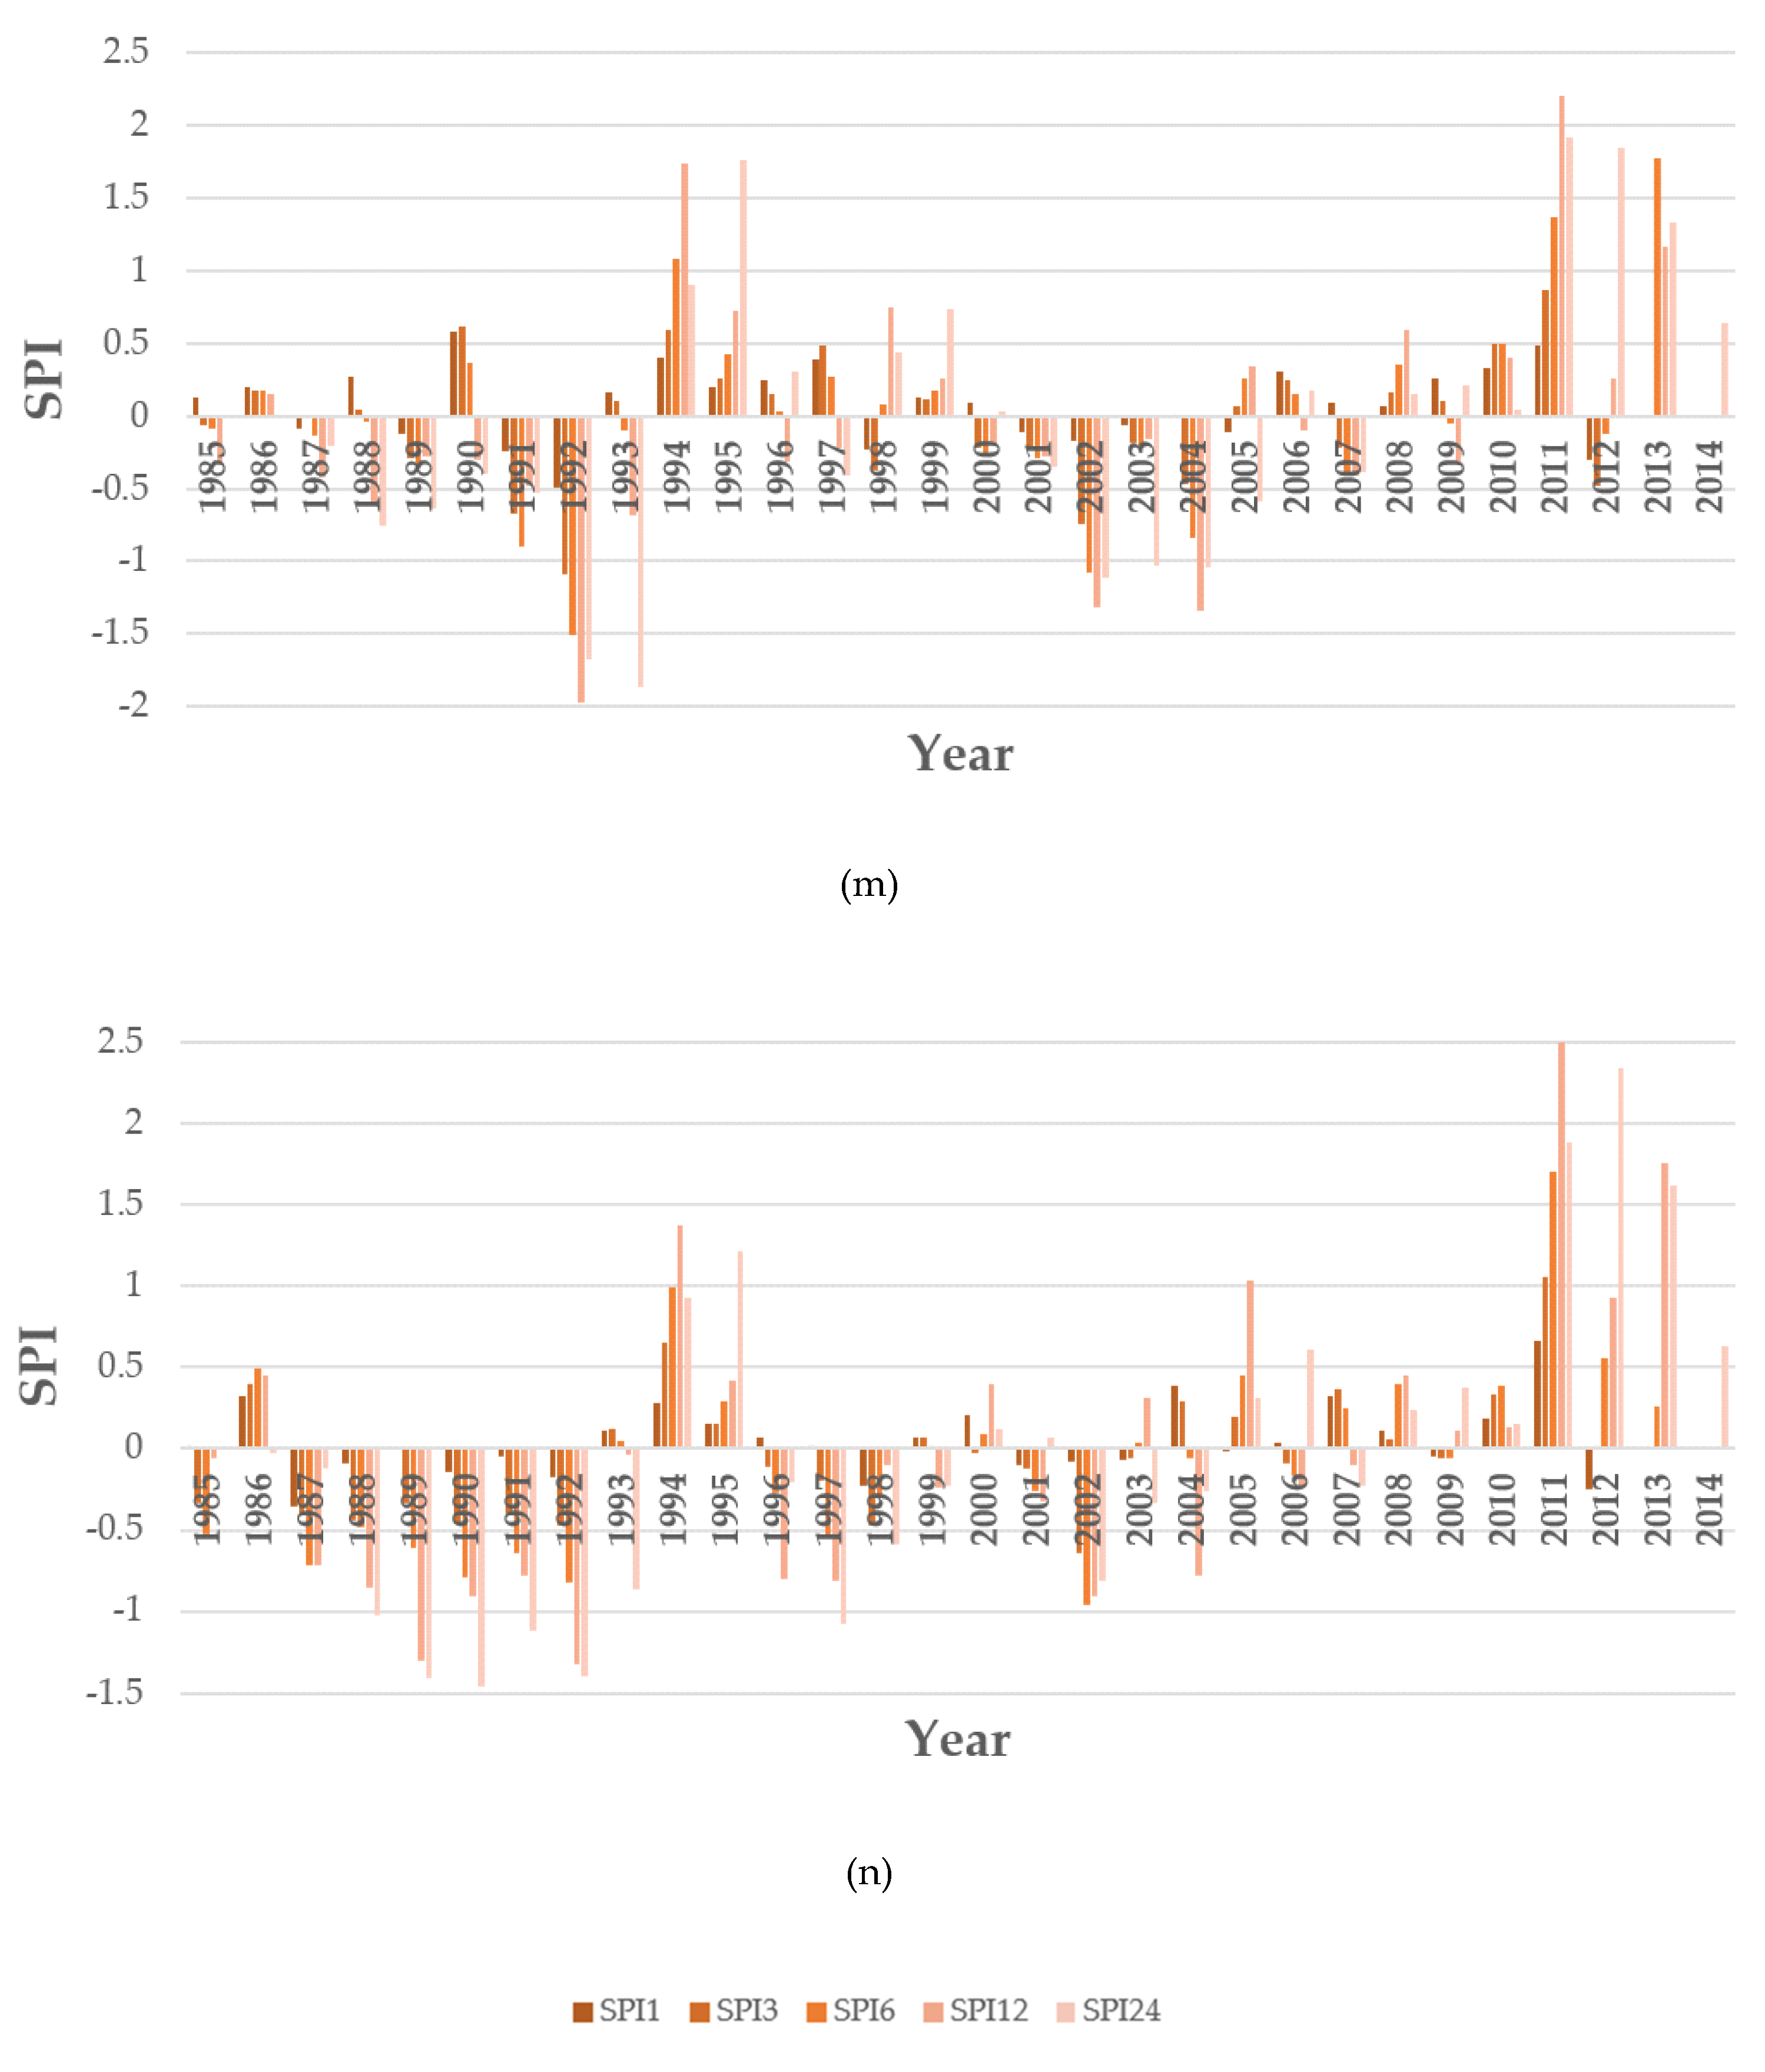
2.4.1. Standardized Precipitation Index (SPI)

The SPI evaluates drought context formed on the probability dispensation of long-term precipitation using the gamma function [11]. Precipitation is modified to normalized numerical values, and the SPI is given as the number of standard deviations by which the perceived precipitation deviates from the long-term mean for a normally distributed arbitrarily variable (Equation (1)). It can thus be utilized to explain droughts. The index gives a strong and authentic appraisal of the enormity, extremity, and spatial expanse of droughts. When precipitation is exceeding the long-term mean value, the SPI is positive, and if precipitation drops below the long-term mean, the SPI is negative. Unlike other drought indices, SPI is less burdensome to use because it only requisites a solitary input data succession of long-term precipitation [33]. Because it is contingent normalized data, the SPI is spatially steady, and droughts can be evaluated in various regions [34]. The index is calculated as Equation (1).
S P I = x i x ¯ σ
where x i is the precipitation of the selected period during the year i, x ¯ is the long-term mean precipitation and σ is the standard deviation for the selected period.

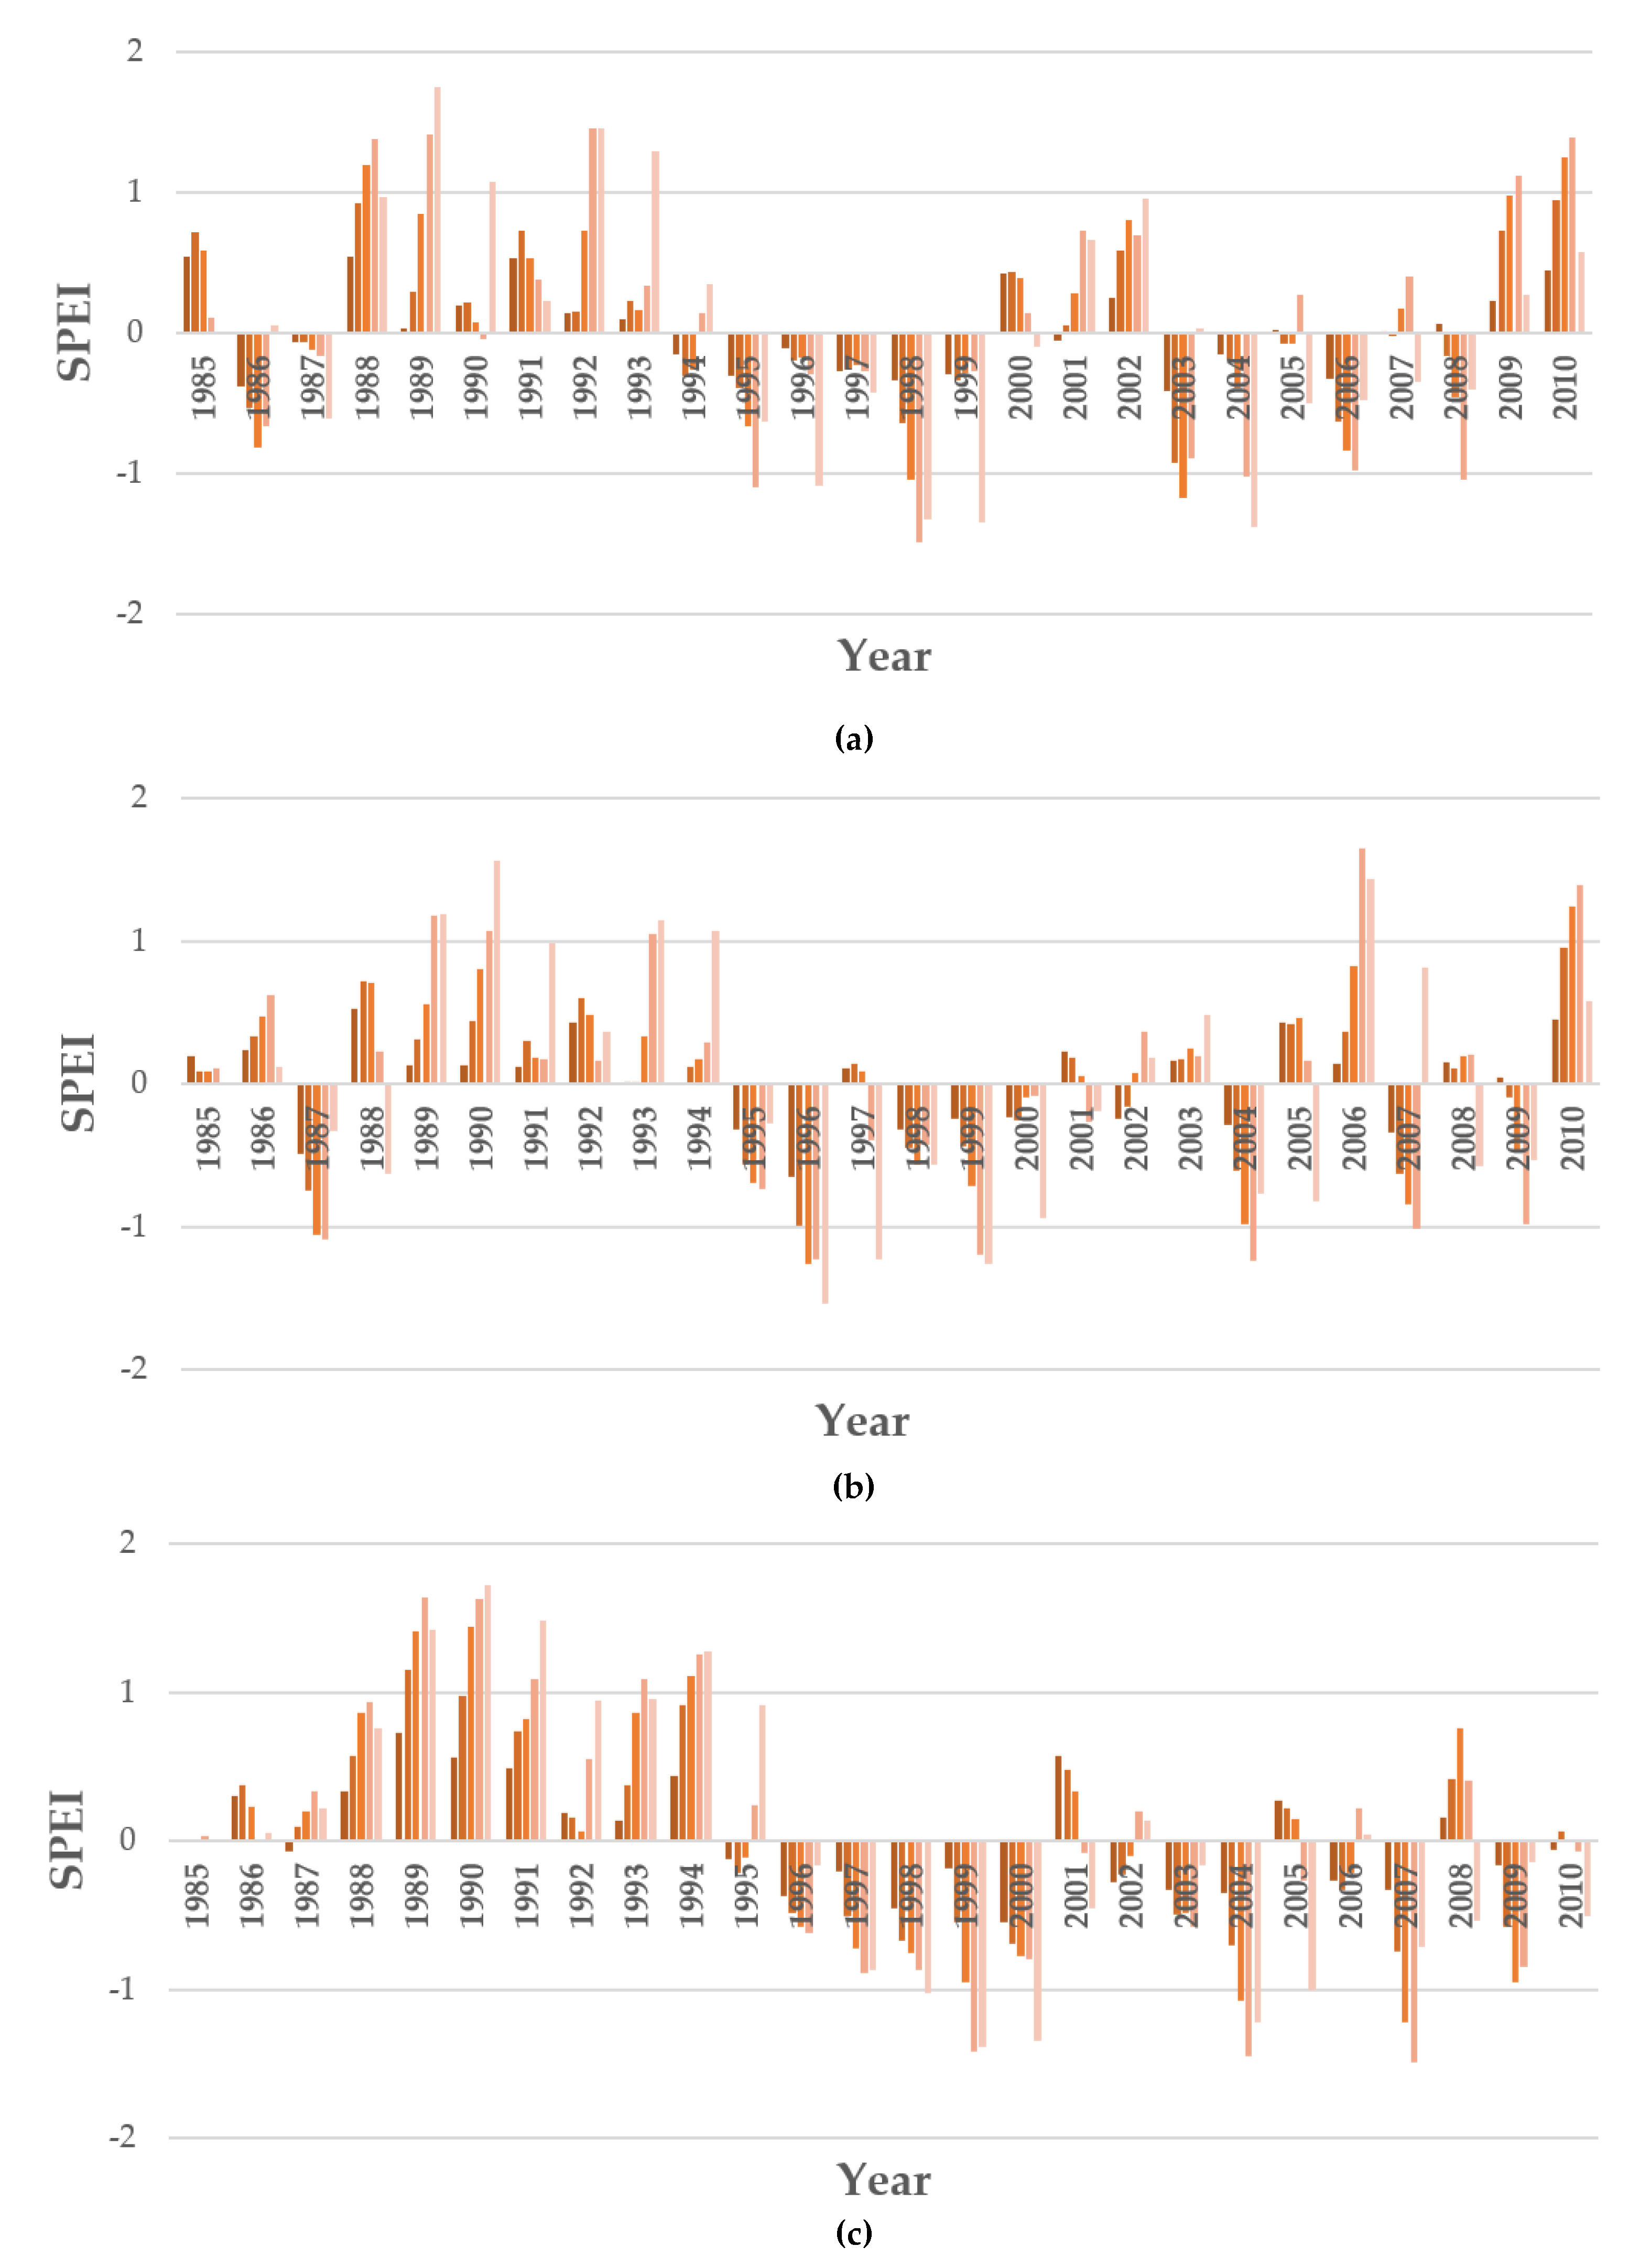
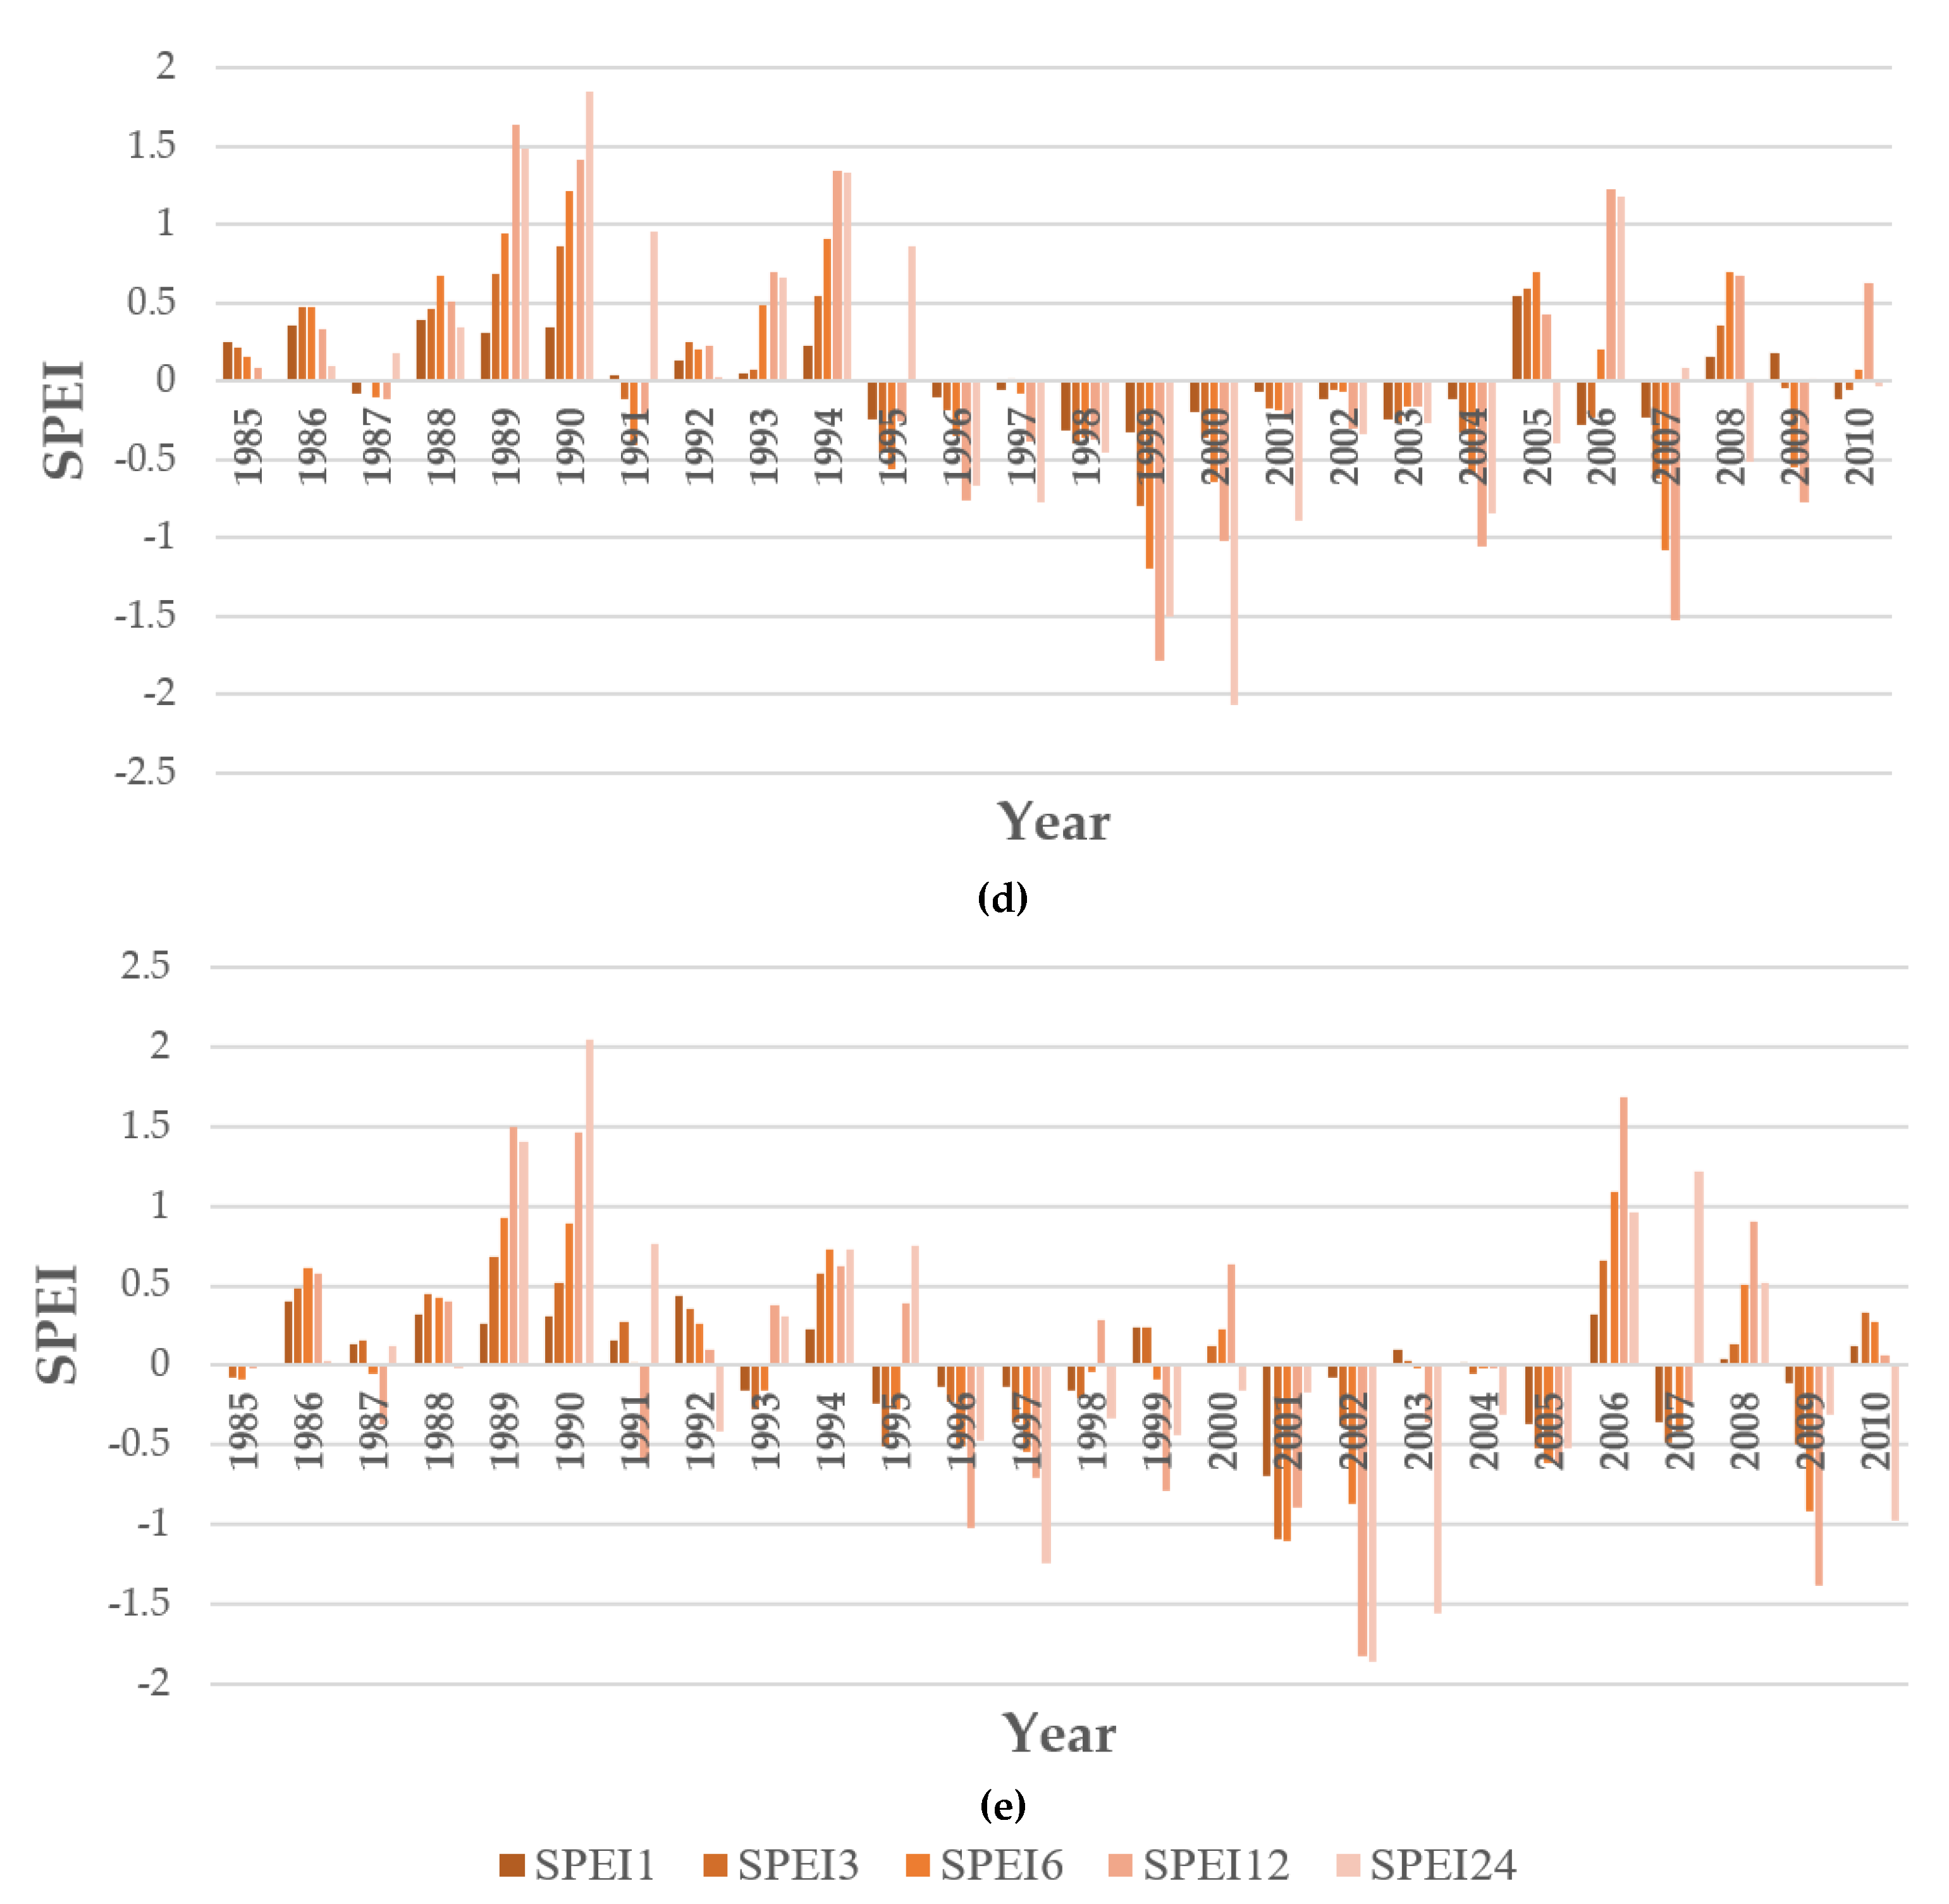
2.4.2. Standardized Precipitation Evaporation Index (SPEI)

SPEI is enumerated contingent on the non-exceedance probability of the differences between precipitation and potential evapotranspiration, which is modified utilizing a three-parameter log-logistic distribution that considers ordinary negative values [13,35]. SPEI utilizes a three-parameter distribution to apprehend the shortage values, since it is most likely that in parched and semi-arid areas, the wetness shortage can be negative. For two indicator distributions as used in SPI, the variable x (taken a variable called x) has a lower frontier of zero (0 > x < ∞), meaning that x can only grasp positive values, while for the three indicator distributions utilized in SPEI, x can take values in the range (ɤ > x< ∞), insinuating that x can also grasp negative values, and ɤ is the parameter of the genesis of the distribution [13]. Therefore, the log-logistic distribution was advocated for SPEI, since it bestows a better fit for the uttermost negative values [36]. The SPEI is acquired by regularizing the water balance into the log-logistic probability distribution. The Potential Evapotranspiration (PET) is evaluated by using the Hargreaves method [37] in R. The difference ( D i ) between precipitation ( P r e c i p i ) and P E T i for the month (i) is given in Equation (2).
D i = P r e c i p i P E T i
The estimated D values are aggregated at different time scales as in Equation (3).
D n k = i 0 k 1 P r e c i p n 1 P E T n 1
where k is the timescale (months) of the aggregation and n is the calculation month. The probability density function of a log-logistic distribution is given in Equation (4).
f ( x ) = β α ( x γ α ) β 1 × ( 1 + ( x γ α ) β ) 2
where α, β, and ɤ are scale, shape, and origin parameters, respectively, for ɤ > D < ∞. The probability distribution function for the D series is then given in Equation (5).
F ( x ) = ( 1 + ( α x γ ) β ) 1
With F(x), the SPEI can be acquired as the standardized values of f(x) confirming the method of Abramowitz and Stegun (1965) (refer to Equations (6) and (7)).
S P E I = W c 0 + c 1 W 1 + c 2 W 2 1 + d 1 W 1 + d 2 W 2 + d 3 W 3
W = 2 l n ( P )     f o r   P 0.5
P is the probability of exceeding a determined Di value and is given as P = 1   f ( x ) , while the constants are, c 0 = 2.515517 , c 1 = 0.802853 , c 2 = 0.010328 , d 1 = 1.432788 , d 2 = 0.189269 and d 3 = 0.001308 . Since SPEI is a standardized variable, it can be used to compare droughts over different spatial and temporal scales [38].

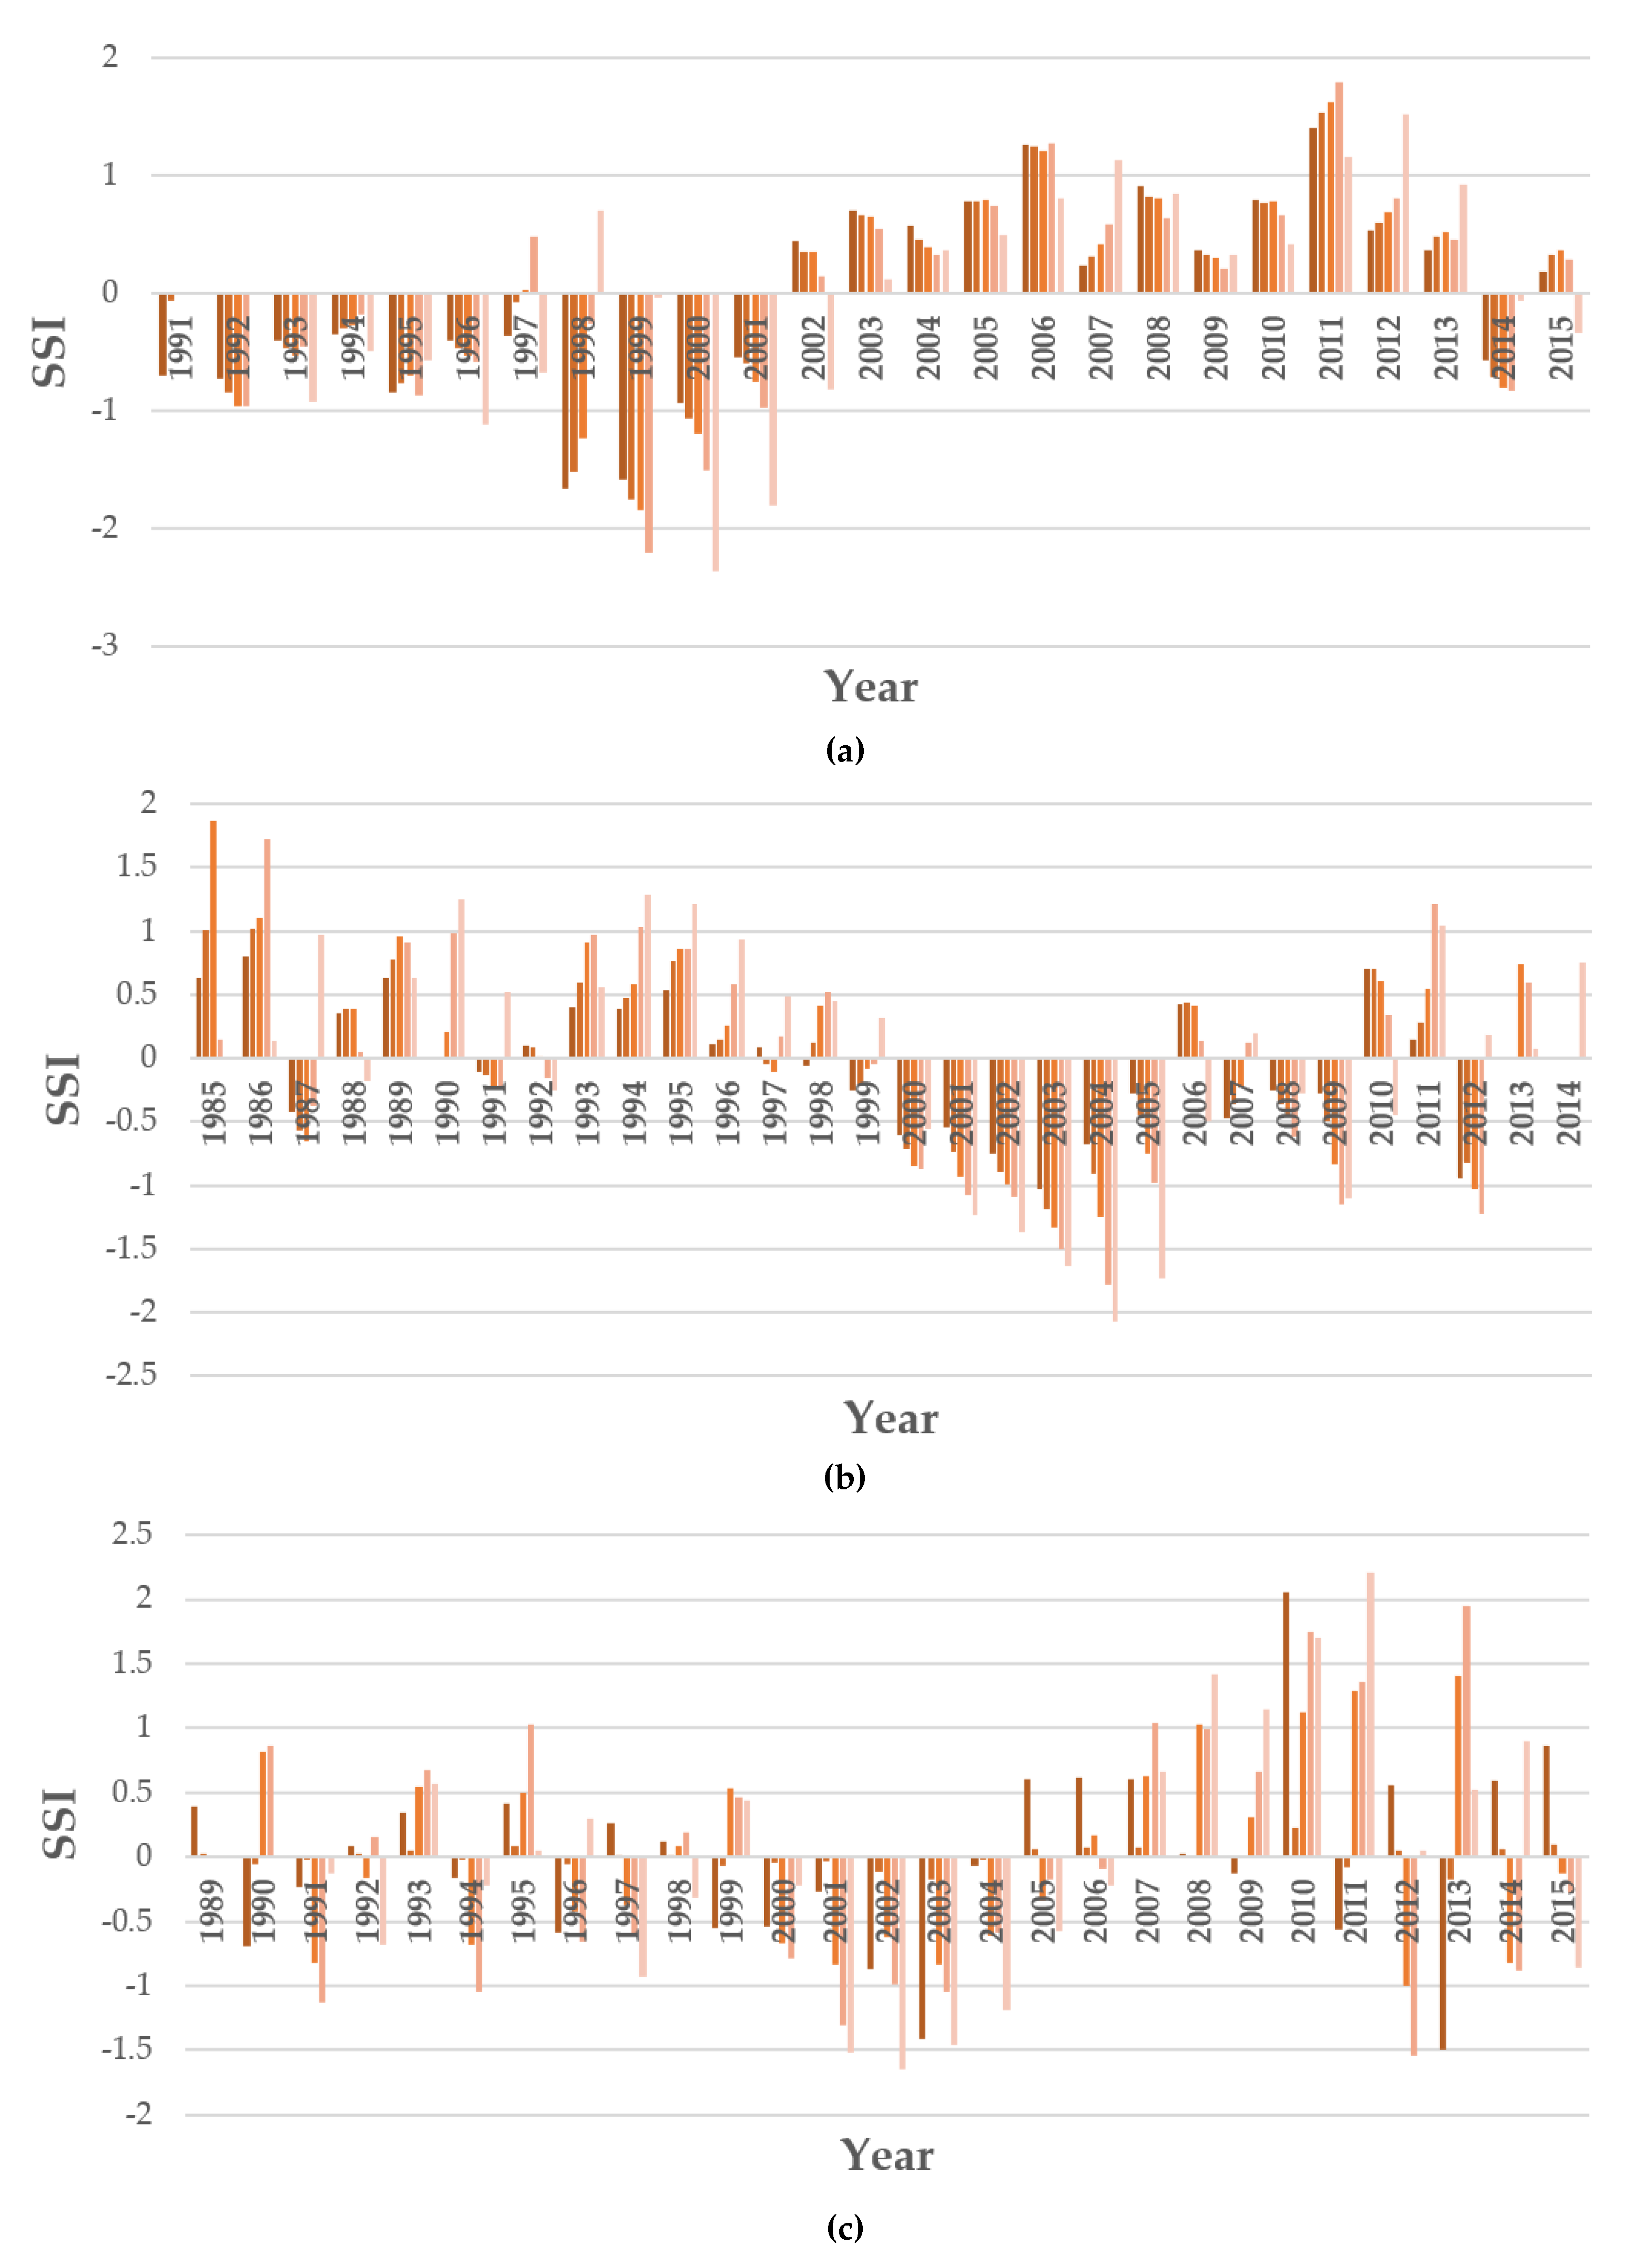
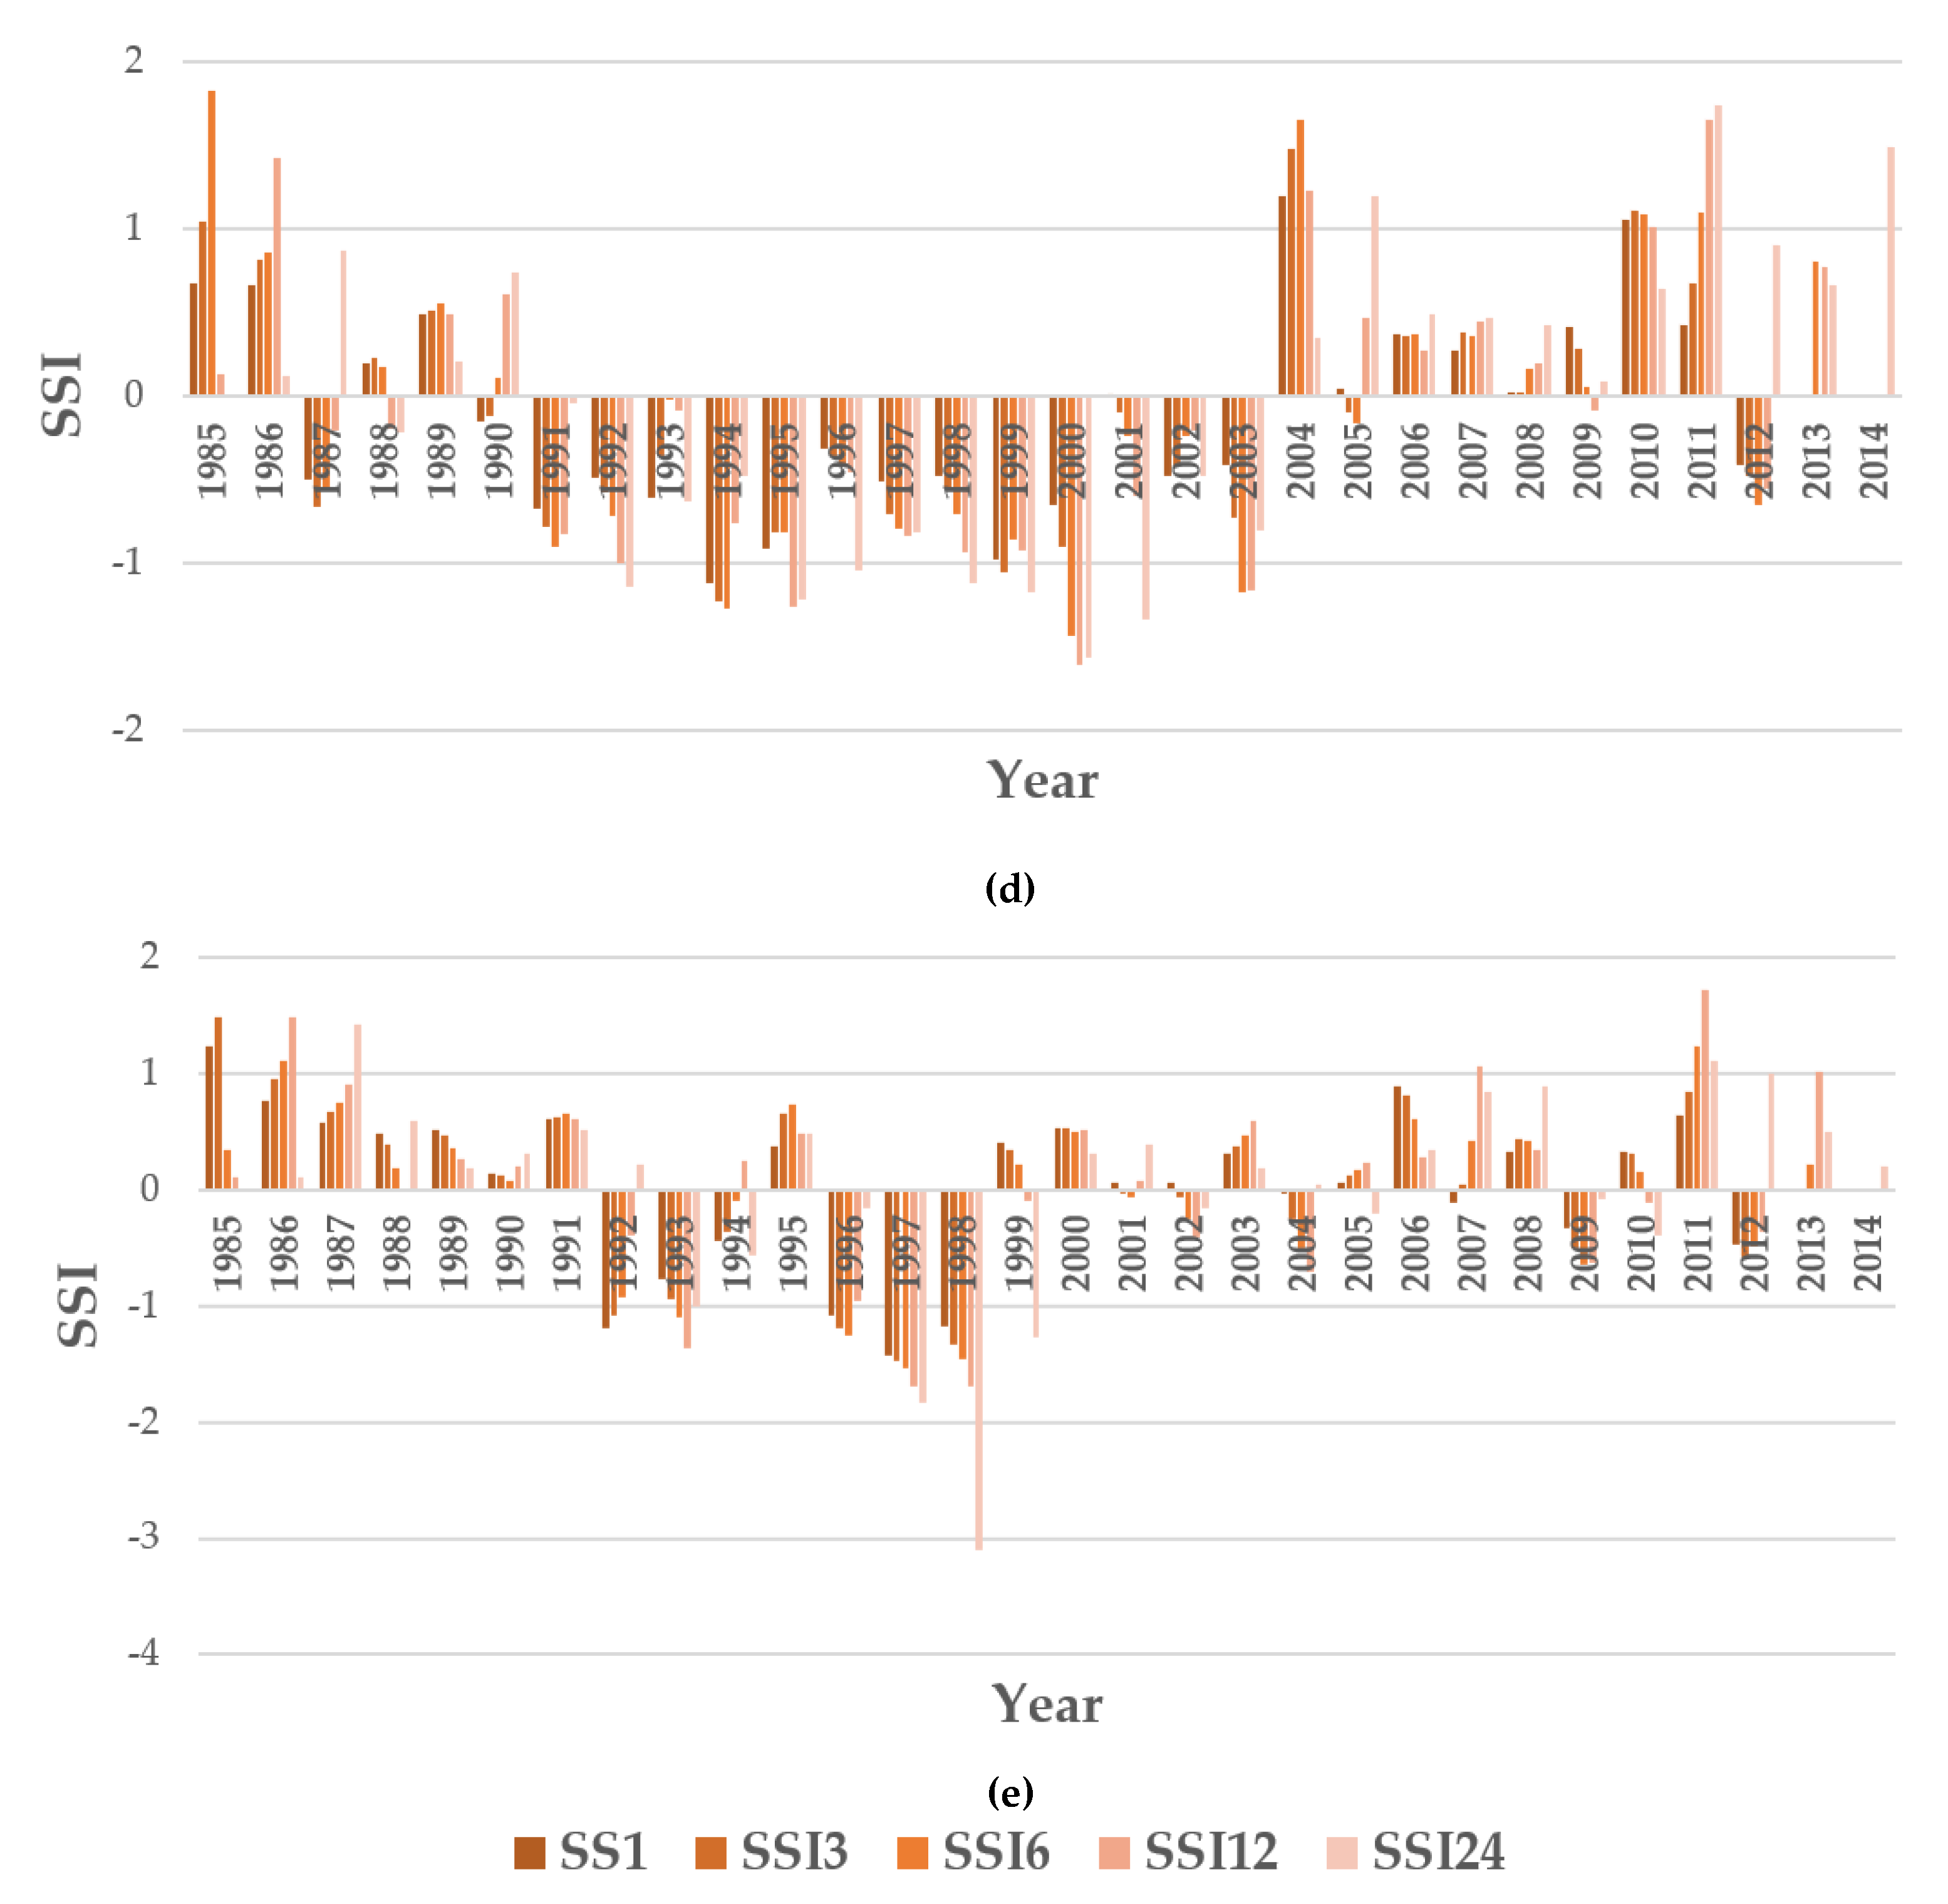
2.4.3. Standardized Streamflow Index (SSI)

The researchers evolved the conventional hydrological drought indices similar to the meteorological drought indices. There are two hydrological drought indices: Standard Streamflow Index (SSI) and Streamflow Drought Index (SDI) having the same theoretical background [39]. Both indices strive to transmute the monthly flow into a standard normal distribution (mean zero and variance of one, similar to the SPI method) and estimate the hydrological drought index. In this study, SSI was used. The stream flow data were used as input data. Similar to SPI, the gamma distribution was utilized to calculate the SSI. The mechanism of SSI is simple and similar to the SPI method. The cumulative flow values for each month are discretely assessed, and SSI is computed on a monthly basis during the 30 years.
Classification of the indices utilized in this study corresponding to the drought severity is shown in Table 2.

2.4.4. Validation of Drought Events

The spatial distribution of results was carried out to obtain the drought events that occurred between 1985 and 2015 using the indices of SPI, SPEI, and SSI, which were further assessed and verified along with previous drought years (1992, 1996, 2000, 2003, 2004, and 2012) identified from the past studies performed in Sri Lanka [25,27,30,41,42].

3. Results

3.1. Comparative Analysis of Meteorological and Hydrological Droughts

The Pearson correlation coefficient was used to assess the correlation between the SPI, SPEI, and SSI indices. Comparisons of meteorological and hydrological drought indices as SPI vs. SSI and SPEI vs. SSI are shown in Table 3 and Table 4, respectively. In the correlation, a positive correlation means that the decrement of rainfall causes the decrements in the streamflow, while the hot or dry conditions in temperature increments drive up the potential evapotranspiration. It reduces the rainfall in the area and consequently, streamflow reduces. As a result, meteorological droughts occurred due to rainfall deficit and high temperature in the basin, causing a hydrological drought throughout the MRB. A negative correlation shows the increments or decrements of rainfall weakly affect increments or decrements in streamflow. In addition, the temperature increments diminish the potential evapotranspiration. As a result, streamflow is increased.
In the correlations of SPI-SSI, the stations of Elahera, Angammedilla, Parakrama Samudra, Giritale, Kaudulla Wewa, and Kantale were correlated with Manampitiya in the dry zone, Rantambe, Victoria, Mapakada Wewa, and Illukkumbura were correlated with Demodara in the intermediate zone, and Ambewela, Kotmale, Katugastota, and Polgolla were correlated with Caledonia, Nawalapitiya, and Peradeniya in the wet zone, which were considered for 1, 3, 6, 12, and 24 months, respectively, as shown in Table 3a–e.
There were correlations among all the stations in the dry zone; Parakrama Samudra–Manampitiya recorded the highest positive correlation of 0.581 in SPI1–SSI1. The lower correlations were recorded in Girithale–Manampitiya, while the lowest correlation was −0.306 recorded for 6 months. All the SPI stations in the dry zone were shown to have lower correlations with Manampitiya for 3 months. In the intermediate zone, Mapakada Wewa was shown to have a maximum correlation of 0.583 with Demodara for 6 months. Most of the time, the correlations of Mapakada Wewa–Demodara were high. The smallest correlation was recorded in Rantabe–Demodara over 1 month as −0.086. All the correlations were low in Mapakada Wewa–Demodara when compared to the other stations. When considering the correlations of the wet zone, the maximum correlation of 0.704 and 0.701 was obtained in Kotmale–Calidonia for 24 and 12 months, respectively. In addition, Katugastota–Nawalapitiya was recorded at 0.622 for 6 months, and Ambewela–Peradeniya was recorded at 0.503 as higher correlations. The lower correlations were obtained in Kotmale–Peradeniya and Polgolla–Peradeniya for all 1, 3, 6, 12, and 24-month correlations. Among those, the lowest correlation was recorded in Kotmale–Peradeniya for 24 months as −0.332. All the SPI stations of Ambewela, Kotmale, Katugastota, and Polgolla were shown to have positive correlations with Peradeniya in the wet zone.
Furthermore, in SPEI–SSI correlations, Trincomalee was correlated with Manampitiya in the dry zone, Badulla and Bandarawela were correlated with Demodara in the intermediate zone and Katugastota and Nuwara Eliya were correlated with Calidonia, Nawalapitiya, and Peradeniya in the wet zone for 1, 3, 6, 12 and 24 months, as shown in Table 4a–e.
The highest correlation was obtained in Trincomalee–Manampitiya as 0.371 for 6 months, while the lowest correlation was 0.258 for 12 months in the dry zone. In the intermediate zone, higher correlations were recorded in Badulla–Demodara. The highest correlation was Badulla–Demodara at 0.423 for 6 months. The correlations of Bandarawela–Demodara were low. The minimum correlation was –0.340 for 24 months. The highest correlation of the wet zone was recorded as 0.515 in Nuwara Eliya–Calidonia for 24 months. The correlations of Katugastota–Calidonia and Katugastota–Peradeniya were comparatively high. The minimum correlation was 0.008 for 3 months in Nuwara Eliya–Perademiya.

3.2. Annual Variations of Drought Events in MRB

In the consideration of annual variations of meteorological drought events in the MRB, a detailed analysis was carried out for each index at five time scales (1, 3, 6, 12, and 24 months) at selected stations (by considering the spatial distribution of stations). SPI variations in the MRB were analyzed at Ambewela, Kotmale, Rantambe, Victoria, Mapakada Wewa, Katugastota, Polgolla, Illukkumbura, Elahera, Angamadilla, Parakrama Samudra, Giritale, Kaudulla Wewa, and Kantale stations.
The extreme dry condition in Ambewela was recorded in 2002 and 2003 (Figure 2a). The maximum dry condition recorded in Kotmale in the wet zone was −2.699, as per Figure 2b. It was recorded as a short-term drought (6 months) in 1985. Furthermore, there was an “extremely dry” condition in 2012 for 12 months. In addition, a “severely dry” condition was recorded for 24 months in 1987. Other than that, in 1985, 1987, 1988, 2004, 2005, and 2012, there were “moderately dry” conditions. The highest dry condition obtained in Rantambe in the intermediate zone was −1.988 (Figure 2c). It was a “severely dry” condition recorded for 24 months in 2010. In addition, there was a “severely dry” condition for 12 months in 2009. Not only that but also, there were “moderately dry” conditions in 1997, 2009, 2010, 2012, and 2014.
Next, in Victoria, in the wet zone, as per Figure 2d, there were “extremely dry” conditions in 6 and 12 months. It was recorded in 2002 as a very high dry condition during the 30 years in that area, showing the values of −2.528 and −2.450. The highest dry condition recorded was −2.569 for 24 months in 2003. The dry condition developed from “moderately dry” to “severely dry” between 1999 and 2002. Moreover, in Mapakada Wewa in the intermediate zone, there was a “severely dry” condition in 1988 for 12 months (Figure 2e). It was recorded in the same condition in the long term with a value of −1.628. Furthermore, there were “moderately dry” conditions in 1989, 1992, 1993, 1997, and 1998.
Further, for Katugastota in the wet zone, there were “severely dry” conditions for 24 months in 2005 (Figure 2f). “Moderately dry” and “severely dry” conditions were recorded in 1987, 1988, 1993, 2004, 2005, and 2012. Polgolla in the wet zone recorded a maximum dry condition of −1.610. It was a “severely dry” condition recorded for 24 months, as shown in Figure 2g. In addition to that, “severely dry” condition was recorded for 24 months in 1992. Furthermore, there were “moderately dry” conditions from 1989 to 1993, 2003 to 2005, 2009, and 2012.
According to Figure 2h, Illukkumbura in the intermediate zone was an “extremely dry” condition for 24 months in 1997. The maximum condition was shown as −2.395. Not only that but also an extreme condition was recorded in 1998. In addition to that, in 1998, 2009, and 2012, there were “moderately dry” conditions. For Elahera in the dry zone, the maximum dry condition was shown as −1.554 for 12 months in 1993 and for 24 months in 1994 (Figure 2i). Not only that but also “moderately dry” conditions were recorded in 1987, 1988, 1997, 1998, 2004, and 2005.
As per the results of Angammedilla in the dry zone, there was an “extremely dry” condition for 24 months in 1997 (Figure 2j). It was “severely dry” for 12 months. It was converted to an extreme condition in 24 months. In 1987 and 1996, there were “moderately dry” conditions, and in 1988 and 1996, they were recorded as “severely dry” conditions. In 1996, moderate conditions occurred for 3 and 6 months. However, it was severe for 12 months. The highest dry condition recorded in Parakrama Samudra in the dry zone was −2.572 (Figure 2k). It was recorded as an “extremely dry” condition in 1997 for 24 months. It developed from −2.197 to −2.572 in 1997 from 12 months to 24 months. In addition, there were “moderately dry” conditions in 1987, 1988, and 1996. There were “severely dry” conditions in 1988 for 24 months and in 1996 for 12 months.
Giritale in the dry zone was recorded as an “extremely dry” condition for 24 months at −3.546 in 1987 (Figure 2l). It was recorded as “moderately dry” from 3 to 12 months and converted into extreme conditions for 24 months. The maximum dry condition recorded was −4.019. It was shown for 12 months in 1986. In addition, there were “moderately dry” and “severely dry” conditions from 1985 to 1989. In Kaudulla Wewa in the dry zone, there was a “severely dry” condition for 12 months in 1992 (Figure 2m). In 3 months, it was recorded as “moderately dry” and developed to a “severely dry” condition in 12 months. It recorded a value of −1.971. In addition to that, in 1993 and from 2002 to 2004, there were “severely dry” and “moderately dry” conditions. Finally, the Kantale tank in the dry zone showed the highest dry condition of −1.460 as a “moderately dry” condition in 1990 (Figure 2n). In addition, there were “moderately dry” conditions in 1988, 1989, 1991, 1992, and 1997.
Bandarawela, Badulla, Nuwara Eliya, Katugastota, and Trincomalee were selected to represent the SPEI variations.
When it comes to Bandarawela in the intermediate zone, “moderately dry” conditions were recorded in 1998 for 12 months as the highest dry condition recorded in that area for 30 years as per Figure 3a. In addition to that for 6 and 24 months, there were “moderately dry” conditions in the same year. Furthermore, in 1996, 1997, 2002, 2003, and 2008, there were “moderately dry” conditions. Badulla in the intermediate zone (Figure 3b) demonstrated a “severely dry” condition by recording the highest dry condition. It was recorded as −1.54 in 1996 as a long-term dry condition. Not only that but also “moderately dry” conditions were recorded for 6 and 12 months in the same year. Furthermore, “moderately dry” conditions were recorded in 1987, 1999, 2004, and 2007 as per the results obtained.
In Katugastota in the wet zone, the maximum dry condition recorded was “extremely dry” in 2000 for 24 months as a long-term effect. (Figure 3c). In addition, there was a “moderately dry” condition in 1999 for 6 months, and it developed to “severely dry” after 12 months, as shown in Figure 3c. Furthermore, it was recorded as “moderately dry” for 24 months in 1999, 12 months in 2000, 12 months in 2004, and 6 months in 2007. Even so, it was recorded as “severely dry” by recording a SPEI-12 value of −1.53 in 2007. Just in Nuwara Eliya in the wet zone, the maximum dry condition recorded was −1.490 in 2007, as shown in Figure 3d. It was recorded as a “moderately dry” condition with a long-term dry condition. Moreover, from 1998 to 2000, 2004, and 2007, “moderately dry” conditions were observed in Nuwara Eliya.
According to Figure 3e in the MRB, a “severely dry” condition was recorded in Trincomalee in the dry zone by showing an SPEI of −1.87 in 2002. It was the highest stage of the drought recorded as a long-term drought in Trincomalee for 24 months. In addition, it was recorded as a “severely dry” condition in SPEI-12 in the same year by recording an index value of −1.82 with a slight decrement. Not only that but also a “severely dry” condition was observed in 2003 for 24 months by showing a SPEI-24 value of −1.56. Furthermore, there were recorded “moderately dry” conditions for 12 months in 1996, 24 months in 1997, 3 and 6 months in 2001, and 12 months in 2009 respectively.
In evaluating the annual variations of hydrological drought events around the MRB, Demodara, Caledonia, Nawalapitiya, Peradeniya, and Manampitiya stations were selected. According to Figure 4a, the highest dry condition was recorded as “extremely dry” for 24 months in 2000 in Demodara in the intermediate zone. In 2000, it was obtained as “moderately dry” for 3 months, “severely dry” for 12 months and finally, it was developed as “extremely dry” for 24 months. In addition, in 1999, the drought condition was observed as “moderately dry” to “extremely dry”. In 1198, there was a “severely dry” condition for 1 month, and it was converted to “moderately dry” for 6 months. Furthermore, a “severely dry” condition was recorded for 24 months in 2001.
As shown in Figure 4b, an “extremely dry” condition was recorded as −2.07 in 24 months in 2004 in Caledonia in the wet zone. The dry period was developed in 2003 from “moderately dry” to “severely dry” by 2005. In 2004 for 12 months and in 2005 for 24 months, “severely dry” conditions were shown. In addition, there were “moderately dry” periods in 2011 and 2012 in that area. In addition, in Nawalapitiya in the wet zone, the maximum dry condition was obtained as a long-term drought for 24 months as “severely dry” in 2002, as shown in Figure 4c. The dry condition of Nawalapitiya has developed in 2001 from “moderately dry” for 12 months to “severely dry” after 24 months. Furthermore, it was recorded as a “moderately dry” condition in 2003 and 2004. In addition, there was a “severely dry” condition for 12 months in 2012. It was converted to a “moderately dry” condition as a short-term drought by 2013.
Nevertheless, it was shown that the maximum dry condition was “severely dry” for 12 months in 2000 in Peradeniya in the wet zone. (Figure 4d). It developed as “moderately dry” from 6 months to “severely dry” within 24 months. Moreover, the “moderately dry” condition was obtained in 1992, 1994, 1995, 1996, 1998, 1999, 2001, and 2003. Manampitiya in the dry zone was shown to have the highest value of −3.09 in 1998 for 24 months. It was an “extremely dry” condition recorded during the 30 years in Manampitiya (Figure 4e). During the 24 months from 1997 to 1998, the dry condition of the area increased from “moderately dry” to “extremely dry” conditions. “Moderately dry” conditions were recorded at 1, 3, and 6 months, and it was recorded as “severely dry” at 12 months. Last, it was recorded as “extremely dry” for 24 months in 1998 (1997 to 1998). Furthermore, the “moderately dry” condition was recorded at 1,3, and 6 months in 1996 as well as 1 and 3 months in 1997, while it was “severely dry” after 6, 12, and 24 months in 1997. In addition, “moderately dry” conditions were obtained at 1 and 3 months in 1992, 6, 12, and 24 months in 1993, and 24 months in 1999 sequentially.

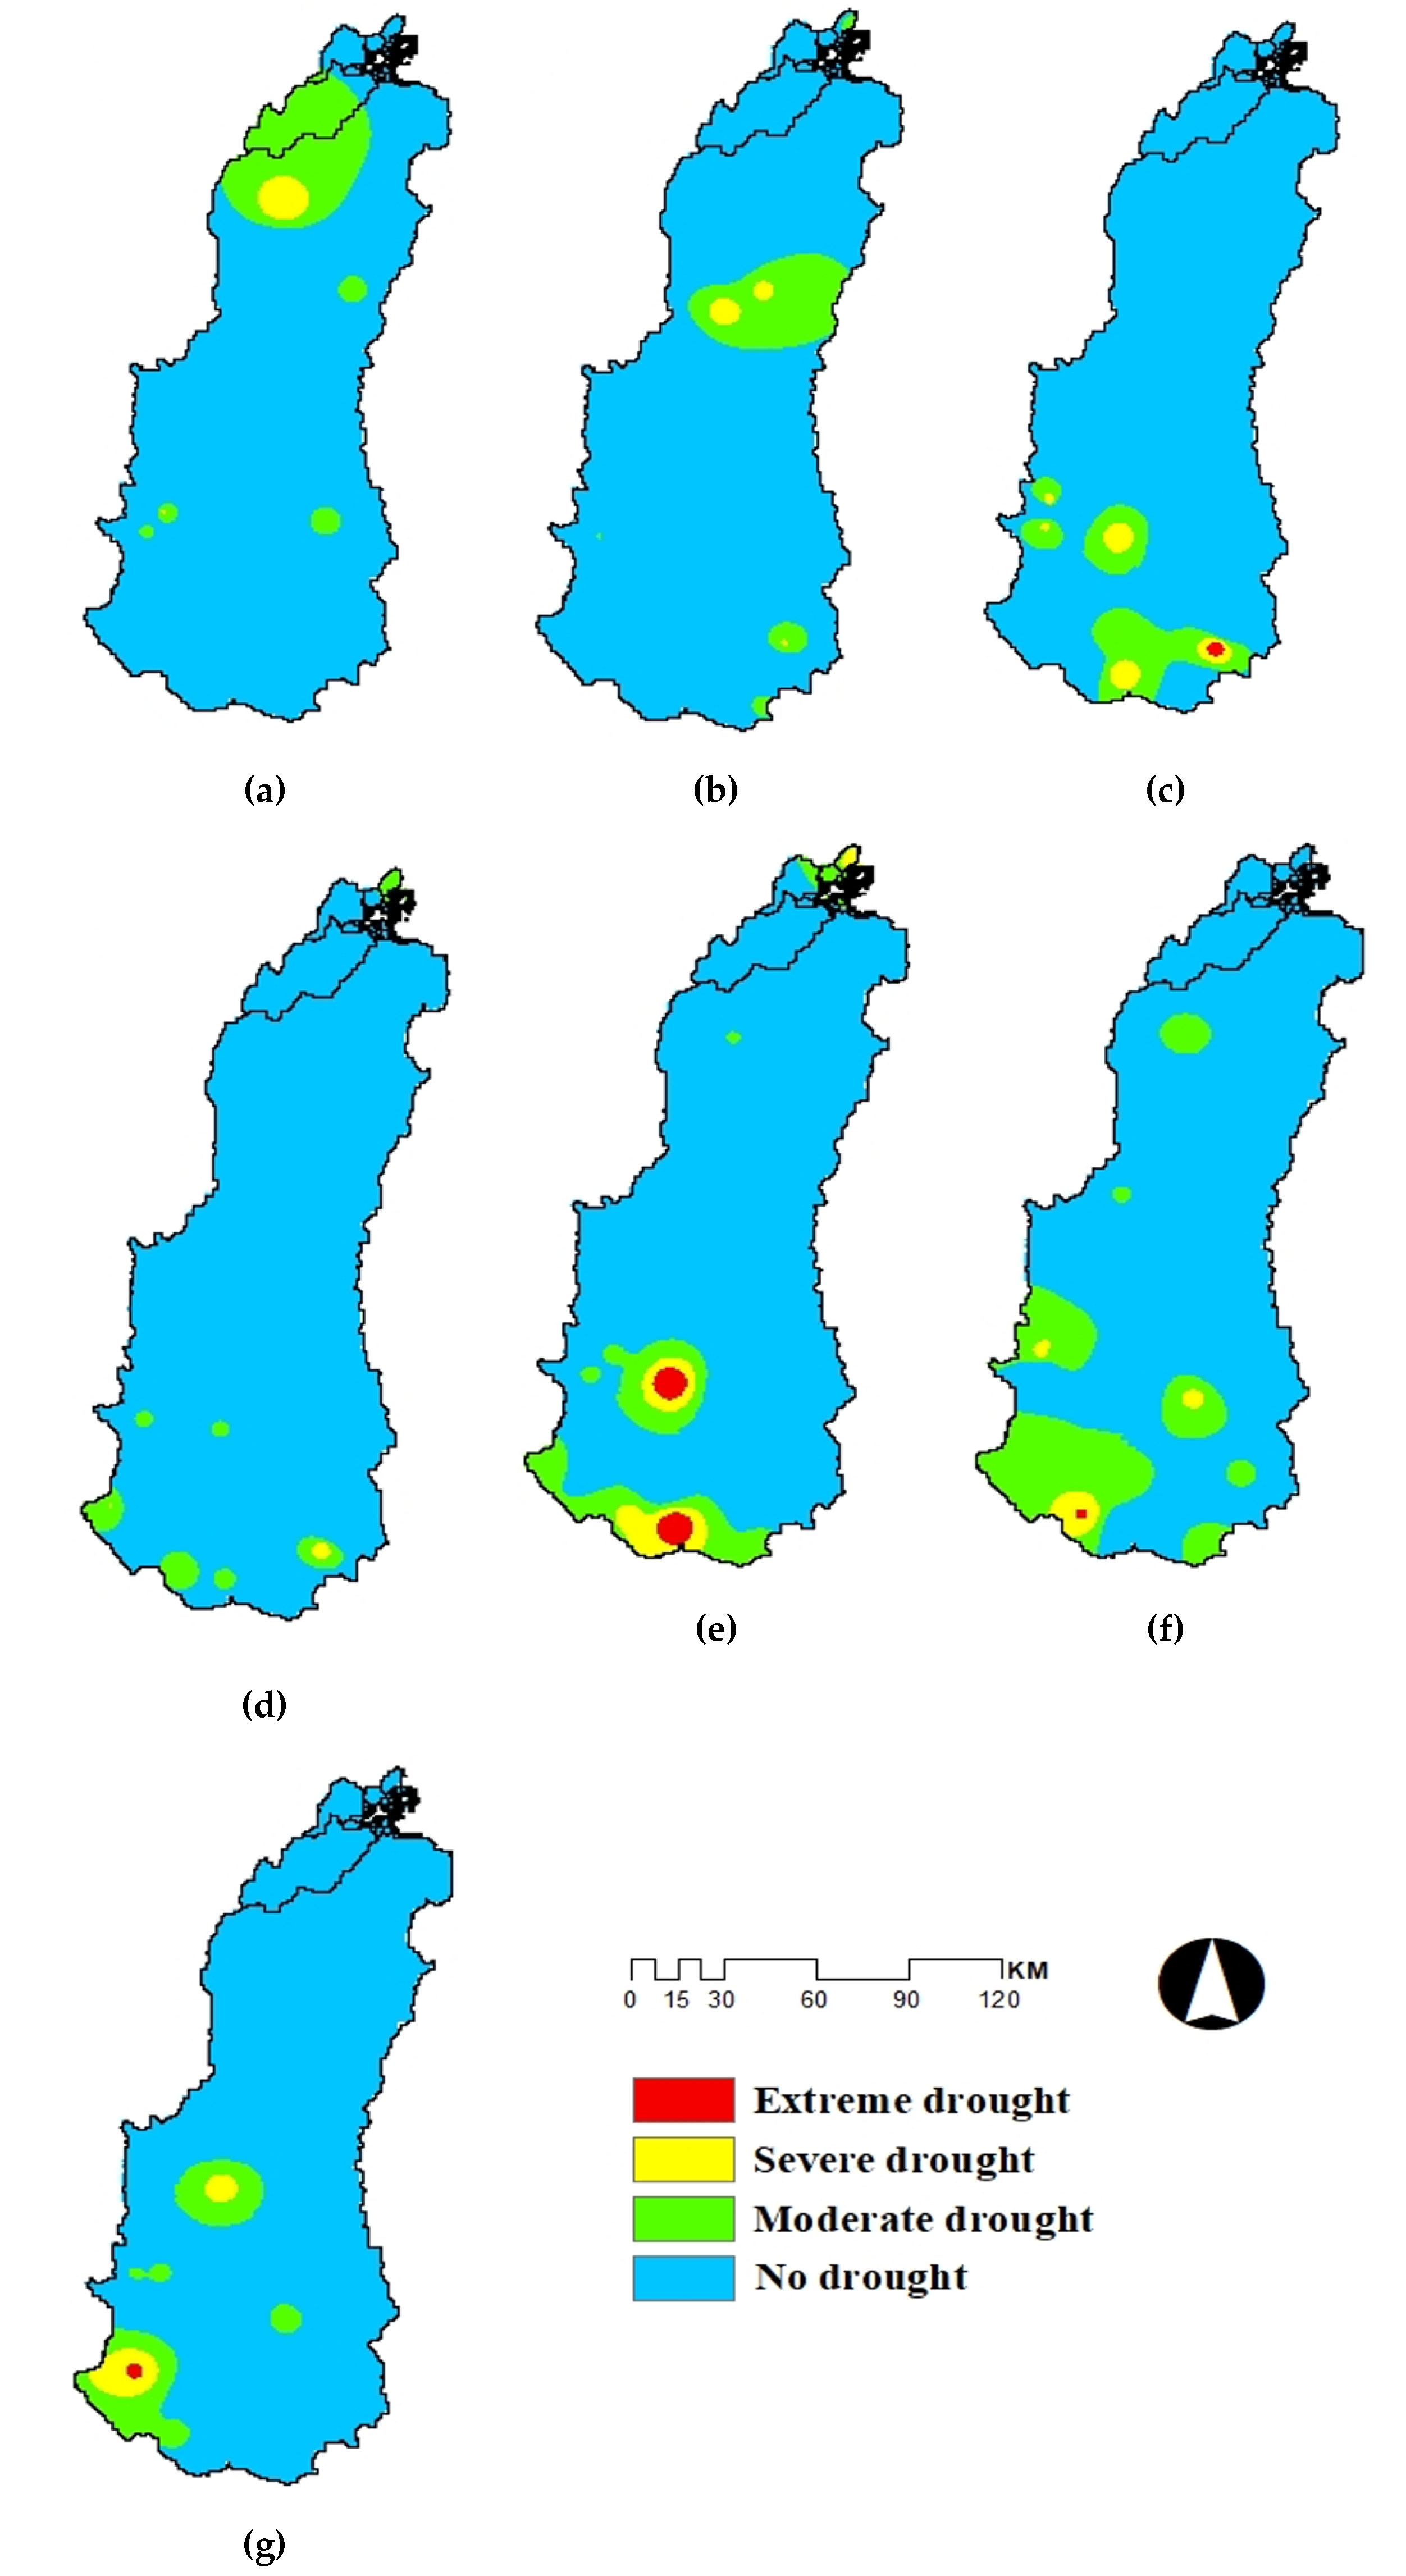
3.3. Spatial Distribution of Drought Indices Using SPI, SPEI, and SSI

According to the spatial distribution results shown in Figure 5a, Kantale tank, Manampitiya, and Kaudulla Wewa in the dry zone as well as Mapakada Wewa, Polgolla, and Peradeniya in the wet zone showed drought conditions in 1992. In Kaudulla Wewa, moderate drought was shown at 3 months while it developed to severe after 6, 12, and 24 months. Similarly, from 3 months to 24 months, drought was converted from moderate condition to severe condition in Polgolla according to the SPI index results. Kantale tank showed a moderate drought after 12 and 24 months. Nevertheless, the condition was moderately drought for 12 months in Mapakada Wewa. Manampitiya was shown to have moderately dry conditions in SSI1 and SSI3 during short-term droughts. Finally, Peradeniya obtained moderate dry conditions in the long term after 12 and 24 months as per SSI index results. Therefore, our analysis showed that in 1992, a moderate/severe drought occurred downstream of the MRB (in the dry zone), and there was a moderate hydrological drought in some of the dry and wet zone areas.
Further, Figure 5b shows the spatial distribution of 1996. In 1996, Angammedilla in the dry zone showed moderate drought and it developed to a severe drought from 3 months to 12 months. Figure 5b shows the spatial distribution of 1996. In Parakrama Samudra in the dry zone, there was a moderate drought after 6 months and 24 months while it had a severe drought after 12 months. As same as Angammedilla, Badulla in the intermediate zone showed a moderate drought and it increased to severe drought from 6 months to 24 months. In Bandarawela in the intermediate zone, it was a moderate drought in SPEI24 as a long-term drought condition. Moreover, Trincomalee in the dry zone showed a moderate drought after 12 months. As a short-term drought, Manampitiya in the dry zone showed moderate drought from 1 month to 6 months. At last, Peradeniya in the wet zone was obtained as a moderate drought in SSI24 as per SSI index results. Accordingly, our results revealed that moderate drought occurred in the downstream (in the dry zone and some of the intermediate zone areas) and the upstream (in the wet zone and some of the intermediate zone areas) areas of the MRB in 1996.
In addition, there were moderate drought conditions in Victoria in the intermediate zone and Ambewela in the wet zone in 2000 in SPI12, and it was a severe drought in SPI 24. Figure 5c shows the spatial distribution of 2000. According to SPEI, a moderate drought in Katugastota in the wet zone at 12 months developed to an extreme drought at 24 months. In addition, Nuwara Eliya in the wet zone obtained a moderate drought condition for 24 months in 2000. Finally, when considering the SSI, a moderate drought condition increased to severe drought from 3 months to 12 months while it developed to an extreme drought by 24 months in Demodara in the intermediate zone. In Peradeniya in the wet zone, moderate drought conditions evolved as a severe drought from 3 months to 12 months in the same year. Consequently, severe/extreme droughts were identified in the intermediate zone, while moderate/severe droughts were identified in the wet zone in 2000.
Figure 5d shows the spatial distribution of 2001. Victoria and Ambewela in the wet zone also recorded a moderate drought not only in 2001 but also at 24 months. For Trincomalee in the dry zone, moderate drought was obtained from 3 to 6 months. As per the SSI results, Caledonia in the wet zone faced moderate drought conditions at 12 and 24 months. It was a severe drought in Demodara in the intermediate zone for 24 months in 2001. The moderate drought condition increased to a severe drought from 12 months to 24 months in Nawalapitiya in the wet zone. In addition, moderate drought was recorded in SSI24 in Peradeniya in the wet zone. Therefore, in 2001, the results showed that moderate drought occurred downstream (in the dry zone areas) and moderate/severe droughts occurred upstream (in the wet zone and some of the intermediate zone areas) of the MRB.
In 2003, Victoria and Ambewela in the wet zone recorded an extreme drought in 24 months by recording a value of −2.57 and severe droughts in 12 months by recording a value of −1.6. Figure 5e shows the spatial distribution of 2003. Kaudulla Wewa in the dry zone and Polgolla in the wet zone recorded moderate droughts. As per the SPEI index results, Bandarawela in the intermediate zone showed a moderate drought for 6 months, and Trincomalee in the dry zone showed a severe drought for 24 months. In addition, Caledonia in the wet zone showed a moderate drought for 1 month and it developed over 3, 6, and 12 months; lastly, a severe drought occurred at 24 months. Moderate droughts were recorded at 6 and 12 months in Peradeniya in the wet zone. Consequently, the results showed that moderate/severe drought occurred in the dry zone, moderate droughts occurred in the intermediate zone and moderate/severe/extreme droughts occurred in the wet zone areas of the MRB in 2003.
Figure 5f shows the spatial distribution of the drought in 2004. Moreover, in 2004, moderate drought conditions occurred in the Kaudulla Wewa in the dry zone for 12 and 24 months. In addition, Elahera in the intermediate zone showed a moderate drought in 12 months while Rantambe in the intermediate zone had a severe drought in SPI12. Moderate drought occurred at 6 and 24 months in Katugastota in the wet zone, but it was severe at 12 months. In Polgolla in the wet zone, there was a moderate drought for 24 months. According to the SPI results for Kotmale in the wet zone, at 12 and 24 months, and with respect to the SPEI results in Badulla and Bandarawela in the intermediate zone at 12 months and at 12 and 24 months, respectively, Katugastota, Nuwara Eliya, and Nawalapitiya recorded moderate droughts in the wet zone at 12 months, at 6, 12 and 24 months and at 24 months, respectively, as per SSI results. At last, Caledonia in the wet zone shows a moderate drought at 6 months and it developed to severe at 12 months and extreme at 24 months in 2004. Hence, our results can be summarized as moderate drought observed in the dry zone, moderate/severe droughts observed in the intermediate zone, and moderate/severe/extreme droughts observed in the wet zone in 2004.
Figure 5g shows the spatial distribution of 2012. A severe drought occurred in Illukkumbura in the intermediate zone for 12 months. According to the SPI results, moderate droughts were obtained at 12 months in Rantambe in the intermediate zone as well as Katugastota and Polgolla in the wet zone. In Kotmale in the wet zone, it was moderate at 6 months and evolved to an extreme drought at 12 months. In addition, moderate drought conditions were observed in Caledonia in the wet zone in SSI6 and SSI12, while it was severe for 24 months in Nawalapitiya in the wet zone. Therefore, in 2012, moderate droughts occurred upstream (in the wet zone), and moderate/severe/extreme droughts were found in the intermediate zone of the MRB.

4. Discussion

In this study, we were mainly focused on finding out the correlation between meteorological and hydrological droughts as one major finding. In that case, SPI–SSI and SPEI–SSI correlations were conducted, and results are shown in Table 3a–e and Table 4a–e. Most of the correlations between SPI and SSI in the dry zone were positive. The stations of Elahera, Angamadilla, Parakrama Samudra, and Kantale show only positive correlations in short-term and long-term droughts. The correlation between Girithale–Manampitiya was the weakest in a long-term drought. Furthermore, in the intermediate zone, Victoria, Mapakada Wewa, and Illukkumbura showed positive correlations with Demodara at all times (Table 3b). There were moderate correlations between Rantambe–Demodara in the short term, but the long-term correlation (24 months) was weak. Moreover, in the wet zone, Ambewela, Kotmale, Katugastota, and Polgolla were more strongly correlated with Nawalapitiya than the other SSI stations. Although Kotmale showed the highest correlation with Calidonia, the short-term correlation of it was negative. The correlations between Kotmale–Peradeniya and Polgolla–Peradeniya were lower when compared to the other stations. The SPI–SSI correlations ranged from 0.8 to −0.3: from strong to weak. Most of the correlations were moderate. However, the majority of the correlations ranged from moderate to low. The reason for the fewer number of negative correlations could be the surface storage along the Mahaweli River. In addition, the reservoir filling and decreasing do not always follow the rainfall pattern.
As shown in Table 4a, all the correlations were positive in SPI and SSI in Trincomalee–Manampitiya in the dry zone. In addition, Badulla in the intermediate zone was correlated more strongly with Demodara than Bandarawel. All the correlations of Bandarawela–Demodara were weak. Furthermore, in the wet zone, Nuwara–Eliya–Calidonia, Katugastota–Calidonia, and Katugastota–Peradeniya showed strong positive correlations when compared with other stations. The weakest correlations were obtained in Nuwara–Eliya–Peradeniya in the wet zone. Although high correlations were observed in the dry zone, the most prominent correlations were obtained in the intermediate and wet zones. The correlations between SPEI and SSI in the Mahaweli River Basin were between 0.5 and −0.3. Therefore, the SPEI–SSI correlations in the wet zone ranged from moderate to low. Although high temperatures are attributed to lower streamflow, some negative correlations were found, which shows the weak relationship between temperature and streamflow. Thereby, sometimes, the high temperatures do not affect lowering the streamflow, while decrements in temperatures do not cause an increase in the streamflow.
As our next major finding, annual variations were assessed to find out the nature of the droughts that occurred in three climatic zones of the MRB as shown in Figure 2, Figure 3 and Figure 4. According to the SPI results, the extreme droughts mainly occurred in Girithale in the dry zone as a long-term (12 months) drought. In addition to that, Illukkumbura and Parakrama Samudra in the dry zone obtained extreme dry conditions (Figure 2a–n). Furthermore, Angamadilla and Victoria in the intermediate zone recorded extreme droughts, while Kotmale in the wet zone recorded extreme drought within 30 years. Although severe and moderate droughts occurred in other selected SPI stations, the extreme drought observed in the dry zone was notable. As per the results of SPEI shown in Figure 3a–e, the extreme drought has occurred over a long term (24 months) in the wet zone in Katugastota. Trincomalee in the dry zone and Badulla in the intermediate zone experienced severe droughts for 30 years intermittently. Nuwara Eliya in the wet zone and Bandarawela in the intermediate zone observed moderate droughts. However, a prominent drought was observed in the wet zone with respect to the SPEI. Finally, when considering the SSI results in Figure 4a–e, the maximum drought event of extreme conditions was recorded in Manampitiya in the dry zone as a long-term (24 months) dry condition. In addition, Demodara in the intermediate zone and Calidonia in the wet zone observed severe droughts as the highest dry conditions. In addition, Nawalapitiya and Peradeniya in the wet zone obtained moderate droughts during the 30 years. As mentioned previously in correlations, although the wet zone faced extremely dry conditions during the 30 years, the effects of droughts were mainly in the dry zone.
Nevertheless, the last finding of our study was identifying the drought years using spatial distribution and comparison with past studies performed on drought assessments. In that case, 2004 and 2012 were drought years according to the report of the Central Bank [43]. In addition, in 1992, 1996, and 2012, there were moderate droughts, and in 2000, 2001, and 2003, severe droughts were identified, and some extreme droughts were identified in 2004 [41,42]. Similarly, according to our results, moderate droughts in the dry zone, moderate and severe droughts in the intermediate zone, and moderate, severe, and extreme droughts in the wet zone were observed in 2003. Then moderate droughts in the wet zone and moderate, severe, and extreme droughts in the intermediate zone were found in 2012. Furthermore, moderate drought was identified in the dry and wet zone areas in 1992, in all three zones in 1996, and in the wet and intermediate zones in 2012. Finally, severe droughts were observed in wet and intermediate zones in 2000, in the wet zone and some of the intermediate zone areas in 2001, and in the dry and wet zones in 2003. Therefore, it was proven that the maximum number of stations faced dry conditions in 2004 in all three climatic zones in the MRB. In addition, a higher number of stations were confronted with dry conditions when compared to other stations, in 2003 during the 30 years, and extreme droughts were obtained in 2000, 2003, and 2004 most prominently as shown in Figure 5.
Overall, Sri Lanka is well noted as an agricultural country with a lot of water-sensitive varieties of cash crops. Some vegetables and their varieties are only grown in one part of the country due to their water sensitivity. In addition, cash crops such as tea and rubber are highly sensitive to changing climates. Therefore, the findings of this research can be effectively used by the authorities for the planning stages of future agricultural work under different zones with seasonal impacts.

5. Conclusions

This study was carried out mainly to explore the link between meteorological and hydrological droughts, secondly to find out the drought events in three climatic zones of the MRB and finally to identify the drought years during the 30 years selected. In order to find the link, a comparative evaluation was carried out using SPI, SPEI, and SSI drought indices. In addition, the drought events were identified between 1985 and 2015 using an annual distribution of data. Finally, spatial distribution was carried out using SPI, SPEI, and SSI index results and validated those using the drought events that occurred in the past.
According to the results of Pearson correlation in SPI–SSI and SPEI–SSI, the strong correlations between meteorological and hydrological droughts were mostly observed in the wet zone than in the other two zones (viz, intermediate and dry). In addition, according to the annual variations of SPI, SPEI, and SSI, the highest effects of the drought were obtained in Girithale and Manampitiya in the dry zone and Katugastota in the wet zone. As proven in the previous studies [44], drought is one of the most important climatic hazards in dry and intermediate zones; the most extreme results were found in the dry zone. Although the droughts obtained in the dry zone were highest, the index results were most prominent in the wet zone in the period of 1985 and 2015 with respect to both correlations. Moreover, the years 2000, 2003, and 2004 were identified as the highest number of dry conditions that occurred (extreme drought years) during the 30 years.
As we identified, the rainfall deficit and the length of the period of dryness affected the occurrence of meteorological drought, while the lack of rainfall on the water supply to the streamflow caused the occurrence of hydrological droughts. This study results can be used by local authorities and also by organizations tasked with drought risk management, policymaking, and mitigating drought impacts if modernized information is made available to users in the future. In addition, annual variations of drought can be developed for drought predictions that can be absorbed with drought hazard early warning systems.

Author Contributions

Conceptualization, J.S. and M.B.G.; methodology, U.S.; software, U.S.; validation, U.S.; formal analysis, U.S.; resources, J.S., M.B.G. and U.R.; data curation, U.S.; writing—original draft preparation, U.S.; writing—review and editing, J.S., M.B.G., N.M. and U.R.; supervision, J.S., M.B.G. and U.R; project administration, U.R.; All authors have read and agreed to the published version of the manuscript.

Funding

This research received no external funding.

Data Availability Statement

The meteorological data and water level data used in this research work can be requested by corresponding authors only for research purposes.

Conflicts of Interest

The authors declare no conflict of interest.

References

  1. Wilhite, D.A. Drought as a Natural Hazard; Drought Mitigation Center Faculty: Lincoln, NE, USA, 2000. [Google Scholar]
  2. Dai, A. Drought under global warming: A review. Wiley Interdiscip. Rev. Clim. Chang. 2011, 2, 45–65. [Google Scholar] [CrossRef] [Green Version]
  3. Mishra, A.K.; Singh, V.P. Drought modeling—A review. J. Hydrol. 2011, 403, 157–1975. [Google Scholar] [CrossRef]
  4. Mallya, G.; Mishra, V.; Niyogi, D.; Tripathi, S.; Govindaraju, R.S. Trends and variability of droughts over the Indian monsoon region. Weather Clim. Extrem. 2016, 12, 43–68. [Google Scholar] [CrossRef] [Green Version]
  5. Spinoni, J.; Naumann, G.; Vogt, J.V. Pan-European seasonal trends and recent changes of drought frequency and severity. Glob. Planet. Chang. 2017, 148, 113–130. [Google Scholar] [CrossRef]
  6. Sharma, J.; Ravindranath, N.H. Applying IPCC 2014 framework for hazard-specific vulnerability assessment under climate change. Env. Res. Commun. 2019, 1, 051004. [Google Scholar] [CrossRef]
  7. Vicente-Serrano, S.M.; López-Moreno, J.I.; Gimeno, L.; Nieto, R.; Morán-Tejeda, E.; Lorenzo-Lacruz, J.; Beguería, S.; Azorin-Molina, C. A multiscalar global evaluation of the impact of ENSO on droughts. J. Geophys. Res. 2016, 116, 1–23. [Google Scholar] [CrossRef] [Green Version]
  8. Wilhite, D.A.; Glantz, M.H. Understanding: The drought phenomenon: The role of definitions. Water Int. 2013, 10, 111–120. [Google Scholar] [CrossRef] [Green Version]
  9. Morid, S.; Smakhtin, V.; Moghaddasi, M. Comparison of seven meteorological indices for drought monitoring in Iran. Int. J. Climatol. 2006, 26, 971–985. [Google Scholar] [CrossRef]
  10. Palmer, W.C. Meteorological Drought; Weather Bureau: Washington, DC, USA, 1965. [Google Scholar]
  11. McKee, T.B.; Doesken, N.J.; Kleist, J. The Relationship of Drought Frequency and Duration to Time Scales. Appl. Climatol. 1993, 17, 179–183. [Google Scholar]
  12. Tsakiris, G.; Pangalou, D.; Vangelis, H. Regional Drought Assessment Based on the Reconnaissance Drought Index (RDI). Water Resour. Manag. 2007, 21, 821–833. [Google Scholar] [CrossRef]
  13. Vicente-Serrano, S.M.; Begueria, S.; Per-Moreno, J.I. A Multiscalar Drought Index Sensitive to Global Warming: The Standardized Precipitation Evapotranspiration Index. J. Clim. 2010, 23, 1696–1718. [Google Scholar] [CrossRef] [Green Version]
  14. Wang, D.; Hejazi, M.; Cai, X.; Valocch, A.J. Climate change impact on meteorological, agricultural, and hydrological drought in central Illinois. Water Resour. Res. 2011, 47, 1–13. [Google Scholar] [CrossRef] [Green Version]
  15. Maskey, S. Hydrological Modeling for Drought Assessment. In Hydro-Meteorological Hazards, Risks and Disasters; Elsevier: Amsterdam, The Netherlands, 2015; pp. 263–282. [Google Scholar]
  16. Edossa, D.C.; Babel, M.S.; Gupta, D.A. Drought Analysis in the Awash River Basin, Ethiopia. Water Resour Manag. 2010, 24, 1441–1460. [Google Scholar] [CrossRef]
  17. Wu, J.; Chen, X.; Yao, H.; Zhang, D. Multi-timescale assessment of propagation thresholds from meteorological to hydrological drought. Sci. Total Environ. 2021, 765, 144232. [Google Scholar] [CrossRef]
  18. Tokarczyk, T.; Szalińska, W. Combined analysis of precipitation and water deficit for drought hazard assessment. Hydrol. Sci. J. 2014, 59, 1675–1689. [Google Scholar] [CrossRef] [Green Version]
  19. Wu, J.; Chen, X.; Yao, H.; Gao, L.; Chen, Y.; Liu, M. Non-linear relationship of hydrological drought responding to meteorological drought and impact of a large reservoir. J. Hydrol. 2017, 551, 495–507. [Google Scholar] [CrossRef]
  20. Tigkas, D.; Vangelis, H.; Tsakiris, G. Drought and climatic change impact on streamflow in small watersheds. Sci. Total Environ. 2012, 440, 33–41. [Google Scholar] [CrossRef] [PubMed]
  21. Azareh, A.; Rahdari, M.R.; Sardoii, R.E.; Moghadam, F.A. Investigate the relationship between hydrological and meteorological droughts in Karaj dam Basin. Eur. J. Exp. Biol. 2014, 4, 102–107. [Google Scholar]
  22. UNDRR. Disaster Risk Reduction in Sri Lanka; UN Office for Disaster Risk Reduction: Geneva, Switzerland, 2019. [Google Scholar]
  23. Asian Development Bank. Climate Risk Country Profile; World Bank Group: Washington, DC, USA, 2020. [Google Scholar]
  24. Eckstein, D.; Kunzel, V.; Schafer, L. Global Climate Risk Index 2021; Germanwatch: Bonn, Germany, 2012; pp. 1–50. [Google Scholar]
  25. Gunda, T.; Hornberger, G.M.; Gilligan, J.M. Spatiotemporal Patterns of Agricultural Drought in Sri Lanka: 1881–2010. Int. J. Climatol. 2016, 36, 563–575. [Google Scholar] [CrossRef]
  26. Lyon, B.; Zubair, L.; Ralapanawe, V.; Yahiya, Z. Finescale Evaluation of Drought in a Tropical Setting: Case Study in Sri Lanka. Appl. Meteorol. Climatol. 2009, 48, 77–88. [Google Scholar] [CrossRef]
  27. Lin, Z.; Shelton, S. Interdecadal Change of Drought Characteristics in Mahaweli River Basin of Sri Lanka and the Associated Atmospheric Circulation Difference. Front. Earth Sci. 2020, 8, 306. [Google Scholar] [CrossRef]
  28. Withanachchi, S.S.; Köpke, S.; Withanachchi, C.R.; Pathiranage, R.; Ploeger, A. Water Resource Management in Dry Zonal Paddy Cultivation in Mahaweli River Basin, Sri Lanka: An Analysis of Spatial andTemporal Climate Change Impacts and Traditional Knowledge. Climate 2014, 2, 329–354. [Google Scholar] [CrossRef]
  29. Shelton, S.; Lin, Z. Streamflow variability in Mahaweli river basin of Sri Lanka during 1990–2014 and its possible mechanisms. Water 2019, 11, 2485. [Google Scholar] [CrossRef] [Green Version]
  30. Neves, J. Compute SPI Index using R, Josemir Neves. 2012. Available online: https://cran.microsoft.com/snapshot/2015-07-09/web/packages/spi/spi.pdf (accessed on 1 November 2022).
  31. Begueria, S.; Vicente-Serrano, S.M. Calculation of the Standardised Precipitation-Evapotranspiration Index, Santiago Begueria; CiteSeerX Pennsylvania State University: State College, PA, USA, 2017. [Google Scholar]
  32. R-Tools Technology Inc. User Manual-RStudio; R-Tools Technology: Richmond Hill, ON, Canada, 2023. [Google Scholar]
  33. Smakhin, V.U.; Hughes, D.A. Review, Automated Estimation and Analyses of Drought Indices in South Asia; International Water Management Institute: Colombo, Sri Lanka, 2004. [Google Scholar]
  34. Guttman, N.B. Comparing the Palmer Drought Index and the Standardized Precipitation Index. J. Amarican Water Resour. Assos. 1998, 34, 113–121. [Google Scholar] [CrossRef]
  35. Tirivarombo, S.; Osupile, D.; Eliasson, P. Drought Monitoring and Analysis: Standardised Precipitation Evapotranspiration Index (SPEI) and Standardised Precipitation Index (SPI). Phys. Chem. Earth 2018, 106, 1–10. [Google Scholar] [CrossRef]
  36. Hernandez, E.A.; Uddameri, V. Standardized precipitation evaporation index (SPEI)-based drought assessment in semi-arid south Texas. Environ. Earth Sci. Vol. 2014, 71, 2491–2501. [Google Scholar] [CrossRef]
  37. Thornthwaite, C.W. An Approach toward a Rational Classification of Climate. Am. Geogr. Soc. 1948, 38, 55–94. [Google Scholar]
  38. Byakatonda, J.; Parida, B.P.; Kenabatho, P.K.; Moalafhi, D.B. Modeling Dryness Severity using Artificial Neural Network at the Okavango Delta, Bostwana. Glob. NEST J. 2016, 18, 463–481. [Google Scholar]
  39. Shukla, S.; Wood, A.W. Use of a standardized runoff index for characterizing hydrologic drought. Geogr. Res. Lett. 2007, 35, 1–7. [Google Scholar] [CrossRef] [Green Version]
  40. Doesken, N.; Mckee, T.; Leist, J. The relationship of drought frequency and duration to time scales. In Proceedings of the 8th Conference on Applied Climatology, Anaheim, CA, USA, 17–22 January 1993. [Google Scholar]
  41. Abeysingha, N.S.; Rajapaksha, U.R.L.N. SPI-Based Spatiotemporal Drought over Sri Lanka. Adv. Meteorol. 2020, 2020, 9753279. [Google Scholar] [CrossRef] [Green Version]
  42. Alahacoon, N.; Edirisinghe, M.; Ranagalage, M. Satellite-Based Meteorological and Agricultural Drought Monitoring for Agricultural Sustainability in Sri Lanka. Sustainability 2021, 13, 3427. [Google Scholar] [CrossRef]
  43. Central Bank. Annual Reports; Central Bank Sri Lanka: Colombo, Sri Lanka, 2015. [Google Scholar]
  44. Zubair, L.; Ralapanawe, V.; Tennakoon, U.; Yahiya, Z.; Perera, R. Natural disaster risks in Sri Lanka: Mapping hazards and risk hotspots. In Natural Disaster Hotspots Case Studies; The World Bank Hazard Management Unit: Washington, DC, USA, 2006. [Google Scholar]
Figure 1. Study area of the Mahaweli River Basin.
Climate 11 00057 g001
Figure 2. Annual variations according to the SPI in MRB from 1985 to 2015: (a) For Ambewela; (b) For Kotmale; (c) For Rantambe; (d) For Victoria; (e) For Mapakadawawa; (f) For Katugastota; (g) For Polgolla; (h) For Illukumbura; (i) For Elehara; (j) For Angamadilla; (k) For Parakramsamudraya. (l) For Giritale; (m) For Kaudulla Wewa; (n) For Kantale.
Climate 11 00057 g002aClimate 11 00057 g002bClimate 11 00057 g002cClimate 11 00057 g002d
Figure 3. Annual variations according to the SPEI in MRB from 1985 to 2015: (a) For Bandarawela; (b) For Badulla; (c) For Nuwara-Eliya; (d); For Katugastota; (e) For Trincomalee.
Climate 11 00057 g003aClimate 11 00057 g003b
Figure 4. Annual variations according to the SSI in MRB from 1985 to 2015: (a) For Demodara; (b) For Caledonia; (c) For Nawalapitiya; (d); For Peradeniya; (e) For Manampitiya.
Climate 11 00057 g004aClimate 11 00057 g004b
Figure 5. Spatial distribution of meteorological and hydrological droughts using SPI, SPEI, and SSI in MRB for previously recorded drought years: (a) For 1992; (b) For 1996; (c) For 2000; (d) For 2001; (e) For 2003; (f) For 2004; (g) For 2012.
Climate 11 00057 g005
Table 1. Selected stations for the study.
Drought IndexStationLatitude (°)Longitude (°)
SPIAmbewela6.8780.80
Kotmale7.0680.60
Rantambe7.2080.95
Victoria7.2480.79
Mapakada Wewa7.2981.03
Katugastota7.3280.62
Polgolla7.3280.65
Illukkumbura7.5480.80
Elahera7.7380.79
Angammedilla7.8686.91
Parakrama Samudra7.9181.00
Giritale8.0080.92
Kaudulla Wewa8.1480.93
Kantale tank8.3781.00
SPEIBandarawela6.8381.00
Badulla6.9981.05
Nuwara Eliya6.9780.77
Katugastota7.3280.62
Trincomalee8.5981.22
SSIDemodara6.9481.03
Caledonia6.9080.70
Nawalapitiya7.0580.53
Peradeniya7.2780.61
Manampitiya7.9181.09
Table 2. Classification of drought indices [40].
Drought CategorySPI, SPEI, and SSI
Extremely wet>2
Very wet1.5 to1.99
Moderately wet1 to 1.49
Near Normal−0.99 to 0.99
Moderately dry−1 to −1.49
Severely dry−1.5 to −1.99
Extremely dry −2
Table 3. (a) to (e). Pearson Correlation Coefficient between SPI and SSI indices for 1, 3, 6, 12, and 24 months, respectively, in the Mahaweli River Basin. (The maximum correlation coefficients are highlighted).
(a)
Manampitiya SPI1–SSI1SPI3–SSI3SPI6–SSI6SPI12–SSI12SPI24–SSI24
Elahera0.3150.0300.2970.5470.388
Angamadilla0.4620.0630.4020.4630.390
Parakrama Samudra0.5810.0320.1920.4810.431
Giritale0.204–0.209–0.306–0.237–0.215
Kaudulla Wewa0.2500.1160.2560.385–0.216
Kantale0.3360.1580.3340.4560.327
(b)
Demodara SPI1–SSI1SPI3–SSI3SPI6–SSI6SPI12–SSI12SPI24–SSI24
Rantambe 0.1060.4460.1890.271–0.086
Victoria0.2080.1470.3230.3790.403
Mapakada Wewa0.6050.1690.5880.4470.532
Illukkumbura0.0960.3400.2910.1380.106
(c)
CaledoniaSPI1–SSI1SPI3–SSI3SPI6–SSI6SPI12–SSI12SPI24–SSI24
Ambewela0.2080.4450.5160.5140.575
Kotmale–0.2700.3870.2030.7010.704
Katugastota0.0530.4920.6090.5850.429
Polgolla–0.1550.4950.4690.5720.450
(d)
NawalapitiyaSPI1–SSI1SPI3–SSI3SPI6–SSI6SPI12–SSI12SPI24–SSI24
Ambewela0.5580.5610.1740.4120.503
Kotmale0.5210.5020.5310.5180.332
Katugastota0.3960.4490.6220.5870.577
Polgolla0.3480.3590.2340.3670.318
(e)
PeradeniyaSPI1–SSI1SPI3–SSI3SPI6–SSI6SPI12–SSI12SPI24–SSI24
Ambewela0.5030.4440.4410.4510.483
Kotmale–0.010–0.159–0.010–0.047–0.332
Katugastota0.3350.2940.3630.3720.306
Polgolla0.010–0.034–0.1380.041–0.193
Table 4. (a)–(e). Pearson Correlation Coefficients between SPEI and SSI indices for 1, 3, 6, 12 and 24 months in Mahaweli River Basin. (The maximum correlation coefficients are highlighted).
(a)
Manampitiya SPEI1–SSI1SPEI3–SSI3SPEI6–SSI6SPEI12–SSI12SPEI24–SSI24
Trincomalee0.2590.3140.3710.2580.347
(b)
Demodara SPEI1–SSI1SPEI3–SSI3SPEI6–SSI6SPEI12–SSI12SPEI24–SSI24
Badulla0.3870.4040.4230.4080.246
Bandarawela0.0920.0950.013–0.116–0.340
(c)
CaledoniaSPEI1–SSI1SPEI3–SSI3SPEI6–SSI6SPEI12–SSI12SPEI24–SSI24
Katugastota0.3620.3460.3570.4430.475
Nuwara Eliya0.3790.3990.3760.4500.515
(d)
NawalapitiyaSPEI1–SSI1SPEI3–SSI3SPEI6–SSI6SPEI12–SSI12SPEI24–SSI24
Katugastota0.0860.0460.1200.1100.156
Nuwara Eliya0.0910.0850.1000.0110.010
(e)
PeradeniyaSPEI1–SSI1SPEI3–SSI3SPEI6–SSI6SPEI12–SSI12SPEI24–SSI24
Katugastota0.2670.1880.1910.3100.431
Nuwara Eliya0.0480.0080.0370.0790.121
Disclaimer/Publisher’s Note: The statements, opinions and data contained in all publications are solely those of the individual author(s) and contributor(s) and not of MDPI and/or the editor(s). MDPI and/or the editor(s) disclaim responsibility for any injury to people or property resulting from any ideas, methods, instructions or products referred to in the content.

