Article

Climate Scenarios for Coastal Flood Vulnerability Assessments: A Case Study for the Ligurian Coastal Region

1
Interuniversity Department of Regional and Urban Studies and Planning (DIST), Politecnico di Torino and Università di Torino, 10125 Torino, Italy
2
Regional Climate Group (RCG), Department of Earth Sciences, University of Gothenburg, 41320 Gothenburg, Sweden
3
Climate, Atmosphere and Ocean Laboratory (Climatoc-Lab), Centro de Investigaciones sobre Desertificación, Consejo Superior de Investigaciones Científicas (CIDE, CDIS-UV-Generalitat Valenciana), 46113 Moncada, Valencia, Spain
*
Author to whom correspondence should be addressed.
Climate 2023, 11(3), 56; https://doi.org/10.3390/cli11030056
Submission received: 24 January 2023 / Revised: 23 February 2023 / Accepted: 27 February 2023 / Published: 1 March 2023
(This article belongs to the Special Issue Climate Change and Responses for Water and Environmental Security)

Abstract

:
Extreme sea levels and coastal flooding are projected to be among the most uncertain and severe consequences of climate change. In response, a wide development of coastal vulnerability assessment methodologies has been observed in research to support societal resilience to future coastal flood risks. This work aims to explore the scope of application of index-based methodologies for coastal vulnerability assessment, in terms of their suitability to convey information on variations in climate variables potentially leading to sea-level changes and inundation. For this purpose, the InVEST Coastal Vulnerability model was coupled for the first time with the ERA5 reanalysis and used to develop a case study assessment of the biophysical exposure component of vulnerability to coastal flooding for Liguria, an Italian coastal region facing the Mediterranean Sea. Different scenarios of wind speed and wave power were created in order to test the sensitivity of this approach to climate data inputs. The results support the applicability of this approach to provide a preliminary grasp of local vulnerability to coastal inundation. Yet, this work also highlights how the method’s data aggregation and indicator computation processes result in its insensitivity to wind and wave variations, and therefore in its unsuitability to reproduce climate scenarios. The implications of these findings for research methodology and regarding the operationalisation of vulnerability assessment results are discussed.

1. Introduction

Assessing the vulnerability of coastal communities to climate-related hazards is a key aspect of climate change adaptation [1,2]. Coastal flooding has been recognised in scientific literature as the most relevant among the many potential hazards related to climate change for coastal communities, due to its frequency and damage potential [3]. Because of the combination of the regional orography and its latitude range resulting in a concentration of all the main natural risks linked to the water cycle [4], the Mediterranean Sea basin is considered to be one of the most vulnerable areas to climate change impacts [5,6]. The quasi-homogeneous signal of Global Mean Sea Level (GMSL) rise, combined with changes in the northeast Atlantic circulation are likely to lead to the average sea level in the Mediterranean Sea rising between 40 and 100 cm at the end of the 21st century, with respect to current values [4]. There is a lack of consensus in scientific literature regarding future projections of Extreme Sea Levels (ESLs); these have been demonstrated to be highly sensitive to the choice of atmospheric forcing, and model simulation results have shown marked differences and low spatial coherence [4]. It is nevertheless widely accepted that, worldwide, today’s 100-year event will become common by the end of the century under all Representative Concentration Pathway (RCP) scenarios [1]. Some notable literature contributions regarding ESLs in the Mediterranean Sea point instead towards a reduction in the average number [7] and magnitude [8] of positive surges, as well as lower values of extreme wind waves [9].
As with other climate change-related risks, flood risk is determined by the interaction of biophysical and social factors [10]. Climate drivers vary in time resulting from the interaction of natural variability and anthropogenic climate change, and contextual characteristics play a role in determining how the flood event will unfold in and impact the specific context [11,12]. Assuming current levels of coastal protection standards to remain unchanged in the future, absolute coastal flood risk is projected to increase strongly because of a combination of climate-induced ESL changes and socioeconomic drivers [13]. Coastal areas are generally associated to a large number of social and economic activities concentrated near the shoreline [2,14] and assets exposed to such extreme events are expected to increase dramatically in the upcoming decades [15,16]. In the EU, one third of the population already lives within 50 km of the coast, and by the end of this century 5 million EU citizens could be annually at risk from coastal flooding [17].
Given the relevance and perceived urgency of the topic, a widespread uptake of coastal vulnerability appraisals has been observed both in research and practice. A variety of frameworks (e.g., the 1991 IPCC Common Methodology [10]), assessment methodologies and indices has been proposed within the field, mirroring the context and purpose-dependency of the concept [2,3] and the breadth of the field of vulnerability to climate change at large. Methodologies including numerical flood modelling (e.g., [18]), the vulnerability curve method, the disaster loss data method [19], indicator-based methodologies (of which [2] and [20] have provided comprehensive reviews) and Multi Criteria Decision Analysis (MCDA) (e.g., [21]) have been used in order to assess coastal flood vulnerability, depending on the research objectives and on the resources available [3]. Among the most widely accepted methodologies for flood vulnerability assessment, indicator-based methodologies have met with particular success because of their overall ability to convey relatively comprehensive information in a quick and not overly computationally-intensive manner [12].
The Coastal Vulnerability Index (CVI) [22,23] represents possibly the earliest attempt at providing an indicator-based assessment methodology of vulnerability to coastal flooding and erosion, with a main focus on the physically-based drivers of vulnerability. Other methodologies were then proposed to also account for the socioeconomic components of coastal vulnerability, such as the Coastal Social Vulnerability Index (CSoVI) [24,25].
Specific approaches have also been devised in order to depict the complex interactions among catchment hydrology and coastal processes in low-lying deltaic environments, such as the Coastal Cities Flood Vulnerability Index (CCFVI) [26] and the Integrated Deltaic Risk Index (IDRI) [27]. The latter is a hybrid approach which utilises numerical model results on different locally-relevant climate and hydrological processes as an input for computing an aggregate risk index.
The most relevant shortcomings within the field of flood vulnerability assessment regard for the most part a generalised lack of standardisation in practices, methodologies [2] and terminology [12], hindering the propagation of good practices and the comparability of research outcomes. The paucity of sensitivity, uncertainty [3,28] and validation analyses provided as complementary to vulnerability assessment results [29] has also been shown to impair their validity in terms of a cognizant and proper incorporation of research outcomes in policy processes. When it comes to indicator-based assessment methodologies, these exhibit critical issues also with regards to the data choice, aggregation and weighting processes leading to a final aggregate indicator [2,30], and regarding the transparency of underlying assumptions not being conveyed by some types of indicators [31].
Within this context, this work aims at addressing some of the relevant shortcomings presented above through a case study assessment of the physical exposure component of vulnerability to coastal flooding, particularly with regards to the study of indicator sensitivity to different climate scenarios. Namely, the focus is to better outline the scope of application of indicator-based methodologies in terms of their suitability to accurately convey information on the underlying variations in climate variables, and to consequently be appropriate tools to depict climate scenarios fit to inform policy action. For this reason, attention was directed towards the characterisation and inclusion within the analysis of relevant climate variables determining extreme sea levels and storm conditions in coastal areas. In order to do so, the consequences of data aggregation and indicator computation processes were investigated through sensitivity and validation analyses for data on wind speed and wave power.
Liguria, an Italian coastal region facing the Mediterranean Sea, was chosen as area of interest for the analysis. Because of a combination of geomorphological characteristics (e.g., high slopes contributing to high runoff speeds for pluvial floods [32]), presence of densely populated urban areas, high soil sealing rates and local climate, this region has historically faced dire consequences related to pluvial and coastal flood events [33]. The case study assessment was carried out using the InVEST Coastal Vulnerability model [34,35], a well established methodology which provides an index-based assessment of vulnerability to coastal floods and coastal erosion in a spatially-explicit manner.
The contribution of this work to the field of research on coastal vulnerability assessments is threefold. The first contribution regards the broad methodological issue of the study of model and indicator sensitivity to climate change scenarios mentioned above in this section, which represents the main research gap this work aims to address. Secondly, this work originally contributes to research in terms of the geographical context of choice: to the best of the authors’ knowledge, most of the published peer-reviewed articles which utilised the InVEST Coastal Vulnerability model focused on oceanic coasts, and none provided examples of its application to coastal areas in the Mediterranean Sea. This article attempts a first application of this methodology to this semi-enclosed sea basin, which entailed tuning model parameters with regards to the limited fetch conditions as well as to the local geomorhphology and coastal habitats. Finally, this case study also represents a first example of coupling the ERA5 reanalysis dataset [36] with this specific coastal vulnerability assessment model, in order to produce scenarios of past climate conditions influencing sea levels locally. Utilising the ERA5 dataset in place of the default Wavewatch III data suggested for use within this InVEST model [35] is particularly relevant in view of the need to account for the context-dependency of climate change impacts by tailoring the methodology of choice to regional characteristics.
Quagliolo et al. [32] proposed an assessment of pluvial flash floods with a focus on Nature-Based Solutions (NBS) for urban flood risk mitigation, for a series of watersheds within the Metropolitan area of Genoa, Liguria. As compound and multi-pathway flooding is at the forefront of research in coastal areas [37], the work presented here further complements the aforementioned analyses by assessing exposure to coastal floods for roughly the same geographical area. Such analyses help highlighting the multitude of potential flooding pathways in the region, also in support of future economic appraisals of climate change impacts and climate adaptation policies for urban coastal environments.
The continuation of this work is articulated as follows: 
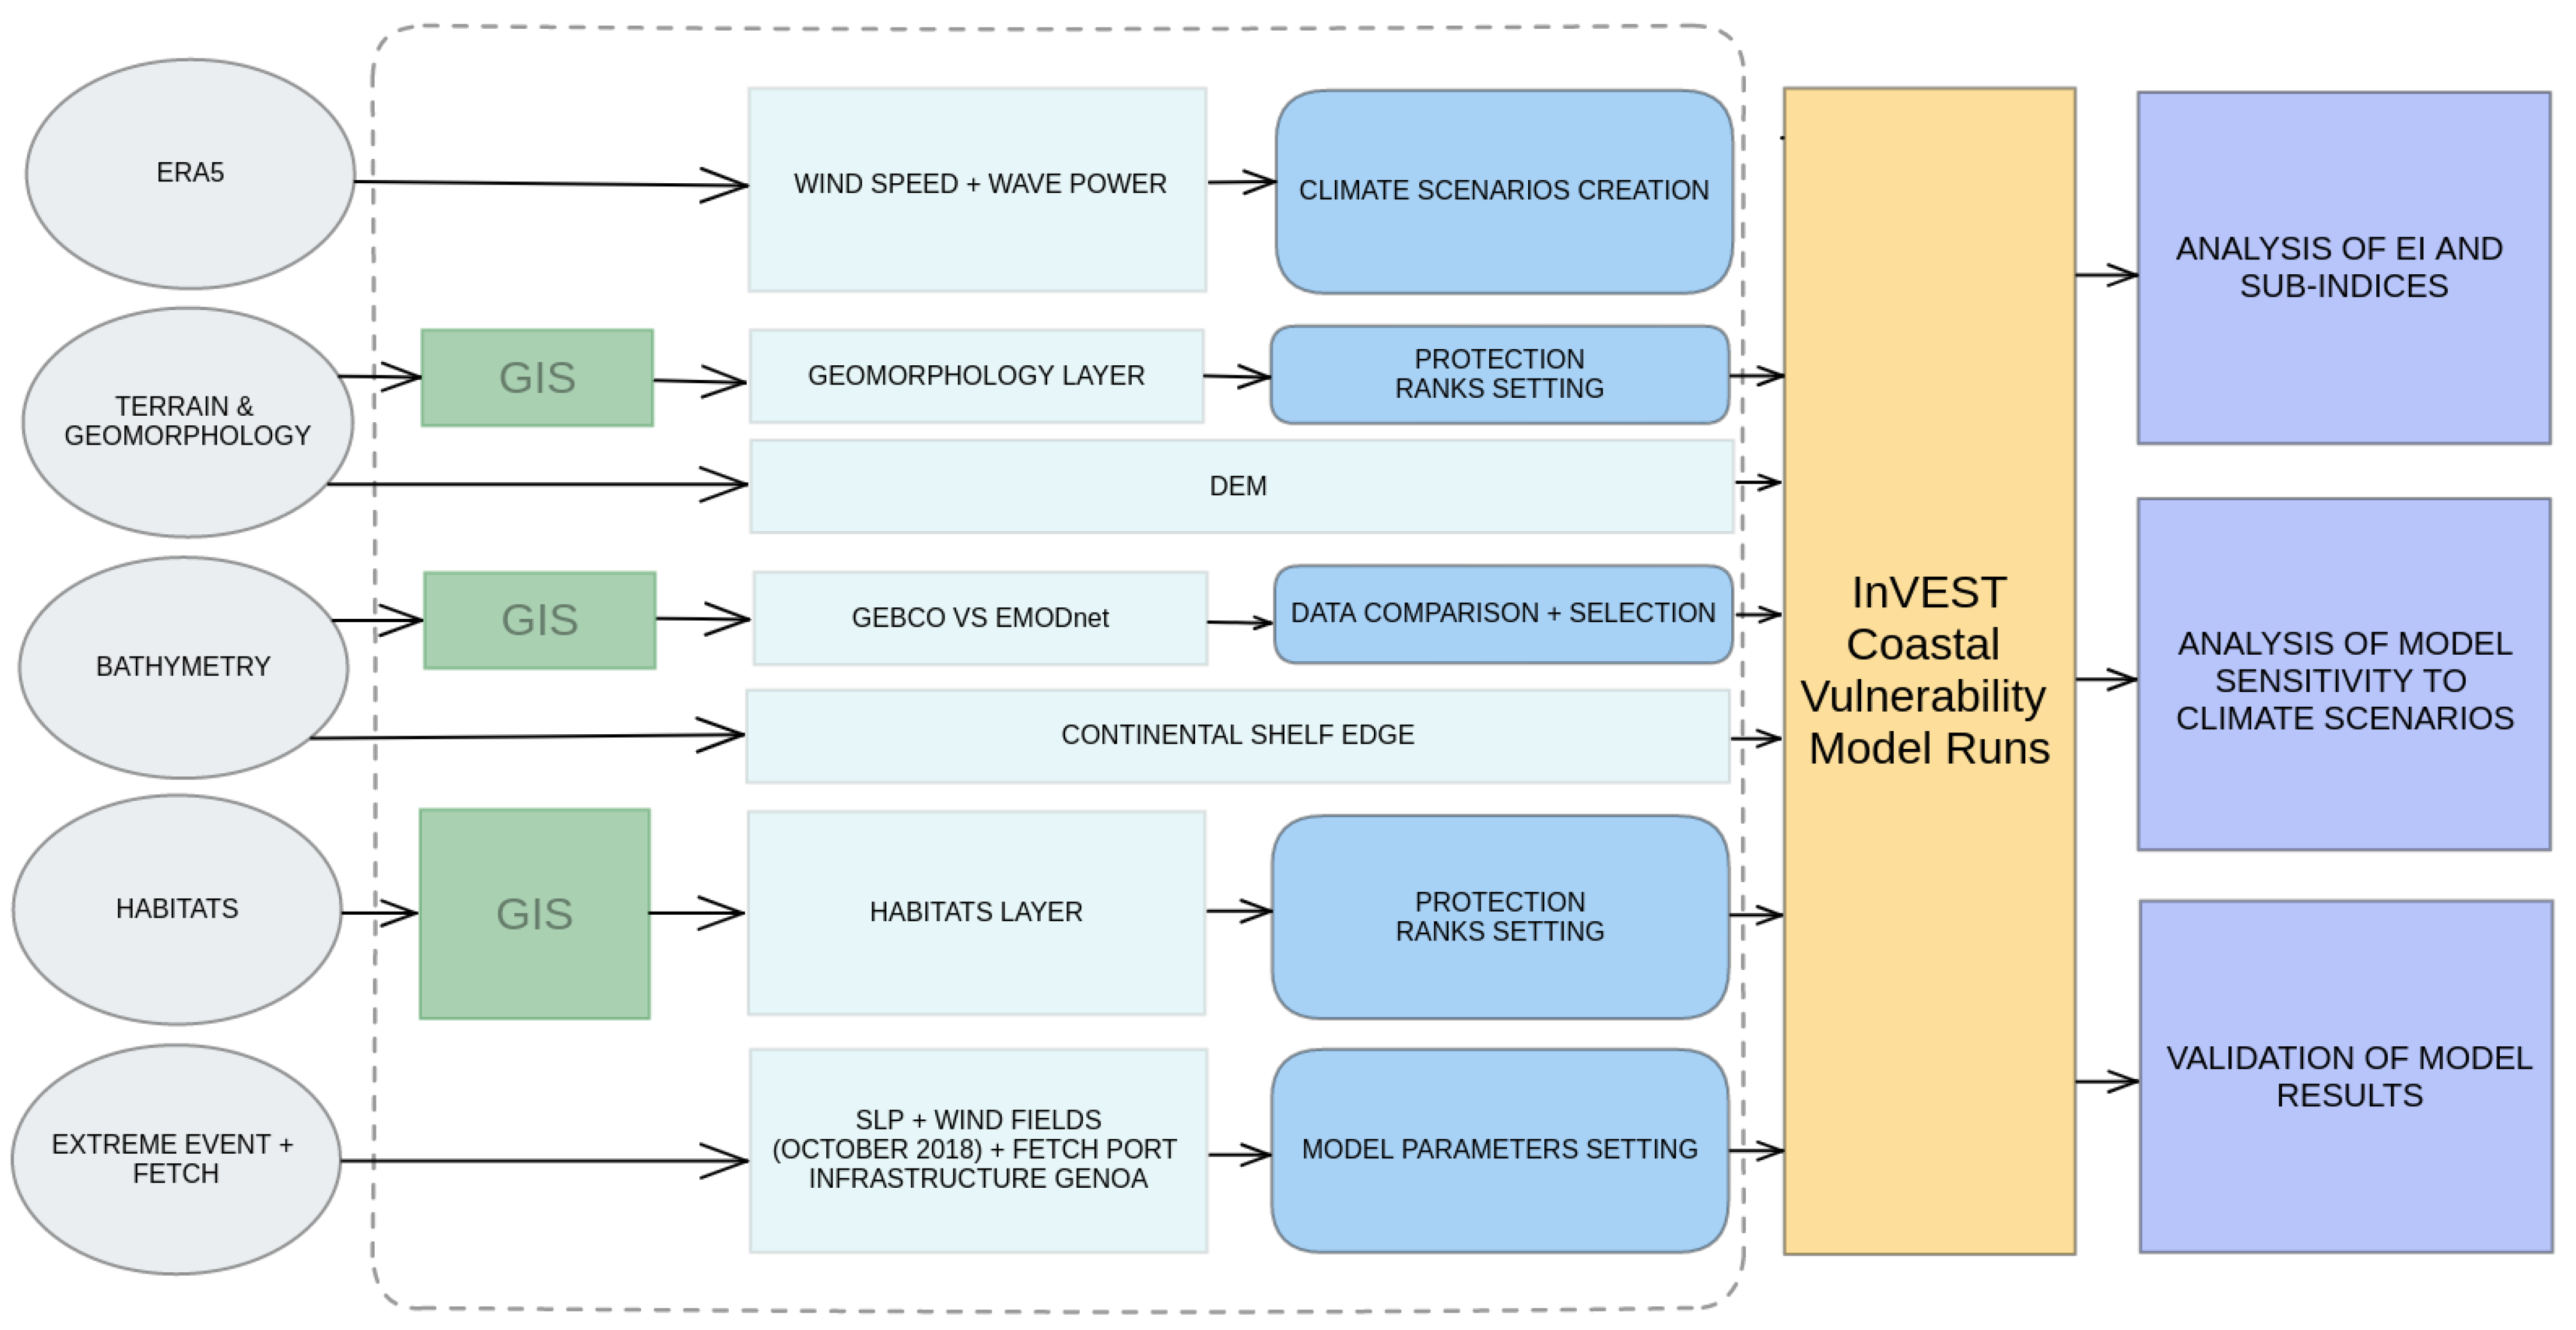
Section 2 presents the study area and the data inputs, and addresses how the latter were used within the InVEST Coastal Vulnerability model. Notably, this section highlights the data on relevant climate variables included in the analysis and the creation of climate scenarios to input in different model runs. Section 3 addresses the analysis results; a general overview of the model outputs is introduced, together with an analysis of the model’s sensitivity to changes in climate data inputs and an attempt at results validation. Section 4 poses a critical discussion of the scope of application of the methodology of choice by addressing its potential and limitations, especially with regards to its use to represent different ESL scenarios in coastal areas. Future research developments in light of the case study results and discussion are additionally examined therein. Conclusions are drawn in Section 5.

2. Materials and Methods

2.1. Study Area

A sizable portion of coastline in the Italian region Liguria—corresponding roughly to the Gulf of Genoa and spanning approximately 440 km—was chosen as the area of interest for the case study presented in this article (see Figure 1). The region’s orography and densely forested surface have caused most of the population and urbanised areas to concentrate in close proximity to the coastlines [32]; the Metropolitan area of Genoa alone houses more than half the regional population (816,250 people out of the regional total of 1,507,438) [38].
Low-lying coasts are located predominantly in the western side of the region, while cliffs and high coasts are more prevalent in the eastern side of the Region, from the Portofino promontory and further towards the Toscana region. Estuaries and river mouths of modest size can be found throughout the regional coastlines. Some major urban areas including those of the Genoa and La Spezia municipalities are located at particularly low elevations above the sea level and/or in close proximity to river mouths.
Liguria is characterised by a Mediterranean climate; data on cumulative monthly precipitation collected at a weather station in Genoa (Genova Università weather station, located at 58 m MSL) for the period 1981–2010 averaged maximum values of just above 210 mm, with September to November being the rainiest months of the year [39].
According to regional projections from the National Climate Change Adaptation Plan [40], the mean sea level in the Ligurian sea’s coastal areas (i.e., within 12 nautical miles from the coastline) [41] might increase by 8 cm in the period 2021–2050 under the RCP8.5 scenario.
Data on relevant oceanographic variables are collected by a measurement buoy located in proximity to La Spezia, on the Eastern side of Liguria [42]. According to both observations from the buoy and to modelled hindcasts, most of the coastal storms come from the Libeccio direction (S-SW). In the area, wave heights of 7.4 m on average are associated to a return period of 100 years (average of relevant modelled locations close to La Spezia) [43].
In the recent past, some extreme events leading to flooding have occurred over the study area, both in terms of pluvial flash floods caused by extreme rainfall [32] and in terms of coastal storms causing extreme sea levels [44]. One such extreme coastal storm is referenced later in Section 2.6, and was used as a worst-case scenario event to set some of the model’s parameters for the case study development.

2.2. The InVEST Coastal Vulnerability Model

The InVEST (Integrated Valuation of Ecosystem Services and Tradeoffs) [34] Coastal Vulnerability model was used for this case study (version 3.10.1). This methodology was chosen for the development of this work because it represents a well-established example of indicator-based assessment methodology for coastal vulnerability assessment. This model aims to provide spatially-explicit, modular and scenario-driven analyses to inform spatial planning in the coastal zone [45], with a particular focus on the role of coastal habitats to provide protection from erosion and inundation. There are extensive examples in literature utilising the InVEST Coastal Vulnerability model to address the topics of vulnerability and Nature-Based Solutions (NBS), green infrastructure and coastal planning (e.g., [45,46,47,48,49,50]). Though, the application of this methodology to a coastal area in the Mediterranean Sea and the in-depth study of the methodology and implications of accounting for climate scenarios within this approach represent—to the best of the author’s knowledge at the time of writing—original research contributions of this work.
The InVEST Coastal Vulnerability model outputs an Exposure Index (EI) and several sub-indices of exposure for each of a series of evenly-spaced shore points along the coastline within a user-defined Area of Interest (AOI). The model computes the EI as the geometric mean of a series of sub-indices about relevant bio-geophysical variables contributing to exposure to coastal hazards in the area: wind exposure, wave exposure, sea level change (optional input, not included in this case study), relief, surge potential, geomorphology (optional input), natural habitats. Both the sub-indices and the overall EI range between ranks 1 to 5, corresponding respectively to very low exposure and very high exposure. The choice, aggregation and ranking of variables adopted by the model build upon the Coastal Vulnerability Index (CVI) proposed by [22,23]. Section 2.7.2 details the data aggregation and indicator computations carried out by the model in more detail.
The shore points are spaced at a user-defined model resolution, which varies depending on the case study at hand and can be adjusted to account for input data resolution, intended use of the model output and processing time. A model resolution of 1000 m was chosen for this case study.
The following sections present a description of the data used to develop this case study, subdivided into three main categories: data on terrain features, data on climate variables influencing storm conditions and sea levels in the coastal area, data on coastal habitats. A summary of the data inputs is provided in Table 1, including their sources and the corresponding bio-geophysical variable within the InVEST Coastal Vulnerability model.

2.3. Data on Terrain Features

2.3.1. Digital Elevation Model

A Digital Elevation Model (DEM) is required by the model in order for it to compute the relief sub-index for each shore point, under the general assumption that on average locations at higher elevation above the sea level are less exposed to inundation. DEMs are at the core of most flood modelling efforts—not just for coastal applications—as they provide a general description of the hydraulic connectivity of the terrain upon which water flows, even if in a very approximate manner [18]. A significant number of coastal risk applications rely on publicly available DEMs in order to delineate flood extents [3]: their availability at high resolution has been recognised as a crucial factor to achieve good results in terms of modelled flood extent and consequences [18]. The DEM (raster dataset with a 5 m × 5 m pixel resolution, 2022 edition) for Liguria was retrieved from Geoportale Liguria.

2.3.2. Geomorphology

The ability of the shoreline to provide protection from inundation and erosion is calculated by the model based on the average elevation above sea level of a given shoreline portion. Though, low-lying stretches of the coast might be reinforced by means of artificial shore-parallel structures to achieve extra protection in otherwise very exposed areas. Such information can optionally be included in the analysis by providing the geomorphology data input to the model. The geomorphology input was created in the form of a polyline shapefile vector representing the different shoreline segments within the AOI based on information provided within the Sistema Informativo della Costa (SICOAST) framework. All relevant vector datasets containing information on the geomorphological characteristics of the coast (see Table 1) were processed in order to capture the variety of the different shoreline types within the AOI according to model specifications. The final ranks assigned to the geomorphology layer (see Section 2.7.2), as well as the different shoreline types considered, are listed in Appendix A.

2.3.3. Bathymetry and Continental Shelf Edge Location

Bathymetry data were originally collected to ensure navigation safety, but have later found widespread use across several other fields, including ocean currents modelling [51]. The InVEST Coastal Vulnerability model requires information on seafloor topography for the study region in two different ways.
Digital Bathymetry Models (DBMs) are digital terrain models that represent the topography of the sea floor, typically in the form of regular grids with depth values assigned to individual grid cells. A DBM raster dataset is used by the model to extract values of water depth in order to perform calculations of wave period and height for the local wave exposure [35]. The European Marine Observation and Data Network (EMODnet) bathymetry grid was used for this case study.
The second seafloor-related information is the location of the edge of the continental shelf, or other user-specified and more locally relevant bathymetry contours, in order to compute the surge sub-index. Among other factors, storm surge elevation is a function of the amount of time wind blows over relatively shallow waters. Therefore, the longer the distance between the coastline and the edge of the continental shelf, the higher the exposure to storm surge which will be calculated by the model. The default global dataset on the location of the continental shelf edge provided by the InVEST model developers was used to run the model.

2.4. Climate Data Inputs—Reanalysis Product Description

Data on relevant climate variables contributing to coastal flood hazard in the area were obtained from the ERA5 reanalysis [36]. ERA5 provides a detailed record of the global atmosphere, land surface and ocean waves from 1950 onwards at a 0.25° × 0.25° horizontal resolution for the atmosphere and 0.5° × 0.5° for ocean waves [52]. Reanalysis datasets are spatially complete and physically coherent simulations of climate processes and variables. They are obtained by a process of data assimilation in which observational data are fed into a forecast model [53]. Because of these features, these datasets are particularly important for the study of climate change trends and consequences, as they allow to overcome hindrances related to data fragmentation.
ERA5-derived data on climate variables relevant to the development of flood events has previously been used to study climate change impacts in the Mediterranean Sea and over the Italian territory [54]. When it comes to the description of sea-level changes, previous literature highlighted how ERA5’s horizontal resolution might lead to poor results in particularly narrow regional seas [55]. Dynamical downscaling of ERA5-derived data has been shown to improve hindcast reliability in coastal areas, especially when it comes to wind and wave directions when compared to the original low-resolution dataset [56]. Nevertheless, ERA5 has shown a good performance reproducing observed seasonal cycles of wind speed and wind gusts in coastal areas dominated by regional and local circulations [53]. Therefore, ERA5 still represents the best long-term reanalysis product to study wave climatology in the Mediterranean Sea [55], and was considered as a suitable choice for use in this case study assessment given the geographical and time resolutions of the analysis.
Nine ERA5 grid points located off the Ligurian coast (see Figure 1) were selected for data retrieval. Notably, the near-surface (10 m height) wind speed (m/s) was obtained following specifications provided by the European Centre for Medium-Range Weather Forecasts (ECMWF) [57] starting from the ERA5 u-component of 10-m wind (u10) and the ERA5 v-component of 10-m wind (v10).
The second climate-related variable for use in the model is the wave energy flux per unit of wave-crest length (W/m). It was calculated following specification by [58,59] starting from the ERA5 significant height of combined wind waves and swell, the ERA5 peak wave period and the ERA5 mean wave direction.
Sea level change is an optional climate-related input for the Coastal Vulnerability model. It was not accounted for in this case study, as the AOI was assumed to be sufficiently limited that there should not be any variability in the rate or amount of sea level change within it [1,60].

30-Year Climate Periods

There is scientific consensus that 30-year periods are recommended for calculation of the climate normal, since such a time span is supposed to be long enough to be able to express relatively representative and stable climatic patterns [61]. One of the objectives of this case study was to test the suitability of the model of choice to account for variations in climate patterns and develop climate scenarios. The focus of the study was not placed on testing the use of longer climate periods as input for the analysis, but rather on comparing the model outputs based on different representative climate periods. In order to do so, wind and waves model inputs were split into two different 30-year periods, one spanning 1961 to 1990 [62] and the other spanning 1991 to 2020. The two subsets were used as input for two different runs of the model in order to compare variations in its outputs, keeping all other inputs equal. By doing so, the intention was to eventually be able to identify changes in the model outcomes—and thus changes in vulnerability—brought about exclusively by changes in climate.

2.5. Data on Coastal Habitats

Nature-Based Solutions (NBS) can be understood as “solutions to societal challenges that involve working with nature [...]”, simultaneously addressing the challenges of “[...] mitigating and adapting to climate change, protecting biodiversity and ensuring human wellbeing [...]” [63]. The role of natural habitats as NBS and green infrastructure as means to provide benefits to society and protect it from adverse situations has received widespread attention in research and policy with regards to both adaptation and mitigation of climate change [64,65]. Natural habitats show dynamic and non-linear responses to climate change-related processes and can’t be assumed to be passive elements of the landscape [6]; because of the complexity of the processes at hand, the quantification of the potential to reduce the impacts of climate change of NBS has shown to be a challenging task [32].
With regards to coastal environments, though most of the analyses of coastal vulnerability to the effects of climate change still seems to focus on hardening shorelines, coastal ecosystem have been estimated to be able to reduce by approximately 50% the proportion of people and property most exposed to sea-level rise and coastal storms in some areas [66]. The potential of seaweeds and seagrass meadows to attenuate waves and intercept and stabilise sediment thus reducing erosion of sandy beaches in several different environments is well documented in literature (e.g., [67,68,69]). Coral reefs are also of particular interest because of their ability to act as natural breakwaters capable of effectively dissipating wave energy [68].
The InVEST Coastal Vulnerability model aims to identify shoreline portions where habitats are most likely to reduce coastal hazards such as inundation and erosion. Geospatial information on habitat distribution off the Ligurian coast was retrieved from the Atlante degli Habitat Marini della Liguria in the form of a polygon vector shapefile highlighting the location of the different coastal habitats in the AOI (see Table 1). The habitats considered in this case study are three types of seaweed/algae (caulerpa, sciaphilous and photophilic algae), two types of seagrass (posidonia oceanica and cymodocea nodosa) and the coralligenous biocoenosis, a Mediterranean Sea formation analogous to coral reefs [70]. The protection ranks assigned to the habitat data input (see Section 2.7.2) are listed in Appendix A.

2.6. Model Parameters

User-defined parameters are required to set the maximum fetch distance and the elevation averaging radius. The former is needed to discern between ocean-driven waves and locally-generated wind-driven waves. The latter is the radius within which the model computes average elevation from the DEM in order to estimate the relief sub-index.
For this case study, the two parameters were set based on projects of port infrastructure for the Port of Genoa [71] as well as on data pertaining to the storm surge episode of late October 2018, considered as a worst-case scenario situation. Beginning in the late evening of 29 October 2018, an exceptional weather event affected a wide portion of Liguria. A combination of heavy rainfall in the previous days and storm conditions (waves up to 10 m high registered in Capo Mele and wind gusts of up to 180 km/h registered at Marina di Loano [44]) resulted in a storm surge causing heavy damage to the coastline, particularly in Santa Margherita Ligure and Rapallo.
400 km was set as the maximum fetch distance parameter, while the elevation averaging radius was set at 100 m, corresponding to the maximum registered inundation extent inland during the 2018 storm event.

2.7. Methodology

The methodology adopted for the development of the case study assessment described in this article is illustrated in Figure 2.

2.7.1. Data Retrieval, Pre-Processing and Scenario Creation

After data retrieval from various sources, data pre-processing was carried out in a GIS environment for the geomorphology and habitat data inputs in order for them to fit to model specifications. Protection ranks for these two inputs were assigned according to model guidelines [35] (see Section 2.7.2 and Appendix A). With regards to the DBM, a quality comparison following specifications from [51] was carried out between the default global dataset recommended by model developers (General Bathymetric Chart of the Oceans, GEBCO [72]) and the EMODnet bathymetry. EMODnet data was ultimately selected as it provided superior quality within the AOI. Two 30-year climate scenarios were created for model output comparison as described above.

2.7.2. Data Processing by the Model

The InVEST Coastal Vulnerability model output is provided as a series of georeferenced shore points. Each shore point is associated to: (i) an overall Exposure Index (EI), (ii) one sub-index for each bio-geophysical variable of interest, and (iii) a series of intermediate outputs that work as the sub-indices’ precursors.
The model computes intermediate outputs differently for each bio-geophysical variable considered (see Table 2). For the wind exposure, wave exposure, surge potential and relief sub-indices, these are computed pointwise directly by the model, starting from input data and model parameters. Intermediate outputs then get arranged in an ordered distribution and assigned to 5 bins of 20% of the distribution each, coincident with ranks 1 to 5. The shore point’s rank represents its value respective to the corresponding sub-index.
The geomorphology and habitat sub-indices are instead calculated by the model starting from ranks assigned to input data by the model user. Specifically, geomorphology ranks are assigned by the user to individual segments of a shoreline polyline vector shapefile provided as geomorhpology input to the InVEST model. The model then computes the final geomorphology sub-index pointwise, as the average rank of shoreline segments found within a given radius (i.e., half the model resolution) around each shore point [35]. Habitat ranks are assigned by the user to individual polygons of a vector shapefile provided as habitat input to the InVEST model. The model then computes the final habitat sub-index pointwise based on the ranks of habitats found within a given radius (i.e., the habitat protection distance, see Table A2) around each shore point [35].
Lastly, the model computes the EI for each shore point as:
E I = ( i = 1 n R i ) 1 / n
where Ri stands for each sub-index computed by the model.

3. Results

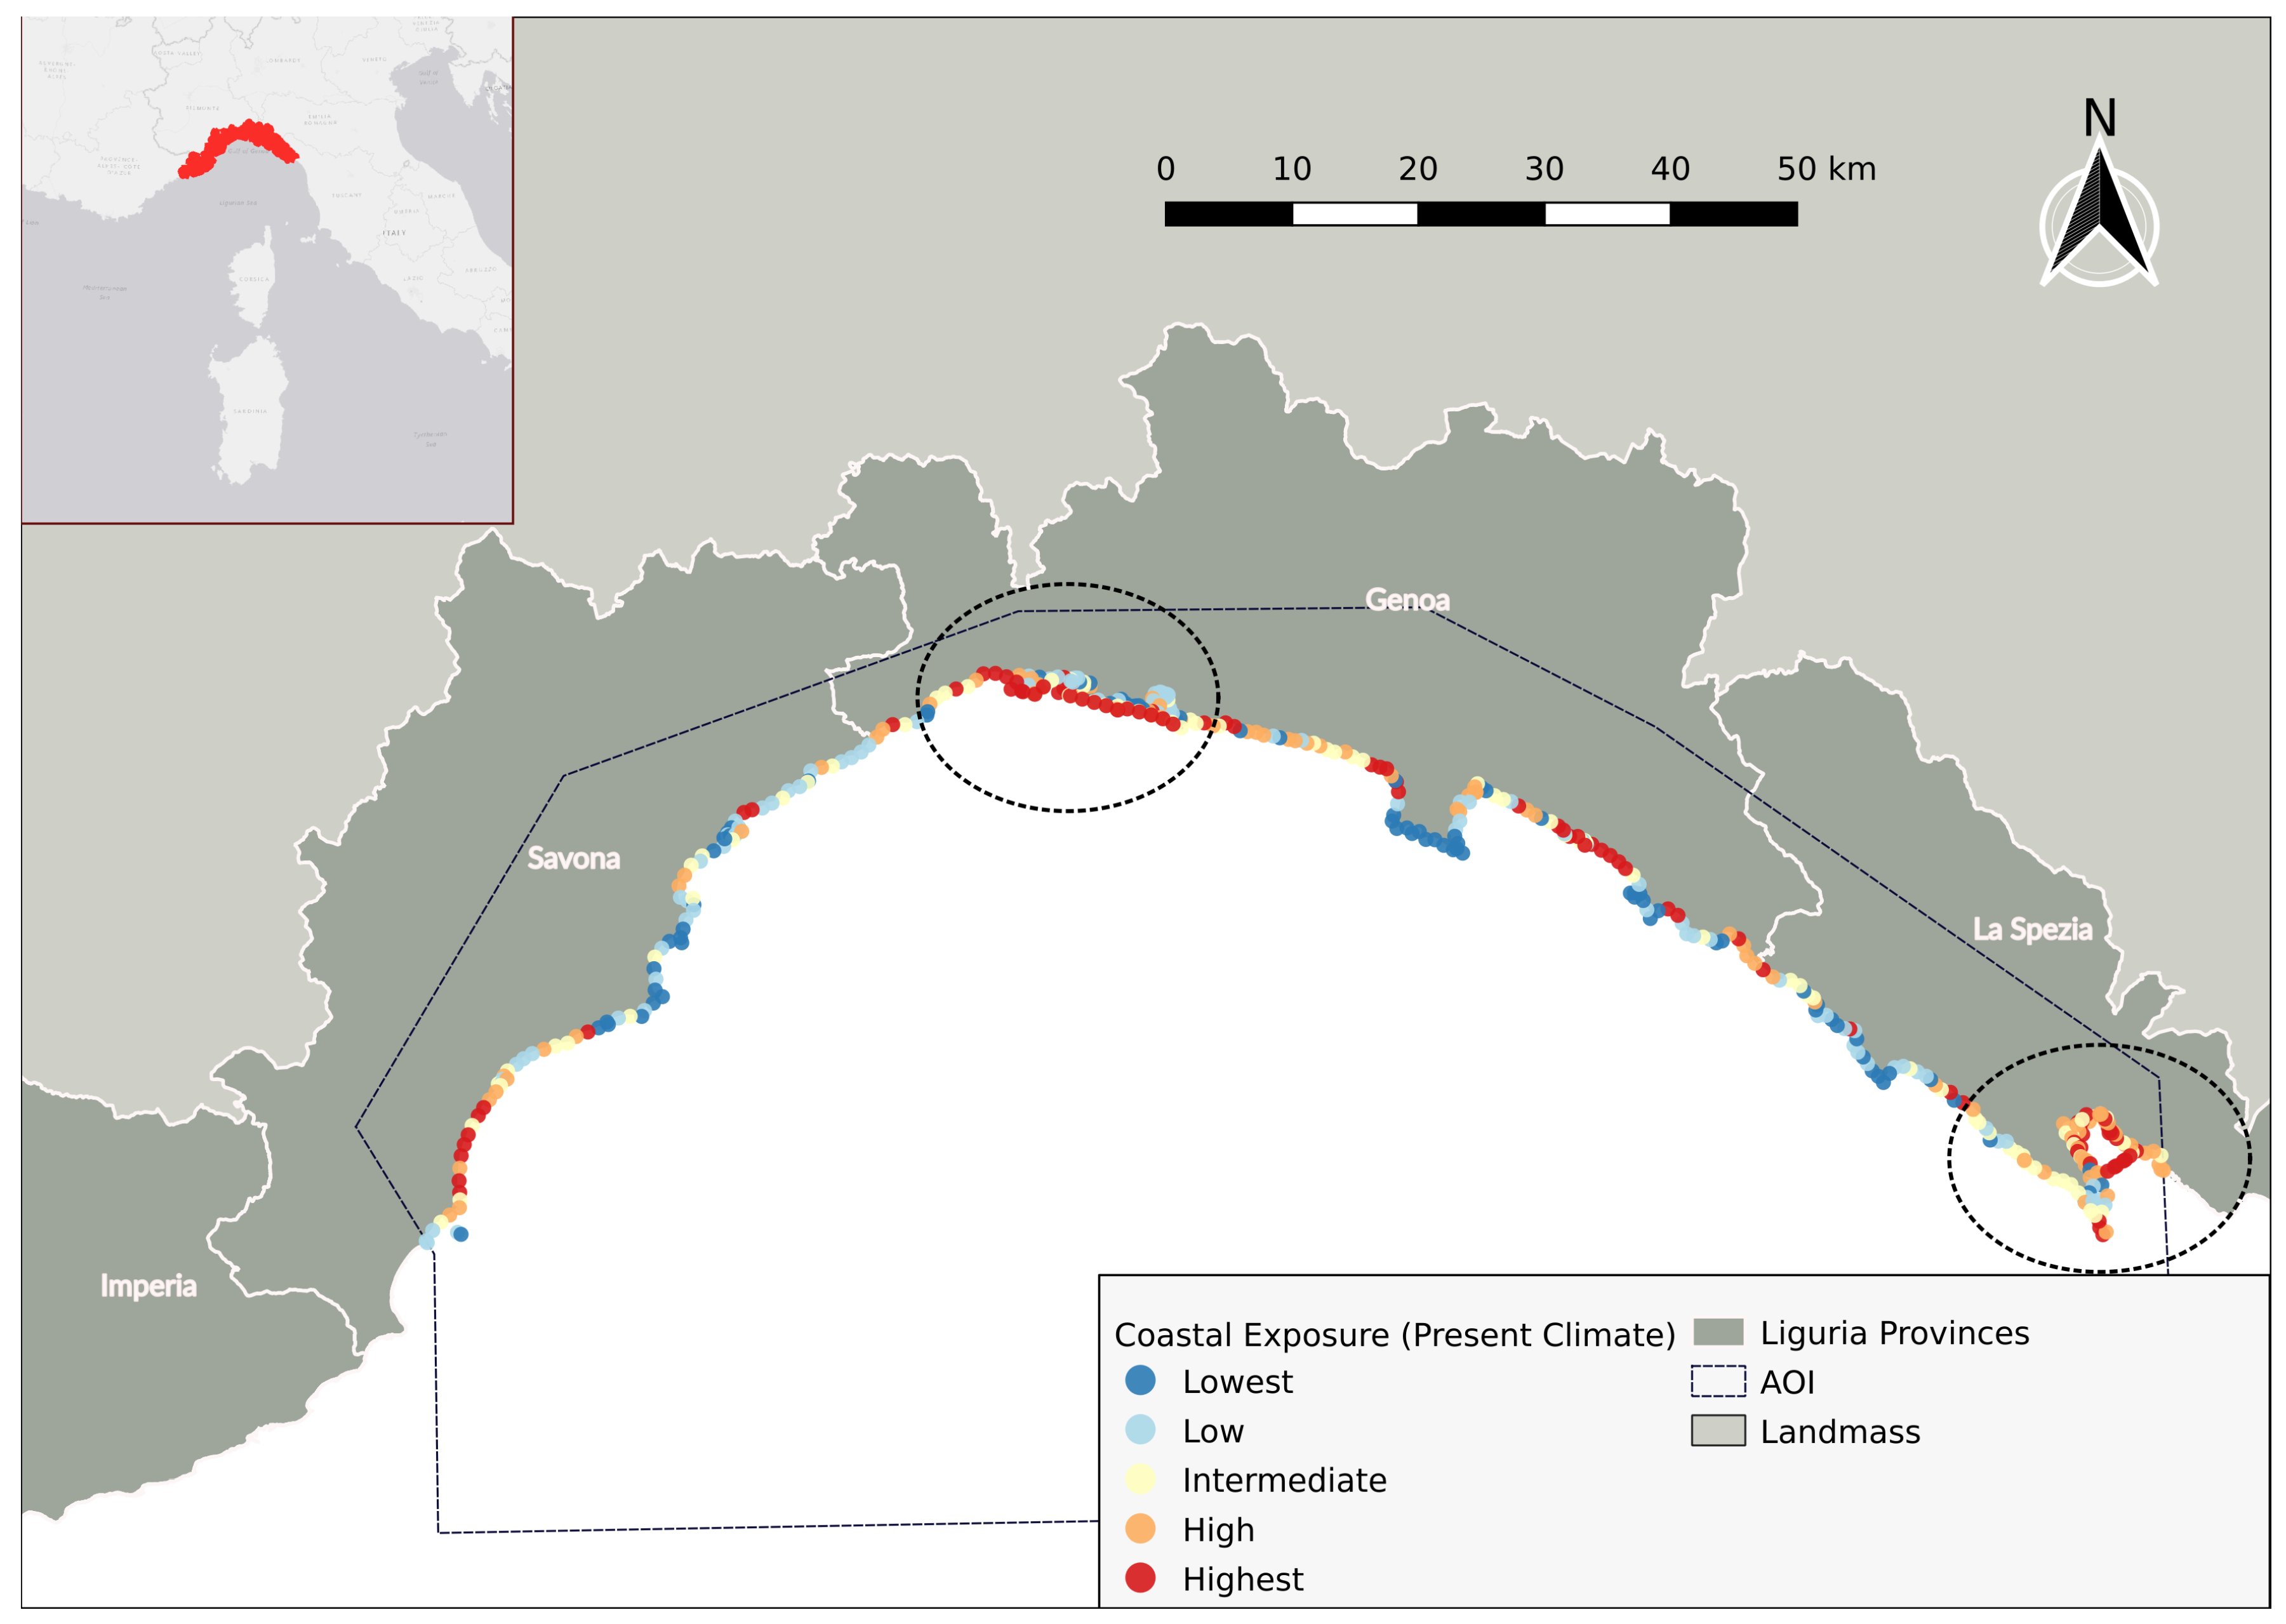
Running the InVEST Coastal Vulnerability model at a resolution of 1000 m within the AOI generated 457 shore points. Figure 3 and 
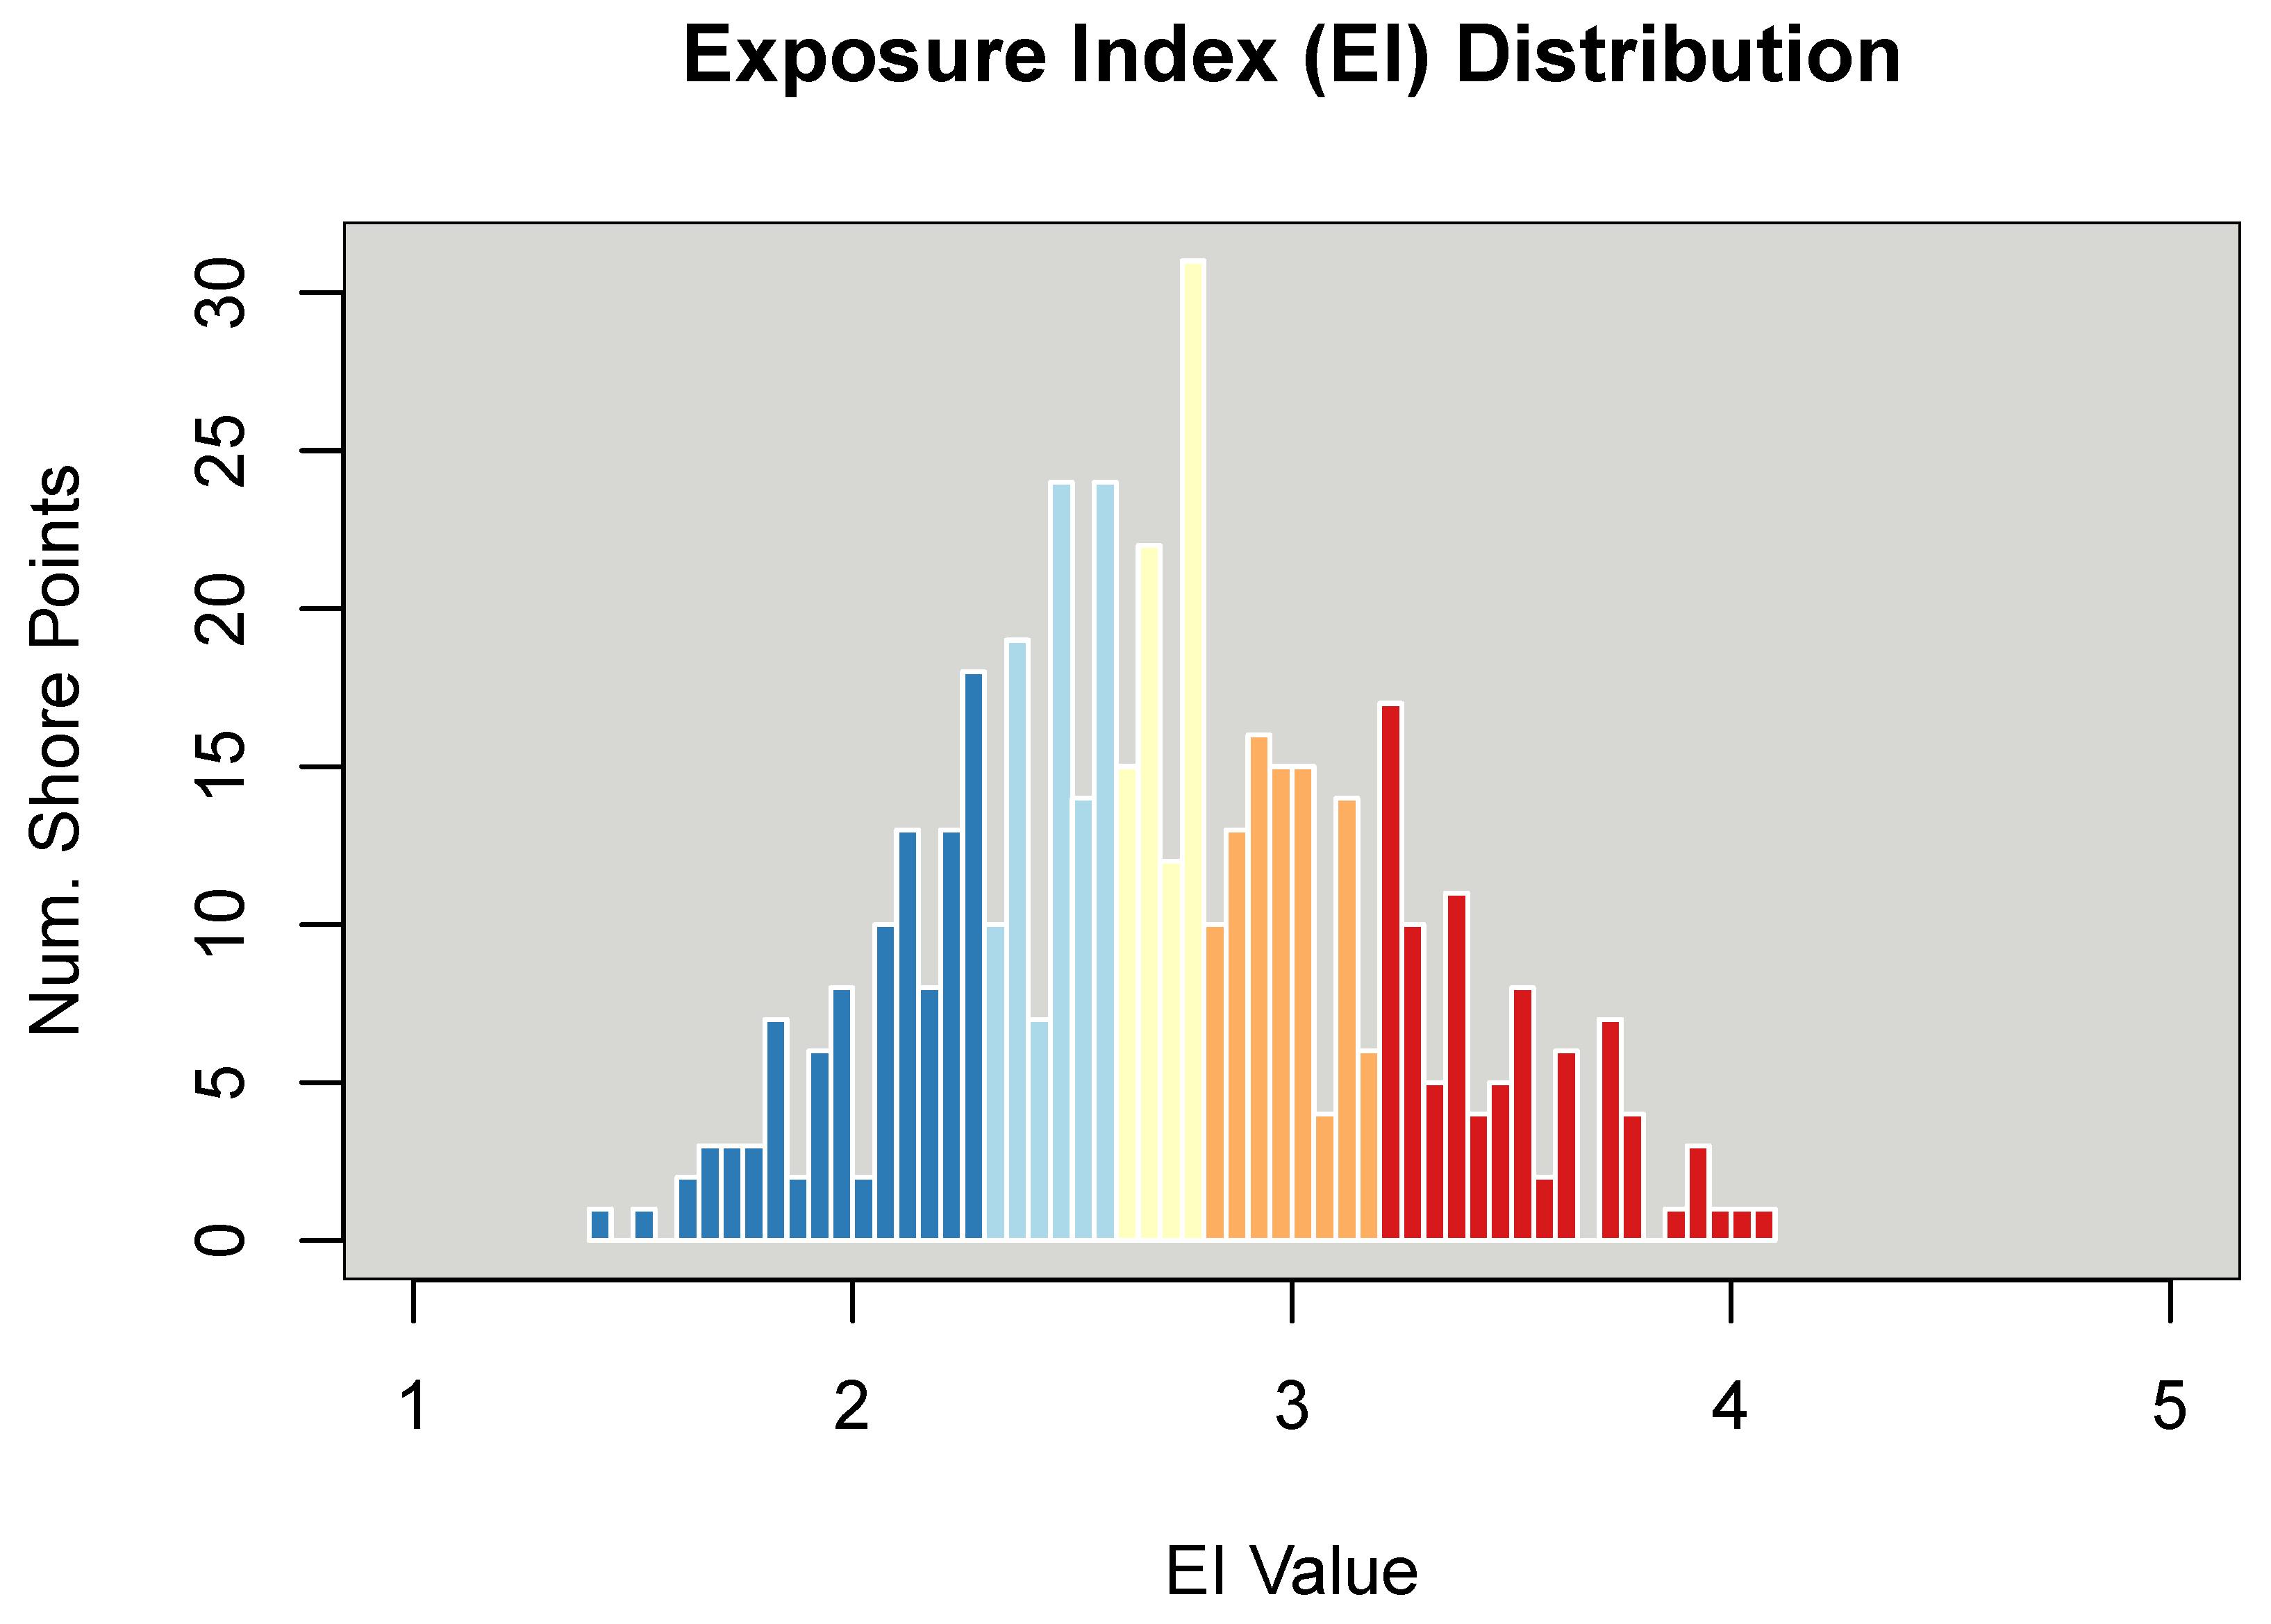
Figure 4 show the model output in a GIS environment: each shore point is coloured based on the values of the overall EI. The EI distribution has been subdivided in 5 equal quantiles corresponding to 20% of the distribution each for the purpose of styling, to which qualitative labels of ’lowest’ to ’highest’ have been assigned within the map. Figure 5 presents the distribution of the EI for the current climate period and highlights its subdivision in quantiles mentioned above.
Table 3 shows summary statistics of the EI and the habitat and geomorphology sub-indices. No summary statistics are provided for the wind, wave, surge and relief sub-indices because they are computed in such a way that there is always going to be the same amount of shore points for each of the ranks spanning 1 to 5 (integers only).

3.1. General Overview of the Outputs

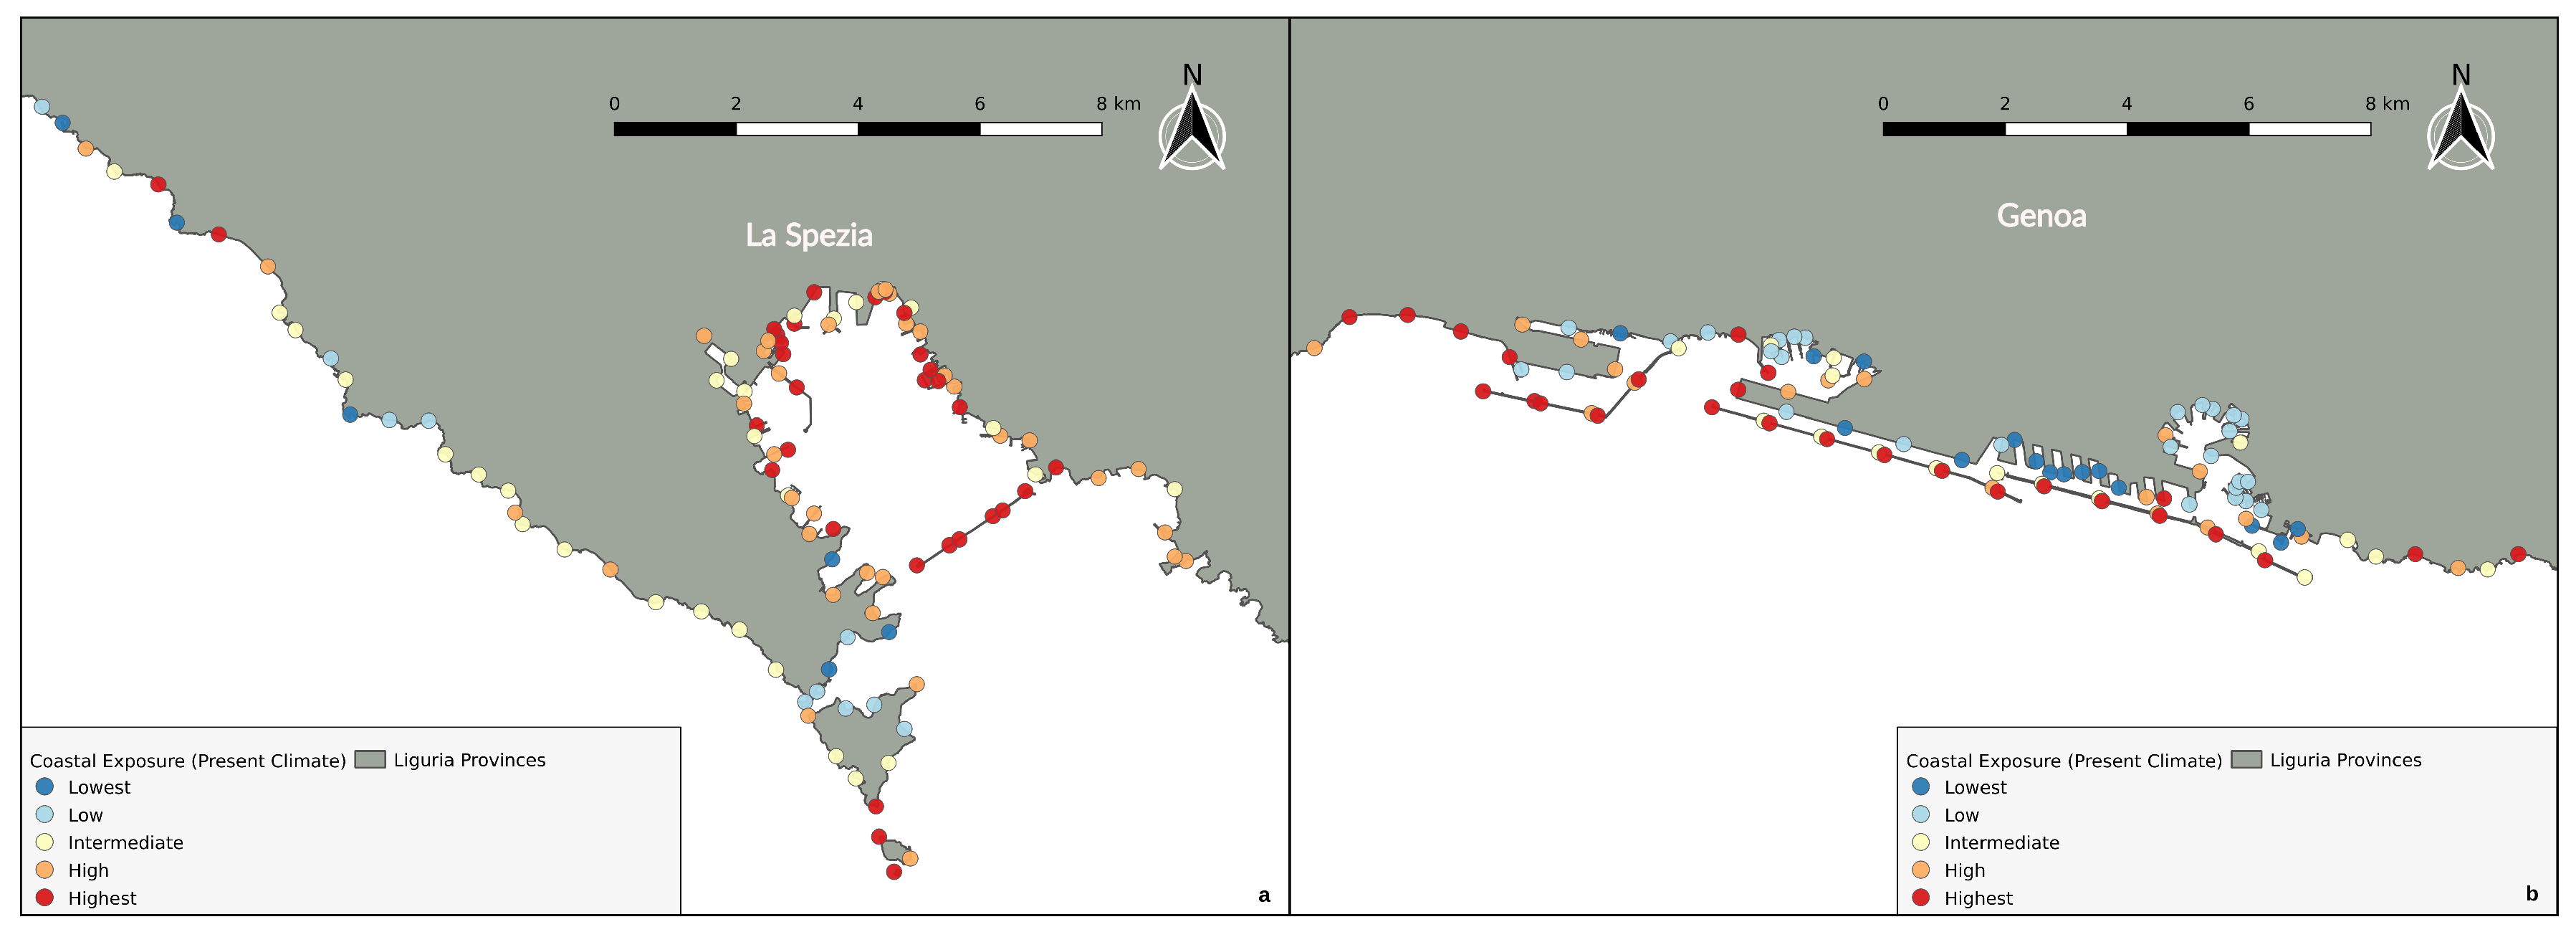
In general, shoreline stretches ranking worse with respect to the overall AOI in terms of the EI are located mostly in front of the port areas of Genoa and La Spezia, to the east of the Portofino promontory (Chiavari and Lavagna municipalities) and close to the westernmost portion of the AOI, in the Savona province (Albenga and Loano municipalities). Some portions of the shoreline present a particularly complex morphology, particularly in port areas where the landmass vector used as input to the model accurately depicts port and coastal defense infrastructure. This is particularly true for the Genoa and La Spezia port areas. Zooming over those areas as shown in Figure 4 allows to highlight that in those complex port areas the model identifies how some portions such as breakwaters are at highest exposure, whereas the innermost portions of portal areas are ranked as less exposed.
Each shore point is associated to values of both the overall EI and individual sub-indices of each bio-geophysical variable contributing to physical exposure. Because of the EI construction (see Section 2.7.2), it is possible for two contiguous shore points to have very different EI values, as it can be noticed in Figure 4. In particular, this happens frequently for shore points that have the same wind and wave exposure, but that fall on shoreline segments that have very different relief or geomorphology ranks: keeping the climate exposure fixed, the shore points located higher above water or in proximity to shoreline defense infrastructure will be less exposed in terms of the relief and geomorphology sub-indices and eventually rank differently in terms of the overall EI.

3.2. Outputs Pertaining to Individual Sub-Indices

The model output type allows to further investigate the main sub-index driver(s) behind the particularly high EI for the areas mentioned above. The very high exposure for several shore points in the Genoa port area can be in general traced back to a combination of absence of habitats potentially providing protection to the coast and a generally very low relief (port infrastructure at very low elevation above water). The model identifies shore points located directly on the breakwater protecting the entrance channel to the port as particularly exposed to waves as well.
For La Spezia, the low relief and lack of habitats still hold true. Moreover, in this instance the model identifies a relatively higher surge potential when compared to the rest of the AOI, due to the bigger distance between this city and the location of the continental shelf edge provided as input to the model.
Coastline stretches pertaining to the municipalities of Chiavari and Lavagna (east of the Portofino promontory) are at highest exposure due to particularly high values of the wind and wave sub-indices. It is worth noting the proximity of these municipalities to Rapallo, whose recorded extreme weather event in 2018 was referenced as a worst-case scenario situation to set model parameters. These findings are also consistent with S-SW (Libeccio) direction being associated to most coastal storms for Liguria [43].
Some sub-indices present a clustering behaviour in space. For instance, shore points ranking the worst in terms of the habitats sub-index are concentrated exclusively in proximity of the two main port areas of the region (Genoa and La Spezia), and those ranking worse in terms of surge potential are located exclusively in La Spezia. Shore points ranking the worst in terms of relief are scattered across the whole regional territory, but are consistently associated to port infrastructure at low elevation above water: for this reason, a lot of shore points of this type are located in the two main port areas of the region.
On the other hand, shore points that are more exposed due to climate variables show less of a spatial clustering behaviour. Shore points ranking badly in terms of wave power are mostly found scattered through the eastern part of the region (Genoa and La Spezia provinces). The same happens with regards to wind exposure, with the worst ranking shore points showing a more scattered distribution in space with still a bit of a prevalence in the eastern portion of the Region.

3.3. Model Outputs Validation

Validating the InVEST Coastal Vulnerability model outputs is a challenging task due to the aggregation of diverse data types and to the qualitative nature of the EI provided. Furthermore, flood risk appraisals are generally difficult to validate against real-life data due to the lack of recorded observations of extreme events location and consequences.
For this case study, an attempt of result validation was performed by comparing model outputs to coastal risk appraisals provided by the Ligurian regional administration in the framework of the Piano di Tutela dell’Ambiente Marino Costiero (PTAMC) [73] for some portions of the Ligurian coastline (’ambiti’ 08-15-16-17-18). The regional administration ranking consisted of 4 ordinal categories. Coastline segments within the areas considered which were not associated to any risk according to the regional appraisal were considered to be at lowest risk for the purpose of this analysis. The regional ranking thus consisted of a total of 5 ordinal risk categories. Regional risk rankings were assigned to InVEST shore points through a spatial join with Voronoi diagram cells generated from InVEST shore points in a GIS environment. In case of multiple categories of the regional ranking pertaining to the same Voronoi cell, the ranking of the biggest shoreline segment was considered. Adopting the same ranking system the InVEST model utilises to assign sub-indices, the EI values associated to the shore points were transformed in 5 categories according to 5 quantiles containing 20% of the EI distribution each (for the whole sample of 457 points). Thus, each shore point was associated to both an InVEST ranking and a regional ranking. The validation subset consisted of 245 shore points out of the original 457 due to the reduced spatial extent of the regional risk appraisal. Table 4 shows a comparison of the two ranking systems considered.
Due to the ranking system adopted, shore points classified according to the InVEST model show an almost uniform distribution, with similar amounts of points falling into each category even when considering the validation sample. Conversely, the vast majority of shore points is at low risk according to the regional classification, and the highest risk is associated to very few points. Assuming the regional classification to better approximate the ground truth within this validation analysis, the InVEST model accuracy can be conveyed by looking at the number of points both appraisal methods classify in the same way. Considering shore points at lowest, low, high and highest risk approximately 32% of the points (79 out of 245) were correctly classified by the InVEST model (bottom-right and upper-left corners of the table) and approximately 40% of the points (98 out of 245) were misclassified.

3.4. Study of the Model’s Sensitivity to Changes in Climate Data Inputs

Sensitivity analyses aim at assessing how variations in model inputs or parameters affect model outputs [74]. The sensitivity analysis presented here intends to highlight how changes in climate variables are translated into changes in the outcome vulnerability computed by the model, keeping all other input variables equal. Results of the sensitivity analysis of the InVEST Coastal Vulnerability model to variations in climate inputs are shown in Table 5.
The percentage of the number of shore points whose value undergoes variation from one climate period to the other is reported in the middle column. The column on the right shows the average variation from one climate period to the other (considering present values minus past values). Different rows are associated to subsequently more aggregate data types. The first row reports the simple interpolation of ERA5-derived climate data for wind and waves to the shore points generated by the model, which can be interpreted as raw data for wind speed (in m/s) and wave energy flux (kW/m). Intermediate outputs are computed by the model as a multiplication of the above-mentioned raw data by other factors such as time and fetch distance. The model then computes wind and wave sub-indices by arranging intermediate outputs in an ordered distribution and then allocating the values to 5 equal bins corresponding to 20% of the distribution each. The 5 bins obtained through this process correspond to ranks 1 to 5 and represent the sub-indices of exposure for wind and waves. The EI is computed by the model as described in Section 2.
These results highlight how the gradual aggregation of data performed by the model induces a progressively more marked masking of the variations in climate data pertaining to different periods. In the case of raw data simply interpolated to shore points before any further computation, all shore points undergo variations between the two climate periods, reflecting the changes in climate patterns. The same happens for intermediate outputs, yet the interpretation of the average variation between periods for these variables is hindered by the complex aggregation of several units of measurement (see [35]).
On the other hand, the ordering and binning process mask most of the variation, resulting in the vast majority of shore points not changing value between the two climate periods when considering both the sub-indices and the resulting EI. The binning procedure also masks the average variation for the wind and wave sub-indices: since two symmetrical variations are always generated, the average variation is always null.
The analyses presented here highlight the main hindrances to the use of the InVEST Coastal Vulnerability model to account for magnitude-of-effect questions [46], including those concerning varying climate scenarios. The data aggregation processes smooth over any variation in the original climate data to the point of rendering almost indistinguishable different climate periods. It might be argued that the original average variations of raw data between periods are of small magnitude to begin with, and that this could result in the lack of variation getting transmitted through the various aggregation steps within the model. Some smoothing in the climate data can indeed be attributed to the need to use periods of at least 5 years for climate data inputs, according to model specifications [35]. Further analyses might therefore need to focus on the creation of synthetic data of more extreme wind and waves to better test the sensitivity of the model to variations of a greater magnitude. Nevertheless, the low percentage of shore points undergoing variations between the two periods when considering the EI (below 5%) and the climate sub-indices (around 3.5% for wind and below 1% for waves) is still noteworthy, if compared to raw data (100% of shore points undergoing variations between periods). Such an asymmetry between raw data and vulnerability metrics represents a relevant methodology limitation, especially in the context of a spatially-explicit assessment methodology aiming to highlight the geographical roots of vulnerability such as the one used for this case study.

4. Discussion

In the Mediterranean Sea basin, atmospheric and ocean dynamics determining sea-level changes are appreciably regionally characterised with regards to the cyclogenesis areas location [75]. Additionally, the relative magnitude of the influence of wind and air pressure on sea levels is markedly significant in semi-enclosed sea basins, as tidal waves get substantially filtered out by straits and other morphological features [76]. Adapting the InVEST model to the Mediterranean Sea basin for the first time entailed tuning the model parameters to account for the much smaller fetch distances over which wind can potentially blow over water (see Section 2.6).
The model parameters also needed to be tuned with regards to the natural habitats of the region. The majority of literature dealing with the characterisation of the potential of coastal habitats to reduce inundation and other adverse impacts has so far focused on habitats that are not present in this geographical context, such as coral reefs, mangroves or kelp forests [68,77]. The coralligenous biocoenosis which is present in the area is akin to a coral reef, but knowledge on its distribution, biology and role within ecosystems is still fragmentary [70]. Other habitats whose flood mitigation potential has been better analysed such as coastal wetlands [6] exist in the Mediterranean Sea basin, though noteworthy instances thereof cannot be found in Liguria specifically [78].
This work aims at contributing to the development of research on exposure to coastal hazards by inquiring about the suitability of the methodology of choice to yield a good enough characterisation of the climate driver component behind the evolution of the coastal flood hazard. To that end, a focus was devoted to the climate data inputs. ERA5 reanalysis data was used as input to the model, instead of the default dataset WaveWatchIII which is suggested for use by model developers. A sensitivity analysis for climate data inputs was also carried out. Both the use of ERA5 data and the creation of different climate scenarios in order to test the InVEST Coastal Vulnerability sensitivity to variations in climate forcings represent novel contributions to research.

4.1. Scope of Application of the Methodology Used

Different choice portfolios can yield different benefit quantities, qualities and values. The InVEST Coastal Vulnerability model’s main field of application is to inform spatial planning in the coastal zone by providing an analysis framework to help discern among decision trade-offs and better identify benefits to population associated to distinctive management choices [45]. The suite of InVEST models focuses primarily on bridging the disconnect between science and practice with regards to benefits to society provided by ecosystems, for instance by rendering explicit within the analysis their contribution to adaptation or mitigation to climate change [46,79]. Such models have been applied in contexts and for communities which have historically been particularly vulnerable to environmental or climate-related hazards, or whose livelihood is strongly tied to the existence and wellbeing of specific ecosystems [50]. Most InVEST models including Coastal Vulnerability were designed to allow use with broadly-available datasets. For this reason, they have found wide application in data-scarce contexts, where more in-depth appraisals might not be feasible or economically viable [3].
Research dealing with vulnerability assessments to climate change is characterised by a significant variety of approaches and a lack of generally agreed-upon best practices and frameworks, leading to a generalised difficulty in comparing research results and assessment outputs [2]. Maps and other communication and decision support tools for the operationalisation of assessment results vary as well [3,28]. This is also due to the high context-dependency of the concept of vulnerability itself, which is echoed by the need to adopt methodologies that are best fit for each specific situation [80].
Evaluating the adherence between vulnerability assessments and reality represents a particularly relevant literature shortcoming, highlighted by a generalised paucity of sensitivity and uncertainty analyses as well as validation efforts with regards to assessment results [3].

4.1.1. Potential of the Approach

The case for keeping into account all dimensions of vulnerability in a comprehensive framework for analysis has been proposed extensively in literature [2,3,80]. Though, this case study analysed the physical exposure component of (outcome) vulnerability exclusively [3,30], in order to focus on how to best account for climate patterns within this type of index-based methodology. The modular nature of the InVEST Coastal Vulnerability model has allowed to carry out the analysis even without the inclusion of socioeconomic data, focusing on the Exposure Index (EI) only.
The InVEST Coastal Vulnerability model is strongly characterised by its spatially-explicit character, providing insights on how and where in space different components of the socio-environmental system interact in determining the overall vulnerability or exposure within the territory. Thus, this approach allowed to take into account the site and context-specific nature of variables and processes contributing to vulnerability locally, which has been highlighted as an aspect of paramount importance in previous literature [46,81]. Both grey and green infrastructure are considered within the analysis, through the inclusion of data pertaining to shore-protection structures and information on local ecosystems.
Index-based approaches to flood vulnerability or exposure assessment such as the one proposed in this work have in general been found to provide relatively trustworthy yet rapid appraisals for specific locations [12,19], and mainly find application in identifying priority areas where action is most likely to add value. Differently from process-based methodologies, index-based approaches providing categorical metrics are not suitable for addressing questions of magnitude-of-effect, such as the quantification of the habitats’ potential to reduce wave heights or current strengths. The choice of the type of approach depends on the questions that need answering and on the phase of policy implementation the appraisals are intended to support [46].
The work carried out for the development of this case study also aimed at better delineating the scope of application of index-based categorical approaches with regards to the inclusion on data on inherently dynamic climate processes. Do this type of methods provide a good enough representation of the ’ground truth’ upon which to orient policy attention? To what extent can their results be subject to validation? What is the scope to carrying out climate scenario analyses through them?

4.1.2. Limitations of the Approach

The case has been made in literature for adopting index-based approaches to coastal flood assessment in order to support solely some phases of the policy-making process and to answer some specific types of questions. Though, the question might still be raised on whether using this type of deterministic and categorical approach early on in the analysis process might result in appraisals that are approximate to the point of misleading the choice of which actions or research objectives to pursue later on.
In general, deterministic and static approaches to coastal flood assessment have shown to lead to substantial overestimation of flood impacts, and are usually considered suitable for first approximation, large-scale flood hazard mapping only [18,37]. Though, [14] highlighted how static approaches perform poorly even for large-scale appraisals, and stressed the need to adopt dynamic process-based methods.
Indicator-based approaches to vulnerability assessment require further inquiry with regards to the choice, aggregation and weighting criteria of diverse data sources into an individual measure [2,30]. Ramieri et al. [31] noted how index-based approaches expressing coastal vulnerability into a one-dimensional and unitless index such as the one provided by the InVEST Coastal Vulnerability model are generally not transparent, as the understanding of underlying assumptions behind the calculations is not conveyed by the final index [2]. As the support to decision-making processes is the core upon which such methodologies are built, the inability to accurately orient attention towards the contextual drivers of vulnerability is possibly the most relevant shortcoming of the approach adopted here.
This work has also described how the data arrangement and ranking procedures, as well as the type of index output by the model make such an approach unsuitable to depict changes in climate variables and thus does not allow to carry out meaningful climate scenarios. The categorical nature of the output index also hinders meaningful interpretations of the results in physical terms, thus limiting the type of result validation attempts available.
In its most established interpretation, exposure is understood as the inventory of elements potentially impacted by adverse events; since the InVEST Coastal Vulnerability model does not provide any information regarding the extent of the areas potentially inundated, no precise inventory of population and assets potentially exposed can be computed based on model outputs.

4.2. Future Developments

A lack of understanding of the dynamic interactions among the risk components has been addressed in the scientific community [82]. For this reason, future developments of this research will prioritise a better depiction of the interplay among the components of the coastal system leading to flood hazard development and unfolding. Ideally, the output of the analysis would be a projected flooded area extent given the climate conditions and local terrain features, in order to obtain results which could to some extent be subject to validation against observed data and used to support climate scenarios.
Methodologies in the field on machine learning (ML) have been shown to be able to capture complex interactions among relevant variables in flood-exposed systems and to resolve processes happening at different timescales [83]. ML is thus currently being used in literature to provide flood susceptibility assessments in a relatively quick and less computationally-intensive way when compared to traditional numerical flood modelling methodologies. Some attempts of applications in coastal areas have been made [83], though most literature proposing such methodologies has so far focused on pluvial and fluvial floods [84,85]. Future developments in this research will entail exploring ways to adopt ML-based techniques to study impacts of ESLs, including the choice of which relevant geomorphological and climate-related flood triggering factors to include in the analysis. The most likely hindrances within this research perspective are finding a methodology which allows a good interpretation of the most important features affecting the model [83], and the high data requirements for model training in the face of a paucity of well documented coastal inundation events [14].

5. Conclusions

The urgency and uncertainty of climate change-induced consequences on coastal communities, primarily in terms of coastal flooding, have resulted in the widespread request for and uptake of coastal vulnerability appraisals. This process has been supported by a flourishing of frameworks and assessment methodologies developed for such a purpose, to the point of bringing about a lack in standardisation and a frequently hasty or inadequate application of best research practices.
Within this context, this work is aimed at studying the suitability of index-based methodologies for coastal vulnerability to accurately convey information on observed variations in climate variables contributing to the generation of Extreme Sea Levels (ESLs) in coastal areas. This research objective is investigated through a case study assessment of the physical exposure component of coastal vulnerability to inundation and erosion for the Italian coastal region Liguria.
The InVEST Coastal Vulnerability model [34] was used within the study area in order to obtain a version of the Coastal Vulnerability Index (CVI) [22,23], based on the aggregation of data on several biogeophysical variables. Particular attention was devoted to the data pertaining to wind speed and wave power; ERA5 reanalysis data [36] was used for the first time to run this model, and two different climate periods were reconstructed from the reanalysis dataset in order to test two climate scenarios within the model.
The results of this case study analysis substantiate previous literature findings regarding index-based methodologies being an advantageous choice in terms of yielding a comprehensive preliminary grasp of coastal vulnerability locally, while still allowing a relative velocity of use, low data input needs and little computational requirements. Most of all, the InVEST Costal Vulnerability model outputs show to be in somewhat good accordance with observed geomorphological characteristics, correctly identifying in space areas most vulnerable because of low elevation above water, specific shoreline type or local bathymetric features.
Nevertheless this work further contributes to emphasise how methodology issues pertaining to data choice, aggregation and indicator computation can impair some applications of coastal vulnerability assessments, particularly regarding the inclusion of climate change variations within the analysis. Within this particular approach, the data aggregation process results in an almost complete loss of the original information conveyed by raw data on climate variables. This results in the unsuitability of this method to accurately reproduce past observed changes or carry out what-if scenarios of climate conditions which might result in ESLs, in support of policymaking processes.
This work originally contributes to literature delineating the perimeter of application of different vulnerability assessment methodologies, by providing an in-depth investigation of the opportunities and drawbacks related to the inclusion within the analysis of data on inherently dynamic climate-change processes.
It suggests that some indicator-based methodologies might produce misleading results if information is not adequately supported by sensitivity analyses and results validation. It further argues that future research in the field should carefully consider the consequences of the methodology of choice on the outcome representation of climate-change impacts, most notably in instances when research outcomes are intended to be used to inform concrete action such as climate adaptation plans for coastal communities and related economic valuations.

Author Contributions

Conceptualization, A.R., L.M. and A.P.; methodology, A.R., L.M. and A.P.; formal analysis, A.R. and L.M.; investigation, A.R. and L.M.; data curation, A.R., L.M. and A.P.; writing—original draft preparation, A.R.; writing—review and editing, A.R., L.M. and A.P.; visualization, A.R.; supervision, L.M. and A.P.; funding acquisition, L.M. and A.P. All authors have read and agreed to the published version of the manuscript.

Funding

Lorenzo Minola is funded by the International Postdoc grant from the Swedish Research Council (2021-00444).

Data Availability Statement

Publicly available datasets were analyzed in this study. Links to the data repositories utilised are reported in Table 1.

Acknowledgments

The authors wish to thank Carlotta Quagliolo (Politecnico and Università di Torino) for the helpful insights on the study area and for the support in setting up the study design. The authors also wish to thank Professor Alessandro Toffoli (University of Melbourne) for the help in obtaining wave data from the ERA5 reanalysis.

Conflicts of Interest

The authors declare no conflict of interest. The funders had no role in the design of the study; in the collection, analyses, or interpretation of data; in the writing of the manuscript; or in the decision to publish the results.

Abbreviations

The following abbreviations are used in this manuscript:
GMSLGlobal mean Sea Level
ESLExtreme Sea Level
RCPRepresentative Concentration Pathway
EUEuropean Union
NBSNature-Based Solutions
InVESTIntegrated Valuation of Ecosystem Services and Tradeoffs
EIExposure Index
CVICoastal Vulnerability Index
AOIArea of Interest
DEMDigital Elevation Model
DBMDigital Bathymetry Model
ECMWFEuropean Centre for Medium-Range Weather Forecasts
EMODnetEuropean Marine Observation and Data Network
GEBCOGeneral Bathymetric Chart of the Oceans
MLMachine Learning

Appendix A

Table A1. Ranks assigned to the geomorphology data input used for the case study.
Shore ClassShore Sub-ClassRank
Artificial CoastlineShore-Parallel Hard Structures (Above Sea Level)2
Artificial CoastlineNot Specified3
Estuary/River MouthNot Specified4
GravelNot Specified4
RockLow-lying Rocky Shore3
RockHigh Cliffs1
RockNot Specified2
SandNot Specified5
Harbour LimitsNot Specified3
Submerged BreakwatersAdherent or Parallel to the Shore3
Table A2. Ranks assigned to the habitats data input used for the case study. In this case study, the protection distance parameter was derived through the approach suggested by model developers for cases where there is limited published literature regarding the distance at which habitats can provide protection to the coastline [35]. The values in the middle column therefore reflect the average distance between the location of a given habitat and the shoreline in the given AOI.
Habitat NameProtection Distance [m]Rank
Coralligenous Biocoenosis20001
Cymodocea Nodosa8003
Posidonia Oceanica (Neptune Grass)12003
Caulerpa5004
Sciaphilous Algae1004
Photophilic Algae1504

References

  1. Oppenheimer, M.; Glavovic, B.; Hinkel, J.; van de Wal, R.; Magnan, A.; Abd-Elgawad, A.; Cai, R.; Cifuentes-Jara, M.; DeConto, R.; Ghosh, T.; et al. Sea Level Rise and Implications for Low-Lying Islands, Coasts and Communities. In IPCC Special Report on the Ocean and Cryosphere in a Changing Climate; IPCC Intergovernmental Panel on Climate Change: Geneva, Switzerland, 2019. [Google Scholar]
  2. Nguyen, T.T.; Bonetti, J.; Rogers, K.; Woodroffe, C.D. Indicator-based assessment of climate-change impacts on coasts: A review of concepts, methodological approaches and vulnerability indices. Ocean Coast. Manag. 2016, 123, 18–43. [Google Scholar] [CrossRef] [Green Version]
  3. Bukvic, A.; Rohat, G.; Apotsos, A.; de Sherbinin, A. A Systematic Review of Coastal Vulnerability Mapping. Sustainability 2020, 12, 2822. [Google Scholar] [CrossRef] [Green Version]
  4. Moatti, J.P.; Thiébault, S. (Eds.) The Mediterranean Region Under Climate Change. A Scientific Update; IRD Éditions: Marseille, France, 2016. [Google Scholar]
  5. Ali, E.; Cramer, W.; Carnicer, J.; Georgopoulou, E.; Hilmi, N.; Le Cozannet, G.; Lionello, P. Cross-Chapter Paper 4: Mediterranean Region. In Climate Change 2022: Impacts, Adaptation and Vulnerability. Contribution of Working Group II to the Sixth Assessment Report of the Intergovernmental Panel on Climate Change; Cambridge University Press: Cambridge, UK; New York, NY, USA, 2022. [Google Scholar]
  6. Nicholls, R.J.; Hoozemans, F.M.; Marchand, M. Increasing flood risk and wetland losses due to global sea-level rise: Regional and global analyses. Glob. Environ. Chang. 1999, 9, S69–S87. [Google Scholar] [CrossRef]
  7. Marcos, M.; Jordà, G.; Gomis, D.; Pérez, B. Changes in storm surges in southern Europe from a regional model under climate change scenarios. Glob. Planet. Chang. 2011, 77, 116–128. [Google Scholar] [CrossRef]
  8. Conte, D.; Lionello, P. Characteristics of large positive and negative surges in the Mediterranean Sea and their attenuation in future climate scenarios. Glob. Planet. Chang. 2013, 111, 159–173. [Google Scholar] [CrossRef]
  9. Lionello, P.; Cogo, S.; Galati, M.; Sanna, A. The Mediterranean surface wave climate inferred from future scenario simulations. Glob. Planet. Chang. 2008, 63, 152–162. [Google Scholar] [CrossRef]
  10. IPCC. IPCC Common Methodology (CM). Update provided in Appendix C in IPCC CZMS, 1992. In Global Climate Change and the Rising Challenge of the Sea; Report of the Coastal Zone Management Subgroup; IPCC Response Strategies Working Group, Rijkswaterstaat: The Hague, The Netherlands, 1991. [Google Scholar]
  11. Field, C.; Barros, V.; Dokken, D.; Mach, K.; Mastrandrea, M.; Bilir, T.; Chatterjee, M.; Ebi, Y.; Estrada, Y.; Genova, R.; et al. IPCC, 2014: Summary for Policymakers. Climate Change 2014: Impacts, Adaptation, and Vulnerability. Part A: Global and Sectoral Aspects. In Contribution of Working Group II to the Fifth Assessment Report of the Intergovernmental Panel on Climate Change; IPCC: Geneva, Switzerland, 2014. [Google Scholar]
  12. Bigi, V.; Comino, E.; Fontana, M.; Pezzoli, A.; Rosso, M. Flood Vulnerability Analysis in Urban Context: A Socioeconomic Sub-Indicators Overview. Climate 2021, 9, 121. [Google Scholar] [CrossRef]
  13. Vousdoukas, M.I.; Mentaschi, L.; Voukouvalas, E.; Bianchi, A.; Dottori, F.; Feyen, L. Climatic and socioeconomic controls of future coastal flood risk in Europe. Nat. Clim. Chang. 2012, 8, 776–780. [Google Scholar] [CrossRef]
  14. Vousdoukas, M.I.; Voukouvalas, E.; Mentaschi, L.; Dottori, F.; Giardino, A.; Bouziotas, D.; Bianchi, A.; Salamon, P.; Feyen, L. Developments in large-scale coastal flood hazard mapping. Nat. Hazards Earth Syst. Sci. 2016, 16, 1841–1853. [Google Scholar] [CrossRef] [Green Version]
  15. Tebaldi, C.; Strauss, B.H.; Zervas, C.E. Modelling sea level rise impacts on storm surges along US coasts. Environ. Res. Lett. 2012, 7, 014032. [Google Scholar] [CrossRef]
  16. Jongman, B.; Ward, P.J.; Aerts, J.C. Global exposure to river and coastal flooding: Long term trends and changes. Glob. Environ. Chang. 2012, 22, 823–835. [Google Scholar] [CrossRef]
  17. Vousdoukas, M.; Mentaschi, L.; Voukouvalas, E.; Feyen, L. PESETA III, Task 8: Coastal Impacts. In Technical Report LB-NA-28243-EN-N; Publications Office of the European Union: Luxembourg, 2019. [Google Scholar]
  18. Gallien, T.; Sanders, B.; Flick, R. Urban coastal flood prediction: Integrating wave overtopping, flood defenses and drainage. Coast. Eng. 2014, 91, 18–28. [Google Scholar] [CrossRef]
  19. Nasiri, H.; Mohd Yusof, M.J.; Mohammad Ali, T.A. An overview to flood vulnerability assessment methods. Sustain. Water Resour. Manag. 2016, 2, 331–336. [Google Scholar] [CrossRef] [Green Version]
  20. Abuodha, P.A.; Woodroffe, C.D. 12 Vulnerability assessment. In Coastal Zone Management; Thomas Telford Limited: London, UK, 2015; pp. 262–290. [Google Scholar] [CrossRef] [Green Version]
  21. Torresan, S.; Critto, A.; Rizzi, J.; Marcomini, A. Assessment of coastal vulnerability to climate change hazards at the regional scale: The case study of the North Adriatic Sea. Nat. Hazards Earth Syst. Sci. 2012, 12, 2347–2368. [Google Scholar] [CrossRef]
  22. Gornitz, V. Vulnerability of the East Coast, U.S.A. to Future Sea Level Rise. J. Coast. Res. 1990, 9, 201–237. [Google Scholar]
  23. Hammar-Klose, E.S.; Thieler, E.R. Coastal Vulnerability to Sea-Level Rise: A Preliminary Database for the U.S. Atlantic, Pacific, and Gulf of Mexico Coasts; U.S. Geological Survey: Reston, VA, USA, 2001. [CrossRef]
  24. Boruff, B.J.; Emrich, C.; Cutter, S.L. Erosion Hazard Vulnerability of US Coastal Counties. J. Coast. Res. 2005, 2005, 932–942. [Google Scholar] [CrossRef] [Green Version]
  25. Cutter, S.L.; Boruff, B.J.; Shirley, W.L. Social Vulnerability to Environmental Hazards*. Soc. Sci. Q. 2003, 84, 242–261. [Google Scholar] [CrossRef]
  26. Balica, S.F.; Wright, N.G.; van der Meulen, F. A flood vulnerability index for coastal cities and its use in assessing climate change impacts. Nat. Hazards 2012, 64, 73–105. [Google Scholar] [CrossRef] [Green Version]
  27. Skoulikaris, C.; Makris, C.; Katirtzidou, M.; Baltikas, V.; Krestenitis, Y. Assessing the Vulnerability of a Deltaic Environment due to Climate Change Impact on Surface and Coastal Waters: The Case of Nestos River (Greece). Environ. Model. Assess. 2021, 26, 459–486. [Google Scholar] [CrossRef]
  28. de Sherbinin, A.; Bukvic, A.; Rohat, G.; Gall, M.; McCusker, B.; Preston, B.; Apotsos, A.; Fish, C.; Kienberger, S.; Muhonda, P.; et al. Climate vulnerability mapping: A systematic review and future prospects. WIREs Clim. Chang. 2019, 10, e600. [Google Scholar] [CrossRef]
  29. Molinari, D.; De Bruijn, K.M.; Castillo-Rodríguez, J.T.; Aronica, G.T.; Bouwer, L.M. Validation of flood risk models: Current practice and possible improvements. Int. J. Disaster Risk Reduct. 2019, 33, 441–448. [Google Scholar] [CrossRef]
  30. Füssel, H.M. Review and Quantitative Analysis of Indices of Climate Change Exposure, Adaptive Capacity, Sensitivity, and Impacts; The World Bank: Washington DC, USA, 2010. [Google Scholar]
  31. Ramieri, E.; Hartley, A.; Barbanti, A.; Duarte Santos, F.; Gomes, A.; Hilden, M.; Laihonen, P.; Marinova, N.; Santini, M. Methods for Assessing Coastal Vulnerability to Climate Change; ETC/CCA Technical Paper I-40127: Bologna, Italy, 2011. [Google Scholar]
  32. Quagliolo, C.; Comino, E.; Pezzoli, A. Experimental Flash Floods Assessment Through Urban Flood Risk Mitigation (UFRM) Model: The Case Study of Ligurian Coastal Cities. Front. Water 2021, 3. [Google Scholar] [CrossRef]
  33. Regione Liguria. Interventi Straordinari e di Emergenza. Available online: https://www.regione.liguria.it/homepage-attivita-istituzionale/trasparenza/amministrazione-trasparente/interventi-straordinari-e-di-emergenza.html (accessed on 20 January 2023).
  34. Sharp, R.; Douglass, S.; Wolny, S.; Arkema, K.; Bernhardt, J.; Bierbower, W.; Chaumont, N.; Denu, D.; Fisher, D.; Glowinski, K.; et al. InVEST User Guide; The Natural Capital Project; Stanford University, University of Minnesota, The Nature Conservancy, and World Wildlife Fund: Stanford, CA, USA, 2020. [Google Scholar]
  35. InVEST User Guide. Available online: http://releases.naturalcapitalproject.org/invest-userguide/latest/coastal_vulnerability.html (accessed on 2 December 2022).
  36. Hersbach, H.; Bell, B.; Berrisford, P.; Hirahara, S.; Horányi, A.; Muñoz-Sabater, J.; Nicolas, J.; Peubey, C.; Radu, R.; Schepers, D.; et al. The ERA5 global reanalysis. Q. J. R. Meteorol. Soc. 2020, 146, 1999–2049. [Google Scholar] [CrossRef]
  37. Gallien, T.W.; Kalligeris, N.; Delisle, M.P.C.; Tang, B.X.; Lucey, J.T.D.; Winters, M.A. Coastal Flood Modeling Challenges in Defended Urban Backshores. Geosciences 2018, 8, 450. [Google Scholar] [CrossRef] [Green Version]
  38. Italian National Institute of Statistics (ISTAT). Popolazione residente al 1 Gennaio 2022. Available online: https://demo.istat.it/app/?i=POS&l=it (accessed on 24 October 2022).
  39. Agenzia Regionale per la Protezione dell’Ambiente Ligure (ARPAL). Atlante Climatico della Liguria. Available online: https://www.arpal.liguria.it/contenuti_statici/clima/atlante/Atlante_climatico_della_Liguria.pdf (accessed on 26 October 2022).
  40. Piano Nazionale di Adattamento ai Cambiamenti Climatici (PNACC). 2018. Available online: https://www.mite.gov.it/sites/default/files/archivio/allegati/clima/pnacc.pdf (accessed on 25 October 2022).
  41. Fratianni, C.; Pinardi, N.; Lalli, F.; Simoncelli, S.; Coppini, G.; Pesarino, V.; Bruschi, A.; Cassese, M.; Drudi, M. Operational oceanography for the Marine Strategy Framework Directive: the case of the mixing indicator. J. Oper. Oceanogr. 2016, 9, s223–s233. [Google Scholar] [CrossRef]
  42. Rete Mareografica Nazionale. Available online: https://www.mareografico.it/?session=0S1164445412ETER72BHD&syslng=ita&sysmen=-1&sysind=-1&syssub=-1&sysfnt=0&code=STAZ&idst=2G (accessed on 25 October 2022).
  43. Regione Liguria. Piano di Tutela dell’Ambiente Marino e Costiero. Relazione sul Clima Ondoso al Largo (RO). Available online: https://www.regione.liguria.it/component/publiccompetitions/document/40334.html?view=document&id=40334:relazione-sul-clima-ondoso-al-largo-ro&Itemid=4630 (accessed on 26 October 2022).
  44. Agenzia Regionale per la Protezione dell’Ambiente Ligure (ARPAL). Riassunto Meteorologico Mensile. Ottobre 2018. Available online: https://www.arpal.liguria.it/contenuti_statici/pubblicazioni/rapporti_mensili/2018/201810_ottobre_meteo.pdf (accessed on 11 January 2023).
  45. Guerry, A.D.; Ruckelshaus, M.H.; Arkema, K.K.; Bernhardt, J.R.; Guannel, G.; Kim, C.K.; Marsik, M.; Papenfus, M.; Toft, J.E.; Verutes, G.; et al. Modeling benefits from nature: Using ecosystem services to inform coastal and marine spatial planning. Int. J. Biodivers. Sci. Ecosyst. Serv. Manag. 2012, 8, 107–121. [Google Scholar] [CrossRef] [Green Version]
  46. Ruckelshaus, M.H.; Guannel, G.; Arkema, K.; Verutes, G.; Griffin, R.; Guerry, A.; Silver, J.; Faries, J.; Brenner, J.; Rosenthal, A. Evaluating the Benefits of Green Infrastructure for Coastal Areas: Location, Location, Location. Coast. Manag. 2016, 44, 504–516. [Google Scholar] [CrossRef]
  47. Ballesteros, C.; Esteves, L.S. Integrated Assessment of Coastal Exposure and Social Vulnerability to Coastal Hazards in East Africa. Estuaries Coasts 2021, 44, 2056–2072. [Google Scholar] [CrossRef] [PubMed]
  48. Hopper, T.; Meixler, M.S. Modeling Coastal Vulnerability Through Space and Time. PLoS ONE 2016, 11, e0163495. [Google Scholar] [CrossRef] [Green Version]
  49. Cunha, J.; Cardona, F.S.; Bio, A.; Ramos, S. Importance of Protection Service Against Erosion and Storm Events Provided by Coastal Ecosystems Under Climate Change Scenarios. Front. Mar. Sci. 2021, 8. [Google Scholar] [CrossRef]
  50. Silver, J.M.; Arkema, K.K.; Griffin, R.M.; Lashley, B.; Lemay, M.; Maldonado, S.; Moultrie, S.H.; Ruckelshaus, M.; Schill, S.; Thomas, A.; et al. Advancing Coastal Risk Reduction Science and Implementation by Accounting for Climate, Ecosystems, and People. Front. Mar. Sci. 2019, 6, 1–19. [Google Scholar] [CrossRef] [Green Version]
  51. Vrdoljak, L. Comparison and Analysis of Publicly Available Bathymetry Models in the East Adriatic Sea. Naše More 2021, 68, 110–119. [Google Scholar] [CrossRef]
  52. Hersbach, H.; de Rosnay, P.; Bell, B.; Schepers, D.; Simmons, A.; Soci, C.; Abdalla, S.; Alonso-Balmaseda, M.; Balsamo, G.; Bechtold, P.; et al. Operational global reanalysis: Progress, future directions and synergies with NWP. In ERA Report Series; European Centre for Medium Range Weather Forecasts: Reading, UK, 2018. [Google Scholar] [CrossRef]
  53. Minola, L.; Zhang, F.; Azorin-Molina, C.; Pirooz, A.A.S.; Flay, R.G.J.; Hersbach, H.; Chen, D. Near-surface mean and gust wind speeds in ERA5 across Sweden: Towards an improved gust parametrization. Clim. Dyn. 2020, 55, 887–907. [Google Scholar] [CrossRef]
  54. Chiaravalloti, F.; Caloiero, T.; Coscarelli, R. The Long-Term ERA5 Data Series for Trend Analysis of Rainfall in Italy. Hydrology 2022, 9, 18. [Google Scholar] [CrossRef]
  55. Barbariol, F.; Davison, S.; Falcieri, F.M.; Ferretti, R.; Ricchi, A.; Sclavo, M.; Benetazzo, A. Wind Waves in the Mediterranean Sea: An ERA5 Reanalysis Wind-Based Climatology. Front. Mar. Sci. 2021, 8. [Google Scholar] [CrossRef]
  56. Vannucchi, V.; Taddei, S.; Capecchi, V.; Bendoni, M.; Brandini, C. Dynamical Downscaling of ERA5 Data on the North-Western Mediterranean Sea: From Atmosphere to High-Resolution Coastal Wave Climate. J. Mar. Sci. Eng. 2021, 9, 208. [Google Scholar] [CrossRef]
  57. European Centre for Medium-Range Weather Forecasts (ECMWF). ERA5: How to Calculate Wind Speed and Wind Direction from u and v Components of the Wind? Available online: http://confluence.ecmwf.int/pages/viewpage.action?pageId=133262398 (accessed on 27 October 2022).
  58. Rusu, L.; Rusu, E. Evaluation of the Worldwide Wave Energy Distribution Based on ERA5 Data and Altimeter Measurements. Energies 2021, 14, 394. [Google Scholar] [CrossRef]
  59. Thomas, G. Wave Power—The Theory Behind Ocean Waves. AZoCleantech. 2012. Available online: https://www.azocleantech.com/article.aspx?ArticleID=227 (accessed on 22 February 2022).
  60. European Environment Agency (EEA). Reference Maps of SLR Projections for Europe. Available online: https://www.eea.europa.eu/ims/global-and-european-sea-level-rise (accessed on 5 December 2022).
  61. Brázdil, R.; Zahradníček, P.; Dobrovolný, P.; Řehoř, J.; Trnka, M.; Lhotka, O.; Štěpánek, P. Circulation and Climate Variability in the Czech Republic between 1961 and 2020: A Comparison of Changes for Two Normal Periods. Atmosphere 2022, 13, 137. [Google Scholar] [CrossRef]
  62. World Meteorological Organization (WMO). WMO Guidelines on the Calculation of Climate Normals, 2017 ed.; WMO report No. 1203; WMO: Geneva, Switzerland, 2017. [Google Scholar]
  63. Seddon, N.; Chausson, A.; Berry, P.; Girardin, C.A.J.; Smith, A.; Turner, B. Understanding the value and limits of nature-based solutions to climate change and other global challenges. Philos. Trans. R. Soc. B Biol. Sci. 2020, 375, 20190120. [Google Scholar] [CrossRef] [Green Version]
  64. Costanza, R.; Pérez-Maqueo, O.; Martinez, M.L.; Sutton, P.; Anderson, S.J.; Mulder, K. The value of coastal wetlands for hurricane protection. Ambio 2008, 37, 241–248. [Google Scholar] [CrossRef]
  65. Barbier, E.B.; Hacker, S.D.; Kennedy, C.; Koch, E.W.; Stier, A.C.; Silliman, B.R. The value of estuarine and coastal ecosystem services. Ecol. Monogr. 2011, 81, 169–193. [Google Scholar] [CrossRef]
  66. Arkema, K.; Guannel, G.; Verutes, G.; Wood, S.A.; Ruckelshaus, M.; Kareiva, P.; Lacayo, M.; Silver, J.M. Coastal habitats shield people and property from sea-level rise and storms. Nat. Clim. Chang. 2013, 3, 913–918. [Google Scholar] [CrossRef]
  67. James, R.K.; Lynch, A.; Herman, P.M.J.; van Katwijk, M.M.; van Tussenbroek, B.I.; Dijkstra, H.A.; van Westen, R.M.; van der Boog, C.G.; Klees, R.; Pietrzak, J.D.; et al. Tropical Biogeomorphic Seagrass Landscapes for Coastal Protection: Persistence and Wave Attenuation During Major Storms Events. Ecosystems 2021, 24, 301–318. [Google Scholar] [CrossRef]
  68. Guannel, G.; Arkema, K.; Ruggiero, P.; Verutes, G. The Power of Three: Coral Reefs, Seagrasses and Mangroves Protect Coastal Regions and Increase Their Resilience. PLoS ONE 2016, 11, e0158094. [Google Scholar] [CrossRef] [PubMed] [Green Version]
  69. Serra, T.; Gracias, N.; Hendriks, I.E. Fragmentation in Seagrass Canopies Can Alter Hydrodynamics and Sediment Deposition Rates. Water 2020, 12, 3473. [Google Scholar] [CrossRef]
  70. Ingrosso, G.; Abbiati, M.; Badalamenti, F.; Bavestrello, G.; Belmonte, G.; Cannas, R.; Benedetti-Cecchi, L.; Bertolino, M.; Bevilacqua, S.; Bianchi, C.N.; et al. Mediterranean Bioconstructions Along the Italian Coast. Adv. Mar. Biol. 2018, 79, 61–136. [Google Scholar] [CrossRef]
  71. Realizzazione Della Nuova Diga Foranea di Genova Ambito Bacino di Sampierdarena. Volume 5—Studio Meteomarino. Available online: https://dpdigaforanea.it/wp-content/uploads/MI046R-PF-D-Z-R-005-01_STUDIO%20METEOMARINO.pdf (accessed on 26 April 2022).
  72. GEBCO Bathymetric Compilation Group. The GEBCO 2020 Grid—A Continuous Terrain Model of the Global Oceans and Land. 2020. Available online: https://doi.org/10.5285/a29c5465-b138-234d-e053-6c86abc040b9 (accessed on 30 May 2022).
  73. Piano di Tutela dell’Ambiente Marino e Costiero (PTAMC). Available online: https://www.regione.liguria.it/homepage-ambiente/cosa-cerchi/acqua/mare-e-costa/competenze-regione/piano-di-tutela-dell-ambiente-marino-costiero.html (accessed on 30 November 2022).
  74. Bennett, N.D.; Croke, B.F.; Guariso, G.; Guillaume, J.H.; Hamilton, S.H.; Jakeman, A.J.; Marsili-Libelli, S.; Newham, L.T.; Norton, J.P.; Perrin, C.; et al. Characterising performance of environmental models. Environ. Model. Softw. 2013, 40, 1–20. [Google Scholar] [CrossRef]
  75. Lionello, P.; Barriopedro, D.; Ferrarin, C.; Nicholls, R.J.; Orlić, M.; Raicich, F.; Reale, M.; Umgiesser, G.; Vousdoukas, M.; Zanchettin, D. Extreme floods of Venice: Characteristics, dynamics, past and future evolution (review article). Nat. Hazards Earth Syst. Sci. 2021, 21, 2705–2731. [Google Scholar] [CrossRef]
  76. Rutgersson, A.; Kjellström, E.; Haapala, J.; Stendel, M.; Danilovich, I.; Drews, M.; Jylhä, K.; Kujala, P.; Larsén, X.G.; Halsnæs, K.; et al. Natural hazards and extreme events in the Baltic Sea region. Earth Syst. Dyn. 2022, 13, 251–301. [Google Scholar] [CrossRef]
  77. Gaylord, B.; Rosman, J.H.; Reed, D.C.; Koseff, J.R.; Fram, J.; MacIntyre, S.; Arkema, K.; McDonald, C.; Brzezinski, M.A.; Largier, J.L.; et al. Spatial patterns of flow and their modification within and around a giant kelp forest. Limnol. Oceanogr. 2007, 52, 1838–1852. [Google Scholar] [CrossRef]
  78. Tinelli, A.; Folleto, A.; Frattarelli, F.; Maffei, L.; Musicanti, A.; Recanatesi, F. Le Zone Umide; Accademia Nazionale delle Scienze detta dei Quaranta: Roma, Italy, 2012; pp. 16–22. [Google Scholar]
  79. Arkema, K.K.; Abramson, S.C.; Dewsbury, B.M. Marine ecosystem-based management: From characterization to implementation. Front. Ecol. Environ. 2006, 4, 525–532. [Google Scholar] [CrossRef]
  80. Hinkel, J.; Bisaro, A. Methodological choices in solution-oriented adaptation research: A diagnostic framework. Reg. Environ. Chang. 2016, 16, 7–20. [Google Scholar] [CrossRef]
  81. Weis, S.W.M.; Agostini, V.N.; Roth, L.M.; Gilmer, B.; Schill, S.R.; Knowles, J.E.; Blyther, R. Assessing vulnerability: An integrated approach for mapping adaptive capacity, sensitivity, and exposure. Clim. Chang. 2016, 136, 615–629. [Google Scholar] [CrossRef] [Green Version]
  82. Reisinger, A.; Howden, M.; Vera, C.; Garschagen, M.; Hurlbert, M.; Kreibiehl, S.; Mach, K.J.; Mintenbeck, K.; O’Neill, B.; Pathak, M.; et al. The Concept of Risk in the IPCC Sixth Assessment Report. A Summary of Cross-Working Group Discussions; Intergovernmental Panel on Climate Change: Geneva, Switzerland, 2020. [Google Scholar]
  83. Zanetti, M.; Allegri, E.; Sperotto, A.; Torresan, S.; Critto, A. Spatio-temporal cross-validation to predict pluvial flood events in the Metropolitan City of Venice. J. Hydrol. 2022, 612, 128150. [Google Scholar] [CrossRef]
  84. Chen, J.; Huang, G.; Chen, W. Towards better flood risk management: Assessing flood risk and investigating the potential mechanism based on machine learning models. J. Environ. Manag. 2021, 293, 112810. [Google Scholar] [CrossRef]
  85. Wang, Y.; Fang, Z.; Hong, H.; Peng, L. Flood susceptibility mapping using convolutional neural network frameworks. J. Hydrol. 2020, 582, 124482. [Google Scholar] [CrossRef]
Figure 1. Map of the study area. The La Spezia measurement buoy and the Genova Università weather station referenced in Section 2.1 are represented respectively as a yellow star and as a red asterisk. The Area of Interest (AOI) within which the InVEST Coastal Vulnerability model was run is marked by the blue dotted line. The location of the ERA5 grid points used for retrieval of climate data are represented as pink dots.
Climate 11 00056 g001
Figure 2. Case study workflow. Grey ellipses represent the main categories of data sources. Data for which a pre-processing has been carried out in a GIS environment (geomorphology and habitat data for data selection and shapefile creation, bathymetry data for quality comparison within the AOI) are connected to the corresponding green rectangles. The main data pre-processing, data selection, parameters setting and scenario creation steps are summarised in the middle part of the workflow (delineated by a dotted perimeter). The three main data analysis steps carried out on model results are pictured as dark blue rectangles on the right of the workflow diagram.
Climate 11 00056 g002
Figure 3. Map of the Exposure Index for the whole area considered in the case study assessment. The Area of Interest (AOI) polygon within which the InVEST Coastal Vulnerability model was run is also highlighted in the map. Liguria’s location within the rest of the landmass is highlighted in red in the upper left corner of the map. Dotted ellipses delineate the location of the two main port areas of the AOI, for which zoomed maps are proposed in Figure 4.
Climate 11 00056 g003
Figure 4. Map of the Exposure Index. Image zooms on the port areas of (a) La Spezia and (b) Genoa highlighting the location of the shore points on portal infrastructure. The location of the two areas within the broader regional context is highlighted in Figure 3. The shore points are styled in the same way as in the map of the whole area considered.
Climate 11 00056 g004
Figure 5. Distribution of the Exposure Index (EI). The plot is styled based on the 5 quantiles containing 20% of the distribution of the EI each. The colours are the same used in the maps presented in Figure 3 and Figure 4.
Climate 11 00056 g005
Table 1. Data inputs for the InVEST Coastal Vulnerability model runs.
Data Layer NameData Type and Spatial ResolutionSourceReference Year(s)Bio-Geophysical Variable
Digital Elevation Model (DEM)Raster; 5 m × 5 mhttps://geoportal.regione.liguria.it/catalogo/mappe.html Geoportale Liguria (accessed on 6 June 2022)2022Relief
Linea di CostaVector; 1:5000https://geoportal.regione.liguria.it/catalogo/mappe.html Geoportale Liguria (accessed on 22 February 2022)2019Geomorphology
SpiaggeVector; 1:5000https://geoportal.regione.liguria.it/catalogo/mappe.html Geoportale Liguria (accessed on 22 February 2022)2016Geomorphology
Costa AltaVector; 1:5000https://geoportal.regione.liguria.it/catalogo/mappe.html Geoportale Liguria (accessed on 22 February 2022)2016Geomorphology
Opere di Difesa CostiereVector; 1:5000https://geoportal.regione.liguria.it/catalogo/mappe.html Geoportale Liguria (accessed on 22 February 2022)2016Geomorphology
EMODnet BathymetryRaster; 1/16 arc minutehttps://portal.emodnet-bathymetry.eu/# EMODnet Product Catalogue (accessed on 30 May 2022)2018Wave Height and Period
Continental Shelf EdgeVector; NAhttp://releases.naturalcapitalproject.org/?prefix=invest/3.11.0/data/ Default Datasets NatCap Project (accessed on 6 January 2022)NASurge
ERA5 u-component of 10-m wind (hourly data)Raster; 0.5° × 0.5°https://cds.climate.copernicus.eu/#!/home CDS Website (accessed on 2 March 2022)1961–1990; 1991–2020Wind Speed
ERA5 v-component of 10-m wind (hourly data)Raster; 0.5° × 0.5°https://cds.climate.copernicus.eu/#!/home CDS Website (accessed on 2 March 2022)1961–1990; 1991–2020Wind Speed
ERA5 significant height of combined wind waves and swell (hourly data)Raster; 0.5° × 0.5°https://cds.climate.copernicus.eu/#!/home CDS Website (accessed on 2 March 2022)1961–1990; 1991–2020Wave Power
ERA5 peak wave period (hourly data)Raster; 0.5° × 0.5°https://cds.climate.copernicus.eu/#!/home CDS Website (accessed on 2 March 2022)1961–1990; 1991–2020Wave Power
ERA5 mean wave direction (hourly data)Raster; 0.5° × 0.5°https://cds.climate.copernicus.eu/#!/home CDS Website (accessed on 2 March 2022)1961–1990; 1991–2020Wave Power
Atlante Habitat Marini della LiguriaVector; 1:10,000https://geoportal.regione.liguria.it/catalogo/mappe.html Geoportale Liguria (accessed on 28 November 2022)2020Habitats
Table 2. Adaptation of the guidance ranking table for the InVEST Coastal Vulnerability model proposed by [35] [perc. = percentile]. The last column highlights the rank calculation method for each sub-index considered in the case study, differentiating between ranks computed by the model for each shore point based on intermediate outputs and ranks assigned by the model user to the different geomorphological or habitat categories present in the respective data inputs. Ranks assigned to geomorphology and habitat data inputs in this case study are reported in Table A1 and Table A2.
Model Sub-IndexRankRank Calculation Method
12345
(lowest)(low)(intermediate)(high)(highest)
Wind Exposure0–20 perc.21–40 perc.41–60 perc.61–80 perc.81–100 perc.Computed by the model
Wave Exposure0–20 perc.21–40 perc.41–60 perc.61–80 perc.81–100 perc.Computed by the model
Surge Potential0–20 perc.21–40 perc.41–60 perc.61–80 perc.81–100 perc.Computed by the model
Relief81–100 perc.61–80 perc.41–60 perc.21–40 perc.0–20 perc.Computed by the model
Geomorphologye.g., rocky high cliffse.g., indented coastse.g., low cliffse.g., cobble beache.g., sand beachAssigned by user
Natural Habitatse.g., coral reefe.g., marshe.g., low dunese.g., sea grasse.g., no habitatsAssigned by user
Table 3. Summary statistics of the Exposure Index (EI) and the two habitats and geomorphology sub-indices for the current climate period (1991–2020).
StatisticEIHabitatsGeomorphology
Minimum1.431.371
Maximum4.0655
Mean2.713.122.87
Median2.682.993
Standard Deviation0.511.500.53
Table 4. Validation of InVEST model results against coastal risk appraisals provided by the Regional Administration. Values in bold italics represent the shore points that are classified in the same way by the two methods considered as being at lowest, low, high and highest risk.
Regional Risk ClassificationInVEST Coastal Vulnerability Model Classification (EI)
LowestLowIntermediateHighHighestTotal Regional
Lowest88971143
Low1923394027148
Intermediate3415114
High38651537
Highest110013
Total InVEST3444555755245
Table 5. Analysis of model sensitivity to variations in climate data inputs between the two 30-year climate periods spanning 1961–1990 and 1991–2020.
Variable% Shore Points Undergoing VariationAverage Variation (Present–Past)
Wind Speed Interpolated to Shore Points (m/s)100%−0.14 m/s (−1.52%)
Wave Power Interpolated to Shore Points (kW/m)100%−0.79 kW/m (−6.5%)
Intermediate Model Output for Wind100%−42,345.77 (−12.6%)
Intermediate Model Output for Waves100%−0.126 (−4.96%)
Wind Sub—Index (range 1–5; integers only)3.5%0 (0%)
Wave Sub—Index (range 1–5; integers only)0.87%0 (0%)
Exposure Index (range 1–5)4.37%−0.0098 (−0.36%)
Disclaimer/Publisher’s Note: The statements, opinions and data contained in all publications are solely those of the individual author(s) and contributor(s) and not of MDPI and/or the editor(s). MDPI and/or the editor(s) disclaim responsibility for any injury to people or property resulting from any ideas, methods, instructions or products referred to in the content.

