
Hydrological and Meteorological Variability in the Volga River Basin under Global Warming by 1.5 and 2 Degrees


Abstract
:1. Introduction
2. Data and Methods
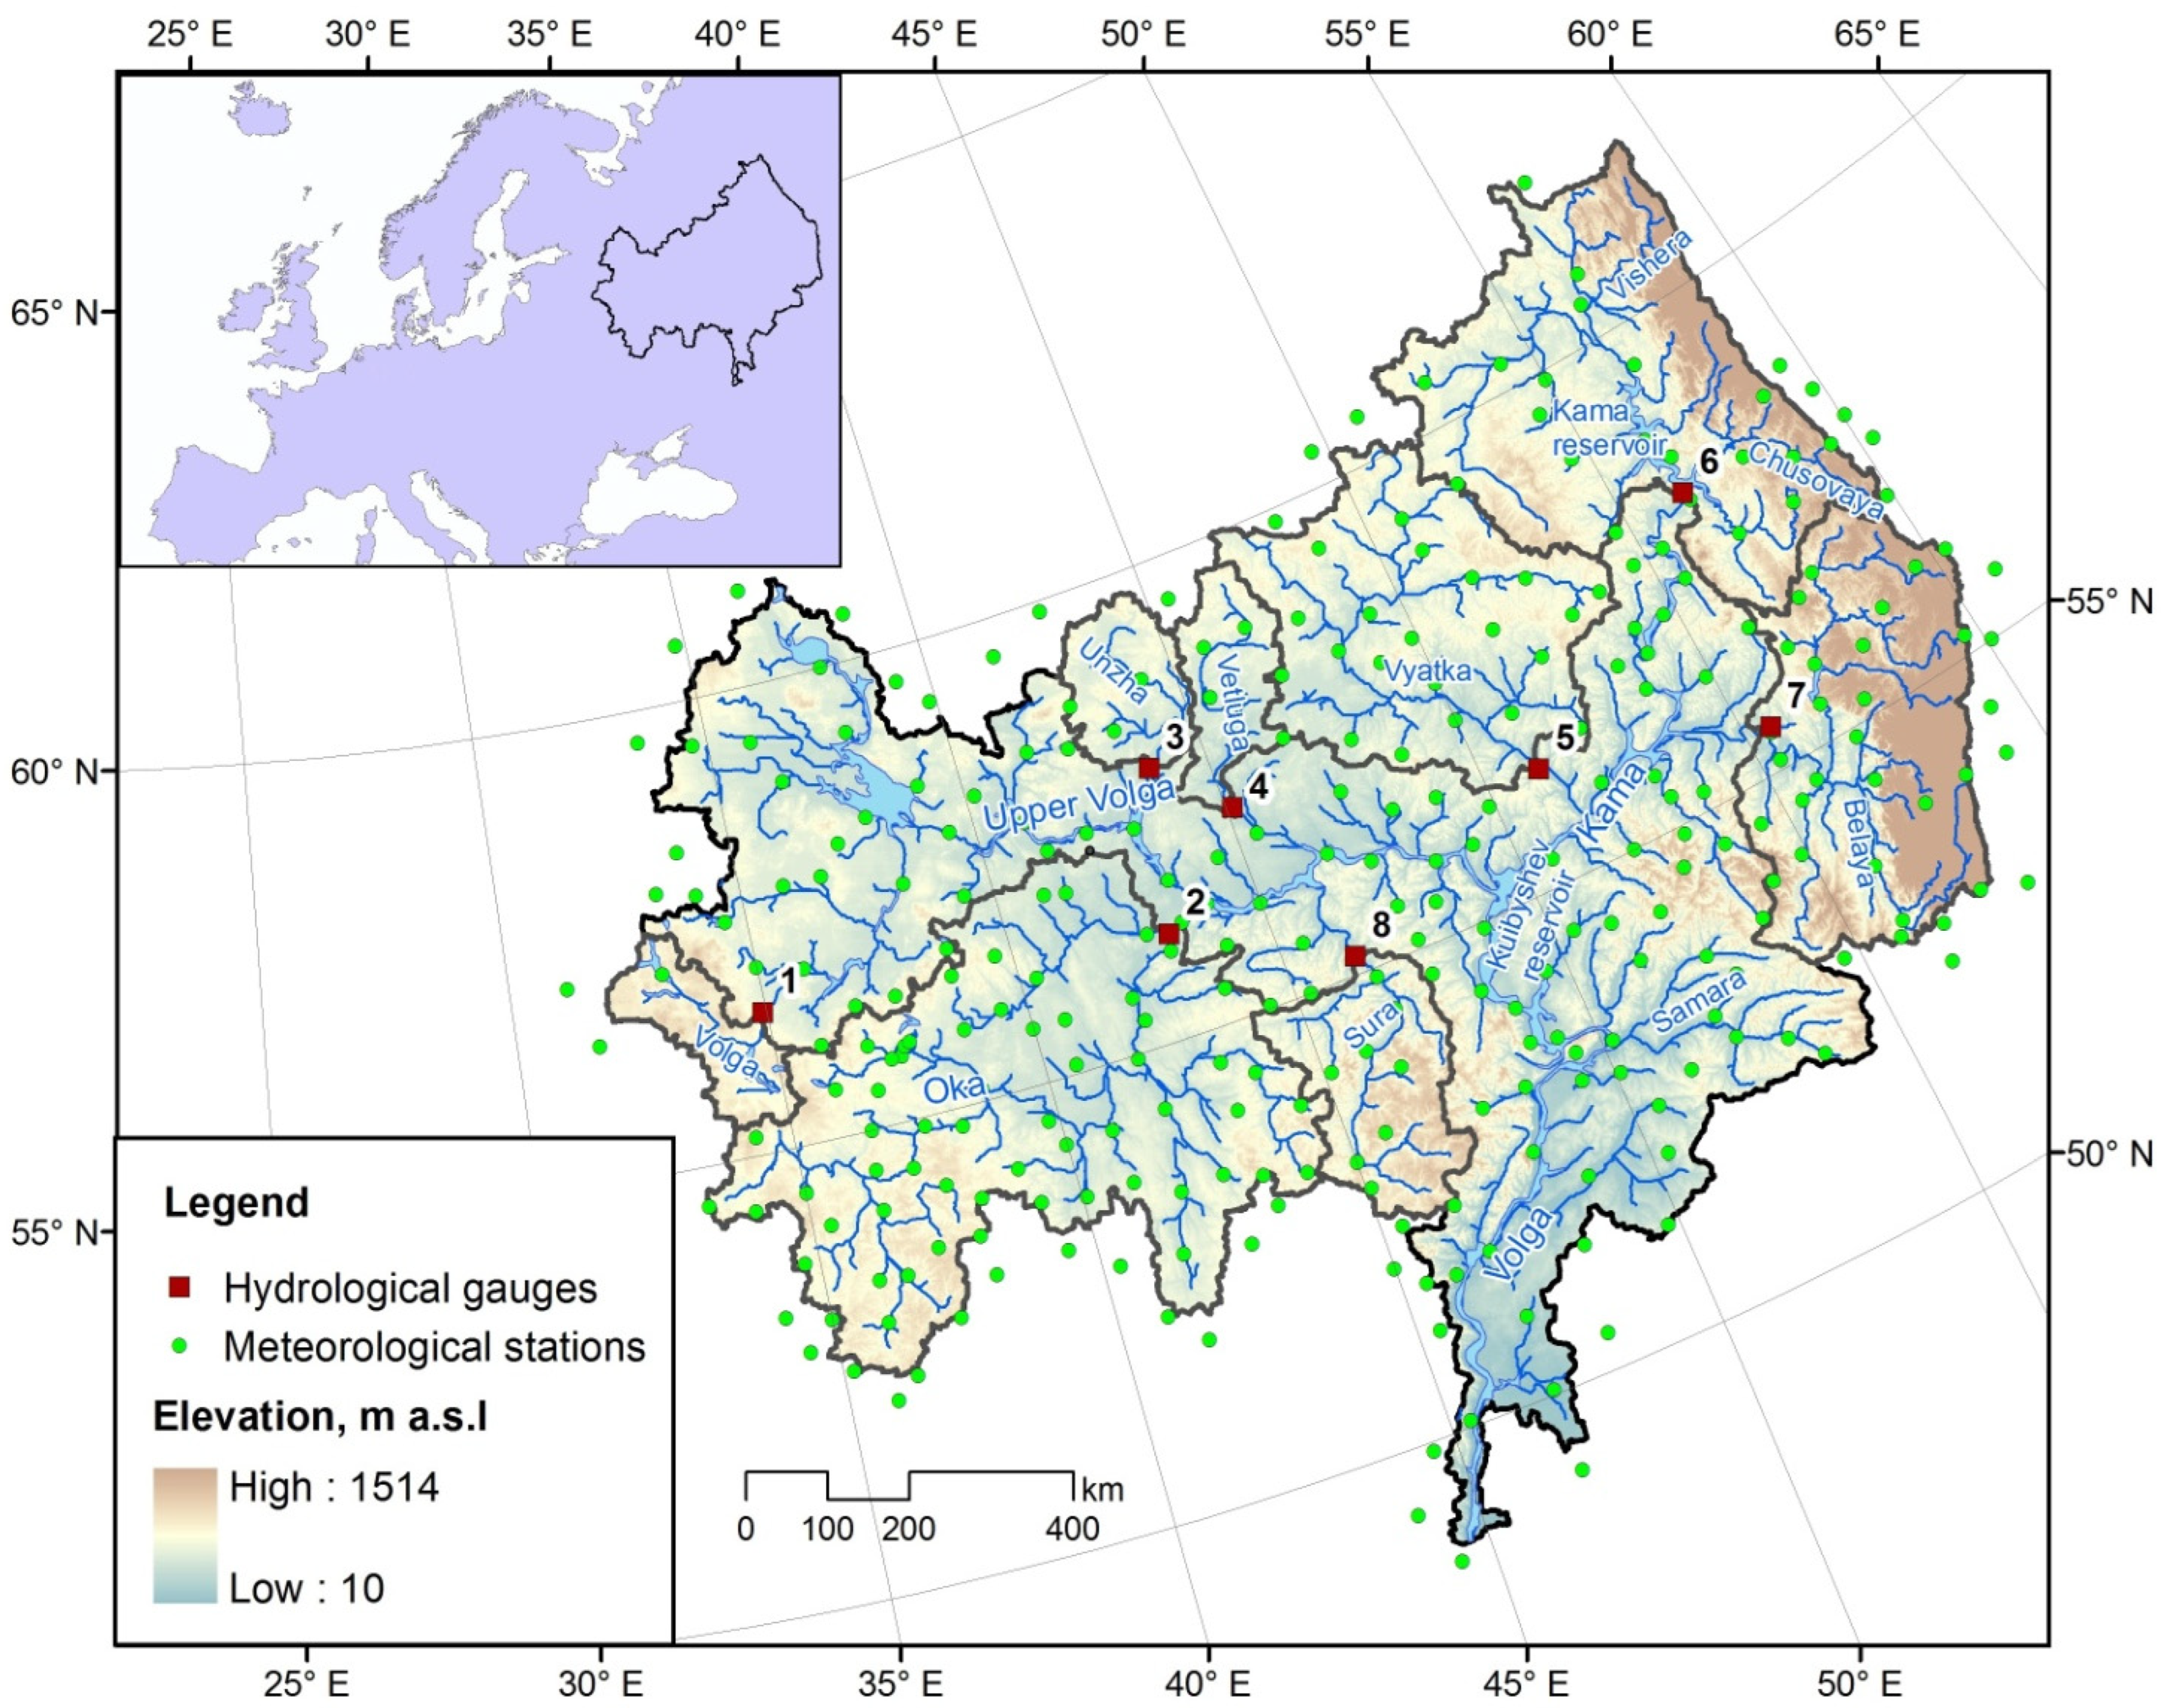
2.1. Study Area
2.2. Hydrological Model, Calibration and Validation
2.3. Hydrological Modeling Using the GCM Output Data for the Historical Period
2.4. Hydrological Modeling Using the GCM Output Data for the Future Period
3. Results
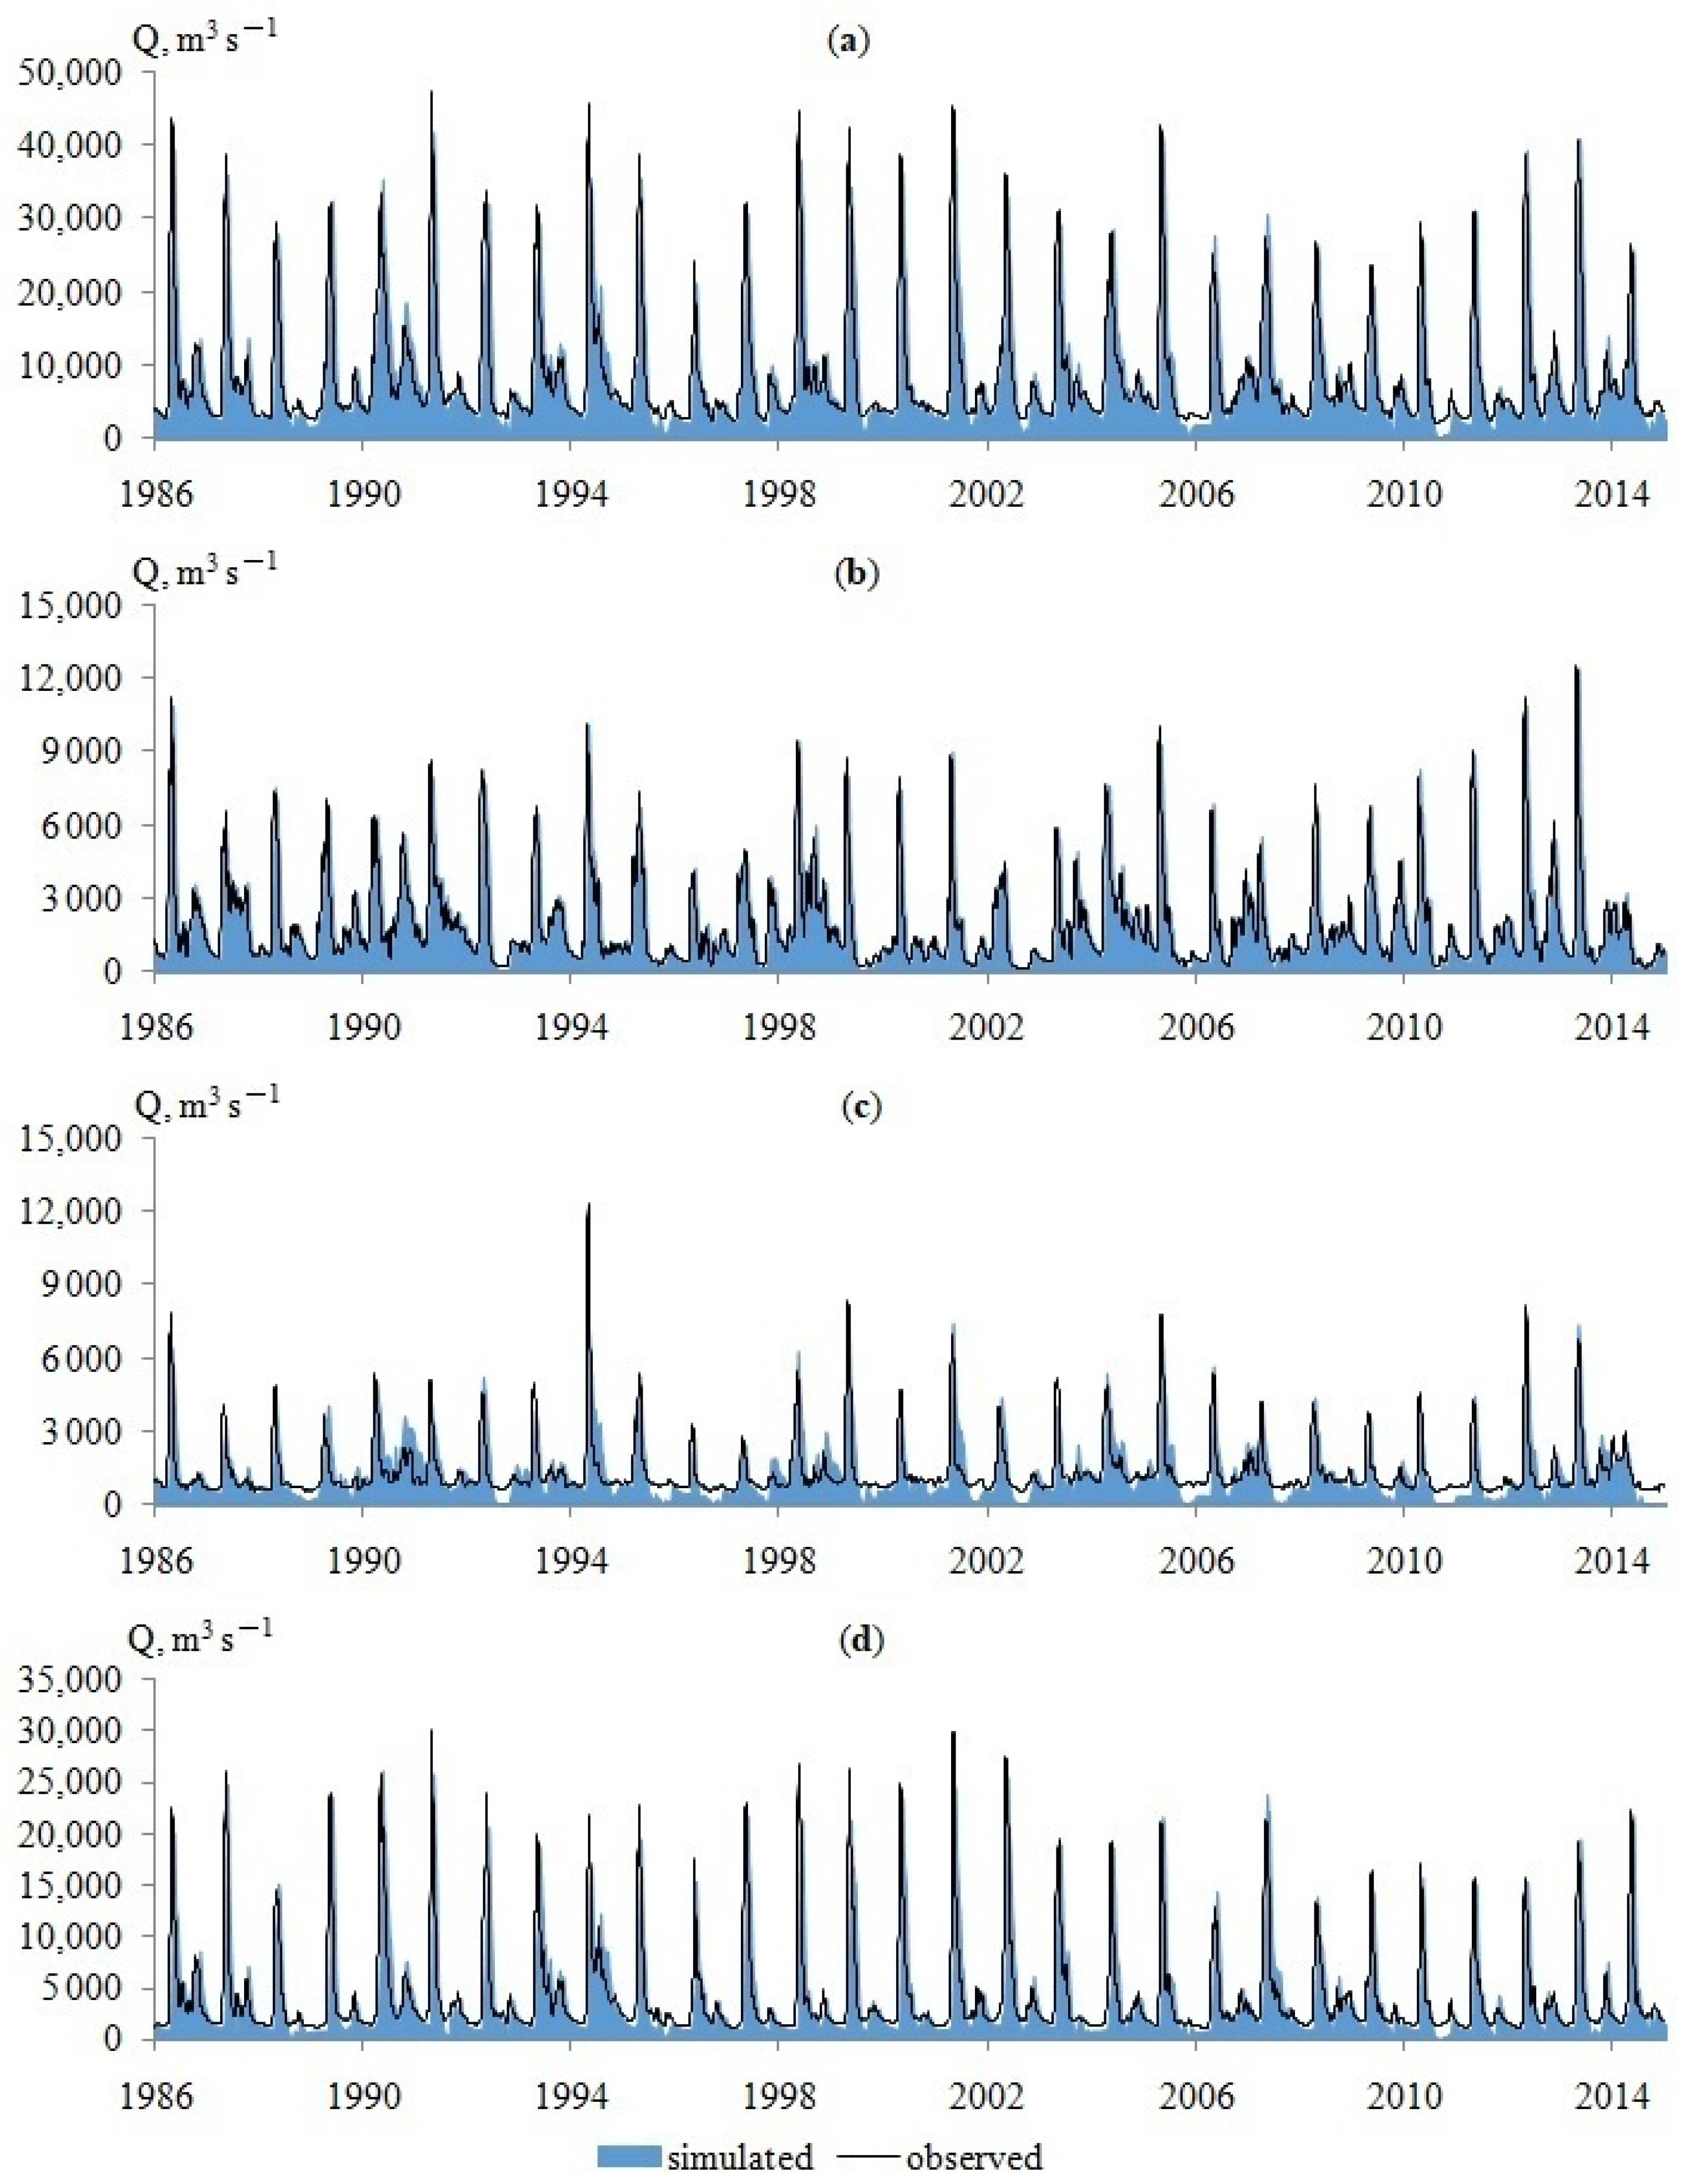
3.1. Hydrological Modeling
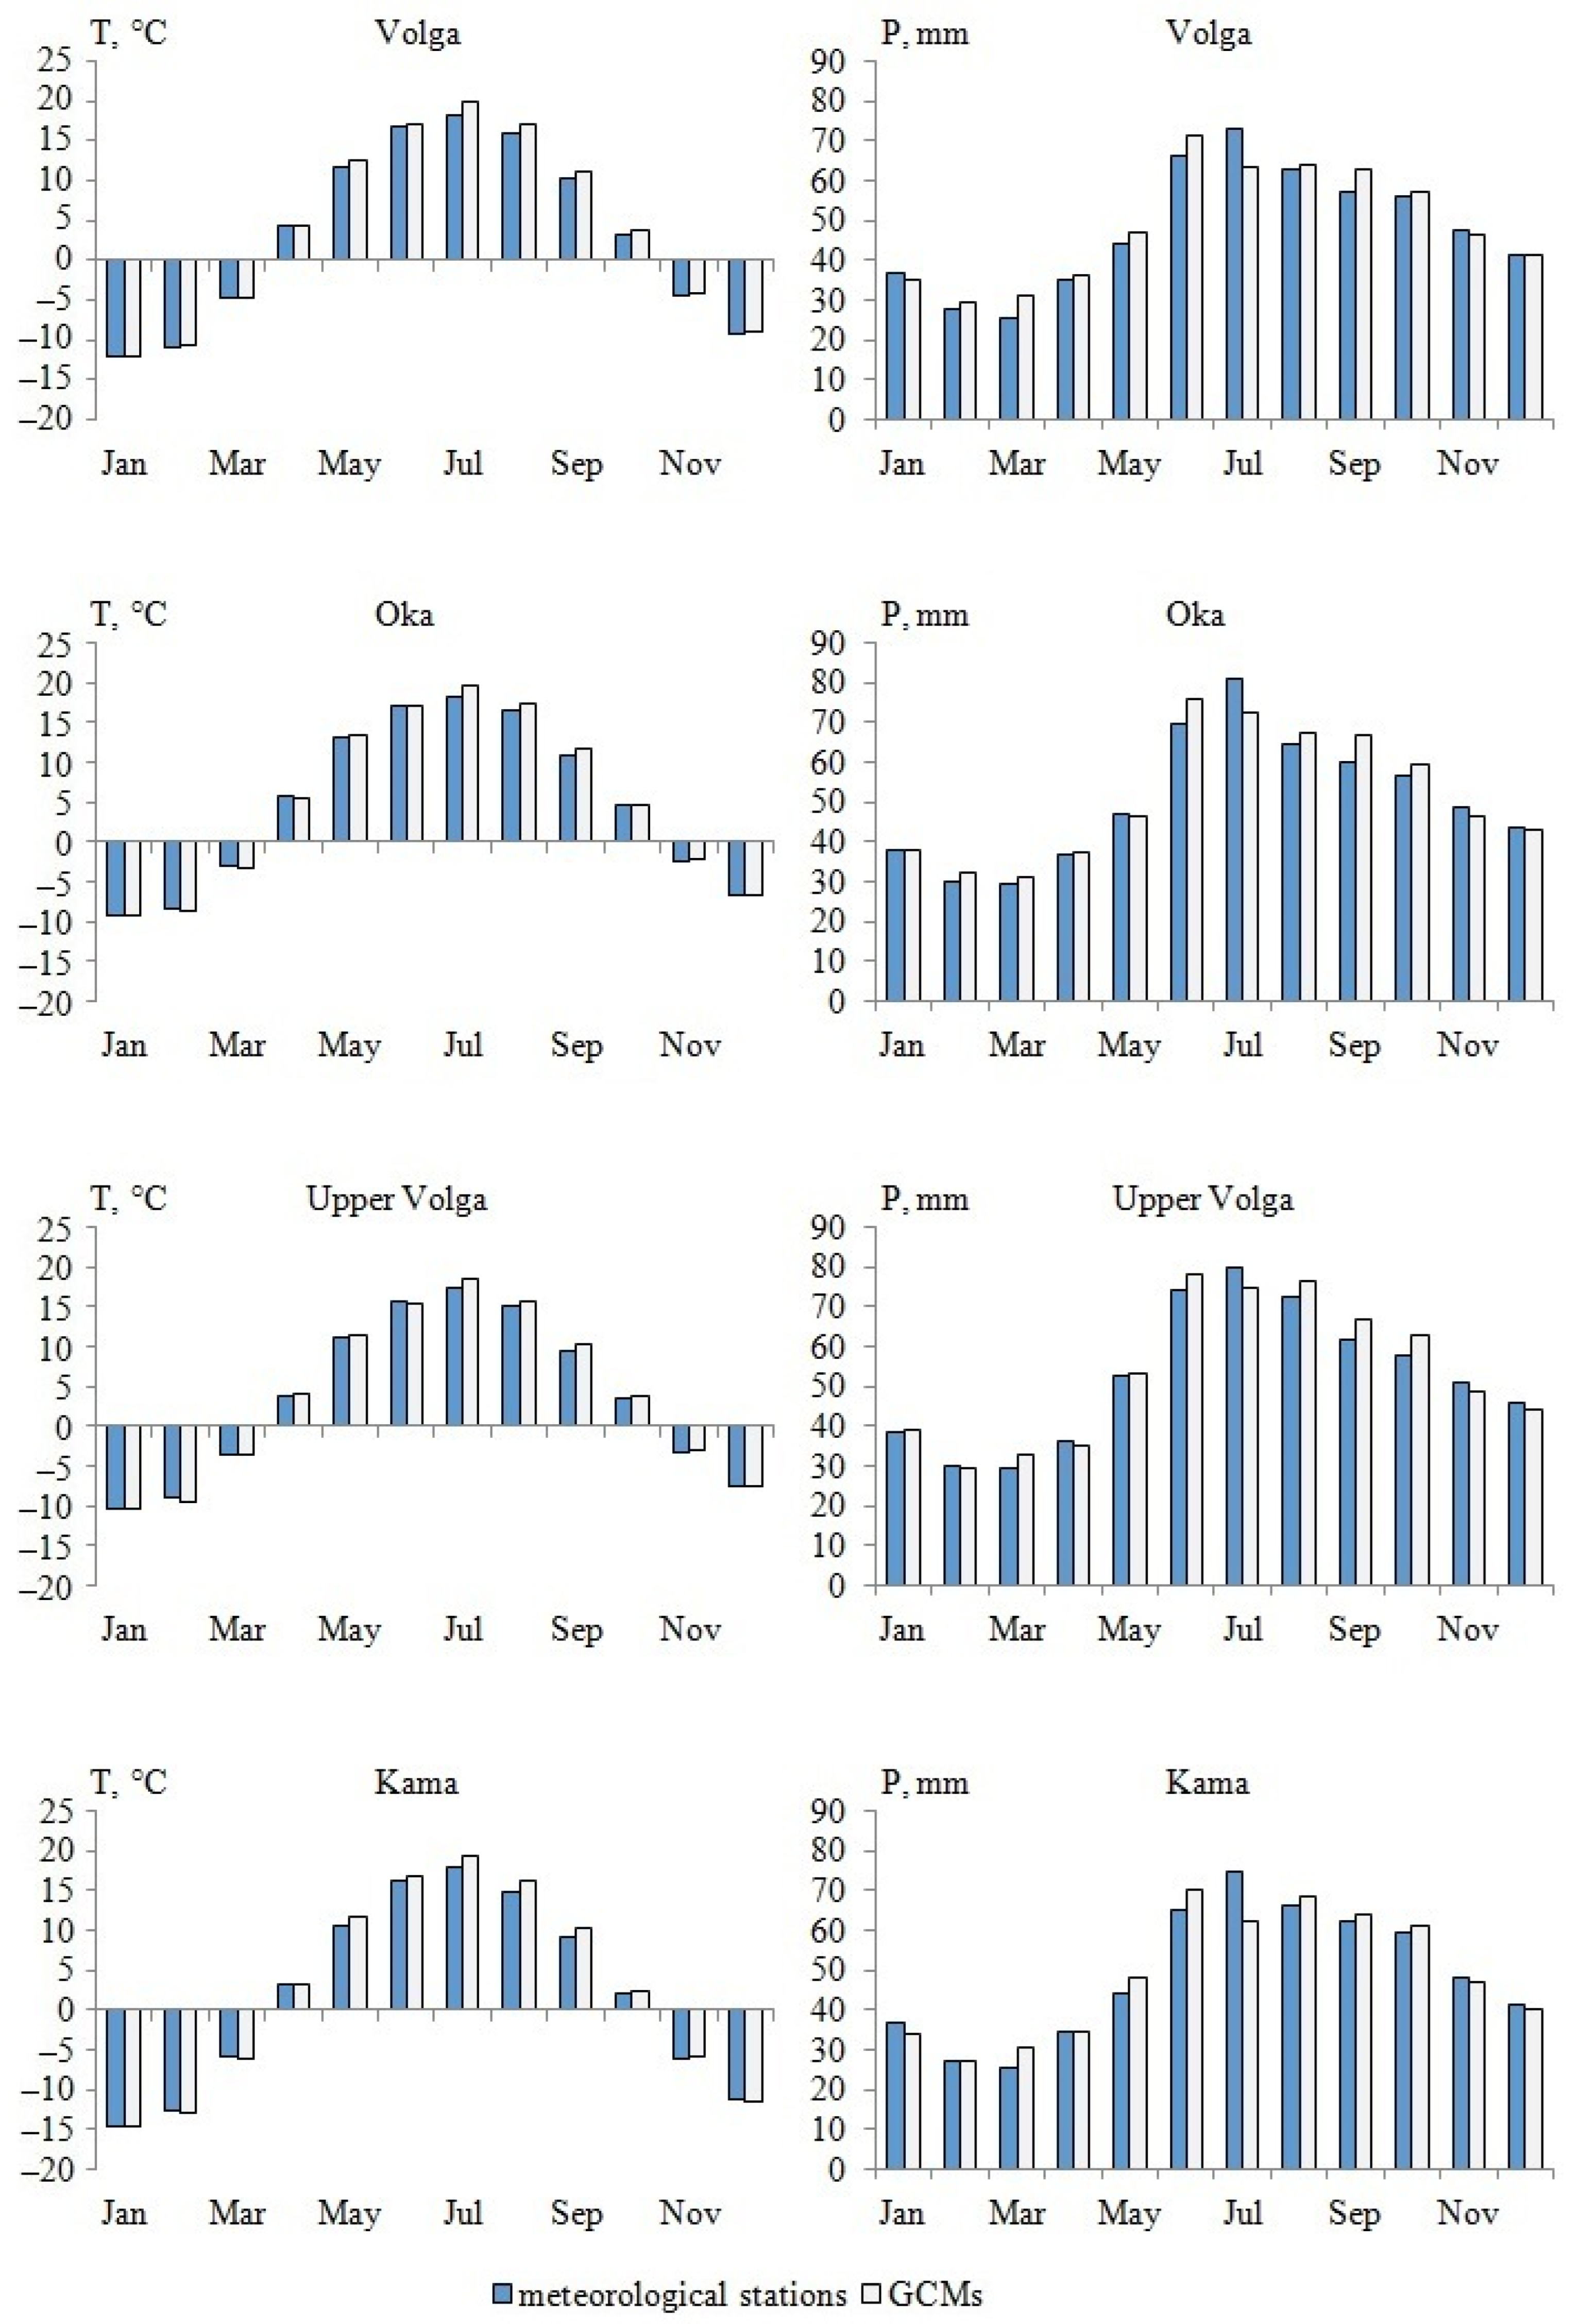
3.2. Hydrological Modeling Using the GCM Output Data for the Historical Period
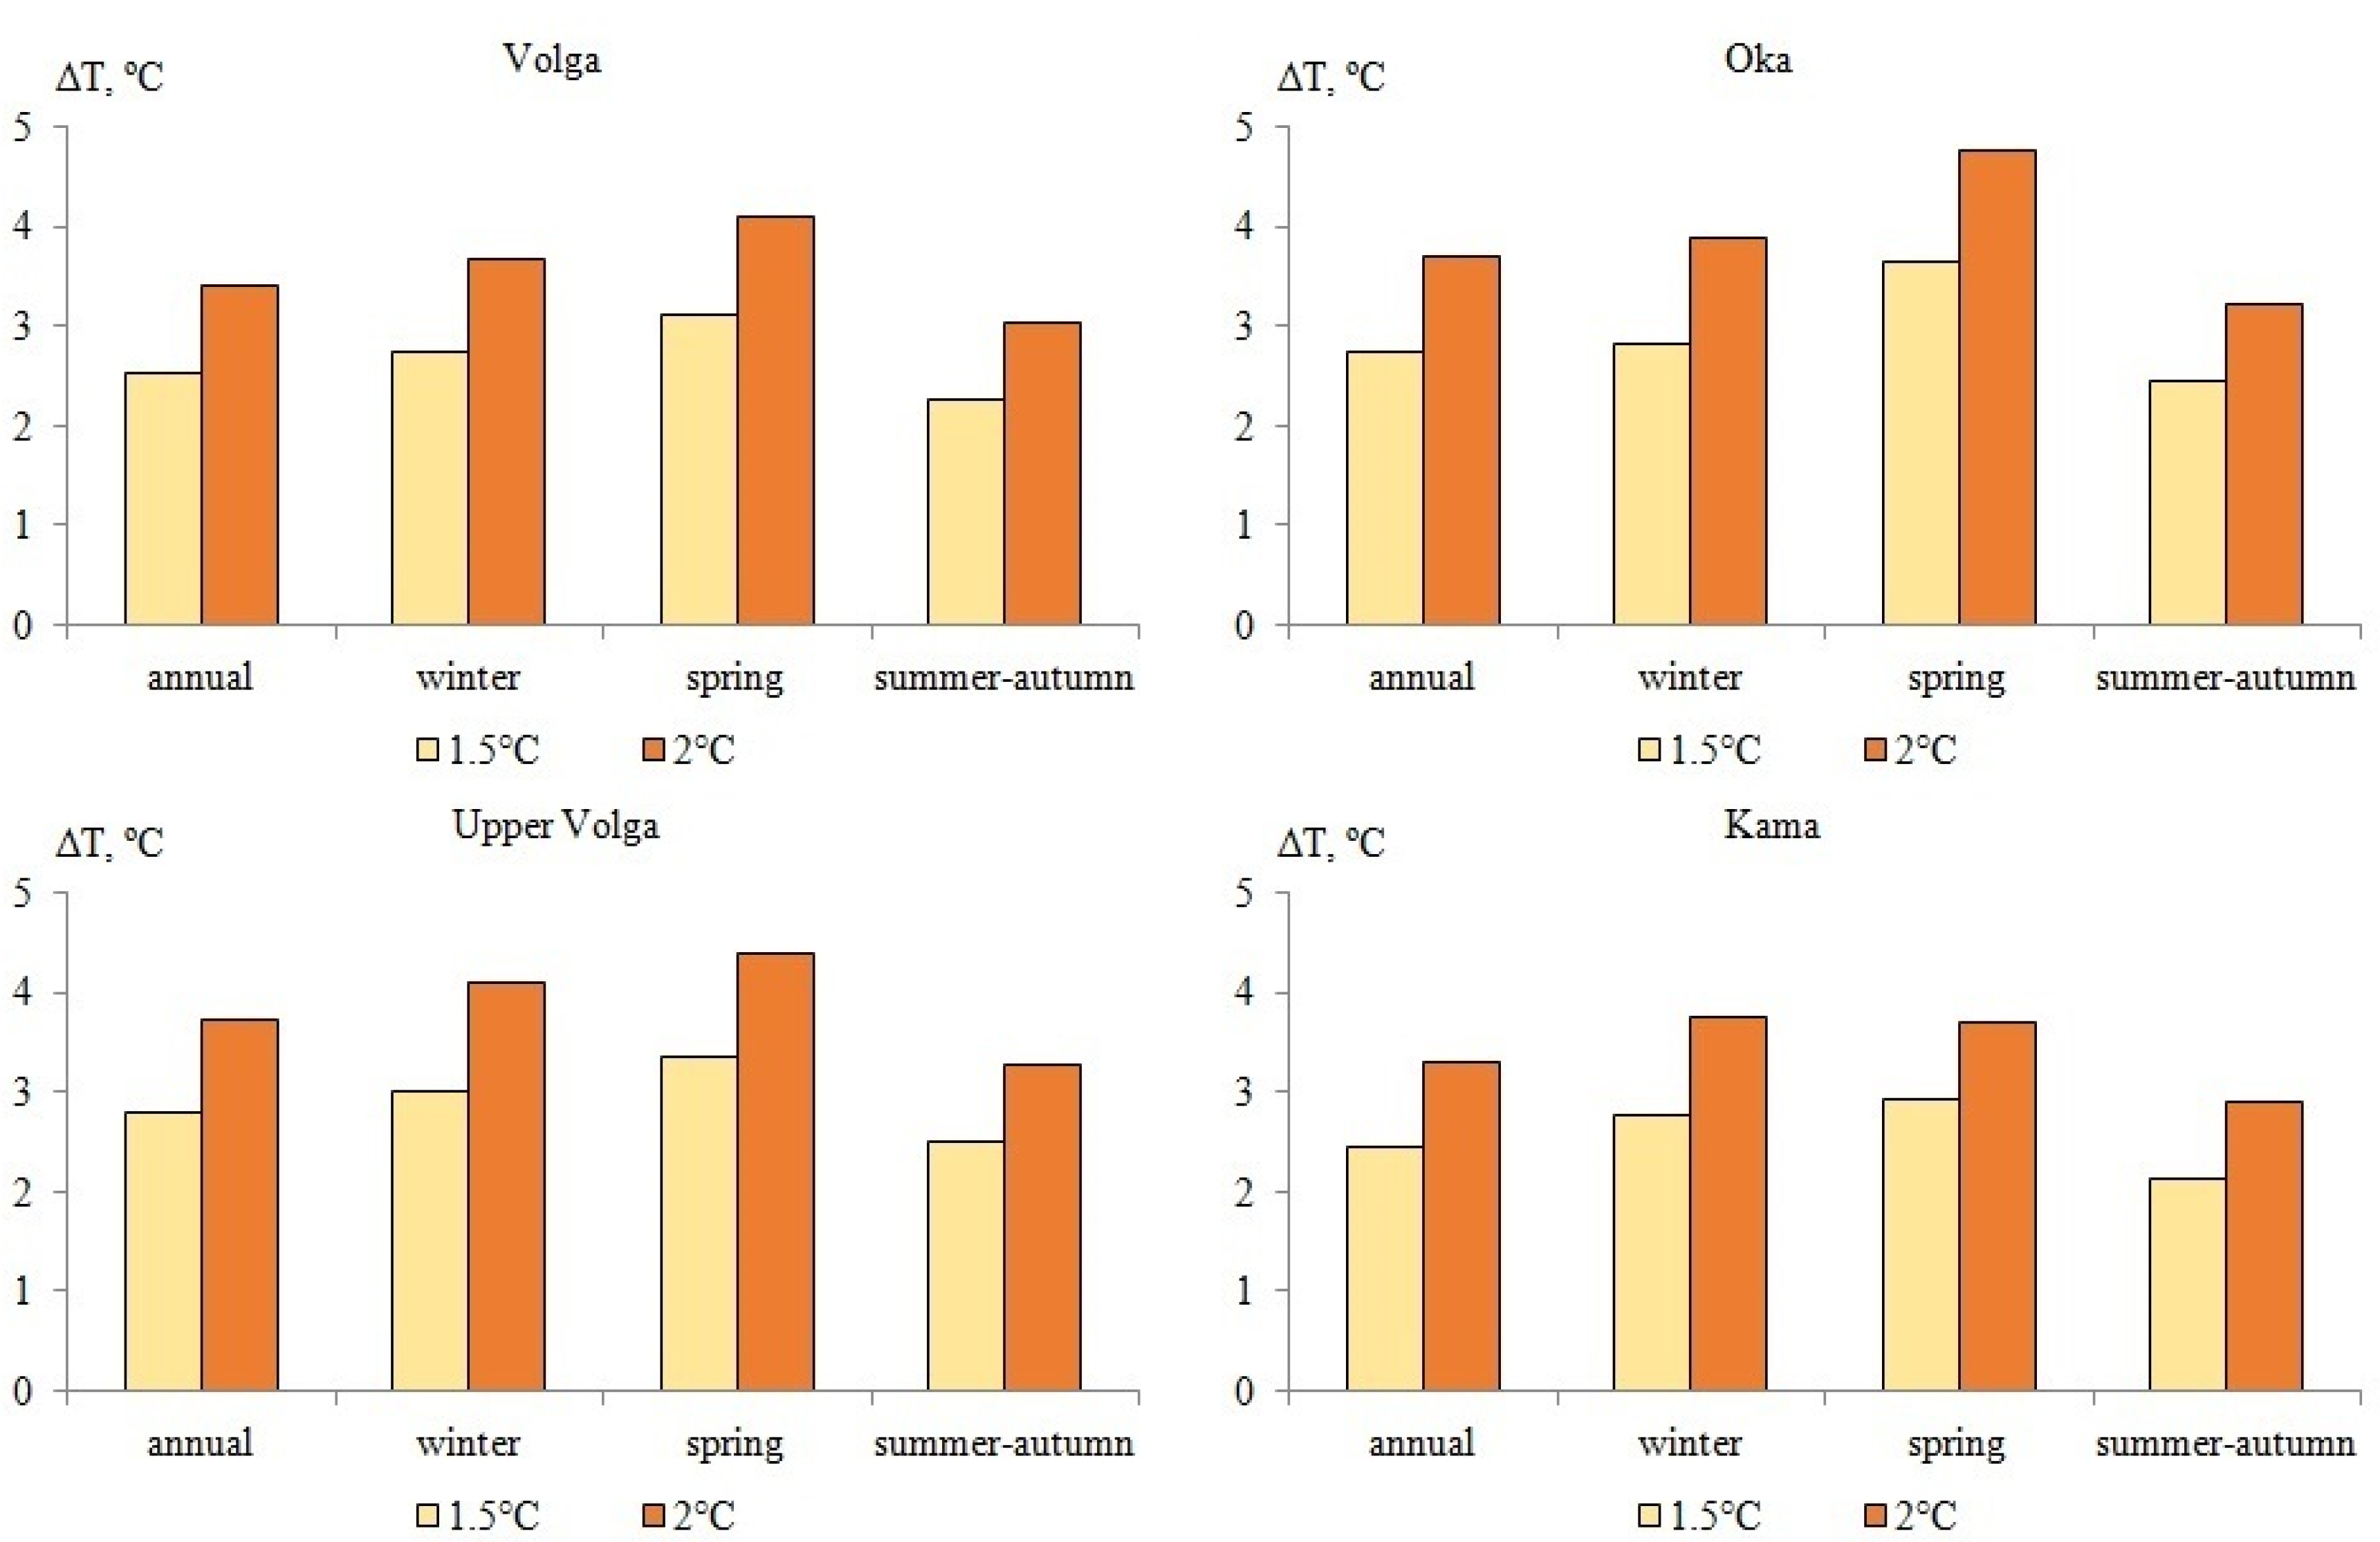
3.3. Hydrological Modeling Using the GCM Output Data for the Future Period
4. Discussion
5. Conclusions
Funding
Institutional Review Board Statement
Informed Consent Statement
Data Availability Statement
Acknowledgments
Conflicts of Interest
References
- Kattsov, V.; Akentieva, E.; Aleksandrov, E.; Alekseev, G.; Anisimov, O.; Balonishnikova, Z.; Bulygina, O.; Georgievsky, V.; Dokukin, M.; Efimov, S.; et al. Report on Climate Risks in the Russian Federation; Roshydromet: St. Petersburg, Russia, 2017; p. 106. [Google Scholar]
- Anisimov, O.; Zhil’tsova, E. Climate Change Estimates for the Regions of Russia in the 20th Century and in the Beginning of the 21st Century Based on the Observational Data. Russ. Meteorol. Hydrol. 2012, 37, 421–429. [Google Scholar] [CrossRef]
- Khlebnikova, E.; Rudakova, Y.; Shkolnik, I. Changes in Precipitation Regime over the Territory of Russia: Data of Regional Climate Modeling and Observations. Russ. Meteorol. Hydrol. 2019, 44, 431–439. [Google Scholar] [CrossRef]
- Zhang, Y.; Ma, N. Spatiotemporal Variability of Snow Cover and Snow Water Equivalent in the Last Three Decades over Eurasia. J. Hydrol. 2018, 559, 238–251. [Google Scholar] [CrossRef]
- Zhong, X.; Zhang, T.; Kang, S.; Wang, K.; Zheng, L.; Hu, Y.; Wang, H. Spatiotemporal Variability of Snow Depth across the Eurasian Continent from 1966 to 2012. Cryosphere 2018, 12, 227–245. [Google Scholar] [CrossRef] [Green Version]
- Masson-Delmotte, V.; Zhai, P.; Pörtner, H.; Roberts, D.; Skea, J.; Shukla, P.; Pirani, A.; Moufouma-Okia, W.; Péan, C.; Pidcock, R.; et al. Global Warming of 1.5 °C. An IPCC Special Report on the Impacts of Global Warming of 1.5 °C above Pre-Industrial Levels and Related Global Greenhouse Gas Emission Pathways, in the Context of Strengthening the Global Response to the Threat of Climate Change, Sustainable Development, and Efforts to Eradicate Poverty; Cambridge University Press: Cambridge, UK, 2018; p. 616. [Google Scholar]
- Kireeva, M.; Frolova, N.; Rets, E.; Samsonov, T.; Entin, A.; Kharlamov, M.; Telegina, E.; Povalishnikova, E. Evaluating Climate and Water Regime Transformation in the European Part of Russia Using Observation and Reanalysis Data for the 1945-2015 Period. Int. J. River Basin Manag. 2020, 18, 491–502. [Google Scholar] [CrossRef]
- Kireeva, M.; Frolova, N.; Winde, F.; Dzhamalov, R.; Rets, E.; Povalishnikova, E.; Pakhomova, O. Low Flow on the Rivers of the European Part of Russia and Its Hazards. Geogr. Environ. Sustain. 2016, 9, 33–47. [Google Scholar] [CrossRef] [Green Version]
- Bolgov, M.; Korobkina, E.; Trubetskova, M.; Filimonova, M.; Filippova, I. Present-Dey Variations of the Minimum Runoff of the Volga Basin Rivers. Russ. Meteorol. Hydrol. 2014, 39, 187–194. [Google Scholar] [CrossRef]
- Dzhamalov, R.; Frolova, N.; Telegina, E. Winter Runoff Variations in European Russia. Water Resour. 2015, 42, 758–765. [Google Scholar] [CrossRef]
- Frolova, N.; Agafonova, S.; Kireeva, M.; Povalishnikova, E.; Pakhomova, O. Recent Changes of Annual Flow Distribution of the Volga Basin Rivers. Geogr. Environ. Sustain. 2017, 10, 28–39. [Google Scholar] [CrossRef]
- Georgievskii, V.; Grek, E.; Grek, E.; Lobanova, A.; Molchanova, T. Spatiotemporal Changes in Extreme Runoff Characteristics for the Volga Basin Rivers. Russ. Meteorol. Hydrol. 2018, 43, 633–638. [Google Scholar] [CrossRef]
- Kalyuzhnyi, I.; Lavrov, S. Variability of Frost Depth in the Volga River Basin and Its Impact on Runoff Formation in Winter and Spring under Climate Change. Russ. Meteorol. Hydrol. 2016, 41, 487–496. [Google Scholar] [CrossRef]
- Dobrovolski, S. The Issue of Global Warming and Changes in the Runoff of Russian Rivers. Water Resour. 2007, 34, 607–618. [Google Scholar] [CrossRef]
- Georgievsky, M.; Golovanov, O.; Balonishnikova, Z.; Timofeeva, L. Changes in River Water Resources of the Russian Federation’s Economic Regions Forecasted Based on the CMIP5 Runoff Data. Ecohydrol. Hydrobiol. 2021, 21, 669–682. [Google Scholar] [CrossRef]
- Alfieri, L.; Bisselink, B.; Dottori, F.; Naumann, G.; Roo, A.; Salamon, P.; Wyser, K.; Feyen, L. Global Projections of River Flood Risk in a Warmer World. Earth’s Future 2017, 5, 171–182. [Google Scholar] [CrossRef]
- Betts, R.; Alfieri, L.; Bradshaw, C.; Caesar, J.; Feyen, L.; Friedlingstein, P.; Gohar, L.; Koutroulis, A.; Lewis, K.; Morfopoulos, C.; et al. Changes in Climate Extremes, Fresh Water Availability and Vulnerability to Food Insecurity Projected at 1.5 °C and 2 °C Global Warming with a Higher-Resolution Global Climate Model. Philis. Trans. R. Soc. 2018, 376, 20160452. [Google Scholar] [CrossRef]
- Döll, P.; Trautmann, T.; Gerten, D.; Schmied, H.; Ostberg, S.; Saaed, F.; Schleussner, C.-F. Risks for the Global Freshwater System at 1.5 °C and 2 °C Global Warming. Environ. Res. Lett. 2018, 13, 044038. [Google Scholar] [CrossRef]
- Donnelly, C.; Greuell, W.; Andersson, J.; Gerten, D.; Pisacane, G.; Roudier, P.; Ludwig, F. Impacts of Climate Change on European Hydrology at 1.5, 2 and 3 Degrees Mean Global Warming above Preindustrial Level. Clim. Chang. 2017, 143, 13–26. [Google Scholar] [CrossRef] [Green Version]
- Gosling, S.; Zaherpour, J.; Mount, N.; Hattermann, F.; Dankers, R.; Arheimer, B.; Breuer, L.; Ding, J.; Haddeland, I.; Kumar, R.; et al. A Comparison of Changes in River Runoff from Multiple Global and Catchment-Scale Hydrological Models under Global Warming Scenarios of 1°C, 2°C and 3°C. Clim. Chang. 2017, 141, 577–595. [Google Scholar] [CrossRef] [Green Version]
- Marx, A.; Kumar, R.; Thober, S.; Rakovec, O.; Wanders, N.; Zink, M.; Wood, E.; Pan, M.; Sheffield, J.; Samaniego, L. Climate Change Alters Low Flows in Europe under a 1.5, 2, and 3 Degree Global Warming. Hydrol. Earth Syst. Sci. 2018, 22, 1017–1032. [Google Scholar] [CrossRef] [Green Version]
- Thober, T.; Kumar, R.; Wanders, N.; Marx, A.; Pan, M.; Rakovec, O.; Samaniego, L.; Sheffield, J.; Wood, E.; Zink, M. Multi-Model Ensemble Projections of European River Floods and High Flows at 1.5, 2, and 3 Degrees Global Warming. Environ. Res. Lett. 2018, 13, 014003. [Google Scholar] [CrossRef]
- Gelfan, A.; Kalugin, A. Permafrost in the Caspian Basin as a Possible Trigger of the Late Khvalynian Transgression: Testing Hypothesis Using a Hydrological Model. Water Resour. 2021, 48, 831–843. [Google Scholar] [CrossRef]
- Motovilov, Y.; Gottschalk, L.; Engeland, K.; Rodhe, A. Validation of a Distributed Hydrological Model against Spatial Observations. Agric. For. Meteorol. 1999, 98–99, 257–277. [Google Scholar] [CrossRef]
- Motovilov, Y. Hydrological Simulation of River Basins at Different Spatial Scales: 1. Generalization and Averaging Algorithms. Water Resour. 2016, 43, 429–437. [Google Scholar] [CrossRef]
- Motovilov, Y.; Danilov-Danilyan, V.; Dod, E.; Kalugin, A. Assessing the Flood Control Effect of the Existing and Projected Reservoirs in the Middle Amur Basin Based on Physical-Mathematical Hydrological Models. Water Resour. 2015, 42, 580–593. [Google Scholar] [CrossRef]
- Bugaets, A.; Gartsman, B.; Gelfan, A.; Motovilov, Y.; Sokolov, O.; Gonchukov, L.; Kalugin, A.; Moreido, V.; Suchilina, Z.; Fingert, E. The Integrated System of Hydrological Forecasting in the Ussuri River Basin Based on the ECOMAG Model. Geosciences 2018, 8, 5. [Google Scholar] [CrossRef] [Green Version]
- Eisner, S.; Florke, M.; Chamorro, A.; Daggupati, P.; Donnelly, C.; Huang, J.; Hundecha, Y.; Koch, H.; Kalugin, A.; Krylenko, I.; et al. An Ensemble Analysis of Climate Change Impacts on Streamflow Seasonality across 11 Large River Basins. Clim. Chang. 2017, 141, 401–417. [Google Scholar] [CrossRef]
- Kalugin, A. Variations of the Present-Day Annual and Seasonal Runoff in the Far East and Siberia with the Use of Regional Hydrological and Global Climate Models. Water Resour. 2018, 45, S102–S111. [Google Scholar] [CrossRef]
- Kalugin, A. Modelling of Future Changes in the Water Regime of the Upper Kama River. IOP Conf. Ser. Earth Environ. Sci. 2021, 834, 012007. [Google Scholar] [CrossRef]
- Kalugin, A. Process-Based Modeling of the High Flow of a Semi-Mountain River under Current and Future Climatic Conditions: A Case Study of the Iya River (Eastern Siberia). Water 2021, 13, 1042. [Google Scholar] [CrossRef]
- Kalugin, A. Future Climate-Driven Runoff Change in the Large River Basins in Eastern Siberia and the Far East Using Process-Based Hydrological Models. Water 2022, 14, 609. [Google Scholar] [CrossRef]
- Kalugin, A.; Lebedeva, L. Runoff Generation at the Small Permafrost River Basin in Eastern Siberia: Data Analysis and Hydrological Modeling. E3S Web Conf. 2020, 163, 01006. [Google Scholar] [CrossRef]
- Moreido, V.; Kalugin, A. Assessing Possible Changes in Selenga River Water Regime in the XXI Century Based on a Runoff Formation Model. Water Resour. 2017, 44, 390–398. [Google Scholar] [CrossRef]
- Kalugin, A.; Motovilov, Y. Runoff Formation Model for the Amur River Basin. Water Resour. 2018, 45, 149–159. [Google Scholar] [CrossRef]
- Motovilov, Y.; Bugaets, A.; Gartsman, B.; Gonchukov, L.; Kalugin, A.; Moreido, V.; Suchilina, Z.; Fingert, E. Assessing the Sensitivity of a Model of Runoff Formation in the Ussuri River Basin. Water Resour. 2018, 45, S128–S134. [Google Scholar] [CrossRef]
- Peel, M.; Blöschl, G. Hydrological Modeling in a Changing World. Prog. Phys. Geogr. Earth Environ. 2011, 35, 249–261. [Google Scholar] [CrossRef]
- Krysanova, V.; Vetter, T.; Eisner, S.; Huang, S.; Pechlivanidis, I.; Strauch, M.; Gelfan, A.; Kumar, R.; Aich, V.; Arheimer, B.; et al. Intercomparison of Regional-Scale Hydrological Models and Climate Change Impacts Projected for 12 Large River Basins Worldwide-a Synthesis. Environ. Res. Lett. 2017, 12, 105002. [Google Scholar] [CrossRef]
- Krysanova, V.; Donnelly, C.; Gelfan, A.; Gerten, D.; Arheimer, B.; Hattermann, F.; Kundzewicz, Z. How the Performance of Hydrological Models Relates to Credibility of Projections under Climate Change. Hydrol. Sci. J. 2018, 63, 696–720. [Google Scholar] [CrossRef]
- Shiklomanov, I.; Georgievskii, V.; Babkin, V.; Balonishnikova, Z. Research Problems of Formation and Estimation of Water Resources and Water Availability Changes of the Russian Federation. Russ. Meteorol. Hydrol. 2010, 35, 13–19. [Google Scholar] [CrossRef]
- Georgiadi, A.; Miluykova, I. Possible Scales of Hydrological Changes in the Volga Basin under Anthropogenic Climate Warming. Russ. Meteorol. Hydrol. 2002, 2, 54–59. [Google Scholar]
- Moriasi, D.; Arnold, J.; Van Liew, M.; Bingner, R.; Harmel, R.; Veith, T. Model Evaluation Guidelines for Systematic Quantification of Accuracy in Watershed Simulations. Trans. Asabe 2007, 50, 885–900. [Google Scholar] [CrossRef]
- Klemeš, V. Operational Testing of Hydrological Simulation Models. Hydrol. Sci. J. 1986, 31, 13–24. [Google Scholar] [CrossRef]
- Hempel, S.; Frieler, K.; Warszawski, L.; Schewe, J.; Piontek, F. A Trend-Preserving Bias Correction—The ISI-MIP Approach. Earth Syst. Dyn. 2013, 4, 219–236. [Google Scholar] [CrossRef] [Green Version]
- Lange, S. Trend-Preserving Bias Adjustment and Statistical Downscaling with ISIMIP3BASD (v1.0). Geosci. Model Dev. 2019, 12, 3055–3070. [Google Scholar] [CrossRef] [Green Version]
- Kour, R.; Patel, N.; Krishna, A. Climate and Hydrological Models to Assess the Impact of Climate Change on Hydrological Regime: A Review. Arab J. Geosci. 2016, 9, 31. [Google Scholar] [CrossRef]
- Frieler, K.; Lange, S.; Piontek, F.; Reyer, C.; Schewe, J.; Warszawski, L.; Zhao, F.; Chini, L.; Denvil, S.; Emanuel, K.; et al. Assessing the Impacts of 1.5 °C Global Warming—Simulation Protocol of the Inter-Sectoral Impact Model Intercomparison Project (ISIMIP2b). Geosci. Model Dev. 2017, 10, 4321–4345. [Google Scholar] [CrossRef] [Green Version]
- Gel’fan, A.; Kalugin, A.; Krylenko, I.; Nasonova, O.; Gusev, E.; Kovalev, E. Testing a Hydrological Model to Evaluate Climate Change Impact on River Runoff. Russ. Meteorol. Hydrol. 2020, 45, 353–359. [Google Scholar] [CrossRef]
- Khon, V.C.; Mokhov, I. The Hydrological Regime of Large River Basins in Northern Eurasia in the XX–XXI Centuries. Water Resour. 2012, 39, 1–10. [Google Scholar] [CrossRef]
- Kundzewicz, Z.; Stakhiv, E. Are Climate Models “Ready for Prime Time” in Water Resources Management Applications, or Is More Research Needed? Hydrol. Sci. J. 2010, 55, 1085–1089. [Google Scholar] [CrossRef]
- Popova, V.; Babina, E.; Georgiadi, A. Climatic Factors of the Volga Runoff Variability in the Second Half of the 20th—Early 21st Centuries. Reg. Res. Russ. 2019, 4, 63–72. [Google Scholar] [CrossRef] [Green Version]
- Renssen, H.; Lougheed, B.; Aerts, J.; de Moel, H.; Ward, P.; Kwadijk, J. Simulating Long-Term Caspian Sea Level Changes: The Impact of Holocene and Future Climate Conditions. Earth Planet. Sci. Lett. 2007, 261, 685–693. [Google Scholar] [CrossRef]
- Shkolnik, I.; Pavlova, T.; Efimov, S.; Zhuravlev, S. Future Changes in Peak River Flows across Northern Eurasia as Inferred from an Ensemble of Regional Climate Projections under the IPCC RCP8.5 Scenario. Clim. Dyn. 2018, 50, 215–230. [Google Scholar] [CrossRef]
- Shkolnik, I.; Meleshko, V.; Pavlova, T. Hydrodynamical Limited Area Model for Climate Studies over Russia. Russ. Meteorol. Hydrol. 2000, 4, 32–49. [Google Scholar]
- Yamazaki, D.; Kanae, S.; Kim, H.; Oki, T. A Physically Based Description of FLoodplain Inundation Dynamics in a Global River Routing Model. Water Resour. Res. 2011, 47, W04501. [Google Scholar] [CrossRef]
- Huang, S.; Kumar, R.; Florke, M.; Yang, T.; Hundecha, Y.; Kraft, P.; Gao, C.; Gelfan, A.; Liersch, S.; Lobanova, A.; et al. Evaluation of an Ensemble of Regional Hydrological Models in 12 Large-Scale River Basins Worldwide. Clim. Chang. 2017, 141, 381–397. [Google Scholar] [CrossRef]
- Krysanova, V.; Hattermann, F. Intercomparison of Climate Change Impacts in 12 Large River Basins: Overview of Methods and Summary of Results. Clim. Chang. 2017, 141, 363–379. [Google Scholar] [CrossRef]
- Hattermann, F.; Krysanova, V.; Gosling, S.; Dankers, R.; Daggupati, P.; Donnelly, C.; Huang, S.; Motovilov, Y.; Buda, S.; Yang, T.; et al. Cross-Scale Intercomparison of Climate Change Impacts Simulated by Regional and Global Hydrological Models in Eleven Large River Basins. Clim. Chang. 2017, 141, 561–576. [Google Scholar] [CrossRef]
- Krysanova, V.; Hattermann, F.; Kundzewicz, Z. How Evaluation of Hydrological Models Influences Results of Climate Impact Assessment—An Editorial. Clim. Chang. 2020, 163, 1121–1141. [Google Scholar] [CrossRef]
- Georgiadi, A.; Koronkevich, N.; Barabanova, E.; Kashutina, E.; Milyukova, I. Assessing the Effect of Climatic and Anthropogenic Factors on the Annual Runoff of Large Rivers in European Russia and Siberia. IOP Conf. Ser. Earth Environ. Sci. 2019, 381, 012027. [Google Scholar] [CrossRef] [Green Version]
- Frolov, A.; Georgievskii, V.Y. Changes in Water Resources under Conditions of Climate Warming and Their Impact on Water Inflow to Russian Large Reservoirs. Russ. Meteorol. Hydrol. 2018, 43, 390–396. [Google Scholar] [CrossRef]
- Gelfan, A.; Kalugin, A.; Krylenko, I.; Nasonova, O.; Gusev, Y.; Kovalev, E. Does a Successful Comprehensive Evaluation Increase Confidence in a Hydrological Model Intended for Climate Impact Assessment? Clim. Chang. 2020, 163, 1165–1185. [Google Scholar] [CrossRef]
- Kalugin, A. The Impact of Climate Change on Surface, Subsurface and Groundwater Flow: A Case Study of the Oka River (European Russia). Water Resour. 2019, 46, S31–S39. [Google Scholar] [CrossRef]
- Elistratov, V.; Maslikov, V.; Sidorenko, G. Water-Power Regimes of the HPP in the Volga-Kama Cascade. Power Technol. Eng. 2015, 49, 6–10. [Google Scholar] [CrossRef]
- Pavlova, V.; Shkolnik, I.; Pikaleva, A.; Efimov, S.; Karachenkova, A.; Kattsov, V. Future Changes in Spring Wheat Yield in the European Russia as Inferred from a Large Ensemble of High-Resolution Climate Projections. Environ. Res. Lett. 2019, 14, 034010. [Google Scholar] [CrossRef]
- Kong, Y.; Wang, C. Responses and Changes in the Permafrost and Snow Water Equivalent in the Northern Hemisphere under a Scenario of 1.5°C Warming. Adv. Clim. Chang. Res. 2017, 8, 235–244. [Google Scholar] [CrossRef]
- Ren, Y.; Lü, Y.; Comber, A.; Fu, B.; Harris, P.; Wu, L. Spatially Explicit Simulation of Land Use/Land Cover Changes: Current Coverage and Future Prospects. Earth-Sci. Rew. 2019, 190, 398–415. [Google Scholar] [CrossRef]
- Sohl, T.; Wimberly, M.; Radeloff, V.; Theobald, D.; Sleeter, B. Divergent Projections of Future Land Use in the United States Arising from Different Models and Scenarios. Ecol. Model. 2016, 337, 281–297. [Google Scholar] [CrossRef] [Green Version]
- Kalugin, A. Climate Change Attribution in the Lena and Selenga River Runoff: An Evaluation Based on the Earth System and Regional Hydrological Models. Water 2022, 14, 118. [Google Scholar] [CrossRef]
- Gelfan, A.; Gusev, E.; Kalugin, A.; Krylenko, I.; Motovilov, Y.; Nasonova, O.; Millionshchikova, T.; Frolova, N. Runoff of Russian Rivers under Current and Projected Climate Change: A Review 2. Climate Change Impact on the Water Regime of Russian Rivers in the XXI Century. Water Resour. 2022, 49, 351–365. [Google Scholar] [CrossRef]


| River—Gauge | Catchment Area, km2 | Annual Runoff, km3 | High Water Months | Annual Precipitation, mm | Mean Annual Air Temperature, °C |
|---|---|---|---|---|---|
| Oka—Gorbatov | 244,000 | 42.1 | April–May | 605 | 5.4 |
| Vyatka—Vyatskie polyany | 124,000 | 31.6 | April–June | 615 | 2.9 |
| Belaya—Birsk | 121,000 | 27.7 | April–May | 530 | 2.1 |
| Kama reservoir | 168,000 | 57.3 | April–June | 660 | 1.4 |
| Sura—Poretskoe | 50,100 | 6.9 | April | 500 | 6.5 |
| Vetluga—Vetluzhsky | 27,500 | 7.2 | April–May | 625 | 3.5 |
| Volga—Staritsa | 21,100 | 5.7 | April | 610 | 3.7 |
| Unzha—Makariev | 18,500 | 6.5 | April–May | 615 | 3.3 |
| GCM | RCP | 1.5 °C | 2 °C |
|---|---|---|---|
| GFDL-ESM2M | RCP2.6 | – | – |
| GFDL-ESM2M | RCP4.5 | 2049 | – |
| GFDL-ESM2M | RCP6.0 | 2056 | 2076 |
| GFDL-ESM2M | RCP8.5 | 2036 | 2053 |
| MIROC5 | RCP2.6 | 2048 | – |
| MIROC5 | RCP4.5 | 2039 | 2069 |
| MIROC5 | RCP6.0 | 2052 | 2071 |
| MIROC5 | RCP8.5 | 2033 | 2048 |
| № | River—Gauge | NSE | PBIAS, % | NSE | PBIAS, % | NSE | PBIAS, % | NSE | PBIAS, % |
|---|---|---|---|---|---|---|---|---|---|
| 1986–1999 | 2000–2014 | Wet Period | Dry Period | ||||||
| 1 | Oka—Gorbatov | 0.73 | 6.4 | 0.75 | −6.6 | 0.70 | 8.7 | 0.78 | −9.9 |
| 2 | Vyatka—Vyatskie polyany | 0.84 | −3.1 | 0.89 | −1.6 | 0.86 | 5.6 | 0.86 | −10.2 |
| 3 | Belaya—Birsk | 0.87 | −13 | 0.86 | −12 | 0.87 | −9.1 | 0.85 | −15.8 |
| 4 | Kama reservoir | 0.94 | −7.1 | 0.93 | −3.8 | 0.93 | −2.5 | 0.93 | −8.5 |
| 5 | Sura—Poretskoe | 0.51 | 9.8 | 0.59 | −15 | 0.53 | 2.4 | 0.63 | −11.8 |
| 6 | Vetluga—Vetluzhsky | 0.86 | 1 | 0.87 | 5.7 | 0.86 | 8.5 | 0.86 | −2.6 |
| 7 | Volga—Staritsa | 0.66 | 12 | 0.67 | 3.7 | 0.65 | 9.9 | 0.67 | 5.1 |
| 8 | Unzha—Makariev | 0.74 | −0.5 | 0.72 | 1 | 0.73 | 5.6 | 0.73 | −5.3 |
| Parameter | Volga | Oka | Upper Volga | Kama |
|---|---|---|---|---|
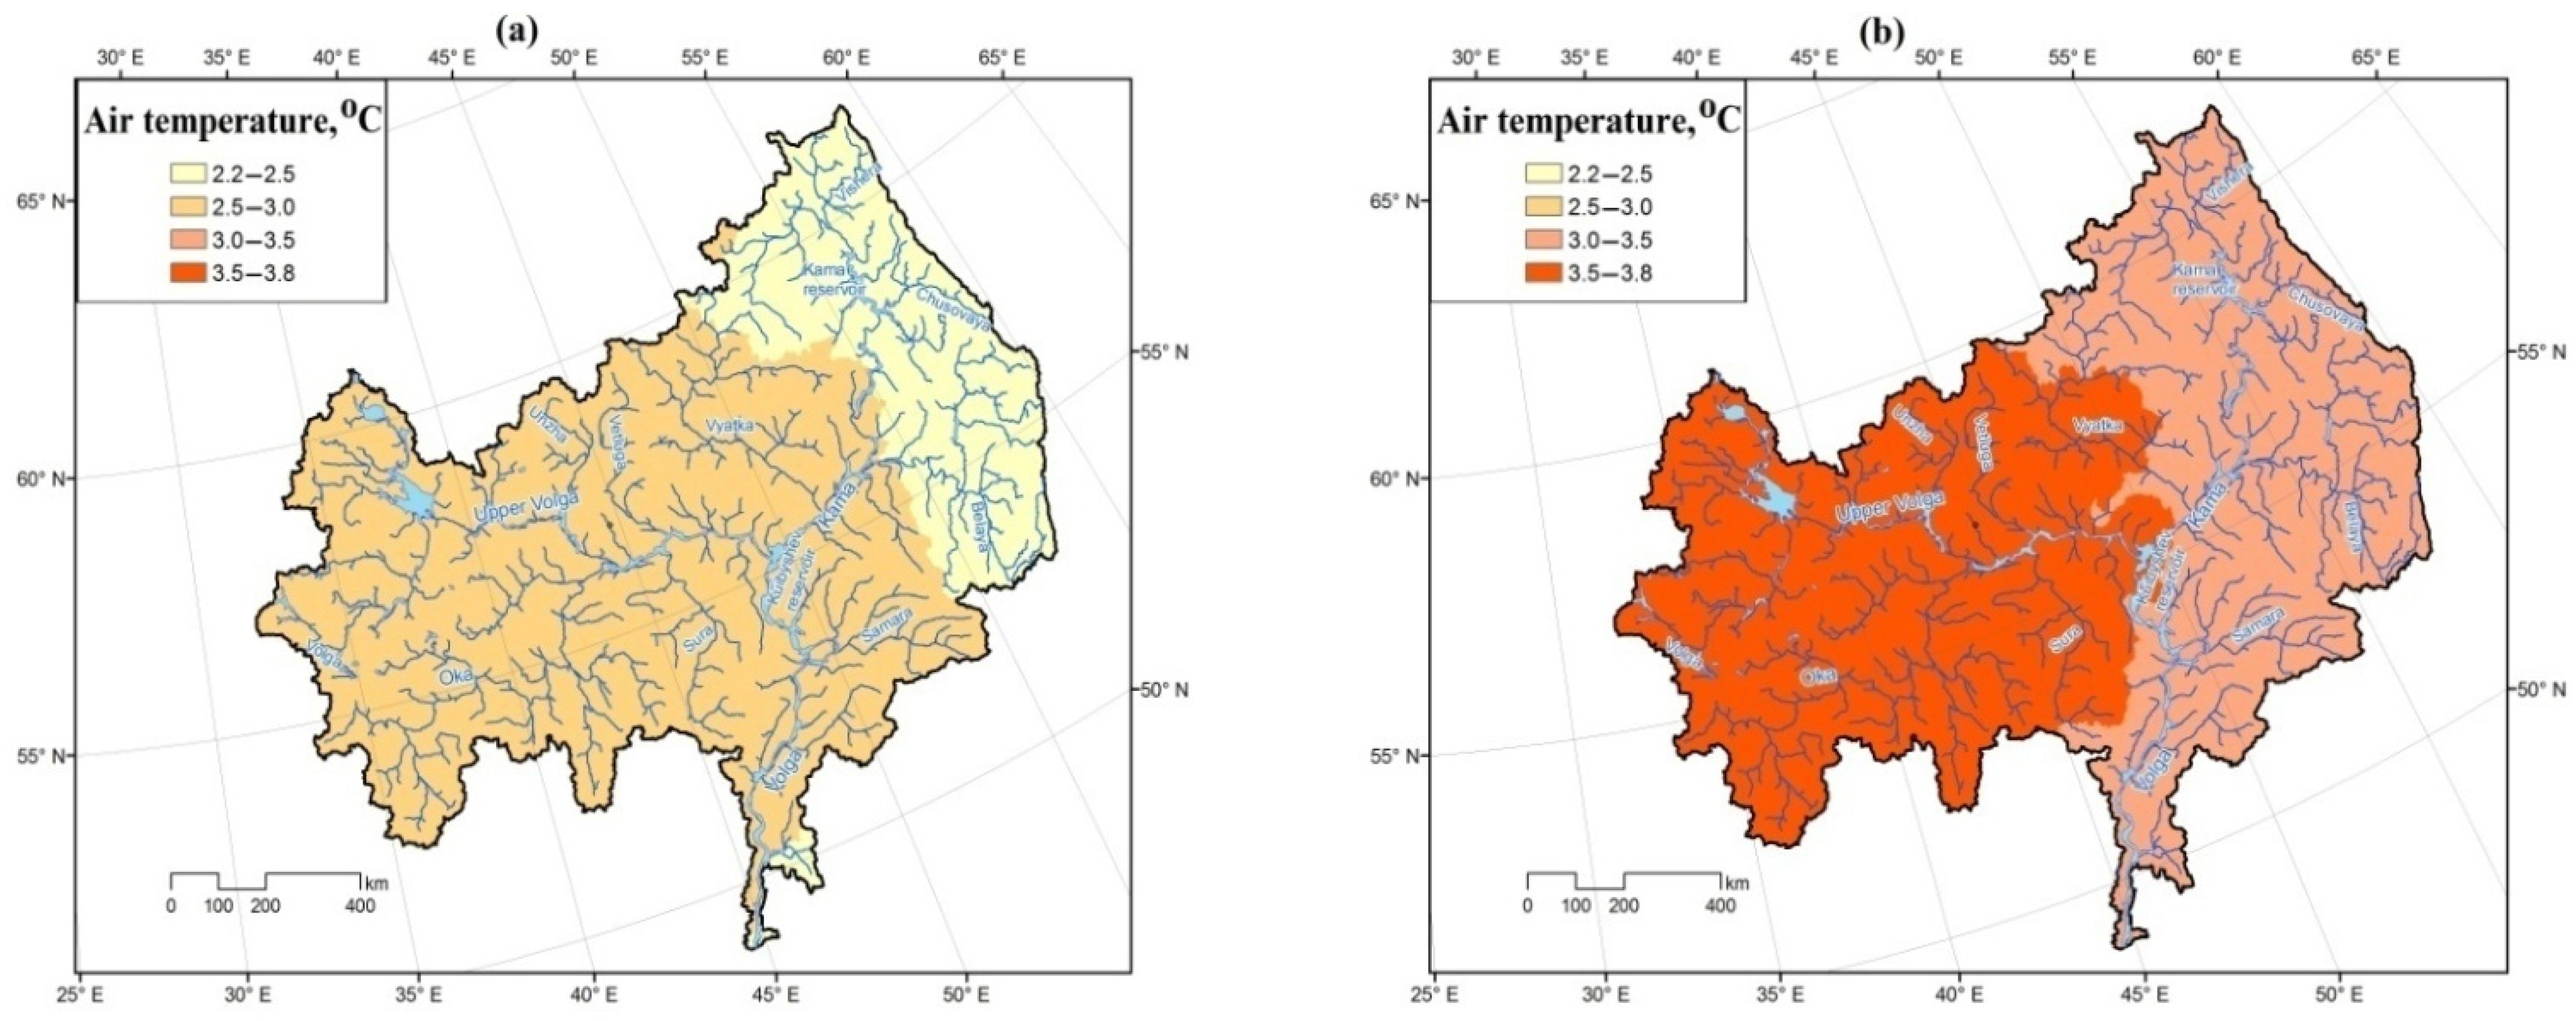
| Mean annual air temperature, °C | 3.4 (0.5) | 4.7 (0.3) | 3.6 (0.3) | 2 (0.4) |
| Mean winter air temperature, °C | −8.2 (0.1) | −6 (−0.1) | −6.7 (−0.1) | −10.1 (−0.1) |
| Mean spring air temperature, °C | 8.1 (0.4) | 9.4 (0.1) | 7.5 (0.2) | 6.9 (0.5) |
| Mean summer-autumn air temperature, °C | 12.8 (0.9) | 13.4 (0.7) | 12.2 (0.6) | 12 (1) |
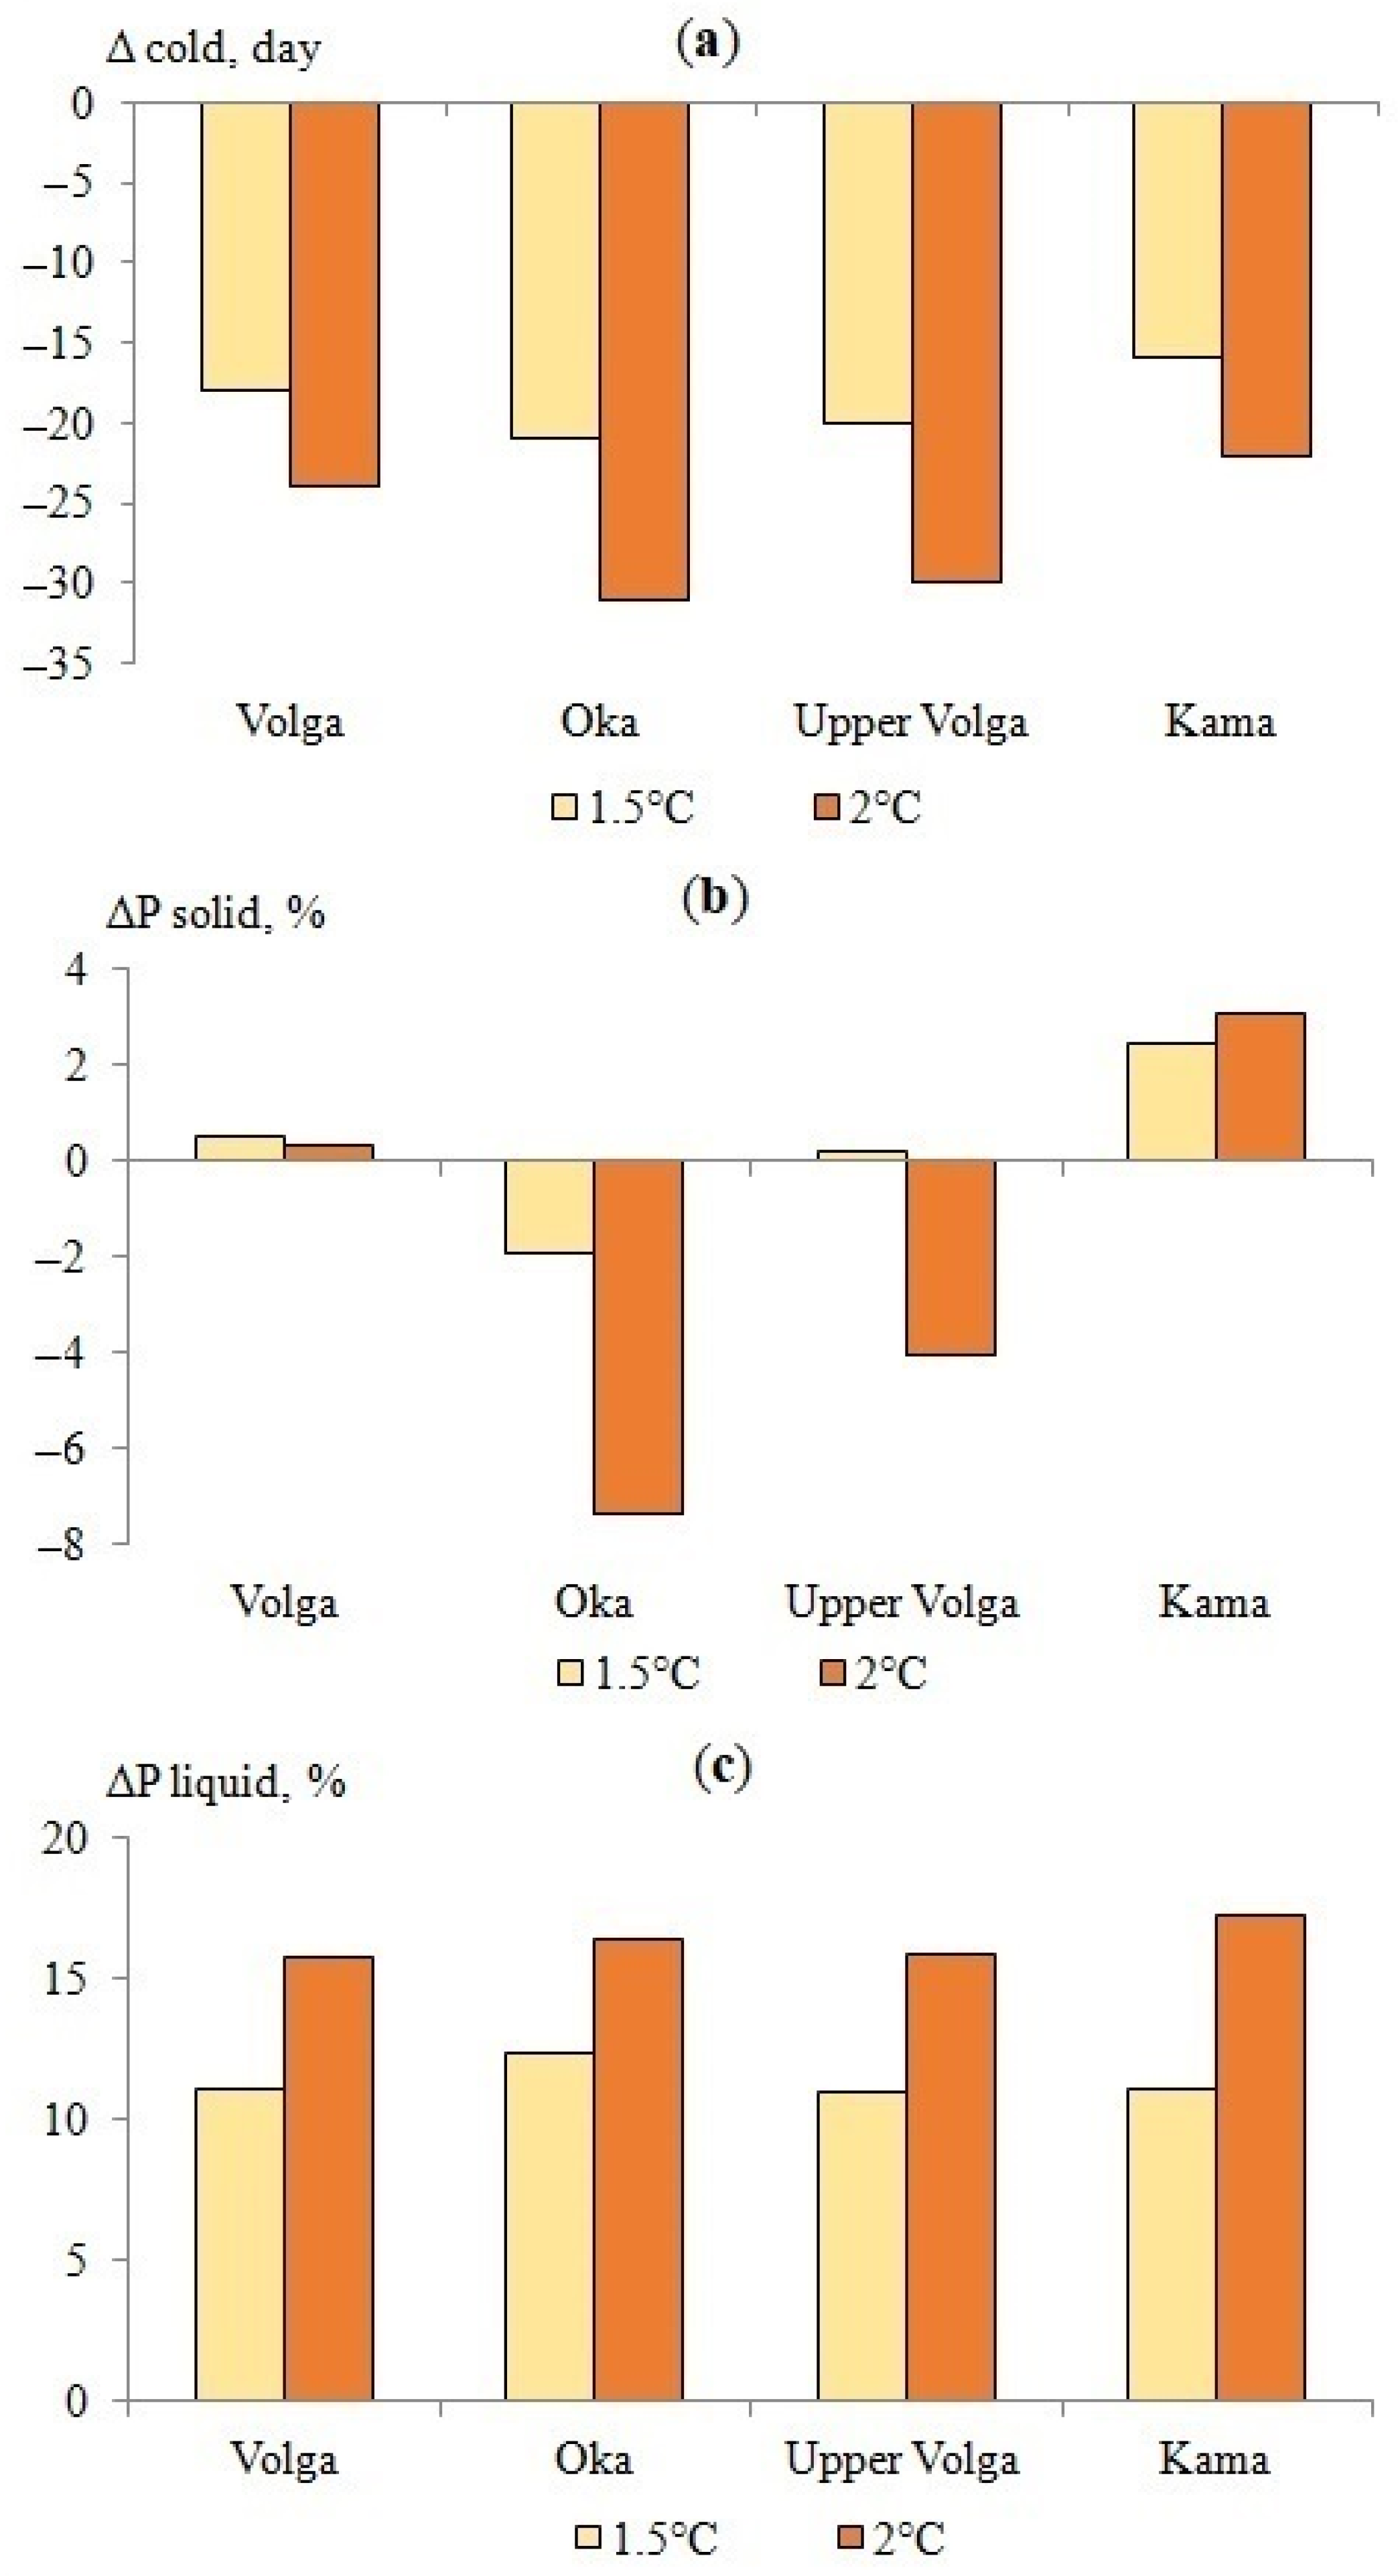
| Duration of the period with negative air temperature, day | 151 (−1) | 131 (7) | 138 (5) | 162 (−2) |
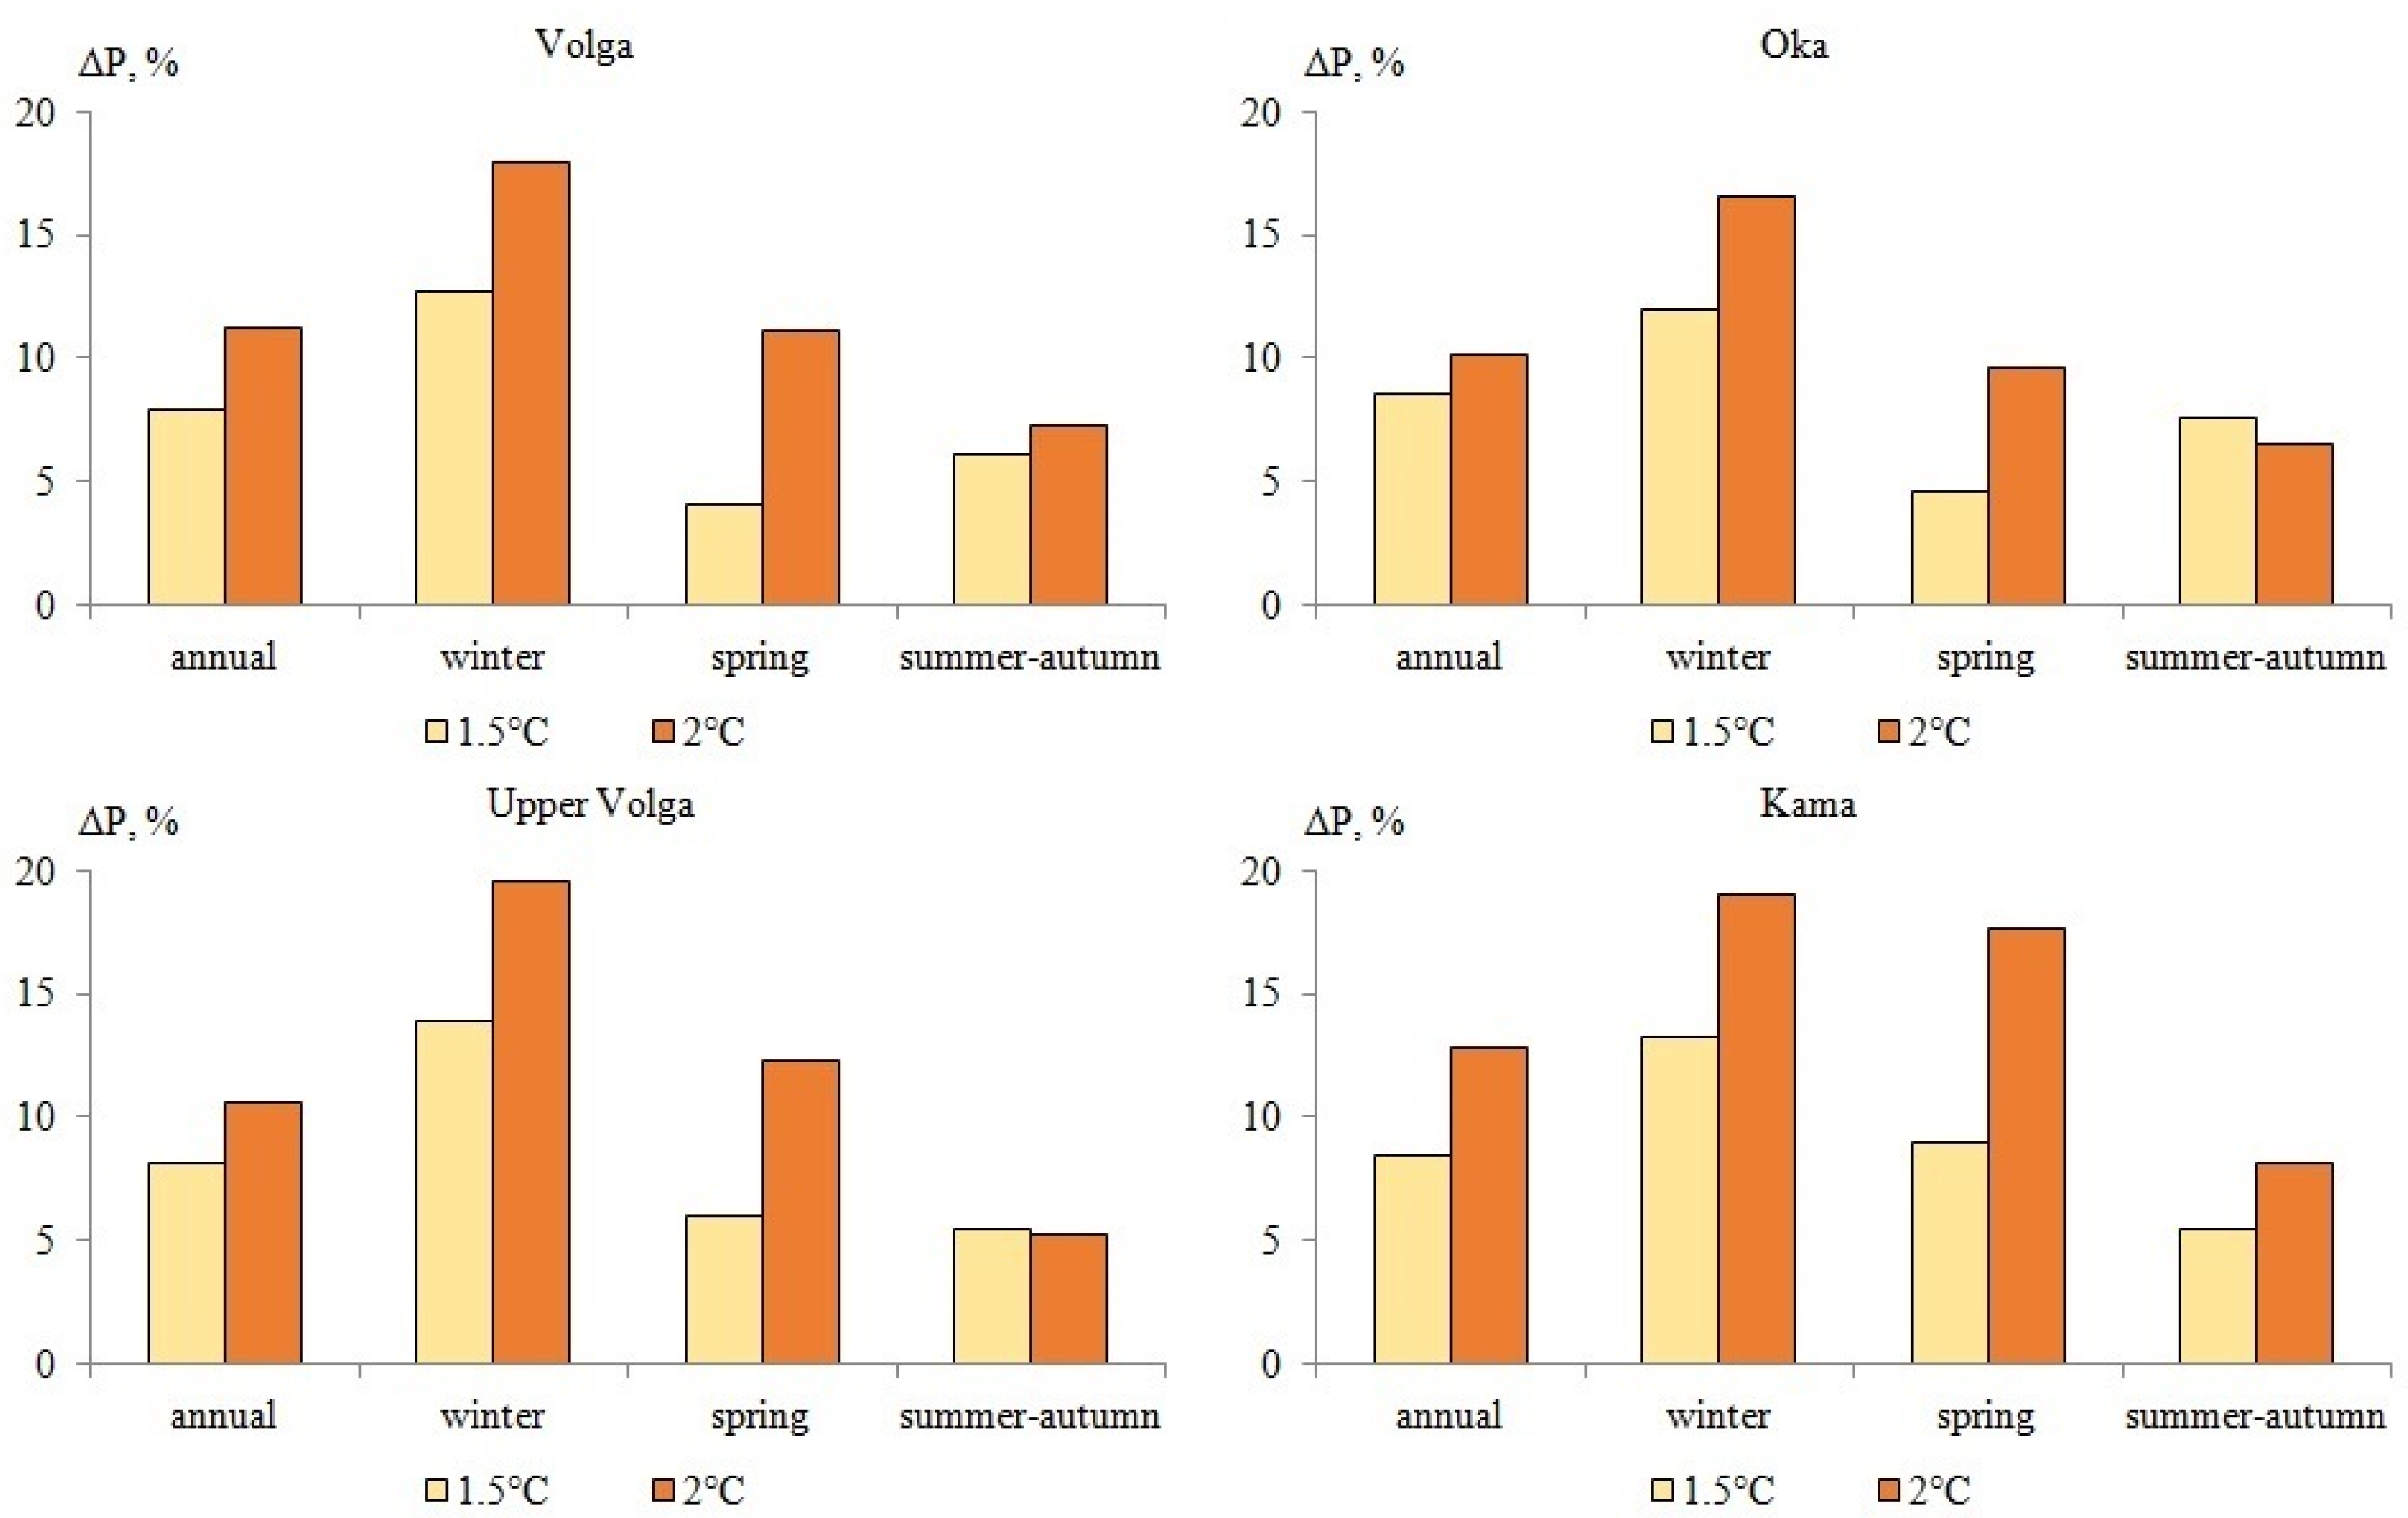
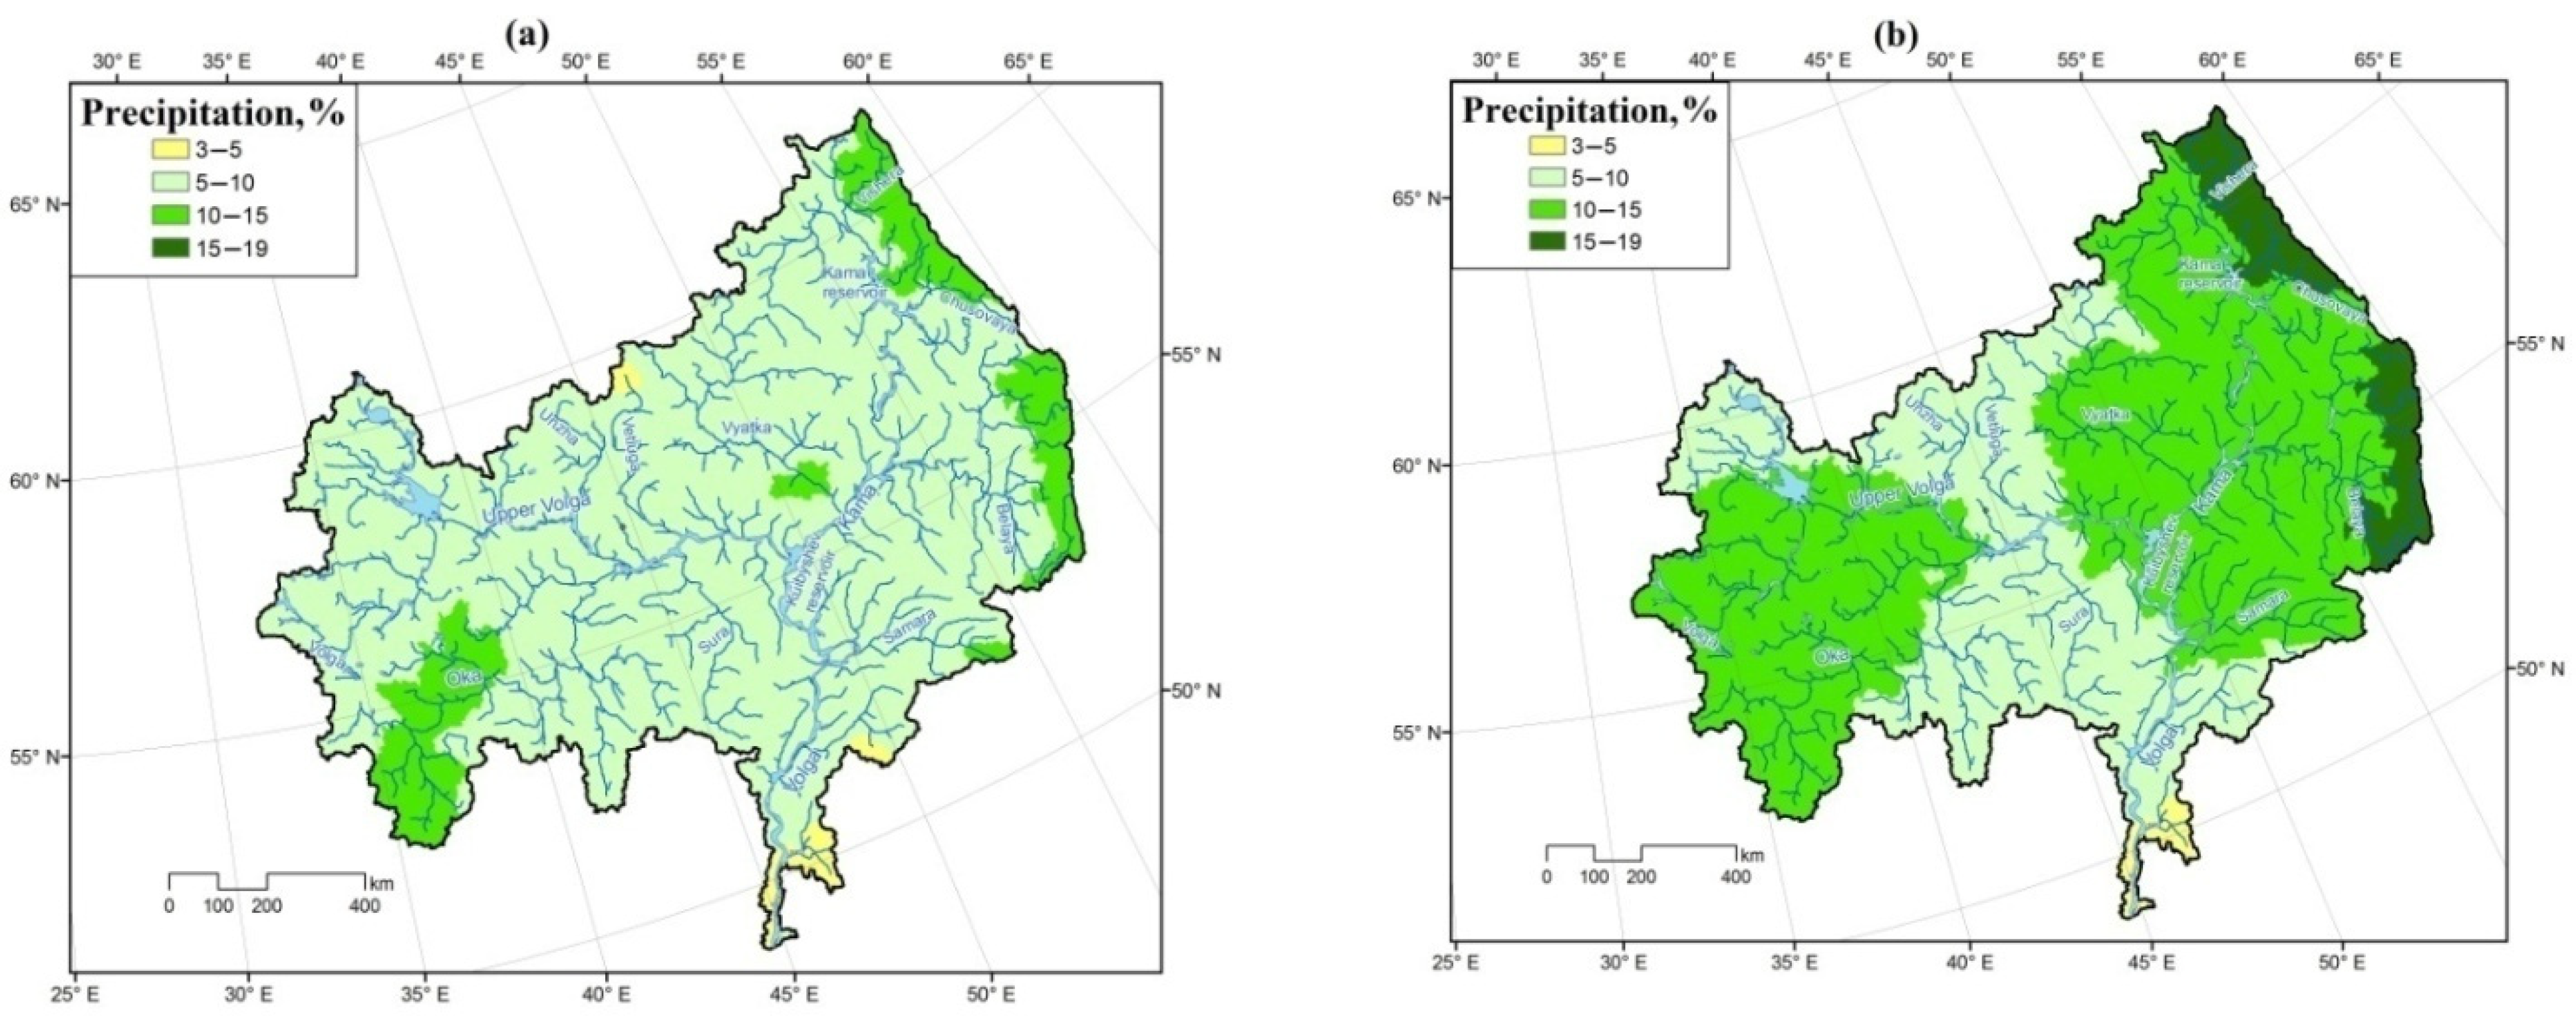
| Annual precipitation, mm | 573 (2%) | 605 (2%) | 629 (2%) | 586 (1%) |
| Winter precipitation, mm | 179 (3%) | 190 (1%) | 195 (−1%) | 179 (1%) |
| Spring precipitation, mm | 79 (6%) | 84 (−1%) | 89 (−1%) | 79 (5%) |
| Summer-autumn precipitation, mm | 315 (1%) | 331 (3%) | 345 (4%) | 328 (−1%) |
| Solid precipitation, mm | 172 (2%) | 149 (9%) | 163 (4%) | 190 (−3%) |
| Liquid precipitation, mm | 401 (2%) | 456 (1%) | 466 (1%) | 396 (2%) |
| Parameter | Volga | Oka | Upper Volga | Kama |
|---|---|---|---|---|
| Annual runoff, km3 | 262 (4%) | 44.9 (5.9%) | 62.3 (5.3%) | 123 (1.5%) |
| Winter runoff, km3 | 60.4 (9.5%) | 14 (6.9%) | 16.4 (17%) | 22.1 (6.9%) |
| Spring flood runoff, km3 | 140.2 (0.4%) | 17.3 (−2.1%) | 25.4 (−6.5%) | 71.4 (−0.2%) |
| Summer–autumn runoff, km3 | 61.4 (7.2%) | 13.6 (15%) | 20.5 (11%) | 29.5 (1.5%) |
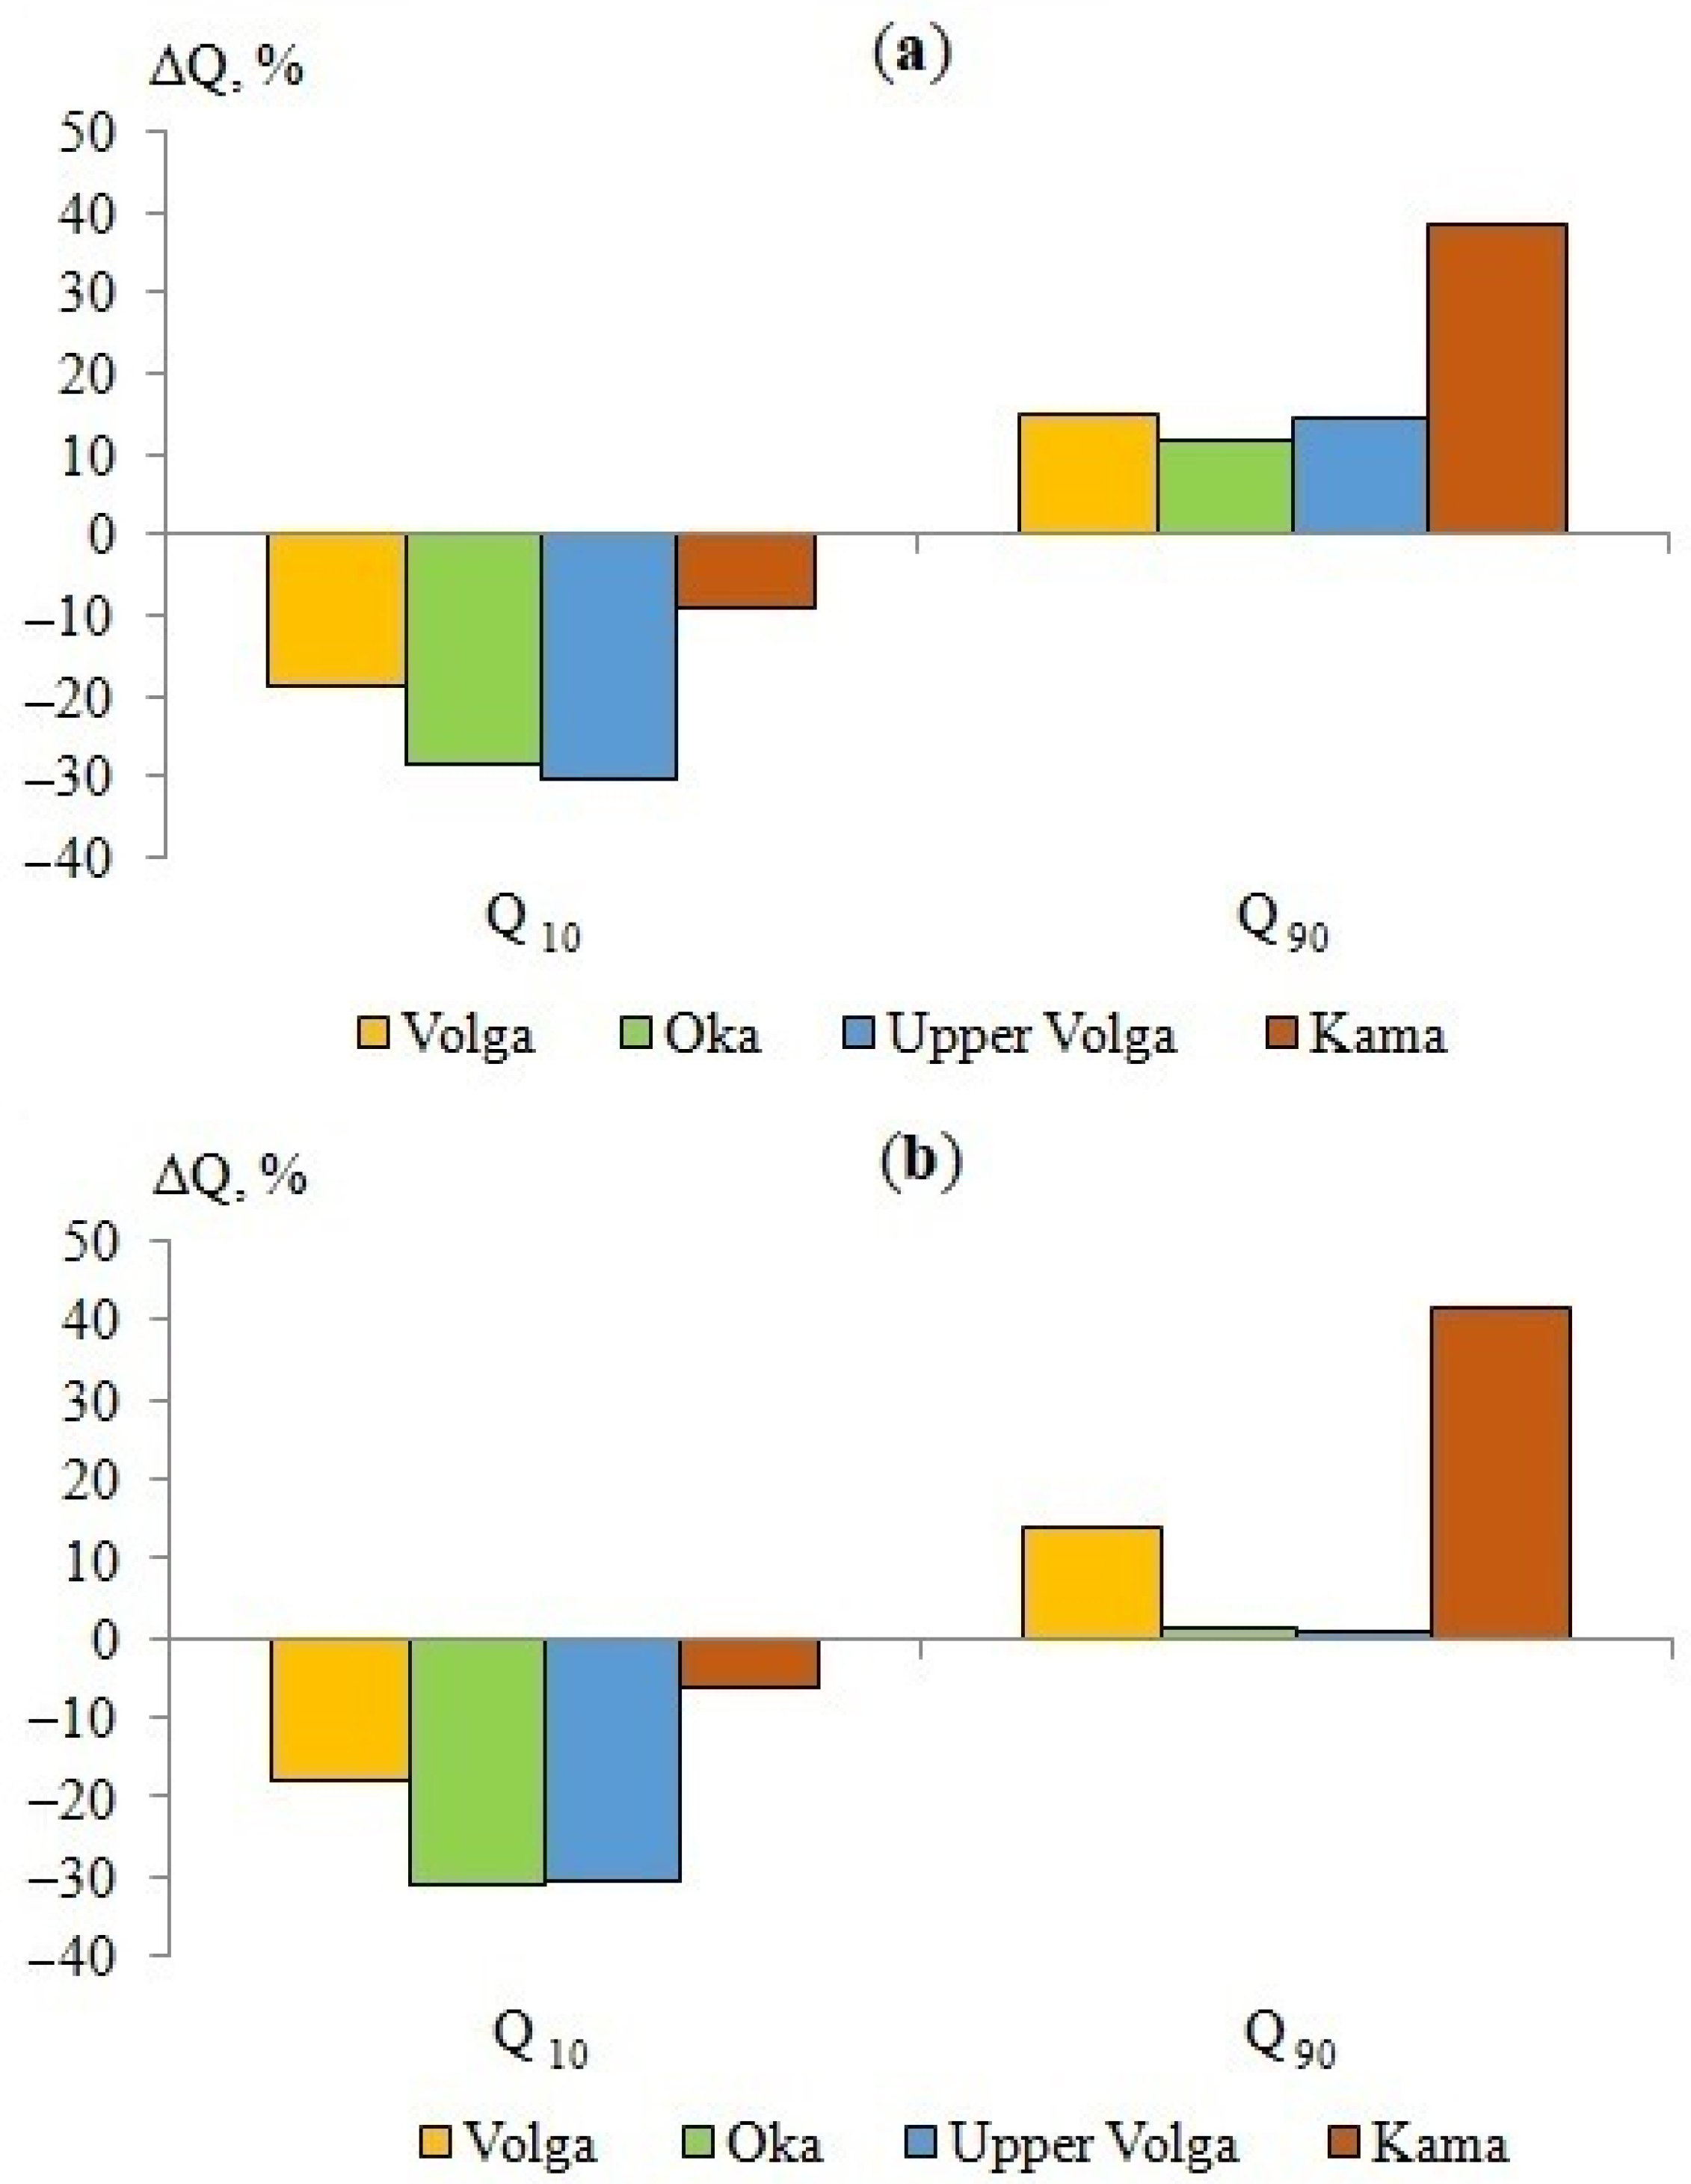
| Q10, m3 s−1 | 20500 (−0.8%) | 4600 (−4.7%) | 3090 (1.4%) | 10500 (−1.2%) |
| Q90, m3 s−1 | 2590 (27%) | 540 (28%) | 450 (20%) | 960 (5.1%) |
| Runoff coefficient | 0.38 (0.01) | 0.30 (0.01) | 0.41 (0.01) | 0.41 (0) |
Publisher’s Note: MDPI stays neutral with regard to jurisdictional claims in published maps and institutional affiliations. |
© 2022 by the author. Licensee MDPI, Basel, Switzerland. This article is an open access article distributed under the terms and conditions of the Creative Commons Attribution (CC BY) license (https://creativecommons.org/licenses/by/4.0/).
Share and Cite
Kalugin, A. Hydrological and Meteorological Variability in the Volga River Basin under Global Warming by 1.5 and 2 Degrees. Climate 2022, 10, 107. https://doi.org/10.3390/cli10070107
Kalugin A. Hydrological and Meteorological Variability in the Volga River Basin under Global Warming by 1.5 and 2 Degrees. Climate. 2022; 10(7):107. https://doi.org/10.3390/cli10070107
Chicago/Turabian StyleKalugin, Andrey. 2022. "Hydrological and Meteorological Variability in the Volga River Basin under Global Warming by 1.5 and 2 Degrees" Climate 10, no. 7: 107. https://doi.org/10.3390/cli10070107