Review

Observations from Personal Weather Stations—EUMETNET Interests and Experience

1
Zentralanstalt für Meteorologie und Geodynamik (ZAMG), A-1190 Vienna, Austria
2
Koninklijk Nederlands Meteorologisch Instituut (KNMI), 3731 GA De Bilt, The Netherlands
3
MetOffice, Exeter EX1 3PB, UK
4
Météo-France, CEDEX 1, 31057 Toulouse, France
5
MetNorway, 0371 Oslo, Norway
6
Swedish Meteorological and Hydrological Institute (SMHI), SE-601 76 Norrkoping, Sweden
7
The Finnish Meteorological Institute (FMI), FI-00101 Helsinki, Finland
8
The German Weather Service (DWD), 20359 Hamburg, Germany
*
Author to whom correspondence should be addressed.
Climate 2022, 10(12), 192; https://doi.org/10.3390/cli10120192
Submission received: 25 October 2022 / Revised: 28 November 2022 / Accepted: 29 November 2022 / Published: 2 December 2022
(This article belongs to the Special Issue Review Feature Papers for Climate)

Abstract

:
The number of people owning a private weather station (PWS) and sharing their meteorological measurements online is growing worldwide. This leads to an unprecedented high density of weather observations, which could help monitor and understand small-scale weather phenomena. However, good data quality cannot be assured and thorough quality control is crucial before the data can be utilized. Nevertheless, this type of data can potentially be used to supplement conventional weather station networks operated by National Meteorological & Hydrological Services (NMHS), since the demand for high-resolution meteorological applications is growing. This is why EUMETNET, a community of European NMHS, decided to enhance knowledge exchange about PWS between NMHSs. Within these efforts, we have collected information about the current interest in PWS across NMHSs and their experiences so far. In addition, this paper provides an overview about the data quality challenges of PWS data, the developed quality control (QC) approaches and openly available QC tools. Some NMHS experimented with PWS data, others have already incorporated PWS measurements into their operational workflows. The growing number of studies with promising results and the ongoing development of quality control procedures and software packages increases the interest in PWS data and their usage for specific applications.

1. Introduction

EUMETNET is a network of 31 European National Meteorological & Hydrological services (NMHS) intended to organize co-operative programs between its members (https://www.eumetnet.eu/, accessed on 25 November 2022). These meteorological programs are focused on assessing observing systems, sharing data processing methods, creating forecasting products, and promoting research, development, and specialized training. In 2019, EUMETNET carried out an observation gap analysis for the EUMETNET Composite Observing System (EUCOS) region, which highlighted wide-ranging deficiencies compared to the requirements defined by the WMO Observing Systems Capability Analysis and Review (OSCAR) requirement Database. In summary, this analysis revealed that the availability of basic atmospheric variables over the EUCOS domain does not meet large parts of the user requirements, except for specific elements related to Global-National Weather Prediction (NWP) applications. The key weaknesses include the availability of near-surface observations of humidity, pressure, temperature, wind, and precipitation (intensity and types) at a horizontal spacing of 50 km or under, every 15 min or less. It is unlikely that core observing networks operated by NMHS can be up-scaled to meet these requirements due to affordability constraints, given the high costs for installation and maintenance of the networks [1,2].
Traditional observational networks are operated by NMHS for weather prediction over regional scales and to study atmospheric conditions and events representative over a wide area [1,3]. These official stations are often spaced in a way that balances financial considerations with the optimal coverage for large scale phenomena at locations meeting WMO regulations for station siting [4]. In practice, the spatial sparsity of the official networks pauses hurdles for advancing towards a higher-resolution weather forecast, which is in disagreement with the increasing societal demands on data availability at local scales. Hence, meeting the requirements for localized and small-scale observation and prediction undoubtedly requires a higher-density observational network.
In this context, observations from private weather stations (PWS) present promising opportunities to complement core national meteorological networks. PWS are affordable weather monitoring instruments that citizens or organizations can purchase and install in their private spaces (e.g., home, school, urban park). Weather enthusiasts across the globe are increasingly joining the effort of monitoring the weather and contributing their measurements to different networks [5]. This follows the global trend of sensors becoming more affordable, accessible, and providing observations with a higher quality [6]. Most PWS allow the automatic submission of observations to data repositories, which in turn offer web platforms and applications allowing the public access for users interested in the weather conditions [7,8]. Currently, these platforms collect tens of thousands of PWS around the globe, thus forming a Big Data store of crowdsourced weather observations.
PWS have the potential to provide real-time observations at the sub-km scale, which are essential for forecasting and managing the impact of fine-scale high-impact weather events, particularly in densely populated areas and/or complex terrain. Nevertheless, observations from PWS are not without their challenges. These stations are generally owned by citizens and can present quality issues due to poor siting of the sensors (e.g., exposed to local radiative or cooling effects relating to ground type, direct exposure to sunlight, proximity to buildings/walls/trees), absence or inconsistent metadata to support downstream processing, suboptimal manufacturing of the PWS (e.g., insufficient ventilation, poor casing materials) and lack of or infrequent calibration and maintenance. Hence, measurements acquired by PWS have a higher intrinsic uncertainty and bias than measurements provided by automatic weather station (AWS) networks operated by NMHS.
In the past decade, researchers have dedicated efforts towards developing and implementing quality control procedures (QC) that assign quality flags to the observations provided by observing networks. These QC are often structured around the following types of filters and corrections: (1) application of intra-station filters (e.g., consistent metadata, observation within climatic range, acceptable daily coverage); (2) application of inter-station filters (e.g., comparisons with surrounding stations); and (3) bias adjustments (e.g., corrective factors to apply to each observation) [9]. In this context, QCs were developed for temperature (e.g., [1,2,10,11]), precipitation [11,12], and wind [13], and some of them have been made into software packages (TITAN: [14]; CrowdQC: [15], CrowdQC+: [16]) ready to use by the research community. These efforts and the growing amount of PWS data further raised interest in these PWS measurements in many different sectors.
Over recent years, there has been a growing interest in the use of PWS to improve weather and climate services. These efforts have yielded some success cases, enabling the usage of PWS data in the forecasting services of several NMHS (e.g., [10,17]). During 2020, EUMETNET’s working group on Crowdsourcing identified PWS as a key topic and created a sub-activity to collectively reinforce the development carried out by NMHS in this area. The ambition is to expand the knowledge of exploiting PWS observations across EUMETNET members, and accelerate the realization of the benefits that this new data type can offer. This report provides an overview of EUMETNET interest in PWS observations and their experience so far. It provides a discussion around the data quality challenges associated with this data type and a review of the available open source quality control tools used to tackle some of these issues.

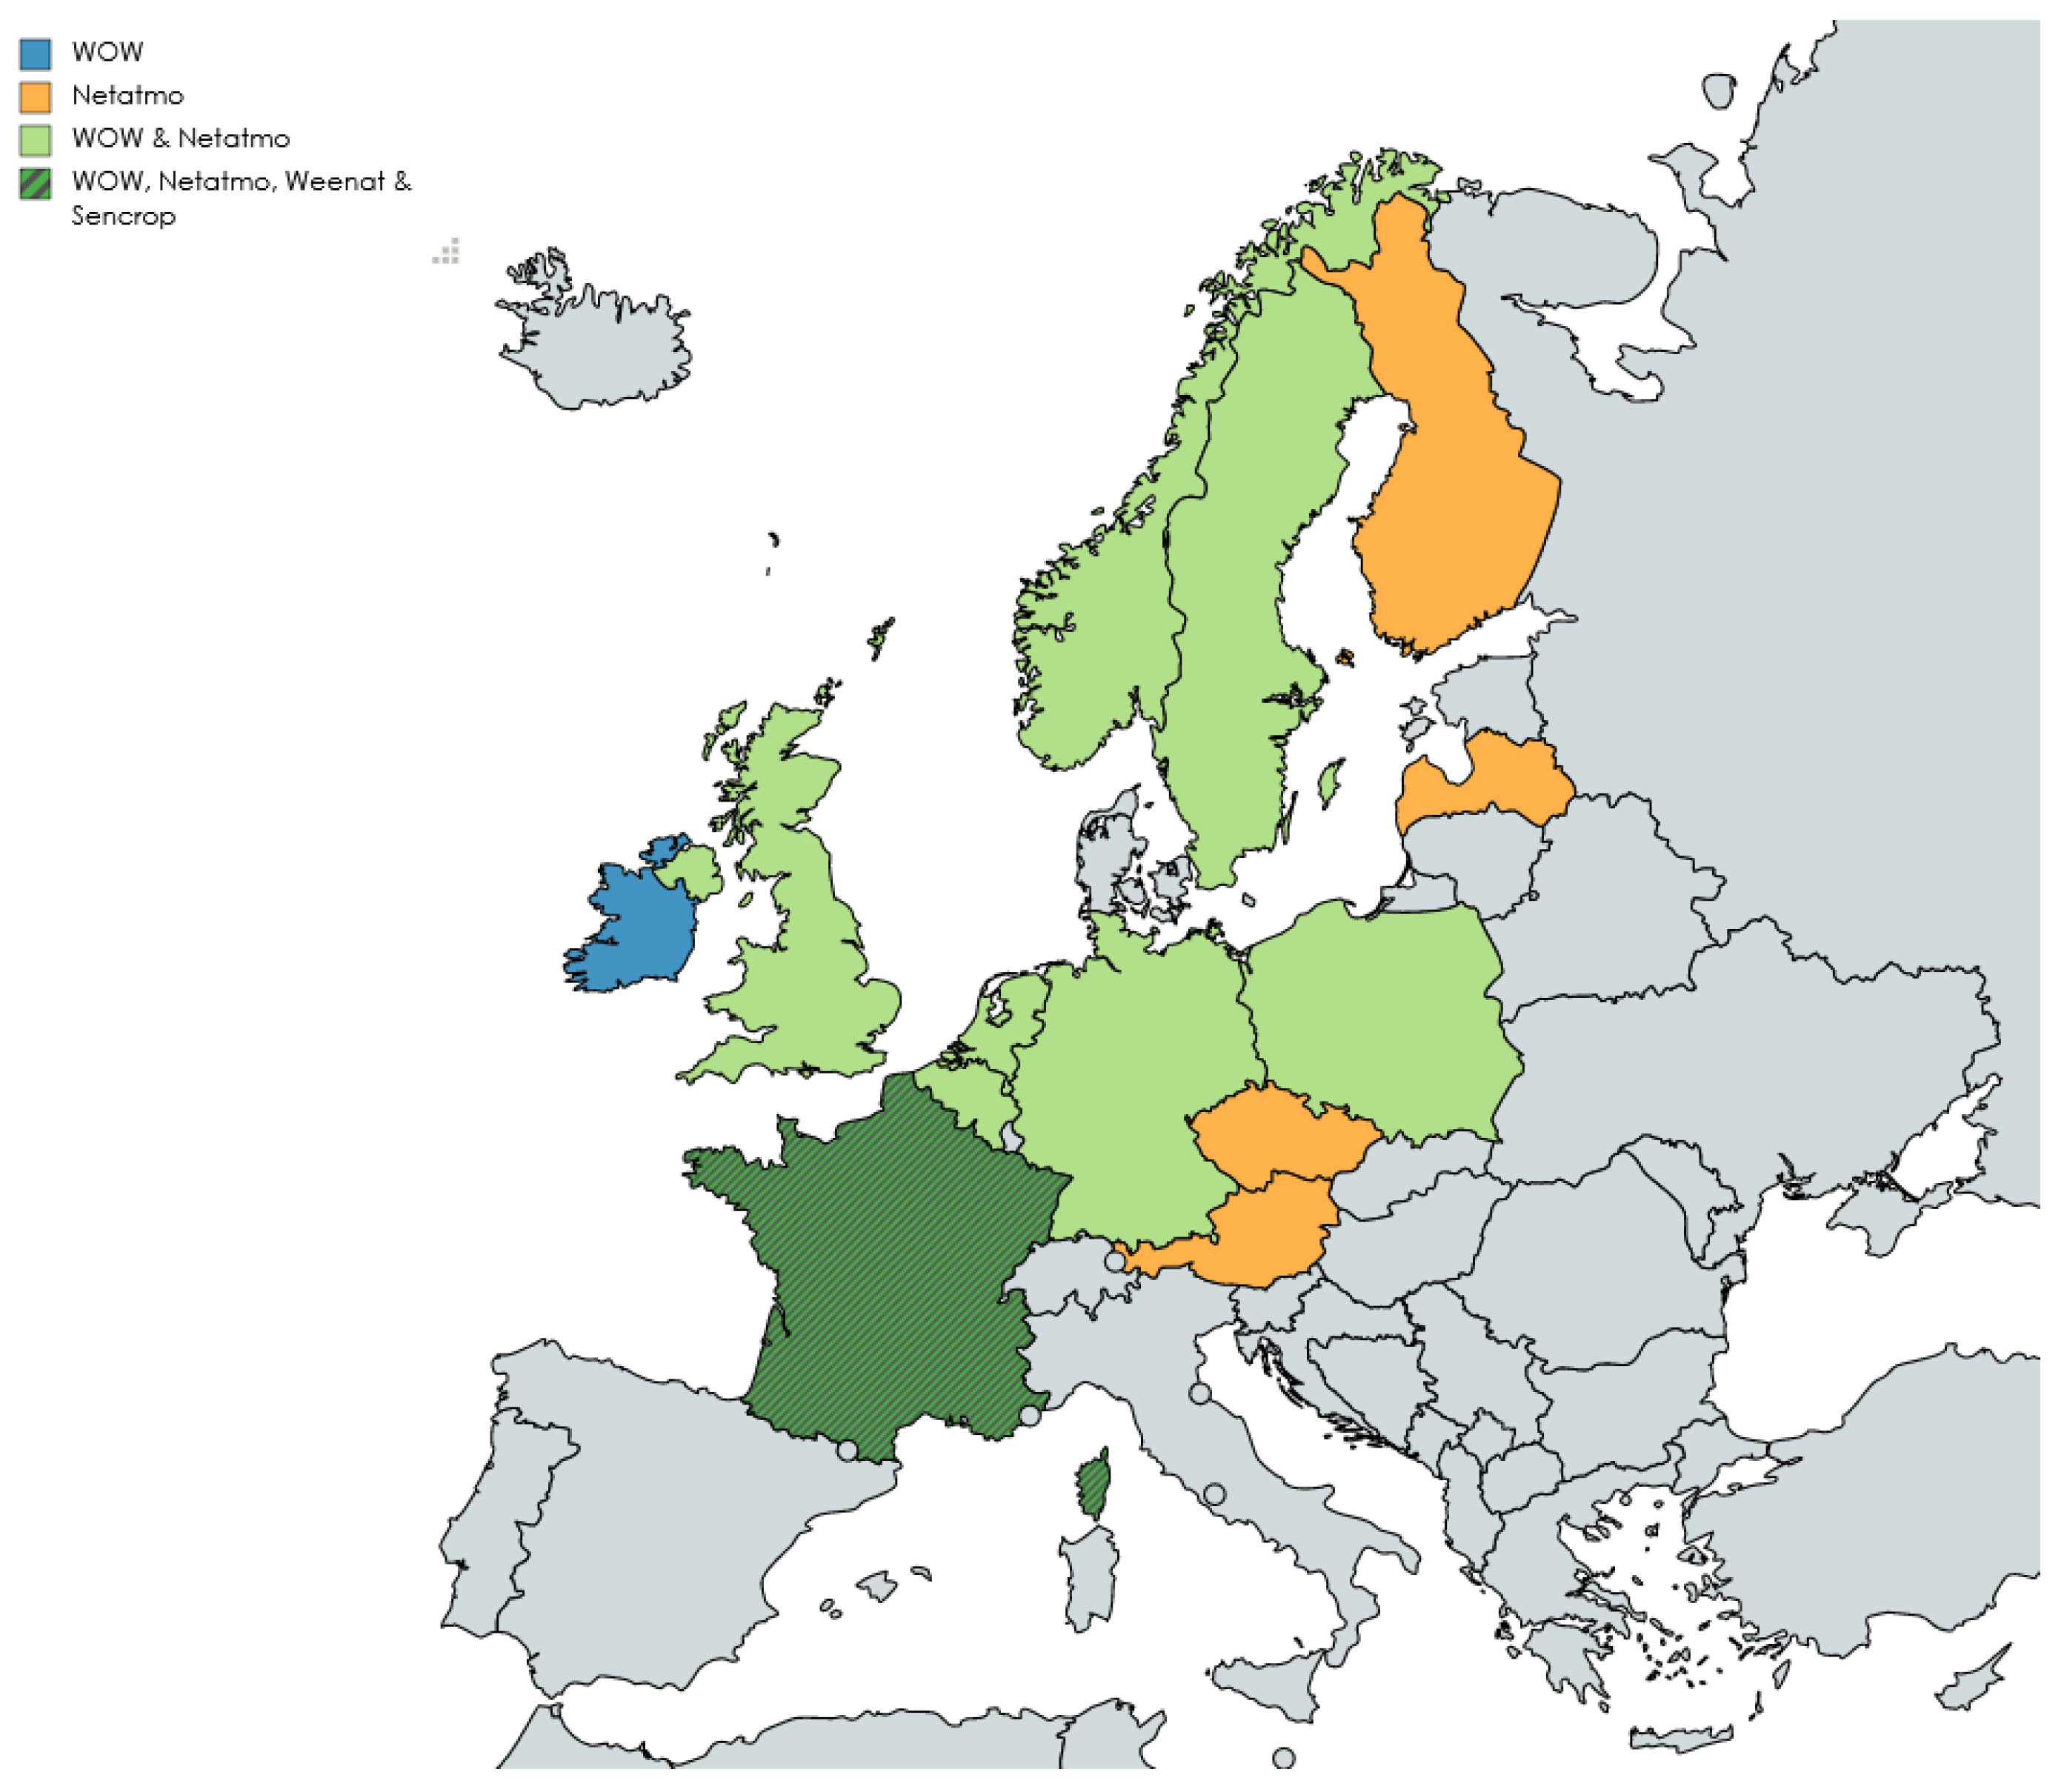
2. Interest in and Experience with Personal Weather Stations across National Meteorological & Hydrological Services in Europe

The mandate of NMHS is to provide weather forecasts and warnings for the state and the general public, hence ensuring timely and well informed decisions to prepare for and manage high impact weather events as well as plan for adverse climate conditions. Enacting this mandate requires the constant enhancement of weather forecast models, data pre- and post-processing, model validation and the generation of services for various sectors that are affected by weather conditions. PWS commonly form high-density monitoring networks. Because of this characteristic, NMHS are investigating the usefulness and potential of PWS data as an additional data source. Currently, some NMHS are evaluating the potential of PWS measurements for these tasks, others already use these observations in operational forecasting.
There is a large variety of PWS that can be purchased and several platforms where the data can be made public and accessed. Some of these platforms allow the (bulk) download of weather observations via an application programming interface (API) [2], which, in the case of commercial platforms, might have some costs associated. Netatmo (https://www.netatmo.com/en-gb, last access on 24 October 2022), for example, is a company manufacturing smart home devices, including PWS. Measurements from Netatmo stations are automatically uploaded to the Netatmo Weathermap platform (https://weathermap.netatmo.com/, last access on 24 October 2022). Sencrop and WEENAT are data providers that also sell weather stations and that focus on the needs of the agricultural community. On platforms like the Weather Observations Website (WOW) (https://wow.metoffice.gov.uk/, last access on 24 October 2022) and Weather Underground (WU) (https://www.wunderground.com/, last access on 24 October 2022), users are able to upload manual observations or register their PWS to automatically upload weather observations [5,18], hence enabling the collection of a variety of data from different vendors.
The European NMHS are currently accessing PWS data from four main providers as shown in Figure 1.

2.1. Operational Weather Forecasts and Meteorological Applications

The national weather service in Norway (MET Norway) uses real-time PWS data from Netatmo to improve operational 2 m temperature forecasts through post-processing for Scandinavia, Finland and the Baltic countries [10]. Together with the Swedish NMHS (SMHI) and the Finnish NMHS (FMI), they were involved in the iOBS-project (Improved Observation usage in numerical weather prediction, https://neic.no/iobs/, last access on 24 October 2022). The iOBS-project aims to demonstrate the impact of supplementing core NMHS networks with observations from PWS on NWP by investigating possibilities to enable effective and high-quality reception, storage and quality control (QC) of observation data for data assimilation.
The national weather service in the Netherlands (KNMI) is in the early stages of research intended to model weather and climate at neighborhood scales. In this context, the high-resolution observations from PWS networks (i.e., WOW for the Netherlands, WOW-NL) are used for the systematic evaluation of HARMONIE-AROME limited area model at the sub-km grid spacing. The German Weather Service (DWD) has assimilated near-surface temperature and humidity observations over Germany derived from the Netatmo PWS network into the Limited Area Model of the Icosahedral Nonhydrostatic Model with 2 km resolution (ICON-D2). For both, the bias correction reduces the mean bias between 50 and 70% for the period analyzed from 17–30 September 2018. In fact, the ICON model does not include an urban canopy model, therefore the use of Netatmo data might be useful in ICON to parameterize this in cities. Overall, it can be concluded that the forecast quality can be improved by assimilating Netatmo data, provided that an effective bias-correction approach is applied [19].
The Swedish Meteorological and Hydrological Institute (SMHI) is interested in using PWS for nowcasting, real-time follow up on weather forecasts, impact-based weather warnings, and post-event analysis to evaluate weather warnings and local weather events.
The Finnish Meteorological Institute (FMI) is currently using quality-controlled Netatmo temperature observations in operational nowcasting, as a supplementary observation network to support the core AWS network. There are also plans to add and test using Netatmo relative humidity observations in the nowcast.
The UK Met Office is accessing PWS data for real-time monitoring of meteorological phenomena across the UK, as well as providing a visual validation for the NWP model forecast. They are using the Met Office core network to quality control PWS observations [17,20]. Quality controlled WOW data are used as a primary input to a mesoanalysis tool, wherein the quality controlled WOW data are combined with model data using data assimilation techniques, to produce gridded fields. The analysis can be used to improve the forecasters’ ‘situational awareness’, e.g., in highlighting regions where convection initiation may occur in the near future. Analysis minus model background plots can be used to show where conditions are starting to deviate from model expectations, again improving forecaster ‘situational awareness’ in the nowcasting timeframe.
At the Austrian national weather service (ZAMG), tests were and are being carried out to assess (a) whether Netatmo data, among other data sources, could substitute standard measurements in objective analysis and weather forecasting in case of an outage/breakdown of reference stations, and (b) whether Netatmo data can be used as an additional data source to enhance analysis and forecasting. Netatmo rain gauge measurements were integrated in the analysis- and nowcasting system INCA and in a preliminary evaluation it was shown that after careful pre-processing and with some limitations, Netatmo data can be helpful in case of a breakdown of the reference stations. Early studies using Netatmo precipitation to improve analysis were inconclusive. Multiple parameters from Netatmo data were also used in the assimilation of the AROME-RUC forecasting system.

2.2. Agriculture Applications

Several institutes and research centers in Meteorology and Agriculture are interested in investigating the benefit of PWS for agricultural applications, e.g., modelling micro-climate at very fine scale in order to create action plans to schedule irrigation spraying, or to reduce the provision of phytosanitary inputs. The use of Internet of Things (IoT) sensors in agriculture is continuously increasing, leading to a very high density of PWS over a small surface. This density is a big advantage for monitoring and to modeling small-scale weather features.
Especially in vineyards, which are often set up over a complex ground (hills), modelling micro-climate is very useful for frost prediction and irrigation management [21]. A study done by [22] in the vineyard of Sonoma (California) shows that PWS have the potential to reduce personnel and material costs, minimize environmental impact and improve fruit quality. In addition, a study carried out by the University Polytechnic of Bucharest (Romania) [23] demonstrated the potential of PWS to monitor small-scale weather features for precision farming.
In Météo-France [24], in the framework of the METEOPREC project [25] (Meteorology for precision agriculture), more than 700 PWS (made available by the data providers Sencrop and Weenat) over the course of a 2-year study have been checked in order to assess meteorological data quality and the potential such data could have to be interpolated in a multi-sources mapping product. After thorough quality control, PWS meteorological time series also fed into a decision tool based on plant diseases modelling. This latter proposes a range of days (in a probabilistic manner) on which treatment with plant-care products could be the most effective.
Meteorological parameters derived from PWS are temperature, humidity and rainfall amounts. Graf et al., 2021 [26] and de Vos et al., 2017 [27] have demonstrated the potential of PWS rain gauges to capture the high spatio-temporal variability of rainfall thanks to a high number of opportunistic rainfall data. This advantage is very useful to forecast thunderstorms and prevent damages on crops caused by hail.

2.3. Urban and Climate Applications

Urban areas in Europe continue to grow due to the development of low-density residential areas expanding the perimeter of cities, the increase of industrial and commercial areas as well as the expansion of construction sites [28]. This urbanization and the accompanying soil sealing negatively affects the local climate (e.g., urban heat islands) [29], which implies that urban dwellers are at risk of severe or extreme weather conditions consequences (e.g., heat waves, flash floods).
In this context, using data from PWS can be highly beneficial. Several studies investigated the potential of personal weather stations for urban and climate applications, focusing on temperature [1,2,7,16,30,31,32,33,34,35], wind [8], and precipitation [7,27]. More recently, PWS data have also been used in combination with additional data sets (e.g., remote sensing data) to map urban temperature using machine learning techniques [36,37].
Chapman et al., 2017 [30] studied the urban heat island effect in London at night-time for a two month period using Netatmo data. Meier et al., 2017 [1] and Fenner et al., 2017 [31] investigated temperature patterns in Berlin for a whole year, also using Netatmo data. While Meier et al., 2017 [1] mainly addressed data quality issues and quality control steps, Fenner et al., 2017 [31] used the quality-controlled data to assess the intra and inter ‘local climate zone’ variability of air temperature in Berlin. Feichtinger et al., 2020 [33] focused, like Chapman et al., 2017 [30], on a summer period during their study. However, they also investigated day- and night-time temperatures of Netatmo stations in Vienna and compared the data with data from reference stations. The quality control procedure applied was based on Napoly et al., 2018 [2] and Meier et al., 2017 [1] and a comparison with reference station data was promising. De Vos et al., 2020 [7] also compared, among other parameters, temperature from Netatmo stations with data from a reference network. These studies already show that quality controlled crowd sourced data are a valuable source to study the urban temperature patterns, which is crucial to support resilient urban planning and developing effective climate change adaptation strategies. Golroudbary et al., 2018 [38] used PWS data from www.wunderground.com (last access on 24 October 2022) and www.hetweeractueel.nl (last access on 24 October 2022) to investigate the impact of urban areas on temperature and precipitation in the Netherlands.
The potential of crowd-sourced precipitation data was also investigated by de de Vos et al., 2017 [27], considering 63 stations in Amsterdam. Most of the stations were Netatmo stations and several shortcomings/error sources were pointed out (e.g., rounding, data transfer). Nevertheless, they conclude that the data could “successfully be used for urban rainfall monitoring”. De Vos et al., 2020 [7] state that rainfall data from PWSs provide useful information regarding rainfall amount and distribution. They also investigated wind observations from PWSs. This data appears to be promising, however affected by precipitation. This has also been addressed by Droste et al., 2020 [8]. They evaluated wind speed measurements from PWSs in Amsterdam and developed a quality assurance protocol.
Based on the good results of comparative analyses for measuring air temperature [1,30,33] and precipitation [27] using PWS, the Czech Hydro-Meteorological Institute (CHMI) is testing the possibility of studying the urban climate using these data sets (especially from Netatmo stations). These data could be a useful complement to mobile measurements or thermal aerial photographs of the city, but research is in its early stages.
KNMI expects that incorporating quality-controlled PWS data into operational workflows will enable the development of high-resolution meteorological applications. Recent research at KNMI has shown the potential of PWS for monitoring urban heat islands in Amsterdam [7], and quality-controlled wind observations [13] might be promising for urban wind monitoring. Both examples are illustrative on how PWS data can complement the official network, especially for regions that remain unobserved by official networks for spatially inhomogeneous weather phenomena (e.g., rainfall, wind speed).
At ZAMG, Feichtinger et al., 2020 [33] investigated the potential of Netatmo data to study urban temperature patterns in Vienna. Given the promising results, Netatmo data is currently used at ZAMG to evaluate the model performance of urban climate models in several cities in Austria. In addition, ZAMG is investigating the potential of Netatmo data to map urban temperature patterns using machine learning techniques.
Together with the University of Lund and the University of Karlstad, SMHI will conduct a four year study to examine the potential of PWS [39]. The purpose is to conduct a thorough analysis after a flood event and thereby be able to better understand the vulnerabilities of society’s infrastructure. If the measurements are made in real time the aim is also to improve rain and discharge forecasts.
This section provided an overview of the different PWS-related activities performed by NMHS. As seen, there is an increasing interest in incorporating PWS data into well-consolidated operational workflows in meteorology and weather forecasting, but also in developing new applications for urban areas and agriculture. MetNorway and FMI already use PWS data in parts of their operational workflows. The MetOffice also uses PWS operationally, to monitor the meteorological situation and validate NWP forecasts. Most of the other NMHS are still at the research stage. The fact that WOW was initiated and is serviced by the MetOffice might explain why the MetOffice makes more substantial use of PWS data than others. In countries like Norway or Finland, servicing conventional stations in remote places is costly, therefore PWS data are a valuable alternative for them. We believe, the level of trust in the PWS data, the amount of available resources to store and process the large amount of data, as well as the distribution and serviceability of a reference network are the main points that influence to what extent PWS data is being used by NMHS. In addition, it is important to note that the incorporation of PWS data into these operational services might require considering new business (e.g., re-assessing value for external partners and stakeholders) and social aspects (e.g., promoting social engagement and outreach towards weather enthusiasts), to ensure the long-term adequate provision of weather observations. However, the consolidation of PWS as “daily business” for NMHS might require a coordinated effort between members striving for the unification of formats, the combination of datasets and the sharing of resources [9]. The results of the aforementioned studies are promising, but they all point towards good quality control being essential before the data can be incorporated into operational services.

3. Quality Control Techniques

3.1. Background

The main challenge in dealing with weather observations from PWS is the uncertainty of the quality of the data. Erroneous values can have a detrimental impact on forecasts and warnings. This uncertainty in the validity of the measurements can be due to various factors, i.e.,:
  • the instrument type: Unlike instruments and networks operated by NMHS, PWS are typically set up using a variety of meteorological instrument types from different manufacturers with varying sensor quality. Whilst some systems have been found to compare well with the standard set for NMHS’s AWS, others have been shown to have mean temperature biases well over recommendation [1,6,31,40].
  • the positioning of the instrument: NMHS tend to follow well defined WMO guidelines (WMO no. 8) [4] for placing their instruments. Conversely, the positioning of PWS varies considerably. Sites with poor exposure, affected by buildings or trees for example, or installed inside a building, lead to erroneous meteorological observations [1,2,8,30].
  • the measurement method: The frequency at which measurements are acquired might vary, depending on the type of site and whether the sampling occurs manually or automatically. In addition, data collection may not be continuous, regardless of whether the sampling is automated or not, so missing data could be common. This could affect services that rely on uninterrupted observations such as daily rainfall accumulations and maximum and minimum temperatures.
  • the quality of the metadata: Errors or missing metadata such as inaccurate site location or sensor height can lead to uncertainties in the observations.
The aim of a quality control technique is to maximize the detection of genuine errors and bias, whilst minimizing the rejection of ‘good’ data. Some of the challenges include dealing with extreme or isolated weather events, the uneven spatial distribution of the observations and topographical or geographical differences that will influence the weather at sites. In other words, large differences in meteorological observations may be identified as outliers by an automated quality control system, but could be genuine due to the influences of topography, coastal effects and isolated weather events such as thunderstorms.
Designing and applying quality control techniques requires a good understanding of the level of quality or uncertainty that is required for the downstream application using the data, in order to optimize the quality control tool to produce the best data for a specific purpose. A number of quality control methods can be used to identify whether the observations provided by meteorological sensors are adequate for a particular application. These tend to have been designed for AWS operated by NMHS although several new methods have been developed over recent years to specifically handle data from PWS.
The WMO Manual on the Global Observing System [41] provides some guidelines on quality control checks to apply to observations from AWS. These can be used as a starting point for automatic quality control procedures applied to data from PWS. They can be summarized as: (1) plausible value check or range check (e.g., observation within physical or climatological limits); (2) time consistency check, sometimes also referred to as plausible rate of change or step change check (e.g., identify unrealistic spikes in the data); (3) persistence check (e.g., variation by a minimum expected amount over a certain period of time); (4) internal consistency check (e.g., meeting physical constraints between interdependent weather variables). The WMO guidelines do not include spatial or metadata checks. These checks are, however, highly important for data from PWS: (5) spatial check (e.g., consistent measurements across neighbors); and (6) metadata check (e.g., identify gross errors in metadata, such as misplaced stations).
Over recent years, several groups have designed quality control techniques for data from PWS. Main error sources include missing or incorrect metadata information, poor positioning of the equipment (e.g., indoors or close to walls), and poor manufacturing and maintenance of the equipment (e.g., lack of ventilation or poor shielding leading to radiation errors, which is exacerbated when exposed to direct sunlight or close to walls). In practice, the quality control techniques and procedures for PWS data have been developed with these main sources of errors in mind. In the remainder of the section we focus on the main checks for PWS data.

3.2. Metadata Check

The initial step for most quality control techniques includes metadata checks to identify stations with the same latitude and longitude, which can be indicative of duplicate records, but also often a sign that the owner of the weather station did not enter the location information in the metadata and therefore information has been set automatically based on the IP address of the wireless network. If two or more stations have the same location information then these stations are set as FALSE or NaN (i.e., not a number) [1,2,8,11]. In the event that these stations are suspected to be duplicates (rather than not having sufficiently accurate location information), then the record containing the most observations is kept, i.e., the record containing the most variables and/or the most consistent reporting frequency, [17]. For non-real-time applications, manual checks of the metadata can also be performed, as reported by [8], who used Google Earth to remove any stations listed in unusual or unrealistic locations (e.g., canal).

3.3. Time Consistency Check

The most commonly applied second step to quality control techniques for PWS data focus on the identification of degradation or poor quality of the reporting frequency of the data stream. Stations reporting at unreliable or inconsistent intervals are either discarded during this step [1,17], or in lesser cases interpolation between data points is applied [2]. Before performing quality control on Netatmo data at MET Norway the observations are interpolated to hourly data (as the data itself is sent more frequently and not necessarily on the hour). This is in order to only keep records that can provide robust daily or monthly means and/or filter out stations most likely to be affected by instrument or communication malfunction. The QC procedure described in [2] and [1] was also applied to hourly Netatmo data.
This step is particularly tricky to perform reliably for precipitation observations where faulty zeroes caused by physical obstruction in the rain gauge (e.g., leaves, insects), and periods of no precipitation provide similar time series. This step can be performed by comparing the gauge data and data from weather radars [12]. However, this is not without its own difficulties as weather radar data provide precipitation estimates over a volume of atmosphere several 10 s or 100 s of meters and sometimes kilometers above the ground. In de Vos et al., 2017 [27] we can find a study carried out over Amsterdam municipality in which the measurements of the Netatmo network are compared to a rainfall gauge-adjusted radar product. The results show that Netatmo measurements tend to underestimate rain, but the median of the stations resembles the reference radar quite well. These results motivated a subsequent research line, dedicated to design and implement quality control for PWS Netatmo observations. De Vos et al., 2019 [12] describe a QC for rainfall applying intra-station, inter-station and bias correction filters that mark time-series as unsuitable if the requirements of these filters are not met. This QC does not require additional data collections operationally, but the bias correction step requires the offline computation of this parameter.
At KNMI, PWS observations coming from different citizen weather networks have been used as reference data to estimate the daily local temperature variations. In Dirksen et al., 2020 [42], researchers apply different multivariate regression techniques to daily air temperature measurements coming from the official weather network. After the interpolated surfaces are obtained, error metrics at the location of the citizen weather stations are calculated to assess how good the regression methods were.

3.4. Spatial Check

Most of the novelty developed specifically for the quality control of PWS data concerns the spatial check step, focusing on removing outliers and systematic errors, which are more frequent and complex than for core AWS networks. This step is particularly designed to identify misuse, poor maintenance and/or poor positioning of the equipment, which can lead to outliers or systematic errors and biases that affect all the meteorological variables.
The most commonly used techniques are based on spatial checks between PWS stations, reference stations and/or climatology of neighboring stations. This is used to determine suitable thresholds for range and step change in the data. Measurements falling outside these thresholds will be identified as outliers and removed. Chapman et al., 2017 [30], for example, developed a night-time statistical method for temperature data using a threshold defined as three standard deviations from the mean of all stations within an urban area for removing data points. Additional spatial checks are, for example, incorporated in the QC procedures of TitanLib [14] and CrowdQC [15]. For example, the spatial consistency check compares each observation to what is expected for the region given the other observations in the area, if it is determined to be an outlier it is flagged. CrowdQC also, for example, calculates the Pearson correlation coefficient between a single station and the median of all stations within one month and flags stations with a correlation coefficient lower than a certain threshold. De Vos et al., 2017 [27] applies this outlier filter to rain-gauge data: inter-gauge correlations are calculated and if a gauge with low correlation with the other stations is found, the entire time series would be removed.
In Chen et al., 2021 [13], researchers developed a spatial quality control for wind speed observations consisting of two steps. Given a station under inspection, the proposed method will select neighboring stations that are geographically close and distributionally similar (i.e., Pearson correlation plus Earth’s mover distance (EMD)). After this step, they devise a second method called inverse EMD weighting (IEMDW) that ranks the selected stations giving additional weight to the ones that are statistically more similar, and calculating confidence intervals that determine whether or not an observation is spatially inconsistent. Since wind might become obstructed by natural or human-made features, this approach minimizes the chances of selecting neighboring stations that are positioned in enclosed or partially obstructed locations.
Without enough surrounding stations the assessment of observations at a certain location is more difficult. This issue makes it hard to use a sparse network of lower quality stations. As a result, Nipen et al., 2020 [10] performed an ‘isolation test’ which removed stations that did not have enough neighboring stations within a certain radius and elevation. To avoid overly dense regions and maintain an evenly distributed PWS network, Clark et al., 2018 [17] applied a QC filter, which compared stations within a small radius of each other. The station with the fewest number of measured parameters or lowest data availability was removed.
As mentioned before, the challenge with the quality control technique is to minimize the number of genuine values being flagged as erroneous whilst capturing as much incorrect data as possible, so careful adjustment must be applied to setting the threshold depending on the requirement of the downstream application. A cost function can be used in order to optimize the spatial QC method [43].

3.5. Bias Correction

While the checks mentioned above flag erroneous data points and do not alter the data, some studies also discuss bias correction methods for PWS measurements. They mainly comprise precipitation and wind data. However, bias correction methods also exist for temperature measurements.
Droste et al., 2020 [8] point out that the performance of the Netatmo wind speed sensors appear to underperform at low wind speeds. In addition, wind speed measurements are affected by periods of rain or high humidity, since the device is not entirely water tight and thus moisture can collect inside. They therefore remove measurements with an hourly mean wind speed equal or lower than 1 km h−1 and measurements taken at periods of rain or high humidity. To account for the fact that the Netatmo stations tend to underestimate wind speed, Droste et al., 2020 [8] correct for the systematic bias using a linear regression model. Chen et al., 2021 [13] adjust systematic biases in wind speed measurements using quantile mapping.
Since PWS also tend to underestimate rainfall, de Vos et al., 2019 [12] apply a bias correction factor to the precipitation data.
Mandement and Caumont, 2020 [11] apply a gridding method to temperature, relative humidity, mean sea level pressure and surface pressure. This method compares PWS data with the nearest reference stations for each grid point, based on closest distance for relative humidity and mean sea level pressure, and closest altitude for temperature and pressure. The PWS data is corrected by removing the median of the errors between the reference station data and the raw PSW data.
The updated CrowdQC+ package now also contains a temporal correction of temperature data to address sensor-response time issues [16], and TitanLib as well has a function to reduce the time lag in temperature measurements.
Instead of removing measurements that are affected by solar radiation, as done, e.g., by Meier et al., 2017 [1] and Feichtinger et al., 2020 [33], Cornes et al., 2020 [3] presented a method to correct for radiation biases. They used generalized additive mixed modelling (GAMM) to adjust the temperature measurements affected by shortwave radiation bias. The study was carried out for WOW stations in the Netherlands.
Beele et al., 2022 [44] also presented a QC and correction method for air temperature data from stations in Leuven, Belgium. They paid special attention to the correction method, which uses random forest to predict the temperature bias, to reduce the number of rejected data points.

3.6. Available Quality Control Tools

Meier et al., 2017 [1] devised a scheme consisting of four steps: the first step is used to identify misuse or indoor use of PWS by comparing the monthly averages and standard deviation of daily minimum temperature reported by PWS and reference AWS stations from the core national network. Indoor PWS would be expected to report lower standard deviation and constant average minimum temperature. A second step flags stations as TRUE or FALSE depending on whether they fall outside ranges defined using reference stations. The third step focuses on identifying systematic radiative errors due to solar radiation: using daytime data when global radiation at a reference station is above a set threshold, Meier et al., 2017 [1] perform a regression analysis between the global radiation and the difference between the temperature reported by PWS and the reference station. A positive correlation indicates systematic radiation errors and the station is flagged as FALSE. For stations showing no evidence of positive correlation but exhibiting high positive deviations for individual values then these individual daytime values are flagged as FALSE. The final step is designed to filter out remaining outliers by computing the spatial average and standard deviation of PWS temperature, and removing data points that fall outside three times the standard deviation.
Napoly et al., 2018 [2] developed a technique that does not require the use of reference stations (CrowdQC). It simply uses PWS data over a selected urban area (Berlin in Germany, and Paris and Toulouse in France). Napoly’s technique introduces a height correction to account for the natural vertical variation of temperature linked to variation of station altitude. To ensure consistency the elevation data is provided by the Shuttle Radar Topography Mission rather than the information provided with the PWS metadata. Once this correction is applied, outliers are identified using a method to estimate expected value and distribution of values. This method is also able to filter out some indoor stations or radiative errors in non-shaded areas. Indoor stations are also targeted by adding a check between the individual station and the median of all PWS over a month period. If the correlation is below a set threshold then the station is rejected.
Feichtinger et al., 2020 [33] applied the Napoly et al., 2018 [2] technique, as well as the systematic radiation error identification from Meier et al., 2017 [1], to Vienna in Austria showing good evidence that PWS data quality controlled using Napoly’s combined with Meier’s techniques can provide a good quality data source for the urban environment. The further developed CrowdQC+ package now also addresses radiative errors, and includes a temporal correction method to account for sensor response time issues [16].
While the above mentioned QC methods focus on urban areas, MetNorway developed a QC procedure (TitanLib, [14], https://github.com/metno/TITAN, last access on 24 October 2022) that is currently applied to all stations in Norway [10]. It consists of several spatial quality control methods to improve the PWS data set. Nipen et al., 2020 [10] identified that if left unfiltered, noisy PWS data can cause problems for operational weather prediction, which requires robust and reliable input data. They first performed a ‘buddy check’, which compared measurements from stations within a specified radius and elevation of each other. This filter excluded a station from the data set if it deviated far from the neighborhood average and resultantly removed unrealistic fine scale variability in the observations. Following the ‘buddy check,’ Nipen et al., 2020 [10] ran a spatial consistency test (SCT) which predicted expected observation value and error variance based on other observations nearby. The SCT is a more rigorous spatial test, where the spatial density of the PWS network had an influence on the threshold definition. It was more restrictive in data-dense regions than data-sparse regions.
Another openly available QC-procedure is NetAtmoQC (https://source.coderefinery.org/iOBS/wp2/task-2-3/netatmoqc, last access on 24 October 2022), which was developed at SMHI and still is under development. The code developed and used by [12], for the quality control of rainfall data, was also made available on github (https://github.com/LottedeVos/PWSQC, last access on 24 October 2022).
It has to be pointed out, that all QC procedures mentioned above, NetAtmoQC, TitanLib and CrowdQC, were developed for Netatmo data. However, CrowdQC and TitanLib can deal with different data sources as well. In addition, in TitanLib, the users are also able to specify the level of trust for each data source [10].
Table 1 provides an overview of available tools and selected references.

4. Conclusions

In recent years, the number of amateur PWS have increased as they have become more affordable and more easily accessible for the weather interested public. Users have the possibility of sharing their observations by uploading them to platforms where NMHS can access them via API. Several European NMHS are currently using PWS operationally or conducting research with data from PWS. We can conclude that PWS have the potential to have a positive impact in meteorology and climate sciences (e.g., operational weather forecasting, post-processing, nowcasting) and provide the opportunity to create other high-resolution meteorological applications. The caveat with PWS is that users need to analyze many stations together, and one isolated station does not hold much value for NMHS.
Research activities have shown that precipitation data from PWS provide useful information regarding rainfall amount and distribution and could be used for urban rainfall monitoring. Observations from PWS rain gauges are valuable to capture the high spatial-temporal variability of rainfall. Several studies investigated the potential of personal weather stations for urban and climate applications, focusing on temperature. In cities, where most of the personal weather stations are located and where climate change impacts are amplified due to the urban heat island effect and high population density, using data from personal weather stations can be highly beneficial. Several institutes are also investigating the benefit of PWS for agricultural applications e.g., modelling micro-climate at very fine scale.
While the results of the studies and activities are promising, they all emphasize that good quality control is essential before the data can be used and that the data needs to be interpreted carefully. Due to the amateur nature of crowdsourced data, there is a lack of requirements to meet official international (quality) standards. Measurements performed by PWS include far more uncertainty than measurements provided by reference AWS stations from NMHS core networks. These are caused by unknown environmental conditions around the equipment. Erroneous values can impair rather than improve forecasts and warnings. Several quality control procedures were developed to address these issues. They comprise quality control checks routinely carried out for conventional stations, as well as e.g., meta-data and spatial checks, which were specifically developed for crowdsourced data. The latter make use of the vast amount of data available to keep valuable observations. The main challenge is to identify and remove erroneous data without removing ‘good’ measurements that capture real extreme phenomena. Currently some EUMETNET members are performing R&D studies to investigate current QC methods and further optimize them. These projects will be completed at the end of 2022 and hopefully provide further guidelines regarding the use and QC of PWS data. How to best acquire and store the wealth of data is another issue many institutions have to tackle. Further aspects on how to incorporate third-party data into operational workflows are addressed by Garcia-Marti et al., 2022 [9].
The community is well aware of the potential the data has and is thankful to station owners that share their measurements. To enable the best use of the data, station owners are encouraged to follow the guidelines when placing the station, and to provide a precise geolocation of the measurement station as well as information about the measurement devices used. This information can be made available on either the PWS provider’s or the open-source platform.

Author Contributions

Writing—original draft preparation, C.H., I.G.-M., J.S., F.E., A.-L.B., L.O., E.S., E.L., M.S. and F.Z.; writing—review and editing, C.H., I.G.-M., J.S., F.E., A.-L.B., L.O., E.S., E.L., M.S. and F.Z.; visualization, J.S.; All authors contributed to the original draft preparation and reviewed and edited the manuscript, with J.S. and F.E. taking the lead at the beginning, C.H., I.G.-M., L.O. taking the lead at the end. All authors have read and agreed to the published version of the manuscript.

Funding

This research received no external funding.

Data Availability Statement

Not applicable.

Acknowledgments

We thank all weather enthusiasts that share their data online and make this work possible! We thank all employees from the NMHS that contributed to this paper, by providing their input e.g., in form of discussions and/or review of the manuscript.

Conflicts of Interest

The authors declare no conflict of interest.

References

  1. Meier, F.; Fenner, D.; Grassmann, T.; Otto, M.; Scherer, D. Crowdsourcing air temperature from citizen weather stations for urban climate research. Urban Clim. 2017, 19, 170–191. [Google Scholar] [CrossRef]
  2. Napoly, A.; Grassmann, T.; Meier, F.; Fenner, D. Development and Application of a Statistically-Based Quality Control for Crowdsourced Air Temperature Data. Front. Earth Sci. 2018, 6, 118. [Google Scholar] [CrossRef] [Green Version]
  3. Cornes, R.C.; Dirksen, M.; Sluiter, R. Correcting citizen-science air temperature measurements across the Netherlands for short wave radiation bias. Meteorol. Appl. 2020, 27, e1814. [Google Scholar] [CrossRef] [Green Version]
  4. World Meteorological Organization. Guide to Instruments and Methods of Observation (WMO-No.8)—Observing Systems; WMO: Geneva, Switzerland, 2018; Volume III, ISBN 978-92-63-10008-5. [Google Scholar]
  5. Bell, S.; Cornford, D.; Bastin, L. The state of automated amateur weather observations. Weather 2013, 68, 36–41. [Google Scholar] [CrossRef]
  6. Bell, S.; Cornford, D.; Bastin, L. How good are citizen weather stations? Addressing a biased opinion. Weather 2015, 70, 75–84. [Google Scholar] [CrossRef] [Green Version]
  7. De Vos, L.W.; Droste, A.M.; Zander, M.J.; Overeem, A.; Leijnse, H.; Heusinkveld, B.G.; Steeneveld, G.J.; Uijlenhoet, R. Hydrometeorological Monitoring Using Opportunistic Sensing Networks in the Amsterdam Metropolitan Area. Bull. Am. Meteorol. Soc. 2020, 101, E167–E185. [Google Scholar] [CrossRef]
  8. Droste, A.M.; Heusinkveld, B.G.; Fenner, D.; Steeneveld, G. Assessing the potential and application of crowdsourced urban wind data. Q. J. R. Meteorol. Soc. 2020, 146, 2671–2688. [Google Scholar] [CrossRef]
  9. Garcia-Marti, I.; Overeem, A.; Noteboom, J.W.; de Vos, L.; de Haij, M.; Whan, K. From proof-of-concept to proof-of-value: Approaching third-party data to operational workflows of national meteorological services. Int. J. Climatol. 2022, 1–18. [Google Scholar] [CrossRef]
  10. Nipen, T.N.; Seierstad, I.A.; Lussana, C.; Kristiansen, J.; Hov, Ø. Adopting Citizen Observations in Operational Weather Prediction. Bull. Am. Meteorol. Soc. 2020, 101, E43–E57. [Google Scholar] [CrossRef]
  11. Mandement, M.; Caumont, O. Contribution of personal weather stations to the observation of deep-convection features near the ground. Nat. Hazards Earth Syst. Sci. 2020, 20, 299–322. [Google Scholar] [CrossRef]
  12. De Vos, L.W.; Leijnse, H.; Overeem, A.; Uijlenhoet, R. Quality Control for Crowdsourced Personal Weather Stations to Enable Operational Rainfall Monitoring. Geophys. Res. Lett. 2019, 46, 8820–8829. [Google Scholar] [CrossRef] [Green Version]
  13. Chen, J.; Saunders, K.; Whan, K. Quality control and bias adjustment of crowdsourced wind speed observations. Q. J. R. Meteorol. Soc. 2021, 147, 3647–3664. [Google Scholar] [CrossRef]
  14. Båserud, L.; Lussana, C.; Nipen, T.N.; Seierstad, I.A.; Oram, L.; Aspelien, T. TITAN automatic spatial quality control of meteorological in-situ observations. Adv. Sci. Res. 2020, 17, 153–163. [Google Scholar] [CrossRef]
  15. Grassmann, T.; Napoly, A.; Meier, F.; Fenner, D. Quality Control for Crowdsourced Aata from CWS. Technische Universität Berlin: Berlin, Germany, 2018. [Google Scholar] [CrossRef]
  16. Fenner, D.; Bechtel, B.; Demuzere, M.; Kittner, J.; Meier, F. CrowdQC+—A Quality-Control for Crowdsourced Air-Temperature Observations Enabling World-Wide Urban Climate Applications. Front. Environ. Sci. 2021, 9. [Google Scholar] [CrossRef]
  17. Clark, M.R.; Webb, J.D.C.; Kirk, P.J. Fine-scale analysis of a severe hailstorm using crowd-sourced and conventional observations. Meteorol. Appl. 2018, 25, 472–492. [Google Scholar] [CrossRef]
  18. Kirk, P.J.; Clark, M.R.; Creed, E. Weather Observations Website. Weather 2021, 76, 47–49. [Google Scholar] [CrossRef]
  19. Sgoff, C.; Acevedo, W.; Paschalidi, Z.; Ulbrich, S.; Bauernschubert, E.; Kratzsch, T.; Potthast, R. Assimilation of crowd-sourced surface observations over Germany in a regional weather prediction system. Q. J. R. Meteorol. Soc. 2022, 148, 1752–1767. [Google Scholar] [CrossRef]
  20. Clark, M. An automated filtering and bias-correction procedure for WOW home AWS data. MetOffice Sp. Appl. Nowcast. Tech. Memo 2022, 38. [Google Scholar]
  21. Sallis, P.; Shanamuganathan, S.; Ghobakhlou, A. Wireless Sensors in the Vineyard. In Proceedings of the 11th International Conference on Applications of Electrical and Computer Engineering, Athens, Greece, 7–9 March 2012; pp. 83–89. [Google Scholar]
  22. Coggan, M. Vineyard weather monitoring: Stand-alone systems that measure, record, and display weather data--and often more. Vineyard Winer. Manag. 2002, 28, 61–65. [Google Scholar]
  23. Marcu, I.; Voicu, C.; Drăgulinescu, A.M.C.; Fratu, O.; Suciu, G.; Balaceanu, C.; Andronache, M.M. Overview of IoT basic platforms for precision agriculture. Lect. Notes Inst. Comput. Sci. Soc. Telecommun. Eng. LNICST 2019, 283, 124–137. [Google Scholar] [CrossRef]
  24. Beaulant, A.-L.; Miahle, P.; Brunier, L.; Deudon, O.; Brun, F. Quality controls applied to opportunistic data for agriculture. In Proceedings of the WMO TECO-2022, Paris, France, 10–13 October 2022. [Google Scholar]
  25. METEOPREC Project. Available online: https://numerique.acta.asso.fr/meteoprec/ (accessed on 26 November 2022).
  26. Graf, M.; Hachem, A.E.; Eisele, M.; Seidel, J.; Chwala, C.; Kunstmann, H.; Bárdossy, A. Combined rainfall estimates from personal weather station and commercial microwave link data in Germany. EGU Gen. Assem. 2021. [Google Scholar] [CrossRef]
  27. De Vos, L.; Leijnse, H.; Overeem, A.; Uijlenhoet, R. The potential of urban rainfall monitoring with crowdsourced automatic weather stations in Amsterdam. Hydrol. Earth Syst. Sci. 2017, 21, 765–777. [Google Scholar] [CrossRef] [Green Version]
  28. EEA; Ivits, E.; Tóth, G.; Gregor, M.; Milego Agràs, R.; Fons Esteve, J.; Marín, A.; Schröder, C.; Mancosu, E. Land Take and Land Degradation in Functional Urban Areas; Publications Office of the European Union: Luxembourg, 2022. [Google Scholar]
  29. EEA. Urban Sprawl in Europe: Joint EEA-FOEN Report; Publications Office of the European Union: Luxembourg, 2016. [Google Scholar]
  30. Chapman, L.; Bell, C.; Bell, S. Can the crowdsourcing data paradigm take atmospheric science to a new level? A case study of the urban heat island of London quantified using Netatmo weather stations. Int. J. Climatol. 2017, 37, 3597–3605. [Google Scholar] [CrossRef]
  31. Fenner, D.; Meier, F.; Bechtel, B.; Otto, M.; Scherer, D. Intra and inter ‘local climate zone’ variability of air temperature as observed by crowdsourced citizen weather stations in Berlin, Germany. Meteorol. Z. 2017, 26, 525–547. [Google Scholar] [CrossRef]
  32. Hammerberg, K.; Brousse, O.; Martilli, A.; Mahdavi, A. Implications of employing detailed urban canopy parameters for mesoscale climate modelling: A comparison between WUDAPT and GIS databases over Vienna, Austria. Int. J. Climatol. 2018, 38, e1241–e1257. [Google Scholar] [CrossRef] [Green Version]
  33. Feichtinger, M.; de Wit, R.; Goldenits, G.; Kolejka, T.; Hollósi, B.; Žuvela-Aloise, M.; Feigl, J. Case-study of neighborhood-scale summertime urban air temperature for the City of Vienna using crowd-sourced data. Urban Clim. 2020, 32, 100597. [Google Scholar] [CrossRef]
  34. Gubler, M.; Christen, A.; Remund, J.; Brönnimann, S. Evaluation and application of a low-cost measurement network to study intra-urban temperature differences during summer 2018 in Bern, Switzerland. Urban Clim. 2021, 37, 100817. [Google Scholar] [CrossRef]
  35. Brousse, O.; Simpson, C.; Walker, N.; Fenner, D.; Meier, F.; Taylor, J.; Heaviside, C. Evidence of horizontal urban heat advection in London using six years of data from a citizen weather station network. Environ. Res. Lett. 2022, 17, 44041. [Google Scholar] [CrossRef]
  36. Venter, Z.S.; Brousse, O.; Esau, I.; Meier, F. Hyperlocal mapping of urban air temperature using remote sensing and crowdsourced weather data. Remote Sens. Environ. 2020, 242, 111791. [Google Scholar] [CrossRef]
  37. Zumwald, M.; Knüsel, B.; Bresch, D.N.; Knutti, R. Mapping urban temperature using crowd-sensing data and machine learning. Urban Clim. 2021, 35, 100739. [Google Scholar] [CrossRef]
  38. Golroudbary, V.R.; Zeng, Y.; Mannaerts, C.M.; Su, Z. Urban impacts on air temperature and precipitation over The Netherlands. Clim. Res. 2018, 75, 95–109. [Google Scholar] [CrossRef]
  39. Nyberg, L.; Mobini, S.; Karagiorgos, K.; Olsson, J.; Larsson, R.; Petersson, L.; Van de Beek, R.; Gustafsson, K.; Grahn, T. New data sources for cloudburst risk assessment and management. Vatten Tidskr. Vattenvård/J. Water Manag. Res. 2022, 78, 77–85. [Google Scholar]
  40. Jenkins, G. A comparison between two types of widely used weather stations. Weather 2014, 69, 105–110. [Google Scholar] [CrossRef]
  41. WMO. Manual on the WMO Integrated Global Observing System (WMO-No.1160)-Annex VIII; WMO: Geneva, Switzerland, 2021; ISBN 9789263111609. [Google Scholar]
  42. Dirksen, M.; Knap, W.H.; Steeneveld, G.-J.; Holtslag, A.A.M.; Tank, A.M.G.K. Downscaling daily air-temperature measurements in the Netherlands. Theor. Appl. Climatol. 2020, 142, 751–767. [Google Scholar] [CrossRef]
  43. Alerskans, E.; Lussana, C.; Nipen, T.N.; Seierstad, I.A. Optimizing spatial quality control for a dense network of meteorological stations. J. Atmos. Ocean. Technol. 2022, 39, 973–984. [Google Scholar] [CrossRef]
  44. Beele, E.; Reyniers, M.; Aerts, R.; Somers, B. Quality control and correction method for air temperature data from a citizen science weather station network in Leuven, Belgium. Earth Syst. Sci. Data. 2022, 14, 4681–4717. [Google Scholar] [CrossRef]
Figure 1. PWS activity (including Operational and Research) within the EUMETNET community by data providers. Data providers are active in more countries than highlighted here.
Climate 10 00192 g001
Table 1. Overview of selected references and available QC-tools for PWS data.
VariableReferences *1Openly Available QC ToolsLink to Tool *2/References Regarding QC Method
Temperature[1,2,3,6,7,10,11,16,19,30,33,35,36,37,38]CrowdQChttps://depositonce.tu-berlin.de/handle/11303/7520.3
[2,15]
CrowdQC+https://github.com/dafenner/CrowdQCplus
[16]
TitanLibhttps://github.com/metno/TITAN[14]
NetAtmoQChttps://source.coderefinery.org/iOBS/wp2/task-2-3/netatmoqc
Precipitation[6,7,11,12,26,27,38]PWSQChttps://github.com/LottedeVos/PWSQC
[12]
Wind[7,8,13,17]
Humidity[6,7,11,19]
Pressure[11,12,17]
*1 listed in ascending order by publication year. *2 last access on 24 October 2022.
Publisher’s Note: MDPI stays neutral with regard to jurisdictional claims in published maps and institutional affiliations.

