1. Introduction
The current lifestyle of society demonstrates an increasing dependence on energy and, in the current model of power generation systems, a substantial amount of electricity still depends on non-renewable high-carbon sources [
1]. In recent years, however,
Renewable Energy Sources (RESs) have been integrated into the generation, and distribution matrices, where
Photovoltaic (PV),
wind, and
small hydroelectric plants, for example, have shown to be sustainable alternatives [
2]. Furthermore, in the last few years, studies have been adding innovations for different segments of energy systems, such as generation, transmission, and distribution of energy [
3,
4,
5,
6]. The need to make these systems more reliable, secure, and efficient has led different areas such as computing, telecommunications, automation, and electrical engineering to develop new solutions [
7,
8,
9,
10,
11]. The new applications with these areas in electrical infrastructure gave rise to intelligent energy systems, called smart grids [
12].
Over several decades, several pioneering research studies on energy optimization problems using intelligent-based methodology were proposed. For instance, Ref. [
13] proposes an ant colony optimization algorithm for a minimization problem of energy not supplied during the restoration process. The proposed algorithm is based on a hypercube framework searching for an optimal switching sequence, and the solution provides an effective service restoration strategy that improves system reliability.
A similar approach can also be found in [
14], who used an ACO algorithm to minimize the number of switching operations on a network. Ref. [
15] used reinforcement learning for optimal reconfiguration that involves selection of the best set of branches to be opened, such that the resulting radial distribution system has the desired performance.
In Ref. [
16]), a swarm-based methodology is designed to locate and isolate faults and then decide and implement the switching operations to restore the out-of-service loads.
In Ref. [
17], an expert system is developed by utilizing its fast reasoning mechanism and object-oriented features. The feeder component and configuration data are organized in a hierarchy way using the object-oriented programming paradigm. These are just some of the dedicated works in building techniques for energy problems in smart grids.
In the power distribution segment, smart grids include the use of distributed systems, artificial intelligence, and power systems as a way of automating the process of recovering a distribution network in the event of abnormalities (e.g., failures in network devices, excess flow, damages caused by nature or vandalism). These events can cause system failures that lead to blackouts or power supply with lower quality than expected [
12,
18]. One of the fundamental aspects of a smart grid power distribution network is the system’s ability to identify and recover the network in case of failure. This ability characterizes a self-healing system [
19].
Several works have proposed self-healing mechanisms for recovering electrical networks such as [
20,
21,
22,
23], just to name a few. Due to the multidisciplinary domain of the problem, some approaches require human specialists from the subareas of computing (distributed systems, programming, and artificial intelligence), telecommunications (transmission and reception of signals), and electrical engineering (energy and electrical systems). This multidisciplinarity makes the proposed solutions highly complex for smart grids due to the diversity of possible approaches to be applied and the sort of problems to handle. For instance, the Switch Allocation Problem (SAP) determines which location, type, and quantity of switches should be installed in a distribution network to increase energy efficiency. For the feasibility of implementing smart electrical grids, the location of the switches is essential, as it increases the possibility of switching on the grid in a future restoration strategy or load reconfiguration. When a grid is optimized for switching plans, it can quickly feed zones without supply or isolate zones with voltage and current disturbances.
Technically, the SAP can be seen as a combinatorial optimization problem [
24,
25,
26]. The approach proposed in [
25] deals with a multi-objective SAP model, considering the Average Duration of Interruption (SAIDI) and Average Duration of Failure (SAIFI) indexes of the system in two sectorized networks, addressing not only restoration reliability constraints but also system initial operating point optimization. Other studies address specific problems that help to add more quality to smart grids. For example, Ref. [
27] proposes the study of the failure of switches in a sectorized network, usually disregarded by other authors. The optimization in this work is mono-objective, considering the costs of switches and quality indexes SAIDI and SAIFI per consumer.
The approach proposed in this paper is based on the single-objective SAP modeled by [
24]. The objective function of our approach are optimizing the network costs by reliability indexes per sector, equivalent interruption duration per consumer unit (EIDCU), and non-distributed energy (END). We use the
Backward∖
Forward Sweep method, proposed by [
28], to calculate the power flow. Then, we propose a metaheuristic solution Gbest guided Artificial Bee Colony (GABC), raised by [
29], and simulate the problem using two networks adapted from the literature [
25].
In the following,
Section 2 presents the related concepts;
Section 3 exposes the proposed resolution, followed by applications in
Section 4; and conclusions are presented in
Section 5.
2. Problem Formulation
Our proposal is based on two main concepts:
- (i)
The network must be conceived as a radial distribution network, i.e., a customer, named load demand, must be redundantly fed by more than one substation (ST) of load. The radial topology provides a way to reconfigure the network by opening/closing some switches and reestablishing the power flow.
- (ii)
The network is sectorized in such a way that the normally closed (NC) and normally open (NO) switches segment the clients into separated groups.
2.1. Network Reliability
For the network reliability evaluation, we need to establish some reliability indexes that allow for measuring the efficiency of the network reconfiguration when our methodology is applied.
In this work, we adopted the formulation proposed in [
24,
30]. Such a formulation establishes two indexes for network evaluation:
- (i)
Equivalent interruption duration per consumer unit (EIDCU);
- (ii)
The energy not supplied (END).
To calculate EIDCU and END, we first need to calculate the energy load L, Equation (1), the failure rate , Equation (2), and the supply time per section , Equation (3).
Let us consider a network as graph , i.e., an ordered pair . Let be the set of vertices modeling the load demands L, and let be the set of edges modeling the switches. Each part of , delimited by switches, constitutes a sector of S, where is normally represented as a failure section, and is the target sector for calculations. Each section has its energy load L, failure rate , and supply time , defined as follows:
- ○
Energy Load: for the
part
- ○
In Equation (2), is the subset of branches present in the section , and is the failure rate of each of the branches . Therefore, the failure rate of a given section derives from the sum of the failure rates of all its branches, i.e., the average number of failures per year.
- ○
In Equation (3), models the failure rate in the section ; is the expected duration of outage in section , caused by faults in section . Determining the restore time depends on the section classification for each fault restoration.
- ○
System Average Interruption Duration Index (EIDCU)
In Equation (4), represents the total duration of interruptions for each interrupted section , considering faults in the section and all other sectors causing power outages in the sector ; is the number of affected consumers; and is the number of consumers on the network. EIDCU expresses the average power outage duration on the grid during one year.
- ○
Energy Not Distributed (END)
In Equation (5), is the total duration of outages for each sector and is the annual average load of the section .
2.2. Restoration Time
To solve the Switch Allocation Problem (SAP), we first have to address the Load Restoration in Distribution Systems Problem (PRES). When this problem is solved, the expected interruption duration per sector is obtained.
The network is segmented into sections, the fault
occurs in one section, affecting the sector
in an outage time
. Basically, four situations occur:
- ○
Case 1: when the section is located downstream from the fault section , and there is a protection device between them. The sector is considered not affected.
- ○
Case 2: when the section is located downstream from the fault sector and there is a sectionalizing switch between them. Opening the switch implies . The section is considered Resettable.
- ○
Case 3: when section is located upstream from the fault section , and there is sectionalizing switch between them, as well as a tie switch somewhere upstream from . Opening the NC key implies and closing the NO implies . The sector is considered Transferable.
- ○
Case 4: when the sector is located in sector () or upstream from the fault section , and there are no switches that can provide load transfer. In such a case, the energy restoration is only possible after the sector has been repaired, implying . The sector and section are considered Permanently Interrupted.
2.3. Power Flow in Distribution Systems
To establish one of the restrictions in PRES, it is necessary to determine the permanent conditions of the system, i.e., if the grid power is within what is supported by the substation and if the load demands are not overloading the grid at some point. All load variables are calculated for an operating point every time a new solution is considered to ensure these conditions. The method
Backward∖Forward Sweep, proposed by [
28], is used, an iterative algorithm belonging to the numerical algorithms, which aims to approximate an exact solution by repeated calculations accepting a margin of error, recommended for weakly meshed and radial networks, which present good general performance. The power flow employs a series of calculations to determine the current, voltage, and losses using the data of resistance, reactance, reactive power, and active power. Details of the implementation of this method can be found in [
28].
2.4. Mathematical Formulation of the Switch Allocation Problem
The SAP aims to determine the number and the location of the switches to benefit the electrical system by qualifying the system reliability indexes and establishing which ones reduce power losses in the network.
The switch allocation considers the whole network in an operational state with no failures, which benefits the entire network. The SAP is NP-Hard [
31] and a multi-criteria problem [
24,
25].
This work is based in the mathematical formulation of SAP, presented in [
24], whose particularity is its time estimate in PRES by considering actual prices applied in the market of electricity distribution. The model also provides conditions to be applied in large-scale networks.
Let us consider a graph
, as an ordered pair
, where
represents a set of vertices, and
is a disjoint set of edges. Each edge of
is an unordered pair of vertices, such that the root of the graph is in a ST;
represents the selection of a vertex modeling a location of a customer i.e., a location of energy demand. Each
corresponds to the selection of a feasible location for switch allocation.
Table 1 shows the notation used in the following mathematical formulation.
The decision variables,
and
, represent the types and locations for sectionalizing switches (NC) and tie switches (NO). These variables are defined as:
The
set represents the available switches. Next, using the definitions presented in
Table 1, the mathematical model for solving the adopted SAP is presented:
Equation (9) represents the objective function to be optimized, with one index being quality and the other cost. Equation (10) is a constraint of the maximum (10) limit for each feeder z. Equation (11) is a binary constraint of the allocation of switches to each edge of the network. Equation (12) is an electrical limitation of the switches where is the maximum electrical flow. Equation (13) is a binary constraint on the keys, and Equation (14) is a positive electric flow constraint on the network.
We use the metaheuristic approximate solving algorithm called Artificial Bee Colony (ABC), discussed as follows, to solve this mathematical model.
2.5. Artificial Bee Colony Metaheuristic
The
Artificial Bees Colony (ABC) [
32] is a metaheuristic that mimics the foraging behavior of a colony of bees. The method consists of conceptually splitting a colony of bees into three groups, named scout, maids, and spectators.
Compared with other swarm algorithms, such as PSO, Ant Colony Optimization, Genetic Algorithm, Simulated Annealing, Tabu Search, etc. [
33,
34], the ABC pre-divides the number of intelligent agents, respects a sequence of tasks generated by the bees, and limits the location performed by the maids in a relatively low value, explained in [
29], as well as being appropriate in problems with continuous search spaces, clustered and constrained search [
32,
35], the SAP characteristics.
3. Proposed Approach
Algorithm 1 shows the implementation of the proposed approach named GABC (Global Artificial Bee Colony Search). The best solution is initiated by a greedy method, passing through the drawing of neighborhood structures followed by the movement of the sectioning switches and elevation of the type of switches. It also has some mechanisms to avoid stagnation. In spectator bees, a draw between the five most elaborate neighborhood structures is made and passed on to each spectator. In addition, a neighborhood structure is incremented by iterating the best solution.
| Algorithm 1: GABC Pseudocode |
![Jsan 11 00077 i001]() |
GABC uses both a movement limit and a time limit . The symbolizes an unfeasible solution, which does not pass when checking its radiality, power flow, or the constraints of the feeders.
Random searches are called a total of times, or in multiple iterations of three by GABC, Algorithm 1.
4. Experimental Results
Before applying the proposed approach SAP directly to the problem, the power flow was compared with four simulated networks known in the literature: (i) the 10-bar network presented in [
36]; (ii) the 33 bars presented [
28]; (iii) the 34 bars presented in [
37]; and (iv) the 70 bar presented in [
38]. The tolerance error of 1 × 10
was allowed in these networks.
Table 2 shows the comparison between the results obtained by the proposed implementation with the results obtained by MATPOWER.
Results presented in
Table 3,
Table 4,
Table 5 and
Table 6 were obtained using an Intel i3 2.40 GHz personal computer with 4 GB of RAM and Windows 7 as the operating system. The algorithms were implemented in MATLAB and supported by the toolbox MATPOWER 7.0. To demonstrate the efficiency of the proposed approach, we use two networks available in [
25].
The parameters of the algorithm GABC, Algorithm 1, were set as a colony of 10 bees, 5 employers, and 5 onlookers, with a limit of 6 moves in local searches per iteration and a time limit of 60 s. The scout bees have a constant rate of 86.47%. The algorithm runs until a convergence rate of 10 iterations is achieved.
The electrical parameters used are: = 7.967 kV, = 1000 A, = 10 MVA. For the resistances, , and reactance of the open switches, minimum values of the reference network 157.54 × 10 pu and 0 pu were considered. For the closed switches, the values of 9658.97 × 10 pu and 14,179.23 × 10 pu were taken. The demand powers and were multiplied ten times to increase the currents and adapt to the model used, allowing the optimizer to choose more types of keys.
The ratio between the cost of undistributed power and the cost of switches is 1000:1.
Table 3 shows the relationship between the EIDCU for the two feeders after
and
stipulated by the average EIDCU.
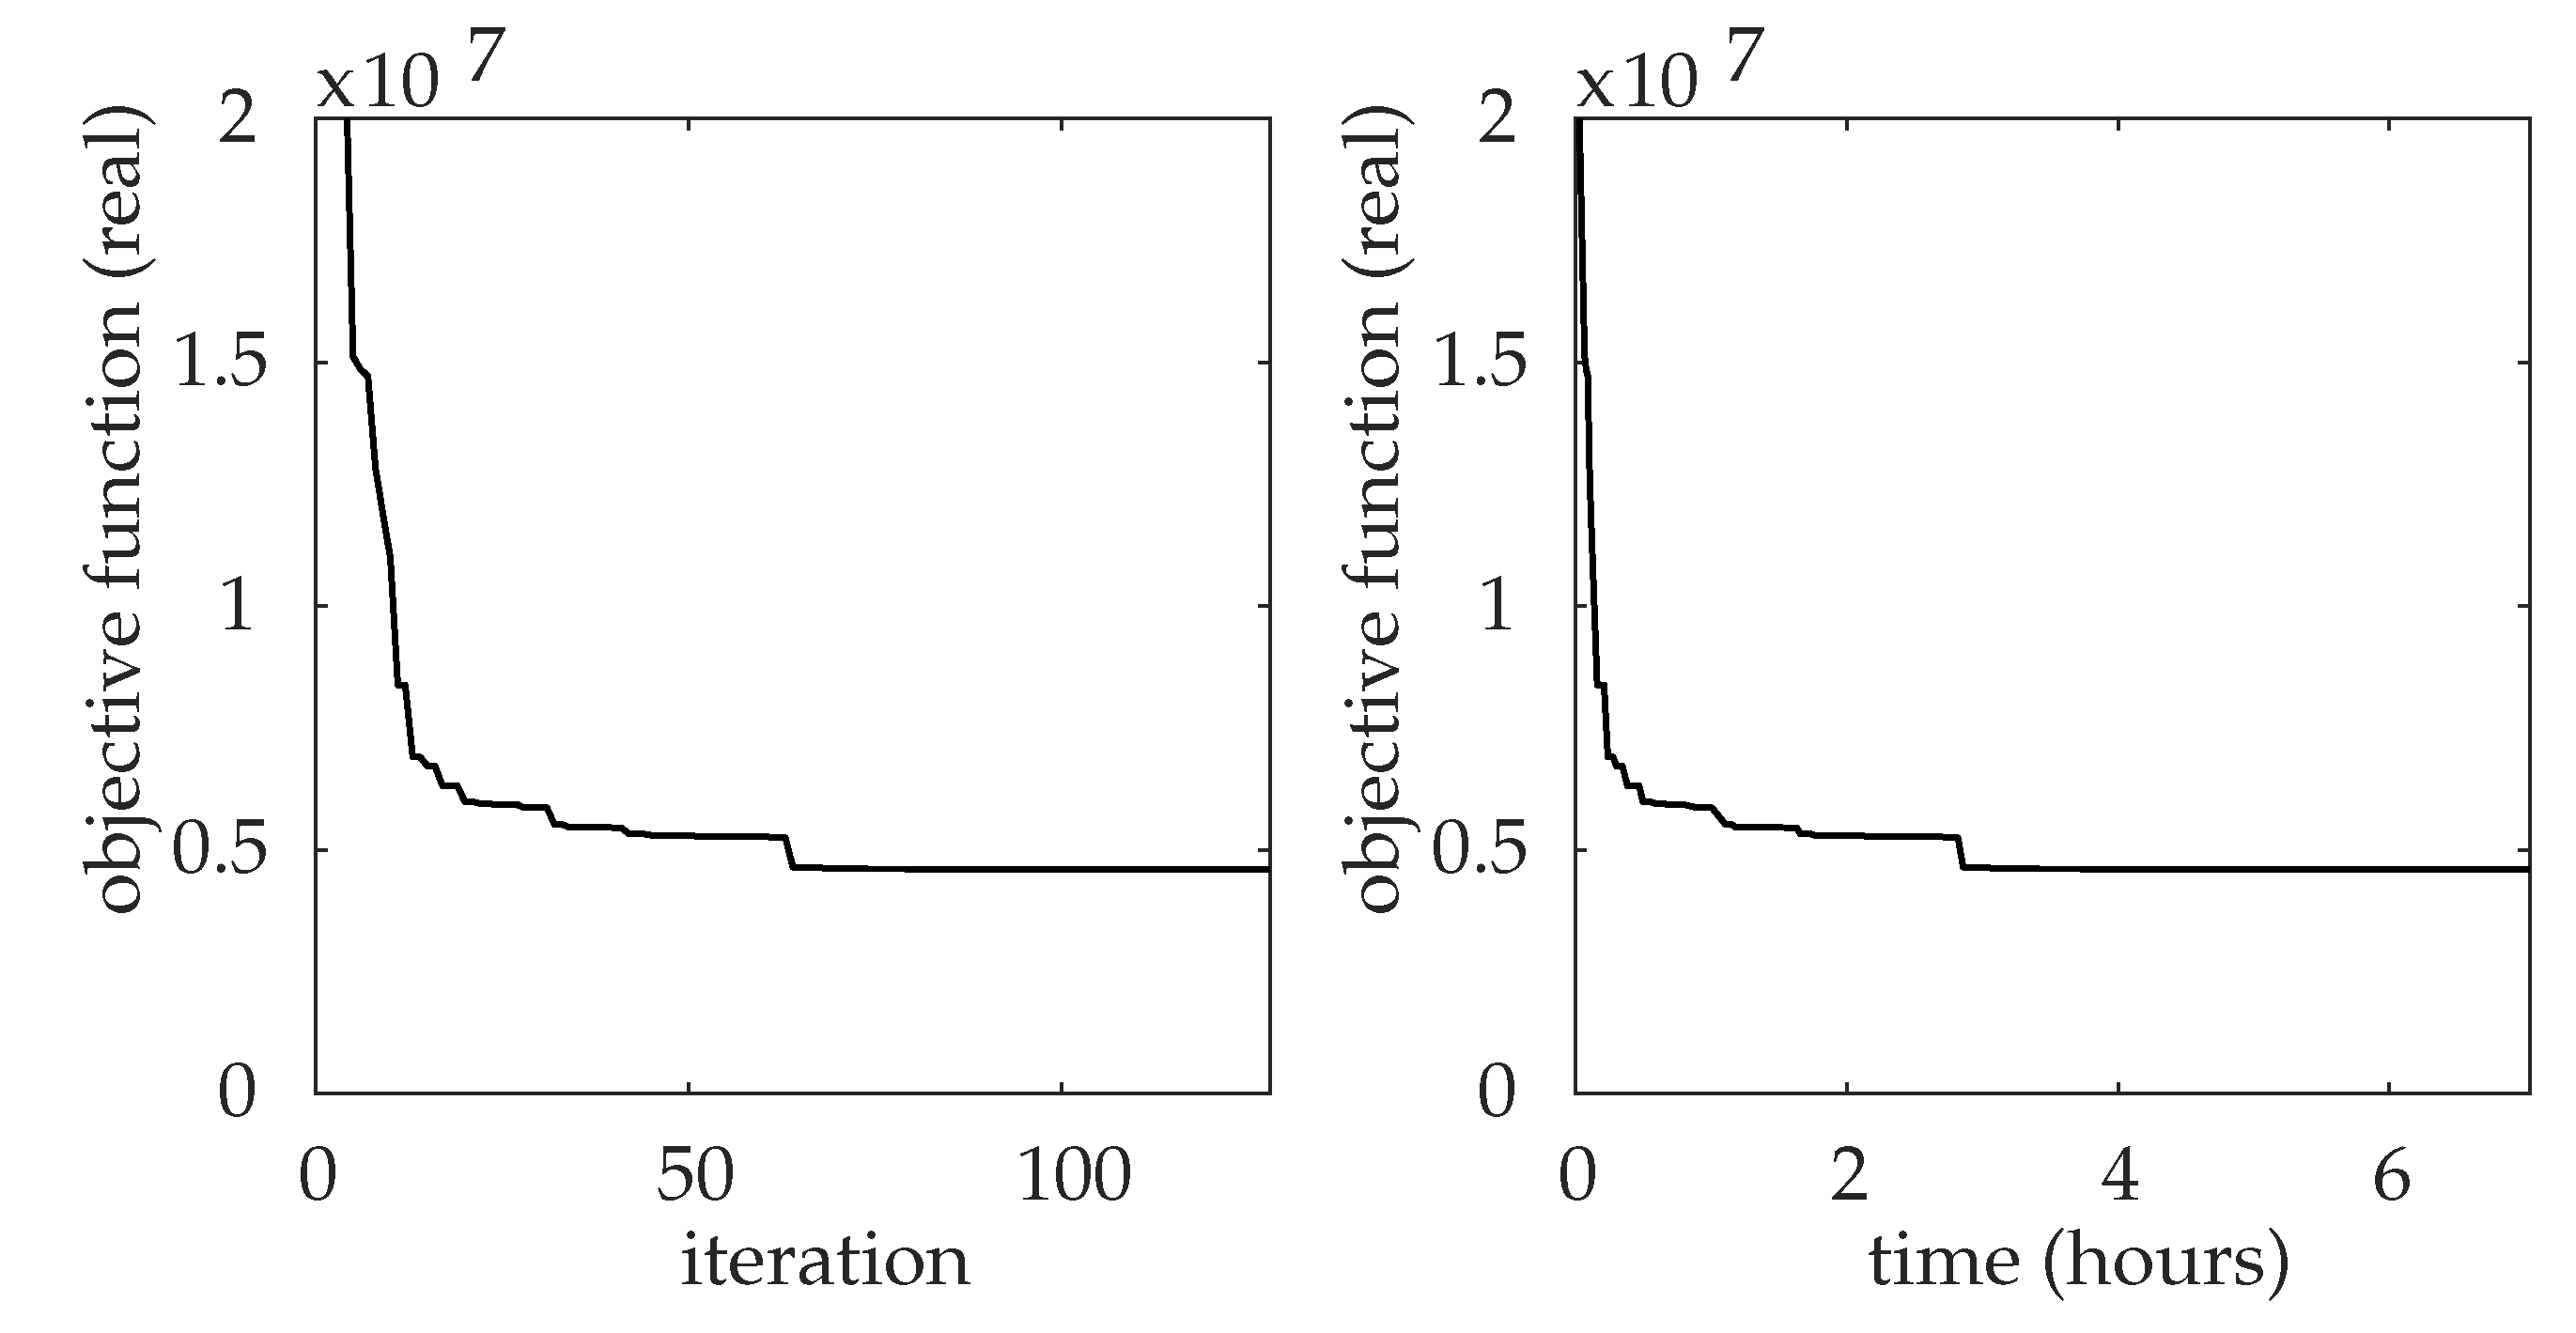
In
Figure 1, we can see the performance by iteration and by time. It shows the sudden drop in the cost of the network right after the initial heuristic.
Table 4 shows the END separated by the feeder, as well as the total cost of END and the cost of the keys before and after the optimization. The presence of the largest portion of END in feeder 1 is transferred to the second after optimization. In
Table 4, we can see the importance of automatic keys in reducing the cost of the objective function. A total of 6 automatic switches are allocated, and 30 manual switches are included for sectioning and switching. The final undistributed energy of the network is 99.09% lower than the initial, showing a decrease of BRL 473,443,261.00. Even reducing the total cost, the greatest weight remains the energy not distributed in the grid. The total cost reduction of the network drops 99.04%, equivalent to BRL 473,219,742.00.
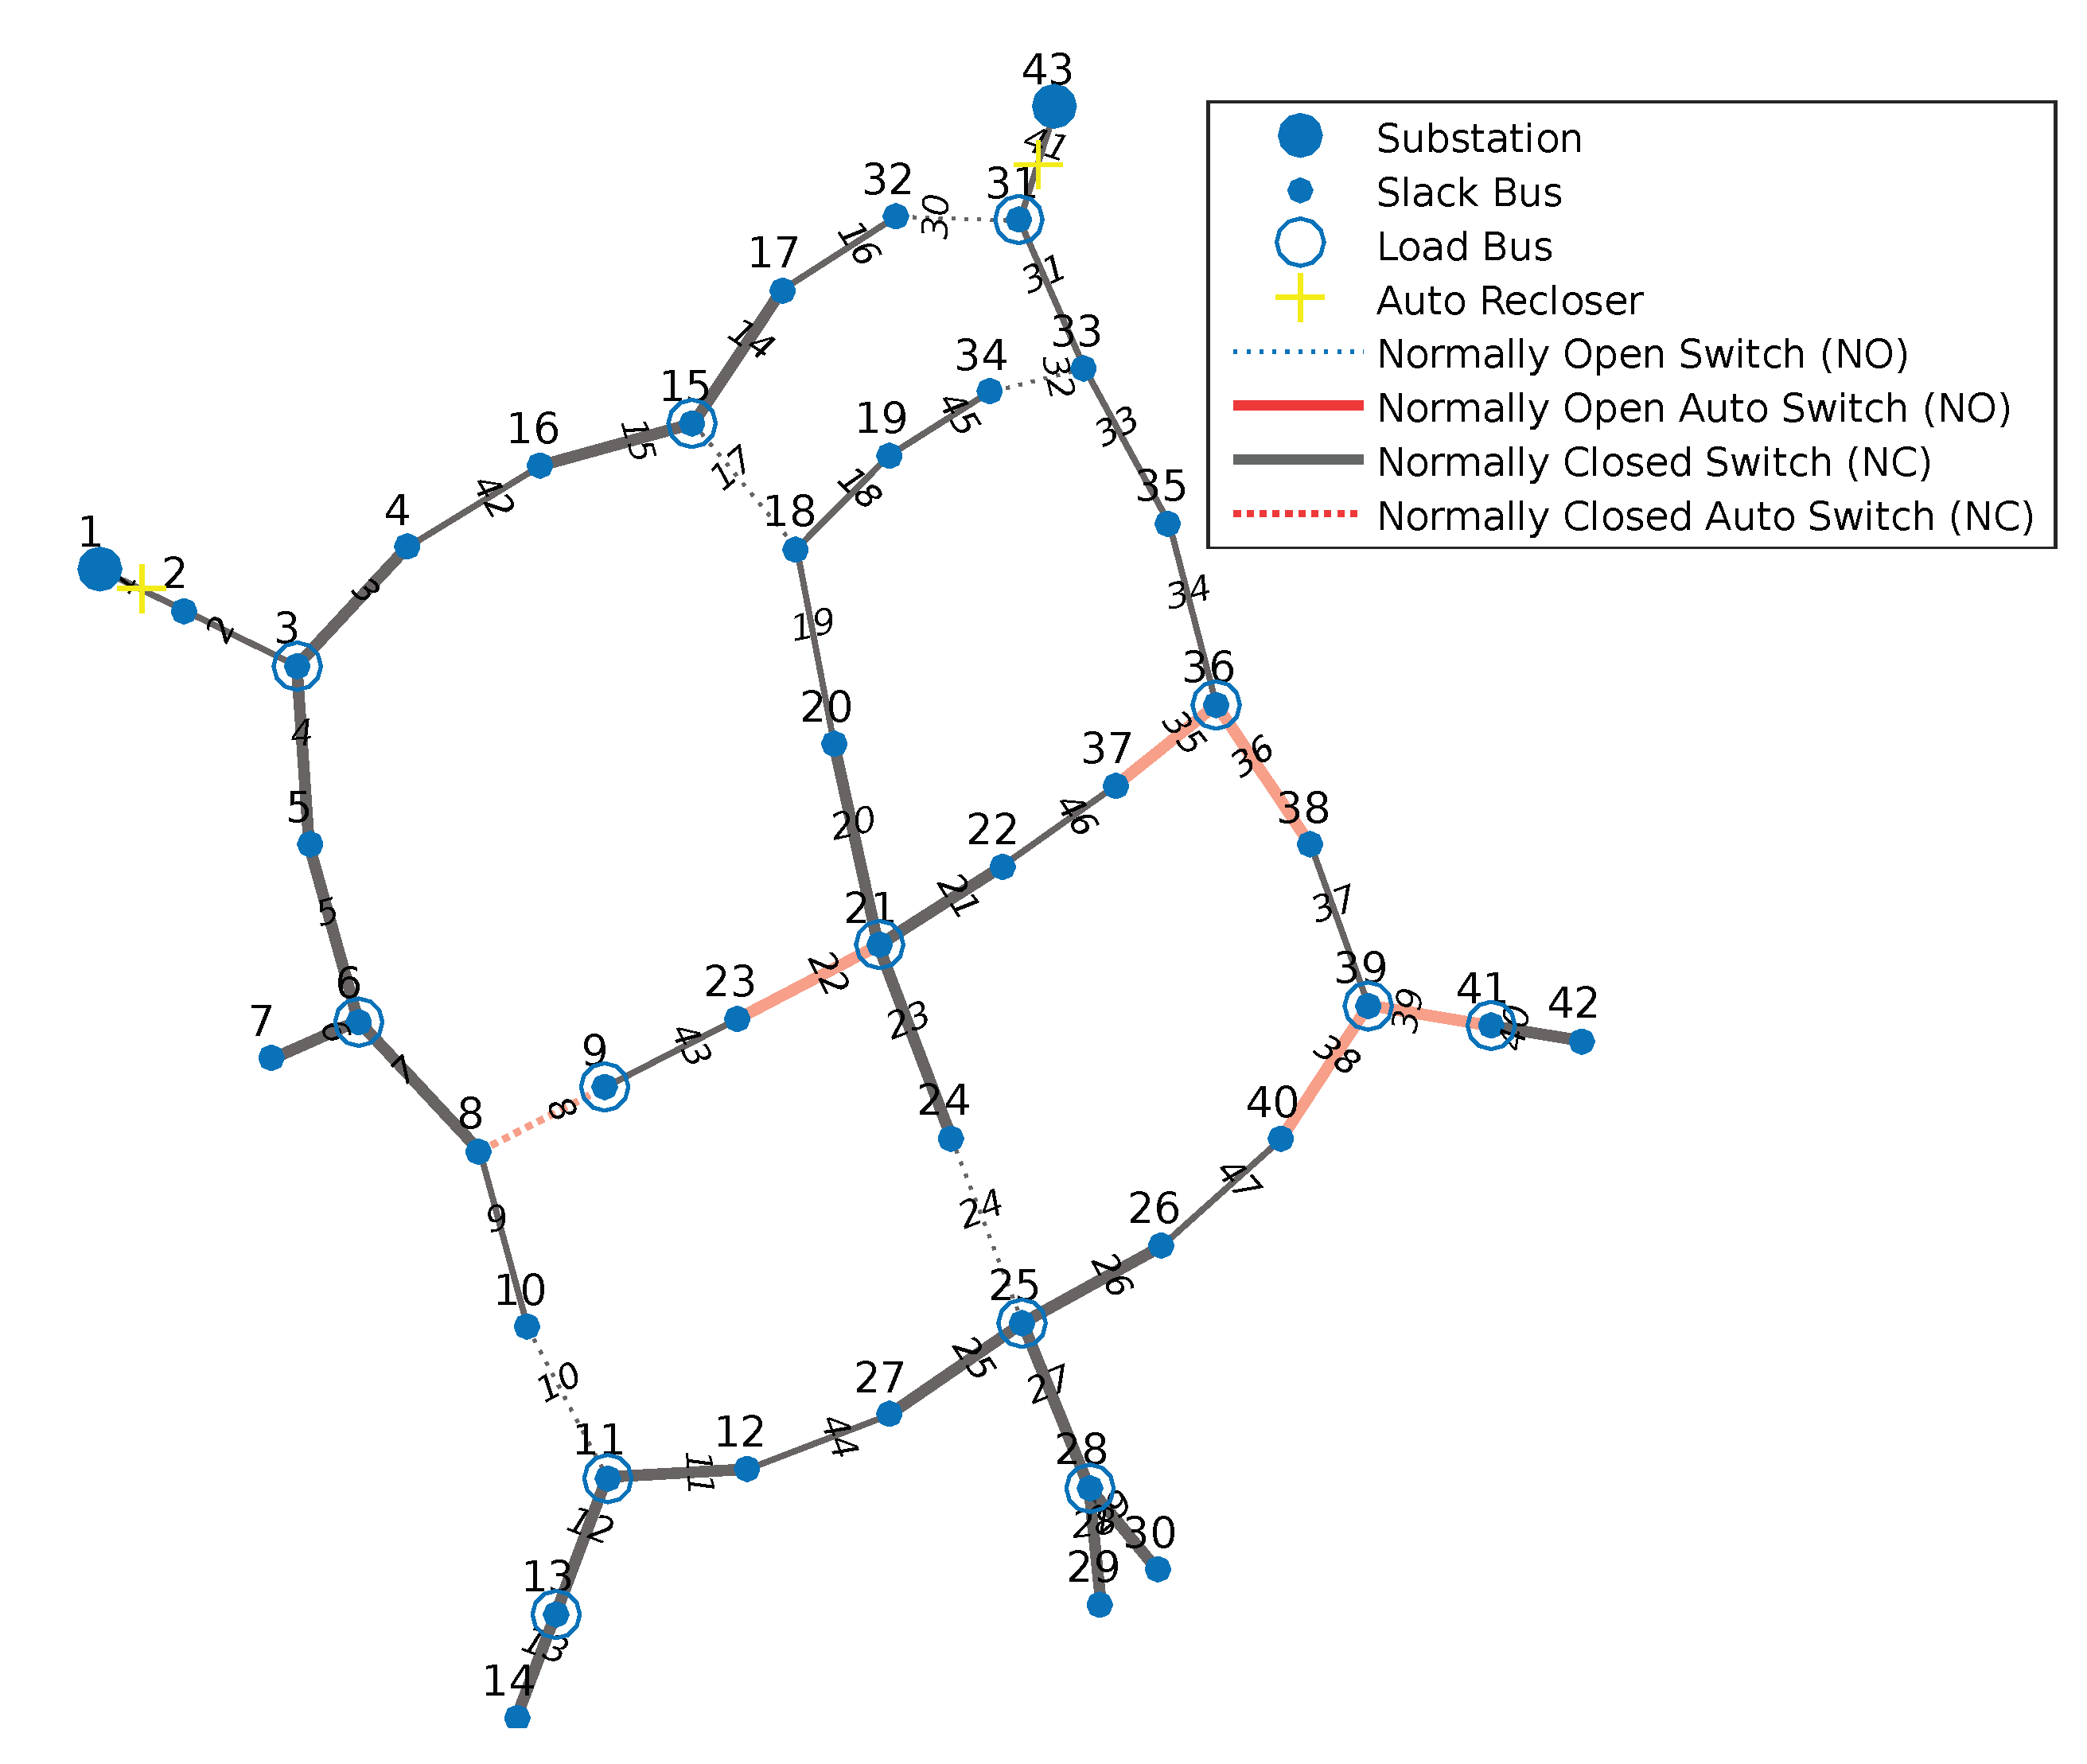
Figure 2 illustrates the optimal setup for 43-bar network. The electrical parameters used are:
= 13,800 kV,
= 1000 A,
= 20 MVA. For the resistors,
, and reactance
of the open switches, minimum values of 105.02 × 10
pu and 0 pu were considered, while the closed switches considered values of 9321.71 × 10
pu and 11,518.86 × 10
pu. The demand powers
and
were multiplied three times to increase the currents and adapt to the model used, allowing the optimizer to choose more types of keys.
Table 5 shows the relationship between EIDCU for the two feeders after
and
stipulated by the average EIDCU.
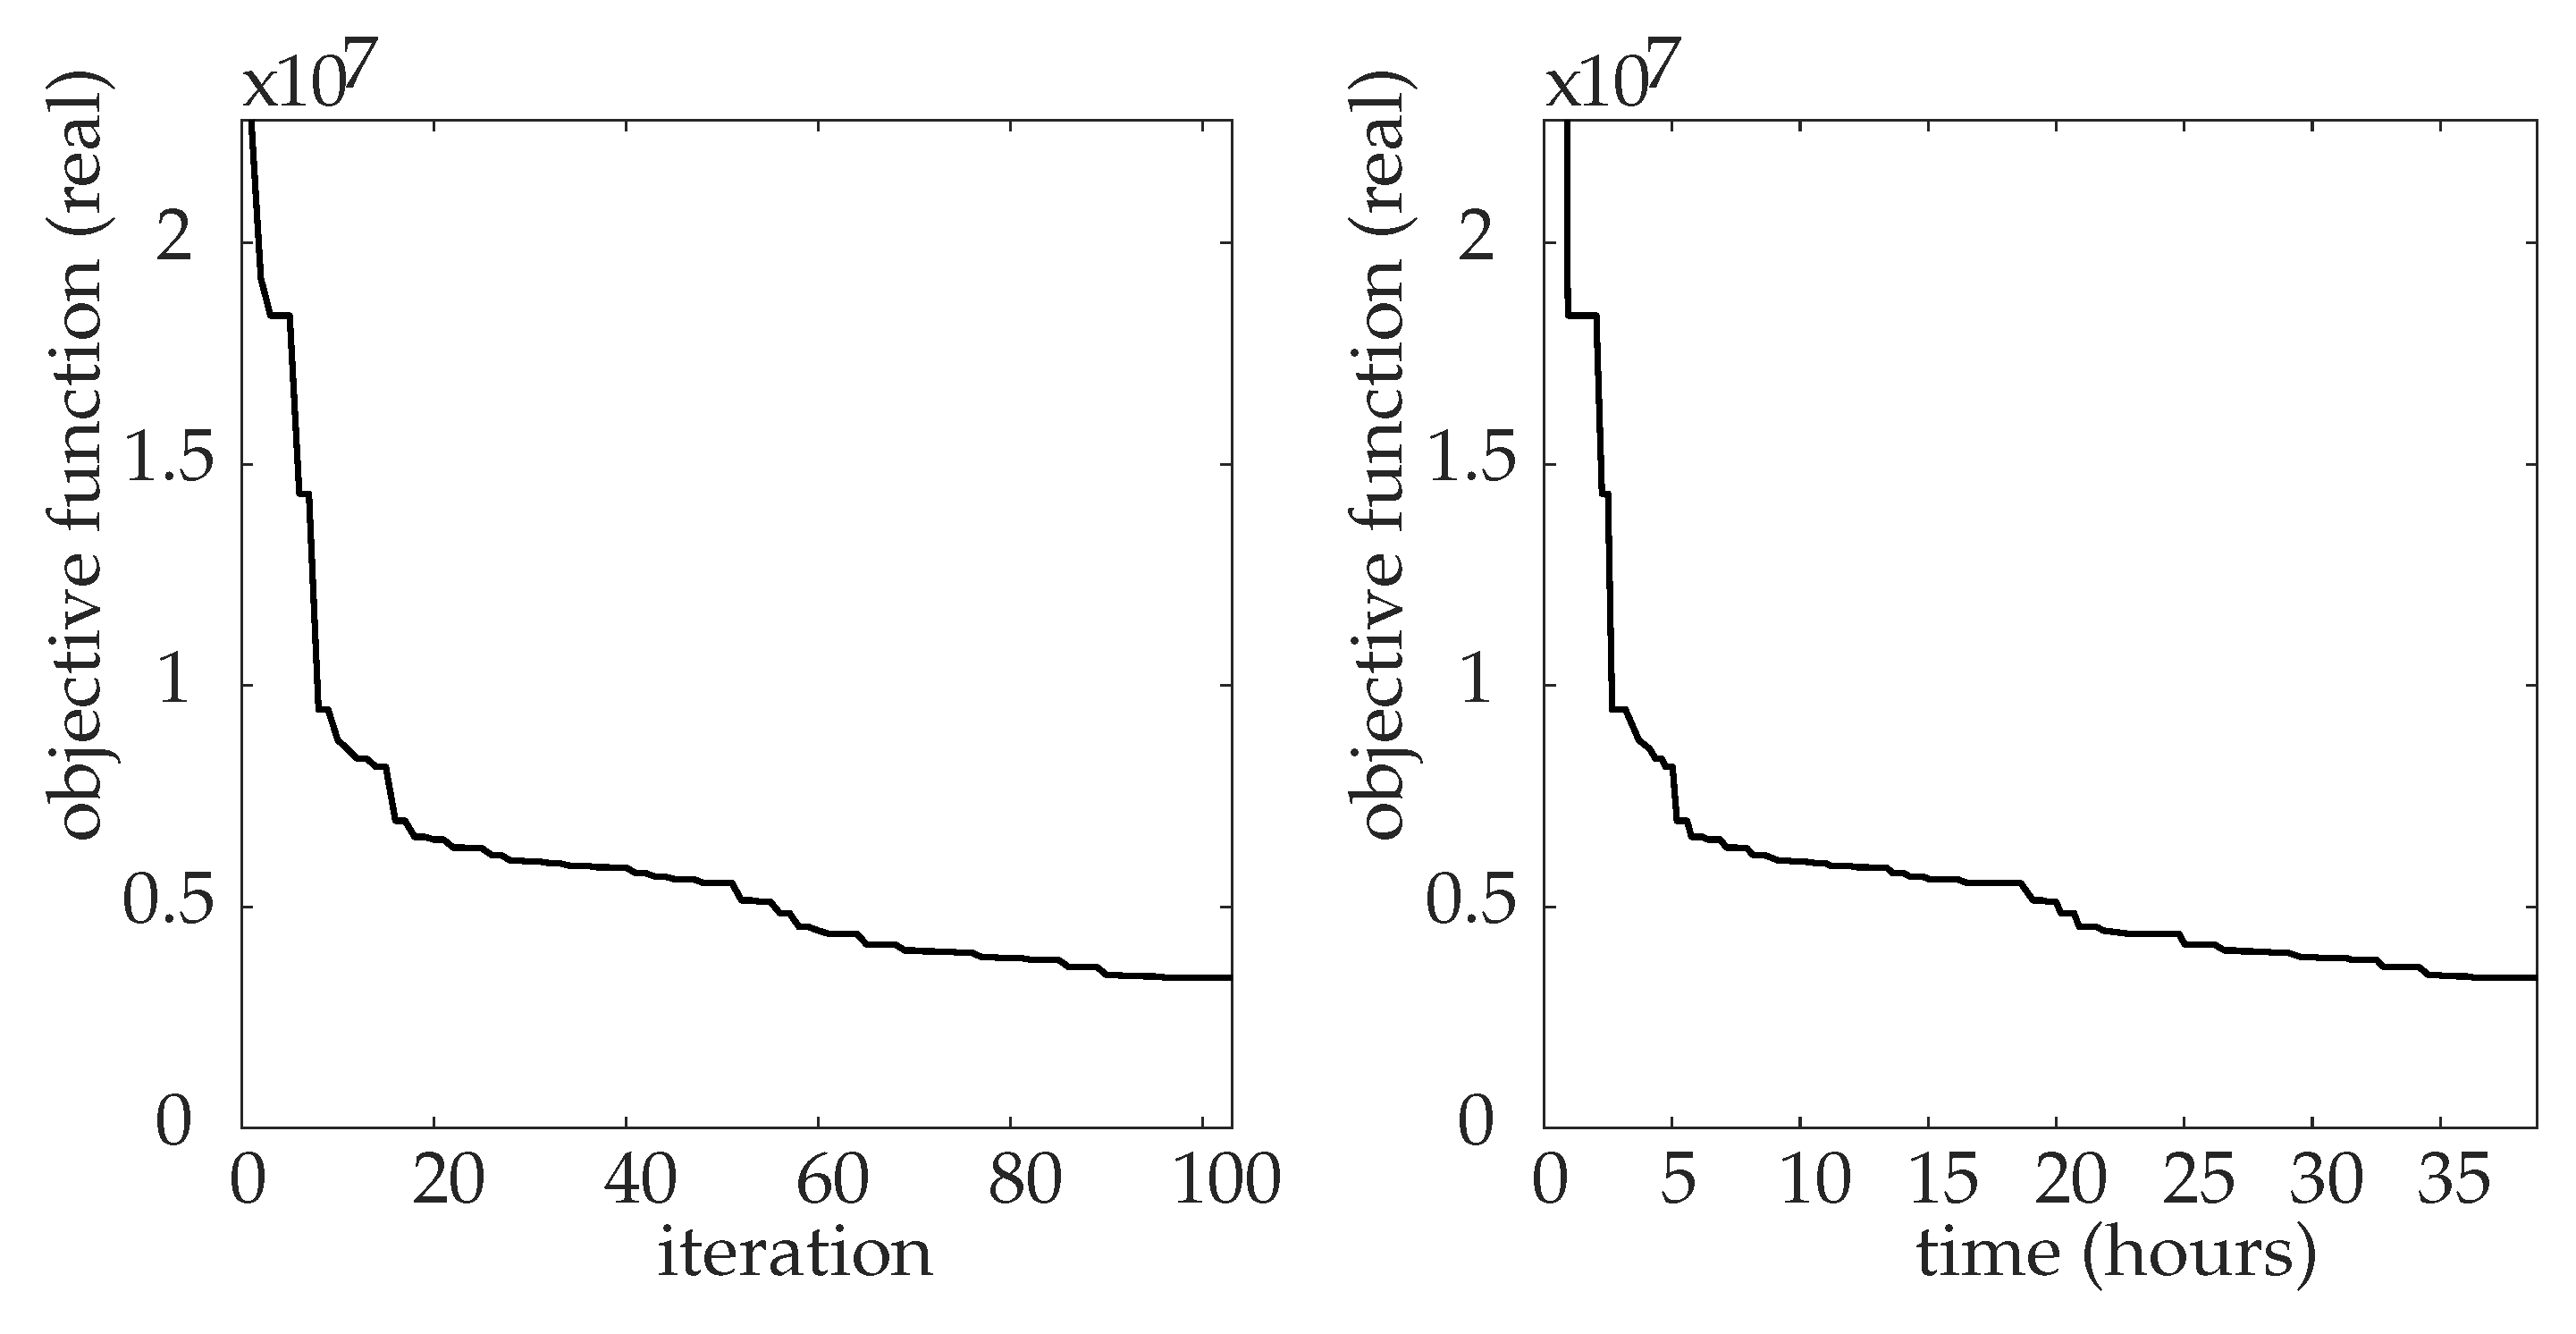
In
Figure 3, we can see the performance by iteration and by time. It shows the sudden drop in the cost of the network right after the initial heuristic, represented until the 4th iteration in 57 min, a drop of 79.09% compared to the initial configuration, and in the 10th iteration with 4 h and 44 min, a drop of 90.01% compared to the initial configuration. Between the 61st, in 25 h and 1 min, and the last iteration, there is a drop of less than 1% in the cost of the network. GABC converges on the 99th iteration in 38 h and 47 min showing a total improvement of 96.13% over the initial configuration.
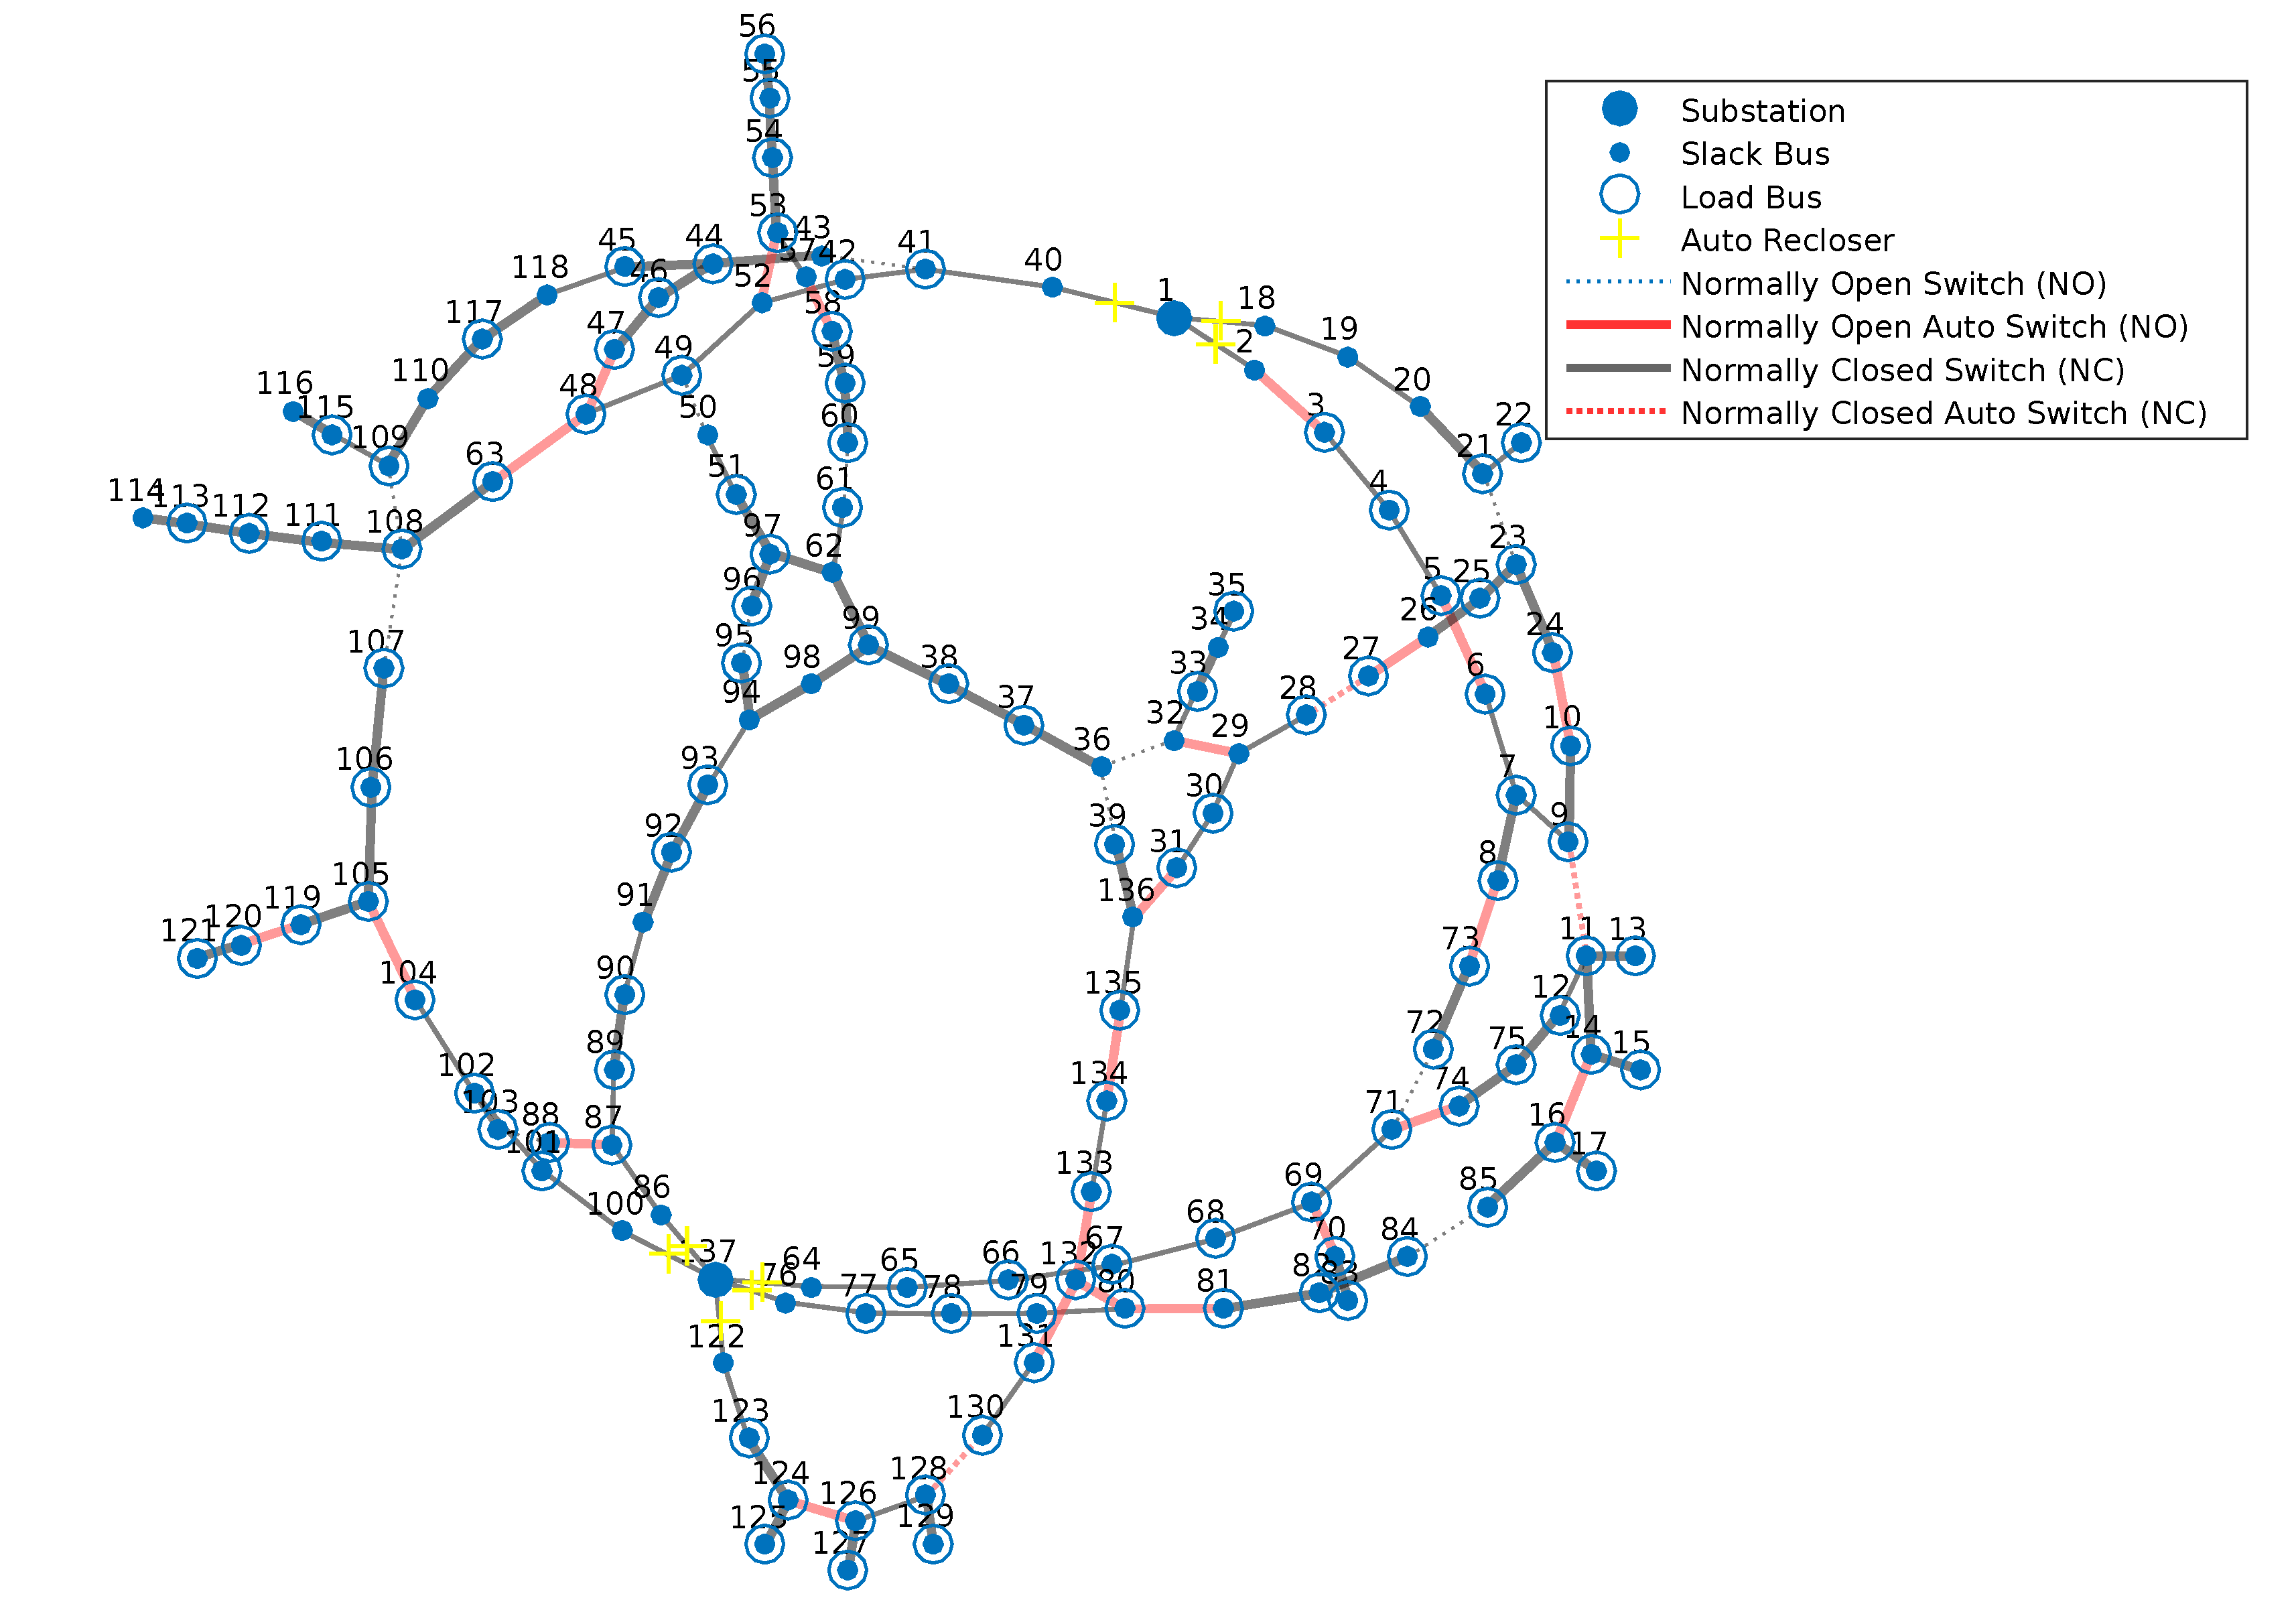
Table 6 shows the portion of END of the feeders, as well as the cost of END and the cost of the keys before and after the optimization. The allocation of automatic keys is predominant in this case, rising from 0 to 71, while manual keys decrease from 28 to 26. The final undistributed energy of the network is 97.35% lower than the initial one, showing a drop of BRL 85,357,177.00. Even reducing the total cost, the greatest weight remains the energy not distributed in the grid. The total cost reduction of the network reduces by 3.87%, equivalent to BRL 84,391,494.00. The optimal setup for 136-bar network which reached such metrics is presented in
Figure 4.
5. Conclusions
This paper presented an approach to treat the single objective version of the Switch Allocation Problem (SAP). When our results are compared to alternative solutions in the literature, our model presented more uniform responses for different feeders with a medium EIDCU. Our model produces a uniform duration equivalent to interruption among the feeders, avoiding overloading some of them.
When applying our approach to the two test networks, a considerable reduction in the final cost of the networks was observed. In the 43-bar network, the cost reduction was 99.04%, from BRL 477,814,648.00 to BRL 4,594,906.00. In the network of 136 bars, there was a 96.13% pf reduction in costs, from BRL 87,793,004.00 to BRL 3,401,510.00.
The proposed approach used the bee colony metaheuristic GABC. It is important to emphasize that the algorithm reached promising results. Future works include the execution time of our approach.

 ,
, 


