
A Knowledge-Based Battery Controller for IoT Devices

Abstract
:1. Introduction
- A new FRBS battery controller based on expert knowledge has been designed and implemented;
- Several experiments have been performed in a PV testbed that verify the correct operation of the controller;
- An FRBS controller, which is adapted to resource-constrained devices, has been designed and implemented;
- Several experiments intended to analyze the performance of the FRBS controller in resource-constrained devices have been performed;
- A new real lighting IoT application that includes a battery controller and reduces the cost of IoT devices has been designed and implemented.
2. Related Technologies and Work
2.1. Internet of Things
- Distributed data storage;
- Hierarchical processing of data in the fog, local data analysis that allows the reduction of the volume of transmitted data to the cloud and reduction of storage and transmission costs;
- Quality of service that allows the prioritization of data from delay-sensitive applications (e.g., industrial control or alarms);
- Performing complex tasks, which IoT devices may not support on fog servers, increasing the possibilities of these applications;
- Uninterrupted services because intermittent access to the cloud would not affect the application;
- Latency reduction because communications between devices in the fog are faster and, conversely, the volume of data to be sent to the cloud is reduced;
- Improved security because servers in the fog can act as firewalls and thus protect devices that do not have sufficient capacity to execute encryption and authentication algorithms.
2.2. Stand-Alone PV Systems
2.3. Fuzzy Rule-Based Systems
2.4. IoT and AI in PV Systems
3. A Knowledge-Based Battery Controller for IoT Devices
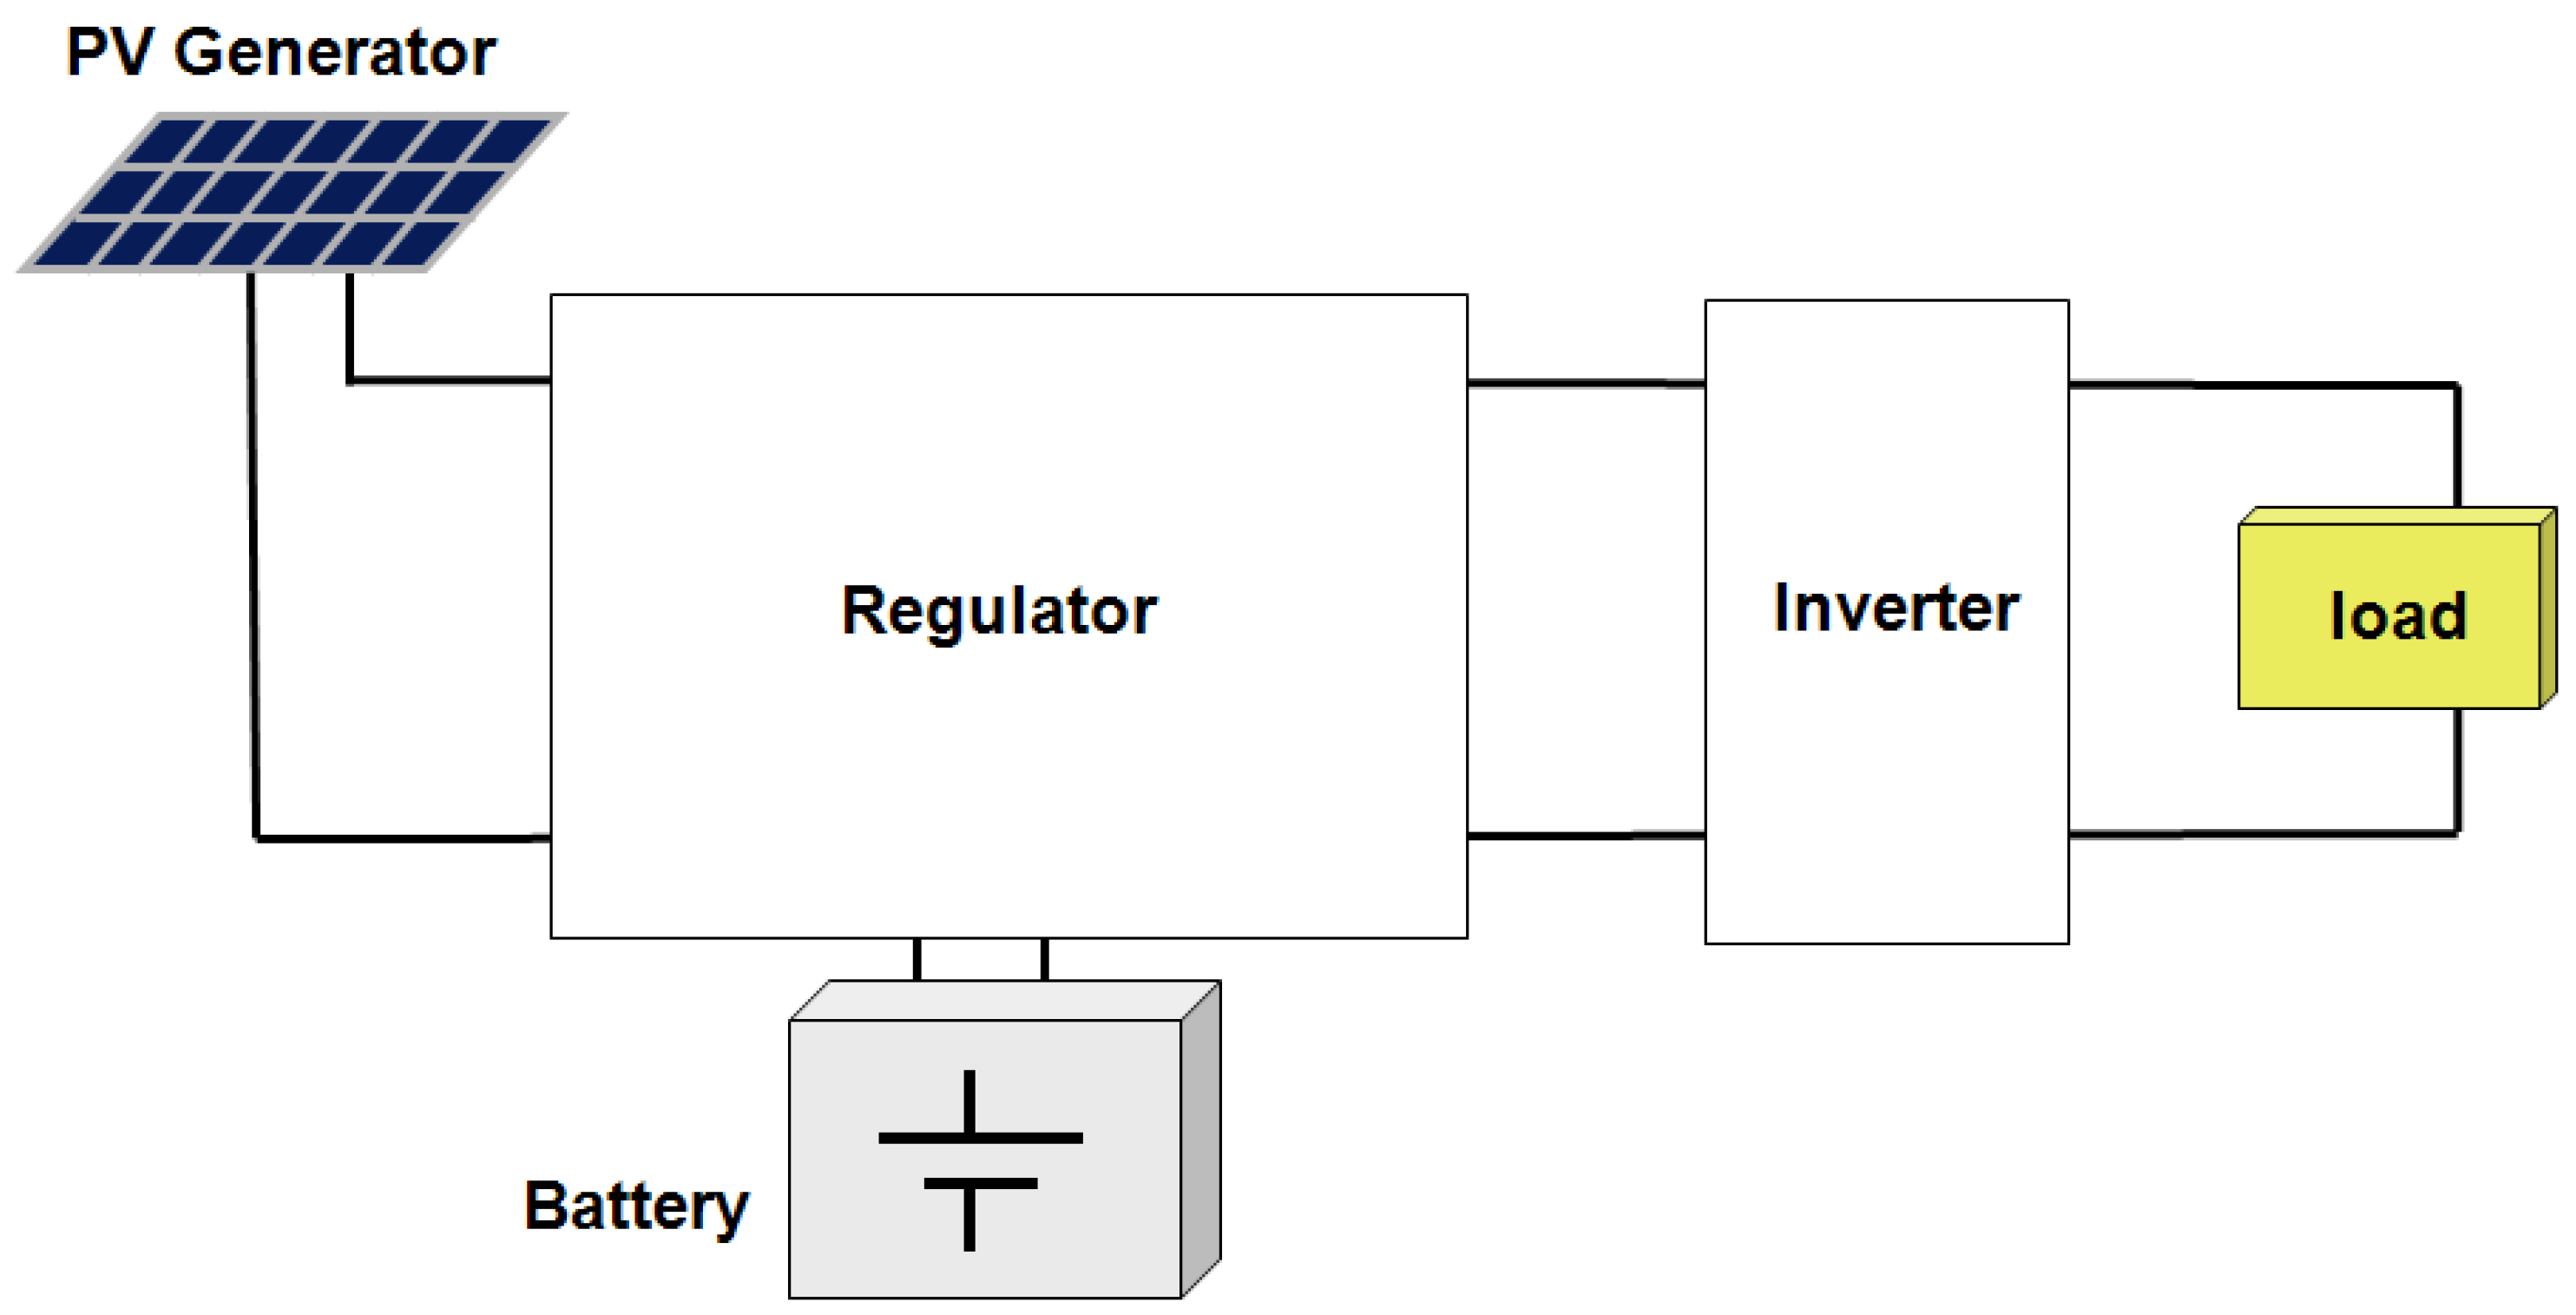
3.1. Stand-Alone PV System Controller
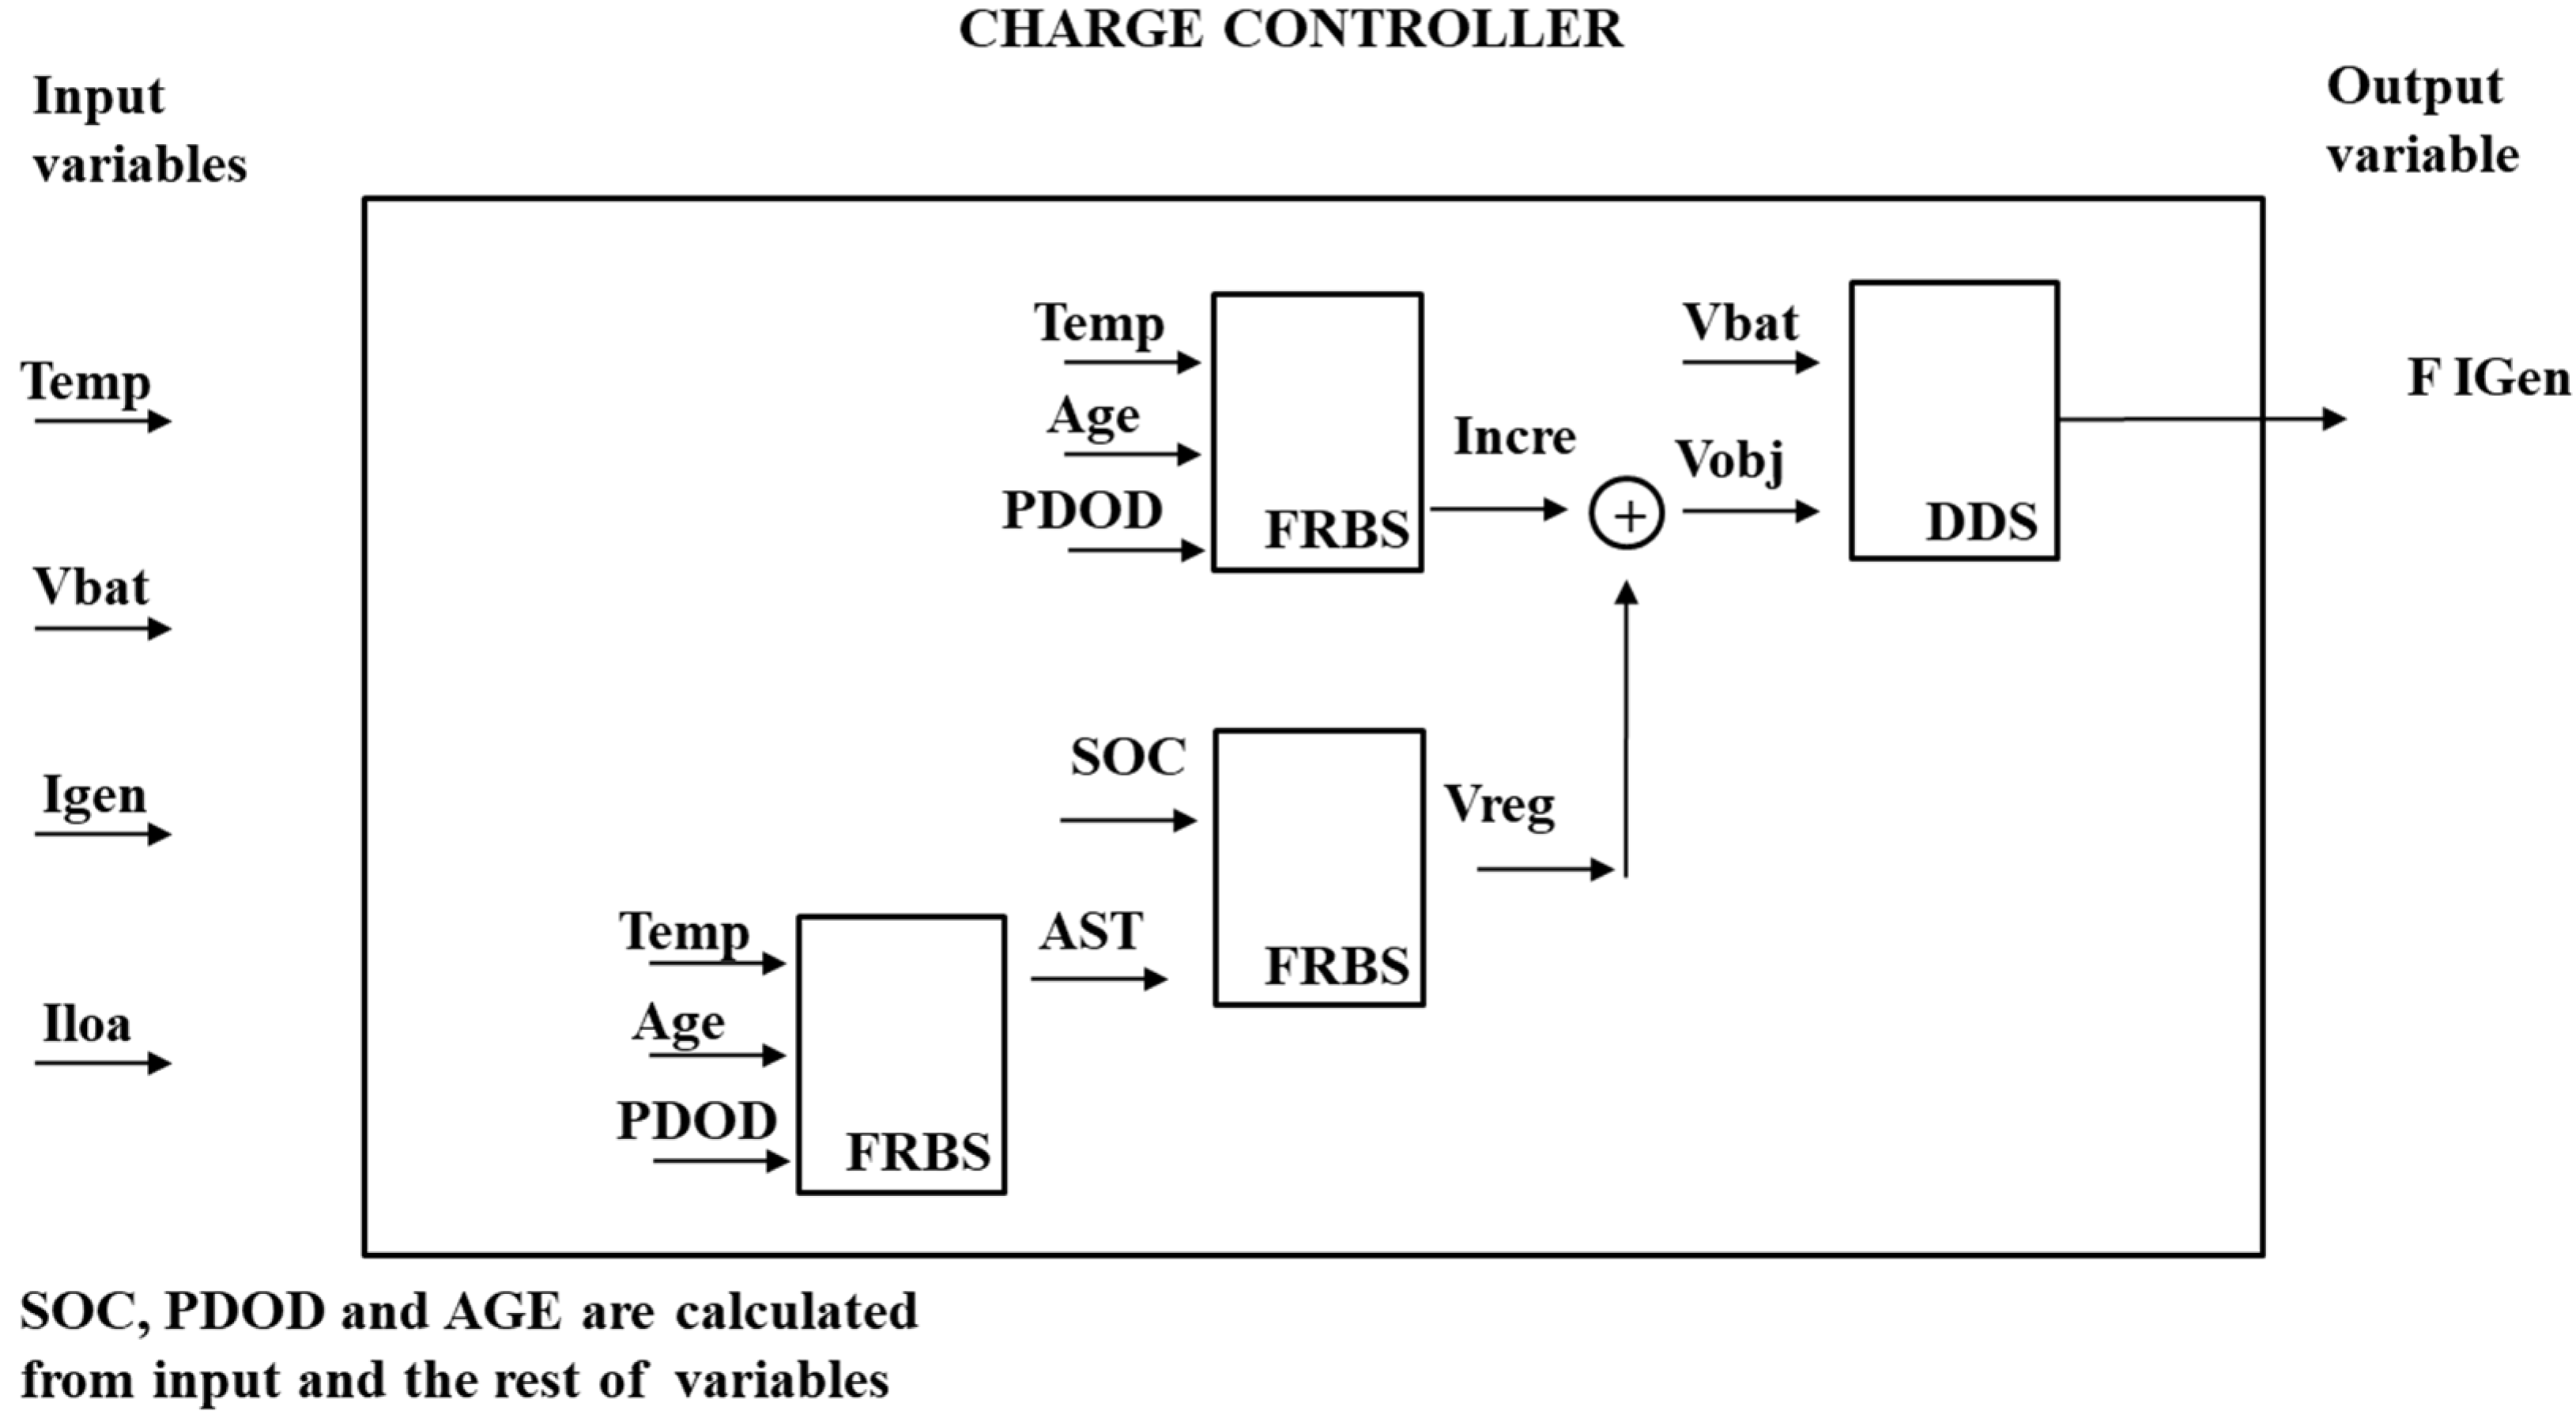
3.2. Structured Charge Controller
- Charging process based on different stages: bulk, absorption, and float, protecting the battery from overcharges;
- Inference of regulation voltages, absorption time, and increments of regulation voltages using different FRBS;
- Temperature compensation for the absorption and float voltages and the duration of the absorption stage;
- Age compensation on absorption and float voltages and duration of absorption stage;
- Previous DOD (PDOD) compensation on absorption and float voltages and the duration of the absorption stage.
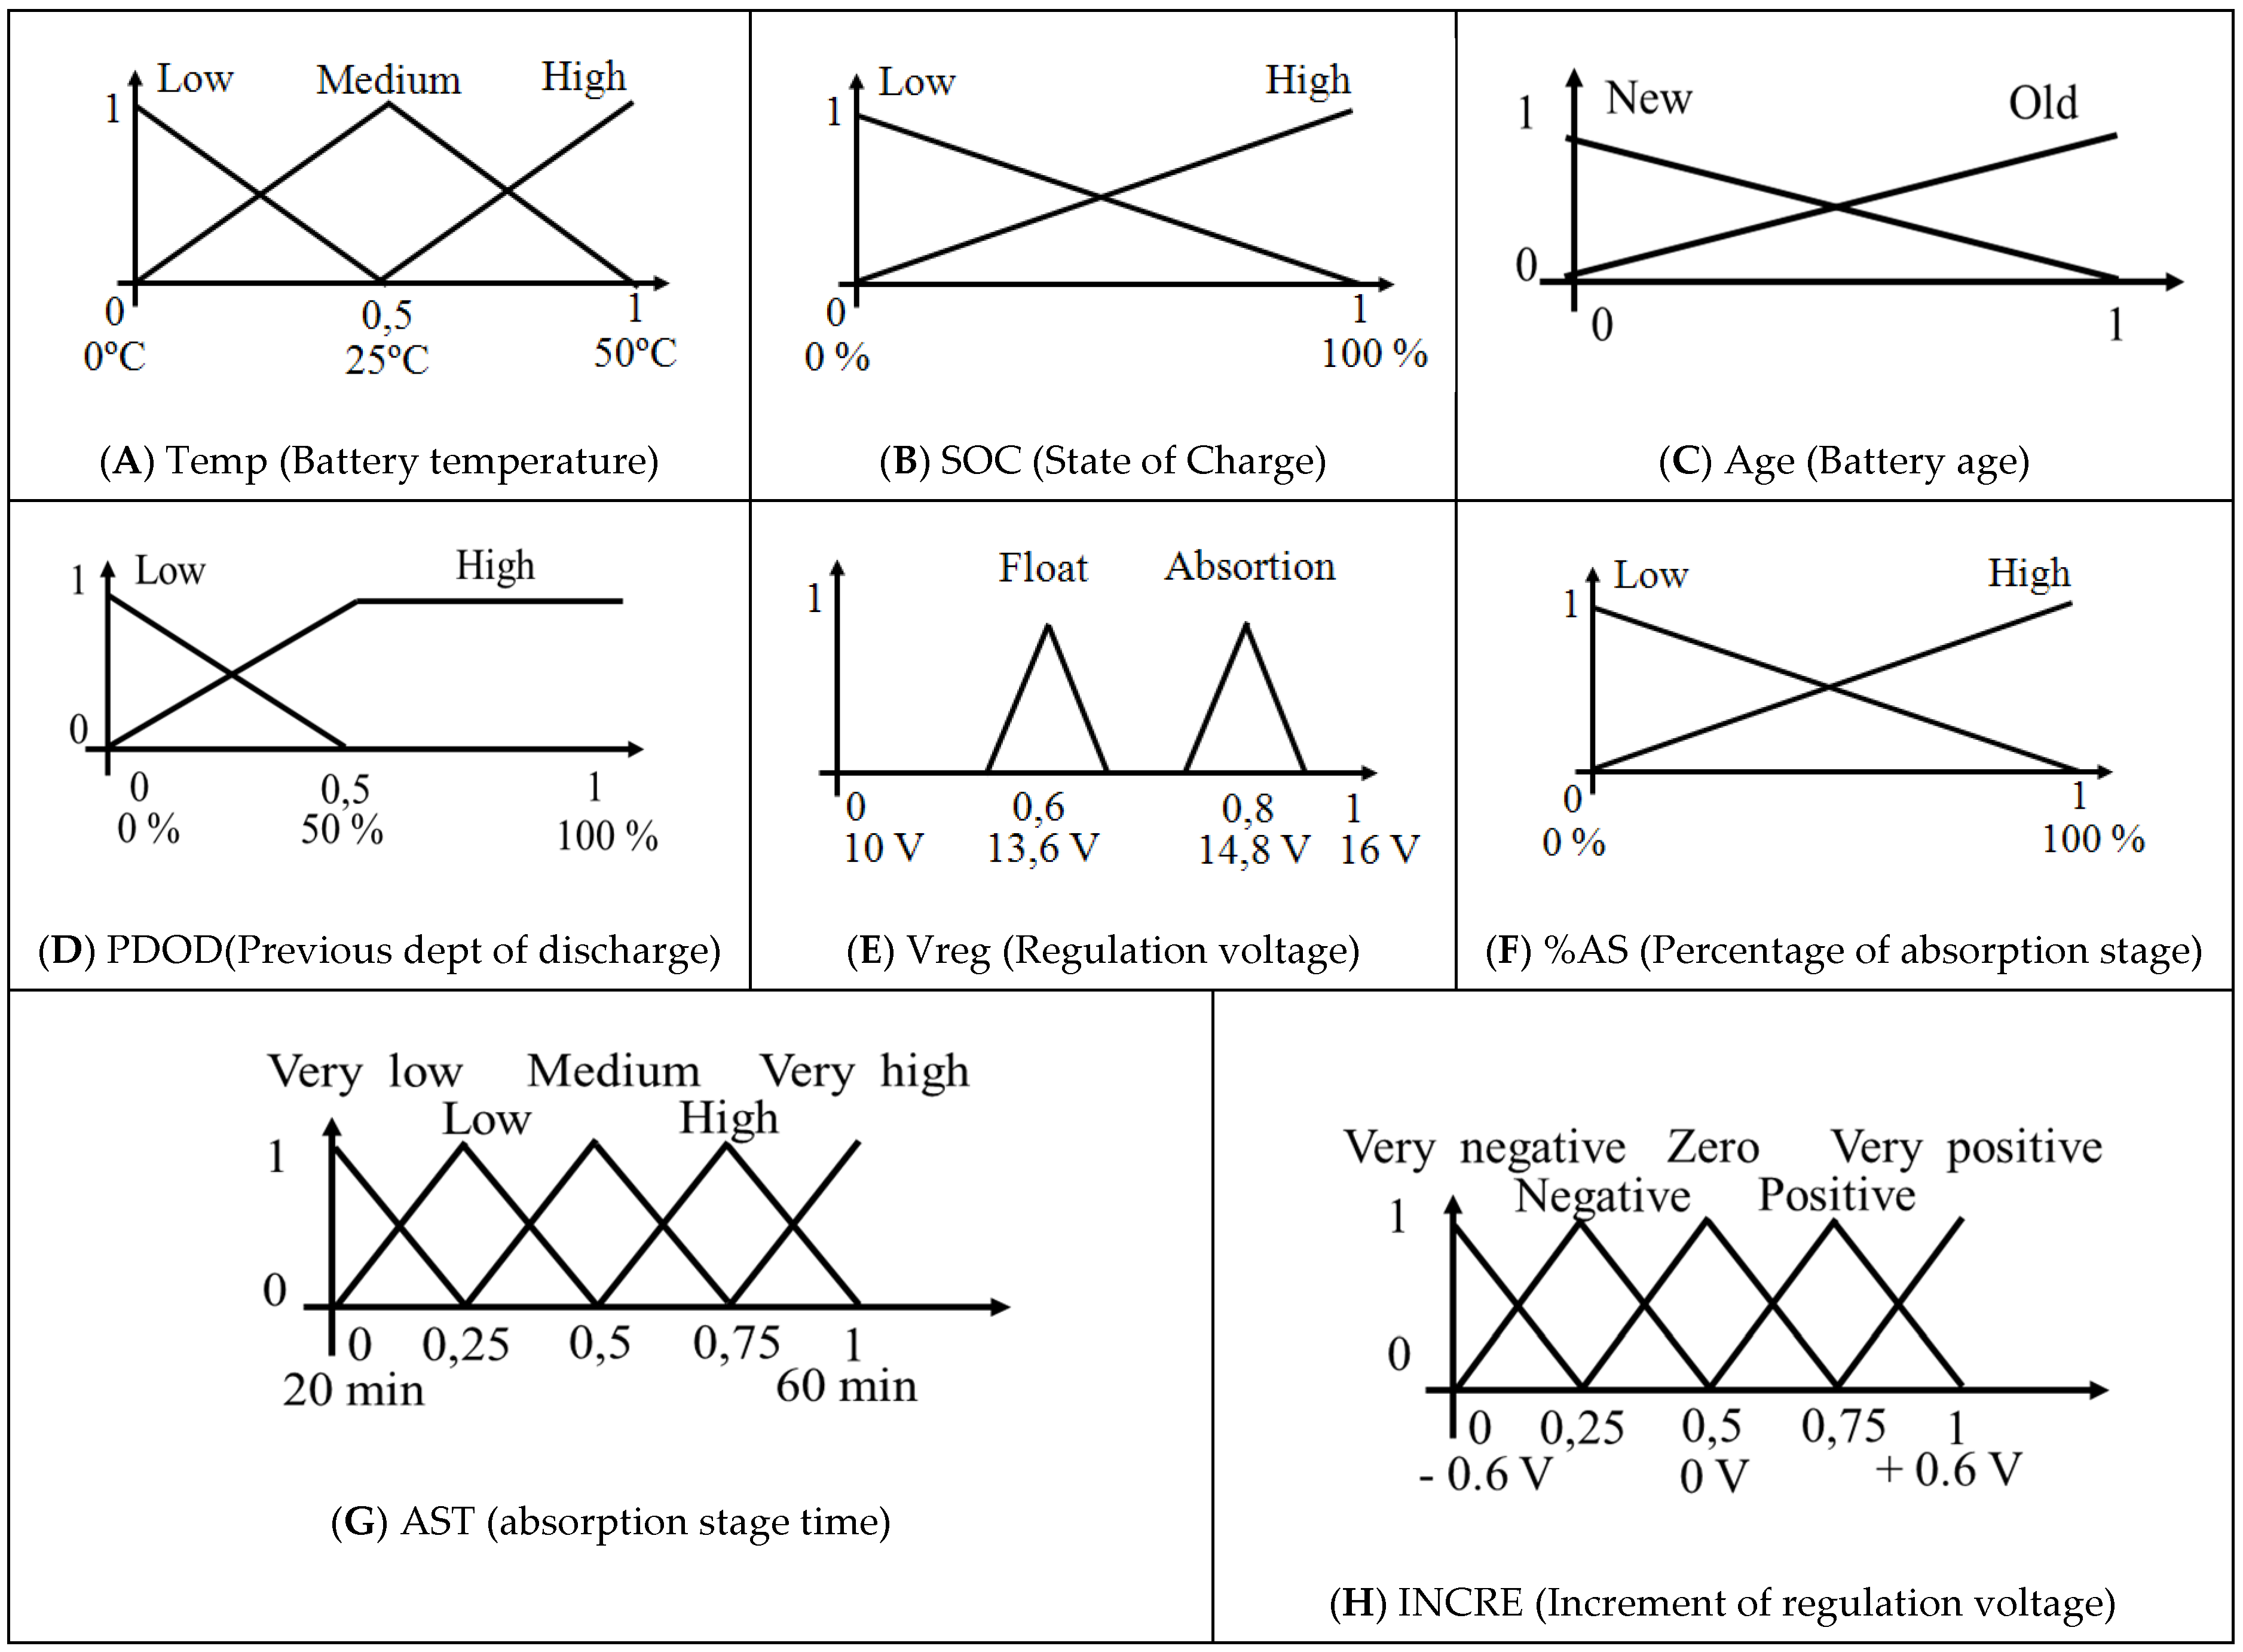
| IF (Temp is low) and (Age is new) and (PDOD is low) | THEN (AST is medium) |
| IF (Temp is low) and (Age is new) and (PDOD is high) | THEN (AST is high) |
| IF (Temp is low) and (Age is old) and (PDOD is low) | THEN (AST is high) |
| IF (Temp is low) and (Age is old) and (PDOD is high) | THEN (AST is very high) |
| IF (Temp is med) and (Age is new) and (PDOD is low) | THEN (AST is low) |
| IF (Temp is med) and (Age is new) and (PDOD is high) | THEN (AST is medium) |
| IF (Temp is med) and (Age is old) and (PDOD is low) | THEN (AST is medium) |
| IF (Temp is med) and (Age is old) and (PDOD is high) | THEN (AST is high) |
| IF (Temp is high) and (Age is new) and (PDOD is low) | THEN (AST is very low) |
| IF (Temp is high) and (Age is new) and (PDOD is high) | THEN (AST is low) |
| IF (Temp is high) and (Age is old) and (PDOD is low) | THEN (AST is low) |
| IF (Temp is high) and (Age is old) and (PDOD is high) | THEN (AST is medium) |
| IF (SOC is low) and (%AS is low) | THEN (Vreg is absorption) |
| IF (SOC is low) and (%AS is high) | THEN (Vreg is float) |
| IF (SOC is high) | THEN (Vreg is float) |
| IF (Temp is low) and (Age is new) and (PDOD is low) | THEN (Incre is positive) |
| IF (Temp is low) and (Age is new) and (PDOD is high) | THEN (Incre is very positive) |
| IF (Temp is low) and (Age is old) | THEN (Incre is very positive) |
| IF (Temp is med) and (Age is new) and (PDOD is low) | THEN (Incre is zero) |
| IF (Temp is med) and (Age is new) and (PDOD is high) | THEN (Incre is positive) |
| IF (Temp is med) and (Age is old) and (PDOD is low) | THEN (Incre is positive) |
| IF (Temp is med) and (Age is old) and (PDOD is high) | THEN (Incre is very positive) |
| IF (Temp is high) and (Age is new) and (PDOD is low) | THEN (Incre is negative) |
| IF (Temp is high) and (Age is new) and (PDOD is high) | THEN (Incre is zero) |
| IF (Temp is high) and (Age is old) and (PDOD is low) | THEN (Incre is zero) |
| IF (Temp is high) and (Age is old) and (PDOD is high) | THEN (Incre is positive) |
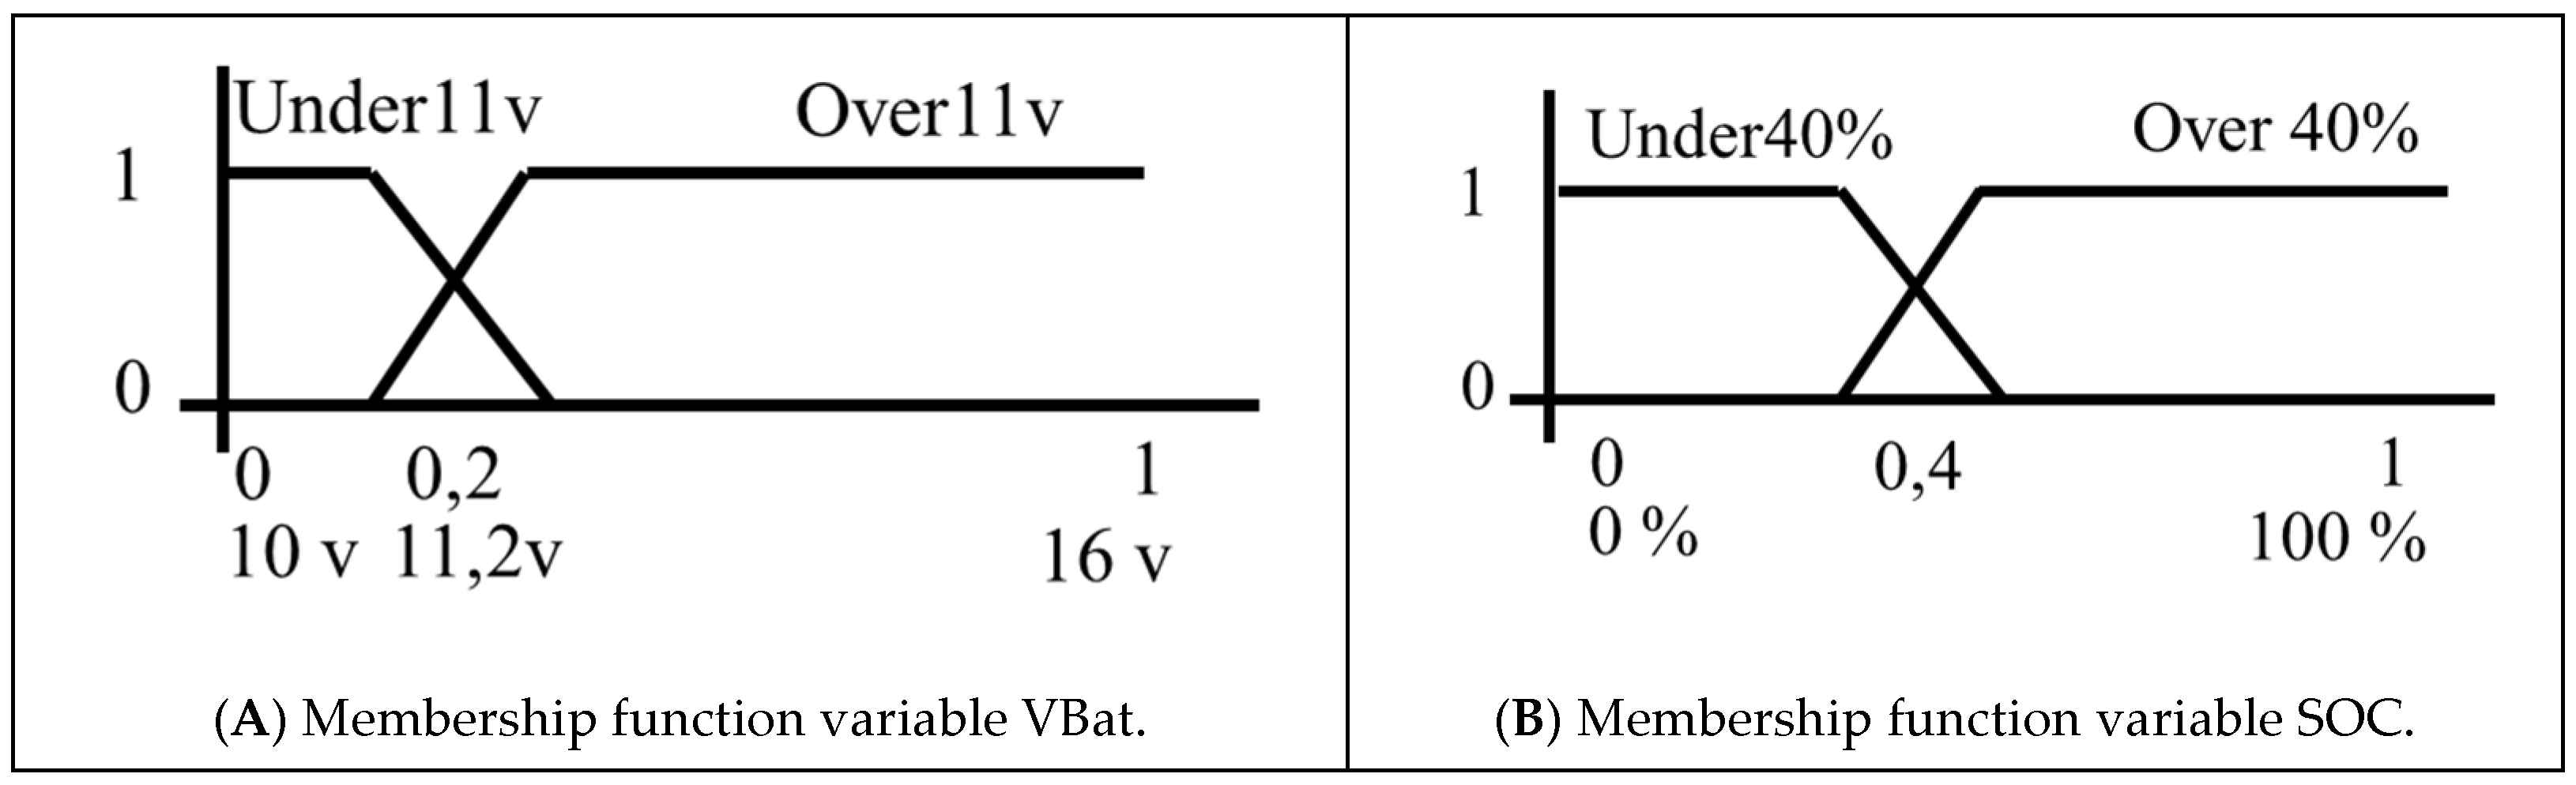
3.3. Discharge Controller
| IF (Vbat is over11v) and (SOC is over40%) | THEN (FIloa is ON) |
| IF (Vbat is over11v) and (SOC is under40%) | THEN (FIloa is OFF) |
| IF (Vbat is under11v) | THEN (FIloa is OFF) |
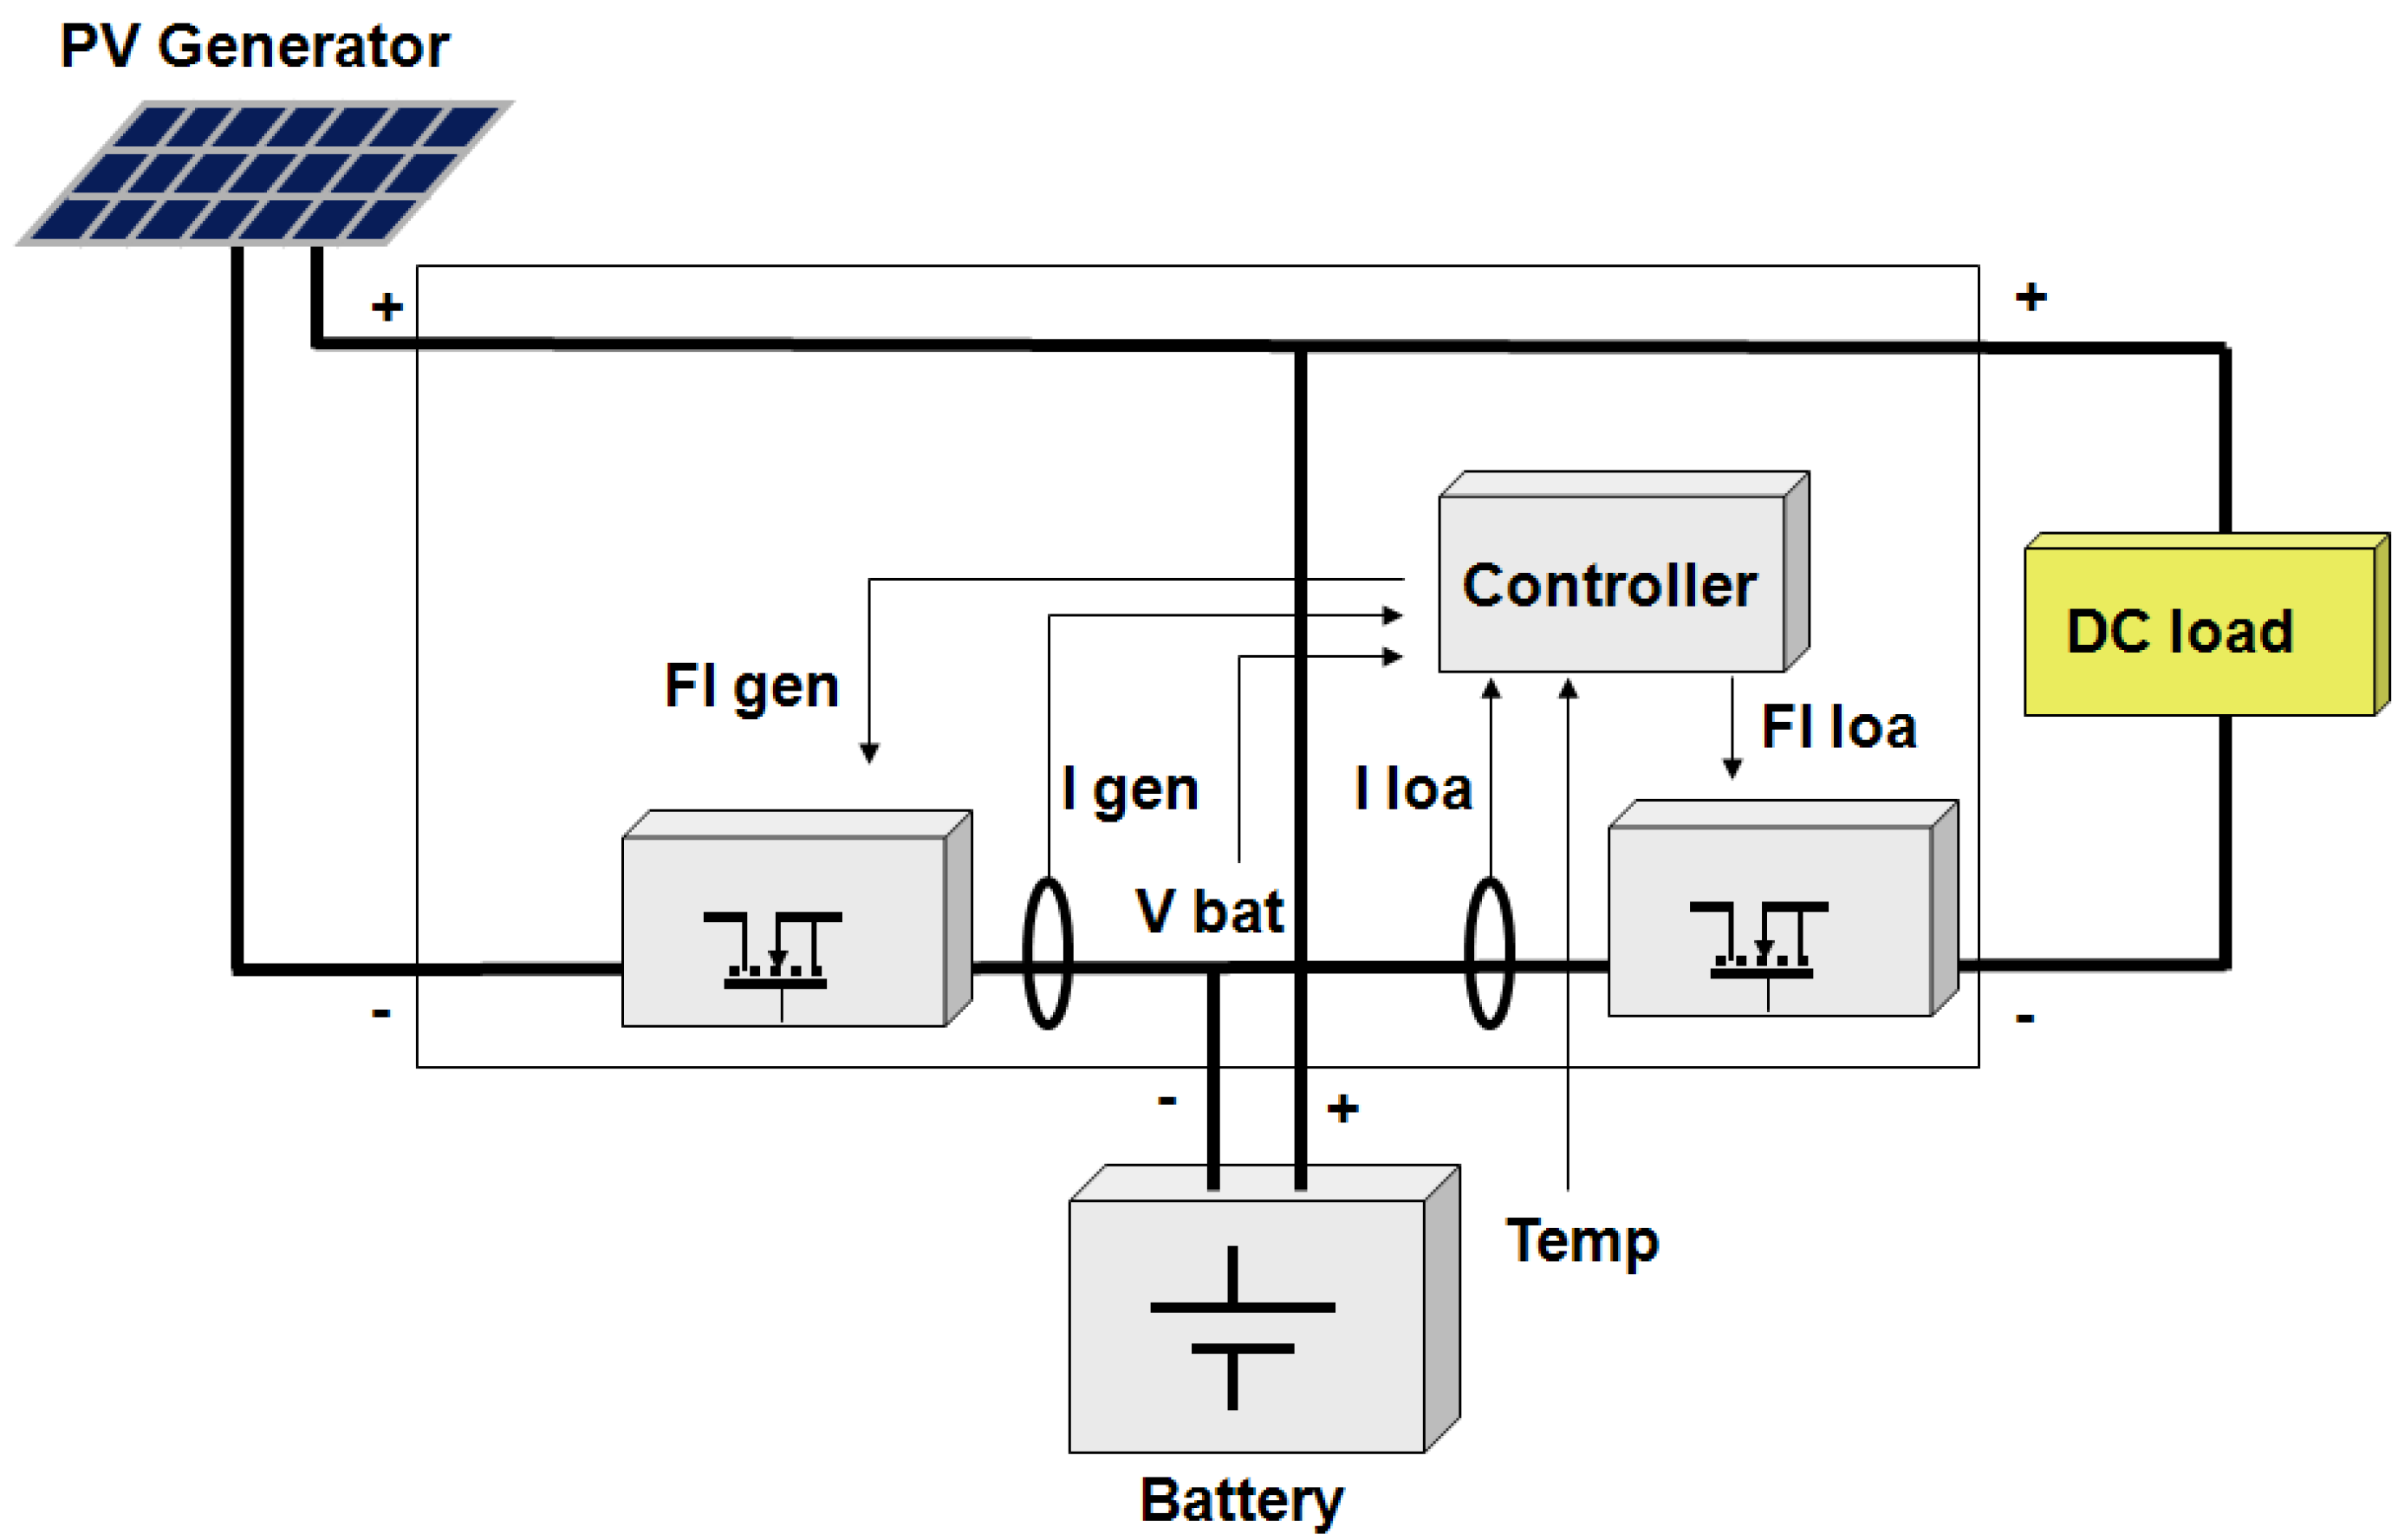
3.4. Integration of Battery Controller in an IoT Device
4. Results
4.1. Comparison of Features between Different Controllers in Real Stand-Alone PV Systems
4.1.1. Physical Stand-Alone PV Systems
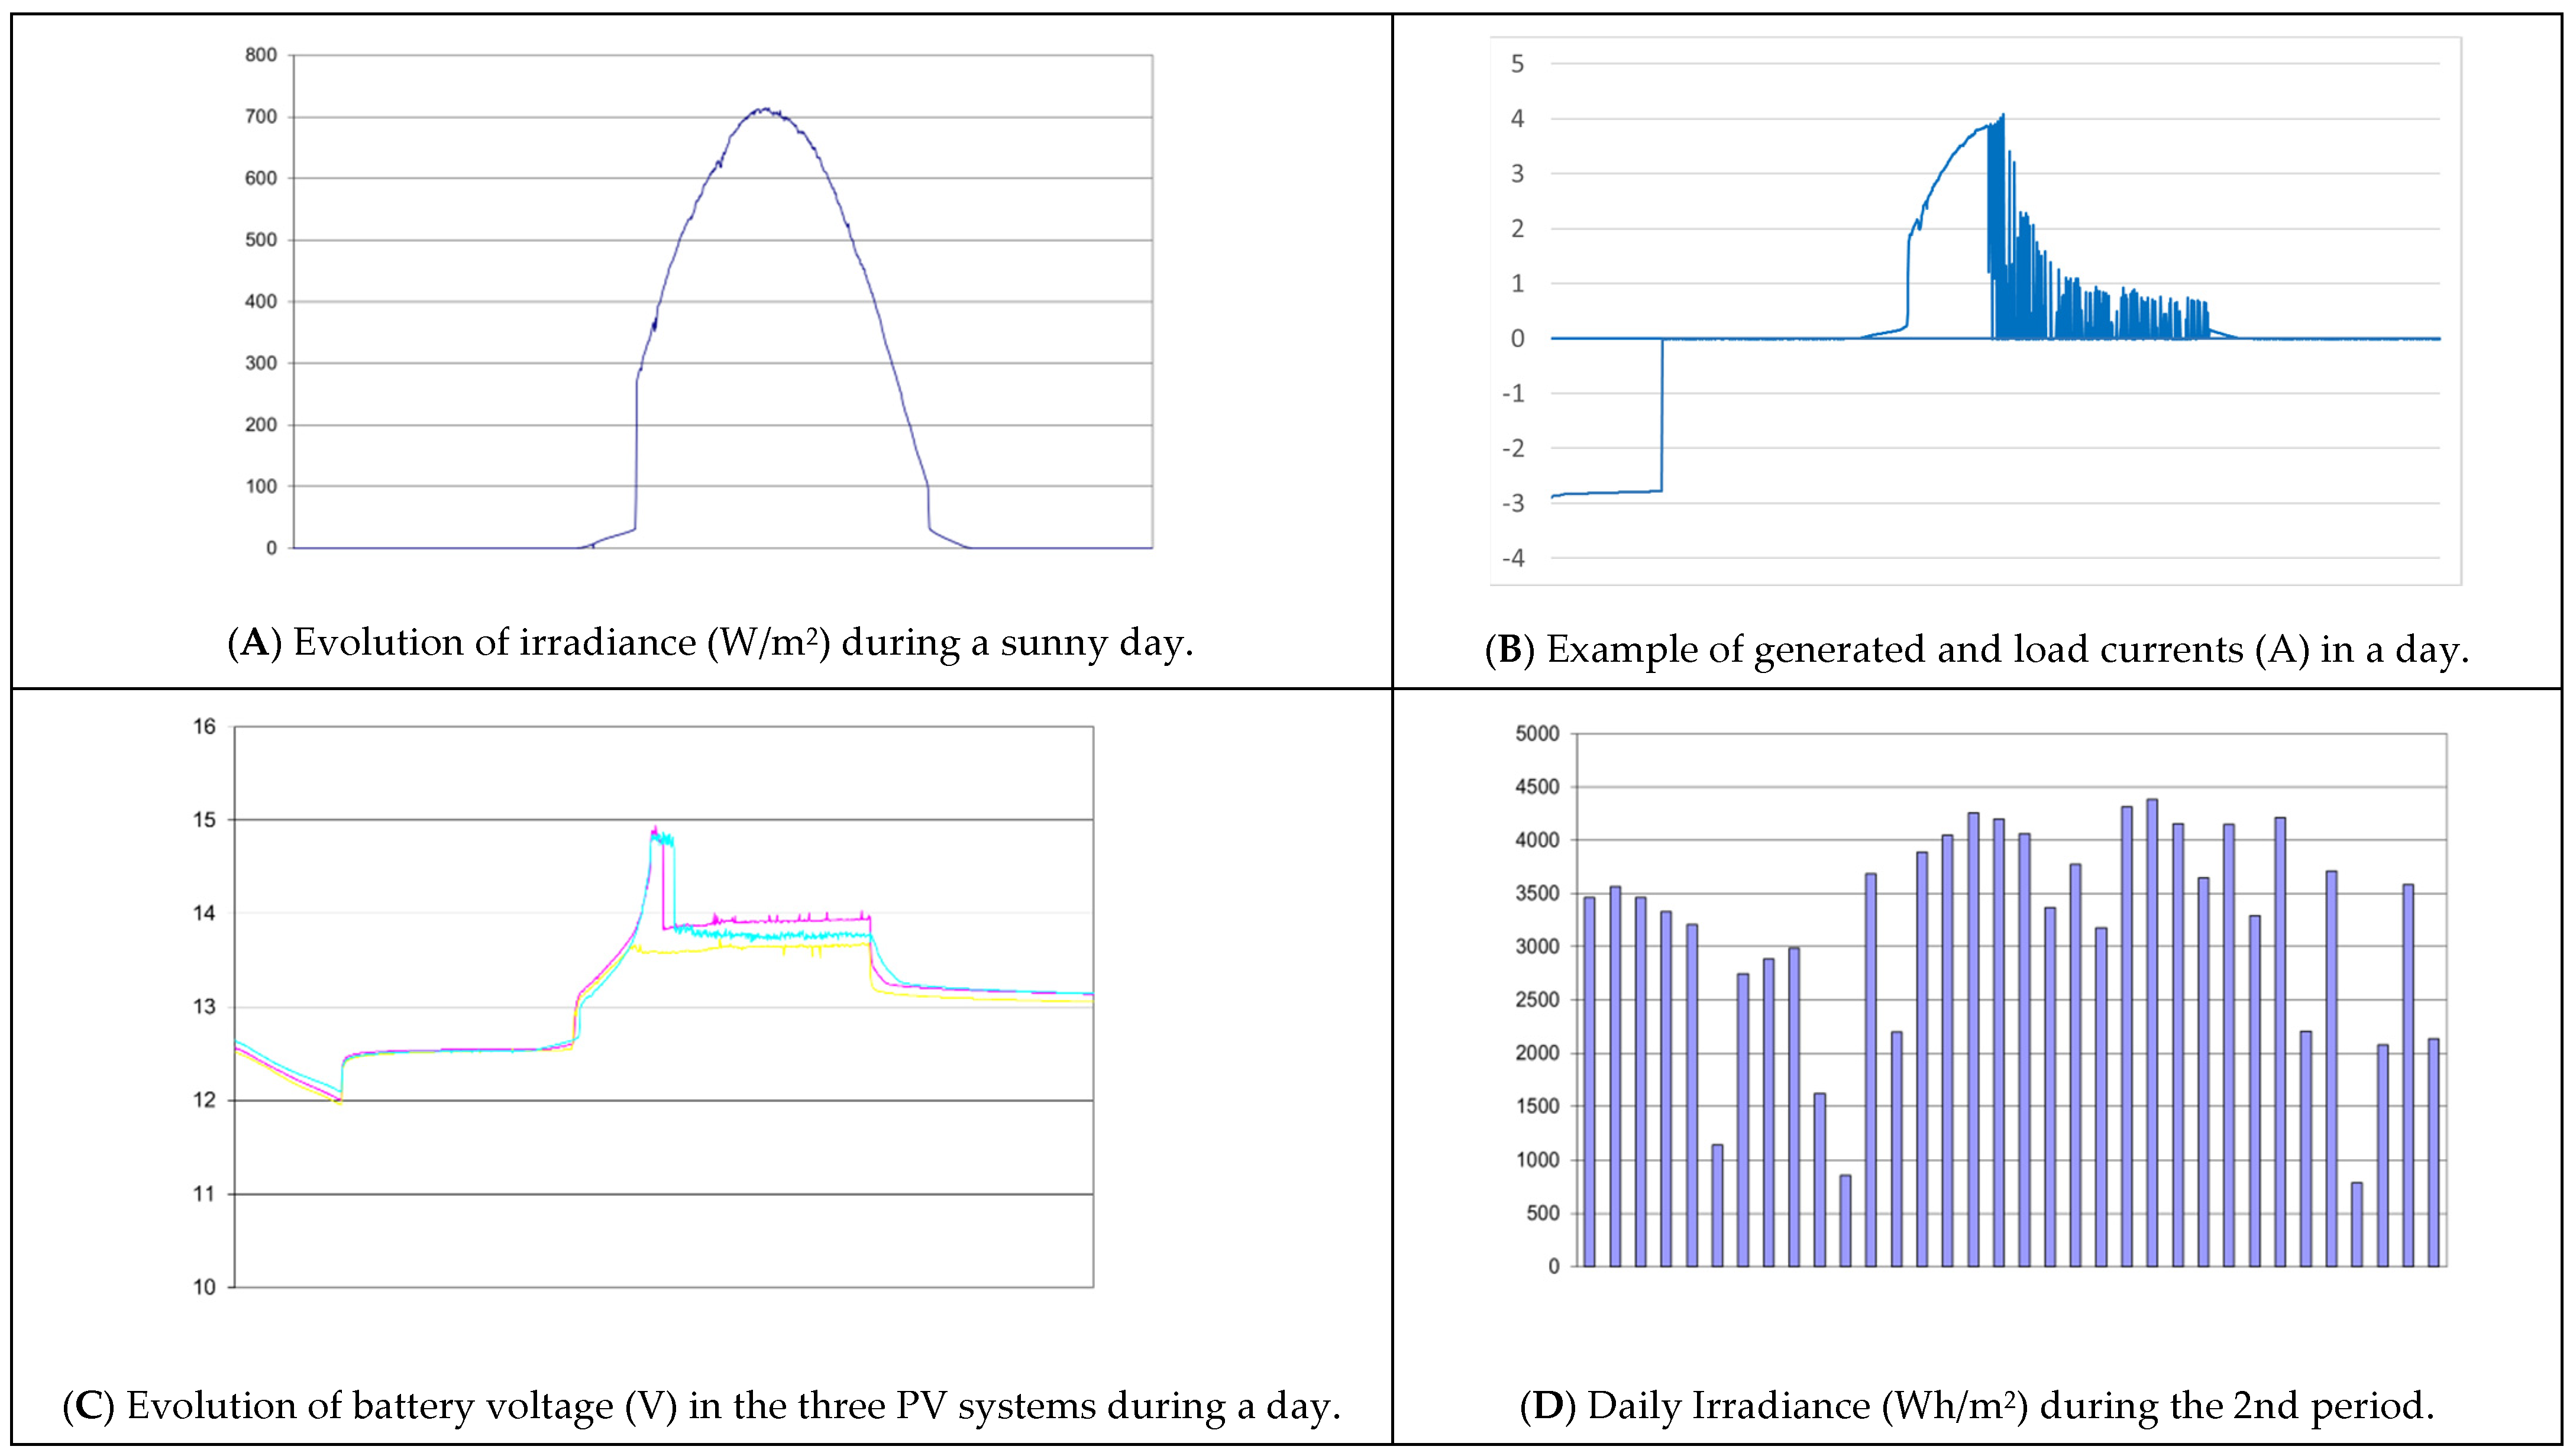
4.1.2. Description of the Experiments
- (1)
- Initial test of battery capacity; and
- (2)
- For each one of three periods,
- (2.1)
- Complete charge of batteries;
- (2.2)
- Period of daily charge and discharge cycles (approximately 30 days);
- (2.3)
- Test of battery capacity.
4.1.3. Comparative Results
4.2. Knowledge-Based Battery Controller for IoT Devices
4.2.1. Performance of FRBS Adapted to Resource-Constrained Devices
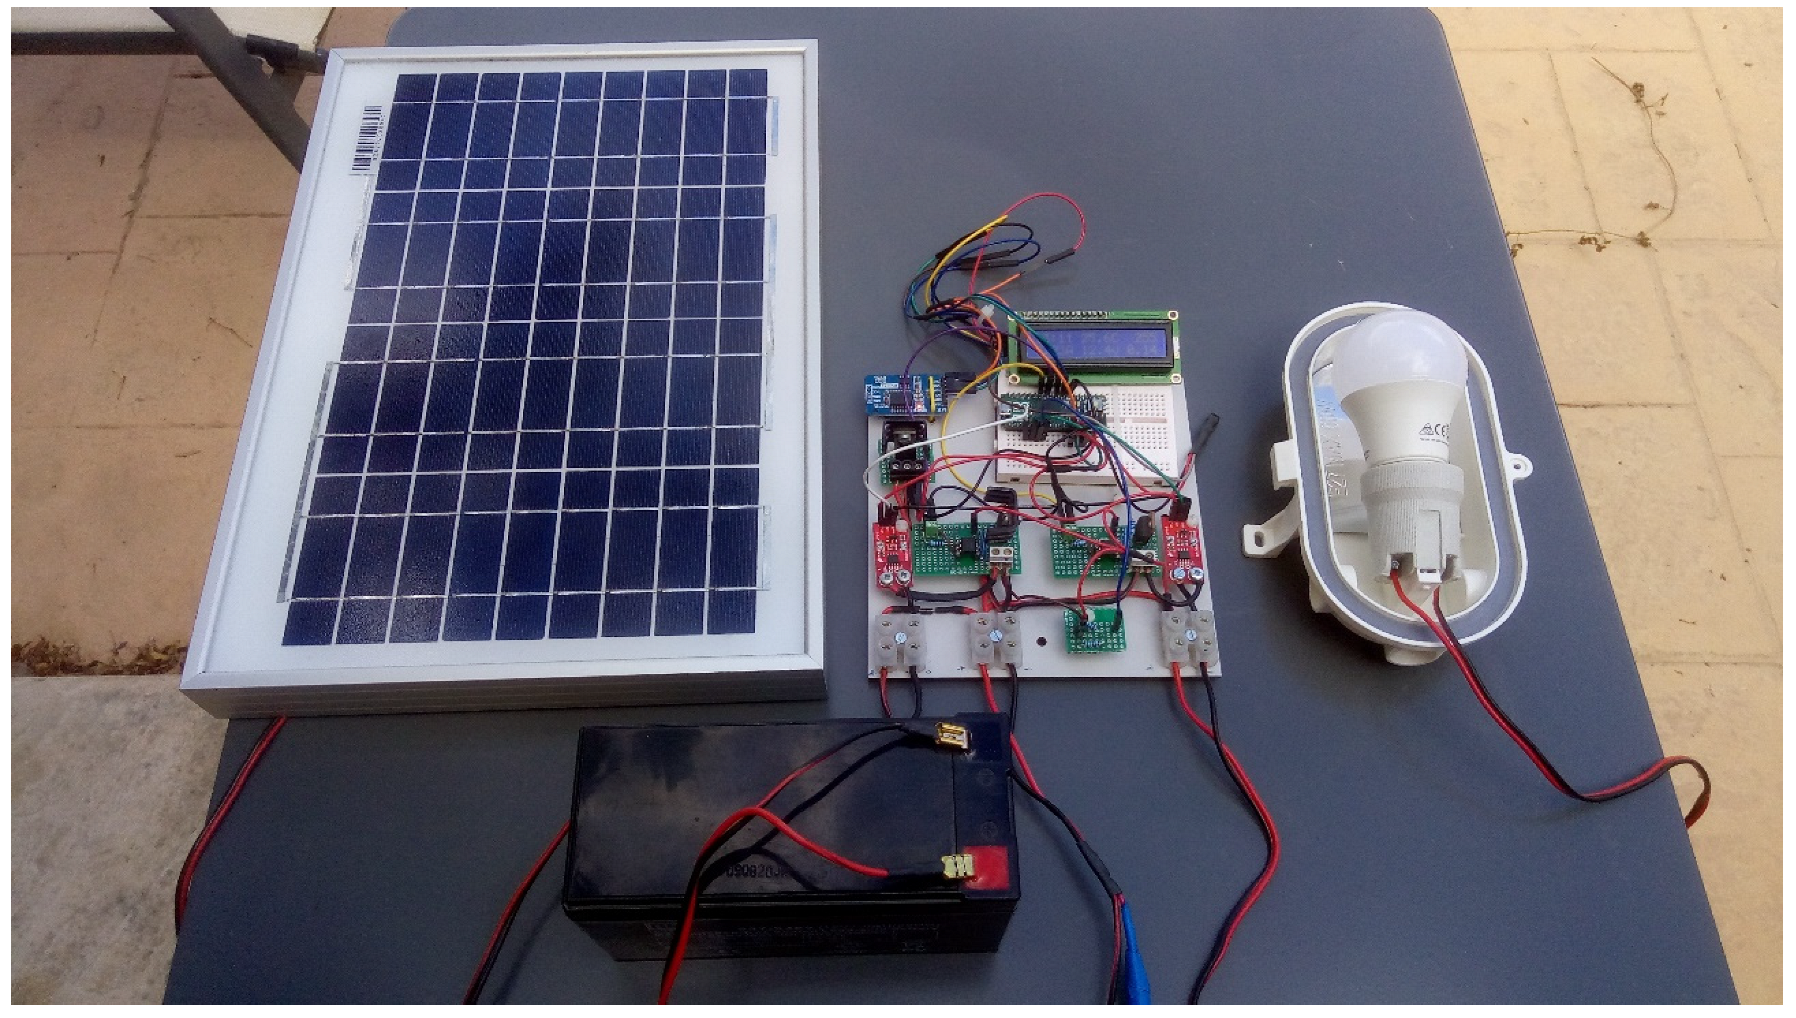
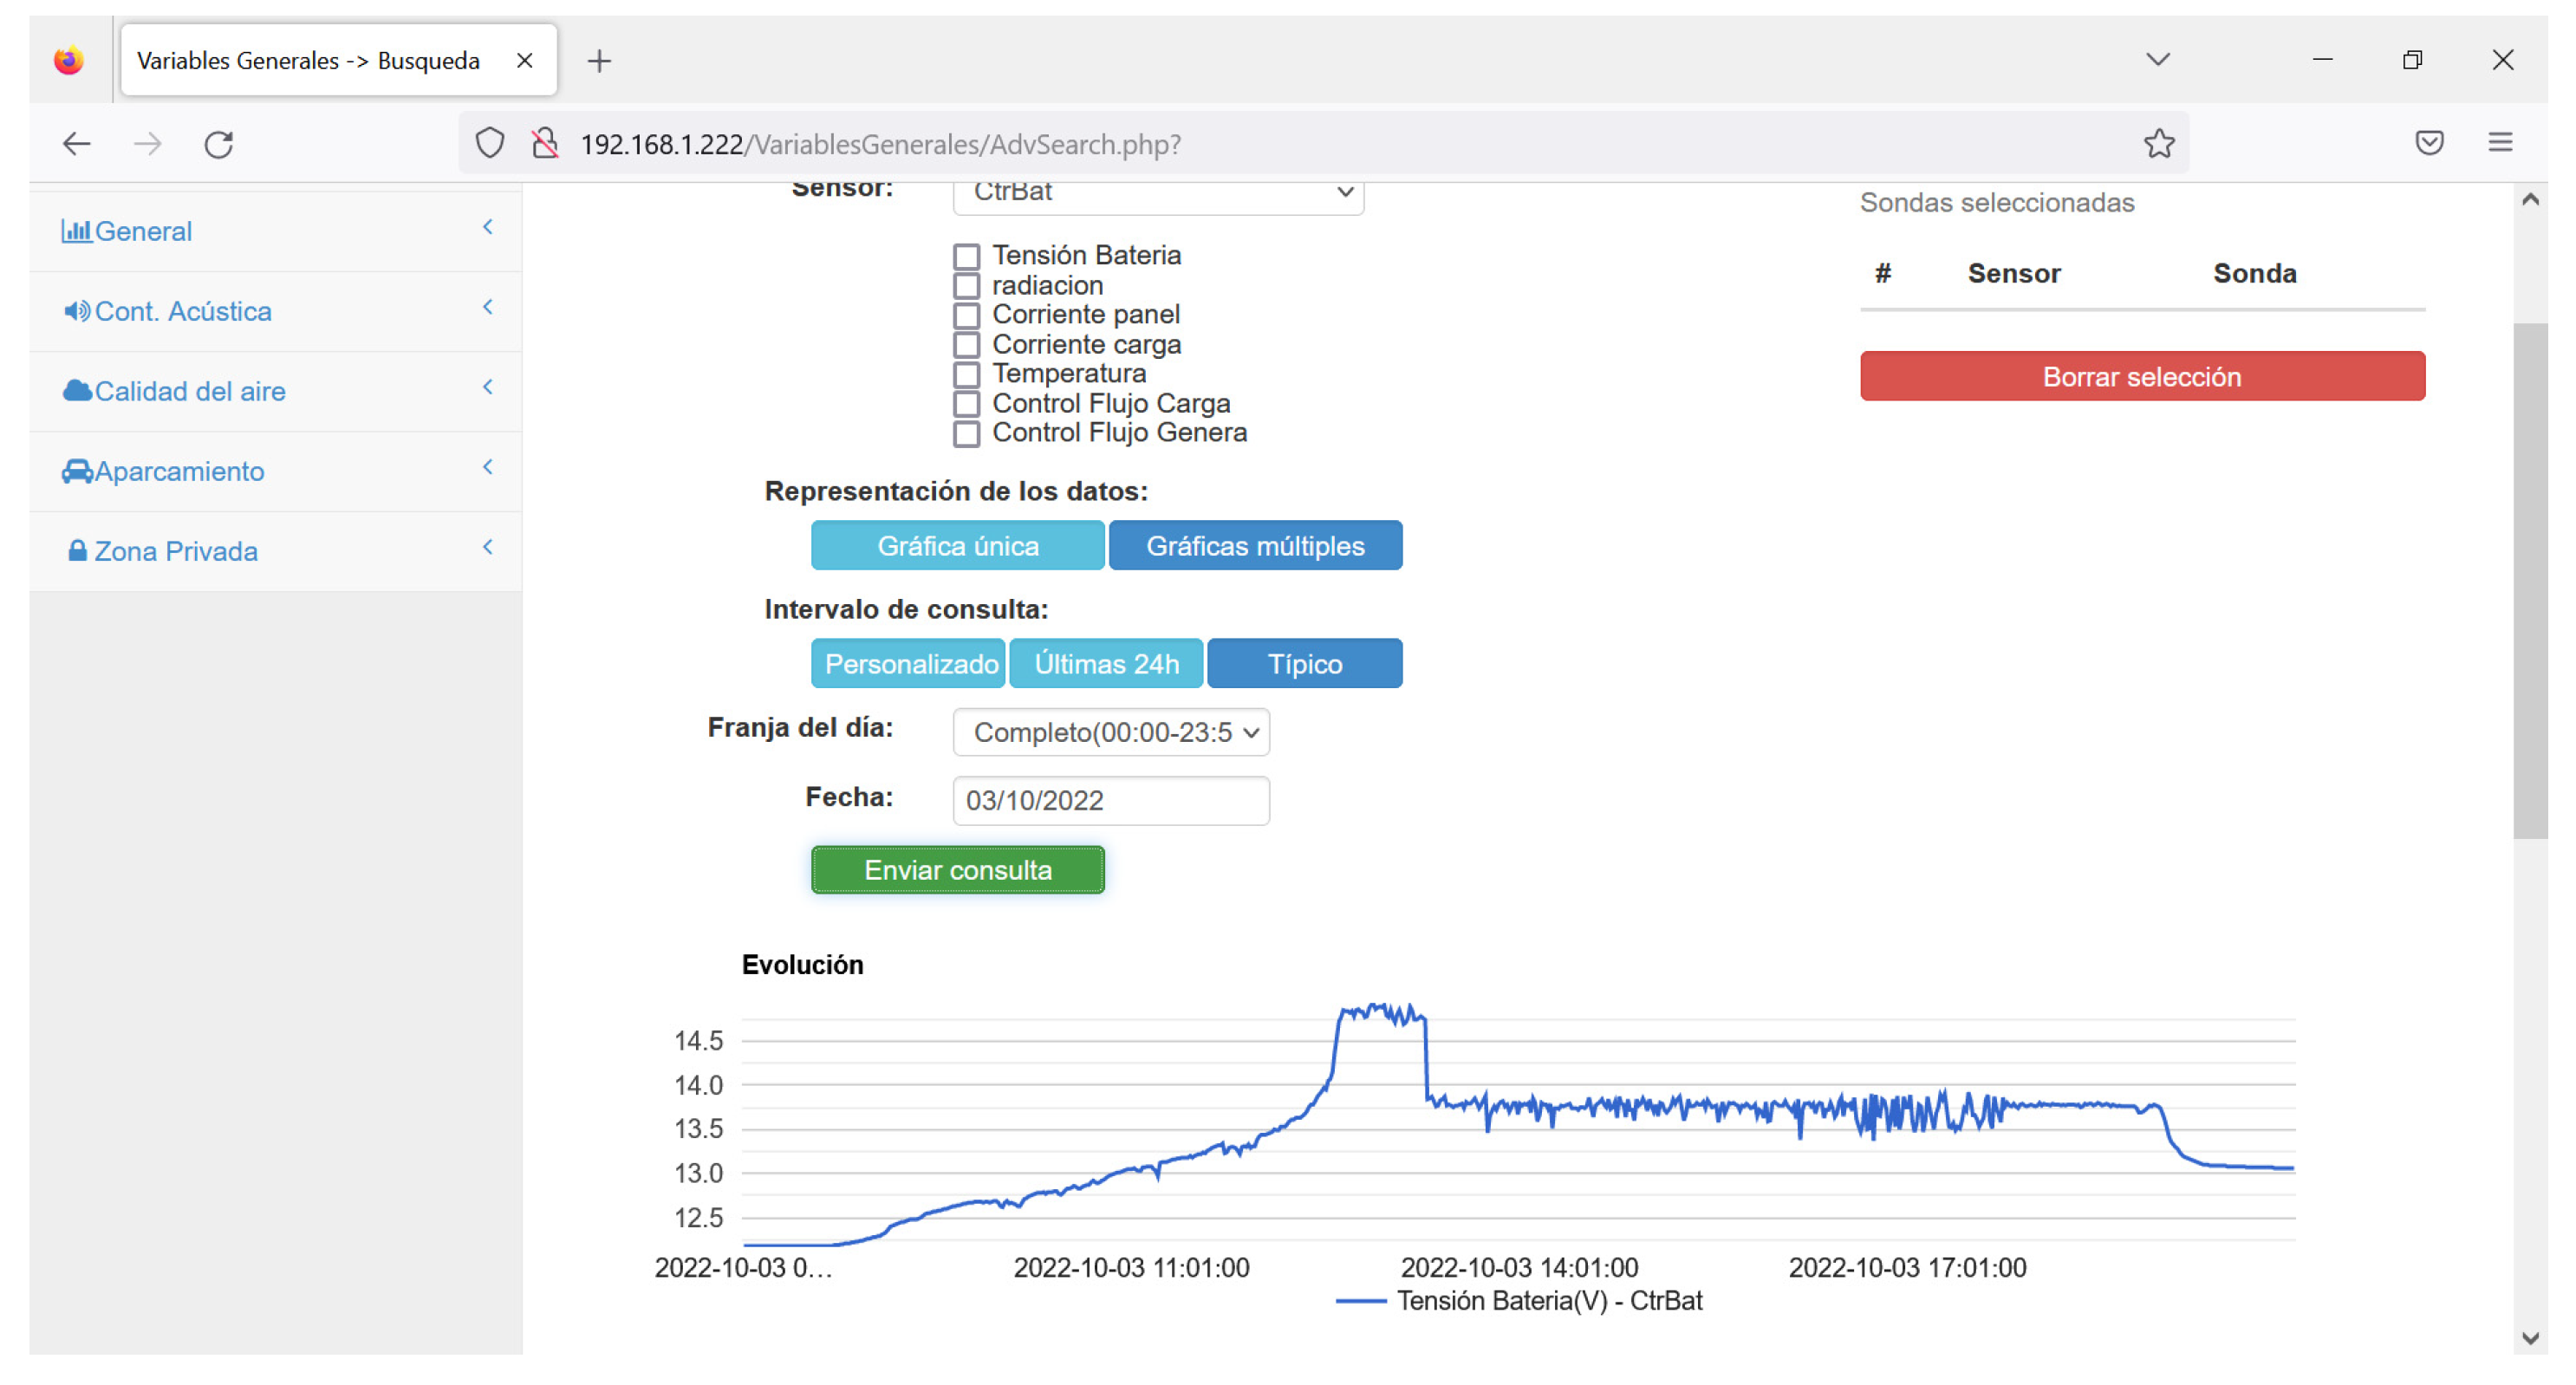
4.2.2. Description of the IoT Application
- One PV module (nominal power of 10 W ± 3% at standard conditions: 1000 W/m2 irradiance at a spectral distribution of air mass (AM) 1.5 and a 25 °C PV cell);
- One 12 V 7 Ah battery;
- One 3 W 270 lumen LED bulb;
- One I2C RTC and I2C LCD display;
- Sensors (electrical current, temperature) and charge and discharge actuator based on FETs.
5. Conclusions and Future Work
Author Contributions
Funding
Data Availability Statement
Conflicts of Interest
Abbreviations
| AI | artificial intelligence |
| Age | age of battery |
| AST | absorption stage time |
| CoAP | constrained application protocol |
| CPU | central processing unit |
| DB | data base |
| DC | direct current |
| DOD | depth of discharge |
| FET | field effect transistor |
| FIgen | flow of current generated |
| FITA | first infer then aggregate |
| FLoa | flow of current in the load |
| FL | fuzzy logic |
| FRBS | fuzzy rule based system |
| HTTP | hypertext transfer protocol |
| Igen | current generated by PV generator |
| Iloa | current consumption in the load |
| Incre | increment of regulation voltage |
| IoT | internet of things |
| KB | knowledge base |
| LCD | liquid cristal display |
| LoRa | long range modulation |
| LoRaWAN | long range modulation wide area networks |
| MPTT | maximum power point tracking |
| MQTT | message queue telemetry transport |
| PDOD | previous clicle depth of discharge |
| PWM | pulse width modulation |
| PV | photovoltaic |
| RTC | real-time clock |
| RB | rule base |
| SOC | state of charge |
| Temp | battery temperature |
| Vbat | battery voltage |
| Vobj | voltage objective |
| Vreg | regulation voltage |
| %AS | percentage of absortion stage |
References
- Madakam, S.; Ramaswamy, R.; Tripathi, S. Internet of Things (IoT): A Literature Review. J. Comput. Commun. 2015, 3, 164–173. [Google Scholar] [CrossRef] [Green Version]
- Kumar, L.; Alexander, S.; Rajendran, M. Power Electronic Converters for Solar Photovoltaic Systems; Elsevier: Amsterdam, The Netherlands; Academic Press: Cambridge, MA, USA, 2021. [Google Scholar] [CrossRef]
- Cordón, O.; Herrera, F.; Hoffmann, F.; Magdalena, L. Genetic Fuzzy Systems: Evolutionary Tunning and Learning of Fuzzy Knowledge Bases; World Scientific: Singapore, 2001; Volume 141. [Google Scholar]
- Buyya, R.; Dastjerdi, A. Internet of Thing. Principles and Paradigms; Elsevier: Amsterdam, The Netherlands, 2016. [Google Scholar]
- Stallings, W. Foundations of Modern Networking: SDN, NFV; QoE, IoT and Cloud; Addison-Wesley Proffesional: Boston, MA, USA, 2015. [Google Scholar]
- Al-Fuqaha, A.; Guizan, M.; Mohammadi, M.; Aledhari, M.; Ayyash, M. Internet of Things: A survey on enabling technologies, protocols and applications. IEEE Commun. Surv. Tutor. 2015, 17, 2347–2376. [Google Scholar] [CrossRef]
- MQTT. Available online: http://mqtt.org/ (accessed on 24 September 2022).
- I.E.T.F. (IETF). The Constrained Application Protocol (CoAP). Available online: https://tools.ietf.org/html/rfc7252 (accessed on 24 September 2022).
- Openstack. Available online: https://www.openstack.org/ (accessed on 24 September 2022).
- Proxmox. Available online: https://www.proxmox.com/en/ (accessed on 24 September 2022).
- Hao, Z.; Novak, E.; Yi, S.; Li, Q. Challenges and Software Architecture for Fog Computing. IEEE Internet Comput. 2017, 21, 44–53. [Google Scholar] [CrossRef]
- Hu, P.; Dhelim, S.; Ning, H.; Qiu, T. Survey on fog computing: Architecture, key technologies, applications and open issues. J. Netw. Comput. Appl. 2017, 98, 27–42. [Google Scholar] [CrossRef]
- Raj, A.; Steingart, D. Power sources for the Internet of Things. J. Electrochem. Soc. 2018, 165, B3130–B3136. [Google Scholar] [CrossRef]
- Zhang, W.; Sheng, Q.A.; Mahmood, Z.; Tran, D.H.; Zaib, M.; Hamad, S.A.; Aljubairy, A.; Alhazmi, A.; Sagar, S.; Ma, C. The 10 Research Topics in the Internet of Things. In Proceedings of the IEEE 6th International Conference on Collaboration and Internet Computing (CIC), Atlanta, GA, USA, 1–3 December 2020. [Google Scholar] [CrossRef]
- Satpathy, R.; Pamuru, V. Solar PV System. Design, Manufacturing and Applications from Sand to Systems; Acadamic Press: Cambridge, MA, USA, 2021. [Google Scholar]
- Madeti, S.; Singh, S. Monitoring system for photovoltaic plants: A review. Renew. Sustain. Energy Rev. 2017, 67, 1180–1207. [Google Scholar] [CrossRef]
- Bendib, B.; Belmili, H.; Krim, F. A survey of the most used MPPT methods: Conventional and advanced algorithms applied for photovoltaic systems. Renew. Sustain. Energy Rev. 2015, 45, 637–648. [Google Scholar] [CrossRef]
- Rezk, H.; Eltamaly, A. A comprehensive comparison of different MPPT techniques for photovoltaic systems. Sol. Energy 2015, 112, 1–11. [Google Scholar] [CrossRef]
- Zadeh, A. Fuzzy Sets. Inf. Control 1965, 8, 338–353. [Google Scholar] [CrossRef] [Green Version]
- Mamdani, E. Application of fuzzy algorithms for control of simple dynamic plant. Proc. Inst. Electr. Eng. 1974, 121, 1585–1588. [Google Scholar] [CrossRef]
- Mamdani, E.; Assilian, S. An experiment in linguistic synthesis with a fuzzy logic controller. Int. J. Man Mach. Stud. 1975, 7, 1–13. [Google Scholar] [CrossRef]
- Takagi, T.; Sugeno, M. Fuzzy Identification of Systems and Its Applications to Modeling and Control. IEEE Trans. Syst. Man Cybern. 1985, SMC-15, 116–132. [Google Scholar] [CrossRef]
- Lopez-Vargas, A.; Fuentes, M.; Vivar, M. IoT Application for Real-Time Monitoring of Solar Home Systems Based on Arduino™ With 3G Connectivity. IEEE Sens. J. 2019, 19, 679–691. [Google Scholar] [CrossRef]
- Kumar, N.; Atluri, K.; Palaparthi, S. Internet of Things (IoT) in PV Systems. In Proceedings of the 2018 National Power Engineering Conference (NPEC), Madurai, India, 9–10 March 2018. [Google Scholar] [CrossRef]
- Lopez-Vargas, A.; Fuentes, M.; Vivar, M. On the application of IoT for real-time monitoring of small stand-alone PV systems: Results from a new smart datalogger. In Proceedings of the 2018 IEEE 7th World Conference on Photovoltaic Energy Conversion (WCPEC), Waikoloa, HI, USA, 29 November 2018. [Google Scholar] [CrossRef]
- Hamied, A.; Melli, A.; Zoulid, M.; Birouk, R. IoT-based experimental prototype for monitoring of photovoltaic arrays. In Proceedings of the 2018 International Conference on Applied Smart Systems (ICASS), Medea, Algeria, 24–25 November 2018. [Google Scholar] [CrossRef]
- González, I.; Portalo, J.; Calderón, A. Configurable IoT Open-Source Hardware and Software I-V Curve Tracer for Photovoltaic Generators. Sensors 2021, 21, 7650. [Google Scholar] [CrossRef] [PubMed]
- Vermesan, O. Internet of Things. Strategic Research Roadmap, European Commission. 2009. Available online: http://www.internet-of-things-research.eu/pdf/IoT_Cluster_Strategic_Research_Agenda_2009.pdf (accessed on 24 September 2022).
- Vermesan, V.; Friess, P. Internet of Things: Converging Technologies for Smart Environments and Integrated Ecosystems; River Publishers: Gistrup, Denmark, 2013. [Google Scholar]
- Bago, J.; Galan, S.G.; Aguilera, J.; Perez, J.R.V.; Layos, L.M. Fuzzy controller applications in stand-alone PV system. Mathware 2002, IX, 85–115. [Google Scholar]
- Pachauri, R.K.; Pandey, J.K.; Sharma, A.; Nautiyal, O.P.; Ram, M. Applied Soft Computing and Embedded System Applications in Solar Energy; Taylolr & Francis: London, UK; CRC Press: Boca Raton, FL, USA, 2021. [Google Scholar]
- Shaw, R.; Mendis, M.; Mekhilef, S.; Ghosh, A. AI and IOT in Renewable Energy; Springer: Berlin/Heidelberg, Germany, 2021. [Google Scholar]
- Shiau, J.; Wei, Y.; Chen, B. A Study on the Fuzzy-Logic-Based Solar Power MPPT Algorithms Using Different Fuzzy Input Variables. Algoritms 2015, 8, 100–127. [Google Scholar] [CrossRef]
- Fannakh, M.; Elhafyani, M.; Zougar, S. Hardware implementation of the fuzzy logic MPPT in an Arduino card using a Simulink support package for PV application. IET Renew. Power Gener. 2019, 13, 510–518. [Google Scholar] [CrossRef]
- Shaw, R.; Ghosh, A.; Mekhilef, S.; Balas, V. Applications of AI and IOT in Renewable Energy; Elsevier: Amsterdam, The Netherlands, 2022. [Google Scholar]
- Canada-Bago, J.; Fernandez-Prieto, J.A.; Perez-Higueras, P.; Gadeo-Martos, M. Knowledge-Based Sensors for Controlling A High-Concentration Photovoltaic Tracker. Sensors 2020, 20, 1315. [Google Scholar] [CrossRef] [PubMed] [Green Version]
- Mellit, A.; Kalogirou, S. Artificial intelligence and internet of things to improve efficacy of diagnosis and remote sensing of solar photovoltaic systems: Challenges, recommendations and future directions. Renew. Sustain. Ennergy Rev. 2021, 143, 110889. [Google Scholar] [CrossRef]


| Σ(Iloa·t) (Ah) | Σ(Igen·t) (Ah) | η (%) | R (Ω) | Capacity of Battery | ||||||
|---|---|---|---|---|---|---|---|---|---|---|
| Initial | Final | Initial (Ah) | 1st Period (Ah) | 2nd Period (Ah) | Final (Ah) | Final/Initial (%) | ||||
| Basic | 566.49 | 585.23 | 0.967 | 0.159 | 0.239 | 40.66 | 14.26 | 5.50 | 2.18 | 5.36 |
| Commercial | 648.48 | 680.41 | 0.953 | 0.116 | 0.119 | 56.48 | 26.82 | 16.03 | 10.40 | 18.41 |
| FRBS | 659.24 | 678.42 | 0.971 | 0.153 | 0.158 | 45.47 | 27.04 | 15.87 | 10.21 | 22.45 |
| Σ(Iloa·t) (Ah) | Σ(Igen·t) (Ah) | η (%) | R (Ω) | Capacity of Battery | ||||||
|---|---|---|---|---|---|---|---|---|---|---|
| Initial | Final | Initial (Ah) | 1st Period (Ah) | 2nd Period (Ah) | Final (Ah) | Final/Initial (%) | ||||
| Basic | 1021.26 | 1040.38 | 0.982 | 0.114 | 0.119 | 63.80 | 48.50 | 47.20 | 42.90 | 67.24 |
| Commercial | 1053.53 | 1099.21 | 0.958 | 0.100 | 0.110 | 68.70 | 55.60 | 52.80 | 47.90 | 69.72 |
| FRBS | 1042.25 | 1069.73 | 0.974 | 0.136 | 0.142 | 64.20 | 49.00 | 46.50 | 46.00 | 71.75 |
| Device | Consumption (9vDC) | Knowledge Base | Inferences/sg | Reaction Time |
|---|---|---|---|---|
| Arduino MEGA 2560 | 78 mA | 24 rules 3 input variables | 71 | 14 ms |
| 4 rules 2 input variables | 550 | 1.8 ms | ||
| Arduino Micro | 30mA | 24 rules 3 input variables | 74 | 13.5 ms |
| 4 rules 2 input variables | 550 | 1.8 ms | ||
| Arduino DUE | 70 mA | 24 rules 3 input variables | 500 | 2 ms |
| 4 rules 2 input variables | 2000 | 0.5 ms |
Publisher’s Note: MDPI stays neutral with regard to jurisdictional claims in published maps and institutional affiliations. |
© 2022 by the authors. Licensee MDPI, Basel, Switzerland. This article is an open access article distributed under the terms and conditions of the Creative Commons Attribution (CC BY) license (https://creativecommons.org/licenses/by/4.0/).
Share and Cite
Canada-Bago, J.; Fernandez-Prieto, J.-A. A Knowledge-Based Battery Controller for IoT Devices. J. Sens. Actuator Netw. 2022, 11, 76. https://doi.org/10.3390/jsan11040076
Canada-Bago J, Fernandez-Prieto J-A. A Knowledge-Based Battery Controller for IoT Devices. Journal of Sensor and Actuator Networks. 2022; 11(4):76. https://doi.org/10.3390/jsan11040076
Chicago/Turabian StyleCanada-Bago, Joaquin, and Jose-Angel Fernandez-Prieto. 2022. "A Knowledge-Based Battery Controller for IoT Devices" Journal of Sensor and Actuator Networks 11, no. 4: 76. https://doi.org/10.3390/jsan11040076