Article

The Ethylene Biosynthesis Genes ACS2 and ACS6 Modulate Disease Severity of Verticillium dahliae

by
Eirini G. Poulaki
1,
Maria-Dimitra Tsolakidou
2,
Danai Gkizi
1,
Iakovos S. Pantelides
2 and
Sotirios E. Tjamos
1,*
1
Laboratory of Phytopathology, Agricultural University of Athens, 75 Iera Odos, 11855 Athens, Greece
2
Department of Agricultural Sciences, Biotechnology and Food Science, Cyprus University of Technology, 30 Arch. Kyprianos Str., Limassol 3036, Cyprus
*
Author to whom correspondence should be addressed.
Plants 2020, 9(7), 907; https://doi.org/10.3390/plants9070907
Submission received: 7 July 2020 / Accepted: 16 July 2020 / Published: 17 July 2020
(This article belongs to the Special Issue Management of Verticillium Wilt Disease)

Abstract

:
Verticillium dahliae is one of the most destructive soilborne plant pathogens since it has a broad host range and there is no chemical disease management. Therefore, there is a need to unravel the molecular interaction between the pathogen and the host plant. For this purpose, we examined the role of 1-aminocyclopropane-1-carboxylic acid synthases (ACSs) of Arabidopsis thaliana upon V. dahliae infection. We observed that the acs2, acs6, and acs2/6 plants are partially resistant to V. dahliae, since the disease severity of the acs mutants was lower than the wild type (wt) Col-0 plants. Quantitative polymerase chain reaction analysis revealed that acs2, acs6, and acs2/6 plants had lower endophytic levels of V. dahliae than the wt. Therefore, the observed reduction of the disease severity in the acs mutants is rather associated with resistance than tolerance. It was also shown that ACS2 and ACS6 were upregulated upon V. dahliae infection in the root and the above ground tissues of the wt plants. Furthermore, the addition of 1-aminocyclopropane-1-carboxylic acid (ACC) and aminooxyacetic acid (AOA), the competitive inhibitor of ACS, in wt A. thaliana, before or after V. dahliae inoculation, revealed that both substances decreased Verticillium wilt symptoms compared to controls irrespectively of the application time. Therefore, our results suggest that the mechanism underpinning the partial resistance of acs2 and acs6 seem to be ethylene depended rather than ACC related, since the application of ACC in the wt led to decreased disease severity compared to control.

1. Introduction

Verticillium dahliae Kleb. is one of the most destructive soil inhabiting fungal pathogens with a worldwide distribution, infecting a wide range of plants, including vegetables, fruits, flowers, oilseed crops, fiber crops, and woody perennials [1,2]. The disease management of V. dahliae is particularly difficult because the fungus survives in the soil as resting structures, microsclerotia, for several years [2], and there are no effective chemical treatments to control the disease. Therefore, it is essential to investigate the host plant–V. dahliae interaction in order to identify the key components that make this interaction disease compatible and develop resistant cultivars or chemical compounds interfering with the pathogenicity mechanisms.
Ethylene has been long implicated as a pathogenicity factor in the V. dahliae interaction with plants. The Verticillium symptoms of epinasty, stunting, premature senescence, and leaf abscission have been associated with ethylene (ET) [3,4]. Interestingly, the defective in ET perception Arabidopsis mutant etr1 is partially resistant to V. dahliae [5]. It has been shown that etr1 plants have lower Verticillium disease severity levels than wild type (wt). This observation was associated with reduced endophytic levels of V. dahliae DNA in the etr1 plants compared to wt [5]. On the other hand, the ET insensitive mutants ein2-1, ein4-1, and ein6-1 are more susceptible to V. dahliae than wt [5,6]. The ethylene response 1 (ETR1) and ethylene insensitive 4 (EIN4) are members of different subfamilies of ET receptors [7], while the ethylene insensitive 2 (EIN2), ethylene insensitive 3 (EIN3), and ethylene insensitive 5 (EIN5) genes are positive regulators of ET responses, acting downstream of ETR1, which acts as a negative regulator of ET; therefore, these differences may explain the different responses of etr1 and ein mutants to V. dahliae [6,7].
In contrast to the extensively studied responses of ethylene perception mutants upon V. dahliae infection, the interaction of ethylene biosynthesis mutants with Verticillum has not been reported yet. The rate-limiting step of ET synthesis in plants is the conversion of S-adenosyl-methionine (S-AdoMet) to 1-aminocyclopropane-1-carboxylic acid (ACC) by ACC synthase (ACS); therefore, to this day, the study of ACS has attracted much scientific attention [8,9,10,11]. ACS is encoded by a multigene family in every plant species examined [10]. The Arabidopsis genome contains 12 genes annotated as ACS (ACS1–12), dispersed among the five chromosomes [10]. The expression of the ACS genes in Arabidopsis is highly regulated by a variety of endogenous or environmental signals [11]. High-order ACS mutants with reduced ET induction are more susceptible to Pseudomonas syringae pv tomato than wt, demonstrating a positive role of ET in plant bacterial resistance [12]. High levels of ACS2 and ACS6 expression were observed, approximately 185- and 33-fold, respectively, at 6 h post-inoculation, in response to P. syringae pv tomato inoculation in Arabidopsis. However, ACS2 and ACS6 did not contribute to P. syringae pv tomato-induced ET production. The lack of ACS2/ACS6 contribution suggests that P. syringae pv tomato effector(s) might target these two ACS isoforms and impede their function either directly or indirectly [12]. Similarly, ACS2 and ACS6 are involved in Botrytis cinerea-induced ethylene production [13,14]. It is evident that ACS2 and ACS6 have a role in leaf invasion by necrotrophs. Therefore, it will be scientifically interesting to investigate their role in plant infection by a root invading fungus, like V. dahliae.
The main objectives of the study were to (i) screen the resistance of the Arabidospsis thaliana mutants acs2, acs6, acs1, and acs2/6 against V. dahliae, (ii) investigate whether the observed resistance of acs2, acs6, and acs2/6 is associated with reduced endophytic colonization by V. dahliae and vice versa for acs1, (iii) detect the expression of ACS2 and ACS6 in the root and above ground plant tissues of wild type (wt) Col-0 plants, upon pathogen invasion, and (iv) identify whether the observed resistance of acs2 and acs6 is due to low ACC or ethylene production.

2. Results

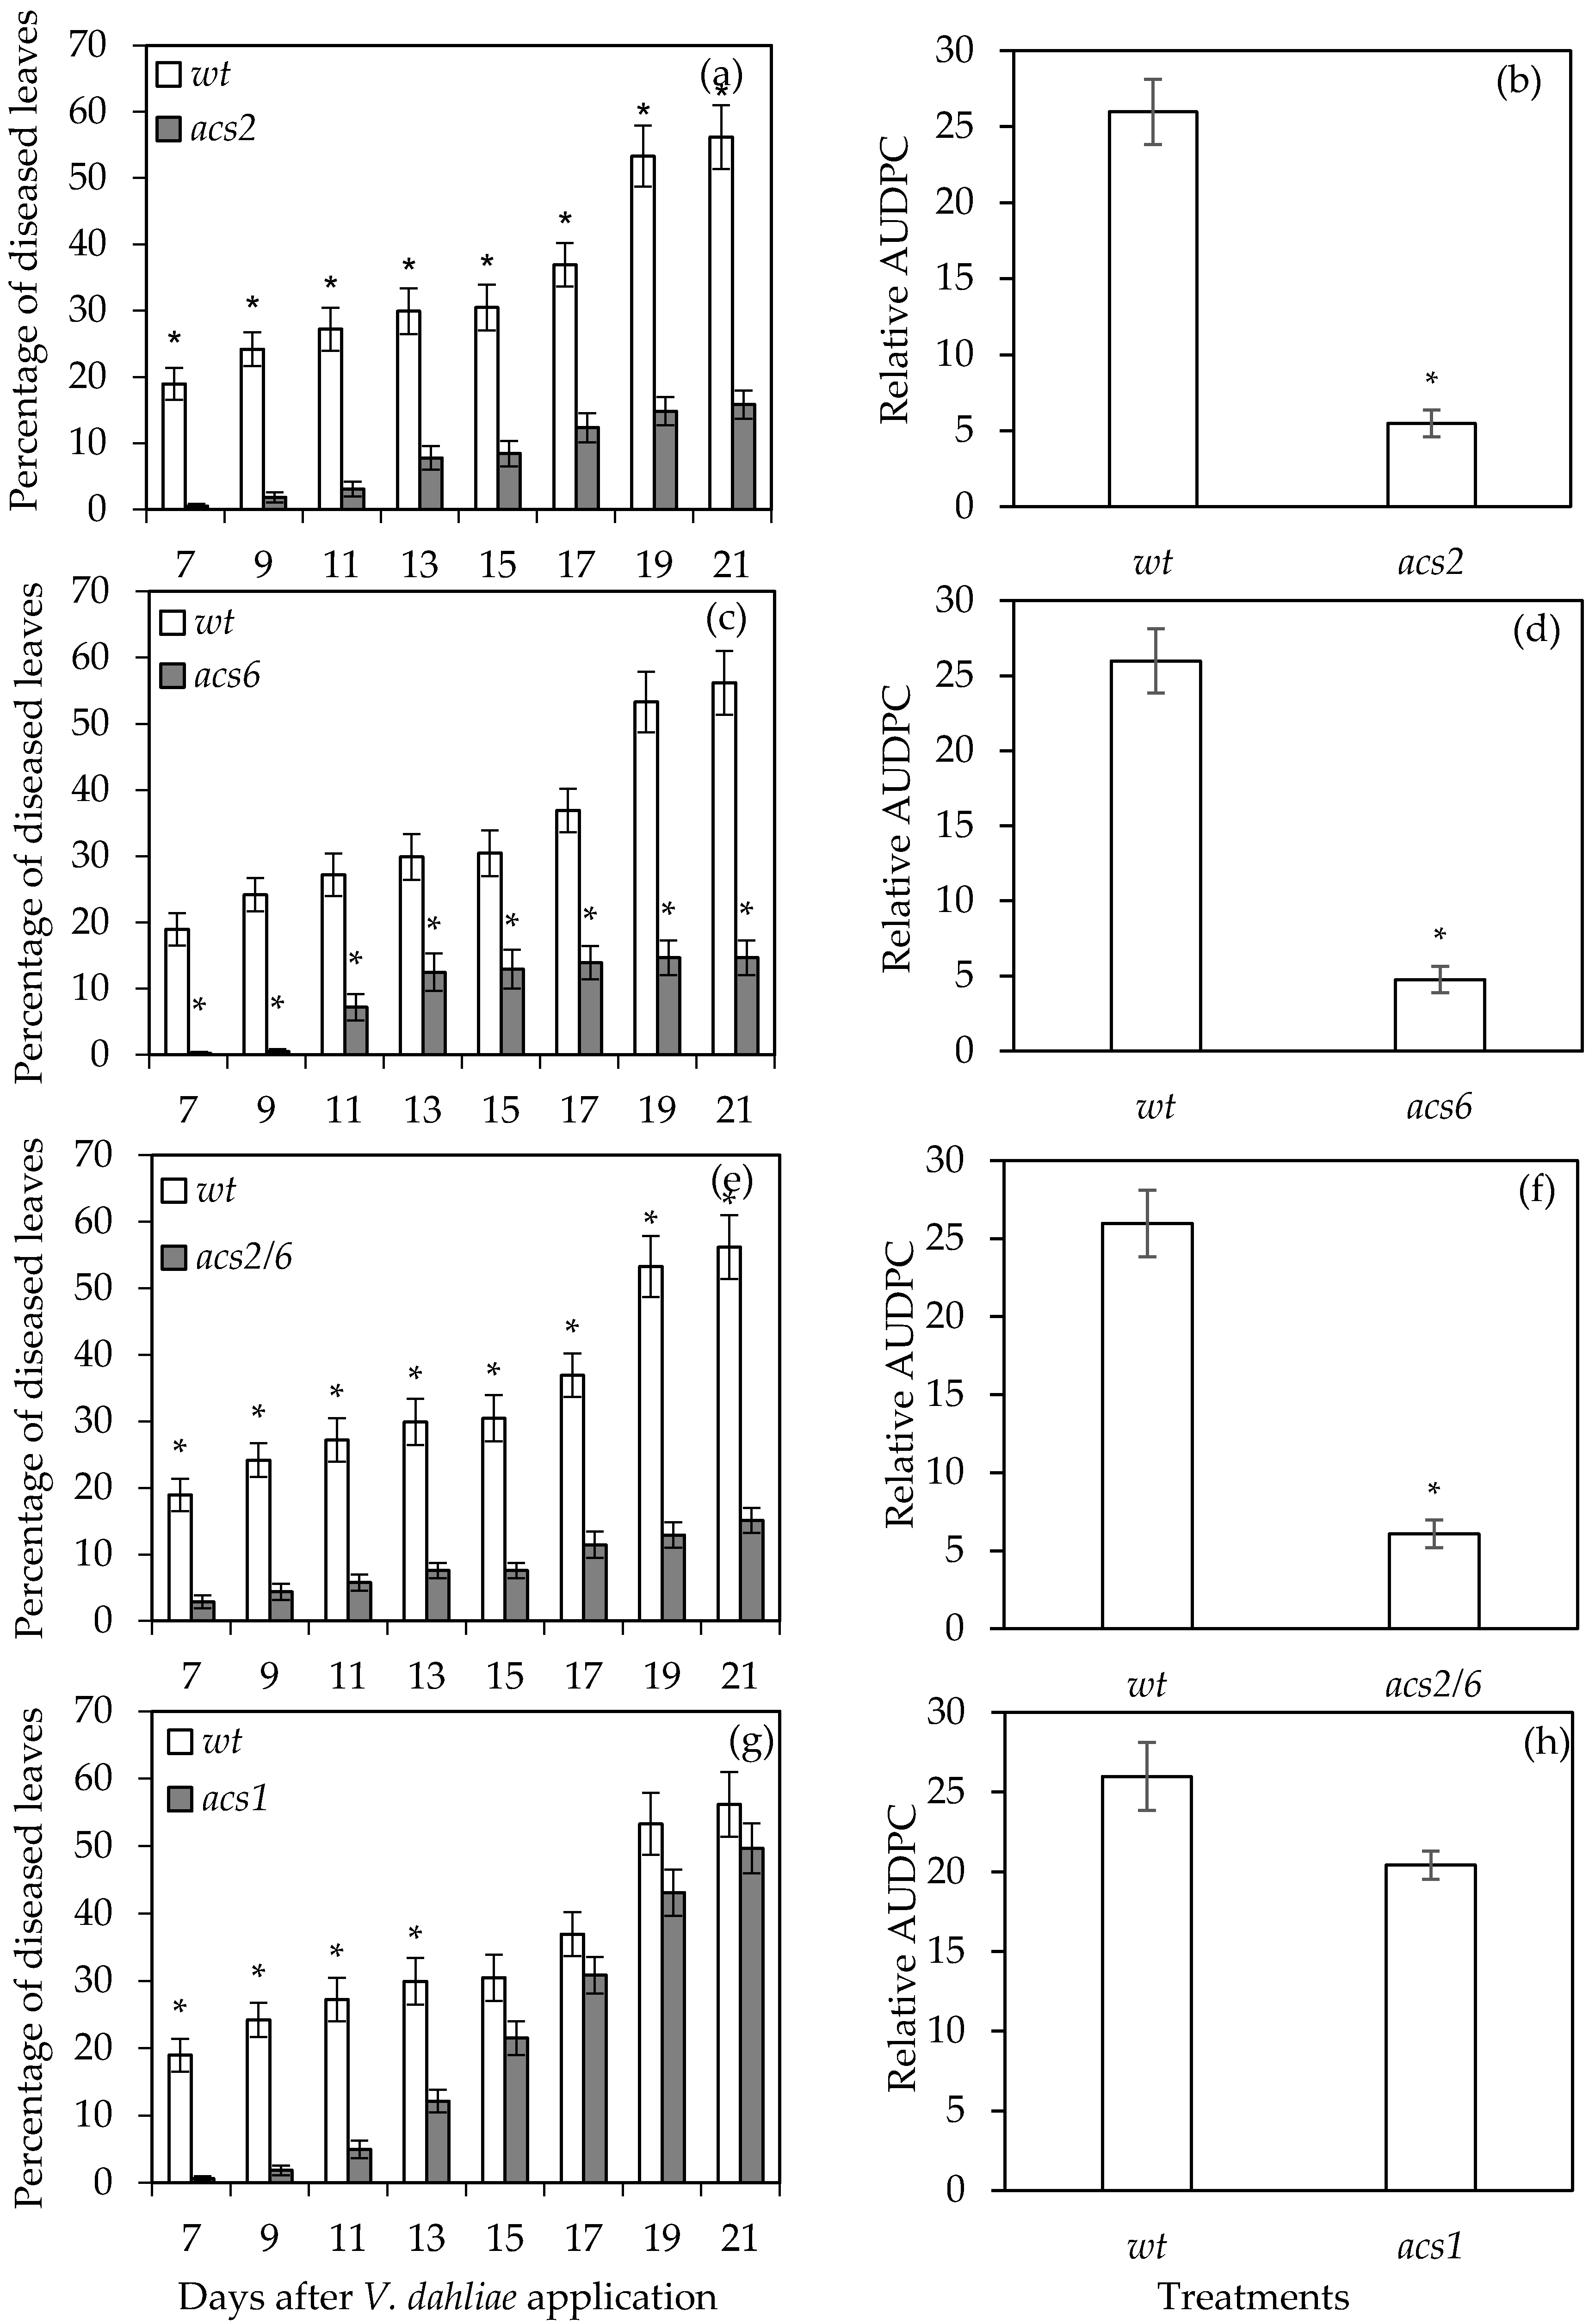
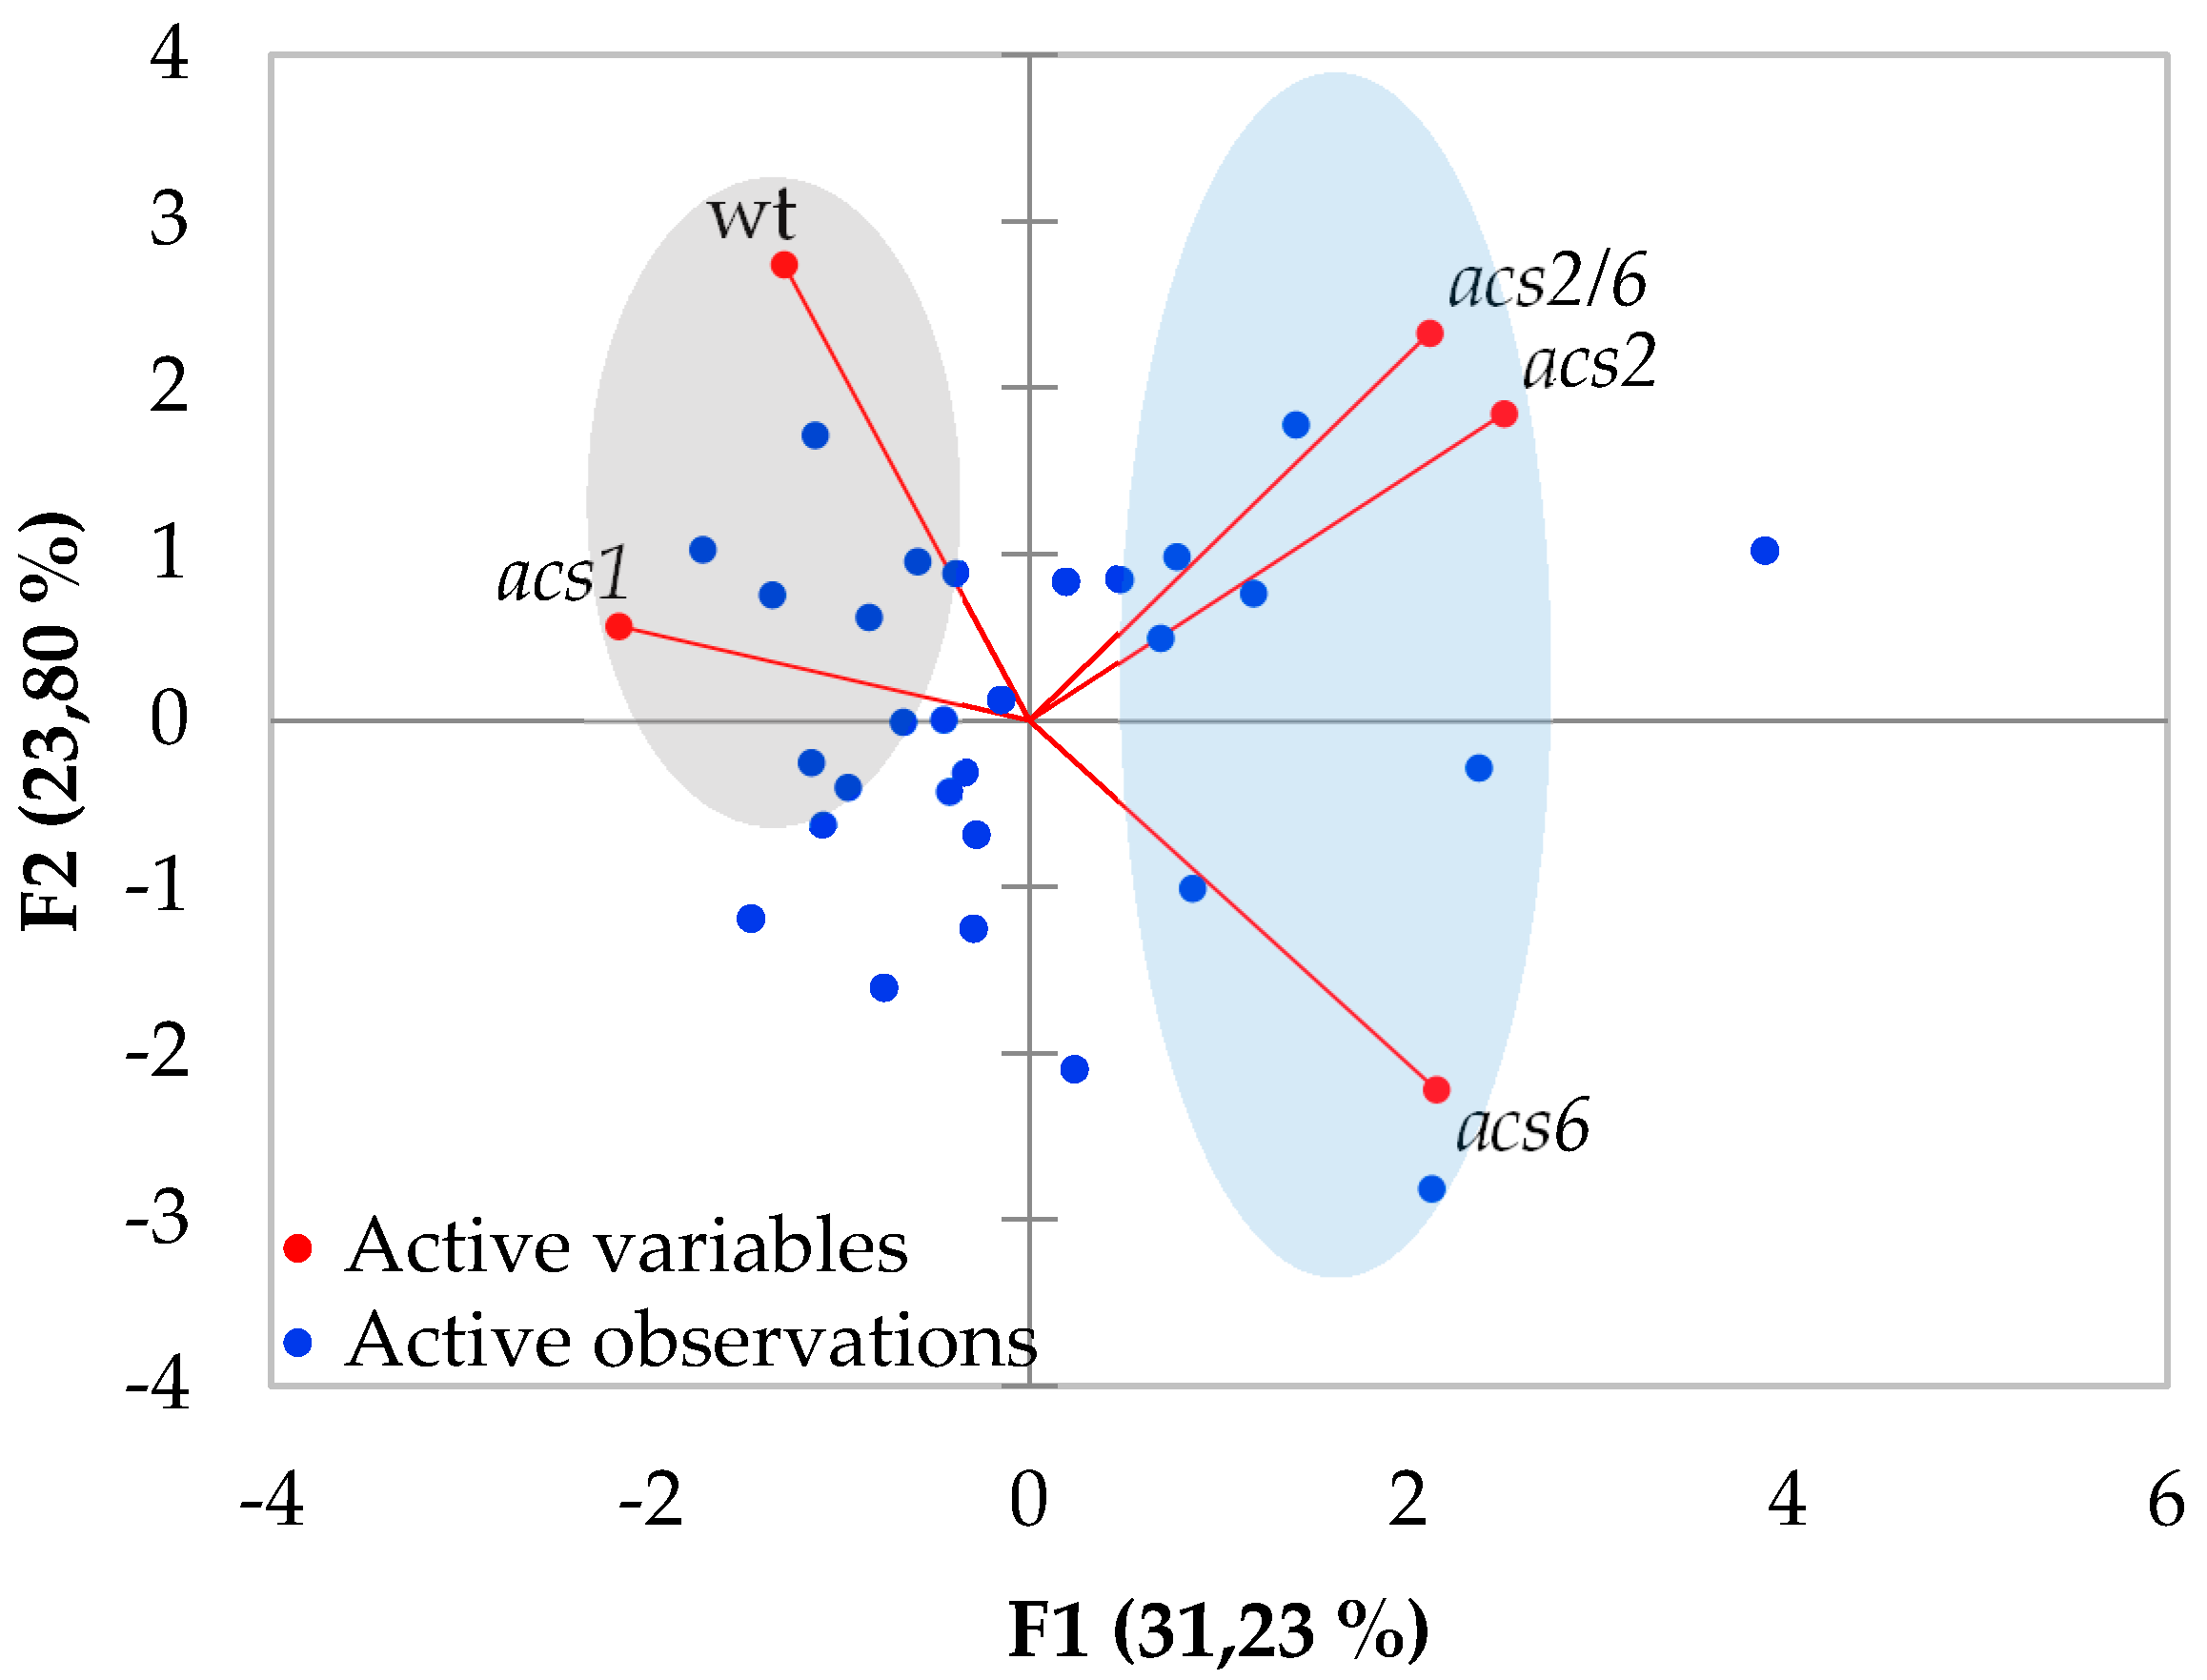
2.1. Verticillium Wilt Symptom Development

The inoculation of acs2, acs6, acs2/6, and acs1 with V. dahliae revealed the partial resistance of acs2, acs6, and acs2/6. The first symptoms appeared in the form of wilting, especially on older leaves at seven days post-inoculation (dpi), and were recorded until 21 dpi (Figure 1). The acs2, acs6, and acs2/6 displayed significantly less symptoms than wt throughout the experimental time period. At the final disease scoring day (21 dpi), the disease severity was ca. 15% in acs2, acs6, and acs2/6, while in the wt it was 56%. Consequently, statistical analysis on the relative area under the disease progress curve (AUDPC) values showed that disease severity in acs2, acs6, and acs2/6 was significantly less than in wt plants. A principal component analysis performed to show the effect of V. dahliae on the examined genotypes and based on the relative AUDPC values revealed that acs2 and acs2/6 were clustered separately from the acs6 along the axis describing the 23.8% of the variation (Figure 2). The acs6 was the most distantly clustered genotype from wt along the PCA axes.
On the other hand, the acs1 plants were not resistant to V. dahliae even if they had less Verticillium wilt symptoms than wt until 13 dpi (Figure 1g,h). The mean relative AUDPC value of the acs1 plants was similar to wt as a result of the enhanced disease severity recorded in the acs1 after 15 dpi. The principal component analysis revealed that acs1 was clustered with wt in the axis describing the 31.2% of the variation.

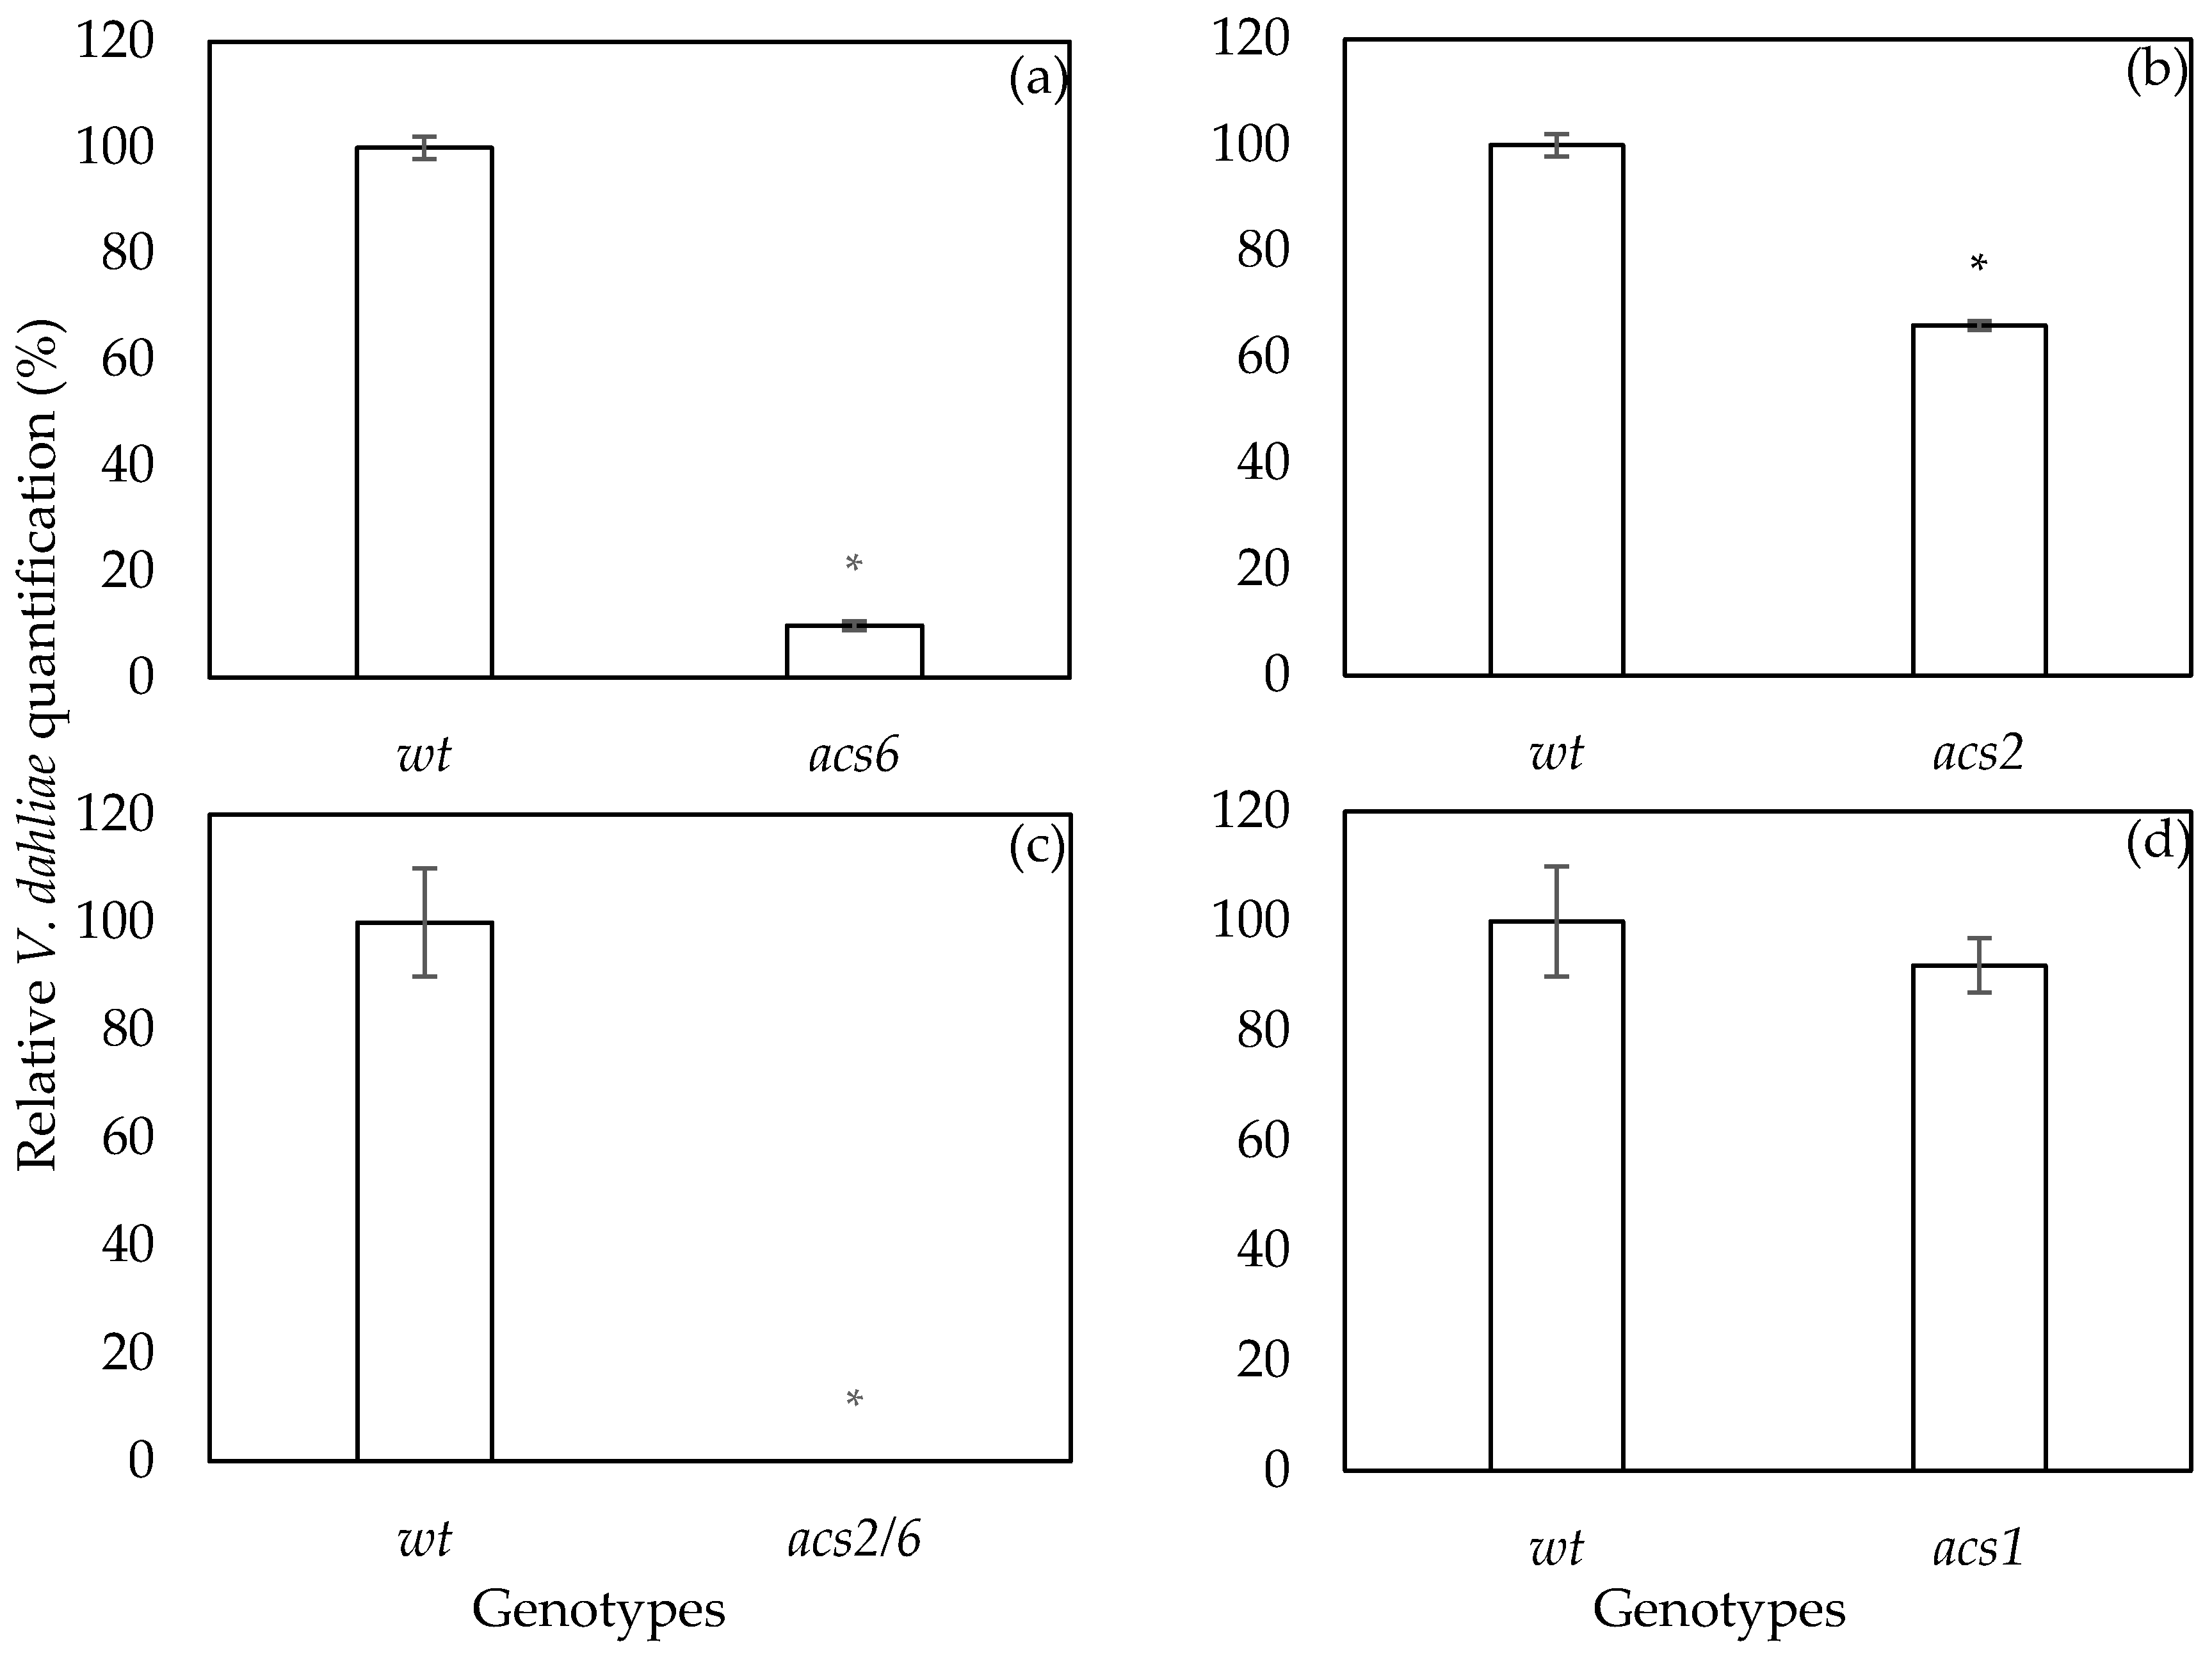
2.2. Verticillium dahliae DNA qPCR Quantification

The pathogenicity tests revealed that acs2, acs6, and acs2/6 exhibit a partially resistant phenotype to V. dahliae infection. To determine whether the reduced disease severity of the acs mutants is due to limited fungal growth and colonization in vascular tissues, the plants of the different treatments were harvested at the end of the pathogenicity experiments (21 dpi), and the level of V. dahliae DNA was assessed in each genotype by qPCR.
V. dahliae was present in the vascular tissues of all genotypes; however, in the acs2, acs6, and acs2/6 mutants, the levels of the pathogen DNA were significantly lower than those observed in the wt plants (Figure 3). The acs2/6 had the lowest pathogen levels followed by acs6. The acs2 harbored the highest V. dahliae DNA levels among the resistant acs mutants; even if the disease severity of acs2 was as low as it was in the acs6 and acs2/6 mutants. On the other hand, the V. dahliae DNA levels in the acs1 mutant were not different from the wt, conferring the susceptibility of the acs1 to V. dahliae.

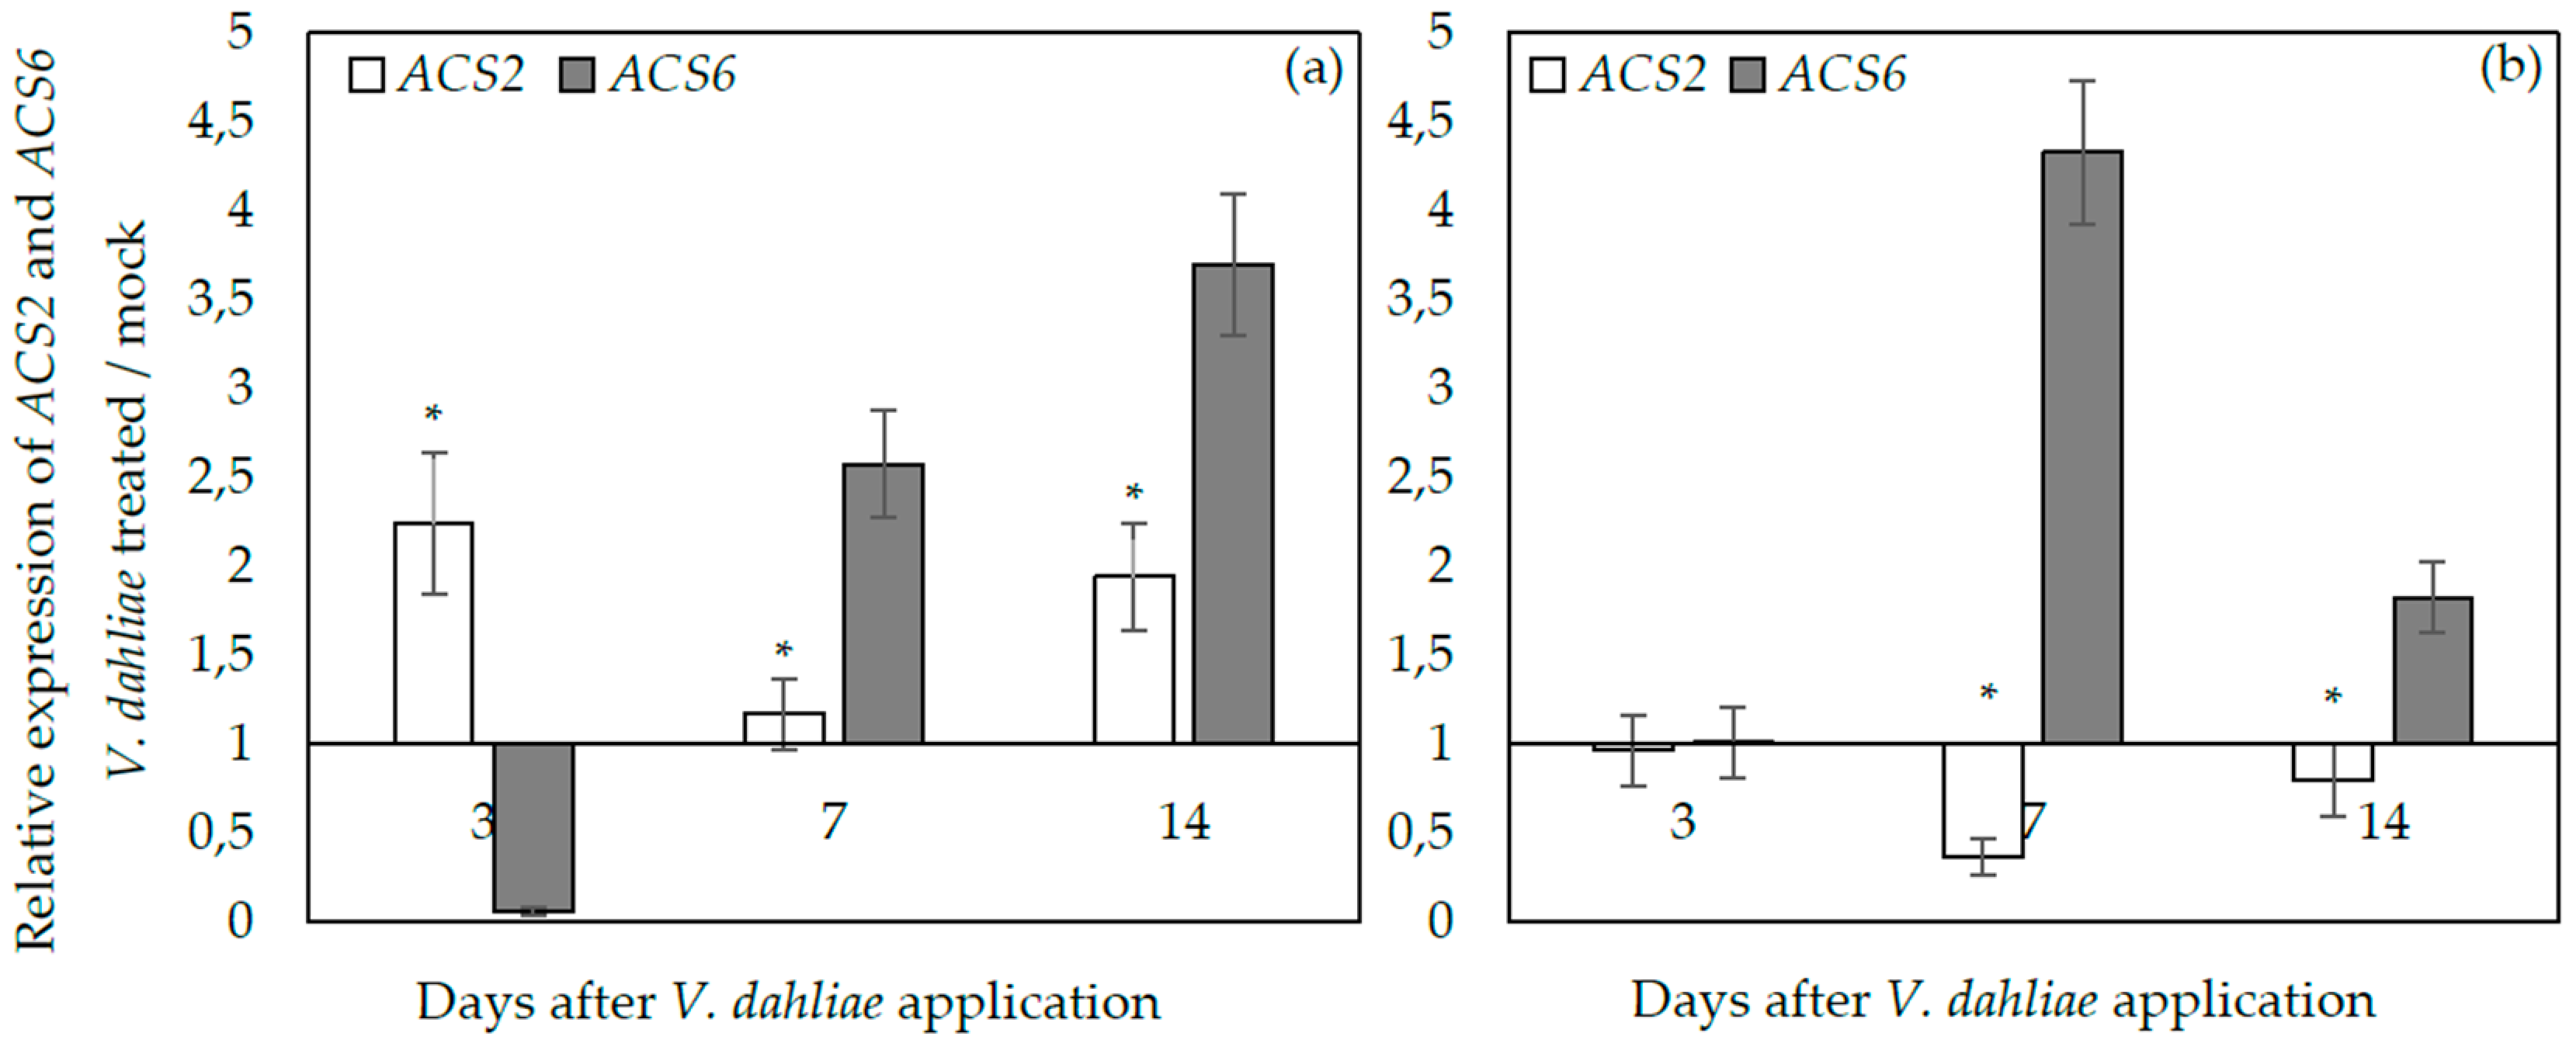
2.3. ACS2 and ACS6 Expression upon Verticillium dahliae Plant Infection

To examine whether ACS2 and ACS6 are differentially expressed upon V. dahliae infection, qPCR analysis was performed on cDNAs prepared from root and above ground (leaves and stems) tissues of Arabidopsis plants (wt) sampled at 3, 7, and 14 dpi. In the above ground tissues, ACS6 was initially downregulated (3 dpi), while ACS2 was upregulated two-fold compared to mocks (Figure 4a). The expression levels of ACS6 increased with time, being 2.5 and 3.7 times higher than mocks, at 7 and 14 dpi, respectively. On the other hand, the expression of ACS2 decreased at 7 dpi and increased at 14 dpi, 1.9-fold more than mocks.
In the root tissues, the expression of ACS2 did not follow the same pattern with the above ground tissues, since it was downregulated at 7 and 14 dpi (Figure 4b). On the other hand, the expression of ACS6 in the V. dahliae-treated plants was similar to mocks at 3 dpi and afterwards it was upregulated 4.3-fold and 1.8-fold at 7 and 14 dpi, respectively. Therefore, ACS6 was upregulated in roots and the above ground tissues at 7 and 14 dpi; while ACS2 was upregulated in the above ground tissues and downregulated in roots. These observations are further supported by the findings of the ANOVA analysis, showing that ACS2 expression depends on the type of the tissue and time, while the ACS6 expression depends on time (Table 1).

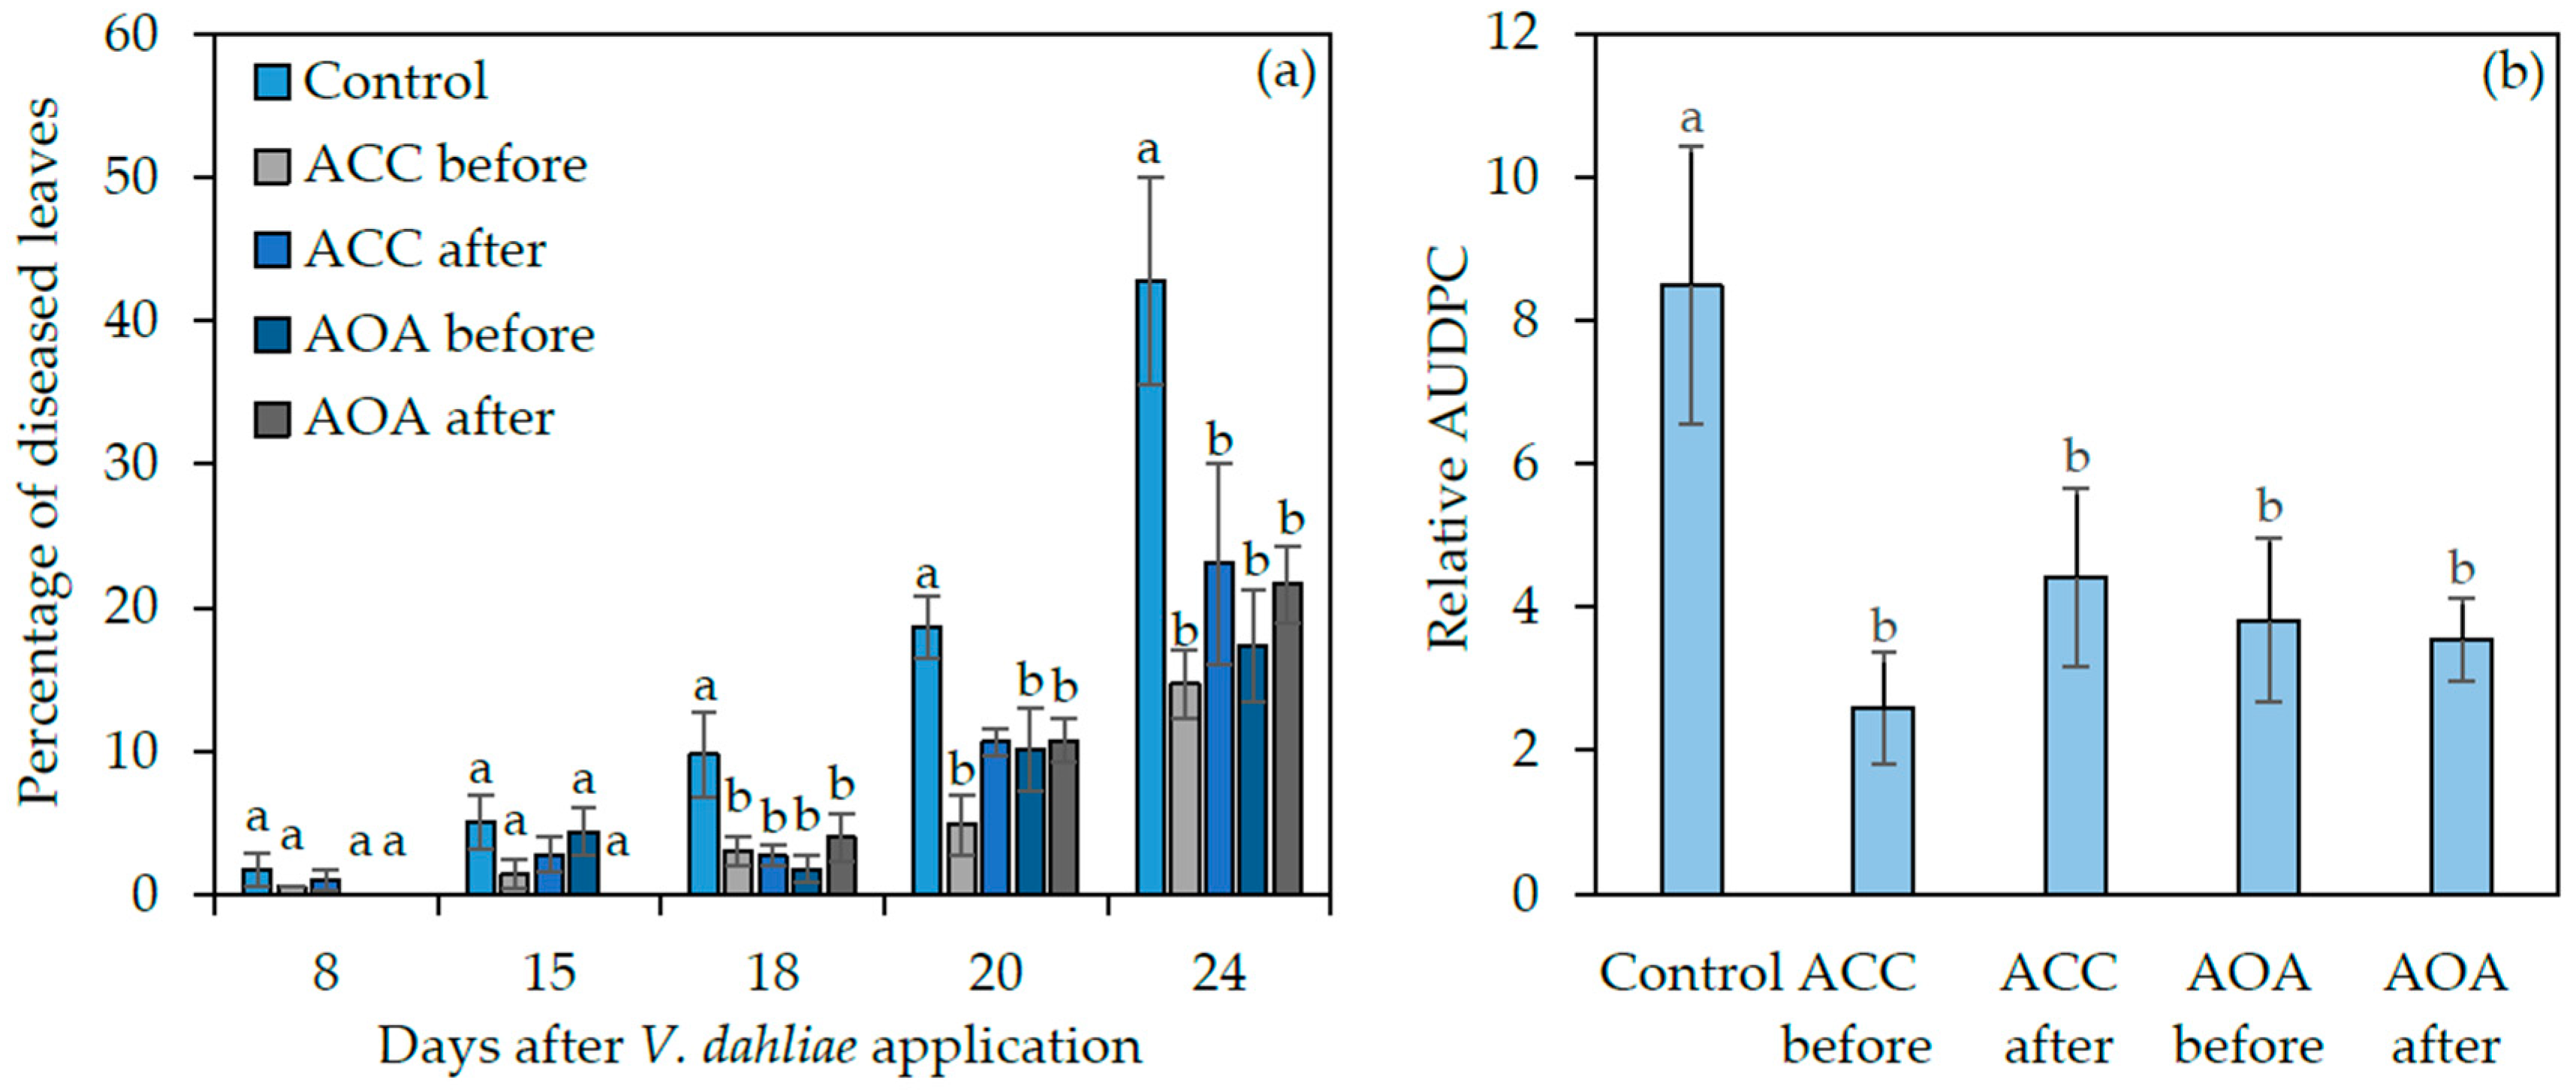
2.4. Exogenous ACC and AOA Application to wt Arabidopsis thaliana before or after Verticillium dahliae Inoculation

In order to investigate whether the resistance of acs2, acs6, and acs2/6 could be attributed to either low ACC or ethylene production, wt plants were root-drenched with ACC or aminooxyacetic acid (AOA), the competitive inhibitor of ACS [15], before or after V. dahliae infection. The first Verticillium wilt symptoms appeared in the control and ACC-treated plants at 8 dpi, while the AOA-treated plants were asymptomatic at that time point (Figure 5a). Overall, the disease severity progressed slower in ACC and AOA treatments compared to controls. At 24 dpi, the percentage of disease severity was 43% in the control treatment; while in the treatments where AOA and ACC were applied before pathogen inoculation, the disease severity was 23% and 15%, respectively. Similarly, the application of AOA and ACC after V. dahliae application resulted in 2.5- and 2-fold, respectively, lower symptoms compared to control at 24 dpi (Figure 5a).
The relative AUDPC that was adopted to comprehensively evaluate the disease severity, confirmed the previous observations. The mean relative AUDPC value for the plants treated with ACC before or after V. dahliae inoculation was 3.3- and 1.9-fold, respectively, lower than control; the respective values in the AOA-treated plants were 2.2- and 2.4-fold lower than control (Figure 5b).

3. Discussion

The role of ACS in plant–pathogen interactions has been previously discussed upon plant infection by B. cinerea and P. syringae pv tomato [12,13]. It has been shown that ACS2 and ACS6 positively regulate defense responses against both pathogens. On the contrary, our results suggest a negative role for ACS2 and ACS6 in plant disease resistance against V. dahliae.
In our experiments, we initially screened the resistance level of acs2, acs6, acs2/6, and acs1 against V. dahliae. The acs2, acs6, and acs2/6 showed significantly less symptoms than wt. Therefore, the pathogenicity experiments suggest a partial resistance genotype for acs2 and acs6. This is an interesting observation since ACS2 and ACS6 are components of the signal transduction pathway leading to disease defense responses [14]. In the defense signaling cascade, ACS2 and ACS6 interact with the mitogen activated protein kinases (MPK) 3 (MPK3) and 6 (MPK6) [14]. It is known that MPK3 and MPK6 positively regulate ethylene production through the phosphorylation-mediated stabilization of ACS2 and ACS6 [14,16]. Similar to acs2 and acs6, the Arabidopsis mutants mpk3 and mpk6 are resistant to V. dahliae [17]. Therefore, the pathogen may use the interaction of ACS2 and ACS6 with MPK3 and MPK6 to promote disease.
In contrast to the resistant phenotype of acs2 and acs6, the acs1 mutant was susceptible to Verticillium; even if it showed less symptoms than wt at the early disease recordings. It is not surprising that acs1 is susceptible to Verticillium, whereas the acs2 and acs6 are resistant; since the ACS1 is enzymatically inactive due to the absence of a highly conserved tripeptide Thr-Asn-Pro (TNP) [18] and it is not phosphorylated by MPK3 and MPK6 as it happens with ACS2 and ACS6.
The pathogenicity experiments suggest that ACS2 and ACS6 influence the outcome of V. dahliae infection. However, the observed reduction of disease symptoms in the acs2 and acs6 plants compared to wt could be the outcome of a tolerance phenomenon rather than a resistance response. The plant tolerance to V. dahliae has been previously addressed in Arabidopsis when the disease response of different ecotypes to V. dahliae was studied [19]. In this study, the ecotype with the fewer wilt symptoms among the examined ecotypes was harboring endophyticaly as much Verticillium as the most susceptible ecotype [19]. For this purpose, we quantified the endophytic presence of V. dahliae in acs2, acs6, acs2/6, acs1, and wt plants at the end of the experiment. The qPCR analysis revealed lower levels of V. dahliae DNA in acs2, acs6, and acs2/6 plants compared to wt. These results suggest that the observed reduction in Verticillium wilt symptoms in the acs mutants was due to partial resistance, as it has been also described in the case of mpk3, mpk6, etr1, and efr1 [5,17]. The phenomenon of partial increase in resistance is linked to quantitative disease resistance (QDR), reported in several studies on Arabidopsis pathosystems including P. syringae, Erisyphe cichoracearum, and B. cinerea [20,21,22].
Ethylene production by plants, at the early stages of plant–pathogen interaction, has been associated with the induction of defense mechanisms, while its production at the later stages of the infection process may act in favor of the pathogen [23]. In our experiments, the upregulation of ACS6 and ACS2 in the examined tissues after pathogen infection was observed, indicating that higher ACC or ethylene production after V. dahliae infection could enhance disease. Since ACS2 and ACS6 are involved in ethylene biosynthesis, we investigated whether exogenous application of AOA, an ACC inhibitor, could mimic the results obtained from the pathogenicity experiments with acs2 and acs6 mutants. Indeed, our results showed that application of AOA after or before V. dahliae infection reduces disease severity compared to the untreated controls. However, the application of ACC to plants, instead of reversing the phenotype observed upon AOA treatment, resulted in significant reduction of disease severity. Likewise, Robison et al. (2001) [24] suggested that long-term inhibition of ethylene production through AVG (aminoethoxyvinylglycine) treatment, an ACC inhibitor, combined with a transient burst of ethylene at the time of infection upon ACC application, could reduce Verticillium wilt disease symptoms in tomato plants. A more recent study suggested that ACC produced by V. dahliae can act as a negative regulator of virulence [25]. In the same study, the authors postulated that V. dahliae strains overexpressing ACC deaminase might promote disease by reducing plant ACC levels in the roots [25]. Consequently, our results suggest that the mechanism underpinning the partial resistance of acs2 and acs6 is likely ethylene depended rather than ACC related, since ACC application led to decreased disease severity.
ACS2 and ACS6 can be integrated in an earlier proposed virulence model of V. dahliae, suggesting that the elongation factor Tu (EF-Tu) receptor (EFR), MPK3, and MPK6 are susceptibility factors for V. dahliae [16]. The EFR binds the bacterial protein EF-Tu [26], it is also known that ET modulates EFR-triggered immunity [27]. Interestingly, a gene (VDAG_01458.1) homologous to EF-Tu that can be detected by EFR and trigger a virulence cascade in the plant, including MPK3 and MPK6, exists in the V. dahliae genome. Arabidopsis MAP kinases MPK3 and MPK6 are activated within 5 min of elf18 treatment [28]. Therefore, the initial binding of the putative V. dahliae EF-Tu to EFR can lead to the activation of MPK3 and MPK6 that in turn phosphorylates the ACS proteins, resulting in ET biosynthesis [29,30]. Among the receptors of ET in plant cells is ETR1, a susceptibility factor for V. dahliae and V. longisporum [5,6]. As proposed earlier, ET synthesis and perception might have a significant role in Verticillium pathogenesis and plant resistance or tolerance [29]. The use of Arabidopsis mutants for each step of this signaling cascade showed their resistance against V. dahliae; therefore, EFR, MPK3, and MPK6, along with ACS2 and ACS6, might be manipulated by V. dahliae to promote disease.
In conclusion, our study is in agreement with an increasing number of studies showing that ACC possess a signaling role in plant defense beyond its function in ethylene biosynthesis. However, the partial resistance of acs2 and acs6 suggests a negative regulatory role for ACS2 and ACS6 in plant defense against V. dahliae, which seems to be ethylene depended. This is the first published study proposing that genes involved in ethylene biosynthesis and not ethylene perception contribute to V. dahliae disease development; further studies are needed to unravel the plant defense mechanisms that are activated in acs2 and acs6 mutants upon V. dahliae infection.

4. Materials and Methods

4.1. Fungal Culture

A V. dahliae strain isolated from Raphanus sativus L. was used in the experiments [30]. The fungal strain was stored at −80 °C as a spore suspension in 25% aqueous glycerol [31]. For the experiments, the fungus was transferred to potato dextrose agar (PDA) (Merck, Darmstadt, Germany) at 24 °C for 5 days and subsequently a suspension of 107 conidia/mL of distilled sterile water was prepared from a culture grown for 5 days at 24 °C in a sucrose sodium nitrate liquid medium [32].

4.2. Seeds Origin and Plant Growth Conditions

A. thaliana Col-0, wt, and the acs2, acs6, acs2/6 and acs1 mutants [10] were obtained from the Nottingham Arabidopsis Stock Centre, Nottingham, UK. The stock numbers are CS16564 (acs2), CS16569 (acs6), CS16581 (acs2/6) and CS16563 (acs1). All seeds were stored at 4 °C. For the bioassays, A. thaliana seeds were sown in pots (9 × 9 × 10 cm) containing pasteurized soil mix of humus and perlite (3:1) and were maintained at 22 °C with a 16-h photoperiod at 60–70% relative humidity in a controlled-environment growth chamber. After 10 days, the plants were singled to plastic pots with approximately 80 cm3 of pasteurized soil mix of humus and perlite (3:1).
For ACC and AOA experiments, Arabidopsis Col-0 seeds were sown directly into 9 cm-diameter pots (Teku, VCH 9 pots), containing approximately 330 mL soil (Plantaflor Potting Soil, Germany) per pot. After 4 days of stratification at 4 °C, the pots were placed in a growth room set at 22 °C, 65–70% RH, and a 16-h photoperiod with photon flux density of 100 ± 20 μmol m−2 s−1. Plants were watered every two days to maintain 70% of soil humidity.

4.3. Pathogenicity Experiments

Twenty-day-old plants were root-drenched either with 10 mL of 107 V. dahliae conidia mL−1 sterile distilled water per plant or sterile distilled water (mocks) [5]. The experiment was repeated three times with 10 plants per genotype (wt, acs2, acs2, acs2/6, acs1) and treatment (V. dahliae; mocks) per replication (a total of 30 plants treated with V. dahliae and 30 mock inoculated plants per genotype). The monitoring of Verticillium wilt symptoms started at 7 dpi until 21 dpi. Disease severity at each observation was calculated from the number of leaves that showed Verticillium symptoms as a percentage of the total number of leaves of each plant. Subsequently, the area under the disease progress curve (AUDPC) was calculated by the trapezoidal integration method [33] for each plant. Disease was expressed as a percentage of the maximum possible area for the whole period of the experiment, which is referred to as the relative AUDPC [17].
The effect of ACC and AOA on disease development was evaluated by applying a solution of 100 μM ACC or AOA by root drenching (10 mL per plant) two-week-old plants 24 h prior or 24 h after fungal inoculation. Pathogen inoculation and disease assessment were performed as it is described above. Six plants per treatment were used, and the experiment was repeated twice.

4.4. DNA Extraction and qPCR Fungal Quantification

The above ground plant parts of 10 plants per genotype were harvested at 21 dpi (end of the pathogenicity experiments) and pooled to one sample for qPCR quantification of the V. dahliae DNA endophytic levels. In brief, the plants were cut at soil level, rinsed with sterile distilled water, and ground to a fine powder, using an autoclaved mortar and pestle in the presence of liquid nitrogen.
Total DNA was isolated according to Dellaporta et al. (1983) [34] and the concentration was estimated by using NanoDrop UV spectrophotometry. qPCR assays for the quantification of V. dahliae were conducted as described previously [17], using the pair of primers ITS1-F 5′–AAAGTTTTAATGGTTCGCTAAGA–3′ and ST-VE1-R 5′–CTTGGTCATTTAGAGGAAGTAA–3′ designed for the ITS1 and ITS2 regions of the 5.8S ribosomal RNA gene (Z29511) of V. dahliae. qPCRs were performed in an Applied Biosystems StepOnePlus thermocycler and for the amplification reactions, FastGene IC Green qPCR universal mix (NIPPON Genetics EUROPEGmbH) was used. The results were analyzed with the StepOne v.2.3 qPCR software. For sample calibration, the Arabidopsis gene At4g26410, previously described as a stable reference gene [35], was detected using the primer pair 5′-GAGCTGAAGTGGCTTCCATGAC-3′ and 5′-GGTCCGACATACCCATGATCC-3′. PCR cycling started with an initial step of denaturation at 95 °C for 2 min, followed by 40 cycles of 95 °C for 5 s and 60 °C for 30 s. PCR efficiency for each amplicon was calculated by employing the linear regression method on log (fluorescence) per cycle number data, using the Lin-Reg PCR software [36]. Three biological repeats were conducted with 10 plants per genotype and repeat (a total of 30 plants per genotype) and three technical repeats per biological repeat. The absence of nonspecific products and primer dimers was confirmed by the analysis of melting curves. The relative V. dahliae DNA quantity, calculated by using the formula 2−ΔCt, was expressed as a percentage compared to wt; while the value (2−ΔCt) of the wt was set to 100% [17].

4.5. Determination of Transcript Levels Using RT-PCR Assay

Ten A. thaliana wt plants from each treatment (V. dahliae and mock) and experimental replication (a total of 3 replications) were harvested for RNA analysis and pooled to one sample at 3, 7, and 14 dpi. For each sampled plant, the above-ground parts (stem and leaves) were cut at soil level, and roots (main and secondary) were shortly rinsed with sterile distilled water to remove soil particles, immediately frozen in liquid nitrogen, and stored at −80 °C. Subsequently, the pooled tissues were ground with liquid nitrogen and total RNA was extracted from 100 mg of the homogenized tissues using TRIzol® Reagent (Invitrogen, Paisley, Renfrewshire, UK), according to the manufacturer’s instructions.
The RNA samples were treated with DNase I (Invitrogen) to eliminate traces of contaminating genomic DNA. The RNA concentration was measured on a Nanodrop ND-1000 spectrophotometer (Saveen Werner, Malmö, Sweden). First-strand cDNA was synthesized using SuperScript II (Invitrogen) following the manufacturer’s procedure. The primers used for real-time PCR were ACS2 (At1g01480; 5-GGATGGTTTAGGATTTGCTTTG-3 and 5-GCACTCTTGTTCTGGATTACCTG-3), and ACS6 (At4g11280; 5-GTTCCAACCCCTTATTATCC-3 and 5-CCGTAATCTTGAACCCATTA-3) [12]. PCR cycling started with an initial step of denaturation at 95 °C for 2 min, followed by 40 cycles of 95 °C for 5 s and 60 °C for 30 s. PCR efficiency for each amplicon was calculated by employing the linear regression method on log (fluorescence) per cycle number data, using the Lin-Reg PCR software [36]. Three biological repeats were conducted with 10 plants per sampling time point (3, 7, 14 dpi), treatment (V. dahliae and mock inoculated plants), and repeat (a total of 30 plants per treatment per sampling time point). Three technical repeats were conducted per biological repeat. The absence of nonspecific products and primer dimers was confirmed by the analysis of melting curves. The relative ACS2 and ACS6 expression levels (2−ΔCt) in the V. dahliae-treated plants were expressed relative to the normalized transcript levels of ACS2 and ACS6 in the mock-inoculated plants.

4.6. Statistics

Data on disease severity, relative AUDPC, V. dahliae qPCR quantification, and relative gene expression of ACS2 and ACS6 were analyzed with a two-sample t-test (p < 0.05); except of the relative AUDPC in the AOA/ACC experiment, where the values of the different treatments were subjected to analysis of variance followed by LSD multiple range test (p < 0.05). A standardized PCA was performed on the relative AUDPC values of the examined genotypes (wt, acs1, acs2, acs6, acs2/6) using the XLSTAT software.

Author Contributions

Investigation and data curation, E.G.P. and D.G.; investigation, data curation, and writing M.-D.T.; supervision and writing—review and editing, I.S.P. and S.E.T. All authors have read and agreed to the published version of the manuscript.

Funding

This research received no external funding.

Conflicts of Interest

The authors declare no conflict of interest.

References

  1. Pegg, G.F.; Brady, B.L. Verticillium Wilts; CABI Publishing: New York, NY, USA, 2002. [Google Scholar]
  2. Schnathorst, W.C. Life cycle and epidemiology of Verticillium. In Fungal Wilt Diseases of Plants; Mace, M.A., Bell, A.A., Beckman, C.H., Eds.; Academic Press: New York, NY, USA, 1981; pp. 81–111. [Google Scholar]
  3. Abeles, F.B.; Morgan, P.W.; Saltveit, M.E., Jr. Ethylene in Plant Biology, 2nd ed.; Academic Press: San Diego, CA, USA, 1992. [Google Scholar]
  4. Johnson, P.R.; Ecker, J.R. The ethylene gas signal transduction pathway: A molecular perspective. Annu. Rev. Genet. 1998, 32, 227–254. [Google Scholar] [CrossRef]
  5. Pantelides, I.S.; Tjamos, S.E.; Paplomatas, E.J. Ethylene perception via ETR1 is required in Arabidopsis infection by Verticillium dahliae. Mol. Plant Pathol. 2010, 11, 191–202. [Google Scholar] [CrossRef]
  6. Johansson, A.; Staal, J.; Dixelius, C. Early responses in the Arabidopsis—Verticillium longisporum pathosystem are dependent on NDR1, JA- and ET-associated signals via cytosolic NPR-1 and RFO1. Mol. Plant Microbe-Interact. 2006, 19, 958–969. [Google Scholar] [CrossRef] [PubMed] [Green Version]
  7. Guo, H.; Ecker, J.R. The ethylene signaling pathway: New insights. Curr. Opin. Plant Biol. 2004, 7, 40–49. [Google Scholar] [CrossRef] [PubMed]
  8. Kende, H. Ethylene biosynthesis. Annu. Rev. Plant Physiol. Plant Mol. Biol. 1993, 44, 283–307. [Google Scholar] [CrossRef]
  9. Wang, K.L.; Li, H.; Ecker, J.R. Ethylene biosynthesis and signaling networks. Plant Cell 2002, 14 (Suppl. 1), S131–S151. [Google Scholar] [CrossRef] [Green Version]
  10. Tsuchisaka, A.; Yu, G.; Jin, H.; Alonso, J.M.; Ecker, J.R.; Zhang, X.; Gao, S.; Theologis, A. A combinatorial interplay among the 1-aminocyclopropane-1-carboxylate isoforms regulates ethylene biosynthesis in Arabidopsis thaliana. Genetics 2009, 183, 979–1003. [Google Scholar] [CrossRef] [Green Version]
  11. Bleecker, A.B.; Kende, H. Ethylene: A Gaseous Signal Molecule in Plants. Annu. Rev. Cell Dev. Biol. 2000, 16, 1–18. [Google Scholar] [CrossRef] [Green Version]
  12. Guan, R.; Su, J.; Meng, X.; Li, S.; Liu, Y.; Xu, J.; Zhang, S. Multilayered regulation of ethylene induction plays a positive role in Arabidopsis resistance against Pseudomonas syringae. Plant Physiol. 2015, 169, 299–312. [Google Scholar] [CrossRef] [Green Version]
  13. Han, L.; Li, G.J.; Yang, K.Y.; Mao, G.; Wang, R.; Liu, Y.; Zhang, S. Mitogen-activated protein kinase 3 and 6 regulate Botrytis cinerea-induced ethylene production in Arabidopsis. Plant J. 2010, 64, 114–127. [Google Scholar] [CrossRef]
  14. Li, G.; Meng, X.; Wang, R.; Mao, G.; Han, L.; Liu, Y.; Zhang, S. Dual-level regulation of ACC synthase activity by MPK3/MPK6 cascade and its downstream WRKY transcription factor during ethylene induction in Arabidopsis. PLoS Genet. 2012, 8, e1002767. [Google Scholar] [CrossRef] [PubMed]
  15. Yu, Y.B.; Adams, D.O.; Yang, S.F. 1-Aminocyclopropanecarboxylate synthase, a key enzyme in ethylene biosynthesis. Arch. Biochem. Biophys. 1979, 198, 280–286. [Google Scholar] [CrossRef]
  16. Liu, Y.; Zhang, S. Phosphorylation of 1-aminocyclopropane-1-carboxylic acid synthase by MPK6, a stress-responsive mitogen-activated protein kinase, induces ethylene biosynthesis in Arabidopsis. Plant Cell 2004, 16, 3386–3399. [Google Scholar] [CrossRef] [Green Version]
  17. Gkizi, D.; Lehmann, S.; L’Haridon, F.; Serrano, M.; Paplomatas, E.J.; Métraux, J.P.; Tjamos, S.E. The innate immune signaling system as a regulator of disease resistance and induced systemic resistance activity against Verticillium dahliae. Mol. Plant Microbe Interact. 2016, 29, 313–323. [Google Scholar] [CrossRef] [Green Version]
  18. Liang, X.; Oono, Y.; Shen, N.F.; Köhler, C.; Li, K.; Scolnik, P.A.; Theologis, A. Characterization of two members (ACS1 and ACS3) of the 1-aminocyclopropane-1-carboxylate synthase gene family of Arabidopsis thaliana. Gene 1995, 167, 17–24. [Google Scholar] [CrossRef]
  19. Veronese, P.; Narasimhan, M.L.; Stevenson, R.A.; Zhu, J.K.; Weller, S.C.; Subbarao, K.V.; Bressan, R.A. Identification of a locus controlling Verticillium disease symptom response in Arabidopsis thaliana. Plant J. 2003, 35, 574–587. [Google Scholar] [CrossRef]
  20. Paula, X.; Kover, P.X.; Schaal, B.A. Genetic variation for disease resistance and tolerance among Arabidopsis thaliana accessions. Proc. Natl. Acad. Sci. USA 2002, 20, 11270–11274. [Google Scholar]
  21. Denby, K.J.; Kumar, P.; Kliebenstein, D.J. Identification of Botrytis cinerea susceptibility loci in Arabidopsis thaliana. Plant J. 2004, 38, 473–486. [Google Scholar] [CrossRef]
  22. Poland, J.A.; Balint-Kurti, P.J.; Wisser, R.J.; Pratt, R.C.; Nelson, R.J. Shades of gray: The world of quantitative disease resistance. Trends Plant Sci. 2009, 14, 21–29. [Google Scholar] [CrossRef]
  23. Van Loon, L.C.; Geraats, B.P.J.; Linthorst, H.J.M. Ethylene as a modulator of disease resistance in plants. Trends Plant Sci. 2006, 11, 184–191. [Google Scholar] [CrossRef]
  24. Robison, M.M.; Griffith, M.; Pauls, K.P.; Glick, B.R. Dual role for ethylene in susceptibility of tomato to Verticillium wilt. J. Phytopathol. 2001, 149, 385–388. [Google Scholar] [CrossRef]
  25. Tsolakidou, M.D.; Pantelides, L.S.; Tzima, A.K.; Kang, S.; Paplomatas, E.J.; Tsaltas, D. Disruption and overexpression of the gene encoding acc (1-aminocyclopropane-1-carboxylic acid) deaminase in soil-borne fungal pathogen Verticillium dahliae revealed the role of ACC as a potential regulator of virulence and plant defense. Mol. Plant Microbe Interact. 2019, 32, 639–653. [Google Scholar] [CrossRef] [PubMed]
  26. Gomez-Gomez, L.; Boller, T. FLS2: An LRR receptor-like kinase involved in the perception of the bacterial elicitor flagellin in Arabidopsis. Mol. Cell 2000, 5, 1003–1011. [Google Scholar] [CrossRef]
  27. Zipfel, C.; Kunze, G.; Chinchilla, D.; Caniard, A.; Jones, J.D.G.; Boller, T.; Felix, G. Perception of the bacterial PAMP EF-Tu by the receptor EFR restricts Agrobacterium-mediated transformation. Cell 2006, 125, 749–760. [Google Scholar] [CrossRef] [PubMed]
  28. Tintor, N.; Ross, A.; Kanehara, K.; Yamada, K.; Fan, L.; Kemmerling, B.; Nürnberger, T.; Tsuda, K.; Saijo, Y. Layered pattern receptor signaling via ethylene and endogenous elicitor peptides during Arabidopsis immunity to bacterial infection. Proc. Natl. Acad. Sci. USA 2013, 110, 6211–6216. [Google Scholar] [CrossRef] [PubMed] [Green Version]
  29. Robb, J.; Lee, B.; Nazar, R.N. Gene suppression in a tolerant tomato–vascular pathogen interaction. Planta 2007, 226, 299–309. [Google Scholar] [CrossRef] [PubMed]
  30. Tjamos, S.E.; Flemetakis, E.; Paplomatas, E.J.; Katinakis, P. Induction of resistance to Verticillium dahliae in Arabidopsis thaliana by the biocontrol agent K165 and pathogenesis-related proteins gene expression. Mol. Plant Microbe Interact. 2005, 18, 555–561. [Google Scholar] [CrossRef] [PubMed] [Green Version]
  31. Maniatis, T.; Fritsch, E.F.; Sambrook, J. Molecular Cloning, a Laboratory Manual; Cold Spring Harbor Laboratory Press: Cold Spring Harbor, NY, USA, 1982. [Google Scholar]
  32. Sinha, A.K.; Wood, R.K.S. Studies on the nature of resistance in tomato plants to Verticillium albo-atrum. Ann. Appl. Biol. 1968, 62, 319–327. [Google Scholar] [CrossRef]
  33. Campbell, C.L.; Madden, L.V. Introduction to Plant Disease Epidemiology; Wiley: New York, NY, USA, 1990. [Google Scholar]
  34. Dellaporta, S.L.; Wood, J.; Hicks, J.B. A plant DNA minipreparation, version II. Plant Mol. Biol. Rep. 1983, 1, 19–21. [Google Scholar] [CrossRef]
  35. Czechowski, T.; Stitt, M.; Altmann, T.; Udvardi, M.K.; Scheible, W.R. Genome wide identification and testing of superior reference genes for transcript normalization in Arabidopsis. Plant Physiol. 2005, 139, 5–17. [Google Scholar] [CrossRef] [Green Version]
  36. Ramakers, C.; Ruijter, J.M.; Deprez, R.H.; Moorman, A.F. Assumption free analysis of quantitative real-time polymerase chain reaction (PCR) data. Neurosci. Lett. 2003, 339, 62–66. [Google Scholar] [CrossRef]
Figure 1. Disease severity (a,c,e,g) and relative area under the disease progress curve (AUDPC) (b,d,f,h) on Arabidopsis thaliana wild type and 1-aminocyclopropane-1-carboxylic acid synthase (acs)2, acs6, acs2/6, and acs1 mutants inoculated with Verticillium dahliae. Each treatment consisted of 10 plants and the experiment was repeated three times. Columns represent means of the three replications (30 plants) and the vertical bars indicate standard errors. Columns with asterisks (*) are significantly different (p < 0.05) from wild type (wt) according to a t-test.
Plants 09 00907 g001
Figure 2. The principal component analysis of the relative AUDPC values of the acs and wt reveals clustered genotypes between the acs2, acs2/6, acs6, and wt, acs1. The percentage of variation explained by the plotted principal coordinates is indicated on the axes.
Plants 09 00907 g002
Figure 3. Relative quantification of the V. dahliae DNA levels in the Arabidopsis mutants acs6 (a), acs2 (b), acs2/6 (c), acs1 (d), and wild type Col-0 plants. Fungal DNA levels were estimated by qPCR using total DNA isolated from the aerial parts of plants at 21 days post-inoculation. The columns represent the means of 3 biological repeats (with 10 plants per genotype and repeat) and 3 technical repeats per biological repeat (total of nine reactions per treatment). The vertical bars indicate the standard errors. Wild type is set to 100%. Columns with asterisks (*) are significantly different (p < 0.05) from wt according to a t-test.
Plants 09 00907 g003
Figure 4. Relative transcript abundance of ACS2 and ACS6 in the above ground plant parts (leaves and stems) (a) and root (b) in wild type Arabidopsis thaliana plants inoculated with Verticillium dahliae, at 3, 7, and 14 days post-inoculation. Transcript levels of the examined genes were normalized to the expression of the plant gene At4g26410 measured in the same samples and expressed relative to the normalized transcript levels in mock-treated plants. The experiment was repeated three times with similar results. The columns represent the means of 3 technical repeats of three biological repeats and the vertical bars indicate the standard errors. At each day, columns with asterisks (*) are significantly different (p < 0.05) from ACS6 according to a t-test.
Plants 09 00907 g004
Figure 5. Disease severity (a) and relative AUDPC (b) of Arabidopsis thaliana wild type plants, root-drenched with ACC and AOA before and after inoculation with Verticillium dahliae. Vertical bars indicate the standard errors based on twelve replicates. All values were subjected to analysis of variance. At each day in (a) and between treatments in (b) different letters above columns denote statistically significant differences according to LSD multiple range test at p < 0.05.
Plants 09 00907 g005
Table 1. Analysis of variance for gene expression of ACS2 and ACS6 in the examined tissues (above ground plant tissues and roots) in the three examined time points (3, 7, and 14 days post-inoculation (dpi)). The analysis was based on the relative gene expression results (2−ΔCt) of 3 technical repeats of three biological repeats.
ACS2ACS6
SourcedfFdfF
Tissue1413.06 **12.53
Time290.09 **2118.14 **
Tissue × Time27.29 *246.80 **
Error48 48
Total54 54
The asterisks (*) and (**) denote significance at p < 0.01, and 0.001 levels, respectively, according to the F test; df: degrees of freedom; F: variance of the group means / mean of the within group variances.

