Transcriptome Analysis of Wounding in the Model Grass Lolium temulentum

Abstract
: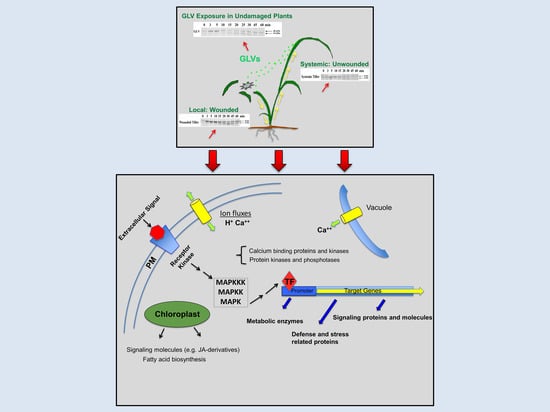
1. Introduction
2. Results and Discussion
2.1. RNA-Seq Libraries
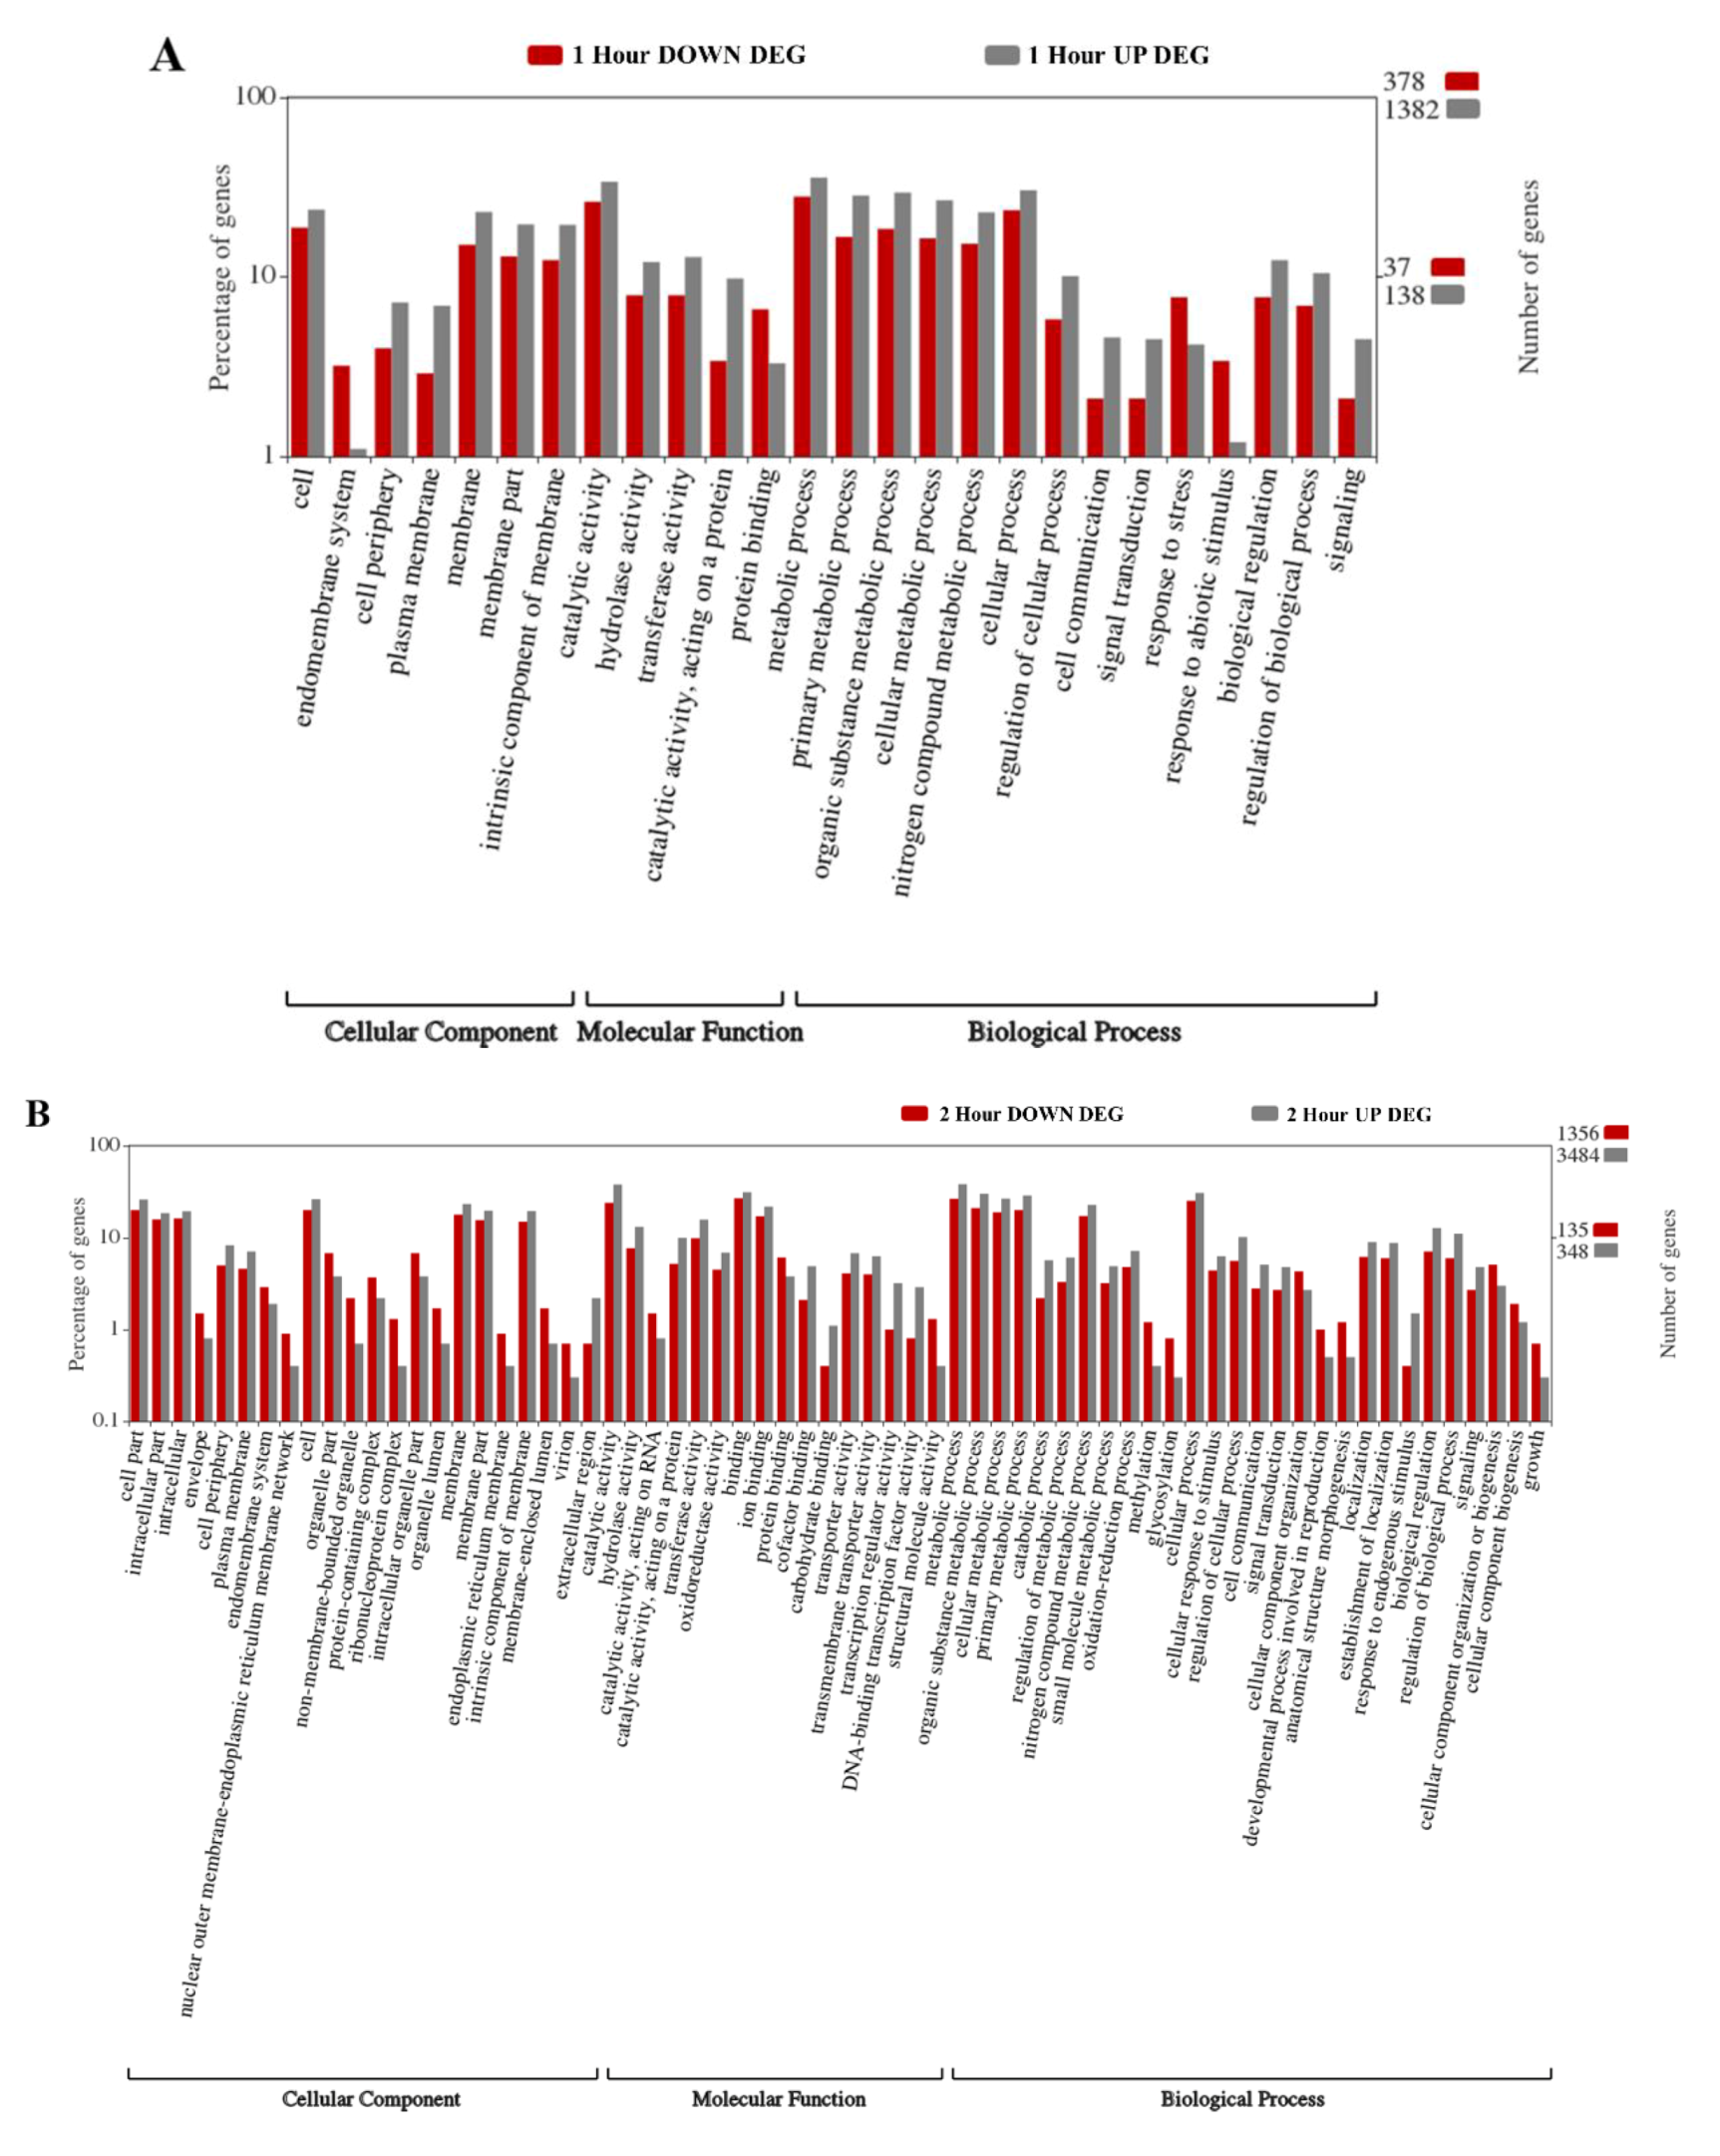
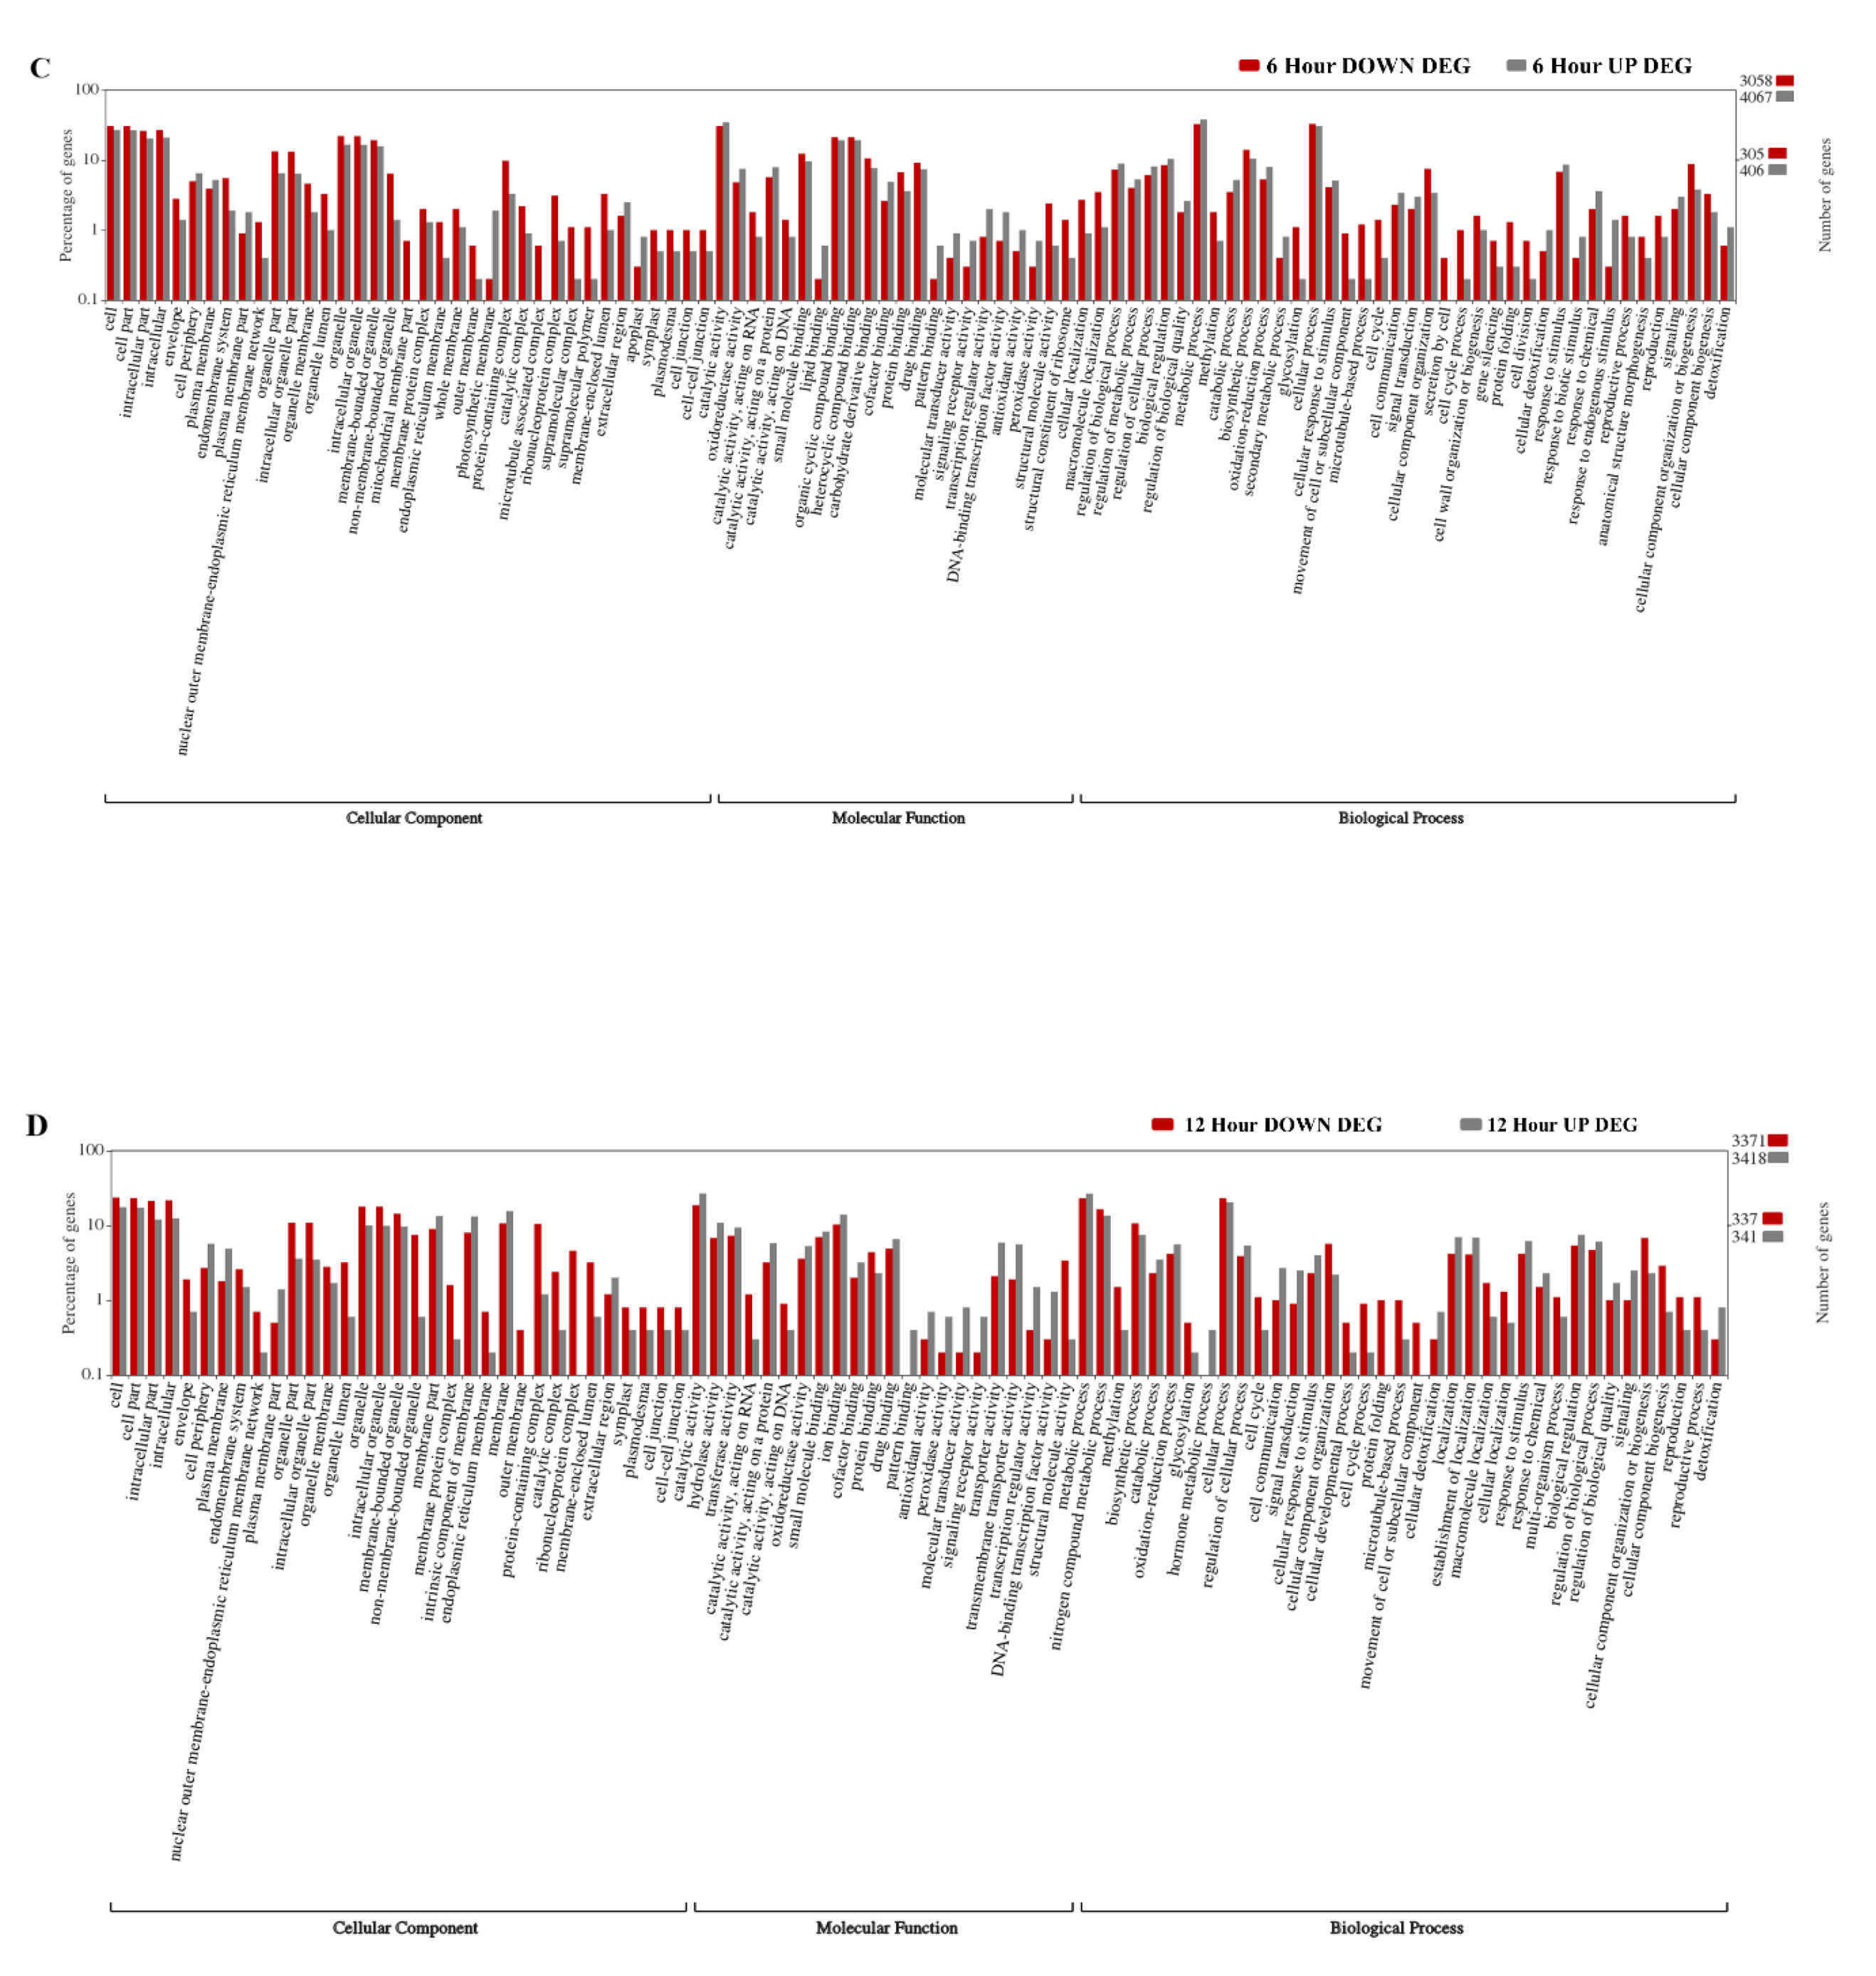
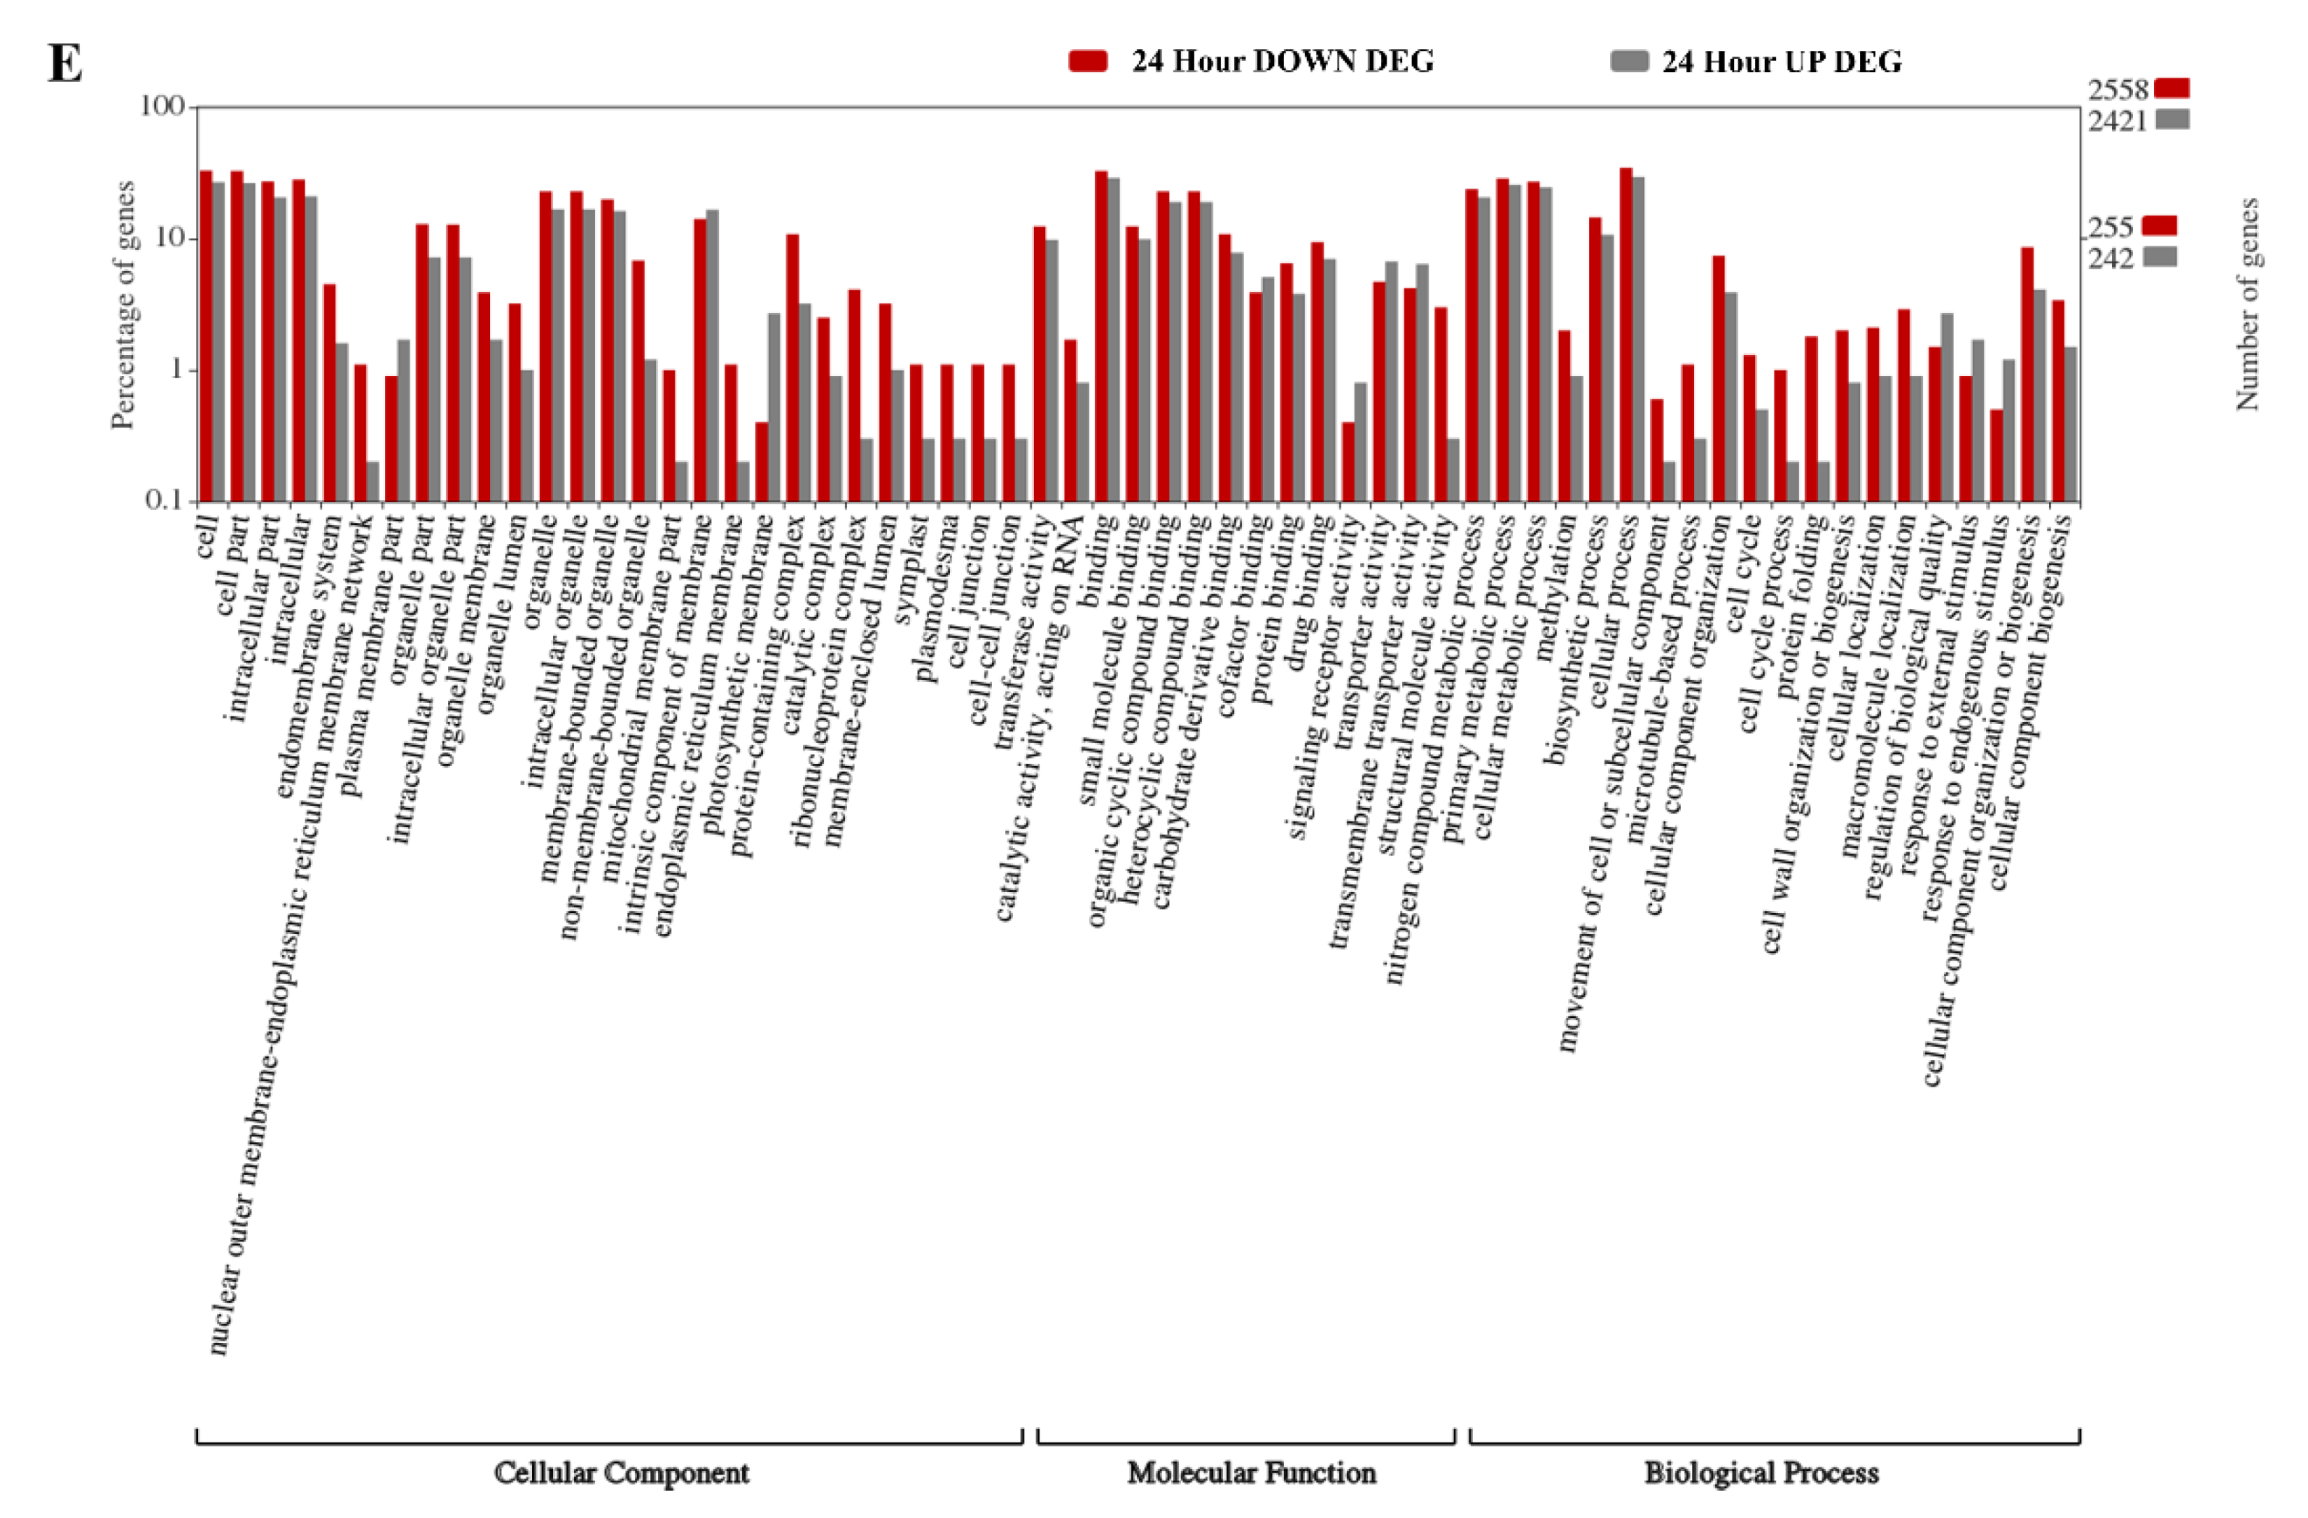
2.2. Gene Ontology Enrichment Analyses
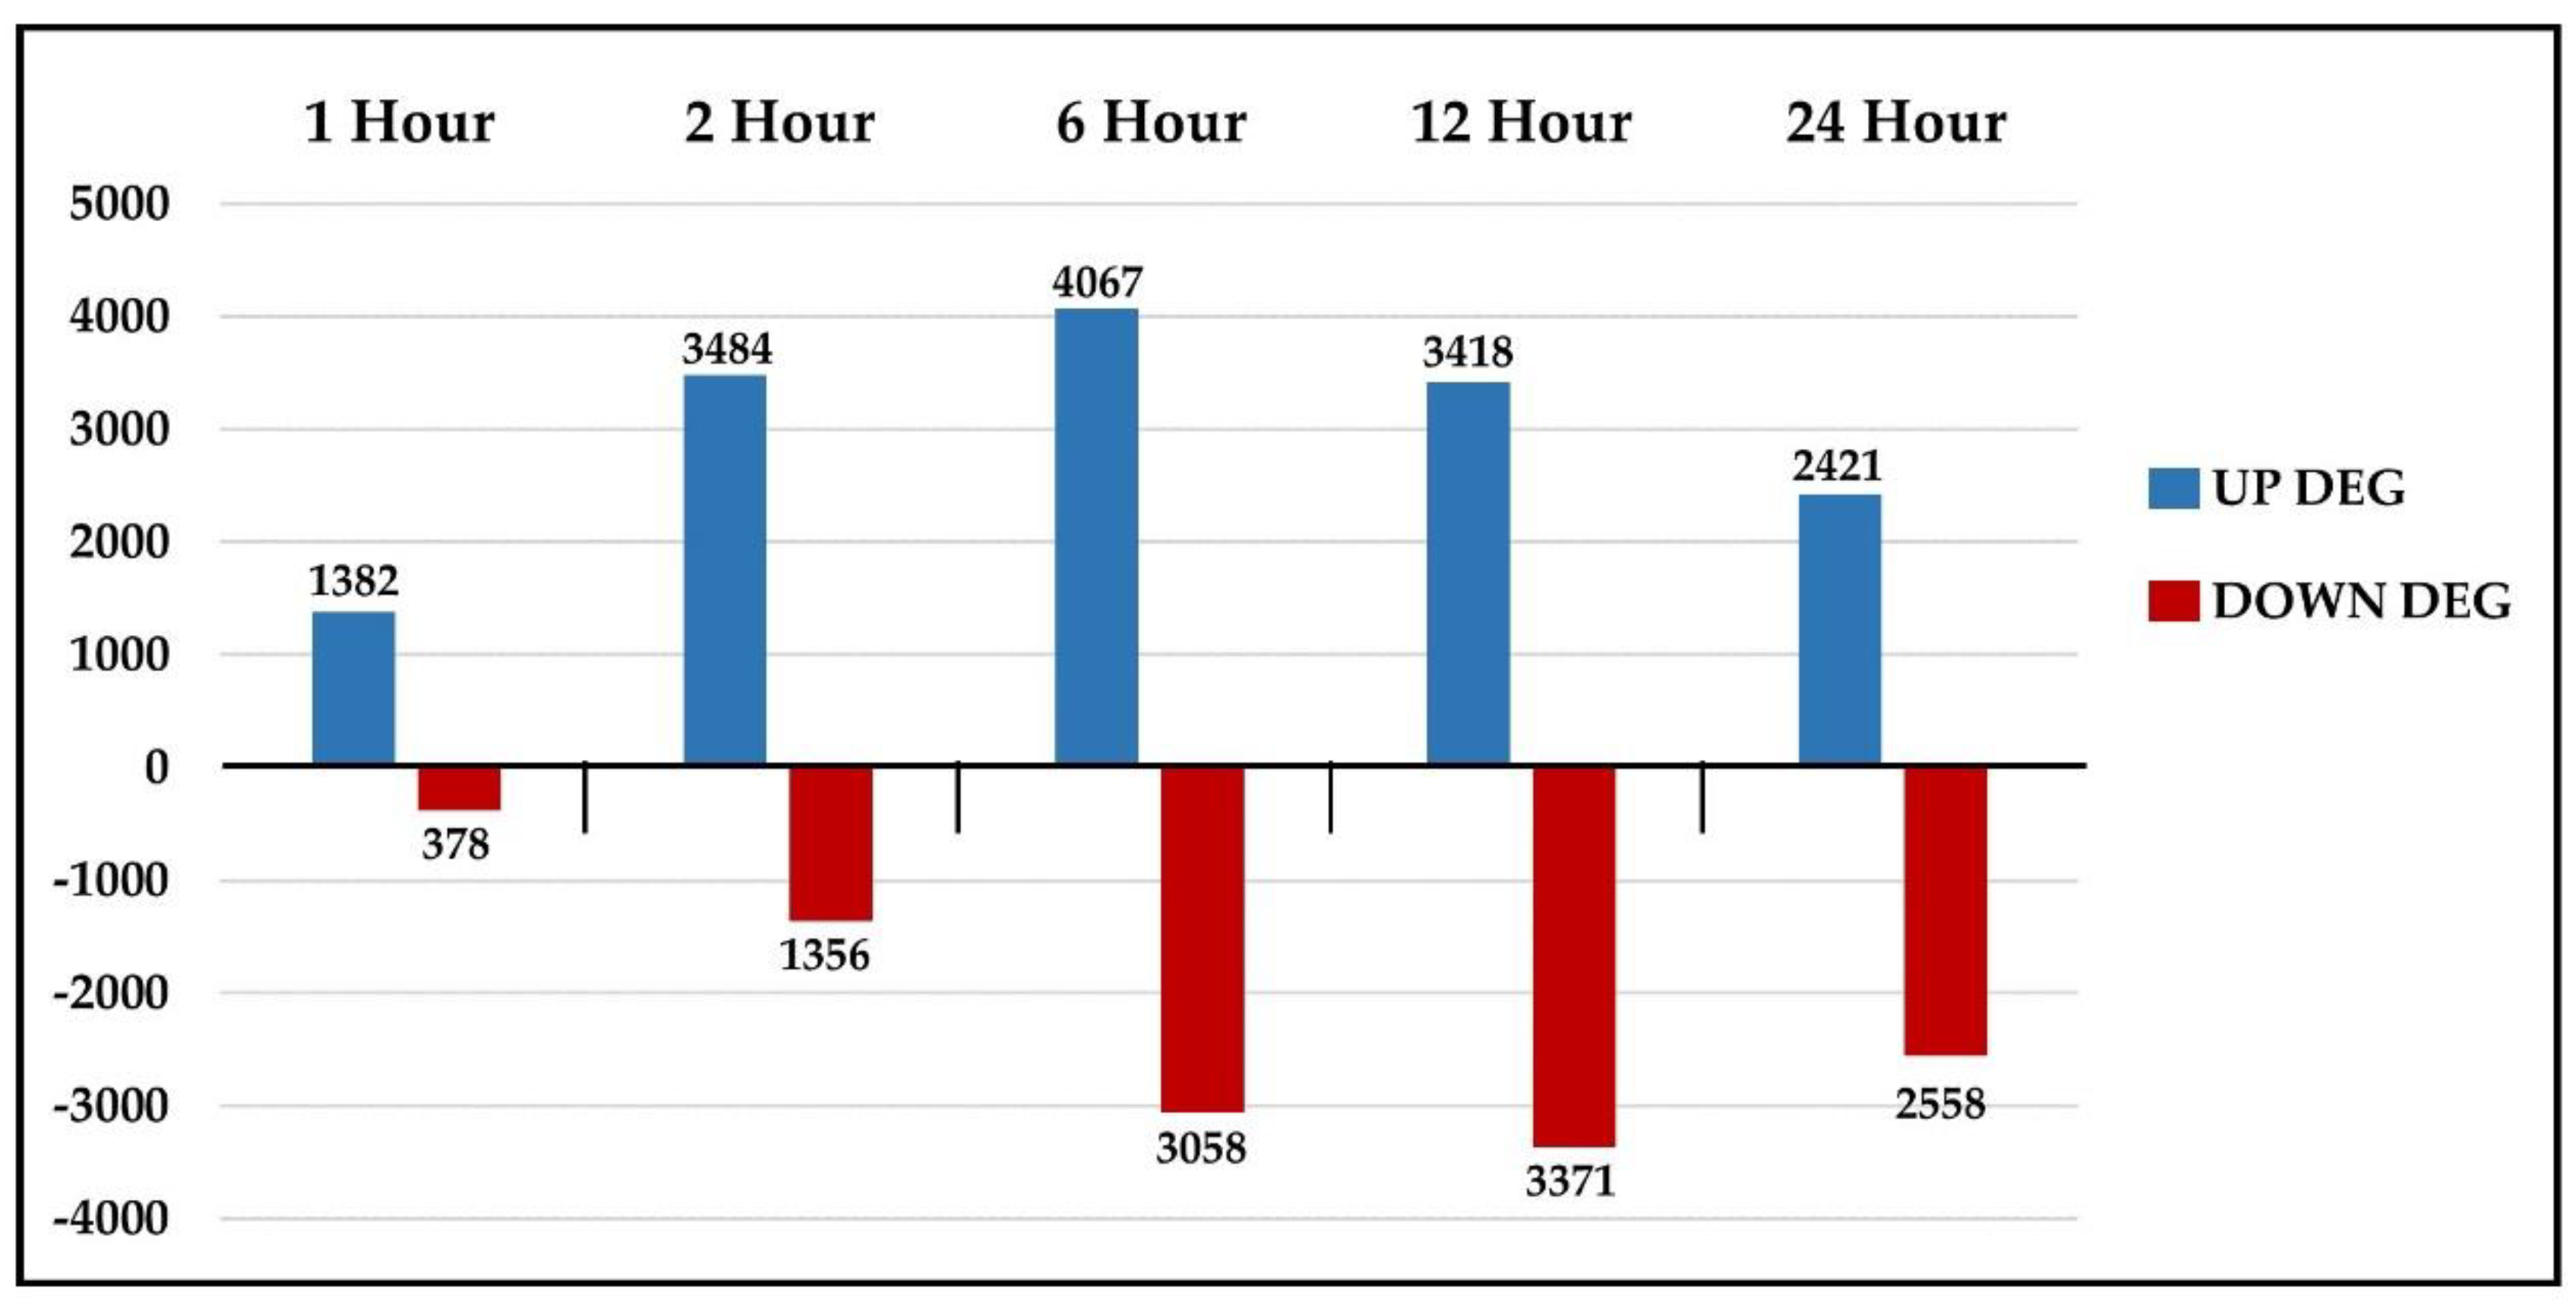
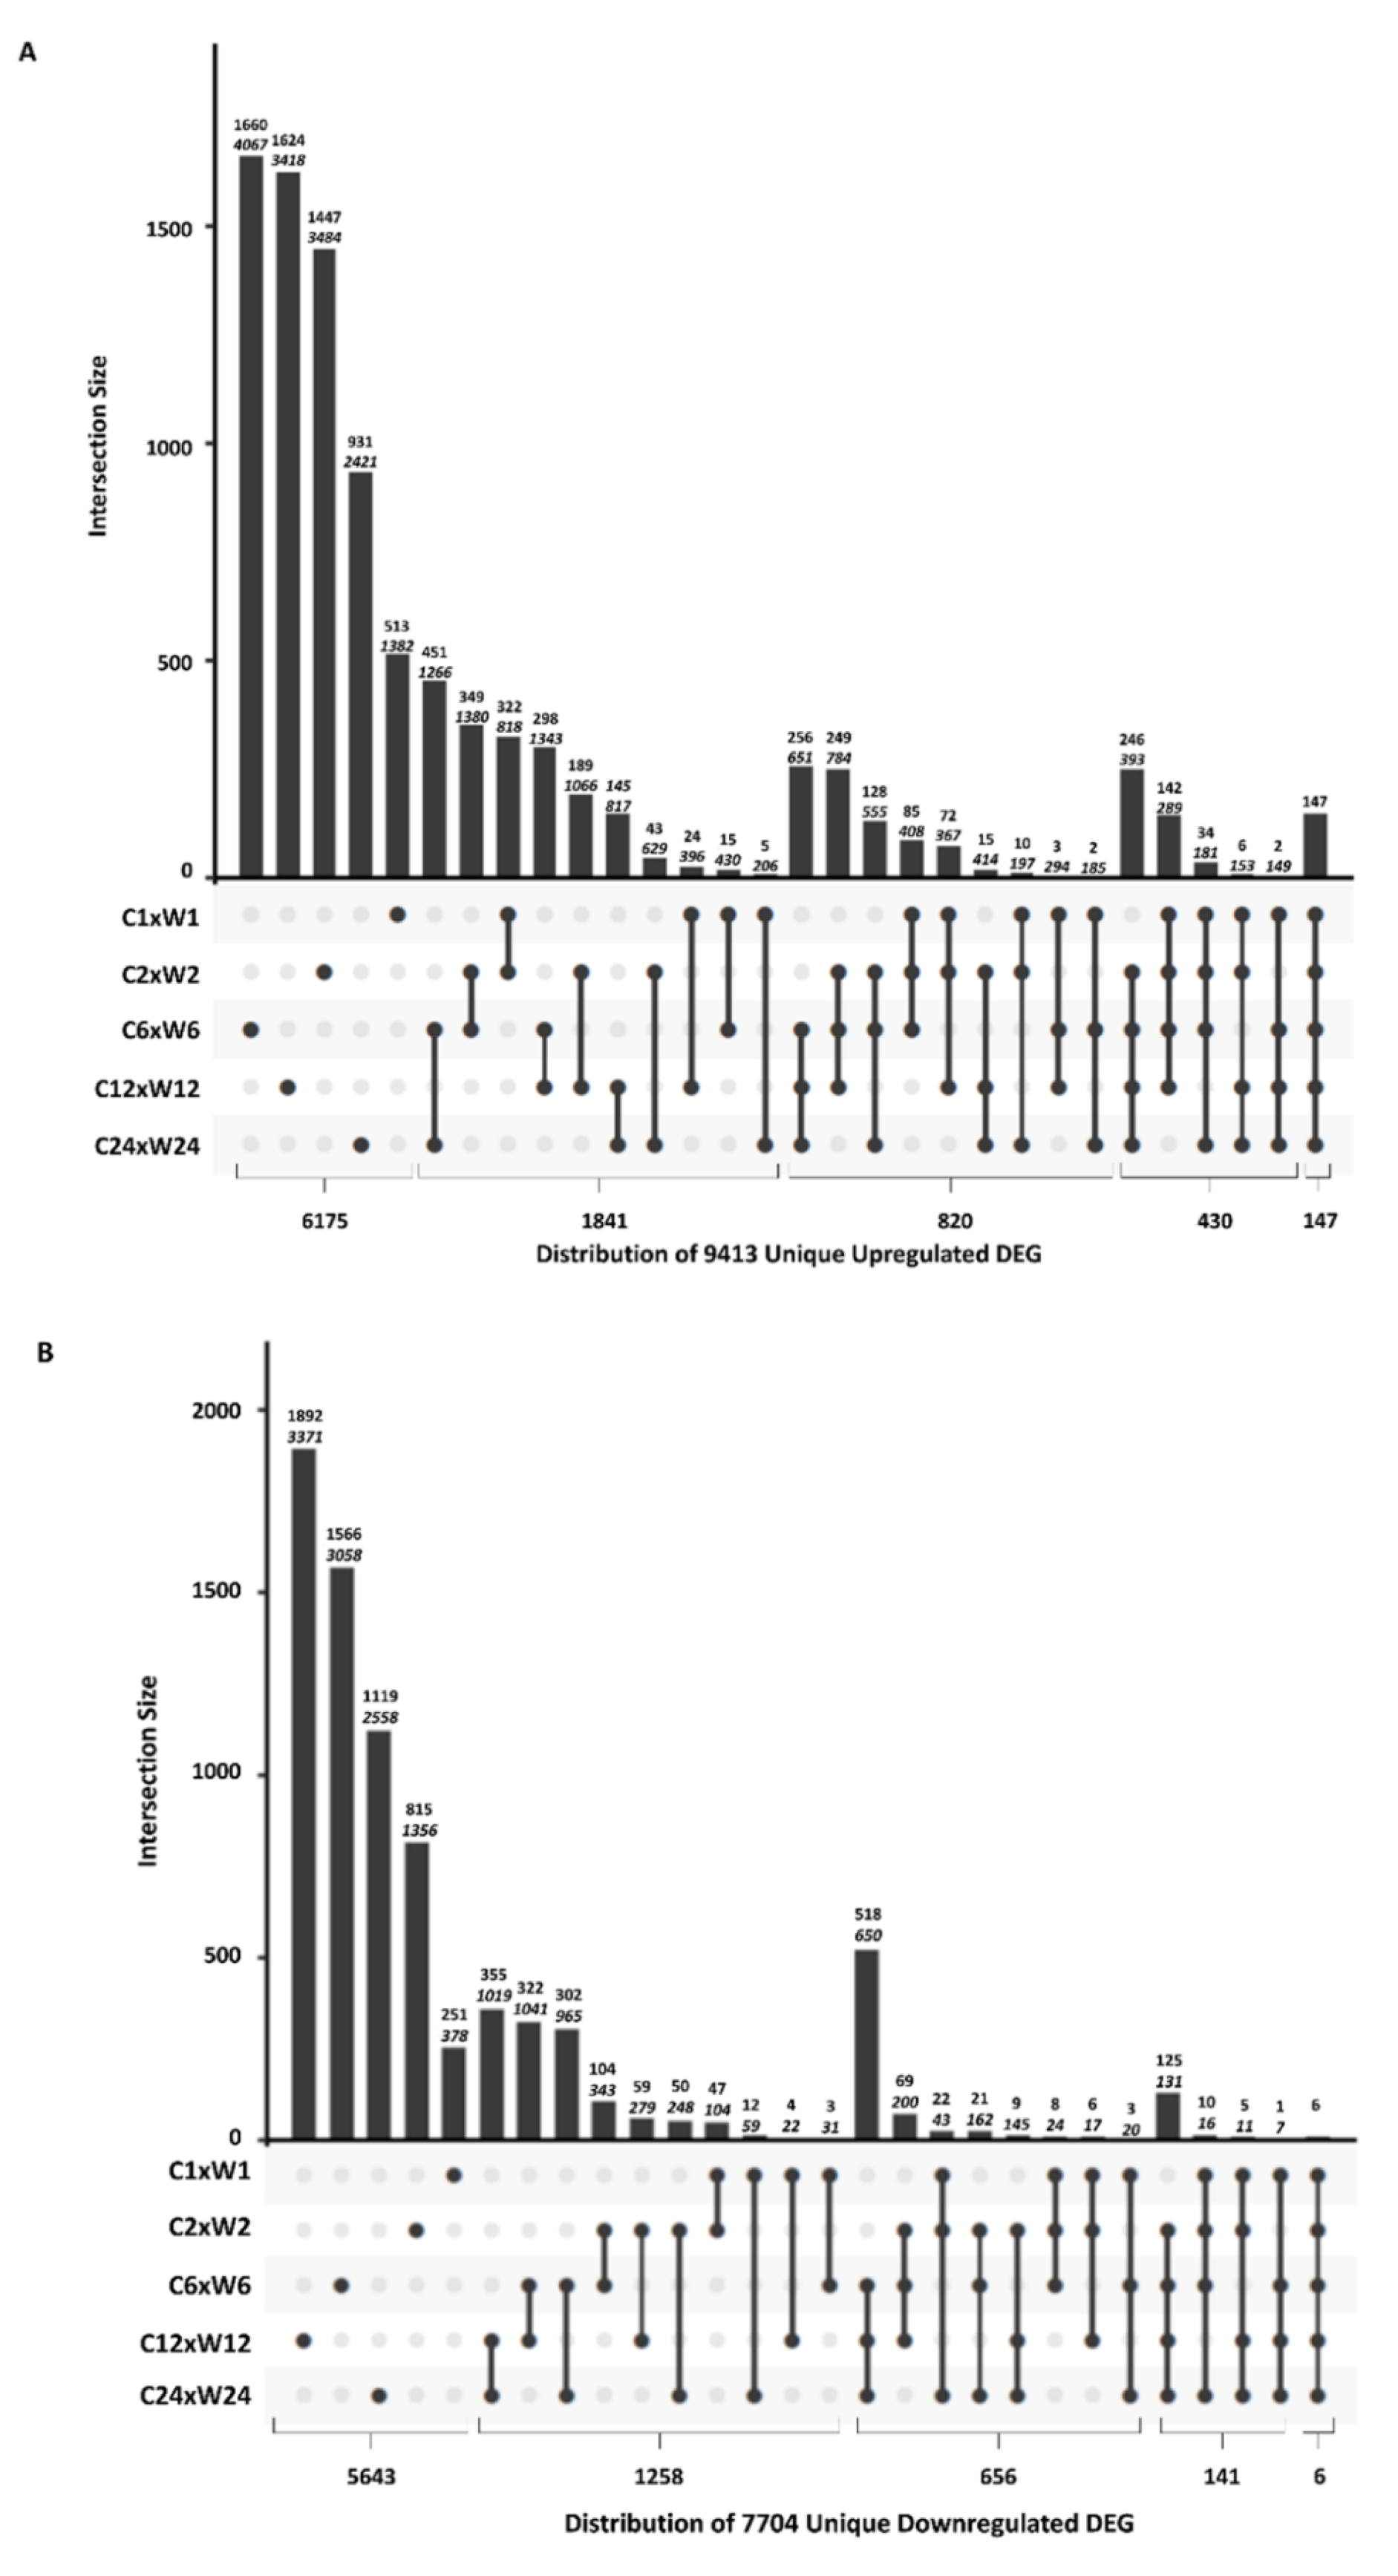
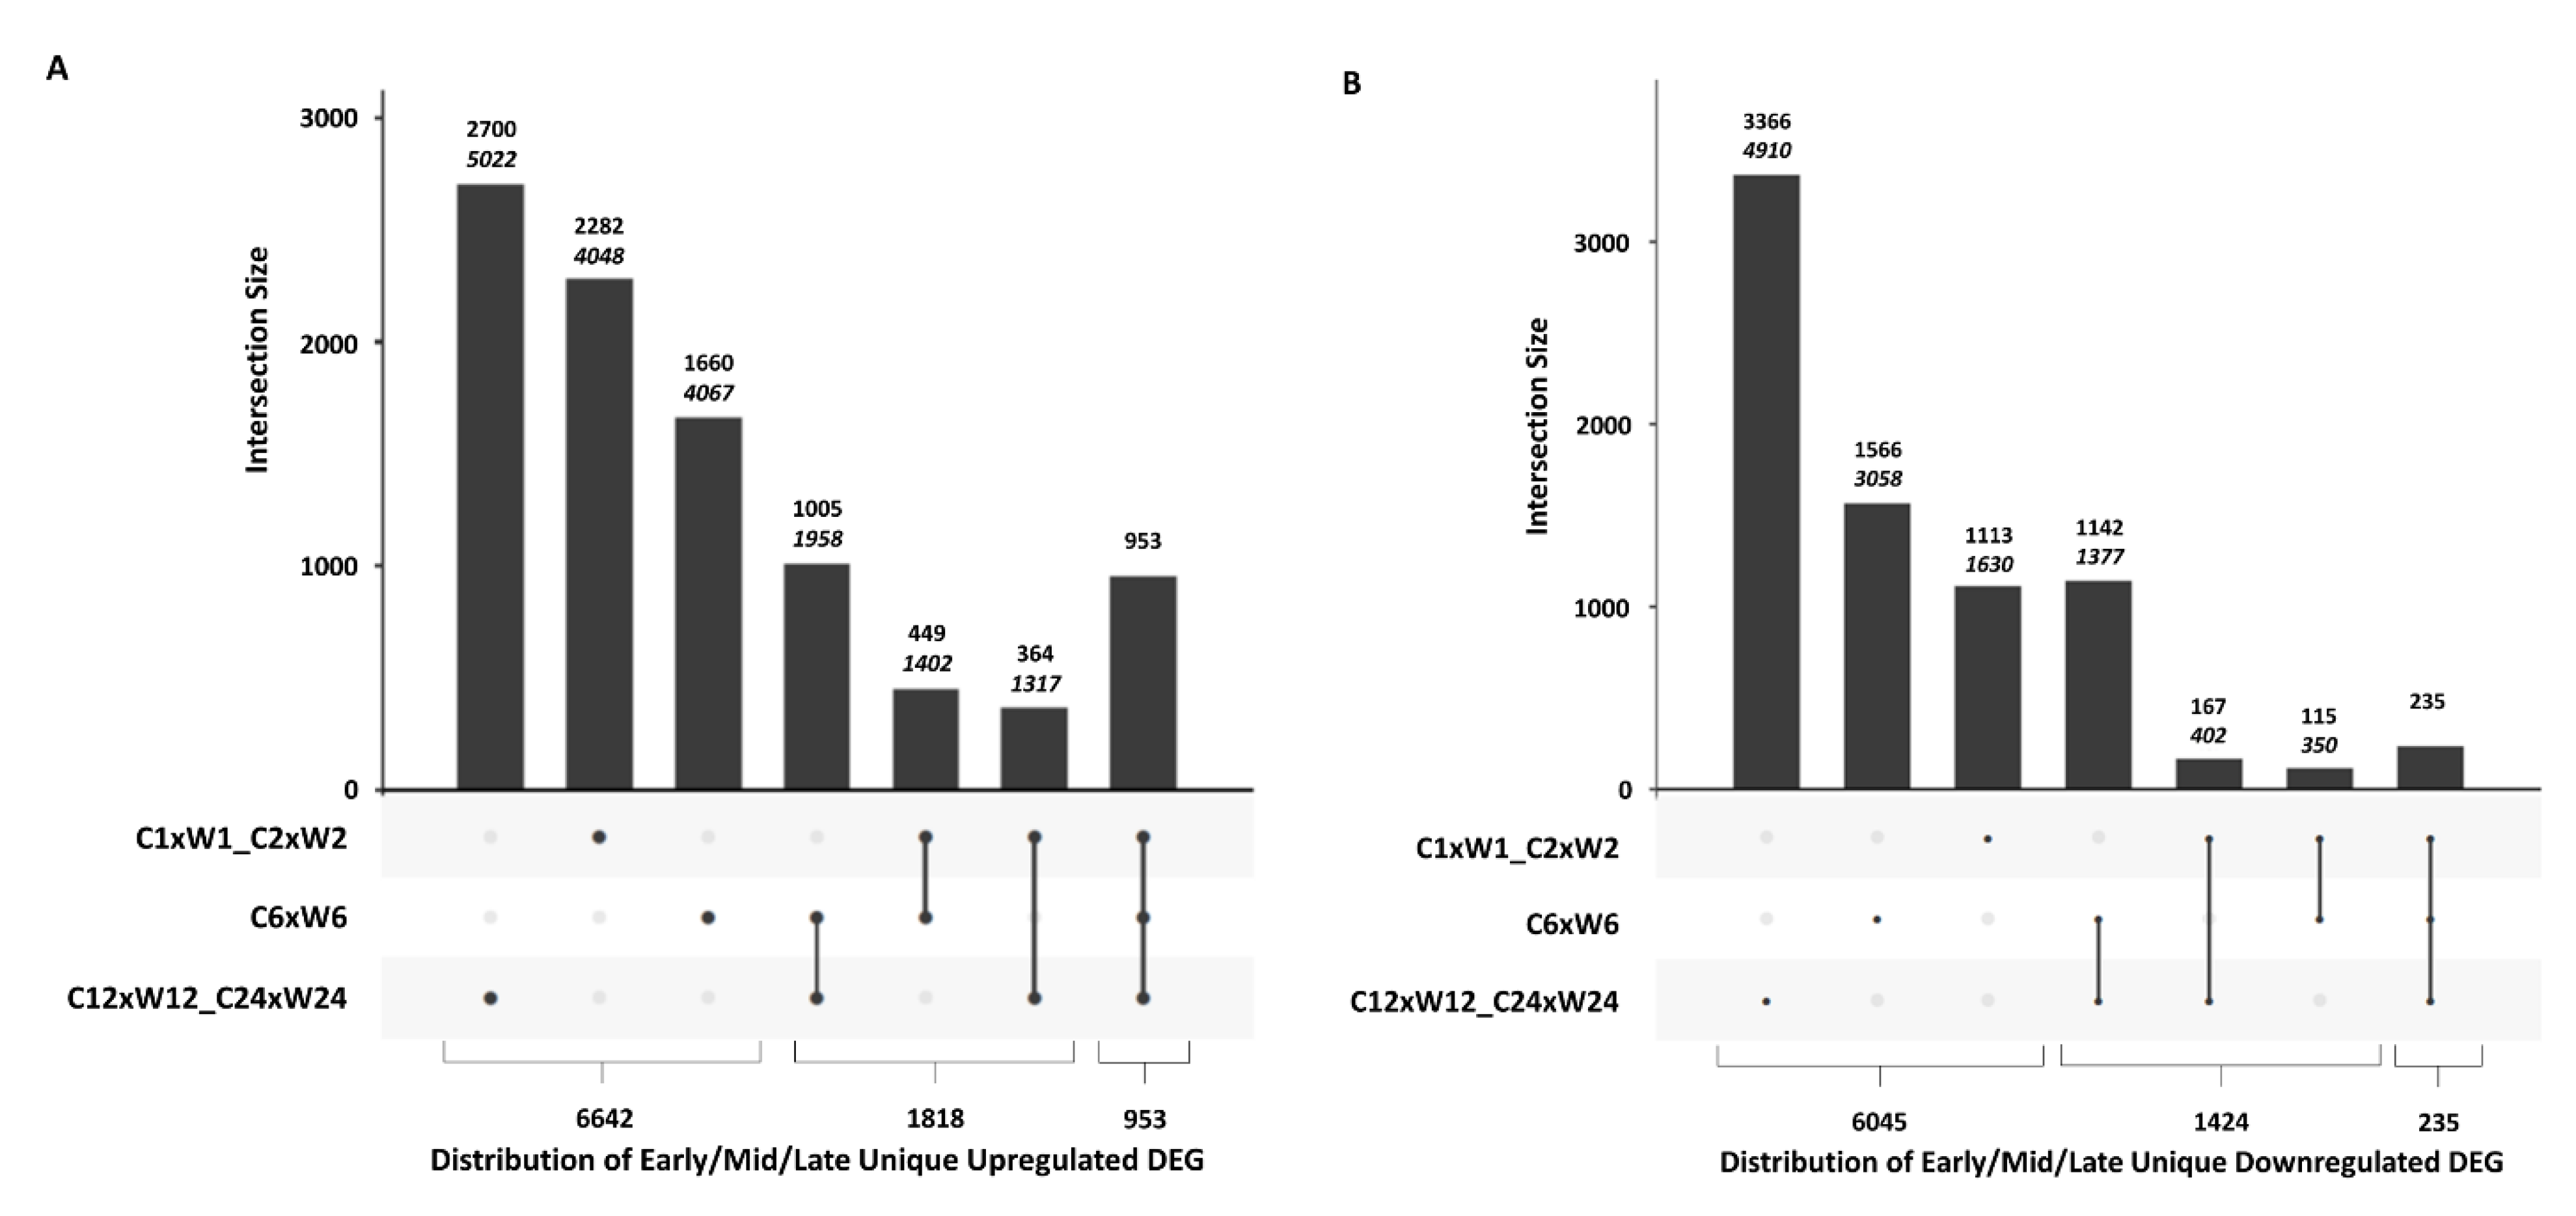
2.3. Comparative Analysis of DEGs at Different Time Points
2.4. DEG Categories
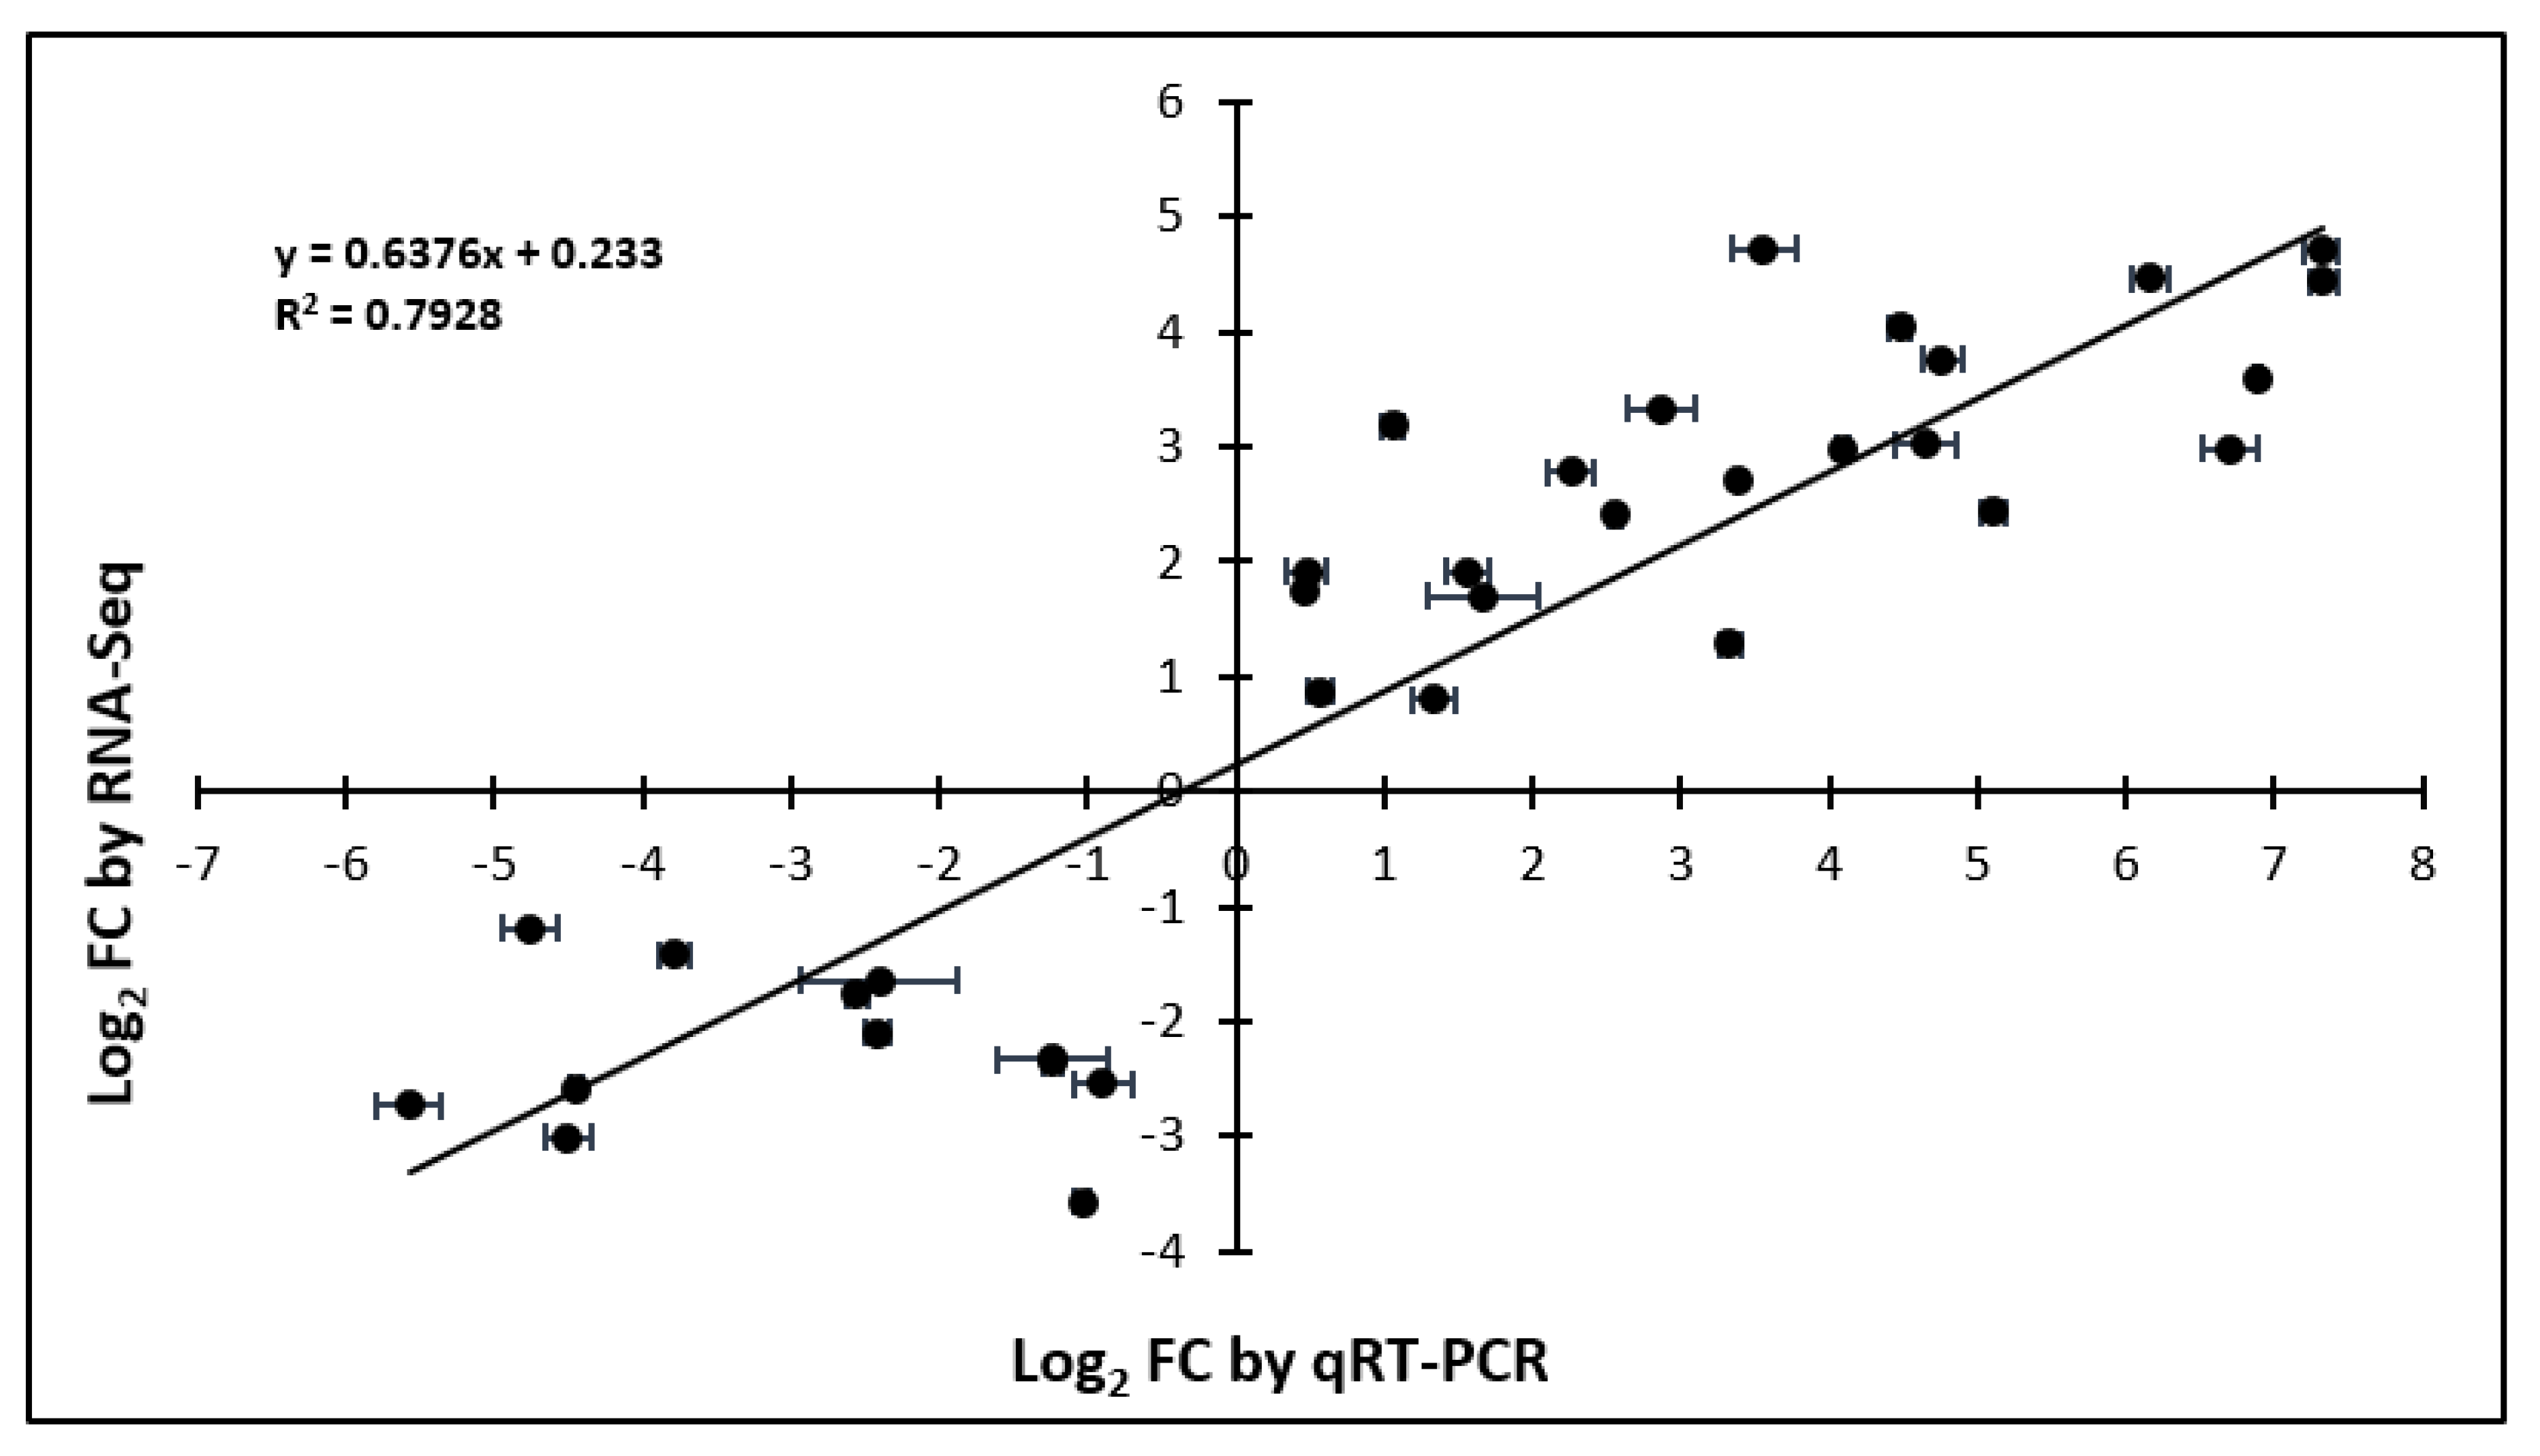
2.5. Validation of RNA-Seq with qRT-PCR
3. Materials and Methods
3.1. Plant Materials
3.2. Plant Treatments
3.3. RNA Sample Preparation and Illumina Sequencing
3.4. Transcriptome Assembly and Analysis
3.5. Validation of RNA-Seq with qRT-PCR
4. Conclusions
Supplementary Materials
Author Contributions
Funding
Acknowledgments
Conflicts of Interest
References
- Green, T.R.; Ryan, C.A. Wound-induced proteinase inhibitor in plant leaves: A possible defense mechanism against insects. Science 1972, 175, 776–777. [Google Scholar] [CrossRef] [Green Version]
- Schilmiller, A.L.; Howe, G.A. Systemic signaling in the wound response. Curr. Opin. Plant Biol. 2005, 8, 369–377. [Google Scholar] [CrossRef]
- Wasternack, C.; Stenzel, I.; Hause, B.; Hause, G.; Kutter, C.; Maucher, H.; Neumerkel, J.; Feussner, I.; Miersch, O. The wound response in tomato–role of jasmonic acid. J. Plant Physiol. 2006, 163, 297–306. [Google Scholar] [CrossRef]
- Cheong, Y.H.; Chang, H.S.; Gupta, R.; Wang, X.; Zhu, T.; Luan, S. Transcriptional profiling reveals novel interactions between wounding, pathogen, abiotic stress, and hormonal responses in Arabidopsis. Plant Physiol. 2002, 129, 661–677. [Google Scholar] [CrossRef] [Green Version]
- Maffei, M.E.; Mithöfer, A.; Boland, W. Before gene expression: Early events in plant–insect interaction. Trends Plant Sci. 2007, 12, 310–316. [Google Scholar] [CrossRef]
- Maffei, M.E.; Mithöfer, A.; Boland, W. Insects feeding on plants: Rapid signals and responses preceding the induction of phytochemical release. Phytochemistry 2007, 68, 2946–2959. [Google Scholar] [CrossRef]
- Koo, A.J.; Howe, G.A. The wound hormone jasmonate. Phytochemistry 2009, 70, 571–580. [Google Scholar] [CrossRef] [Green Version]
- Gilroy, S.; Białasek, M.; Suzuki, N.; Górecka, M.; Devireddy, A.R.; Karpiński, S.; Mittler, R. ROS, calcium, and electric signals: Key mediators of rapid systemic signaling in plants. Plant Physiol. 2016, 171, 1606–1615. [Google Scholar] [CrossRef] [PubMed]
- Wu, J.; Baldwin, I.T. Herbivory induced signalling in plants: Perception and action. Plant Cell Environ. 2009, 32, 1161–1174. [Google Scholar] [CrossRef] [PubMed]
- Erb, M.; Meldau, S.; Howe, G.A. Role of phytohormones in insect-specific plant reactions. Trends Plant Sci. 2012, 17, 250–259. [Google Scholar] [CrossRef] [PubMed] [Green Version]
- Kerchev, P.I.; Fenton, B.; Foyer, C.H.; Hancock, R.D. Plant responses to insect herbivory: Interactions between photosynthesis, reactive oxygen species and hormonal signalling pathways. Plant Cell Environ. 2012, 35, 441–453. [Google Scholar] [CrossRef] [PubMed]
- Baxter, A.; Mittler, R.; Suzuki, N. ROS as key players in plant stress signalling. J. Exp. Bot. 2013, 65, 1229–1240. [Google Scholar] [CrossRef] [PubMed]
- Zebelo, S.A.; Maffei, M.E. Role of early signalling events in plant–insect interactions. J. Exp. Bot. 2014, 66, 435–448. [Google Scholar] [CrossRef] [PubMed] [Green Version]
- Miller, G.; Schlauch, K.; Tam, R.; Cortes, D.; Torres, M.A.; Shulaev, V.; Dangl, J.L.; Mittler, R. The plant NADPH oxidase RBOHD mediates rapid systemic signaling in response to diverse stimuli. Sci. Signal. 2009, 2, ra45. [Google Scholar] [CrossRef] [Green Version]
- Katsir, L.; Chung, H.S.; Koo, A.J.; Howe, G.A. Jasmonate signaling: A conserved mechanism of hormone sensing. Curr. Opin. Plant Biol. 2008, 11, 428–435. [Google Scholar] [CrossRef] [Green Version]
- León, J.; Rojo, E.; Sánchez-Serrano, J.J. Wound signalling in plants. J. Exp. Bot. 2001, 52, 1–9. [Google Scholar] [CrossRef]
- Mithöfer, A.; Boland, W. Plant defense against herbivores: Chemical aspects. Annu. Rev. Plant Biol. 2012, 63, 431–450. [Google Scholar] [CrossRef] [Green Version]
- Chung, H.S.; Niu, Y.; Browse, J.; Howe, G.A. Top hits in contemporary JAZ: An update on jasmonate signaling. Phytochemistry 2009, 70, 1547–1559. [Google Scholar] [CrossRef] [Green Version]
- Howe, G.A.; Major, I.T.; Koo, A.J. Modularity in jasmonate signaling for multistress resilience. Annu. Rev. Plant Biol. 2018, 69, 387–415. [Google Scholar] [CrossRef] [Green Version]
- Wasternack, C.; Feussner, I. The oxylipin pathways: Biochemistry and function. Annu. Rev. Plant Biol. 2018, 69, 363–386. [Google Scholar] [CrossRef]
- Cheong, J.J.; Do Choi, Y. Methyl jasmonate as a vital substance in plants. Trends Genet. 2003, 19, 409–413. [Google Scholar] [CrossRef]
- Titarenko, E.; Rojo, E.; Leon, J.; Sanchez-Serrano, J.J. Jasmonic acid-dependent and -independent signaling pathways control wound-induced gene activation in Arabidopsis thaliana. Plant Physiol. 1997, 115, 817–826. [Google Scholar] [CrossRef] [PubMed] [Green Version]
- LeBrasseur, N.D.; MacIntosh, G.C.; Pérez-Amador, M.A.; Saitoh, M.; Green, P.J. Local and systemic wound-induction of RNase and nuclease activities in Arabidopsis: RNS1 as a marker for a JA-independent systemic signaling pathway. Plant J. 2002, 29, 393–403. [Google Scholar] [CrossRef] [PubMed]
- Dudareva, N.; Negre, F.; Nagegowda, D.A.; Orlova, I. Plant volatiles: Recent advances and future perspectives. Crit. Rev. Plant Sci. 2006, 25, 417–440. [Google Scholar] [CrossRef]
- Loreto, F.; Schnitzler, J.P. Abiotic stresses and induced BVOCs. Trends Plant Sci. 2010, 15, 154–166. [Google Scholar] [CrossRef] [PubMed]
- Röse, U.S.; Tumlinson, J.H. Volatiles released from cotton plants in response to Helicoverpa zea feeding damage on cotton flower buds. Planta 2004, 218, 824–832. [Google Scholar] [CrossRef]
- Röse, U.S.; Tumlinson, J.H. Systemic induction of volatile release in cotton: How specific is the signal to herbivory? Planta 2005, 222, 327–335. [Google Scholar] [CrossRef]
- Rodriguez-Saona, C.R.; Frost, C.J. New evidence for a multi-functional role of herbivore-induced plant volatiles in defense against herbivores. Plant Signal. Behav. 2010, 5, 58–60. [Google Scholar] [CrossRef]
- Scala, A.; Allmann, S.; Mirabella, R.; Haring, M.A.; Schuurink, R.C. Green leaf volatiles: A plant’s multifunctional weapon against herbivores and pathogens. Int. J. Mol. Sci. 2013, 14, 17781–17811. [Google Scholar] [CrossRef] [Green Version]
- Engelberth, J.; Alborn, H.T.; Schmelz, E.A.; Tumlinson, J.H. Airborne signals prime plants against insect herbivore attack. Proc. Natl. Acad. Sci. USA 2004, 101, 1781–1785. [Google Scholar] [CrossRef] [Green Version]
- Baldwin, I.T. Plant volatiles. Curr. Biol. 2010, 20, R392–R397. [Google Scholar] [CrossRef] [PubMed] [Green Version]
- Watkins, E.; Gianfagna, T.J.; Sun, R.; Meyer, W.A. Volatile compounds of tufted hairgrass. Crop Sci. 2006, 46, 2575–2580. [Google Scholar] [CrossRef]
- Dong, F.; Fu, X.; Watanabe, N.; Su, X.; Yang, Z. Recent advances in the emission and functions of plant vegetative volatiles. Molecules 2016, 21, 124. [Google Scholar] [CrossRef] [PubMed]
- Kessler, A.; Halitschke, R.; Diezel, C.; Baldwin, I.T. Priming of plant defense responses in nature by airborne signaling between Artemisia tridentata and Nicotiana attenuata. Oecologia 2006, 148, 280–292. [Google Scholar] [CrossRef]
- Heil, M.; Bueno, J.C. Within-plant signaling by volatiles leads to induction and priming of an indirect plant defense in nature. Proc. Natl. Acad. Sci. USA 2007, 104, 5467–5472. [Google Scholar] [CrossRef] [Green Version]
- Frost, C.J.; Mescher, M.C.; Carlson, J.E.; De Moraes, C.M. Plant defense priming against herbivores: Getting ready for a different battle. Plant Physiol. 2008, 146, 818–824. [Google Scholar] [CrossRef] [PubMed] [Green Version]
- Karban, R.; Shiojiri, K.; Huntzinger, M.; McCall, A.C. Damage-induced resistance in sagebrush: Volatiles are key to intra-and interplant communication. Ecology 2006, 87, 922–930. [Google Scholar] [CrossRef]
- Shiojiri, K.; Ozawa, R.; Matsui, K.; Sabelis, M.W.; Takabayashi, J. Intermittent exposure to traces of green leaf volatiles triggers a plant response. Sci. Rep. 2012, 2, 378. [Google Scholar] [CrossRef] [Green Version]
- Ton, J.; D’alessandro, M.; Jourdie, V.; Jakab, G.; Karlen, D.; Held, M.; Mauch-Mani, B.; Turlings, T.C. Priming by airborne signals boosts direct and indirect resistance in maize. Plant J. 2007, 49, 16–26. [Google Scholar] [CrossRef] [Green Version]
- Frost, C.J.; Appel, H.M.; Carlson, J.E.; De Moraes, C.M.; Mescher, M.C.; Schultz, J.C. Within-plant signalling via volatiles overcomes vascular constraints on systemic signalling and primes responses against herbivores. Ecol. Lett. 2007, 10, 490–498. [Google Scholar] [CrossRef]
- Kim, J.; Felton, G.W. Priming of antiherbivore defensive responses in plants. Insect Sci. 2013, 20, 273–285. [Google Scholar] [CrossRef] [PubMed]
- Dombrowski, J.E.; Kronmiller, B.A.; Hollenbeck, V.G.; Rhodes, A.C.; Henning, J.A.; Martin, R.C. Transcriptome analysis of the model grass Lolium temulentum exposed to green leaf volatiles. BMC Plant Biol. 2019, 19, 222. [Google Scholar] [CrossRef] [PubMed] [Green Version]
- Matsui, K. Green leaf volatiles: Hydroperoxide lyase pathway of oxylipin metabolism. Curr. Opin. Plant Biol. 2006, 9, 274–280. [Google Scholar] [CrossRef] [PubMed]
- Rakwal, R.; Tamogami, S.; Agrawal, G.K.; Iwahashi, H. Octadecanoid signaling component “burst” in rice (Oryza sativa L.) seedling leaves upon wounding by cut and treatment with fungal elicitor chitosan. Biochem. Biophys. Res. Comm. 2002, 295, 1041–1045. [Google Scholar] [CrossRef]
- Agrawal, G.K.; Tamogami, S.; Han, O.; Iwahashi, H.; Rakwal, R. Rice octadecanoid pathway. Biochem Biophys Res Comm. 2004, 317, 1–5. [Google Scholar] [CrossRef]
- Zhou, G.; Qi, J.; Ren, N.; Cheng, J.; Erb, M.; Mao, B.; Lou, Y. Silencing OsHI-LOX makes rice more susceptible to chewing herbivores, but enhances resistance to a phloem feeder. Plant J. 2009, 60, 638–648. [Google Scholar] [CrossRef]
- Wakuta, S.; Suzuki, E.; Saburi, W.; Matsuura, H.; Nabeta, K.; Imai, R.; Matsui, H. OsJAR1 and OsJAR2 are jasmonyl-L-isoleucine synthases involved in wound-and pathogen-induced jasmonic acid signalling. Biochem. Biophys. Res. Comm. 2011, 409, 634–639. [Google Scholar] [CrossRef] [Green Version]
- Szczegielniak, J.; Borkiewicz, L.; Szurmak, B.; Lewandowska-Gnatowska, E.; Statkiewicz, M.; Klimecka, M.; Cieśla, J.; Muszyńska, G. Maize calcium-dependent protein kinase (ZmCPK11): Local and systemic response to wounding, regulation by touch and components of jasmonate signaling. Physiol. Plant. 2012, 146, 1–4. [Google Scholar] [CrossRef]
- Zimmermann, M.R.; Maischak, H.; Mithöfer, A.; Boland, W.; Felle, H.H. System potentials, a novel electrical long-distance apoplastic signal in plants, induced by wounding. Plant Physiol. 2009, 149, 1593–1600. [Google Scholar] [CrossRef] [Green Version]
- Felle, H.H.; Zimmermann, M.R. Systemic signalling in barley through action potentials. Planta 2007, 226, 203. [Google Scholar] [CrossRef]
- Cho, K.; Agrawal, G.K.; Jwa, N.S.; Kubo, A.; Rakwal, R. Rice OsSIPK and its orthologs: A “central master switch” for stress responses. Biochem. Biophys. Res. Comm. 2009, 379, 649–653. [Google Scholar] [CrossRef] [PubMed]
- Sinha, A.K.; Jaggi, M.; Raghuram, B.; Tuteja, N. Mitogen-activated protein kinase signaling in plants under abiotic stress. Plant Signal. Behav. 2011, 6, 196–203. [Google Scholar] [CrossRef] [PubMed] [Green Version]
- Schmelz, E.A.; Alborn, H.T.; Tumlinson, J.H. The influence of intact-plant and excised-leaf bioassay designs on volicitin- and jasmonic acid-induced sesquiterpene volatile release in Zea mays. Planta 2001, 214, 171–179. [Google Scholar] [CrossRef] [PubMed]
- Piesik, D.; Pańka, D.; Delaney, K.J.; Skoczek, A.; Lamparski, R.; Weaver, D.K. Cereal crop volatile organic compound induction after mechanical injury, beetle herbivory (Oulema spp.), or fungal infection (Fusarium spp.). J. Plant. Physiol. 2011, 168, 878–886. [Google Scholar] [CrossRef]
- Engelberth, J.; Seidl-Adams, I.; Schultz, J.C.; Tumlinson, J.H. Insect elicitors and exposure to green leafy volatiles differentially upregulate major octadecanoids and transcripts of 12-oxo phytodienoic acid reductases in Zea mays. Mol. Plant-Microbe Interact. 2007, 20, 707–716. [Google Scholar] [CrossRef] [Green Version]
- Shen, S.; Jing, Y.; Kuang, T. Proteomics approach to identify wound-response related proteins from rice leaf sheath. Proteomics 2003, 3, 527–535. [Google Scholar] [CrossRef]
- Lawrence, S.D.; Novak, N.G. Maize genes induced by herbivory and volicitin. J. Chem. Ecol. 2004, 30, 2543–2557. [Google Scholar] [CrossRef]
- Zhang, F.; Zhu, L.; He, G. Differential gene expression in response to brown planthopper feeding in rice. J. Plant Physiol. 2004, 161, 53–62. [Google Scholar] [CrossRef] [Green Version]
- Kim, K.M.; Cho, S.K.; Shin, S.H.; Kim, G.T.; Lee, J.H.; Oh, B.J.; Kang, K.H.; Hong, J.C.; Choi, J.Y.; Shin, J.S.; et al. Analysis of differentially expressed transcripts of fungal elicitor-and wound-treated wild rice (Oryza grandiglumis). J. Plant Res. 2005, 118, 347–354. [Google Scholar] [CrossRef]
- Van Loon, L.C.; Rep, M.; Pieterse, C.M. Significance of inducible defense-related proteins in infected plants. Annu. Rev. Phytopathol. 2006, 44, 135–162. [Google Scholar] [CrossRef] [Green Version]
- Tamayo, M.C.; Rufat, M.; Bravo, J.M.; San Segundo, B. Accumulation of a maize proteinase inhibitor in response to wounding and insect feeding, and characterization of its activity toward digestive proteinases of Spodoptera littoralis larvae. Planta 2000, 211, 62–71. [Google Scholar] [CrossRef]
- Tiffin, P.; Gaut, B.S. Molecular evolution of the wound-induced serine protease inhibitor wip1 in Zea and related genera. Mol. Biol. Evol. 2001, 18, 2092–2101. [Google Scholar] [CrossRef] [PubMed] [Green Version]
- Mur, L.A.; Xu, R.; Casson, S.A.; Stoddart, W.M.; Routledge, A.P.; Draper, J. Characterization of a proteinase inhibitor from Brachypodium distachyon suggests the conservation of defence signalling pathways between dicotyledonous plants and grasses. Mol. Plant Pathol. 2004, 5, 267–280. [Google Scholar] [CrossRef]
- Le Deunff, E.; Davoine, C.; Le Dantec, C.; Billard, J.P.; Huault, C. Oxidative burst and expression of germin/oxo genes during wounding of ryegrass leaf blades: Comparison with senescence of leaf sheaths. Plant J. 2004, 38, 421–431. [Google Scholar] [CrossRef] [PubMed]
- Chen, S.; Cai, Y.; Zhang, L.; Yan, X.; Cheng, L.; Qi, D.; Zhou, Q.; Li, X.; Liu, G. Transcriptome analysis reveals common and distinct mechanisms for sheepgrass (Leymus chinensis) responses to defoliation compared to mechanical wounding. PLoS ONE 2014, 9, e89495. [Google Scholar] [CrossRef] [Green Version]
- Dombrowski, J.E.; Hind, S.R.; Martin, R.C.; Stratmann, J.W. Wounding systemically activates a mitogen-activated protein kinase in forage and turf grasses. Plant Sci. 2011, 180, 686–693. [Google Scholar] [CrossRef] [PubMed]
- Dombrowski, J.E.; Martin, R.C. Green leaf volatiles, fire and nonanoic acid activate MAPkinases in the model grass species Lolium temulentum. BMC Res. Notes 2014, 7, 807. [Google Scholar] [CrossRef] [PubMed] [Green Version]
- Dombrowski, J.E.; Martin, R.C. Activation of MAP kinases by green leaf volatiles in grasses. BMC Res. Notes 2018, 11, 79. [Google Scholar] [CrossRef]
- Hou, X.; Ding, L.; Yu, H. Crosstalk between GA and JA signaling mediates plant growth and defense. Plant Cell Rep. 2013, 32, 1067–1074. [Google Scholar] [CrossRef]
- Kazan, K. Diverse roles of jasmonates and ethylene in abiotic stress tolerance. Trends Plant Sci. 2015, 20, 219–229. [Google Scholar] [CrossRef]
- Schaller, F.; Biesgen, C.; Müssig, C.; Altmann, T.; Weiler, E.W. 12-Oxophytodienoate reductase 3 (OPR3) is the isoenzyme involved in jasmonate biosynthesis. Planta 2000, 210, 979–984. [Google Scholar] [CrossRef] [PubMed]
- Schaller, A.; Stintzi, A. Enzymes in jasmonate biosynthesis-structure, function, regulation. Phytochemistry 2009, 70, 1532–1538. [Google Scholar] [CrossRef] [PubMed]
- Ishiguro, S.; Kawai-Oda, A.; Ueda, J.; Nishida, I.; Okada, K. The DEFECTIVE IN ANTHER DEHISCENCE1 gene encodes a novel phospholipase A1 catalyzing the initial step of jasmonic acid biosynthesis, which synchronizes pollen maturation, anther dehiscence, and flower opening in Arabidopsis. Plant Cell 2001, 13, 2191–2209. [Google Scholar] [CrossRef] [PubMed] [Green Version]
- Martin, D.; Tholl, D.; Gershenzon, J.; Bohlmann, J. Methyl jasmonate induces traumatic resin ducts, terpenoid resin biosynthesis, and terpenoid accumulation in developing xylem of Norway spruce stems. Plant Physiol. 2002, 129, 1003–1018. [Google Scholar] [CrossRef] [PubMed] [Green Version]
- Franceschi, V.R.; Krekling, T.; Christiansen, E. Application of methyl jasmonate on Picea abies (Pinaceae) stems induces defense-related responses in phloem and xylem. Am. J. Bot. 2002, 89, 578–586. [Google Scholar] [CrossRef] [PubMed]
- Martin, D.M.; Gershenzon, J.; Bohlmann, J. Induction of volatile terpene biosynthesis and diurnal emission by methyl jasmonate in foliage of Norway spruce. Plant Physiol. 2003, 132, 1586–1599. [Google Scholar] [CrossRef] [PubMed] [Green Version]
- McKay, S.A.; Hunter, W.L.; Godard, K.A.; Wang, S.X.; Martin, D.M.; Bohlmann, J.; Plant, A.L. Insect attack and wounding induce traumatic resin duct development and gene expression of (-)-pinene synthase in Sitka spruce. Plant Physiol. 2003, 133, 368–378. [Google Scholar] [CrossRef] [Green Version]
- Hudgins, J.W.; Christiansen, E.; Franceschi, V.R. Methyl jasmonate induces changes mimicking anatomical defenses in diverse members of the Pinaceae. Tree Physiol. 2003, 23, 361–371. [Google Scholar] [CrossRef] [Green Version]
- Hudgins, J.W.; Christiansen, E.; Franceschi, V.R. Induction of anatomically based defense responses in stems of diverse conifers by methyl jasmonate: A phylogenetic perspective. Tree Physiol. 2004, 24, 251–264. [Google Scholar] [CrossRef] [Green Version]
- Miller, B.; Madilao, L.L.; Ralph, S.; Bohlmann, J. Insect-induced conifer defense. White pine weevil and methyl jasmonate induce traumatic resinosis, de novo formed volatile emissions, and accumulation of terpenoid synthase and putative octadecanoid pathway transcripts in Sitka spruce. Plant Physiol. 2005, 137, 369–382. [Google Scholar] [CrossRef] [Green Version]
- Krokene, P.; Nagy, N.E.; Solheim, H. Methyl jasmonate and oxalic acid treatment of Norway spruce: Anatomically based defense responses and increased resistance against fungal infection. Tree Physiol. 2008, 28, 29–35. [Google Scholar] [CrossRef] [Green Version]
- Ralph, S.; Park, J.Y.; Bohlmann, J.; Mansfield, S.D. Dirigent proteins in conifer defense: Gene discovery, phylogeny, and differential wound-and insect-induced expression of a family of DIR and DIR-like genes in spruce (Picea spp.). Plant Mol Biol. 2006, 60, 21. [Google Scholar] [CrossRef] [PubMed]
- Chano, V.; Collada, C.; Soto, A. Transcriptomic analysis of wound xylem formation in Pinus canariensis. BMC Plant Biol. 2017, 17, 234. [Google Scholar] [CrossRef] [PubMed] [Green Version]
- Bleecker, A.B.; Kende, H. Ethylene: A gaseous signal molecule in plants. Annu. Rev. Cell. Devel. Biol. 2000, 16, 1–8. [Google Scholar] [CrossRef] [PubMed] [Green Version]
- Tuteja, N.; Mahajan, S. Calcium signaling network in plants: An overview. Plant Signal. Behav. 2007, 2, 79–85. [Google Scholar] [CrossRef] [PubMed] [Green Version]
- Batistič, O.; Kudla, J. Analysis of calcium signaling pathways in plants. Biochim Biophys Acta (BBA)-General Subjects. 2012, 1820, 1283–1293. [Google Scholar] [CrossRef]
- Ogasawara, Y.; Kaya, H.; Hiraoka, G.; Yumoto, F.; Kimura, S.; Kadota, Y.; Hishinuma, H.; Senzaki, E.; Yamagoe, S.; Nagata, K.; et al. Synergistic activation of the Arabidopsis NADPH oxidase AtrbohD by Ca2+ and phosphorylation. J. Biol. Chem. 2008, 283, 8885–8892. [Google Scholar] [CrossRef] [Green Version]
- Orozco-Cardenas, M.; Ryan, C.A. Hydrogen peroxide is generated systemically in plant leaves by wounding and systemin via the octadecanoid pathway. Proc. Natl. Acad. Sci. USA 1999, 96, 6553–6557. [Google Scholar] [CrossRef] [Green Version]
- Mittler, R.; Vanderauwera, S.; Suzuki, N.; Miller, G.A.; Tognetti, V.B.; Vandepoele, K.; Gollery, M.; Shulaev, V.; Van Breusegem, F. ROS signaling: The new wave? Trends Plant Sci. 2011, 16, 300–309. [Google Scholar] [CrossRef]
- Kimura, S.; Kaya, H.; Kawarazaki, T.; Hiraoka, G.; Senzaki, E.; Michikawa, M.; Kuchitsu, K. Protein phosphorylation is a prerequisite for the Ca2+-dependent activation of Arabidopsis NADPH oxidases and may function as a trigger for the positive feedback regulation of Ca2+ and reactive oxygen species. Biochim. Biophys. Acta (BBA)-Mol. Cell Res. 2012, 1823, 398–405. [Google Scholar] [CrossRef] [Green Version]
- Choi, W.G.; Miller, G.; Wallace, I.; Harper, J.; Mittler, R.; Gilroy, S. Orchestrating rapid long-distance signaling in plants with Ca2+, ROS and electrical signals. Plant J. 2017, 90, 698–707. [Google Scholar] [CrossRef] [PubMed] [Green Version]
- Minibayeva, F.; Beckett, R.P.; Kranner, I. Roles of apoplastic peroxidases in plant response to wounding. Phytochemistry 2015, 112, 122–129. [Google Scholar] [CrossRef] [PubMed]
- Stone, J.M.; Walker, J.C. Plant protein kinase families and signal transduction. Plant Physiol. 1995, 108, 451–457. [Google Scholar] [CrossRef] [PubMed] [Green Version]
- Dissmeyer, N.; Schnittger, A. The age of protein kinases. In Plant Kinases. Methods in Molecular Biology (Methods and Protocols); Dissmeyer, N., Schnittger, A., Eds.; Humana Press: Totowa, NJ, USA, 2011; Volume 779, pp. 7–52. [Google Scholar]
- Cristina, M.S.; Petersen, M.; Mundy, J. Mitogen-activated protein kinase signaling in plants. Annu. Rev. Plant Biol. 2010, 61, 621–649. [Google Scholar] [CrossRef] [PubMed]
- Smékalová, V.; Doskočilová, A.; Komis, G.; Šamaj, J. Crosstalk between secondary messengers, hormones and MAPK modules during abiotic stress signalling in plants. Biotechnol. Adv. 2014, 32, 2–11. [Google Scholar] [CrossRef]
- Taj, G.; Agarwal, P.; Grant, M.; Kumar, A. MAPK machinery in plants: Recognition and response to different stresses through multiple signal transduction pathways. Plant Signal. Behav. 2010, 5, 1370–1378. [Google Scholar] [CrossRef] [Green Version]
- Dombrowski, J.E.; Martin, R.C. Abiotic stresses activate a MAPkinase in the model grass species Lolium temulentum. J. Plant Physiol. 2012, 169, 915–919. [Google Scholar] [CrossRef]
- Livanos, P.; Apostolakos, P.; Galatis, B. Plant cell division: ROS homeostasis is required. Plant Signal. Behav. 2012, 7, 771–778. [Google Scholar] [CrossRef] [Green Version]
- Xu, J.; Zhang, S. Mitogen-activated protein kinase cascades in signaling plant growth and development. Trends Plant Sci. 2015, 20, 56–64. [Google Scholar] [CrossRef]
- Komis, G.; Illés, P.; Beck, M.; Šamaj, J. Microtubules and mitogen-activated protein kinase signalling. Curr. Opin. Plant Biol. 2011, 14, 650–657. [Google Scholar] [CrossRef]
- Beck, M.; Komis, G.; Ziemann, A.; Menzel, D.; Šamaj, J. Mitogen-activated protein kinase 4 is involved in the regulation of mitotic and cytokinetic microtubule transitions in Arabidopsis thaliana. New Phytol. 2011, 189, 10691083. [Google Scholar] [CrossRef] [PubMed]
- Zárský, V.; Hirt, H. A Mitogen-activated protein kinase kinase kinase mediates reactive oxygen species homeostasis in Arabidopsis. J. Biol. Chem. 2006, 281, 38697–38704. [Google Scholar]
- Scheer, J.M.; Ryan, C.A. The systemin receptor SR160 from Lycopersicon peruvianum is a member of the LRR receptor kinase family. Proc. Natl. Acad. Sci. USA 2002, 99, 9585–9590. [Google Scholar] [CrossRef] [PubMed] [Green Version]
- Szekeres, M. Brassinosteroid and systemin: Two hormones perceived by the same receptor. Trends Plant Sci. 2003, 8, 102–104. [Google Scholar] [CrossRef]
- Planas-Riverola, A.; Gupta, A.; Betegón-Putze, I.; Bosch, N.; Ibañes, M.; Caño-Delgado, A.I. Brassinosteroid signaling in plant development and adaptation to stress. Development 2019, 146, dev151894. [Google Scholar] [CrossRef] [PubMed] [Green Version]
- Zhu, J.Y.; Sae-Seaw, J.; Wang, Z.Y. Brassinosteroid signalling. Development 2013, 140, 1615–1620. [Google Scholar] [CrossRef] [Green Version]
- Hara, K.; Yagi, M.; Kusano, T.; Sano, H. Rapid systemic accumulation of transcripts encoding a tobacco WRKY transcription factor upon wounding. Mol. Gen. Genet. MGG 2000, 263, 30–37. [Google Scholar] [CrossRef]
- Pandey, S.P.; Somssich, I.E. The role of WRKY transcription factors in plant immunity. Plant Physiol. 2009, 150, 1648–1655. [Google Scholar] [CrossRef] [Green Version]
- Phukan, U.J.; Jeena, G.S.; Shukla, R.K. WRKY transcription factors: Molecular regulation and stress responses in plants. Front. Plant Sci. 2016, 7, 760. [Google Scholar] [CrossRef] [Green Version]
- Heyman, J.; Cools, T.; Canher, B.; Shavialenka, S.; Traas, J.; Vercauteren, I.; Van den Daele, H.; Persiau, G.; De Jaeger, G.; Sugimoto, K.; et al. The heterodimeric transcription factor complex ERF115–PAT1 grants regeneration competence. Nat. Plants 2016, 2, 16165. [Google Scholar] [CrossRef]
- Ikeuchi, M.; Iwase, A.; Rymen, B.; Lambolez, A.; Kojima, M.; Takebayashi, Y.; Heyman, J.; Watanabe, S.; Seo, M.; De Veylder, L.; et al. Wounding triggers callus formation via dynamic hormonal and transcriptional changes. Plant Physiol. 2017, 175, 1158–1174. [Google Scholar] [CrossRef] [PubMed] [Green Version]
- Gapper, C.; Dolan, L. Control of plant development by reactive oxygen species. Plant Physiol. 2006, 141, 341–345. [Google Scholar] [CrossRef] [Green Version]
- Foreman, J.; Demidchik, V.; Bothwell, J.H.; Mylona, P.; Miedema, H.; Torres, M.A.; Linstead, P.; Costa, S.; Brownlee, C.; Jones, J.D.; et al. Reactive oxygen species produced by NADPH oxidase regulate plant cell growth. Nature 2003, 422, 442. [Google Scholar] [CrossRef]
- Mironov, V.; De Veylder, L.; Van Montagu, M.; Inzé, D. Cyclin-dependent kinases and cell division in plants-the nexus. Plant Cell 1999, 11, 509–521. [Google Scholar] [PubMed] [Green Version]
- Wang, H.; Zhou, Y.; Gilmer, S.; Whitwill, S.; Fowke, L.C. Expression of the plant cyclin-dependent kinase inhibitor ICK1 affects cell division, plant growth and morphology. Plant J. 2000, 24, 613–623. [Google Scholar] [CrossRef] [PubMed]
- Cockcroft, C.E.; den Boer, B.G.; Healy, J.S.; Murray, J.A. Cyclin D control of growth rate in plants. Nature 2000, 405, 575. [Google Scholar] [CrossRef]
- Quilliam, R.S.; Swarbrick, P.J.; Scholes, J.D.; Rolfe, S.A. Imaging photosynthesis in wounded leaves of Arabidopsis thaliana. J. Exp. Bot. 2006, 57, 55–69. [Google Scholar] [CrossRef] [Green Version]
- Carpita, N.C. Update on mechanisms of plant cell wall biosynthesis: How plants make cellulose and other (1→ 4)-β-D-glycans. Plant Physiol. 2011, 155, 171–184. [Google Scholar] [CrossRef] [Green Version]
- Miedes, E.; Zarra, I.; Hoson, T.; Herbers, K.; Sonnewald, U.; Lorences, E.P. Xyloglucan endotransglucosylase and cell wall extensibility. J. Plant Physiol. 2011, 168, 196–203. [Google Scholar] [CrossRef] [Green Version]
- Van Sandt, V.S.; Suslov, D.; Verbelen, J.P.; Vissenberg, K. Xyloglucan endotransglucosylase activity loosens a plant cell wall. Ann. Bot. 2007, 100, 1467–1473. [Google Scholar] [CrossRef] [Green Version]
- Cosgrove, D.J. Plant expansins: Diversity and interactions with plant cell walls. Curr. Opin. Plant Biol. 2015, 25, 162–172. [Google Scholar] [CrossRef] [PubMed] [Green Version]
- Carpita, N.C. Structure and biogenesis of the cell walls of grasses. Annu. Rev. Plant Biol. 1996, 47, 445–476. [Google Scholar] [CrossRef] [PubMed]
- Hoson, T.; Nevins, D.J. β-D-Glucan antibodies inhibit auxin-induced cell elongation and changes in the cell wall of Zea coleoptile segments. Plant Physiol. 1989, 90, 1353–1358. [Google Scholar] [CrossRef] [PubMed] [Green Version]
- Akiyama, T.; Jin, S.; Yoshida, M.; Hoshino, T.; Opassiri, R.; Cairns, J.R. Expression of an endo-(1, 3; 1, 4)-β-glucanase in response to wounding, methyl jasmonate, abscisic acid and ethephon in rice seedlings. J. Plant Physiol. 2009, 166, 1814–1825. [Google Scholar] [CrossRef]
- Delrot, S.; Atanassova, R.; Gomès, E.; Coutos-Thévenot, P. Plasma membrane transporters: A machinery for uptake of organic solutes and stress resistance. Plant Sci. 2001, 161, 391–404. [Google Scholar] [CrossRef]
- Sherson, S.M.; Alford, H.L.; Forbes, S.M.; Wallace, G.; Smith, S.M. Roles of cell-wall invertases and monosaccharide transporters in the growth and development of Arabidopsis. J. Exp. Bot. 2003, 54, 525–531. [Google Scholar] [CrossRef] [Green Version]
- Tegeder, M. Transporters for amino acids in plant cells: Some functions and many unknowns. Curr. Opin. Plant Biol. 2012, 15, 315–321. [Google Scholar] [CrossRef]
- Al-Whaibi, M.H. Plant heat-shock proteins: A mini review. J King Saud Univ. Sci. 2011, 23, 139–150. [Google Scholar] [CrossRef] [Green Version]
- Wang, W.; Vinocur, B.; Shoseyov, O.; Altman, A. Role of plant heat-shock proteins and molecular chaperones in the abiotic stress response. Trends Plant Sci. 2004, 9, 244–252. [Google Scholar] [CrossRef]
- Ryan, C.A. Protease inhibitors in plants: Genes for improving defenses against insects and pathogens. Annu. Rev. Phytopathol. 1990, 28, 425–449. [Google Scholar] [CrossRef]
- Koiwa, H.; Bressan, R.A.; Hasegawa, P.M. Regulation of protease inhibitors and plant defense. Trends Plant Sci. 1997, 2, 379–384. [Google Scholar] [CrossRef]
- Habib, H.; Fazili, K.M. Plant protease inhibitors: A defense strategy in plants. Biotechnol. Mol. Biol. Rev. 2007, 2, 68–85. [Google Scholar]
- Eckelkamp, C.; Ehmann, B.; Schöpfer, P. Wound-induced systemic accumulation of a transcript coding for a Bowman-Birk trypsin inhibitor-related protein in maize (Zea mays L.) seedlings. FEBS Lett. 1993, 323, 73–76. [Google Scholar] [CrossRef] [Green Version]
- Cordero, M.J.; Raventós, D.; San Segundo, B. Expression of a maize proteinase inhibitor gene is induced in response to wounding and fungal infection: Systemic wound-response of a monocot gene. Plant J. 1994, 6, 141–150. [Google Scholar] [CrossRef] [PubMed]
- Sels, J.; Mathys, J.; De Coninck, B.M.; Cammue, B.P.; De Bolle, M.F. Plant pathogenesis-related (PR) proteins: A focus on PR peptides. Plant Physiol. Biochem. 2008, 46, 941–950. [Google Scholar] [CrossRef] [PubMed]
- Mauch, F.; Mauch-Mani, B.; Boller, T. Antifungal hydrolases in pea tissue: II. Inhibition of fungal growth by combinations of chitinase and β-1, 3-glucanase. Plant Physiol. 1988, 88, 936–942. [Google Scholar] [CrossRef] [Green Version]
- Jongedijk, E.; Tigelaar, H.; Van Roekel, J.S.; Bres-Vloemans, S.A.; Dekker, I.; van den Elzen, P.J.; Cornelissen, B.J.; Melchers, L.S. Synergistic activity of chitinases and β-1, 3-glucanases enhances fungal resistance in transgenic tomato plants. Euphytica 1995, 85, 173–180. [Google Scholar] [CrossRef] [Green Version]
- Grover, A. Plant chitinases: Genetic diversity and physiological roles. Crit. Rev. Plant Sci. 2012, 31, 57–73. [Google Scholar] [CrossRef]
- Balasubramanian, V.; Vashisht, D.; Cletus, J.; Sakthivel, N. Plant β-1, 3-glucanases: Their biological functions and transgenic expression against phytopathogenic fungi. Biotechnol. Lett. 2012, 34, 1983–1990. [Google Scholar] [CrossRef]
- Romeis, T.; Tang, S.; Hammond-Kosack, K.; Piedras, P.; Blatt, M.; Jones, J.D. Early signalling events in the Avr9/Cf-9-dependent plant defence response. Mol. Plant Pathol. 2000, 1, 3–8. [Google Scholar] [CrossRef]
- Mitsuhara, I.; Iwai, T.; Seo, S.; Yanagawa, Y.; Kawahigasi, H.; Hirose, S.; Ohkawa, Y.; Ohashi, Y. Characteristic expression of twelve rice PR1 family genes in response to pathogen infection, wounding, and defense-related signal compounds (121/180). Mol. Genet. Genom. 2008, 279, 415–427. [Google Scholar] [CrossRef] [PubMed] [Green Version]
- Krishnaveni, S.; Muthukrishnan, S.; Liang, G.H.; Wilde, G.; Manickam, A. Induction of chitinases and β-1, 3-glucanases in resistant and susceptible cultivars of sorghum in response to insect attack, fungal infection and wounding. Plant Sci. 1999, 144, 9–16. [Google Scholar] [CrossRef]
- Savatin, D.V.; Gramegna, G.; Modesti, V.; Cervone, F. Wounding in the plant tissue: The defense of a dangerous passage. Front. Plant Sci. 2014, 5, 470. [Google Scholar] [CrossRef] [PubMed] [Green Version]
- Martin, M. Cutadapt removes adapter sequences from high-throughput sequencing reads. EMBnet. J. 2011, 17, 10–12. [Google Scholar] [CrossRef]
- Li, H. Aligning sequence reads, clone sequences and assembly contigs with BWA-MEM. arXiv 2013, arXiv:1303.3997. [Google Scholar]
- Li, H.; Handsaker, B.; Wysoker, A.; Fennell, T.; Ruan, J.; Homer, N.; Marth, G.; Abecasis, G.; Durbin, R. The sequence alignment/map format and SAMtools. Bioinformatics 2009, 25, 2078–2079. [Google Scholar] [CrossRef] [Green Version]
- Trapnell, C.; Hendrickson, D.G.; Sauvageau, M.; Goff, L.; Rinn, J.L.; Pachter, L. Differential analysis of gene regulation at transcript resolution with RNA-seq. Nat. Biotechnol. 2013, 31, 46. [Google Scholar] [CrossRef]
- Goff, L.; Trapnell, C.; Kelley, D. cummeRbund: Analysis, Exploration, Manipulation, and Visualization of Cufflinks High-Throughput Sequencing Data; R package version. 2013. Available online: https://www.bioconductor.org/packages/release/bioc/html/cummeRbund.html (accessed on 26 April 2020).
- UniProt Consortium. UniProt: A worldwide hub of protein knowledge. Nucleic Acids Res. 2019, 47, D506–D515. [Google Scholar]
- Altschul, S.F.; Gish, W.; Miller, W.; Myers, E.W.; Lipman, D.J. Basic local alignment search tool. J. Mol. Biol. 1990, 215, 403–410. [Google Scholar] [CrossRef]
- Huntley, R.P.; Sawford, T.; Mutowo-Meullenet, P.; Shypitsyna, A.; Bonilla, C.; Martin, M.J.; O’Donovan, C. The GOA database: Gene ontology annotation updates for 2015. Nucleic Acids Res. 2015, 43, D1057–D1063. [Google Scholar] [CrossRef]
- Ashburner, M.; Ball, C.A.; Blake, J.A.; Botstein, D.; Butler, H.; Cherry, J.M.; Davis, A.P.; Dolinski, K.; Dwight, S.S.; Eppig, J.T.; et al. Gene ontology: Tool for the unification of biology. Nat. Genet. 2000, 25, 25–29. [Google Scholar] [CrossRef] [PubMed] [Green Version]
- Gene Ontology Consortium. The gene ontology resource: 20 years and still GOing strong. Nucleic Acids Res. 2019, 47, D330–D338. [Google Scholar]
- Ye, J.; Fang, L.; Zheng, H.; Zhang, Y.; Chen, J.; Zhang, Z.; Wang, J.; Li, S.; Li, R.; Bolund, L.; et al. WEGO: A web tool for plotting GO annotations. Nucleic Acids Res. 2006, 34 (Suppl. 2), W293–W297. [Google Scholar] [CrossRef] [PubMed]
- Conway, J.R.; Lex, A.; Gehlenborg, N. UpSetR: An R package for the visualization of intersecting sets and their properties. Bioinformatics 2017, 33, 2938–2940. [Google Scholar] [CrossRef] [Green Version]
- Dombrowski, J.E.; Martin, R.C. Evaluation of reference genes for quantitative RT-PCR in Lolium temulentum under abiotic stress. Plant Sci. 2009, 176, 390–396. [Google Scholar] [CrossRef]


| Time (h) | Treatment | Replicate 1 | Replicate 2 | Replicate 3 | |||
|---|---|---|---|---|---|---|---|
| Reads | Alignment | Reads | Alignment | Reads | Alignment | ||
| 1 | Control | 59843094 | 98.5% | 58101312 | 98.2% | 59686650 | 98.0% |
| 2 | Control | 64916262 | 98.5% | 74641320 | 98.0% | 67418496 | 98.0% |
| 6 | Control | 64740740 | 98.6% | 68759474 | 98.0% | 71426244 | 97.8% |
| 12 | Control | 48624754 | 98.4% | 43314674 | 98.3% | 37368582 | 98.4% |
| 24 | Control | 64365702 | 98.6% | 68469240 | 98.2% | 68572898 | 97.9% |
| 1 | Wound | 62072772 | 98.6% | 62531754 | 98.0% | 52132476 | 98.1% |
| 2 | Wound | 69339124 | 98.3% | 83197276 | 97.9% | 57943888 | 98.2% |
| 6 | Wound | 62301400 | 98.5% | 61347708 | 98.0% | 61003562 | 98.1% |
| 12 | Wound | 55820584 | 98.2% | 47114420 | 98.2% | 60013782 | 98.3% |
| 24 | Wound | 66900286 | 98.4% | 72082570 | 98.0% | 59419184 | 98.1% |
| UP | DOWN | ||||
|---|---|---|---|---|---|
| Total DEGs (All) | 9413 | 7704 | |||
| Unannotated Sequences | 1959 | 1956 | |||
| DEGs | DEGs | ||||
| Keyword Search | UP () * | DOWN () * | Keyword Search | UP () * | DOWN () * |
| Kinase | 637 (280) | 348 (143) | Cytochrome | 173 (89) | 131 (52) |
| Receptor kinase | 281 (66) | 112 (26) | Cytochrome P450 | 133 (69) | 68 (33) |
| Mitogen-activated protein kinase/MAPK | 18 (4) | 6 (1) | Dehydrogenase | 259 (121) | 211 (79) |
| Phosphatase | 169 (70) | 76 (34) | Calcium/calmodulin | 130 (40) | 54 (24) |
| Receptor | 431 (229) | 236 (113) | Auxin | 76 (33) | 45 (12) |
| LRR receptor | 46 (23) | 15 (5) | Cytokinin | 20 (9) | 2 (0) |
| Systemin/brassinosteroid receptor | 16 (3) | 3 (1) | Salicylate/salicylic | 22 (10) | 4 (1) |
| Transcription | 382 (194) | 218 (81) | Ethylene | 78 (31) | 31 (13) |
| Transcription factor | 273 (122) | 122 (41) | Abscisic acid | 18 (4) | 6 (0) |
| WRKY | 19 (14) | 9 (6) | Gibberellin | 20 (12) | 8 (3) |
| BZIP | 27 (9) | 8 (3) | Lipoxygenase | 24 (13) | 12 (3) |
| Heat shock/chaperone | 63 (29) | 183 (38) | Jasmonate/jasmonic | 24 (12) | 9 (3) |
| Protease/proteinase/peptidase | 264 (112) | 204 (73) | Lipase | 84 (29) | 46 (13) |
| Protease/proteinase/peptidase Inhibitor | 25 (7) | 8 (0) | Phospholipase | 34 (8) | 17 (4) |
| Ubiquitin | 124 (42) | 79 (29) | Proline | 74 (31) | 50 (15) |
| Chloroplast/chloroplastic | 657 (154) | 384 (80) | Glycine betaine/proline transporter | 5 (2) | 1 (1) |
| Photosystem | 62 (10) | 15 (8) | Phenylalanine ammonia-lyase | 15 (8) | 1 (1) |
| Chlorophyll | 44 (13) | 27 (9) | Glucanase | 60 (27) | 18 (7) |
| Phytochrome | 27 (10) | 7 (3) | Ferric reductase | 8 (0) | 9 (0) |
| Sucrose | 54 (21) | 25 (5) | Expansin | 9 (4) | 16 (4) |
| Glucose | 111 (47) | 94 (19) | Xyloglucan endotransglycosylase | 19 (6) | 2 (1) |
| Glucan | 106 (50) | 49 (17) | Cellulose synthase | 19 (3) | 19 (2) |
| Glucosyltransferase | 107 (46) | 43 (16) | ATP | 433 (158) | 377 (117) |
| Monosaccharide transporter | 16 (9) | 2 (0) | ATPase | 116 (49) | 95 (31) |
| Amino acid | 95 (43) | 45 (15) | GTP | 57 (18) | 72 (16) |
| Amino acid transporter | 70 (29) | 39 (13) | GTPase | 21 (10) | 38 (10) |
| Membrane | 379 (150) | 285 (117) | Dehydrin | 5 (2) | 0 |
| Channel | 64 (23) | 31 (14) | Thioredoxin | 27 (5) | 14 (3) |
| ABC transporter | 154 (68) | 108 (62) | Thaumatin | 11 (9) | 6 (1) |
| Transport | 613 (253) | 344 (150) | Inhibitor | 80 (34) | 39 (7) |
| Transferase | 641 (322) | 557 (202) | Disease | 97 (44) | 41 (20) |
| Esterase | 130 (63) | 89 (31) | Pathogen | 44 (18) | 22 (7) |
| Invertase | 40 (15) | 21 (4) | Chitinase | 30 (21) | 11 (3) |
| Synthase | 404 (192) | 315 (126) | Avr9 | 40 (21) | 7 (2) |
| Synthetase | 153 (88) | 144 (74) | Avr9 Cf-9 | 34 (19) | 6 (2) |
| Reductase | 272 (119) | 225 (84) | Allene oxidase | 6 (3) | 0 |
| Oxidase | 238 (100) | 133 (42) | Allene cyclase | 1 (0) | 1 (1) |
| Oxygenase | 181 (89) | 71 (31) | 12-Oxophytodienoic | ||
| Peroxidase | 57 (26) | 32 (7) | acid reducase | 8 (4) | 1 (0) |
| Hydrolase | 319 (141) | 152 (69) | ACC oxidase | 29 (17) | 5 (1) |
| Total UP DEG | 1 Hour | 2 Hour | 6 Hour | 12 Hour | 24 Hour |
| 1382 | 3484 | 4067 | 3418 | 2421 | |
| DEG Designation | All UP () * | All UP () * | All UP () * | All UP () * | All UP () * |
| Kinase | 140 (81) | 321 (135) | 272 (90) | 177 (26) | 125 (40) |
| Phosphatase | 34 (22) | 82 (39) | 83 (31) | 52 (11) | 57 (20) |
| Calcium/calmodulin | 46 (16) | 89 (22) | 34 (11) | 20 (2) | 18 (9) |
| Transcription factor | 67 (39) | 151 (72) | 125 (46) | 68 (11) | 63 (13) |
| Transcription | 85 (52) | 187 (94) | 175 (67) | 93 (19) | 95 (31) |
| Synthase | 74 (39) | 158 (86) | 212 (86) | 105 (29) | 122 (47) |
| Oxidase | 34 (21) | 99 (39) | 116 (49) | 74 (19) | 75 (31) |
| Reductase | 34 (23) | 89 (48) | 144 (53) | 60 (11) | 105 (28) |
| Peroxidase | 8 (7) | 22 (9) | 33 (16) | 24 (12) | 15 (6) |
| Dehydrogenase | 42 (25) | 106 (56) | 149 (62) | 66 (7) | 81 (20) |
| Transport | 112 (66) | 280 (138) | 294 (98) | 214 (38) | 189 (60) |
| ABC transporter | 21 (9) | 80 (35) | 43 (20) | 41 (5) | 35 (14) |
| Monosaccharide transporter | 5 (2) | 10 (10) | 13 (8) | 10 (6) | 4 (1) |
| Chloroplast | 75 (49) | 141 (73) | 421 (72) | 154 (11) | 307 (32) |
| Photosystem | 2 (1) | 2 (1) | 55 (6) | 4 (2) | 35 (1) |
| Disease | 22 (5) | 49 (28) | 35 (11) | 34 (8) | 28 (6) |
| Pathogen | 11 (4) | 31 (15) | 20 (3) | 21 (9) | 13 (4) |
| Chitinase | 6 (4) | 22 (18) | 20 (12) | 13 (8) | 4 (1) |
| Glucanase | 17 (11) | 38 (20) | 32 (11) | 30 (14) | 13 (7) |
| Allene oxide synthase | 5 (2) | 5 (3) | 3 (1) | 1 (0) | 0 |
| ACC oxidase | 5 (2) | 9 (6) | 12 (6) | 8 (3) | 13 (8) |
| Thioredoxin | 3 (2) | 5 (4) | 17 (5) | 7 (0) | 11 (1) |
| Xyloglucan endotransglycoslase | 1 (0) | 10 (3) | 11 (5) | 7 (2) | 5 (3) |
© 2020 by the authors. Licensee MDPI, Basel, Switzerland. This article is an open access article distributed under the terms and conditions of the Creative Commons Attribution (CC BY) license (http://creativecommons.org/licenses/by/4.0/).
Share and Cite
Dombrowski, J.E.; Kronmiller, B.A.; Hollenbeck, V.; Martin, R.C. Transcriptome Analysis of Wounding in the Model Grass Lolium temulentum. Plants 2020, 9, 780. https://doi.org/10.3390/plants9060780
Dombrowski JE, Kronmiller BA, Hollenbeck V, Martin RC. Transcriptome Analysis of Wounding in the Model Grass Lolium temulentum. Plants. 2020; 9(6):780. https://doi.org/10.3390/plants9060780
Chicago/Turabian StyleDombrowski, James E., Brent A. Kronmiller, Vicky Hollenbeck, and Ruth C. Martin. 2020. "Transcriptome Analysis of Wounding in the Model Grass Lolium temulentum" Plants 9, no. 6: 780. https://doi.org/10.3390/plants9060780