Light Interception and the Growth of Pastures under Ideal and Stressful Growing Conditions on the Allegheny Plateau


Abstract
:1. Introduction
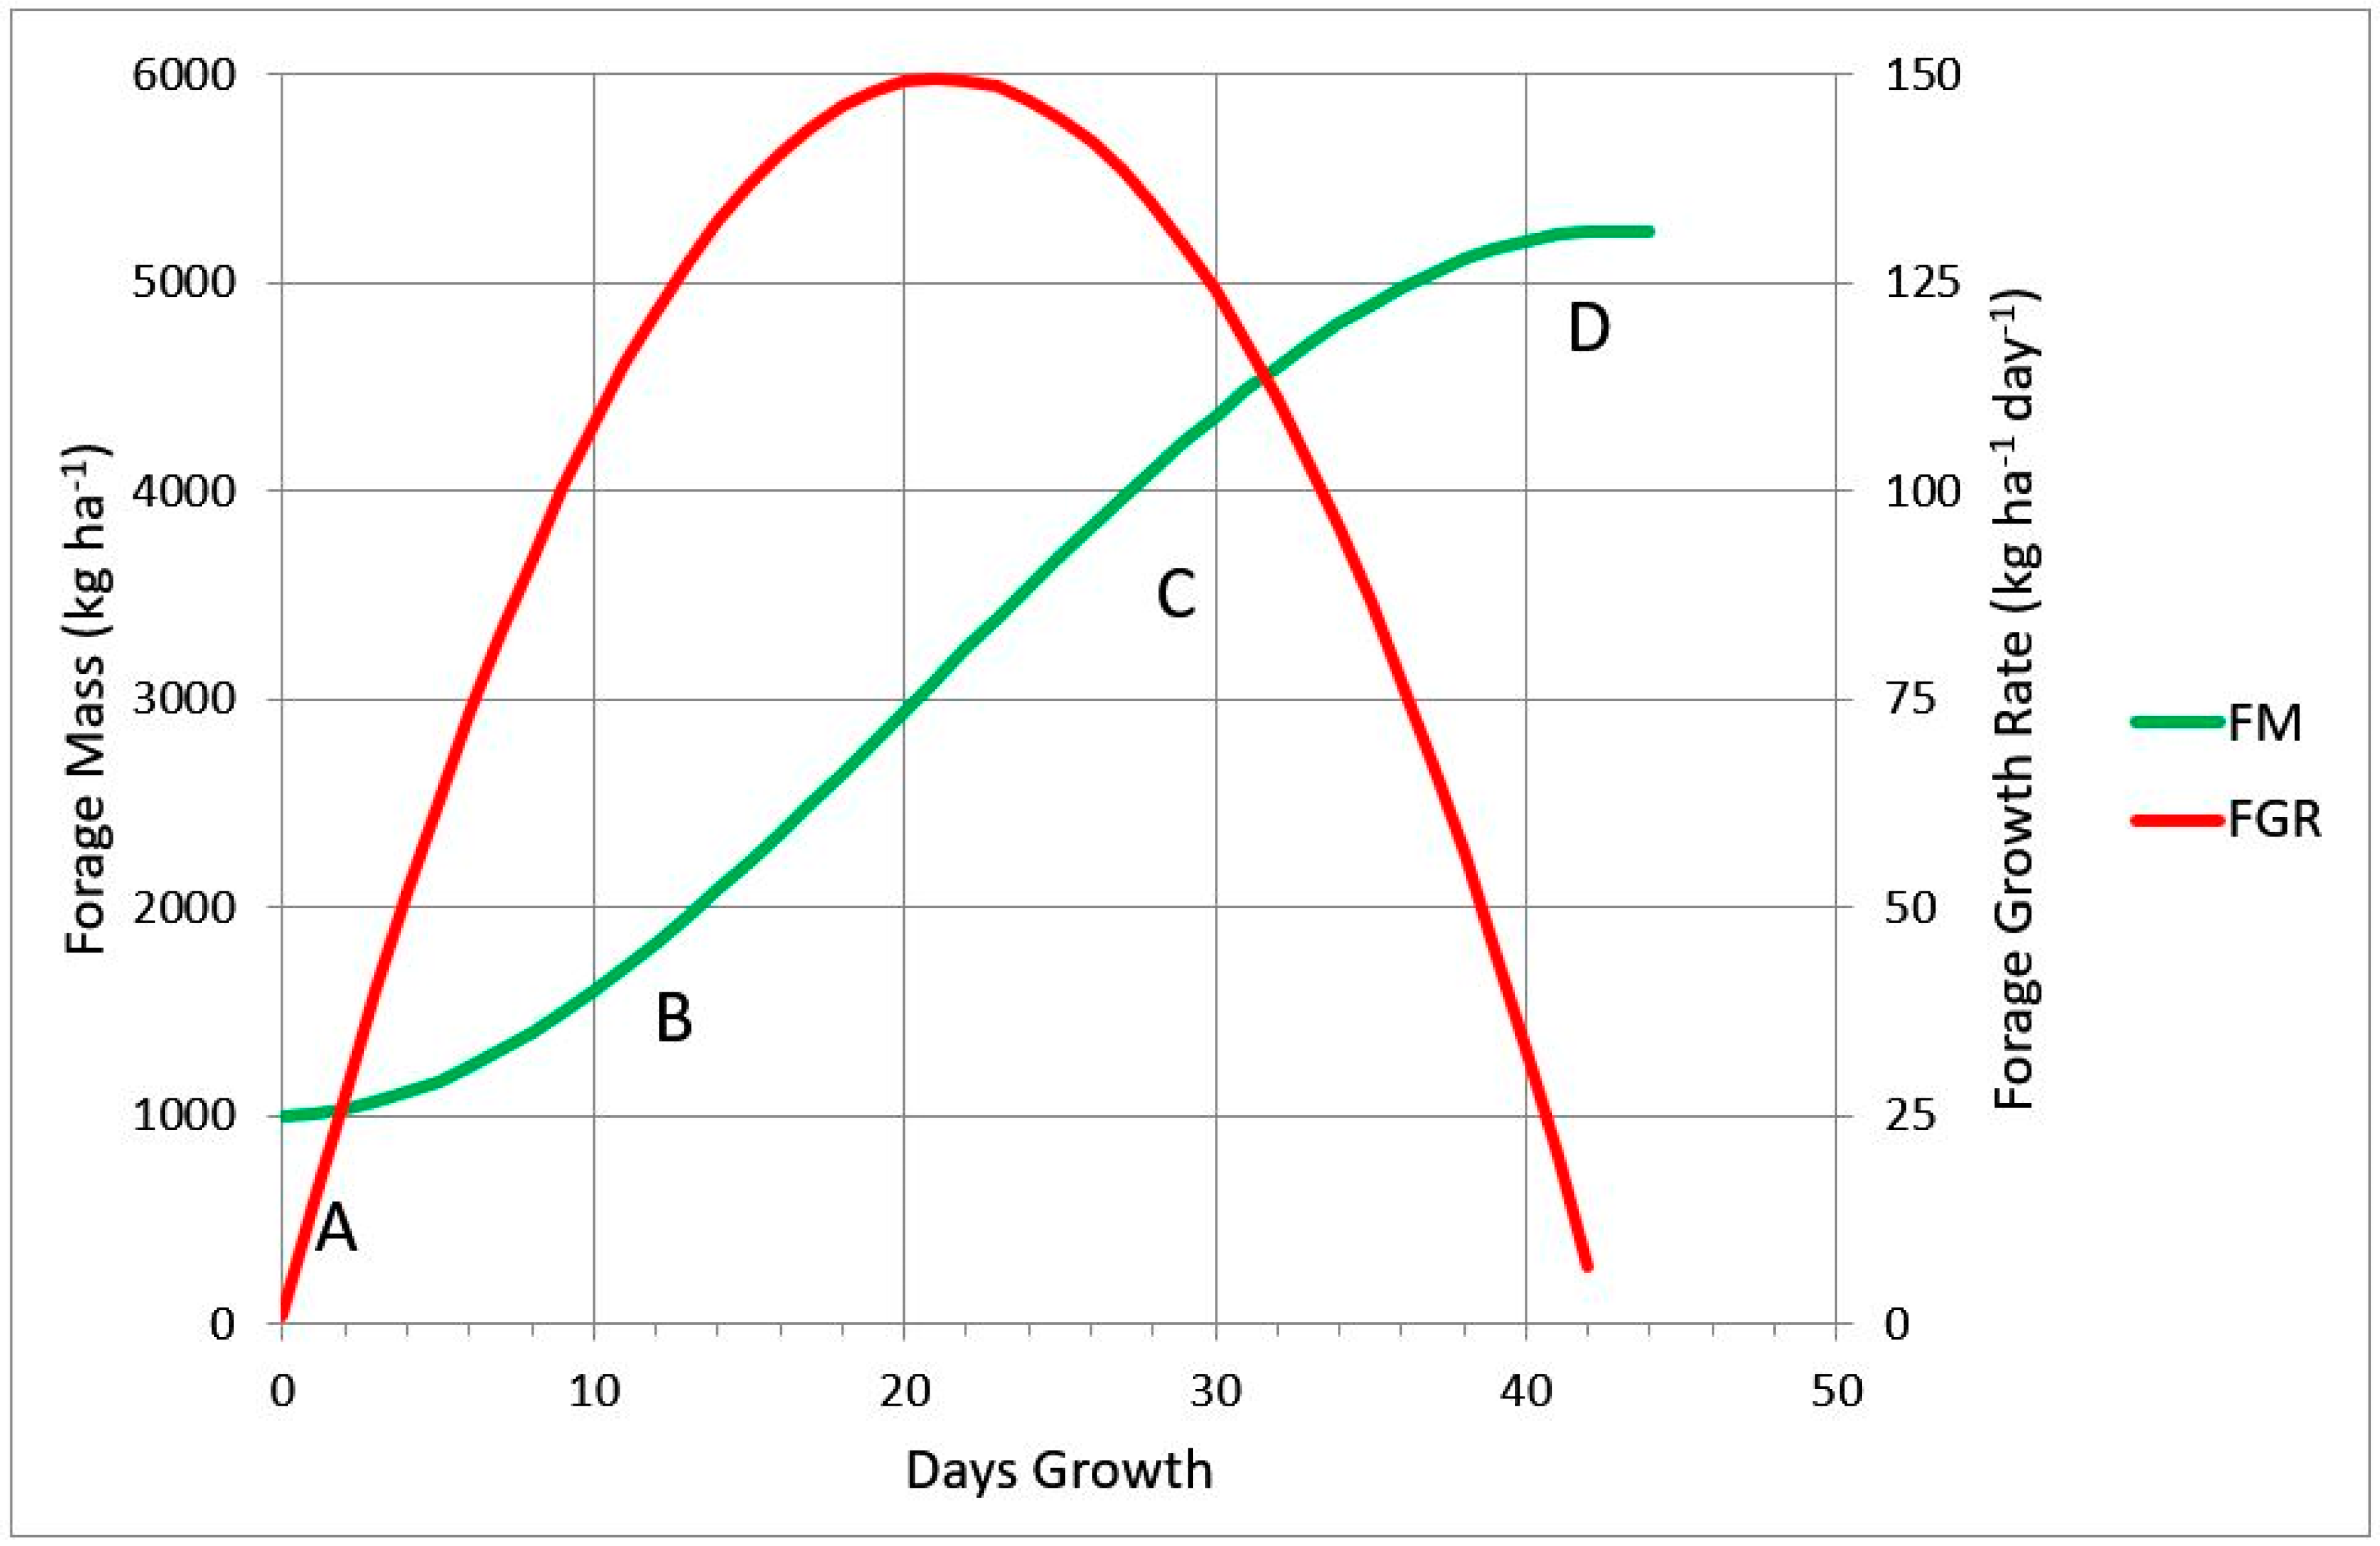
- early exponential growth (FM = +c T2, section A to B),
- mid linear growth (FM = +b T, section B to C) and
- late plateau growth (FM = −d T3, section C to D).
- Forage mass at a point in time: FM = 1000 + 1 Day + 7 Day2 − 0.11 Day3
- Forage growth rate at a point in time: FGR Day−1 = 1 + 14 Day − 0.33 Day2
- Do current grazing timing and intensity recommendations maintain pastures in a linear growth phase, or do they cause a depression in early or late regrowth?
- What impact does alternative defoliation timing and intensity have on LI, plant growth and plant health, as measured by rooting activity?
- What impact does weather variation across the Appalachian Plateau have on pasture growth over the growing season?
2. Results
2.1. Pasture Growth Rate after Recommended Defoliation
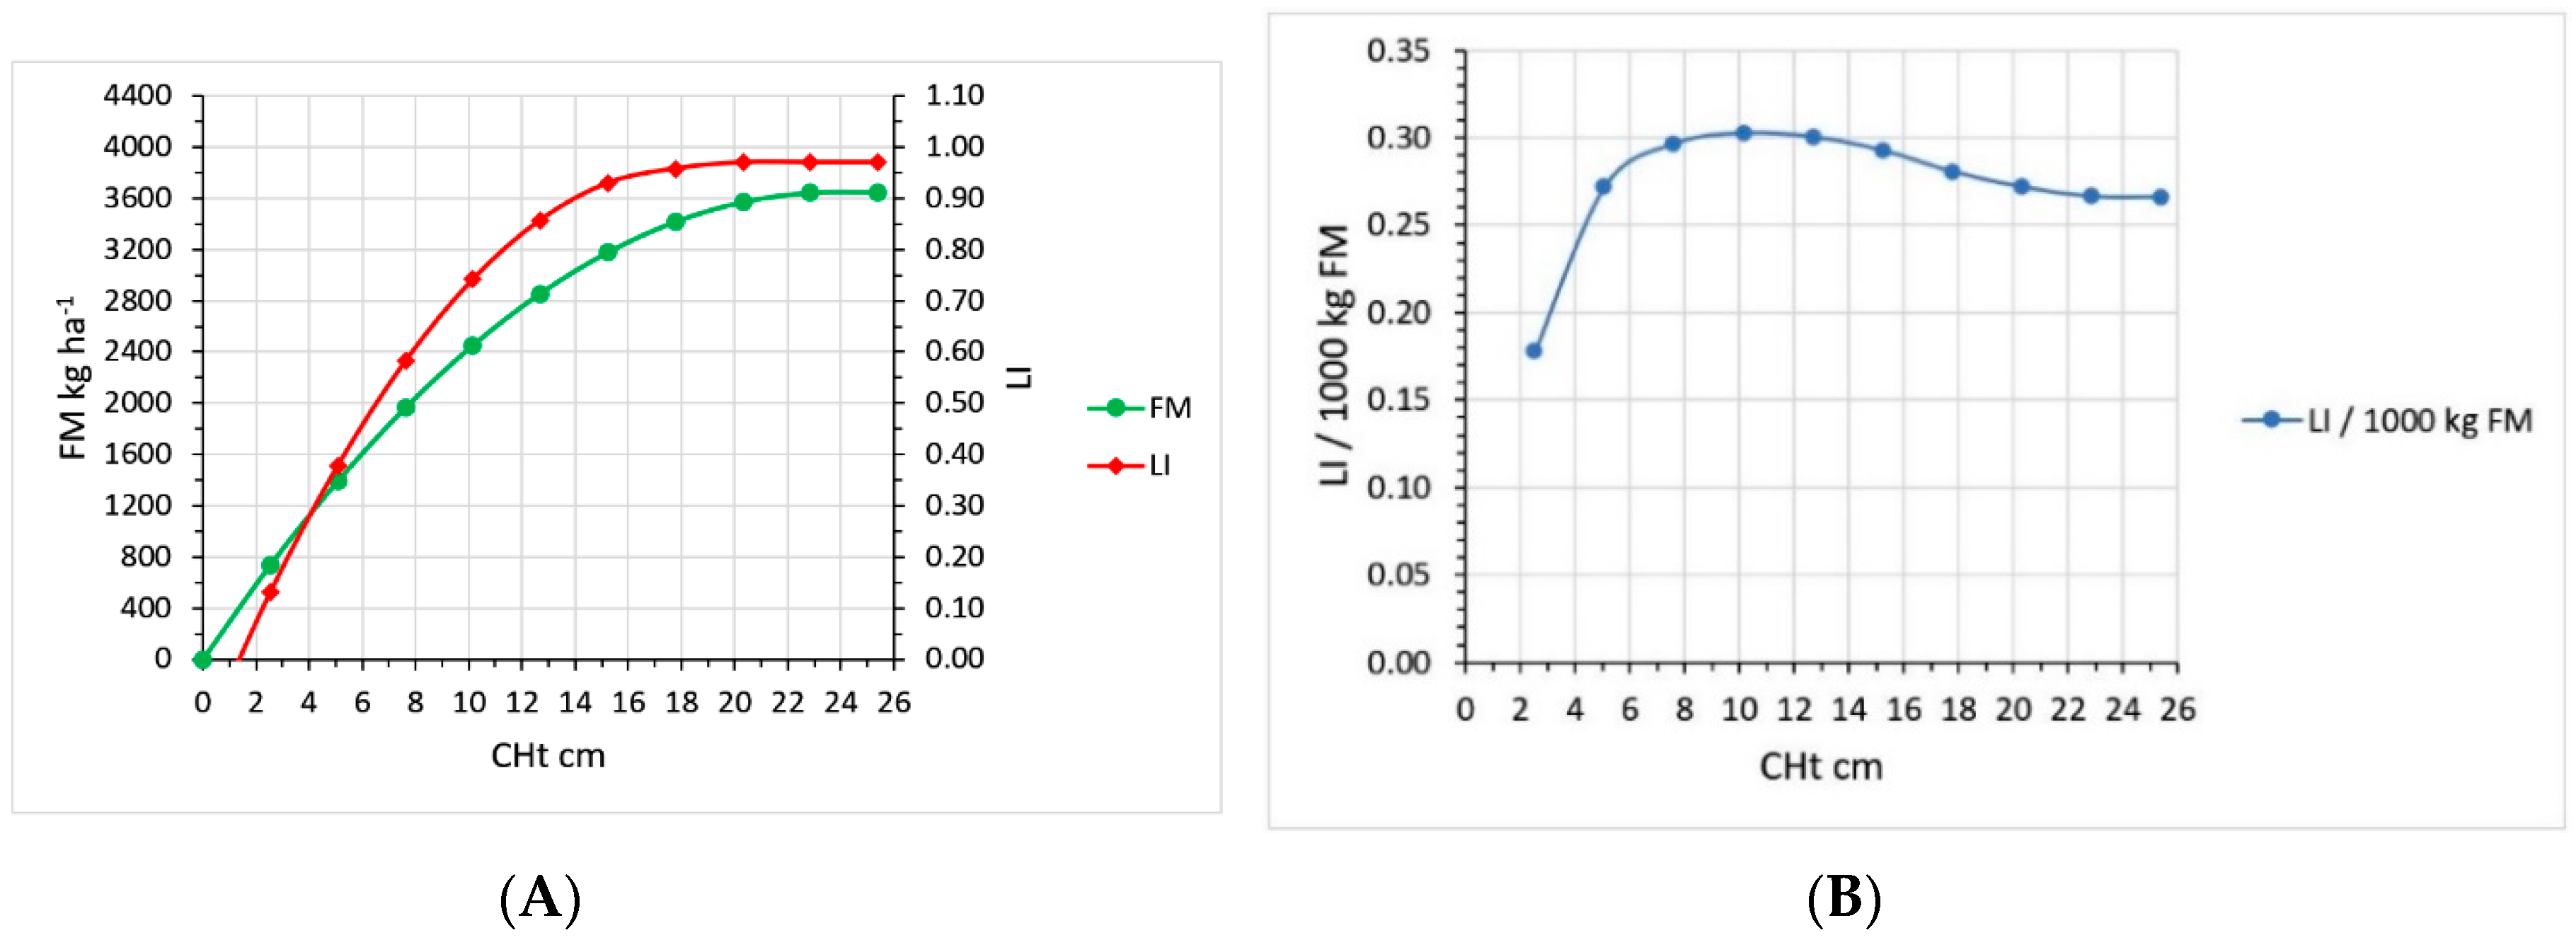
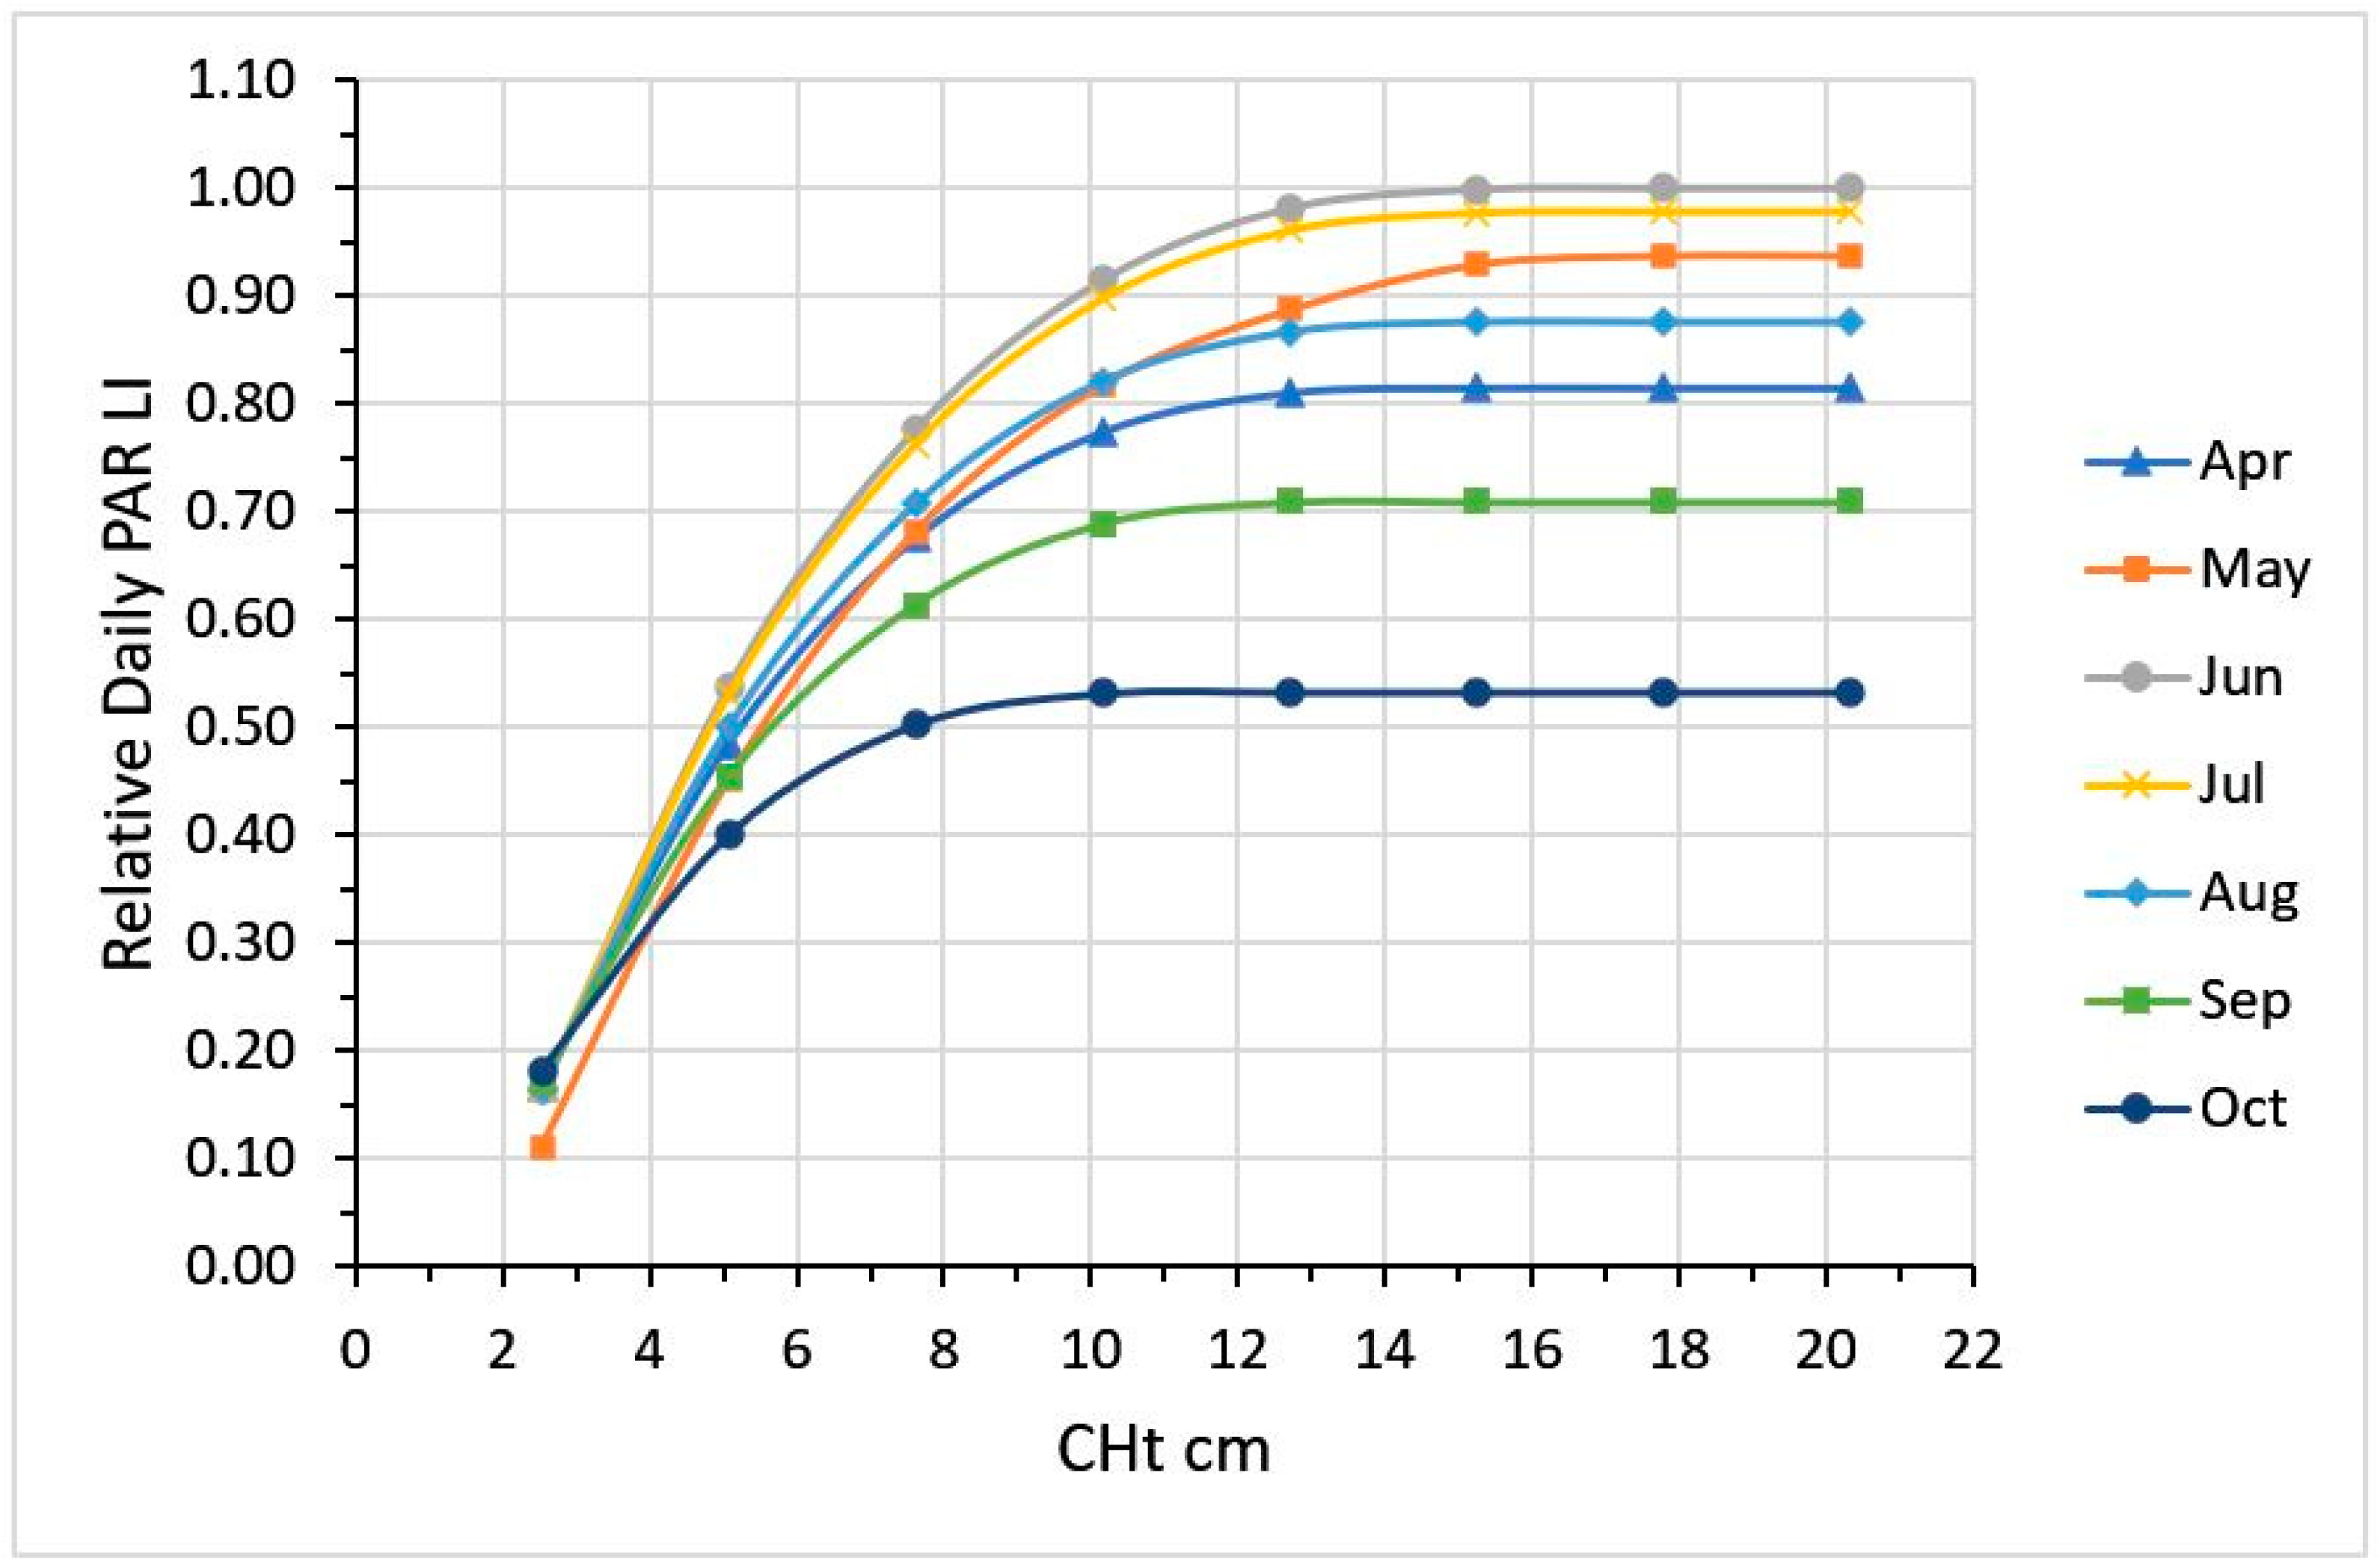
2.2. CHt, LI and Growth Curve
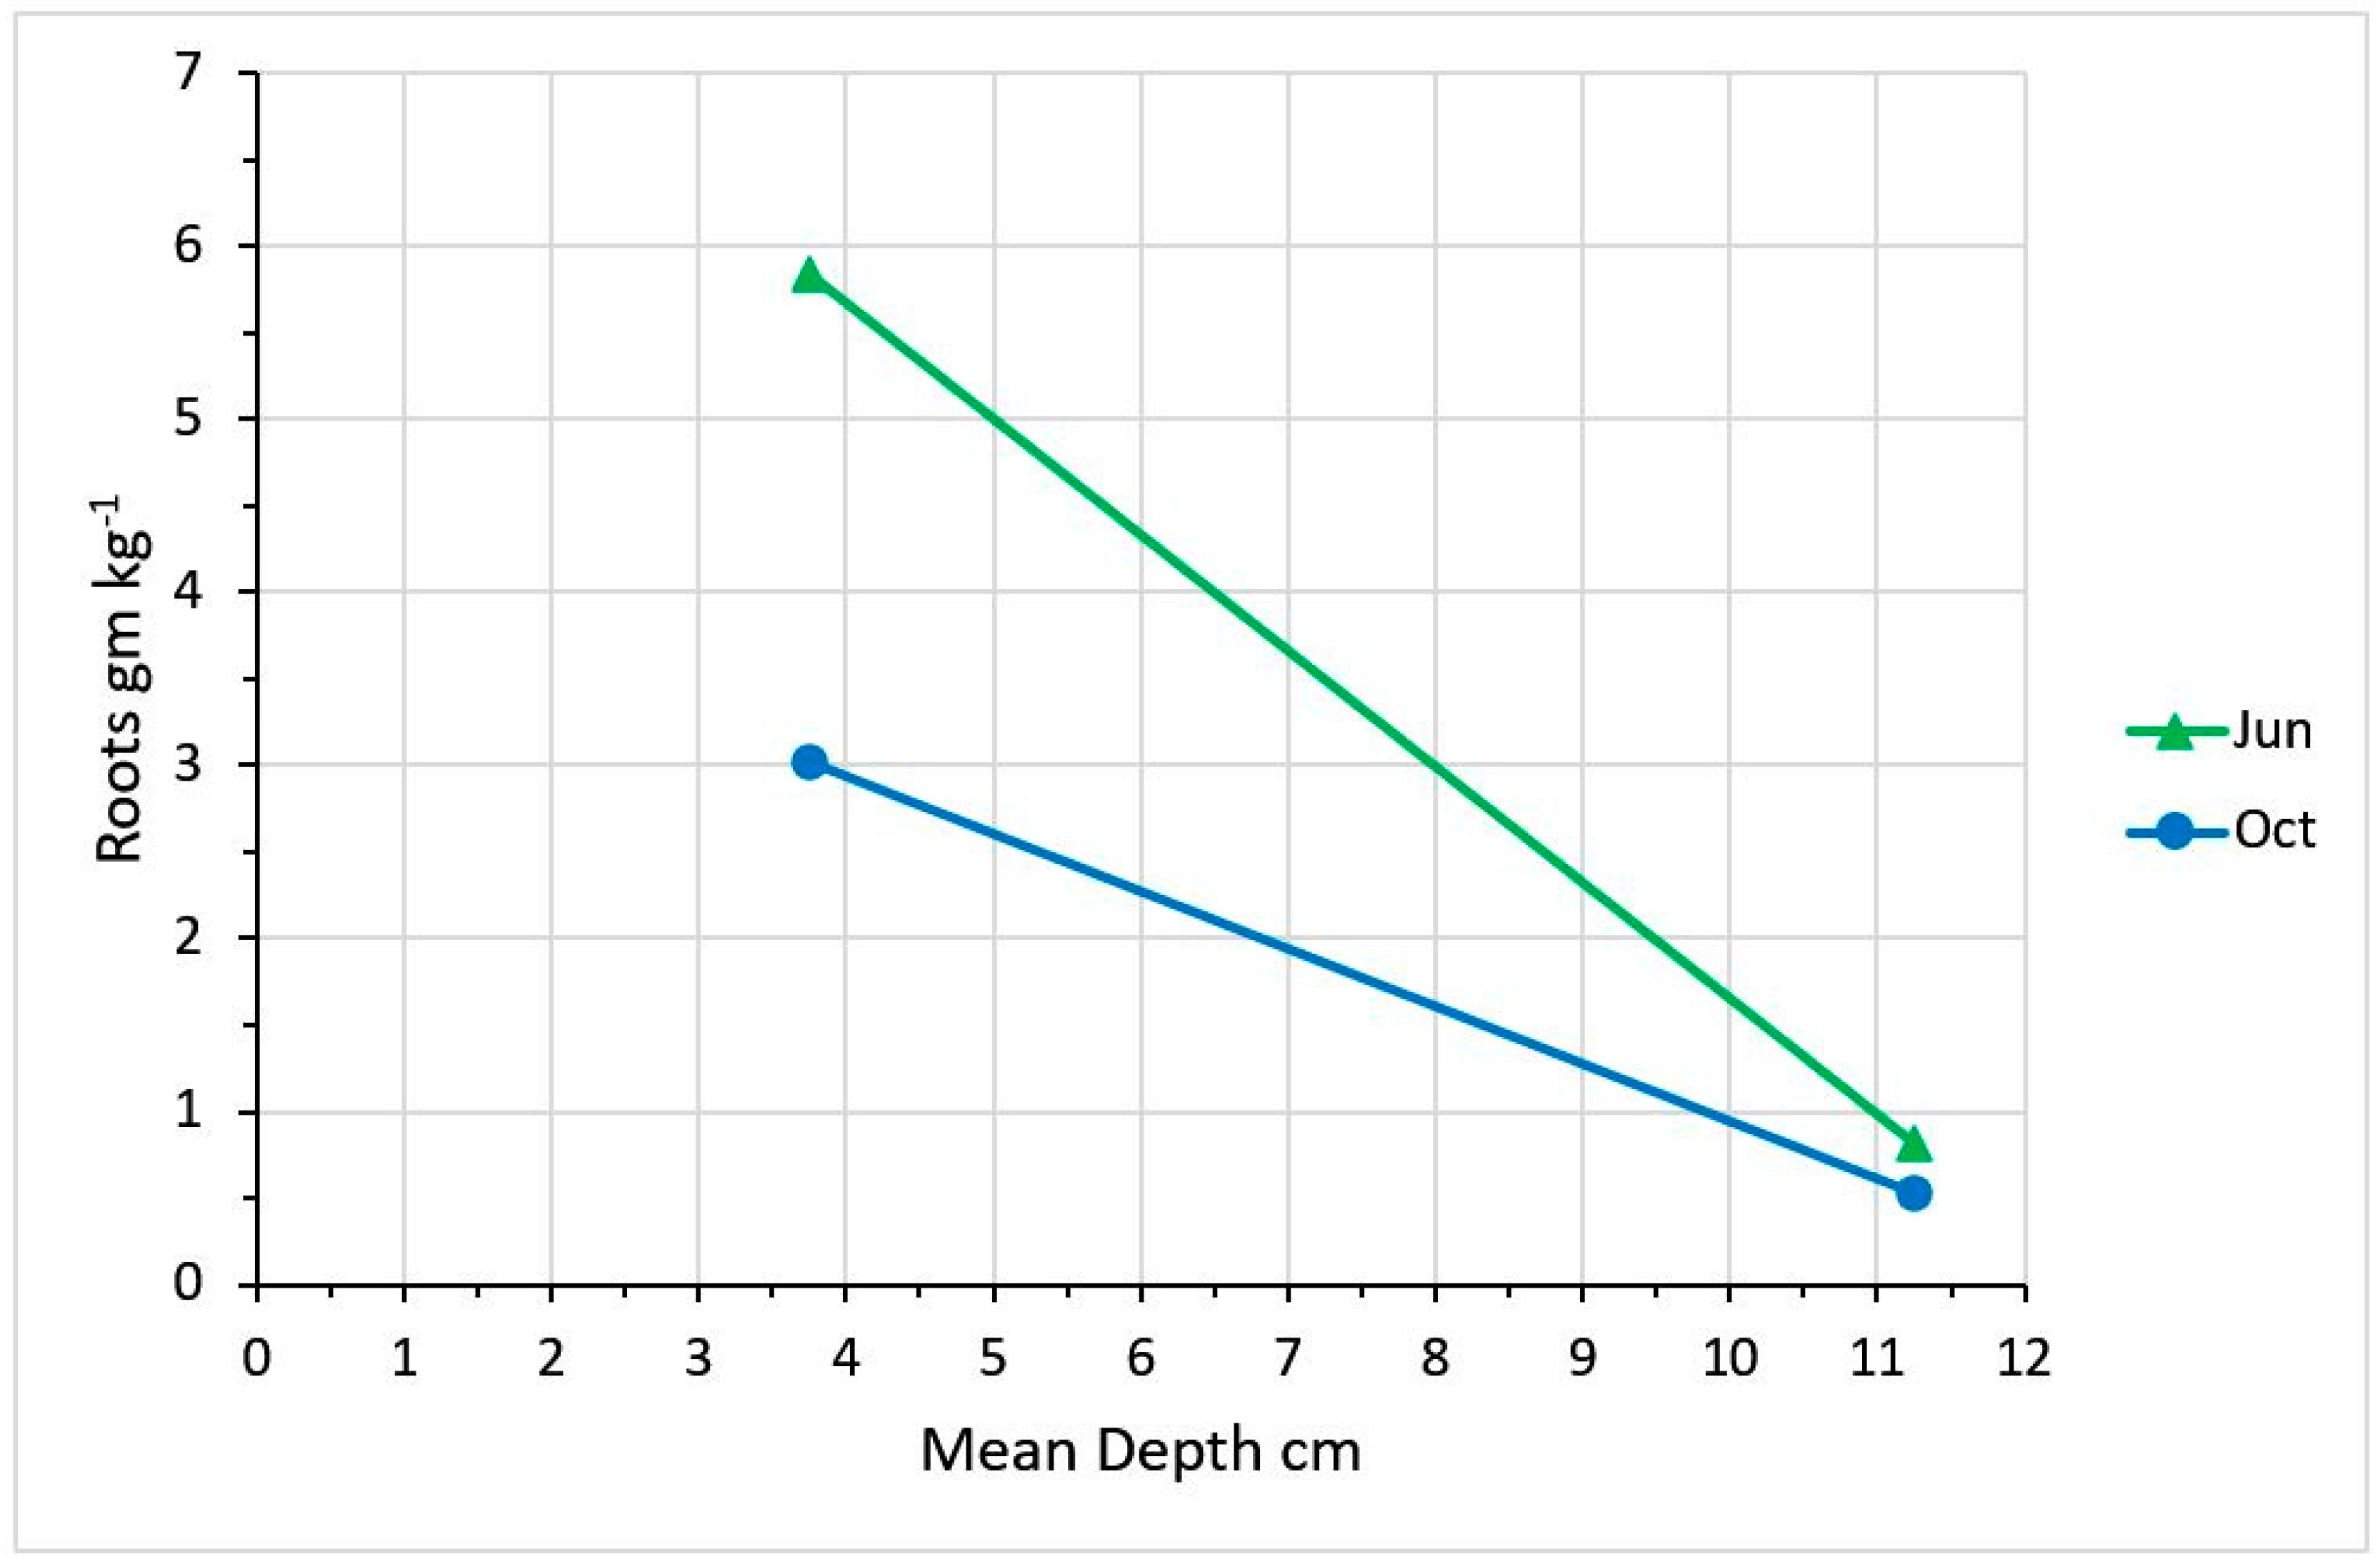
2.3. Impact of Defoliation Timing and Intensity on Plant Growth and Rooting Density
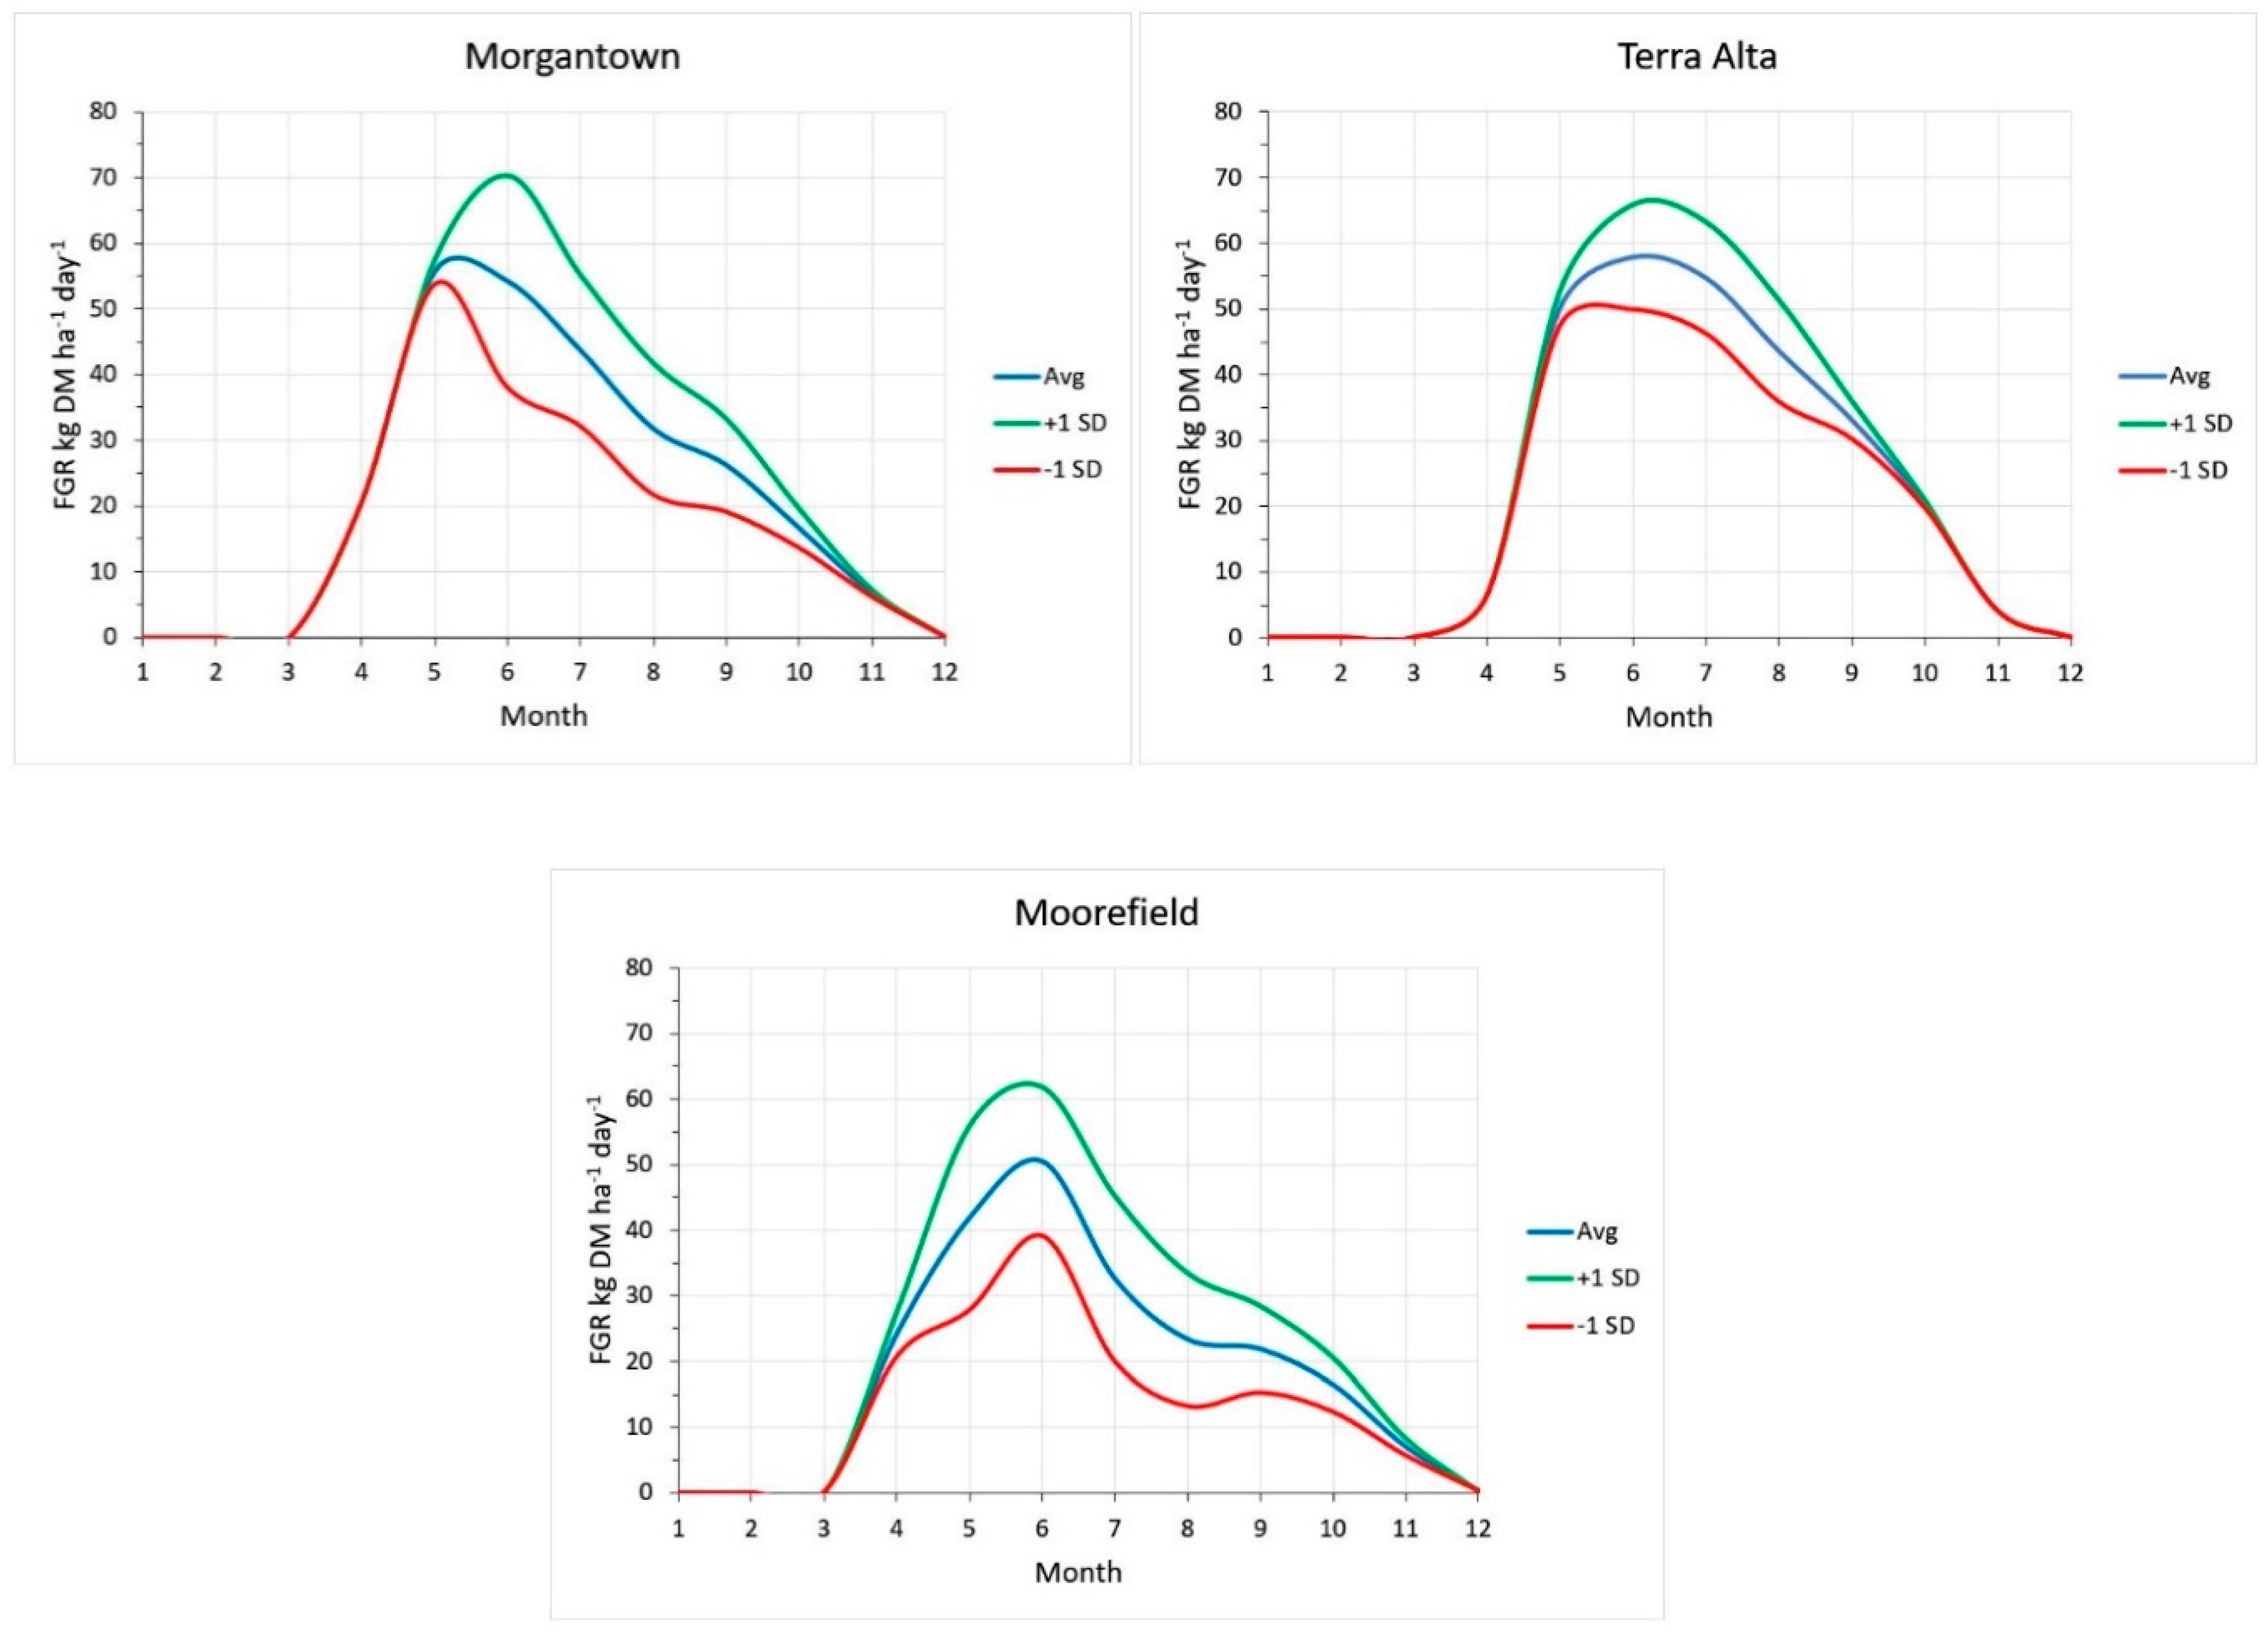
2.4. Growth Variability and Risk in Stressful Environments
3. Discussion
| GLeaf | Growth of leaves |
| GEff | Growth efficiency {ƒ(plant nutrition, temperature and moisture stress)} |
| PhotoEff | Photosynthetic efficiency {ƒ(plant nutrition, temperature and moisture stress)} |
| PARInt | PAR interception {ƒ(LAI or sward RHt, solar elevation, and daylength)} |
| NightRes | Night respiration {ƒ(night temperature)} |
| GRoot | Growth of roots {ƒ(net photosynthesis, temperature and moisture stress)} |
| ΔSER | Change in stored energy reserves |
Balancing Leaf Growth and Harvest
4. Materials and Methods
4.1. Pasture Growth Rate after Recommended Defoliation
4.2. Impact of Defoliation Timing and Intensity on Plant Growth and Rooting Density
- Rotational, low stubble: clip to 7 cm after regrowth to 25–30 cm or 35 days.
- Rotational, high stubble: clip to 13 cm after regrowth to 25–30 cm or 35 days.
- Continuous, low stubble: clip to 7 cm at 7- to 11-day intervals or regrowth to 10–11 cm.
- Continuous, high stubble: clip to 13 cm at 7- to 11-day intervals or regrowth to 15–16 cm.
- Hay-stage, low stubble: clip to 7 cm after growth to mature hay stage or 42–45 days.
- Hay-stage, high stubble: clip to 13 cm after growth to mature hay stage or 42–45 days.
4.3. Variability of Pasture Growth across the Allegheny Plateau in West Virginia
5. Conclusions
Author Contributions
Funding
Acknowledgments
Conflicts of Interest
References
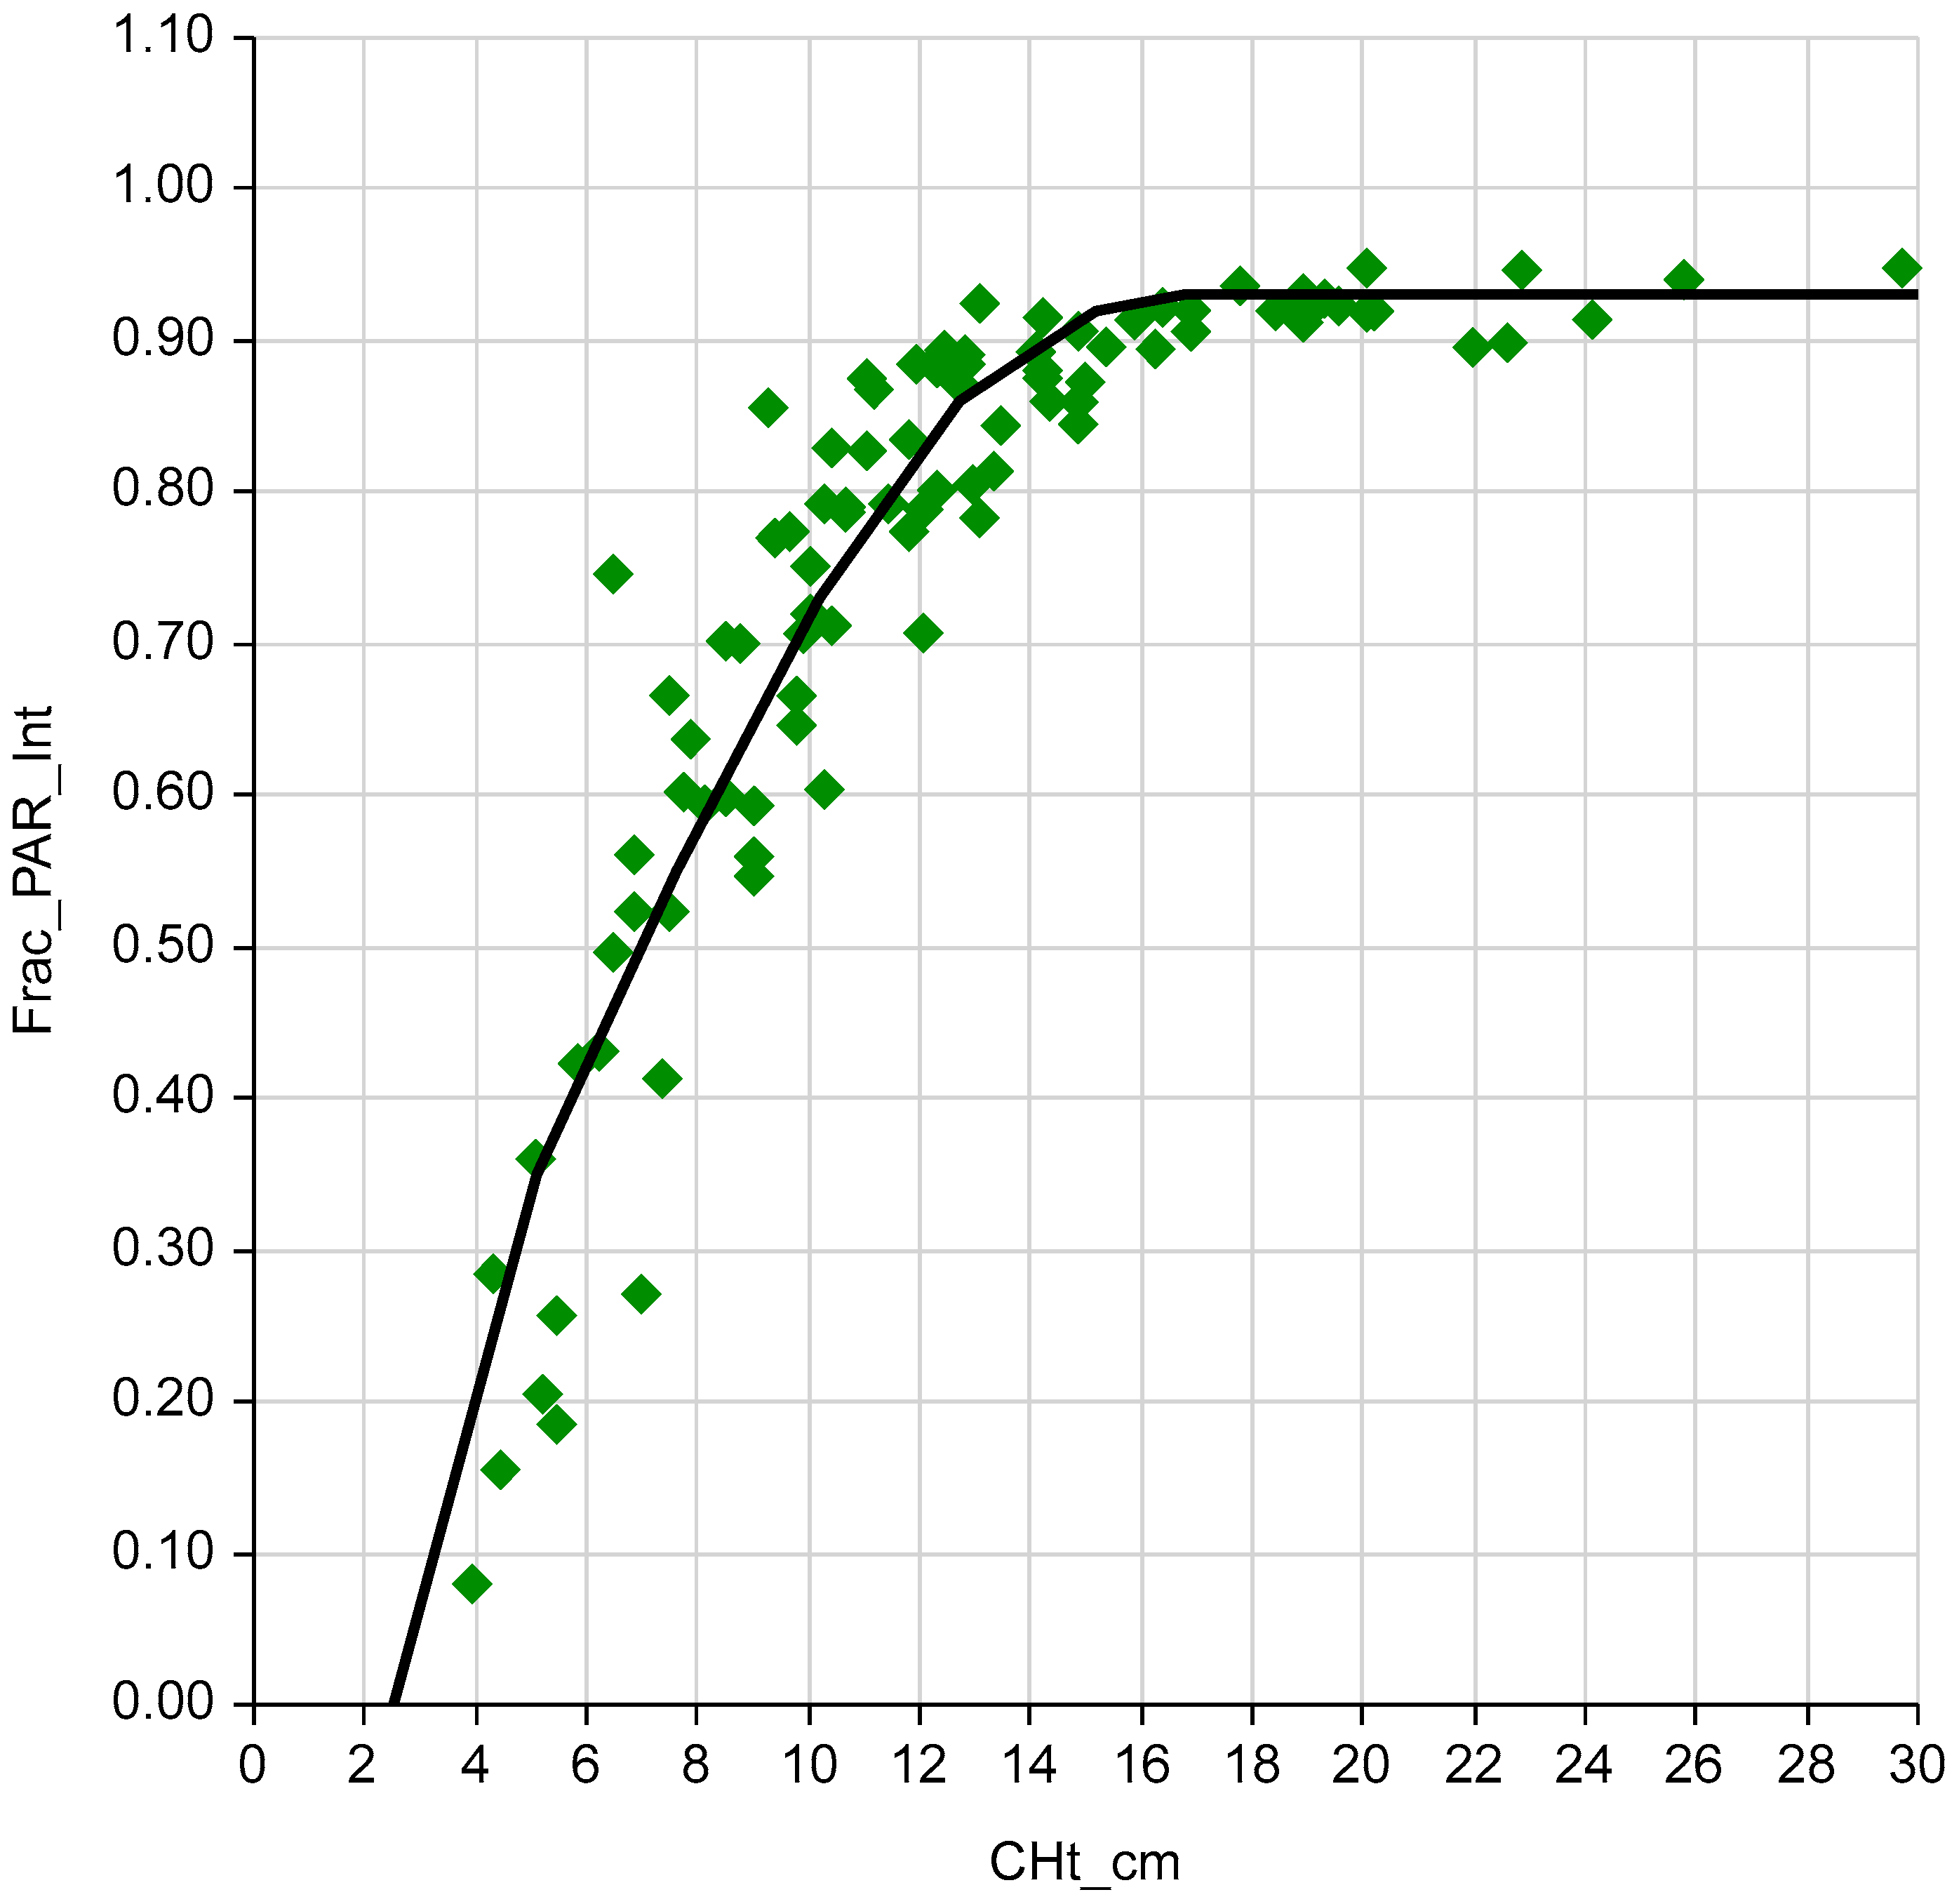
- Rayburn, E.B.; Shockey, W.L.; Smith, B.D.; Seymore, D.A.; Basden, T.J. Light interception by pasture canopies as affected by height and botanical composition. Crop Forage Turfgrass Manag. 2016, 2. [Google Scholar] [CrossRef]
- Trott, J.O.; Moore, K.J.; Lechtenberg, V.L.; Johnson, K.D. Light penetration through tall fescue in relation to canopy biomass. J. Prod. Agric. 1988, 1, 137–140. [Google Scholar] [CrossRef]
- Engel, R.K.; Moser, L.E.; Stubbendieck, J.; Lowry, S.R. Yield accumulation, leaf area index, and light interception of smooth bromegrass. Crop Sci. 1987, 27, 316–321. [Google Scholar] [CrossRef] [Green Version]
- Sharratt, B.S.; Baker, D.G. Alfalfa leaf area as a function of dry matter. Crop Sci. 1986, 26, 1040–1043. [Google Scholar] [CrossRef]
- Wilkinson, S.R.; Mays, D.A. Mineral nutrition. In Tall Fescue; Buckner, R.C., Bush, L.P., Eds.; American Soc. of Agron: Madison, WI, USA, 1979. [Google Scholar]
- Lile, D.F.; George, M.R. Prediction of Pasture Growth Rates from Climatic Variables. J. Prod. Agric. 1993, 6, 86–90. [Google Scholar] [CrossRef]
- McCree, K.J.; Author, M.E. Effects of Diurnal Variation in Temperature on the Carbon Balances of White Clover Plants. Crop Sci. 1982, 22, 822–827. [Google Scholar] [CrossRef]
- Rayburn, E.B.; Hall, M.H.; Murphy, W.; Vough, L. Pasture production. In Pasture Management in the Northeast-Assessing Current Technologies, Research Directions and Educational Needs; Krueger, C.R., Pionke, H.B., Eds.; NRAES-113; Northeast Regional Agricultural Engineering Service: Ithaca, NY, USA, 1998. [Google Scholar]
- Brown, R.H.; Cooper, R.B.; Blaser, R.E. Effects of Leaf Age on Efficiency. Crop Sci. 1966, 6, 206–209. [Google Scholar] [CrossRef]
- Wilhelm, W.W.; Nelson, C.J. Leaf Growth, Leaf Aging, and Photosynthetic Rate of Tall Fescue Genotypes. Crop Sci. 1978, 18, 769–772. [Google Scholar] [CrossRef] [Green Version]
- Wolf, D.D.; Brown, R.H.; Blaser, R.E. Physiology of growth and development. In Tall Fescue; Buckner, R.C., Bush, L.P., Eds.; American Soc. of Agron: Madison, WI, USA, 1979. [Google Scholar]
- Brougham, R.W. Effect of intensity of defoliation on regrowth of pasture. Aust. J. Agric. Res. 1956, 7, 377–387. [Google Scholar] [CrossRef]
- Pearce, R.B.; Brown, R.H.; Blaser, R.E. Relationships between Leaf Area Index, Light Interception and Net Photosynthesis in Orchardgrass. Crop Sci. 1965, 5, 553–556. [Google Scholar] [CrossRef] [Green Version]
- Brown, R.H.; Pearce, R.B.; Wolf, D.D.; Blaser, R.E. Energy Accumulation and Utilization. In Alfalfa Science and Technology; Hanson, C.H., Ed.; American Soc. of Agron: Madison, WI, USA, 1972. [Google Scholar]
- Wilfong, R.T.; RBrown, H.; Blaser, R.E. Relationships between Leaf Area Index and Apparent Photosynthesis in Alfalfa (Medicago sativa L.) and Ladino Clover (Trifolium repens L.). Crop Sci. 1967, 7, 27–30. [Google Scholar] [CrossRef]
- Lee, R.; Boyer, D.G.; Valli, V.J.; Dickerson, W.H. Global radiation in West Virginia. In West Va. Univ. Agr. Forestry Exp. Sta.; Bulletin 665T; WVU: Morgantown, WV, USA, 1979; p. 51. [Google Scholar]
- Lee, J.M.; Donaghy, D.J.; Roche, J.R. Effect of Defoliation Severity on Regrowth and Nutritive Value of Perennial Ryegrass Dominant Swards. Agron. J. 2008, 100, 308–314. [Google Scholar] [CrossRef]
- Lee, J.M.; Donaghy, D.J.; Sathish, P.; Roche, J.R. Interaction between water-soluble carbohydrate reserves and defoliation severity on the regrowth of perennial ryegrass (Lolium perenne L.)-dominant swards. Grass Forage Sci. 2009, 64, 266–275. [Google Scholar] [CrossRef]
- Nelson, C.J. Physiology and Developmental Morphology. In Cool-Season Forage Grasses; Moser, L.E., Buxton, D.R., Casler, M.D., Eds.; American Soc. Agron: Maison, WI, USA, 1996. [Google Scholar]
- Greub, L.J.; Wedin, W.F. Leaf Area, Dry-Matter Production, and Carbohydrate Reserve Levels of Birdsfoot Trefoil as Influenced by Cutting Height. Crop Sci. 1971, 11, 734–738. [Google Scholar] [CrossRef]
- Smith, D. Forage Management in the North; Kendall/Hunt Publishing Company: Dubuque, IA, USA, 1975. [Google Scholar]
- Carlassare, M.; Karsten, H.D. Species Contribution to Seasonal Productivity of a Mixed Pasture under Two Sward Grazing Height Regimes. Agron. J. 2002, 94, 840–850. [Google Scholar] [CrossRef]
- Oates, L.G.; Undersander, D.J.; Gratton, C.; Bell, M.M.; Jackson, R.D. Management-intensive rotational grazing enhances forage production and quality of subhumid cool-season pastures. Crop Sci. 2011, 51, 892–901. [Google Scholar] [CrossRef] [Green Version]
- Hart, R.H.; Carlson, G.E.; McCloud, D.E. Cumulative effects of cutting management on forage yields and tiller densities of tall fescue and orchardgrass. Agron. J. 1971, 63, 895–898. [Google Scholar] [CrossRef]
- Brink, G.E.; Casler, M.D.; Martin, N.P. Meadow fescue, tall fescue and orchardgrass response to defoliation management. Agron. J. 2010, 102, 667–674. [Google Scholar] [CrossRef] [Green Version]
- Brink, G.E.; Jackson, R.D.; Alber, N.B. Residual sward height effects on growth and nutritive value of grazed temperate perennial grasses. Crop Sci. 2013, 53, 2264–2274. [Google Scholar] [CrossRef]
- Skinner, R.H.; Sanderson, M.A.; Tracy, B.F.; Dell, C.J. Above- and Belowground Productivity and Soil Carbon Dynamics of Pasture Mixtures. Agron. J. 2006, 98, 320–326. [Google Scholar] [CrossRef] [Green Version]
- Tracy, B.F.; Faulkner, D.B. Pasture and Cattle Responses in Rotationally Stocked Grazing Systems Sown with Differing Levels of Species Richness. Crop Sci. 2006, 46, 2062–2068. [Google Scholar] [CrossRef]
- Belesky, D.P.; Fedders, J.M. Influence of Autumn Management on Orchardgrass–White Clover Swards. Agron. J. 1995, 87, 1186–1192. [Google Scholar]
- Rayburn, E.B.; Rayburn, S.B. A standardized plate meter for estimating pasture mass in on-farm research trials. Agron. J. 1998, 90, 238–241. [Google Scholar] [CrossRef]
- Rayburn, E.B.; JLozier, D.; Smith, M.A.S.B.D.; Shockey, W.L.; Seymore, D.A.; Fultz, S.W. Alternative methods of estimating forage height and sward capacitance in pastures can be cross calibrated. Online Forage Grazinglands 2007. [Google Scholar] [CrossRef] [Green Version]
- Rayburn, E.B.; Shockey, W.L.; Seymore, D.A.; Smith, B.D.; Basden, T.J. Calibration of pasture forage mass to plate meter compressed height is a second-order response with a zero intercept. Crop Forage Turfgrass Manag. 2017, 3. [Google Scholar] [CrossRef] [Green Version]
- Rayburn, E.B. Plate meter calibrations for forage mass follow a continuum of sward basal density. Crop Forage Turfgrass Manag. 2020, 5. [Google Scholar] [CrossRef] [Green Version]
- Barker, D.J.; Ferraro, F.P.; Nave, R.L.G.; Sulc, R.M.; Lopes, F.; Albrecht, K.A. Analysis of herbage mass and herbage accumulation rate using Gompertz equations. Agron. J. 2010, 102, 849–857. [Google Scholar] [CrossRef]
- NCSS. NCSS 11 Statistical Software; NCSS, LLC: Kaysville, UT, USA, 2016. [Google Scholar]
- USDA/NRCS. Land resource regions and major land resource areas of the United States, the Caribbean, and the Pacific Basin. In USDA Ag. Handbook 296; USDA: Washington, DC, USA, 2006; Volume 20250, 682p. [Google Scholar]
- Earle, D.F.; McGowan, A.A. Evaluation and Calibration of an Automated Rising Plate Meter for Estimating Dry Matter Yield of Pasture. Aust. J. Exp. Agric. Anim. Husb. 1979, 19, 337–343. [Google Scholar] [CrossRef]


| Measure | Units | Litter | No-litter | P |
|---|---|---|---|---|
| CHtmin | cm | 8.6 ± 0.5 | 7.4 ± 0.5 | 0.05 |
| CHtmax | cm | 16.8 ± 0.8 | 14.2 ± 0.8 | 0.05 |
| RHtmin | cm | 14.2 ± 0.8 | 11.9 ± 0.8 | 0.05 |
| RHtmax | cm | 27.4 ± 1.3 | 23.4 ± 1.3 | 0.05 |
| Days growth | Days | 35 ± 6 | 56 ± 6 | 0.02 |
| FMmin | kg DM ha−1 | 2162 ± 90 | 1901 ± 90 | 0.05 |
| FMmax | kg DM ha−1 | 3272 ± 96 | 2991 ± 96 | 0.05 |
| FM grown | kg DM ha−1 | 1111 ± 52 | 1091 ± 52 | 0.78 |
| FGR day−1 | kg DM ha−1 day−1 | 36 ± 3 | 24 ± 3 | 0.02 |
| Fertility Level | Growth Curve Form | ||
|---|---|---|---|
| Exponential FM = RFM + b T2 | Linear FM = RFM + b T | Linear-Plateau FM = RFM + b T − c T2 | |
| Frequency of occurrence of growth curve form | |||
| Litter | 1 (4%) | 9 (38%) | 2 (8%) |
| No-litter | 1 (4%) | 3 (12%) | 8 (33%) |
| Total | 2 (8%) | 12 (50%) | 10 (42%) |
| Forage mass at start and end of growth by growth curve form | |||
| RFM (P = 0.34) | 2239 ± 172 | 2086 ± 72 | 1920 ± 132 |
| FM (P = 0.14) | 3286 ± 109 | 3246 ± 54 | 2958 ± 149 |
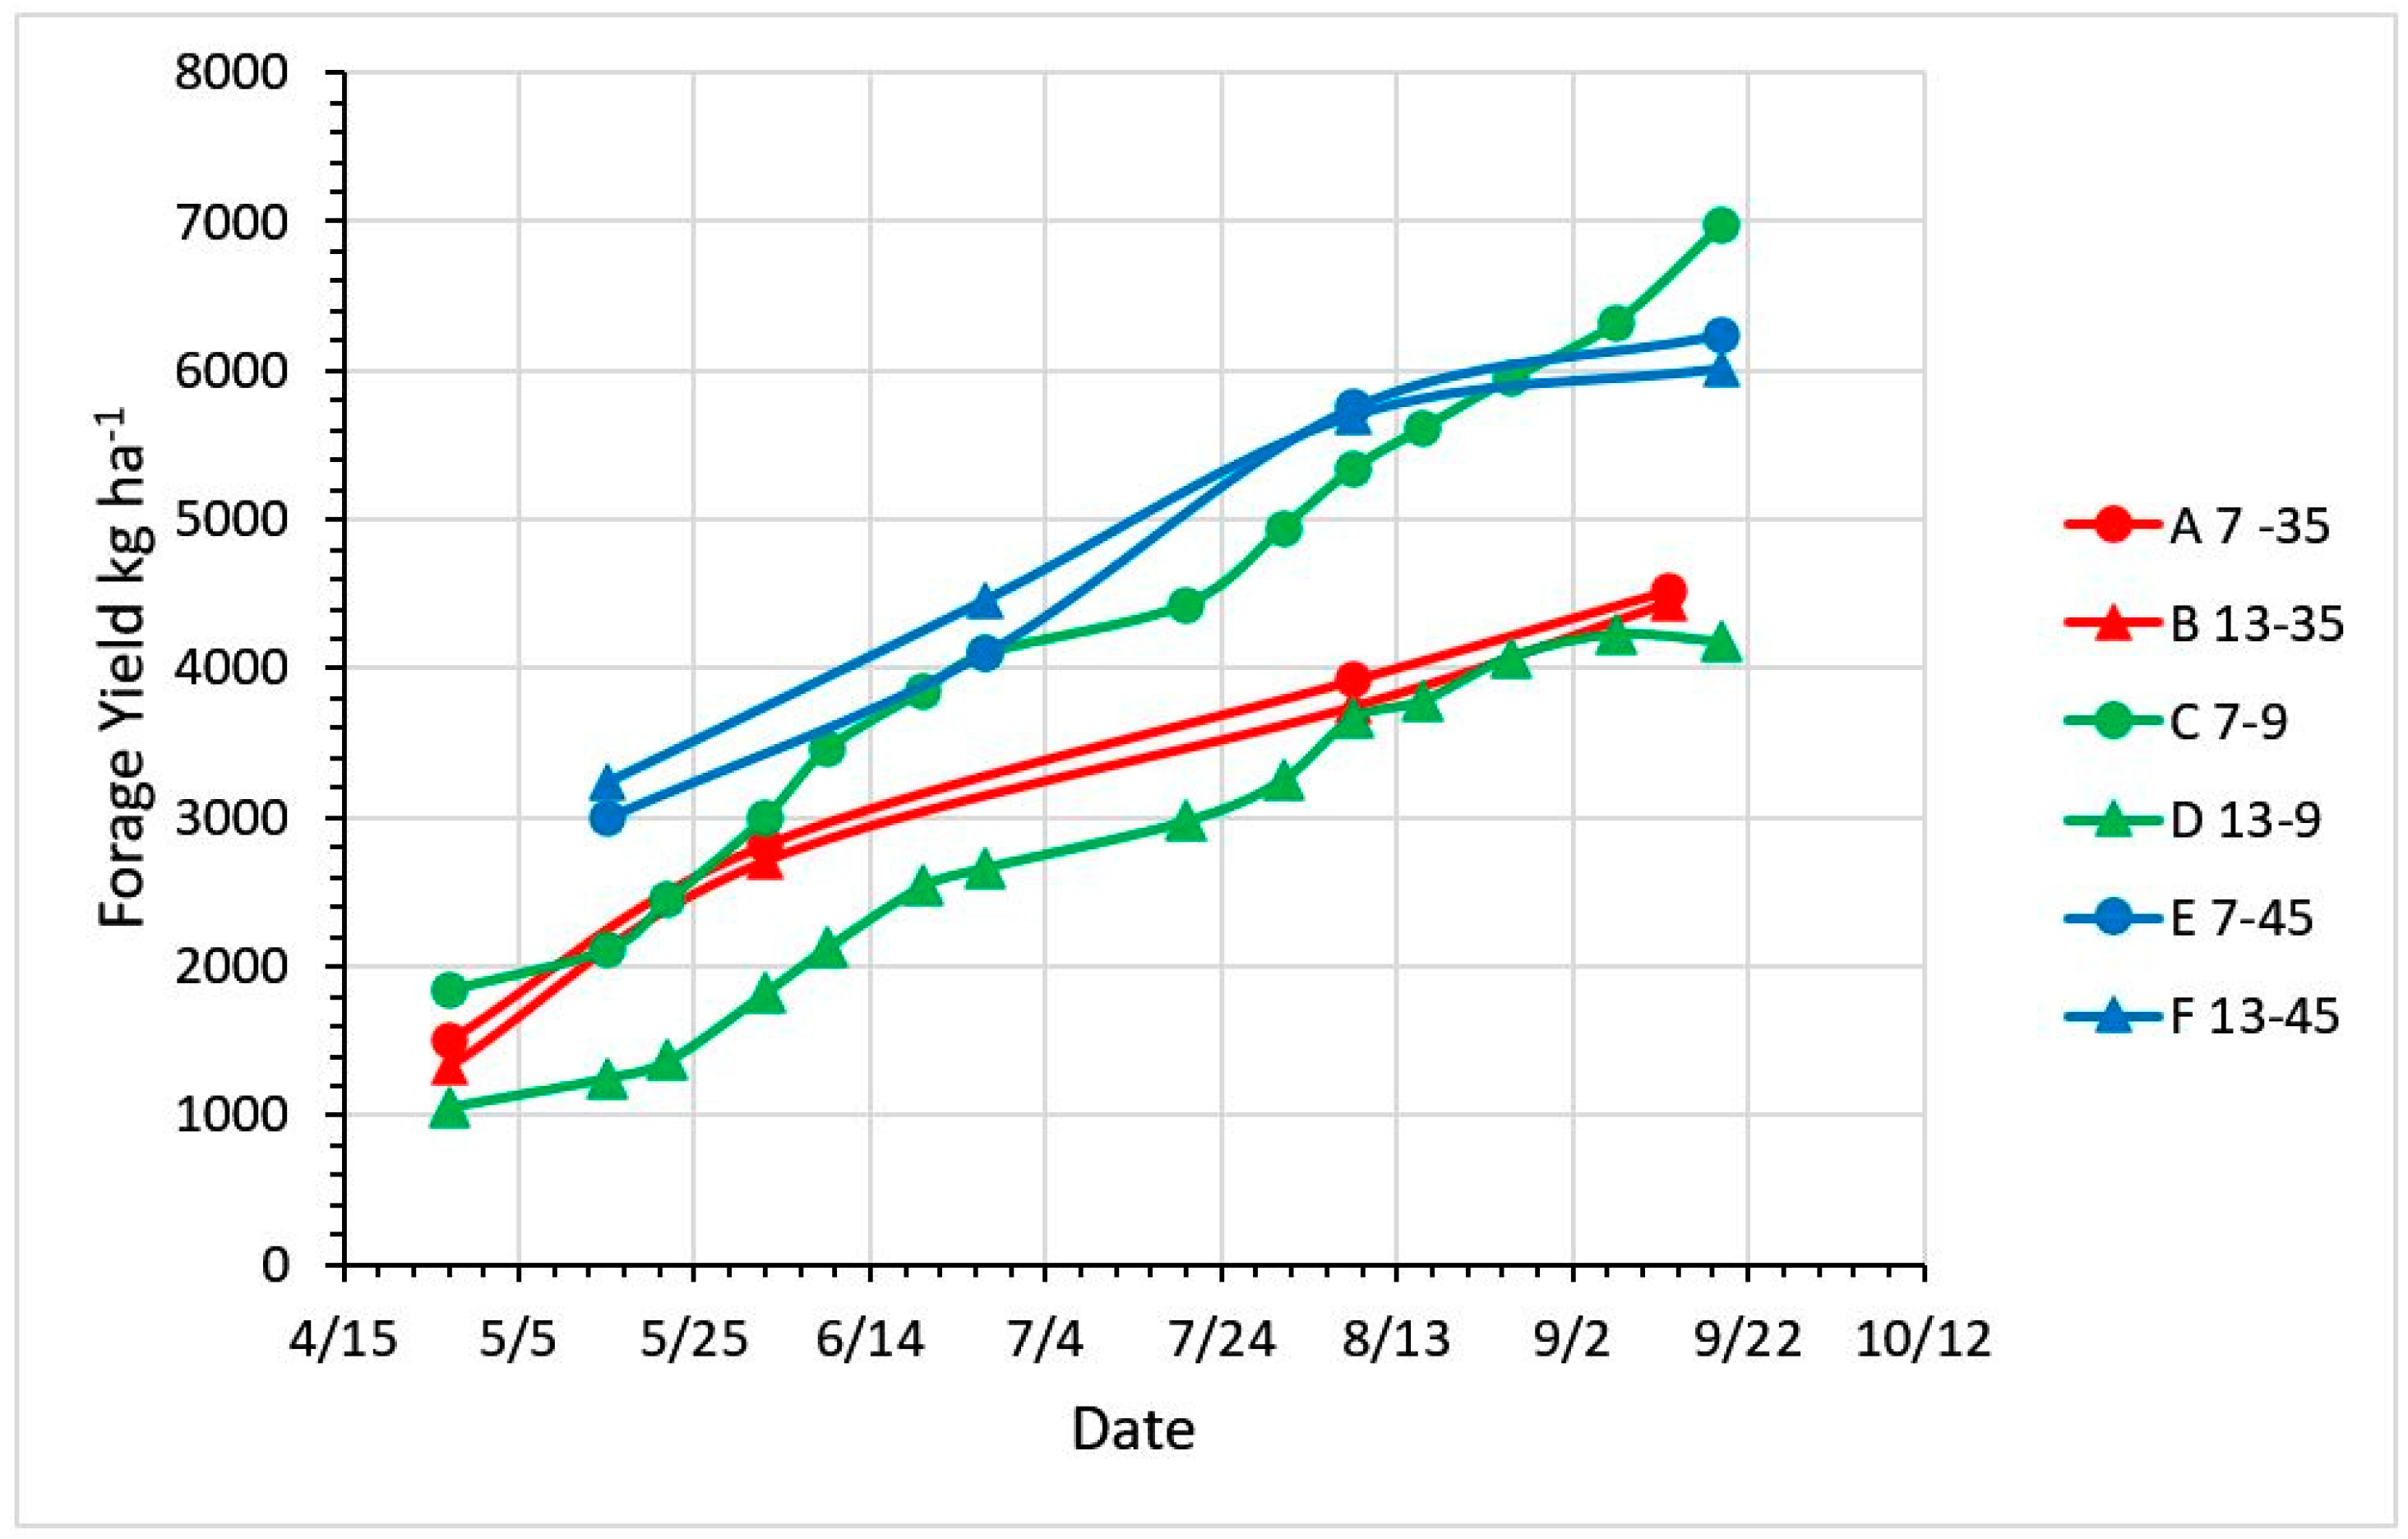
| Treatment | Stubble Height cm | Days Growth | Forage Available for Grazing kg DM ha−1 | Different from | PAR LI | Different from | FGR | Different from |
|---|---|---|---|---|---|---|---|---|
| A | 7 | 35 | 4526 | C | 0.91 | C | 21 | C, D, E, F |
| B | 13 | 35 | 4445 | C | 0.94 | C | 21 | C, D, E, F |
| C | 7 | 9 | 6975 | A, B, D | 0.77 | A, B, D, E, F | 35 | A, B, D, E, F |
| D | 13 | 9 | 4176 | C, E | 0.86 | C, F | 24 | A, B, C |
| E | 7 | 44 | 6242 | D | 0.94 | C | 27 | A, B, C |
| F | 13 | 44 | 6008 | 0.96 | C, D | 23 | A, B, C |
| Month | N | Percent of Days | Day Length Mid-Month, Hours | ||
|---|---|---|---|---|---|
| 25 | 50 | 75 | |||
| Apr | 120 | 580 | 1360 | 1630 | 13.1 |
| May | 257 | 690 | 1350 | 1670 | 14.2 |
| Jun | 191 | 720 | 1410 | 1580 | 14.8 |
| Jul | 272 | 700 | 1310 | 1580 | 14.5 |
| Aug | 170 | 470 | 900 | 1460 | 13.5 |
| Sep | 183 | 570 | 1010 | 1200 | 12.2 |
| Oct | 140 | 130 | 560 | 1150 | 10.9 |
| Site | County | Ann. Rainfall mm | January Temp. C | July Temp. C | Elevation m | MLRA |
|---|---|---|---|---|---|---|
| Experimental site | ||||||
| Reedsville | Preston | 1255 ± 373 | −3 ± 4 | 20 ± 1 | 537 | 127 |
| Stochastic model sites | ||||||
| Morgantown | Monongalia | 1067 ± 178 | −1 ± 3 | 23 ± 1 | 305 | 126 |
| Terra Alta | Preston | 1422 ± 203 | −3 ± 3 | 20 ± 1 | 792 | 127 |
| Moorefield | Hardy | 838 ± 127 | 0 ± 3 | 23 ± 1 | 305 | 147 |
| Major Land Resource Area (MLRA, USDA/NRCS, 2006) 126 Central Allegheny Plateau 127 Eastern Allegheny Plateau and Mountains 147 Northern Appalachian Ridges and Valleys | ||||||
| Month | Avg Rainfall (mm) | RTD RTM | RTD NRTM | NRTD NRTM | Alpha | Beta |
|---|---|---|---|---|---|---|
| Morgantown | ||||||
| Apr | 90 | 0.25 | 0.40 | 0.35 | 0.73 | 0.35 |
| May | 99 | 0.24 | 0.38 | 0.38 | 0.69 | 0.41 |
| Jun | 99 | 0.20 | 0.37 | 0.43 | 0.70 | 0.46 |
| Jul | 104 | 0.17 | 0.41 | 0.42 | 0.73 | 0.47 |
| Aug | 102 | 0.15 | 0.38 | 0.47 | 0.64 | 0.56 |
| Sep | 84 | 0.15 | 0.35 | 0.50 | 0.78 | 0.43 |
| Oct | 65 | 0.15 | 0.34 | 0.51 | 0.58 | 0.42 |
| Terra Alta | ||||||
| Apr | 119 | 0.32 | 0.37 | 0.31 | 0.80 | 0.37 |
| May | 127 | 0.28 | 0.38 | 0.34 | 0.80 | 0.43 |
| Jun | 132 | 0.25 | 0.39 | 0.36 | 0.76 | 0.50 |
| Jul | 152 | 0.22 | 0.41 | 0.37 | 0.68 | 0.65 |
| Aug | 116 | 0.21 | 0.38 | 0.41 | 0.58 | 0.62 |
| Sep | 98 | 0.18 | 0.37 | 0.45 | 0.72 | 0.46 |
| Oct | 85 | 0.18 | 0.34 | 0.48 | 0.72 | 0.42 |
| Moorefield | ||||||
| Apr | 59 | 0.10 | 0.30 | 0.60 | 1.09 | 0.28 |
| May | 85 | 0.15 | 0.36 | 0.49 | 0.73 | 0.44 |
| Jun | 90 | 0.13 | 0.35 | 0.52 | 0.75 | 0.49 |
| Jul | 94 | 0.12 | 0.34 | 0.54 | 0.89 | 0.45 |
| Aug | 85 | 0.10 | 0.34 | 0.56 | 0.79 | 0.50 |
| Sep | 65 | 0.08 | 0.30 | 0.62 | 0.82 | 0.45 |
| Oct | 62 | 0.07 | 0.23 | 0.70 | 0.80 | 0.51 |
| Probability | Morgantown | Terra Alta | Moorefield |
|---|---|---|---|
| Rain Fall mm | |||
| 10 | 0.3 | 0.5 | 0.8 |
| 25 | 1.5 | 1.8 | 2.3 |
| 50 | 4.6 | 5.3 | 5.8 |
| 75 | 10.7 | 12.2 | 13.0 |
| 90 | 19.6 | 22.4 | 22.4 |
© 2020 by the authors. Licensee MDPI, Basel, Switzerland. This article is an open access article distributed under the terms and conditions of the Creative Commons Attribution (CC BY) license (http://creativecommons.org/licenses/by/4.0/).
Share and Cite
Rayburn, E.B.; Griggs, T.C. Light Interception and the Growth of Pastures under Ideal and Stressful Growing Conditions on the Allegheny Plateau. Plants 2020, 9, 734. https://doi.org/10.3390/plants9060734
Rayburn EB, Griggs TC. Light Interception and the Growth of Pastures under Ideal and Stressful Growing Conditions on the Allegheny Plateau. Plants. 2020; 9(6):734. https://doi.org/10.3390/plants9060734
Chicago/Turabian StyleRayburn, Edward B., and Thomas C. Griggs. 2020. "Light Interception and the Growth of Pastures under Ideal and Stressful Growing Conditions on the Allegheny Plateau" Plants 9, no. 6: 734. https://doi.org/10.3390/plants9060734