Figure 1.
Changes of monthly average temperature (°C) and monthly precipitation (mm) from January 1 to August 31 in 2018 and 2019.
Figure 1.
Changes of monthly average temperature (°C) and monthly precipitation (mm) from January 1 to August 31 in 2018 and 2019.
Figure 2.
Changes of the maximum quantum yield of photosystem II (Fv/Fm); the effect of maize hybrids (Armagnac, Loupiac, Fornad), different N supply (0 kg ha−1; 80 kg ha−1; 160 kg ha−1), and two irrigation varieties (irrigated, non-irrigated) in a two year experiment (2018, 2019) at the tasseling (VT) phenological stage n = 4, ± s.e (differences between means of years (2018, 2019) were significant (p ≤ 0.001): in 2019, significantly higher values were observed than in 2018).
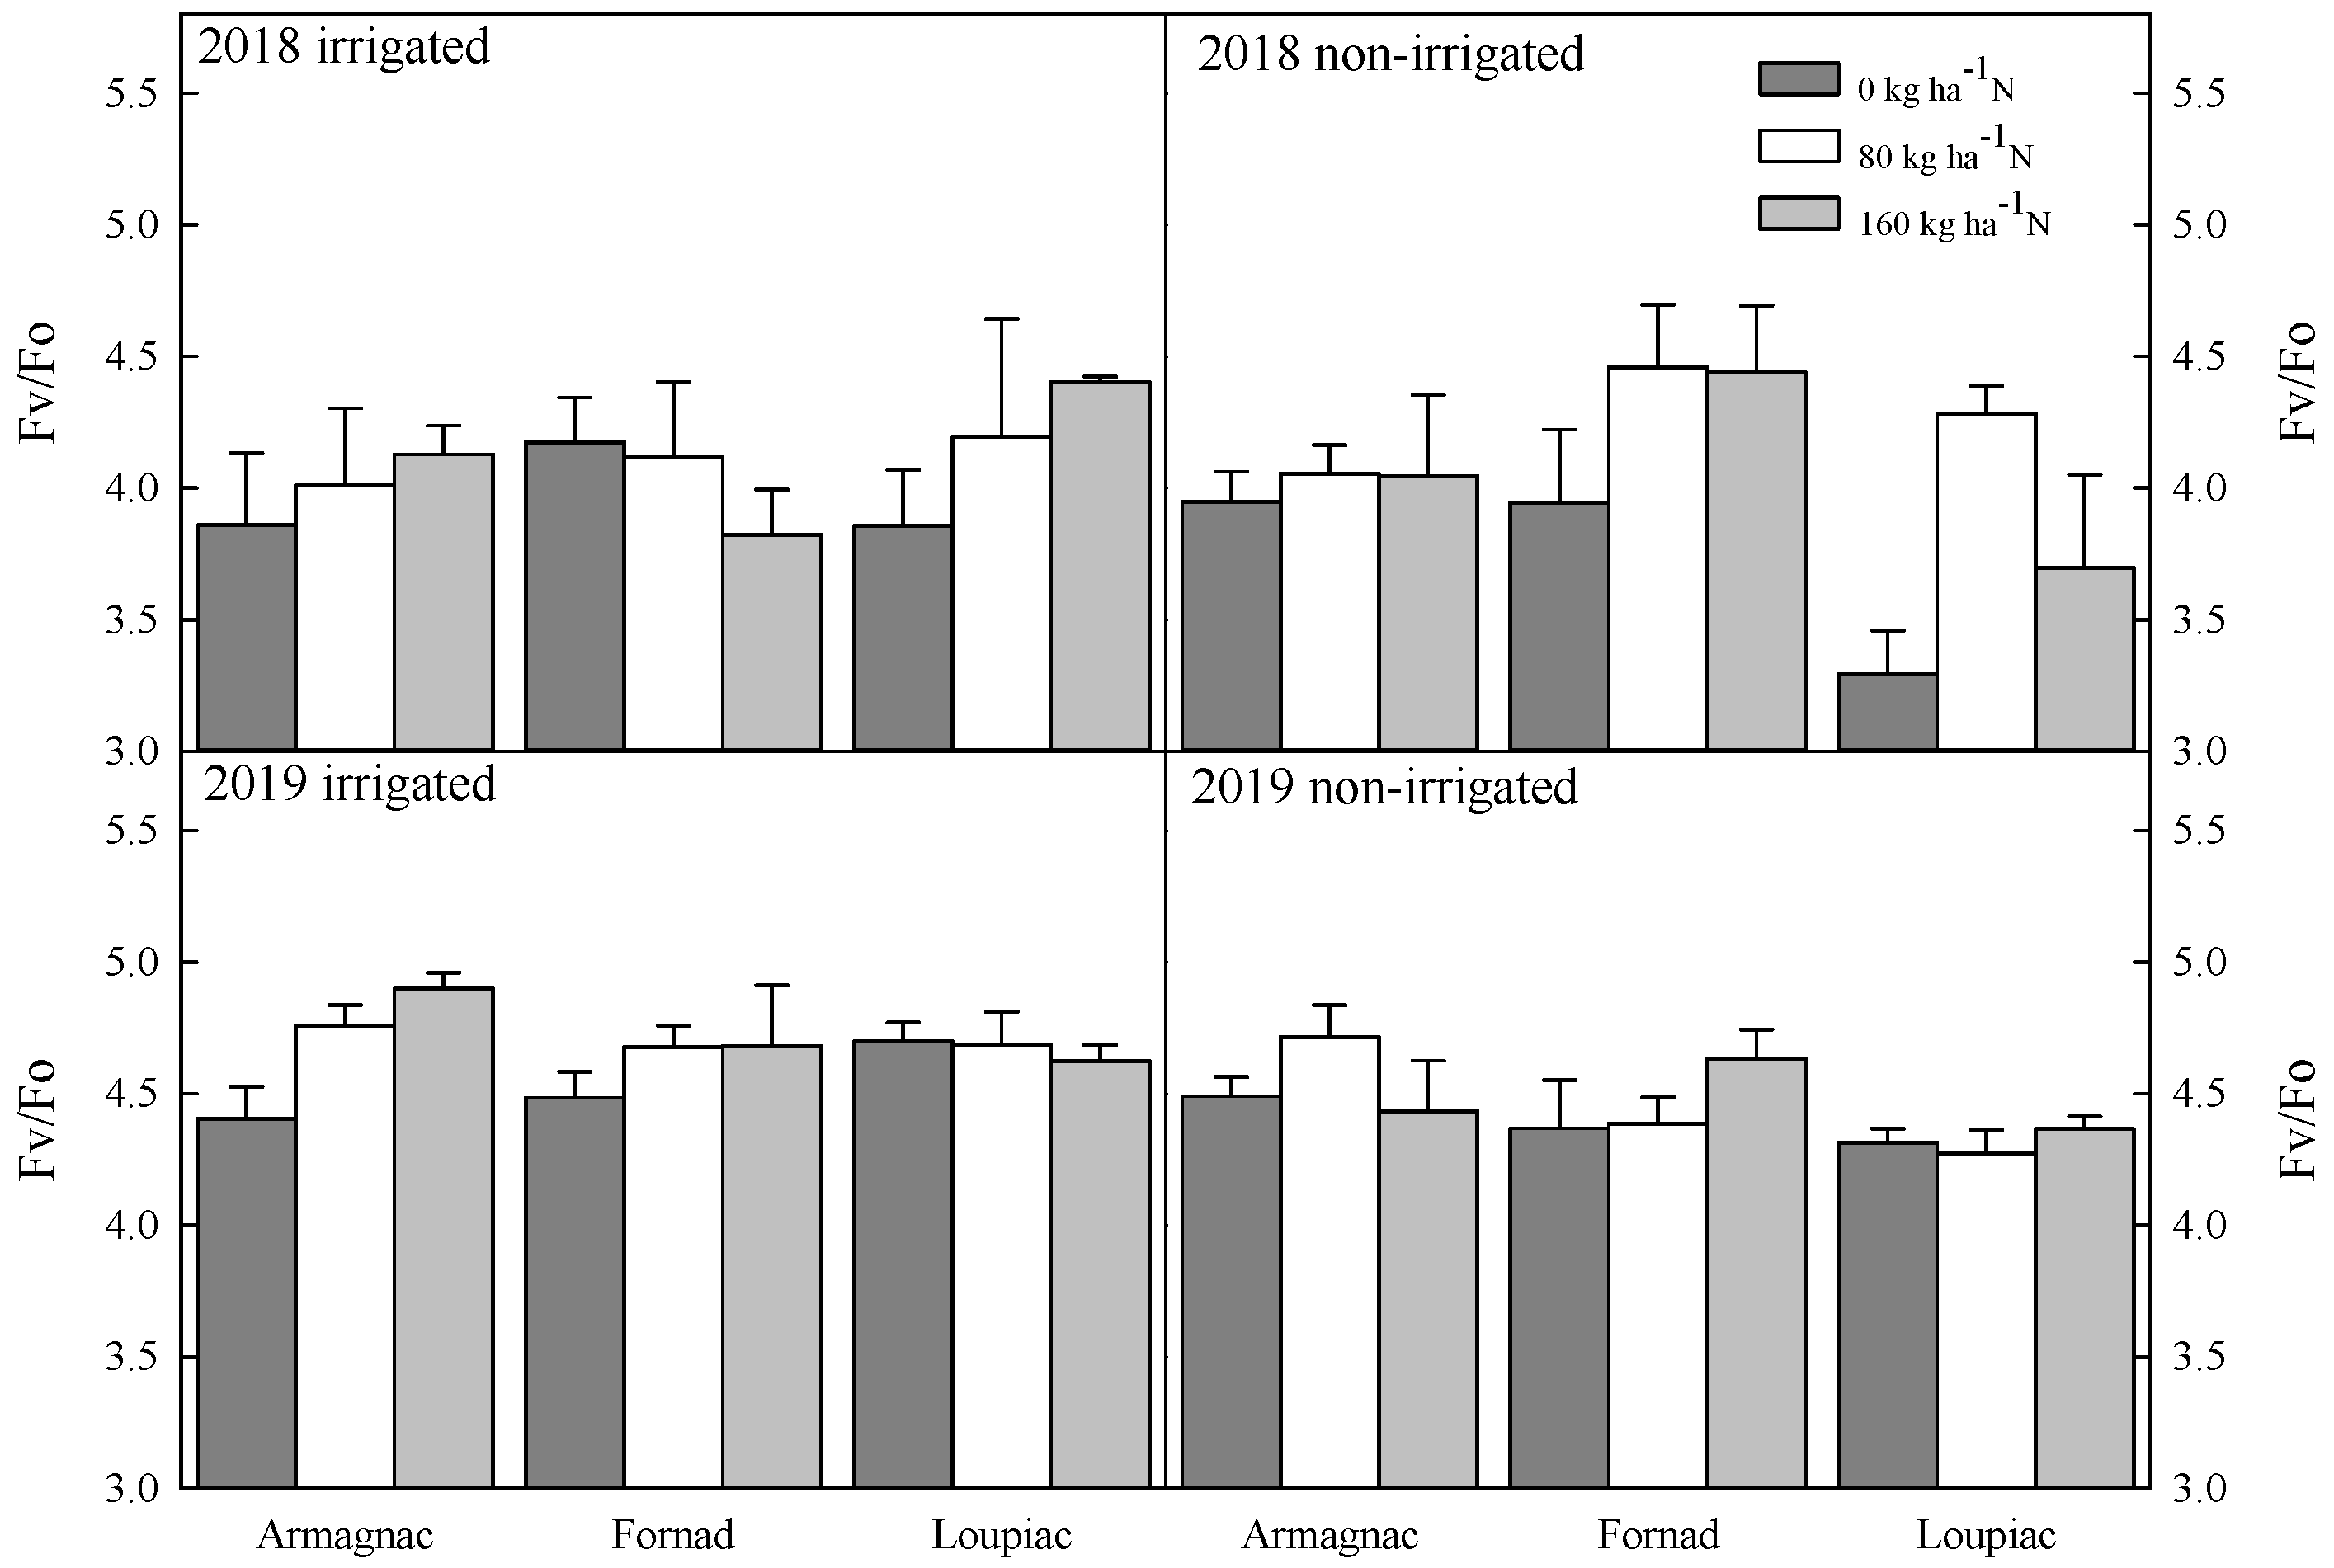
Figure 3.
Changes in the ratio between variable and minimal fluorescence (Fv/Fo), the effect of maize hybrids (Armagnac, Loupiac, Fornad), different N supply (0 kg ha−1; 80 kg ha−1; 160 kg ha−1), and two irrigation varieties (irrigated, non-irrigated) in a two year experiment (2018, 2019) at the tasseling (VT) phenological stage n = 4, ± s.e. (differences between means of years (2018, 2019) were significant (p ≤ 0.001): in 2019, significantly higher values were observed than in 2018).
Figure 4.
Changes of the ratio between maximal and minimal fluorescence (Fm/Fo), the effect of maize hybrids (Armagnac, Loupiac, Fornad), different N supply (0 kg ha−1; 80 kg ha−1; 160 kg ha−1), and two irrigation varieties (irrigated, non-irrigated) in a two year experiment (2018, 2019) at the tasseling (VT) phenological stage n = 4, ± s.e. (differences between means of years (2018, 2019) were significant (p ≤ 0.001): in 2019, significantly higher values were observed than in 2018).
Table 1.
Changes of Gaussen–Bagnouls xerothermal index from Jan 1 to Aug 31 in 2018 and 2019.
Table 1.
Changes of Gaussen–Bagnouls xerothermal index from Jan 1 to Aug 31 in 2018 and 2019.
| | January | February | March | April | May | June | July | August |
|---|
| 2018 | 7.0 | 443.3 | 11.2 | 1.1 | 1.5 | 1.4 | 1.0 | 2.0 |
| 2019 | −5.4 | 1.4 | 0.7 | 1.3 | 2.9 | 0.7 | 2.4 | 0.3 |
Table 2.
Results of the three-way ANOVA performed on the Fo, Fm, Fv, Fv/Fm, Fv/Fo, and Fm/Fo parameters measured at the V8 and R1 stages of maize in different crop years (2018, 2019); changes are due to nitrogen supply (0, 80, 160 kg ha−1), irrigation (irrigated, non-irrigated), and genotype (Armagnac, Fornad, Loupiac) * p ≤ 0.05 (n = 4).
| | 2018 | | 2019 | |
|---|
| Fo | Fm | Fv | Fv/Fm | Fv/Fo | Fm/Fo | Yield | Fo | Fm | Fv | Fv/Fm | Fv/Fo | Fm/Fo | Yield |
|---|
| V8 | Genotype | n.s. | n.s. | * | n.s. | n.s. | n.s. | − | * | * | n.s. | * | n.s. | n.s. | − |
| Nitrogen X Genotype | n.s. | n.s. | n.s. | n.s. | n.s. | n.s. | − | * | n.s. | n.s. | n.s. | n.s. | n.s. | − |
| R1 | Genotype | n.s. | * | * | n.s. | n.s. | n.s. | n.s. | n.s. | n.s. | n.s. | n.s. | n.s. | n.s. | n.s. |
| Nitrogen X Irrigation | * | n.s. | n.s. | n.s. | n.s. | n.s. | n.s. | n.s. | n.s. | n.s. | * | * | * | n.s. |
Table 3.
Changes of the Fo, Fm, Fv, Fv/Fm, Fv/Fo, Fm/Fo, and yield parameters at different levels of N (0, 80, 160 kg ha−1), genotypes (Armagnac, Fornad and Loupiac), and irrigation treatments (irrigated, non-irrigated) in 2018 (n = 4 ± s.e.).
Table 3.
Changes of the Fo, Fm, Fv, Fv/Fm, Fv/Fo, Fm/Fo, and yield parameters at different levels of N (0, 80, 160 kg ha−1), genotypes (Armagnac, Fornad and Loupiac), and irrigation treatments (irrigated, non-irrigated) in 2018 (n = 4 ± s.e.).
| | Armagnac | Fornad | Loupiac |
|---|
| 0 kg ha−1 | 80 kg ha−1 | 160 kg ha−1 | 0 kg ha−1 | 80 kg ha−1 | 160 kg ha−1 | 0 kg ha−1 | 80 kg ha−1 | 160 kg ha−1 |
|---|
| Irrigated | Fo | 0.21 ± 0.02 | 0.21 ± 0.02 | 0.21 ± 0.01 | 0.19 ± 0.01 | 0.2 ± 0.01 | 0.21 ± 0.01 | 0.21 ± 0.01 | 0.22 ± 0.02 | 0.19 ± 0.03 |
| Fm | 1.13 ± 0.12 | 1.02 ± 0.11 | 1.09 ± 0.13 | 0.86 ± 0.13 | 1.03 ± 0.14 | 1.08 ± 0.09 | 0.95 ± 0.16 | 1.15 ± 0.19 | 1.0 ± 0.16 |
| Fv | 0.91 ± 0.1 | 0.81 ± 0.09 | 0.88 ± 0.12 | 0.67 ± 0.12 | 0.83 ± 0.13 | 0.87 ± 0.09 | 0.74 ± 0.15 | 0.93 ± 0.18 | 0.81 ± 0.14 |
| Fv/Fm | 0.81 ± 0.01 | 0.79 ± 0.01 | 0.81 ± 0.02 | 0.78 ± 0.03 | 0.8 ± 0.01 | 0.81 ± 0.02 | 0.78 ± 0.02 | 0.81 ± 0.02 | 0.81 ± 0.03 |
| Fv/Fo | 4.28 ± 0.34 | 3.85 ± 0.2 | 4.19 ± 0.43 | 3.64 ± 0.66 | 4.02 ± 0.39 | 4.27 ± 0.63 | 3.55 ± 0.52 | 4.19 ± 0.59 | 4.23 ± 0.65 |
| Fm/Fo | 5.28 ± 0.34 | 4.85 ± 0.2 | 5.19 ± 0.44 | 4.64 ± 0.66 | 5.02 ± 0.39 | 5.27 ± 0.63 | 4.55 ± 0.52 | 5.19 ± 0.59 | 5.23 ± 0.65 |
| Yield | 0.46 ± 0.11 | 0.46 ± 0.11 | 0.47 ± 0.1 | 0.42 ± 0.13 | 0.42 ± 0.09 | 0.44 ± 0.07 | 0.44 ± 0.06 | 0.4 ± 0.14 | 0.49 ± 0.09 |
| Non-irrigated | Fo | 0.22 ± 0.01 | 0.21 ± 0.02 | 0.21 ± 0.01 | 0.22 ± 0.02 | 0.2 ± 0.01 | 0.21 ± 0.01 | 0.21 ± 0.03 | 0.2 ± 0.01 | 0.21 ± 0.01 |
| Fm | 1.2 ± 0.16 | 1.14 ± 0.09 | 1.08 ± 0.13 | 1.11 ± 0.12 | 1.04 ± 0.15 | 1.11 ± 0.07 | 1.08 ± 0.17 | 1.04 ± 0.01 | 1.04 ± 0.07 |
| Fv | 0.98 ± 0.16 | 0.93 ± 0.08 | 0.87 ± 0.13 | 0.89 ± 0.1 | 0.84 ± 0.15 | 0.9 ± 0.06 | 0.86 ± 0.15 | 0.84 ± 0.07 | 0.84 ± 0.01 |
| Fv/Fm | 0.81 ± 0.03 | 0.82 ± 0.01 | 0.8 ± 0.02 | 0.8 ± 0.01 | 0.8 ± 0.03 | 0.81 ± 0.01 | 0.8 ± 0.02 | 0.81 ± 0.01 | 0.8 ± 0.02 |
| Fv/Fo | 4.42 ± 0.7 | 4.5 ± 0.28 | 4.12 ± 0.56 | 4.01 ± 0.26 | 4.17 ± 0.73 | 4.24 ± 0.14 | 4.05 ± 0.47 | 4.24 ± 0.28 | 4.06 ± 0.46 |
| Fm/Fo | 5.42 ± 0.71 | 5.5 ± 0.28 | 5.12 ± 0.56 | 5.01 ± 0.26 | 5.17 ± 0.73 | 5.24 ± 0.14 | 5.05 ± 0.47 | 5.25 ± 0.28 | 5.06 ± 0.45 |
| Yield | 0.5 ± 0.1 | 0.54 ± 0.04 | 0.43 ± 0.12 | 0.38 ± 0.09 | 0.39 ± 0.09 | 0.39 ± 0.14 | 0.48 ± 0.11 | 0.47 ± 0.11 | 0.47 ± 0.11 |
Table 4.
Changes of the Fo, Fm, Fv, Fv/Fm, Fv/Fo, Fm/Fo, and yield parameters at different levels of N (0, 80, 160 kg ha−1), genotypes (Armagnac, Fornad, and Loupiac), and irrigation treatments (irrigated, non-irrigated) in 2019 (n = 4 ± s.e.).
Table 4.
Changes of the Fo, Fm, Fv, Fv/Fm, Fv/Fo, Fm/Fo, and yield parameters at different levels of N (0, 80, 160 kg ha−1), genotypes (Armagnac, Fornad, and Loupiac), and irrigation treatments (irrigated, non-irrigated) in 2019 (n = 4 ± s.e.).
| | Armagnac | Fornad | Loupiac |
|---|
| 0 kg ha−1 | 80 kg ha−1 | 160 kg ha−1 | 0 kg ha−1 | 80 kg ha−1 | 160 kg ha−1 | 0 kg ha−1 | 80 kg ha−1 | 160 kg ha−1 |
|---|
| Irrigated | Fo | 0.24 ± 0.01 | 0.24 ± 0.02 | 0.23 ± 0.01 | 0.23 ± 0.02 | 0.24 ± 0.03 | 0.24 ± 0.03 | 0.25 ± 0.01 | 0.24 ± 0.01 | 0.25 ± 0.02 |
| Fm | 1.22 ± 0.08 | 1.26 ± 0.2 | 1.22 ± 0.14 | 1.15 ± 0.06 | 1.29 ± 0.18 | 1.23 ± 0.07 | 1.26 ± 0.05 | 1.09 ± 0.11 | 1.33 ± 0.12 |
| Fv | 0.98 ± 0.09 | 1.02 ± 0.19 | 0.98 ± 0.14 | 0.91 ± 0.05 | 1.05 ± 0.16 | 0.99 ± 0.06 | 1.01 ± 0.06 | 0.85 ± 0. 11 | 1.08 ± 0.11 |
| Fv/Fm | 0.81 ± 0.02 | 0.81 ± 0.03 | 0.81 ± 0.03 | 0.8 ± 0.02 | 0.81 ± 0.02 | 0.81 ± 0.02 | 0.8 ± 0.02 | 0.78 ± 0.03 | 0.81 ± 0.01 |
| Fv/Fo | 4.15 ± 0.42 | 4.25 ± 0.71 | 4.27 ± 0.66 | 4.02 ± 0.35 | 4.41 ± 0.53 | 4.24 ± 0.46 | 3.91 ± 0.45 | 3.61 ± 0.53 | 4.38 ± 0.24 |
| Fm/Fo | 5.15 ± 0.42 | 5.25 ± 0.71 | 5.27 ± 0.66 | 4.91 ± 0.35 | 5.41 ± 0.53 | 5.24 ± 0.46 | 5.02 ± 0.45 | 4.61 ± 0.53 | 5.39 ± 0.24 |
| Yield | 0.68 ± 0.06 | 0.67 ± 0.08 | 0.59 ± 0.17 | 0.63 ± 0.08 | 0.69 ± 0.09 | 0.64 ± 0.12 | 0.62 ± 0.16 | 0.46 ± 0.14 | 0.62 ± 0.08 |
| Non-irrigated | Fo | 0.26 ± 0.02 | 0.23 ± 0.01 | 0.25 ± 0.01 | 0.24 ± 0.01 | 0.25 ± 0.02 | 0.23 ± 0.03 | 0.25 ± 0.01 | 0.25 ± 0.02 | 0.24 ± 0.02 |
| Fm | 1.25 ± 0.24 | 1.26 ± 0.17 | 1.08 ± 0.19 | 1.19 ± 0.15 | 1.3 ± 0.1 | 1.19 ± 0.12 | 1.13 ± 0.15 | 1.31 ± 0.19 | 1.08 ± 0.14 |
| Fv | 1.0 ± 0.22 | 1.03 ± 0.16 | 0.84 ± 0.19 | 0.95 ± 0.14 | 1.06 ± 0.08 | 0.95 ± 0.09 | 0.88 ± 0.15 | 1.05 ± 0.17 | 0.84 ± 0.12 |
| Fv/Fm | 0.79 ± 0.03 | 0.82 ± 0.02 | 0.77 ± 0.05 | 0.8 ± 0.02 | 0.81 ± 0.01 | 0.8 ± 0.01 | 0.78 ± 0.04 | 0.81 ± 0.01 | 0.78 ± 0.02 |
| Fv/Fo | 3.89 ± 0.71 | 4.47 ± 0.58 | 3.44 ± 0.86 | 4 ± 0.54 | 4.31 ± 0.26 | 4.07 ± 0.11 | 3.55 ± 0.7 | 4.17 ± 0.38 | 3.47 ± 0.31 |
| Fm/Fo | 4.89 ± 0.71 | 5.47 ± 0.59 | 4.44 ± 0.86 | 5 ± 0.53 | 5.31 ± 0.26 | 5.07 ± 0.11 | 4.54 ± 0.7 | 5.17 ± 0.38 | 4.46 ± 0.31 |
| Yield | 0.66 ± 0.07 | 0.53 ± 0.14 | 0.62 ± 0.09 | 0.49 ± 0.33 | 0.55 ± 0.27 | 0.34 ± 0.39 | 0.56 ± 0.12 | 0.71 ± 0.03 | 0.58 ± 0.11 |
Table 5.
Changes in weight of ear (g), kernel (g), and kernel/cob ratio at different levels of N (0, 80, 160 kg ha-1) in different crop years (2018, 2019), genotypes (Armagnac, Fornad, and Loupiac), and irrigation treatments (irrigated, non-irrigated) (n = 4 ± s.e.).
Table 5.
Changes in weight of ear (g), kernel (g), and kernel/cob ratio at different levels of N (0, 80, 160 kg ha-1) in different crop years (2018, 2019), genotypes (Armagnac, Fornad, and Loupiac), and irrigation treatments (irrigated, non-irrigated) (n = 4 ± s.e.).
| | Armagnac | Fornad | Loupiac |
|---|
| 0 kg ha−1 | 80 kg ha−1 | 160 kg ha−1 | 0 kg ha−1 | 80 kg ha−1 | 160 kg ha−1 | 0 kg ha−1 | 80 kg ha−1 | 160 kg ha−1 |
|---|
| Irrigated | 2018 | Ear (g) | 206.59 ± 46.93 | 219.7 ± 32.83 | 231.36 ± 10.16 | 142.61 ± 26.5 | 228.71 ± 16.55 | 211.67 ± 28.08 | 178.05 ± 59.74 | 214.63 ± 21.62 | 216.95 ± 20.72 |
| Kernel (g) | 180.77 ± 41.15 | 195.65 ± 28.31 | 205.39 ± 8.86 | 127.68 ± 23.86 | 207.56 ± 15.05 | 191.68 ± 23.84 | 159.66 ± 53.46 | 193.77 ± 19.91 | 191.02 ± 25.63 |
| Ker/cob ratio | 7.01 ± 0.25 | 8.24 ± 0.81 | 7.92 ± 0.25 | 8.63 ± 1.08 | 9.82 ± 0.27 | 9.73 ± 0.88 | 8.69 ± 0.73 | 9.4 ± 1.28 | 7.8 ± 2.28 |
| 2019 | Ear (g) | 178.3 ± 53.25 | 180.42 ± 41.95 | 226.22 ± 19.41 | 163.33 ± 38.1 | 173.17 ± 12.76 | 199.41 ± 28.99 | 167.64 ± 43.57 | 208.58 ± 14.87 | 225.22 ± 10.28 |
| Kernel (g) | 156.19 ± 48.93 | 158.24 ± 38.24 | 199.77 ± 16.57 | 143.57 ± 34.26 | 156.01 ± 11.5 | 180.44 ± 25.34 | 149.49 ± 38.12 | 187.37 ± 12.87 | 202.31 ± 8.27 |
| Ker/cob ratio | 6.96 ± 1.11 | 7.07 ± 0.63 | 7.57 ± 0.33 | 7.33 ± 0.98 | 9.12 ± 0.64 | 9.59 ± 0.53 | 8.31 ± 0.38 | 8.91 ± 0.86 | 8.92 ± 0.93 |
| Non- irrigated | 2018 | Ear (g)t | 182.87 ± 56.35 | 201.86 ± 30.42 | 213.61 ± 32.62 | 185.86 ± 30.18 | 192.02 ± 15.69 | 173.58 ± 13 | 160.54 ± 40.72 | 221.52 ± 42.71 | 201.67 ± 16.42 |
| Kernel (g) | 159.99 ± 50.07 | 177.69 ± 26.44 | 188.51 ± 27.92 | 168.88 ± 28.38 | 174.33 ± 14.19 | 157.63 ± 11.09 | 141.81 ± 38.81 | 198.31 ± 37.87 | 177.41 ± 17.13 |
| Ker/cob ratio | 6.97 ± 0.51 | 7.37 ± 0.19 | 7.58 ± 0.68 | 9.9 ± 0.62 | 9.95 ± 1.14 | 9.96 ± 0.84 | 7.74 ± 1.86 | 8.6 ± 0.57 | 7.45 ± 1.58 |
| 2019 | Ear (g) | 168.77 ± 47.29 | 173.82 ± 47.24 | 184.48 ± 18.73 | 137.36 ± 44.47 | 202.26 ± 32.35 | 198.29 ± 19.63 | 143.51 ± 28.47 | 172.89 ± 23.44 | 187.1 ± 28.43 |
| Kernel (g) | 148.33 ± 39.95 | 153.8 ± 43.19 | 162.25 ± 15.42 | 123.97 ± 40.41 | 180.71 ± 29.64 | 178.93 ± 17.09 | 127.53 ± 25.52 | 155.18 ± 21.31 | 166.86 ± 25.69 |
| Ker/cob ratio | 7.62 ± 1.76 | 7.61 ± 0.77 | 7.34 ± 0.37 | 9.4 ± 1.62 | 8.47 ± 1.2 | 9.28 ± 0.48 | 7.97 ± 0.2 | 8.81 ± 0.94 | 8.27 ± 0.83 |
Table 6.
Changes of the correlation coefficients (r) between ear parameters of maize (ear weight, kernel weight) and chlorophyll fluorescence parameters (Fv/Fm, Fv/Fo, Fm/Fo) at different levels of N (0, 80, 160 kg ha−1) in different crop years (2018, 2019), genotypes (Armagnac, Fornad and Loupiac), and irrigation treatments (irrigated, non-irrigated). Significant differences in grey (p ≤ 0.05) and dark grey (p ≤ 0.01).
| | 0 kg ha−1 | 80 kg ha−1 | 160 kg ha−1 |
|---|
| Fv/Fm | Fv/Fo | Fm/Fo | Fv/Fm | Fv/Fo | Fm/Fo | Fv/Fm | Fv/Fo | Fm/Fo |
|---|
| Ear weight | Armagnac | 2018 | Irrigated | −0.95 | −0.97 | −0.97 | 0.85 | 0.83 | 0.83 | 0.49 | 0.8 | 0.48 |
| Non-irrigated | −0.90 | −0.90 | −0.90 | −0.63 | −0.65 | −0.66 | −0.54 | −0.54 | −0.54 |
| 2019 | Irrigated | 0.66 | 0.69 | 0.70 | 0.37 | 0.39 | 0.40 | 0.96 | 0.95 | 0.95 |
| Non-irrigated | −0.69 | −0.67 | −0.67 | 0.48 | 0.52 | 0.53 | 0.28 | 0.24 | 0.24 |
| Fornad | 2018 | Irrigated | 0.90 | 0.88 | 0.88 | −0.15 | −0.15 | −0.15 | 0.82 | 0.84 | 0.84 |
| Non-irrigated | 0.82 | 0.86 | 0.86 | −0.02 | −0.01 | −0.01 | −0.05 | 0.00 | 0.01 |
| 2019 | Irrigated | 0.07 | 0.02 | 0.01 | 0.90 | −0.91 | −0.91 | 0.44 | 0.43 | 0.43 |
| Non-irrigated | 0.82 | 0.81 | 0.81 | 0.34 | 0.34 | 0.33 | 0.65 | 0.63 | 0.62 |
| Loupiac | 2018 | Irrigated | −0.26 | −0.22 | −0.22 | −1.00 | −0.99 | −0.99 | 0.93 | 0.95 | 0.94 |
| Non-irrigated | 0.53 | 0.55 | 0.55 | 0.07 | 0.10 | 0.10 | −0.63 | −0.66 | −0.66 |
| 2019 | Irrigated | 0.93 | 0.91 | 0.91 | 0.63 | 0.59 | 0.59 | −0.59 | −0.55 | −0.55 |
| Non-irrigated | −0.49 | −0.49 | −0.50 | 0.89 | 0.88 | 0.88 | 0.83 | 0.85 | 0.85 |
| Kernel weight | Armagnac | 2018 | Irrigated | −0.95 | −0.97 | −0.97 | 0.84 | 0.82 | 0.82 | 0.42 | 0.41 | 0.41 |
| Non-irrigated | −0.89 | −0.89 | −0.89 | −0.62 | −0.65 | −0.65 | −0.59 | −0.60 | −0.59 |
| 2019 | Irrigated | 0.67 | 0.70 | 0.71 | 0.35 | 0.38 | 0.38 | 0.97 | 0.97 | 0.96 |
| Non-irrigated | −0.66 | −0.64 | −0.64 | 0.50 | 0.54 | 0.55 | 0.28 | 0.24 | 0.23 |
| Fornad | 2018 | Irrigated | 0.91 | 0.89 | 0.89 | −0.11 | −0.11 | −0.12 | 0.82 | 0.84 | 0.60 |
| Non−irrigated | 0.82 | 0.85 | 0.85 | 0.10 | 0.12 | 0.12 | 0.01 | 0.05 | 0.06 |
| 2019 | Irrigated | 0.14 | 0.09 | 0.07 | −0.87 | −0.88 | −0.88 | 0.43 | 0.43 | 0.42 |
| Non−irrigated | 0.86 | 0.85 | 0.84 | 0.79 | 0.42 | 0.41 | 0.63 | 0.61 | 0.60 |
| Loupiac | 2018 | Irrigated | −0.23 | −0.20 | −0.20 | −1.00 | −1.00 | −1.00 | 0.98 | 0.97 | −0.39 |
| Non−irrigated | 0.58 | 0.61 | 0.61 | 0.06 | 0.08 | 0.08 | −0.58 | −0.63 | −0.63 |
| 2019 | Irrigated | 0.93 | 0.91 | 0.90 | 0.62 | 0.59 | 0.59 | −0.66 | −0.63 | −0.62 |
| Non−irrigated | −0.50 | −0.50 | −0.50 | −0.05 | 0.89 | 0.89 | 0.83 | 0.84 | 0.85 |


