Effect of the Applied Fertilization Method under Full Straw Return on the Growth of Mechanically Transplanted Rice

Abstract
:1. Introduction
2. Materials and Methods
2.1. Experimental Materials
2.2. Field Site and Experimental Design
2.3. Testing Index
2.4. Statistical Analysis
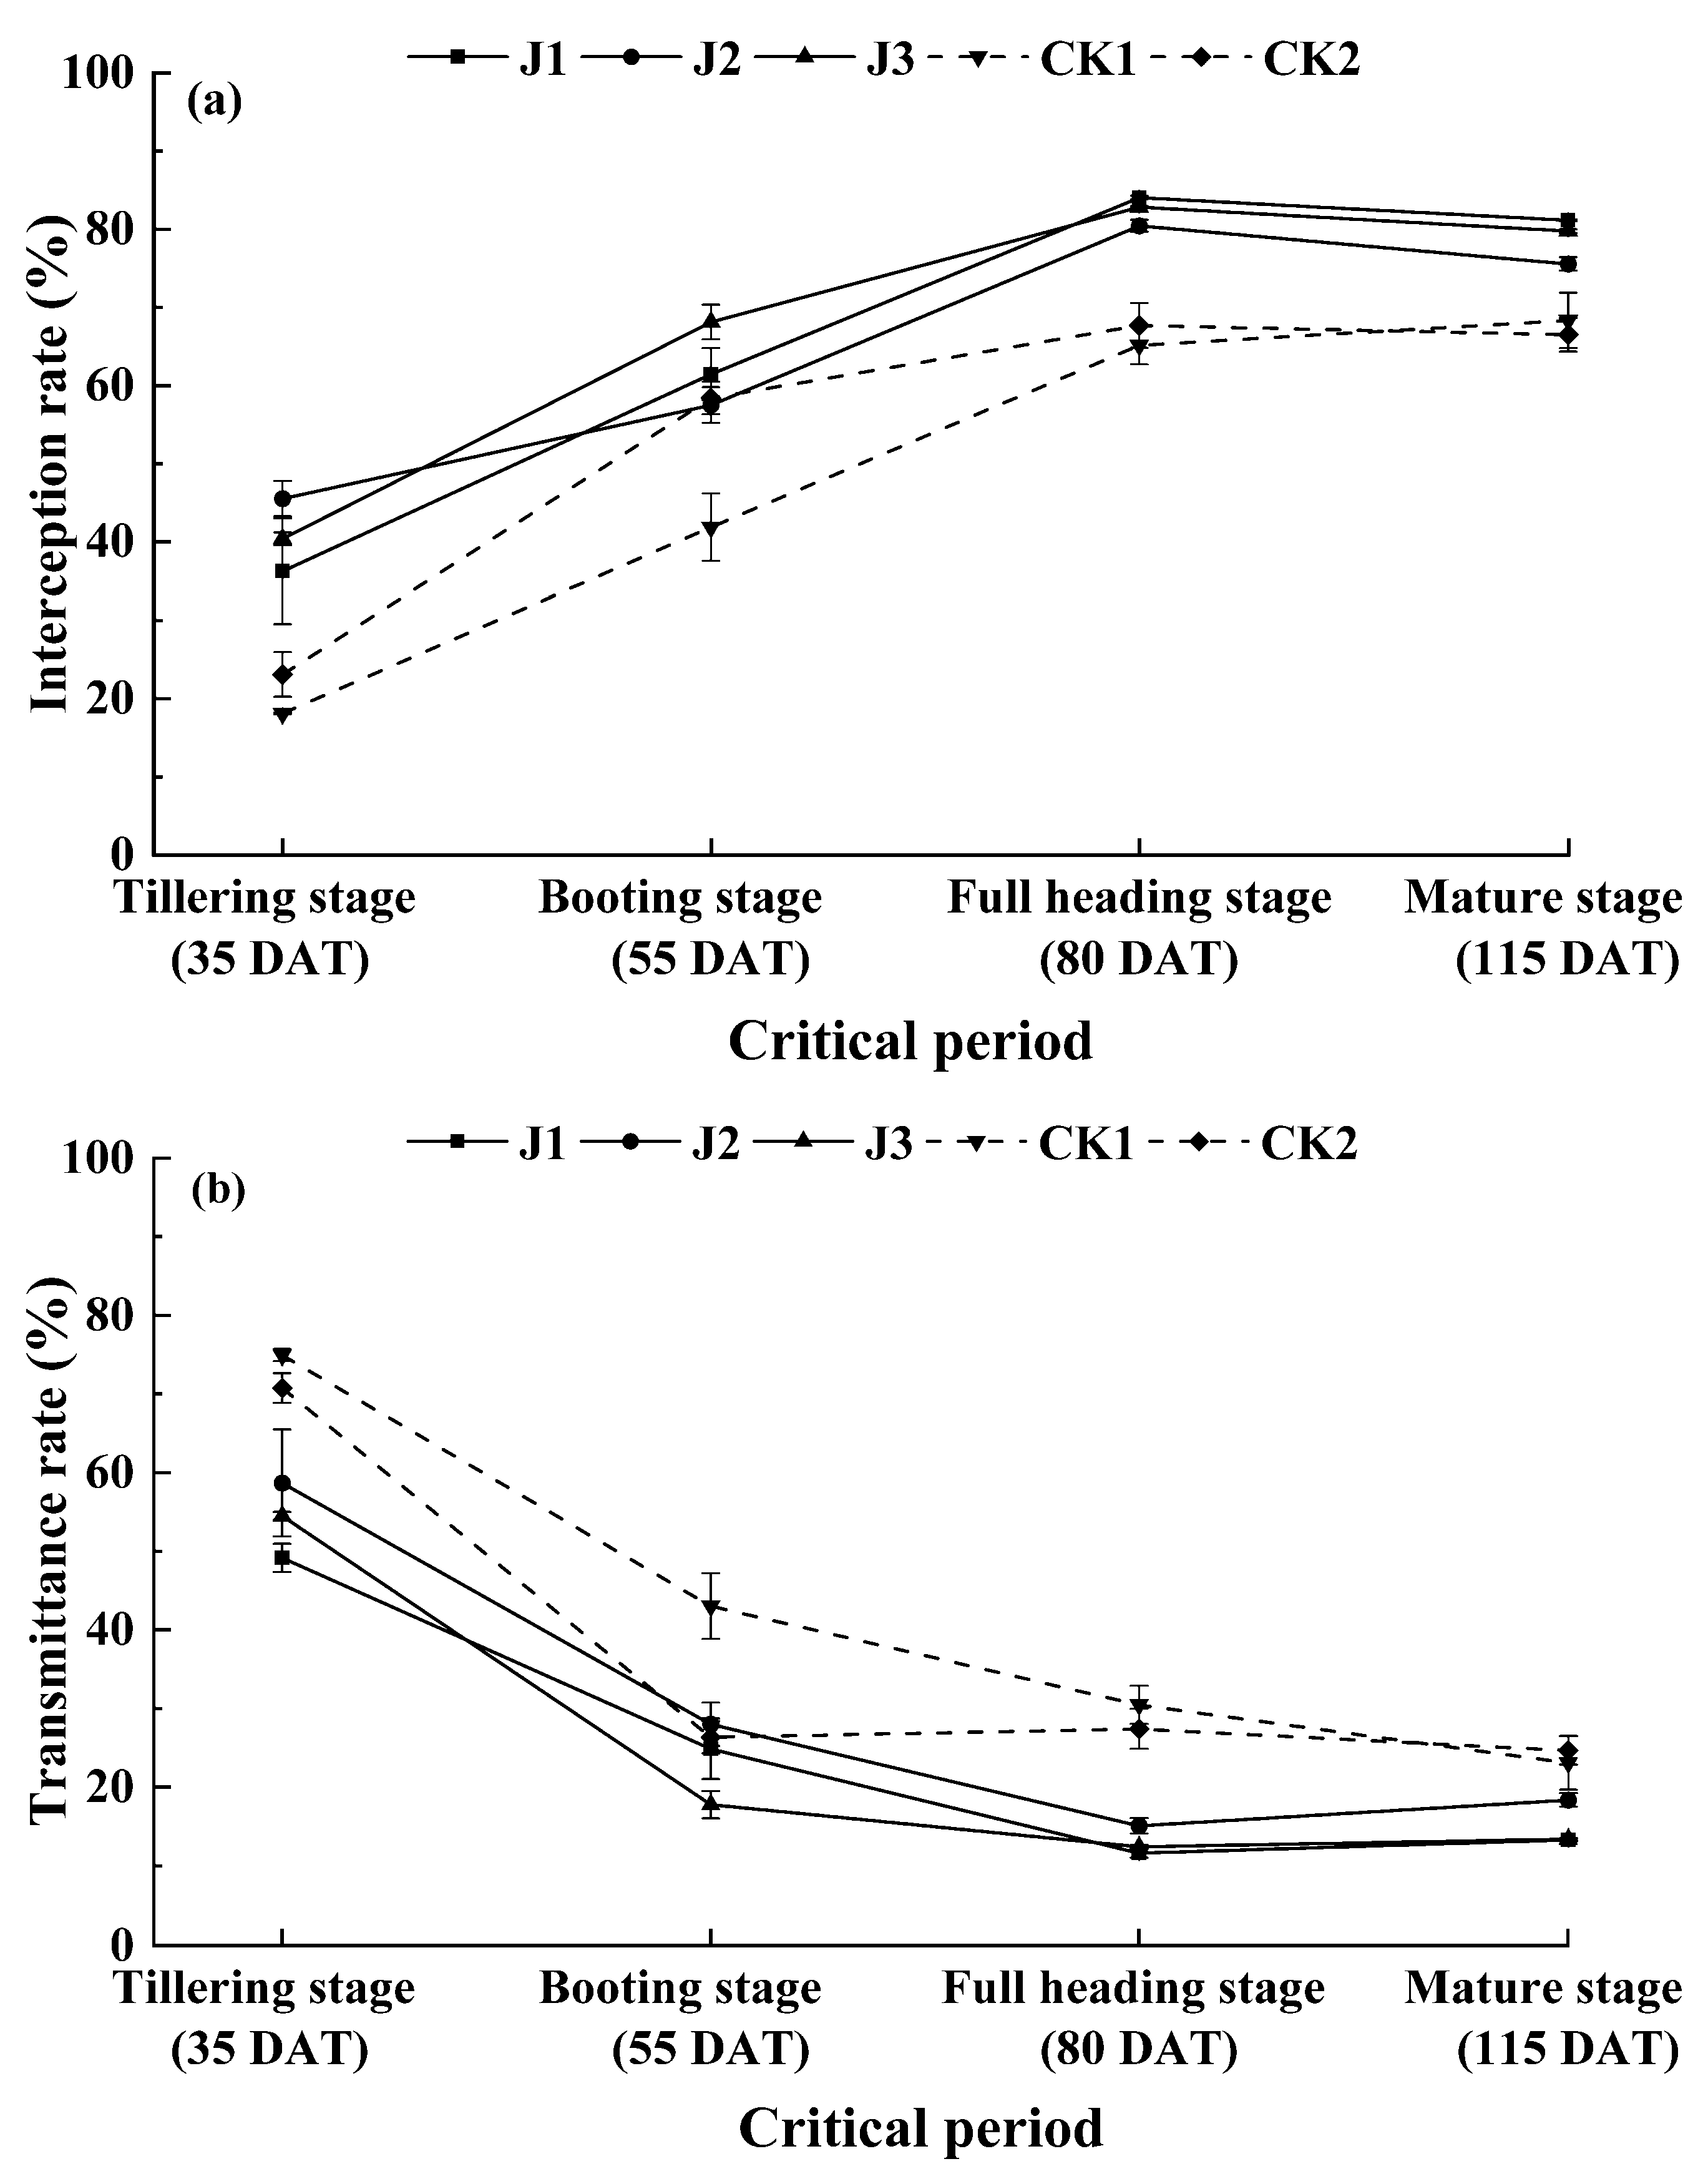
- Tr = PART / PARI
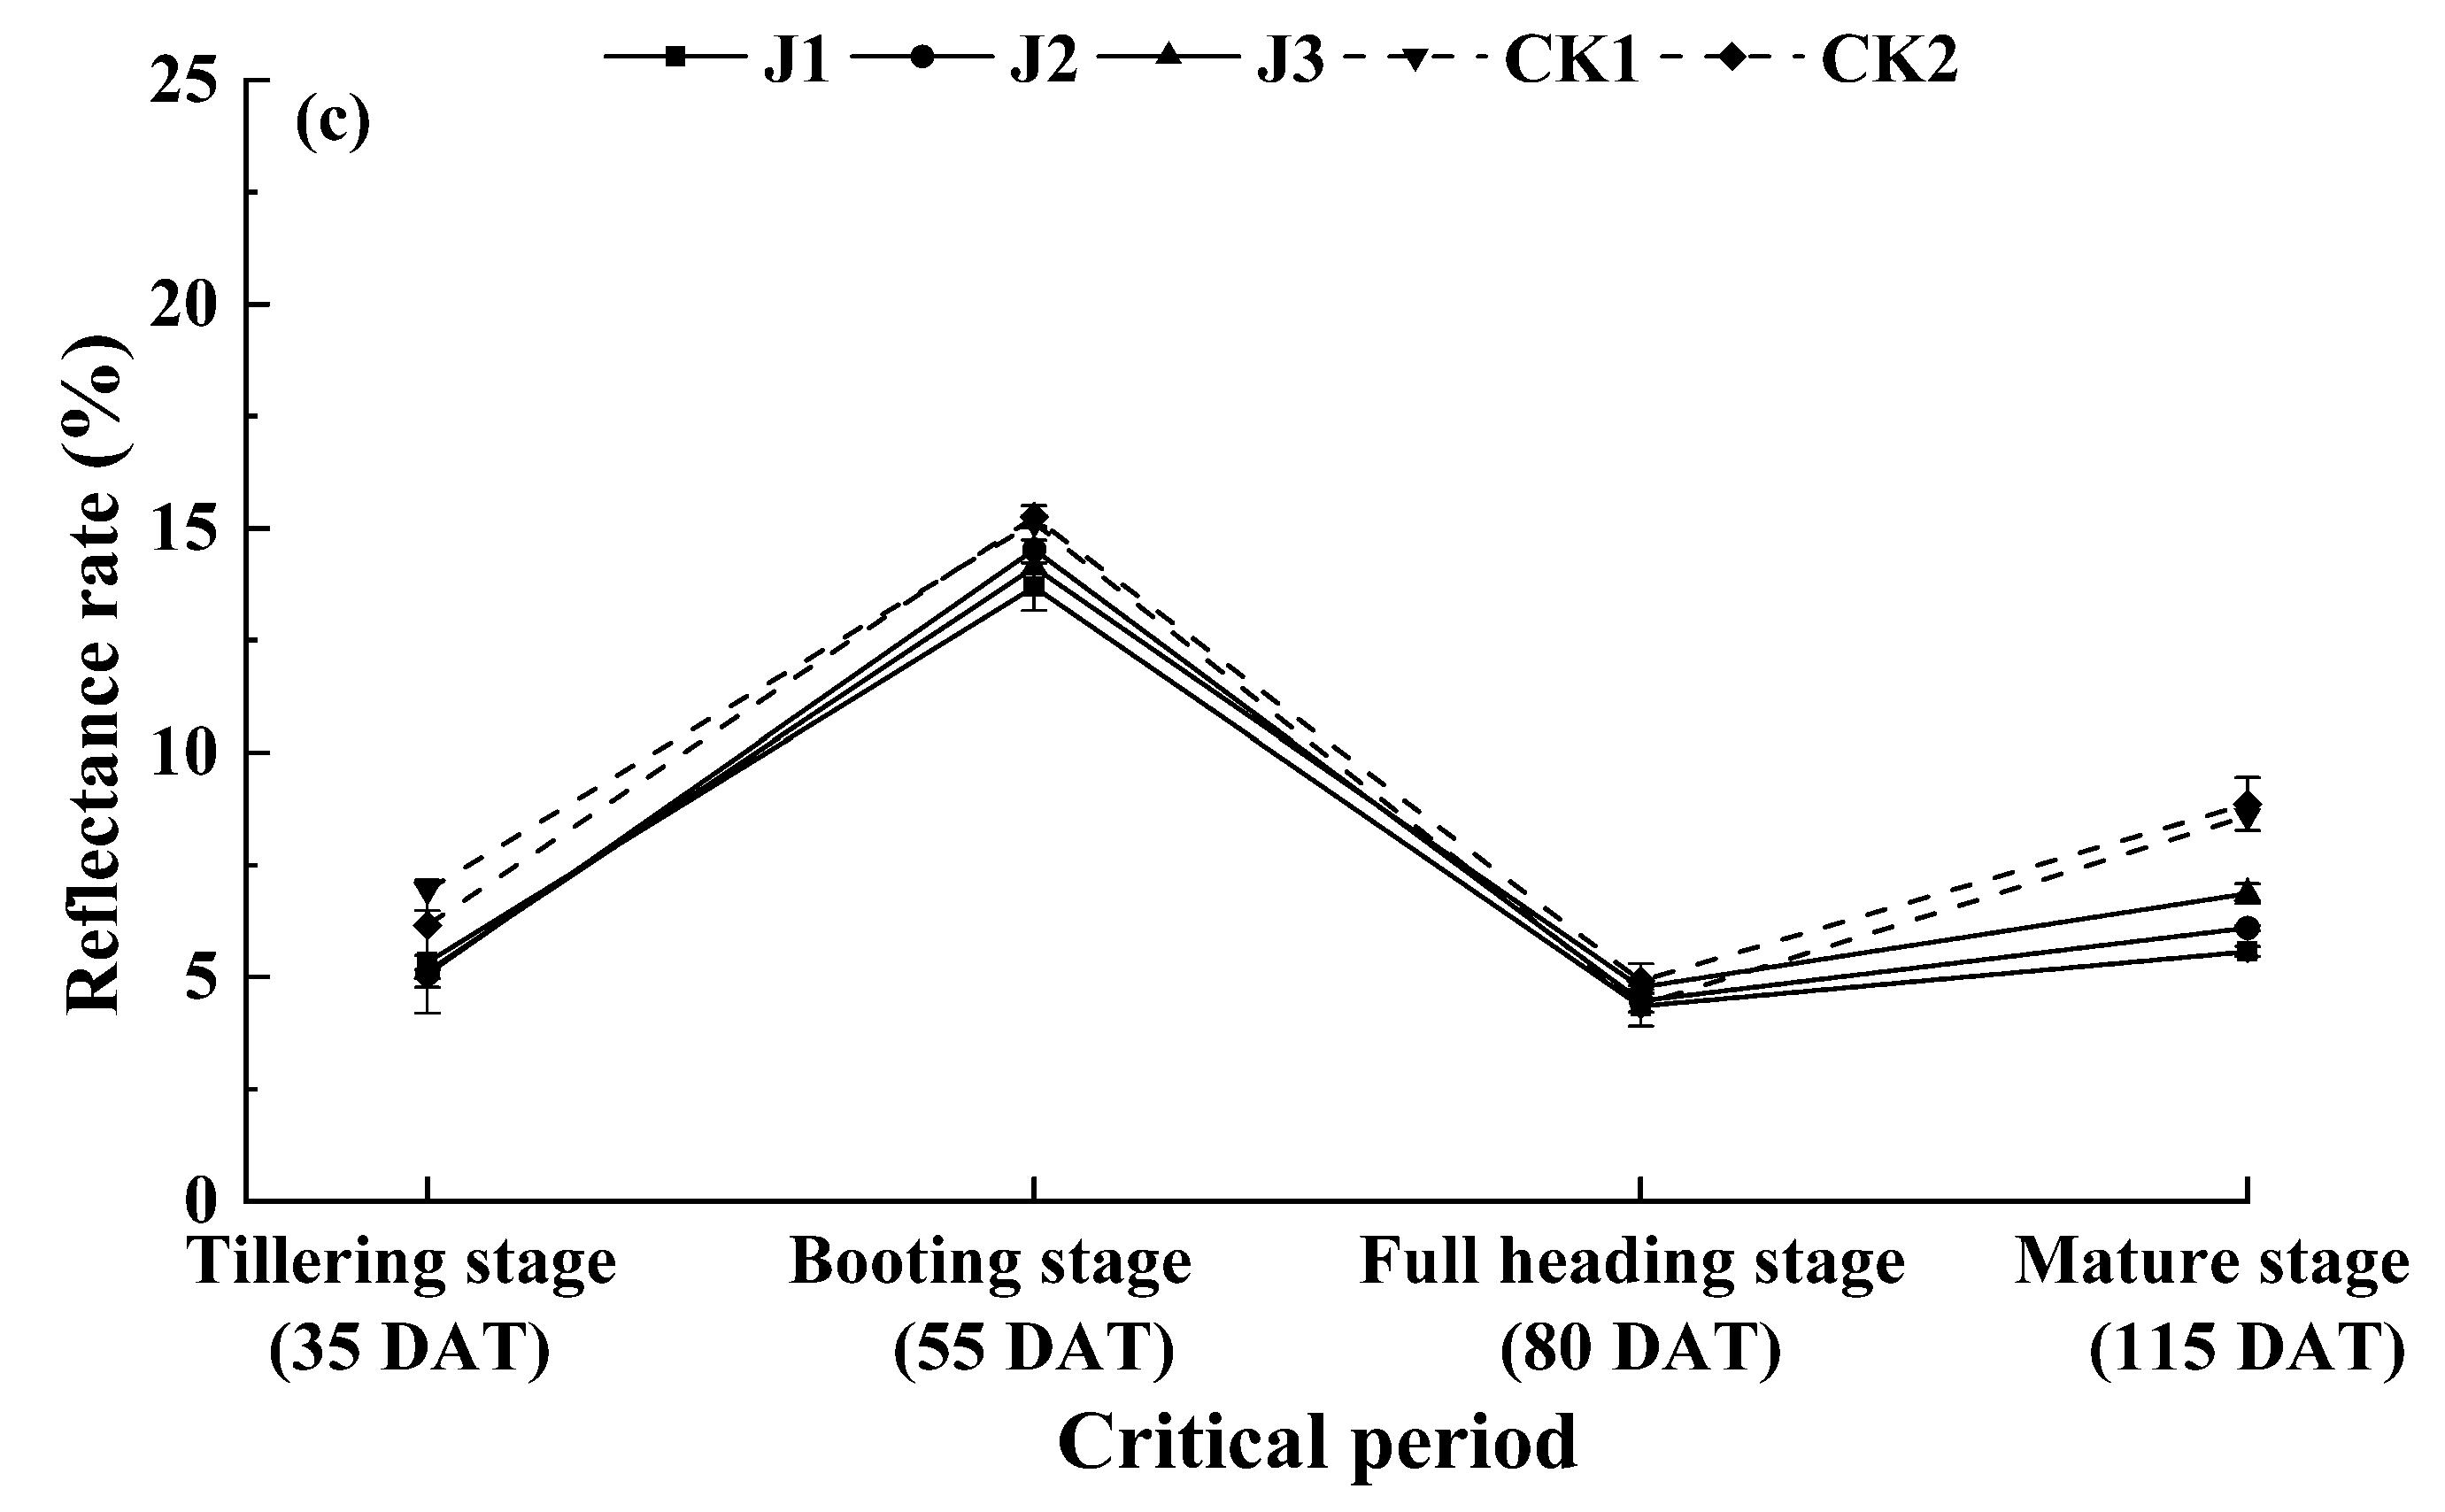
- Re = PARR / PARI
- In = (PARI-PART-PARR) / PARI
3. Results
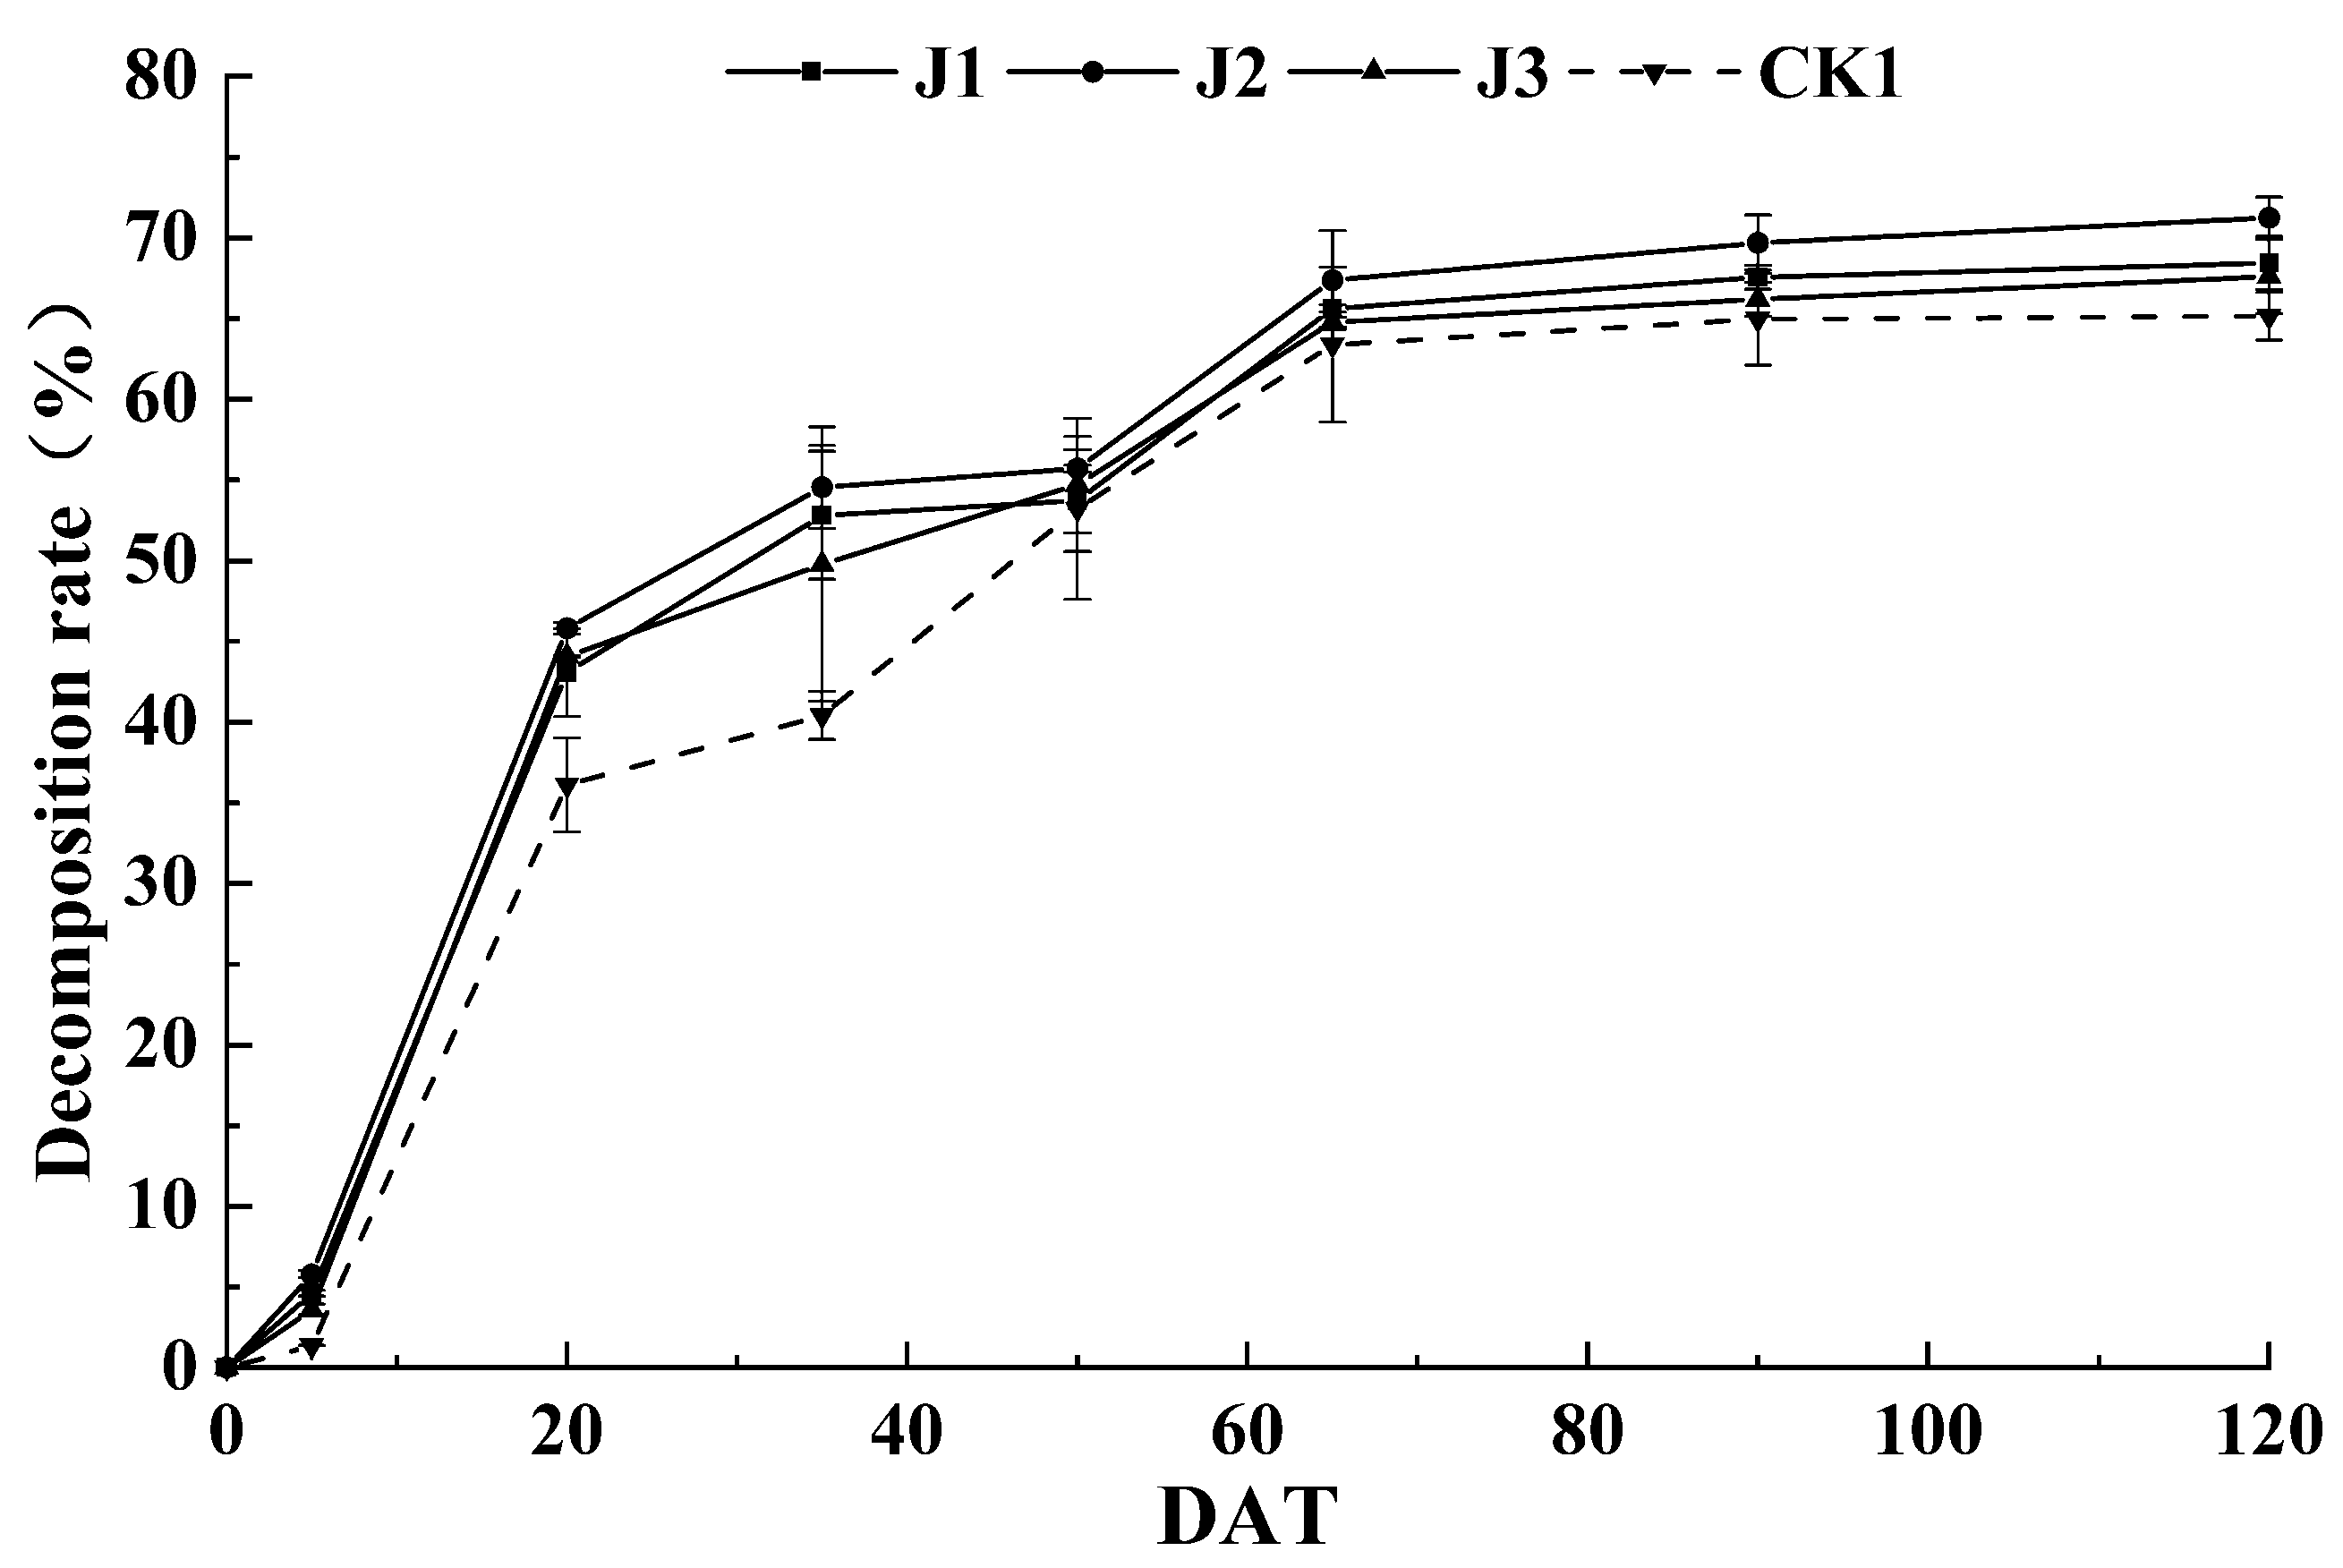
3.1. Effect of the Applied Fertilization Method on Straw Decomposition Rate
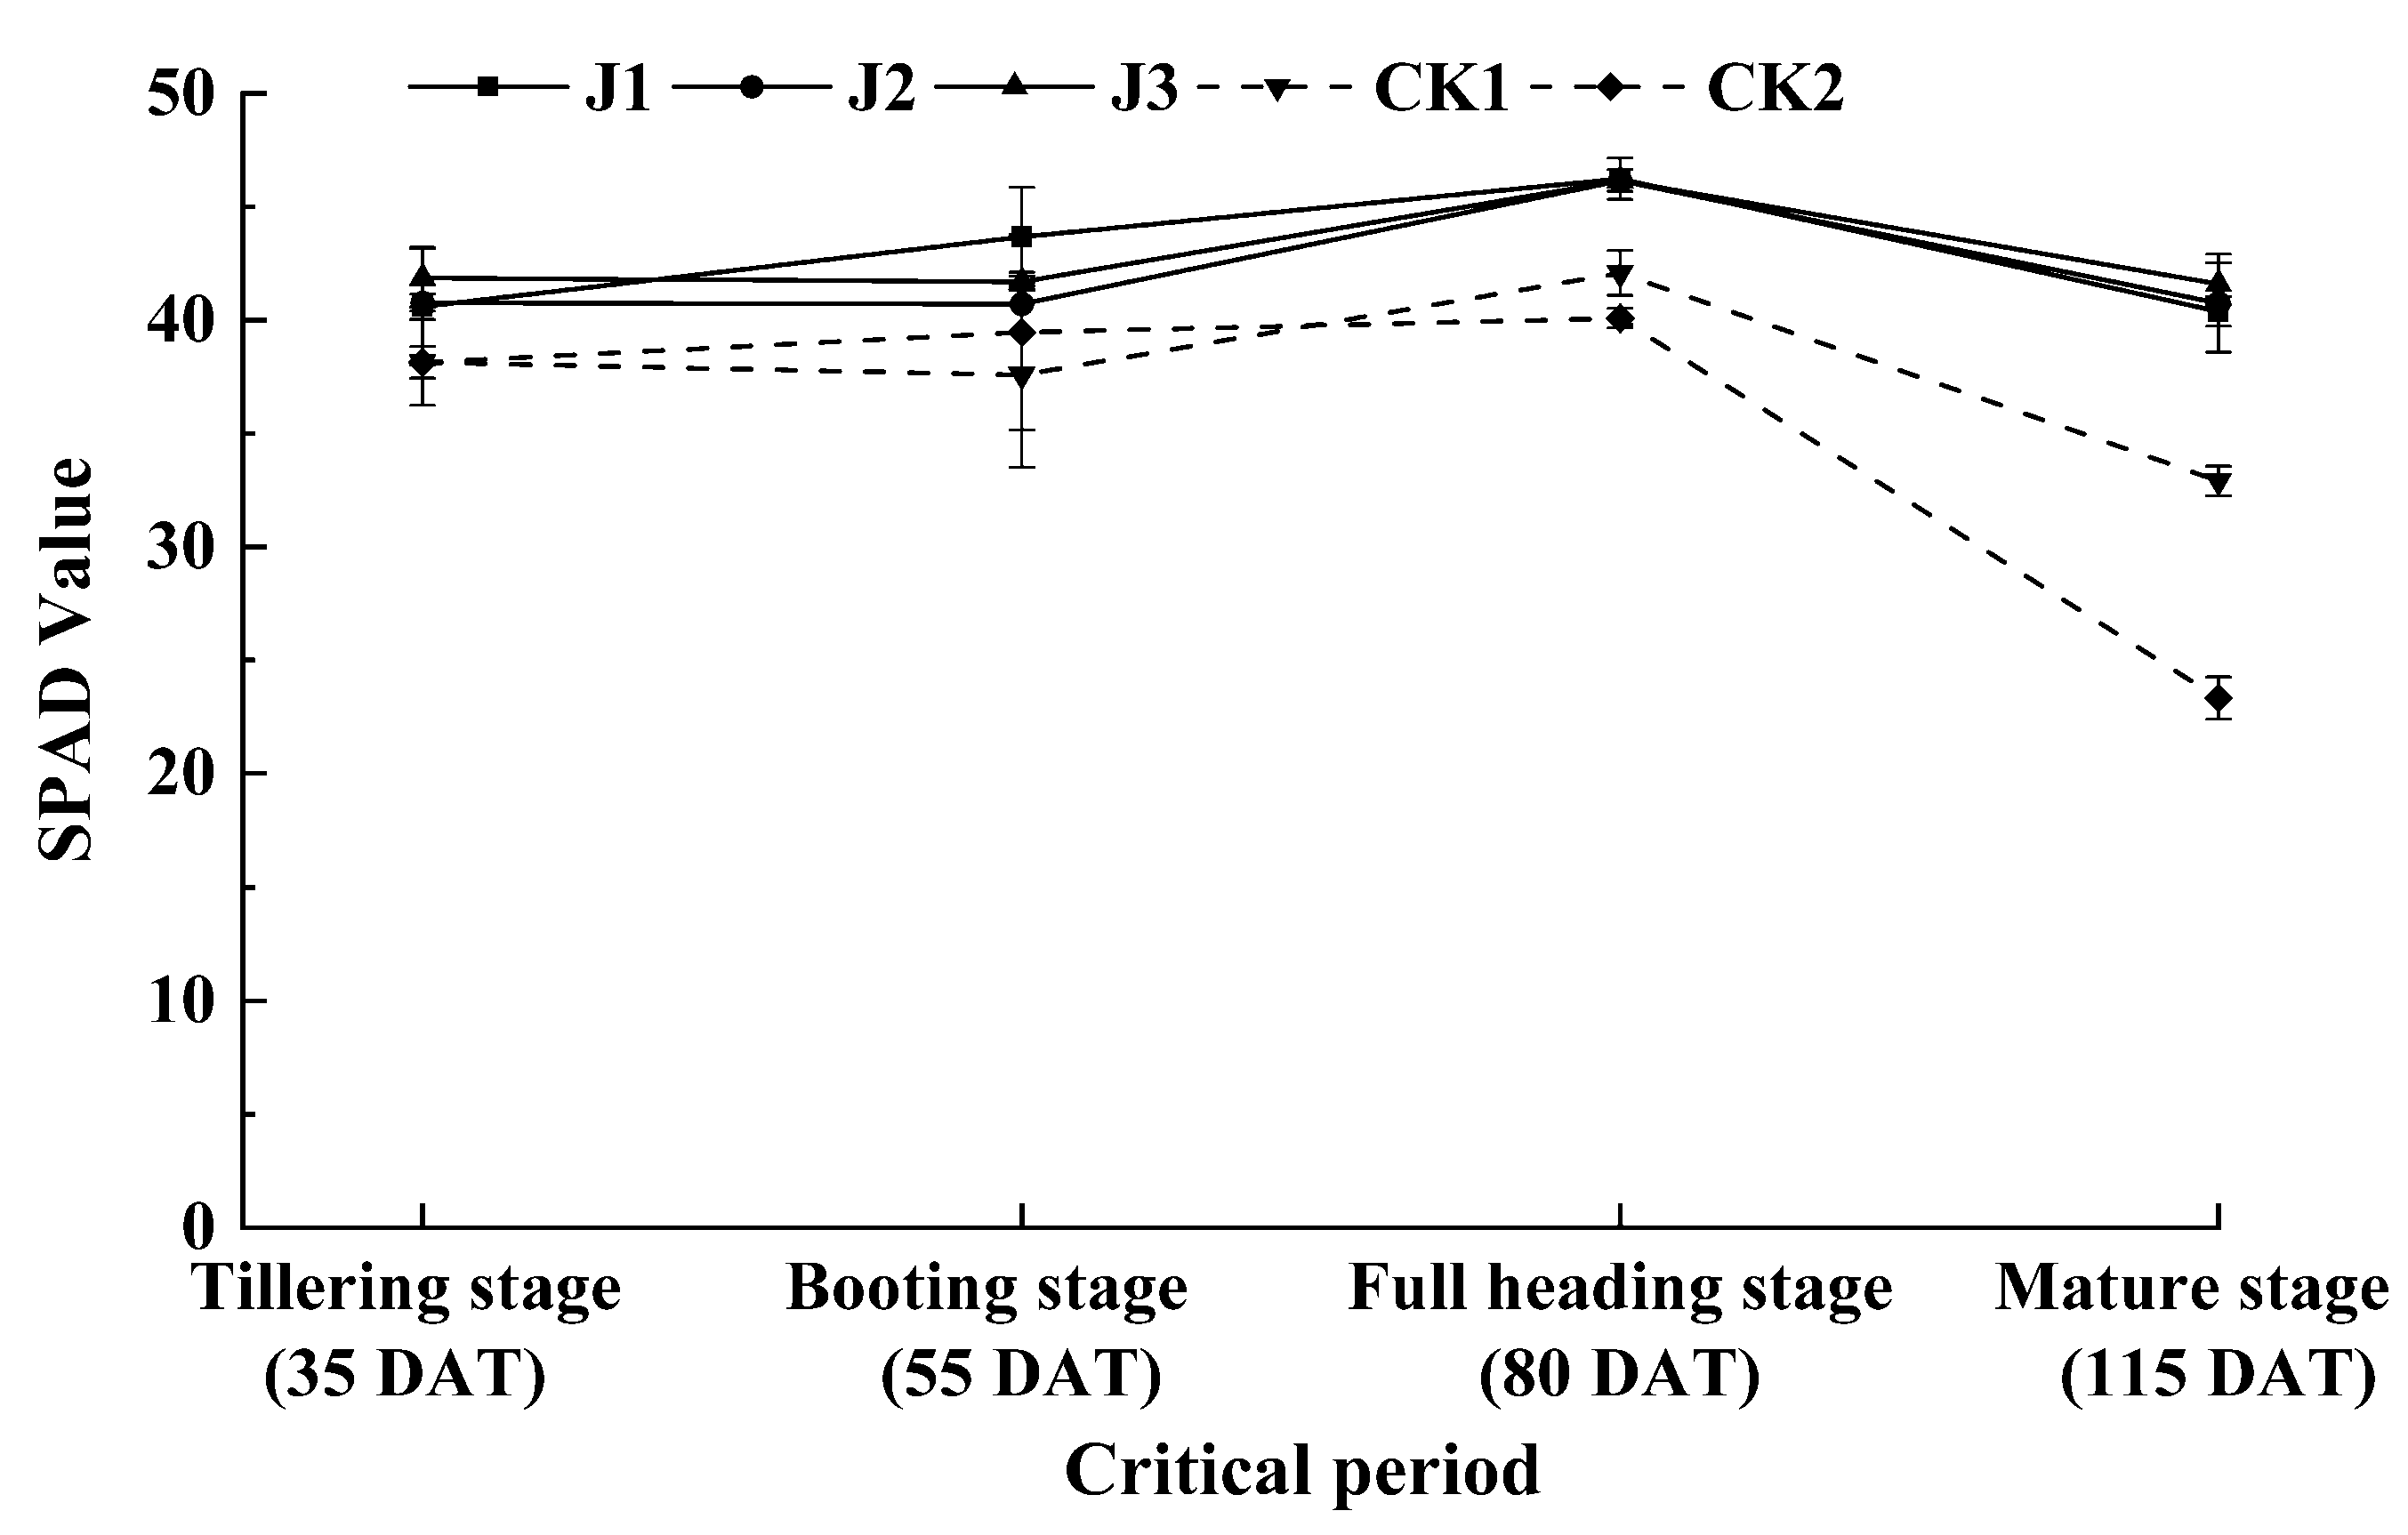
3.2. Effect of the Applied Fertilization Method on the SPAD Value in Rice Crop
3.3. Effect of the Applied Fertilization Method on Canopy PAR Transmission Parameters in Rice Crop
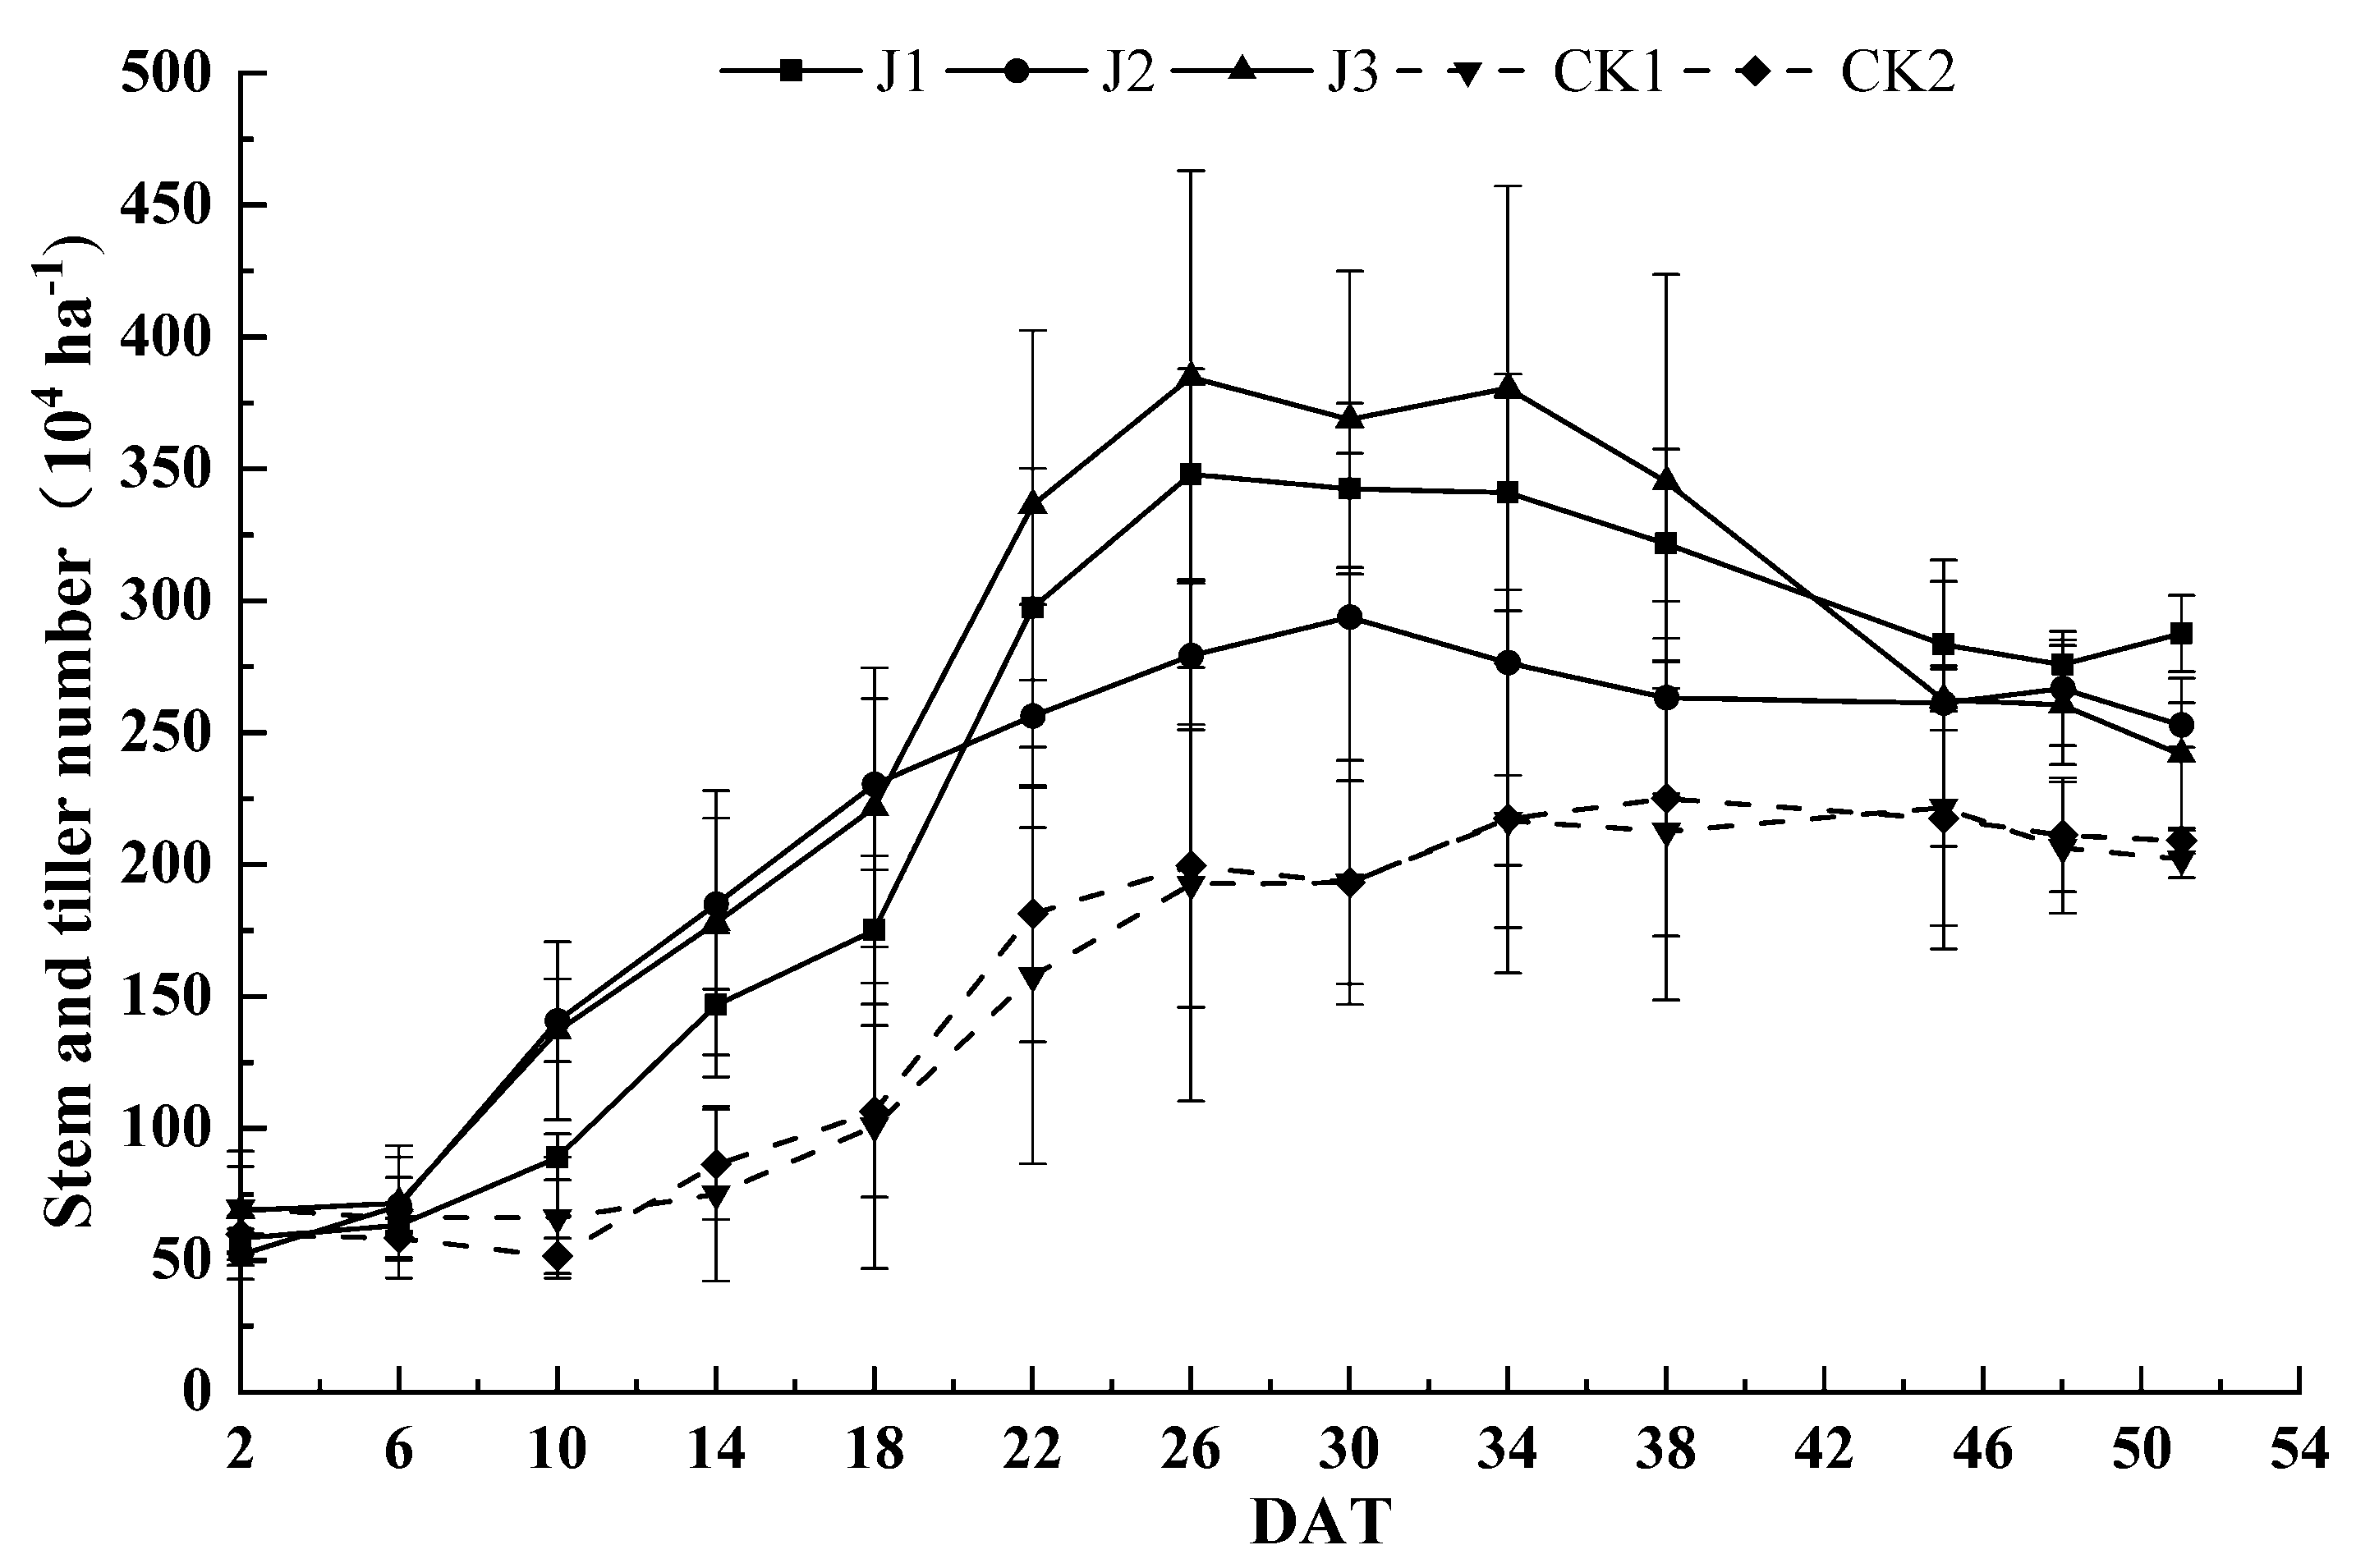
3.4. Effect of the Applied Fertilization Method on Stem and Tiller number in Rice Crop
3.5. Effect of the Applied Fertilization Method on Dry Matter Accumulation in Rice Crop
3.6. Effect of the Applied Fertilization Method on Nitrogen Use Efficiency in Rice Crop
3.7. Effect of the Applied Fertilization Method on Yield and Yield Components in Rice Crop
4. Discussion
5. Conclusions
Author Contributions
Funding
Conflicts of Interest
References
- Lal, R. Soil quality impacts of residue removal for bioethanol production. Soil Tillage Res. 2009, 102, 233–241. [Google Scholar] [CrossRef]
- Blanco-Canqui, H.; Lal, R. Crop residue removal impacts on soil productivity and environmental quality. Crit. Rev. Plant Sci. 2009, 28, 139–163. [Google Scholar] [CrossRef]
- Yan, F.; Sun, Y.; Xu, H.; Yin, Y.; Wang, H.; Guo, C.; Yang, Z.; Sun, Y.; Ma, J. Effects of wheat straw mulch application and nitrogen management on rice root growth, dry matter accumulation and rice quality in soils of different fertility. Paddy Water Environ. 2018, 16, 507–518. [Google Scholar] [CrossRef]
- Sun, R.; Zhang, X.-X.; Guo, X.; Wang, D.; Chu, H. Bacterial diversity in soils subjected to long-term chemical fertilization can be more stably maintained with the addition of livestock manure than wheat straw. Soil Biol. Biochem. 2015, 88, 9–18. [Google Scholar] [CrossRef]
- Tirol-Padre, A.; Tsuchiya, K.; Inubushi, K.; Ladha, J.K. Enhancing soil quality through residue management in a rice-wheat system in Fukuoka, Japan. Soil Sci. Plant. Nutr. 2005, 51, 849–860. [Google Scholar] [CrossRef] [Green Version]
- Wang, W.; Lai, D.Y.F.; Wang, C.; Pan, T.; Zeng, C. Effects ofrice straw incorporation on active soil organic carbon pools in a subtropical paddy field. Soil Till. Res. 2015, 152, 8–16. [Google Scholar] [CrossRef]
- Takakai, F.; Hirano, S.; Harakawa, Y.; Hatakeyama, K.; Yasuda, K.; Sato, T.; Kimura, K.; Kaneta, Y. Fate of fertilizer-derived N applied to enhance rice straw decomposition in a paddy field during the fallow season under cool temperature conditions. Agriculture 2018, 8, 50. [Google Scholar] [CrossRef] [Green Version]
- Wang, J.; Wang, D.; Zhang, G.; Wang, Y.; Wang, C.; Teng, Y.; Christie, P. Nitrogen and phosphorus leaching losses from intensively managed paddy fields with straw retention. Agric. Water Manag. 2014, 141, 66–73. [Google Scholar] [CrossRef]
- Eiland, F.; Klamer, M.; Lind, A.M.; Leth, M.; Bååth, E. Influence of Initial C/N ratio on chemical and microbial composition during long term composting of straw. Microb. Ecol. 2001, 41, 272–280. [Google Scholar] [CrossRef]
- Pan, F.; Yu, W.; Ma, Q.; Zhou, H.; Jiang, C.-H.; Xu, Y.-G.; Ren, J.-F. Influence of 15 N-labeled ammonium sulfate and straw on nitrogen retention and supply in different fertility soils. Biol. Fert. Soils 2017, 53, 303–313. [Google Scholar] [CrossRef]
- Zhao, J.; Ni, T.; Xun, W.; Huang, X.; Huang, Q.; Ran, W.; Shen, B.; Zhang, R.; Shen, Q. Influence of straw incorporation with and without straw decomposer on soil bacterial community structure and function in a rice-wheat cropping system. Appl. Microbiol. Biotechnol. 2017, 101, 1–13. [Google Scholar] [CrossRef] [PubMed]
- Verma, T.S.; Bhagat, R.M. Impact of rice straw management practices on yield, nitrogen uptake and soil properties in a wheat-rice rotation in northern India. Fertil. Res. 1992, 33, 97–106. [Google Scholar] [CrossRef]
- Gentile, R.; Vanlauwe, B.; van Kessel, C.; Six, J. Managing N availability and losses by combining fertilizer-N with different quality residues in Kenya. Agric. Ecosyst. Environ. 2009, 131, 308–314. [Google Scholar] [CrossRef]
- Manzoni, S.; Jackson, R.B.; Trofymow, J.A.; Porporato, A. The global stoichiometry of litter nitrogen mineralization. Science 2008, 321, 684–686. [Google Scholar] [CrossRef]
- Pansu, M.; Thuries, L. Kinetics of C and N mineralization, N immobilization and N volatilization of organic inputs in soil. Soil Biol. Biochem. 2003, 35, 37–48. [Google Scholar] [CrossRef]
- Yanni, S.F.; Whalen, J.K.; Simpson, M.J.; Janzen, H.H. Plant lignin and nitrogen contents control carbon dioxide production and nitrogen mineralization in soils incubated with Bt and non-Bt corn residues. Soil Biol. Biochem. 2011, 43, 63–69. [Google Scholar] [CrossRef]
- Yan, F.; Sun, Y.; Hui, X.; Jiang, M.; Xiang, K.; Wu, Y.; Zhang, Q.; Tang, Y.; Yang, Z.; Sun, Y.; et al. The effect of straw mulch on nitrogen, phosphorus and potassium uptake and use in hybrid rice. Paddy Water Environ. 2019, 17, 23–33. [Google Scholar] [CrossRef]
- Kanal, A. Effect of incorporation depth and soil climate on straw decomposition rate in a loamy Podzoluvisol. Biol. Fertil. Soils 1995, 20, 190–196. [Google Scholar] [CrossRef]
- Cui, T.; Li, Z.; Wang, S. Effects of in-situ straw decomposition on composition of humus and structure of humic acid at different soil depths. J. Soils Sediments 2017, 17, 2391–2399. [Google Scholar] [CrossRef]
- Ghimire, R.; Lamichhane, S.; Acharya, B.S.; Bista, P.; Sainju, U.M. Tillage, crop residue, and nutrient management effects on soil organic carbon in rice-based cropping systems: A review. J. Integr. Agric. 2017, 16, 1–15. [Google Scholar] [CrossRef]
- Rezig, F.A.M.; Elhadi, E.A.; Abdalla, M.R. Decomposition and nutrient release pattern of wheat (Triticum aestivum) residues under different treatments in desert field conditions of Sudan. Int. J. Recycl. Org. Waste Agricult. 2014, 3, 10. [Google Scholar] [CrossRef] [Green Version]
- Wang, Y.; Chang, S.X.; Fang, S.; Tian, Y. Contrasting decomposition rates and nutrient release patterns in mixed vs singular species litter in agroforestry systems. J. Soil Sediment. 2014, 14, 1071–1081. [Google Scholar] [CrossRef]
- Liu, S.; Chen, W.; Nie, X.; Zhang, Z.Y.; Dai, D.Q.; Huo, Z.Y.; Xu, K. Effect of embedding depth on decomposition course of crop residues in rice-wheat system. Plant Nutr. Fertil. Sci. 2007, 13, 1049–1053. [Google Scholar]
- Liu, X.; Wang, H.; Zhou, J.; Hu, F.; Zhu, D.; Chen, Z.; Liu, Y. Effect of N Fertilization Pattern on Rice Yield, N Use Efficiency and Fertilizer–N Fate in the Yangtze River Basin, China. PLoS ONE 2016, 11, e0166002. [Google Scholar] [CrossRef] [PubMed] [Green Version]
- Wang, Y.; Wang, D.; Shi, P.; Omasa, K. Estimating rice chlorophyll content and leaf nitrogen concentration with a digital still color camera under natural light. Plant Methods 2014, 10, 36. [Google Scholar] [CrossRef] [Green Version]
- Huang, J.; Sun, J.; Liao, H.; Liu, X. Detection of brown planthopper infestation based on SPAD and spectral data from rice under different rates of nitrogen fertilizer. Precis. Agric. 2015, 16, 148–163. [Google Scholar] [CrossRef]
- Esfahani, M.; Abbasi, H.R.A.; Rabiei, B.; Kavousi, M. Improvement of nitrogen management in rice paddy fields using chlorophyll meter (SPAD). Paddy Water Environ. 2008, 6, 181–188. [Google Scholar] [CrossRef] [Green Version]
- Kiniry, J.R.; Jones, C.A.; Toole, J.C.O.; Blanchet, R.; Cabelguenne, M.; Spanel, D.A. Radiation use efficiency in biomass accumulation prior to grain filling for five grain crop species. Field Crops Res. 1989, 20, 51–64. [Google Scholar] [CrossRef]
- Medlyn, B. Physiological basis of the light use fficiency model. Treephysiology 1998, 18, 167–176. [Google Scholar]
- Connor, D.J.; Fereres, E. Adynamic model of crop growth and partitioning of biomass. Field Crops Res. 1999, 63, 139–157. [Google Scholar] [CrossRef]
- Kiniry, J.R.; M cCauley, G.; Yun, X.; Arnold, J.G. Rice parameters describing crop perfo rmance of four U S Cultivars. Agron. J. 2001, 93, 1354–1361. [Google Scholar] [CrossRef] [Green Version]


| Treatment | 5 Days before Transplantation (N Application Ratio) | During Transplanting (N Application Ratio) | Tillering Stage (N Application Ratio) | Panicle Initiation Stage (N Application Ratio) | Total Nitrogen Application (kg hm−2) |
|---|---|---|---|---|---|
| J1 | 0 | 50%, Compound fertilizer | 30%, Urea | 20%, Urea | 195 |
| J2 | 25%, Ammonium carbonate | 25%, Compound fertilizer | 30%, Urea | 20%, Urea | 195 |
| J3 | 25%, Compound fertilizer | 25%, Compound fertilizer | 30%, Urea | 20%, Urea | 195 |
| CK1 | Full straw return without fertilizer | ||||
| CK2 | No straw return without fertilizer | ||||
| Treatment | Dry Matter Accumulation in Each Growth Stage (t ha−1) | Dry Matter Accumulation of Each Stage (t ha−1) | |||||
|---|---|---|---|---|---|---|---|
| Tillering Stage | Booting Stage | Full Heading Stage | Mature Stage | Tillering-Booting | Booting-Full Heading | Full Heading-Mature | |
| J1 | 1.75 ± 0.38 b | 4.42 ± 0.80 ab | 13.79 ± 0.31 a | 20.63 ± 1.17 b | 2.67 ± 0.46 ab | 9.37 ± 0.58 a | 6.84 ± 0.88 b |
| J2 | 2.23 ± 0.26 a | 3.26 ± 0.26 b | 12.37 ± 0.68 b | 19.61 ± 0.34 c | 1.03 ± 0.12 c | 9.10 ± 0.42 a | 7.25 ± 0.34 b |
| J3 | 1.91 ± 0.12 b | 5.19 ± 1.39 a | 14.13 ± 0.30 a | 22.61 ± 0.42 a | 3.28 ± 1.27 a | 8.94 ± 1.11 a | 8.49 ± 0.12 a |
| CK1 | 0.62 ± 0.23 c | 3.22 ± 0.77 b | 9.26 ± 0.26 c | 13.59 ± 0.53 d | 2.60 ± 0.68 ab | 6.05 ± 0.75 b | 4.32 ± 0.34 c |
| CK2 | 0.85 ± 0.07 c | 2.98 ± 0.81 b | 9.57 ± 0.08 c | 14.34 ± 0.43 d | 2.13 ± 0.75 bc | 6.59 ± 0.74 b | 4.77 ± 0.35 c |
| Treatment | Total N (kg ha−1) | ANUE (%) | AE (kg kg−1) | PNUE (kg kg−1) | PFP (kg kg−1) |
|---|---|---|---|---|---|
| J1 | 195.81 ± 5.55 ab | 44.49 ± 4.09 ab | 19.24 ± 3.15 a | 43.93 ± 11.18 a | 58.12 ± 2.10 a |
| J2 | 187.80 ± 2.14 b | 40.38 ± 3.32 b | 11.52 ± 1.81 b | 28.92 ± 7.12 b | 50.40 ± 0.90 b |
| J3 | 203.41 ± 8.54 a | 48.39 ± 2.67 a | 17.36 ± 0.99 a | 35.94 ± 2.31 ab | 56.24 ± 0.40 a |
| CK1 | 109.05 ± 5.61 c | / | / | / | / |
| CK2 | 117.28 ± 6.27 c | / | / | / | / |
| Treatment | Panicle (104 ha−1) | Spikelet Per Panicle | Filled-Grain Percentage (%) | 1000-Grain Weight (g) | Actual Yield (kg ha−1) | |
|---|---|---|---|---|---|---|
| 2018 Year | 2017 Year | |||||
| J1 | 263.66 ± 15.41 a | 197.60 ± 1.54 a | 82.65 ± 0.46 a | 29.21 ± 0.12 a | 11,332.91 ± 408.79 a | 11,048.46 ± 375.94 a |
| J2 | 234.26 ± 14.27 b | 198.67 ± 0.38 a | 78.98 ± 0.18 b | 28.82 ± 0.09 ab | 9827.76 ± 174.93 b | 9598.16 ± 243.71 b |
| J3 | 230.56 ± 13.30 b | 198.09 ± 13.50 a | 84.11 ± 1.30 a | 28.79 ± 0.16 ab | 10,966.92 ± 77.81 a | 11,016.03 ± 139.01 a |
| CK1 | 190.74 ± 15.47 c | 179.73 ± 5.37 b | 78.75 ± 2.71 b | 28.64 ± 0.24 bc | 7580.80 ± 221.63 d | 7927.13 ± 132.24 d |
| CK2 | 208.10 ± 3.13 c | 195.83 ± 7.33 a | 76.64 ± 2.03 b | 28.34 ± 0.35 c | 8658.96 ± 163.43 c | 8748.14 ± 201.36 c |
© 2020 by the authors. Licensee MDPI, Basel, Switzerland. This article is an open access article distributed under the terms and conditions of the Creative Commons Attribution (CC BY) license (http://creativecommons.org/licenses/by/4.0/).
Share and Cite
Tang, J.; Zhang, R.; Li, H.; Zhang, J.; Chen, S.; Lu, B. Effect of the Applied Fertilization Method under Full Straw Return on the Growth of Mechanically Transplanted Rice. Plants 2020, 9, 399. https://doi.org/10.3390/plants9030399
Tang J, Zhang R, Li H, Zhang J, Chen S, Lu B. Effect of the Applied Fertilization Method under Full Straw Return on the Growth of Mechanically Transplanted Rice. Plants. 2020; 9(3):399. https://doi.org/10.3390/plants9030399
Chicago/Turabian StyleTang, Jichao, Ruoyu Zhang, Hechao Li, Jun Zhang, Shaoqiang Chen, and Bilin Lu. 2020. "Effect of the Applied Fertilization Method under Full Straw Return on the Growth of Mechanically Transplanted Rice" Plants 9, no. 3: 399. https://doi.org/10.3390/plants9030399