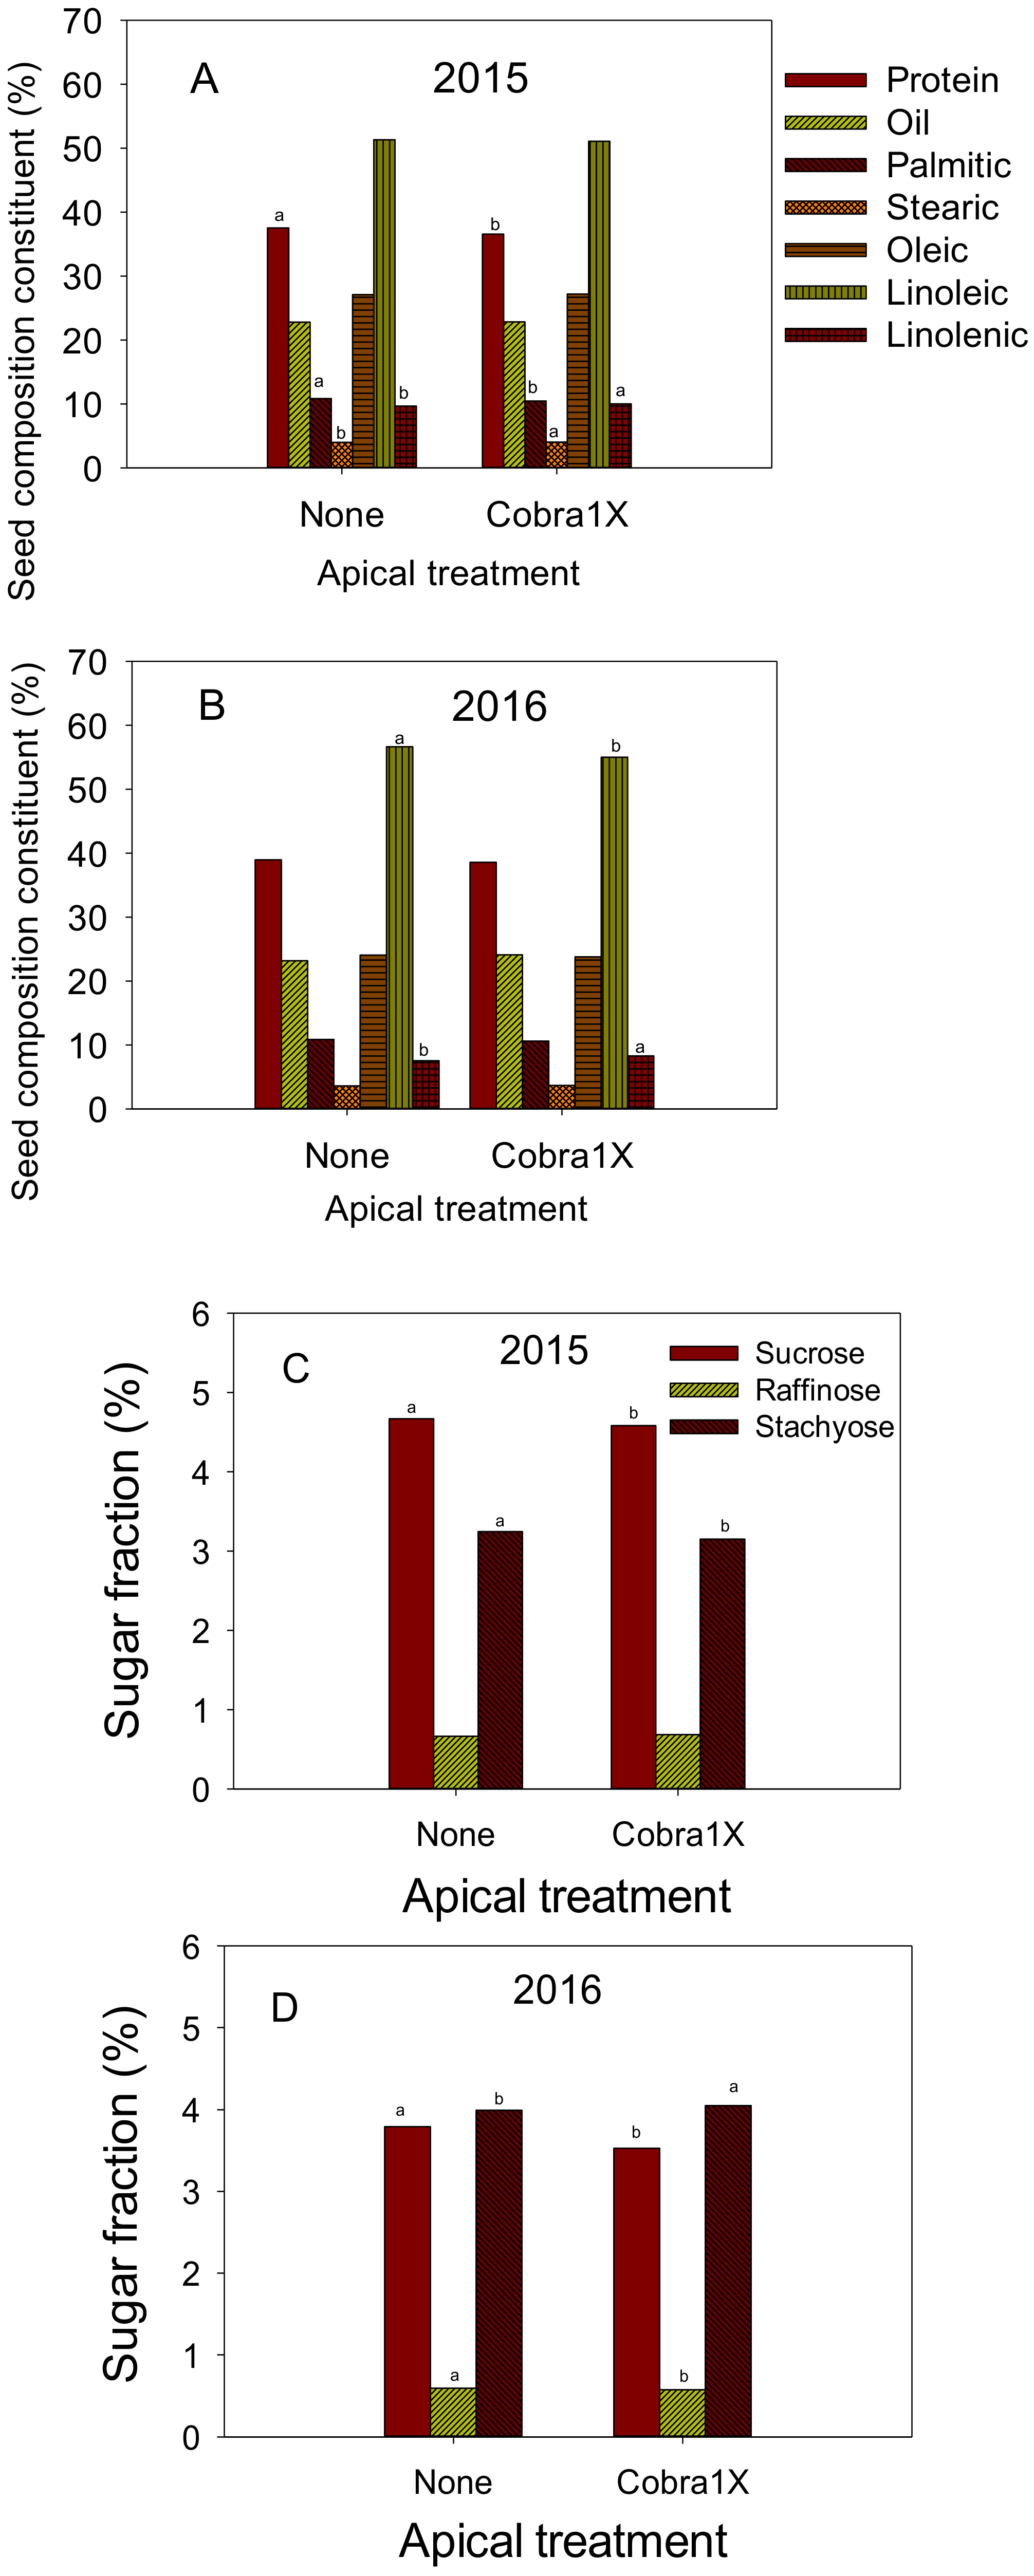
Figure 1.
Effect of apical treatment of Cobra1X (rate of 12 oz/ac = 0.88 L ha−1) on seed protein, oil, and fatty acids palmitic, stearic, oleic, linoleic, and linolenic (%) in 2015 (A) and 2016 (B); Effect of apical treatment of Cobra1X (rate of 12 oz/ac = 0.88 L ha−1) on seed sugars (sucrose, raffinose, and stachyose) (%) in 2015 (C) and 2016 (D). Bars with the same colors and patterns with different letters are significantly different at P = 0.05. Bars without letters are not significant.
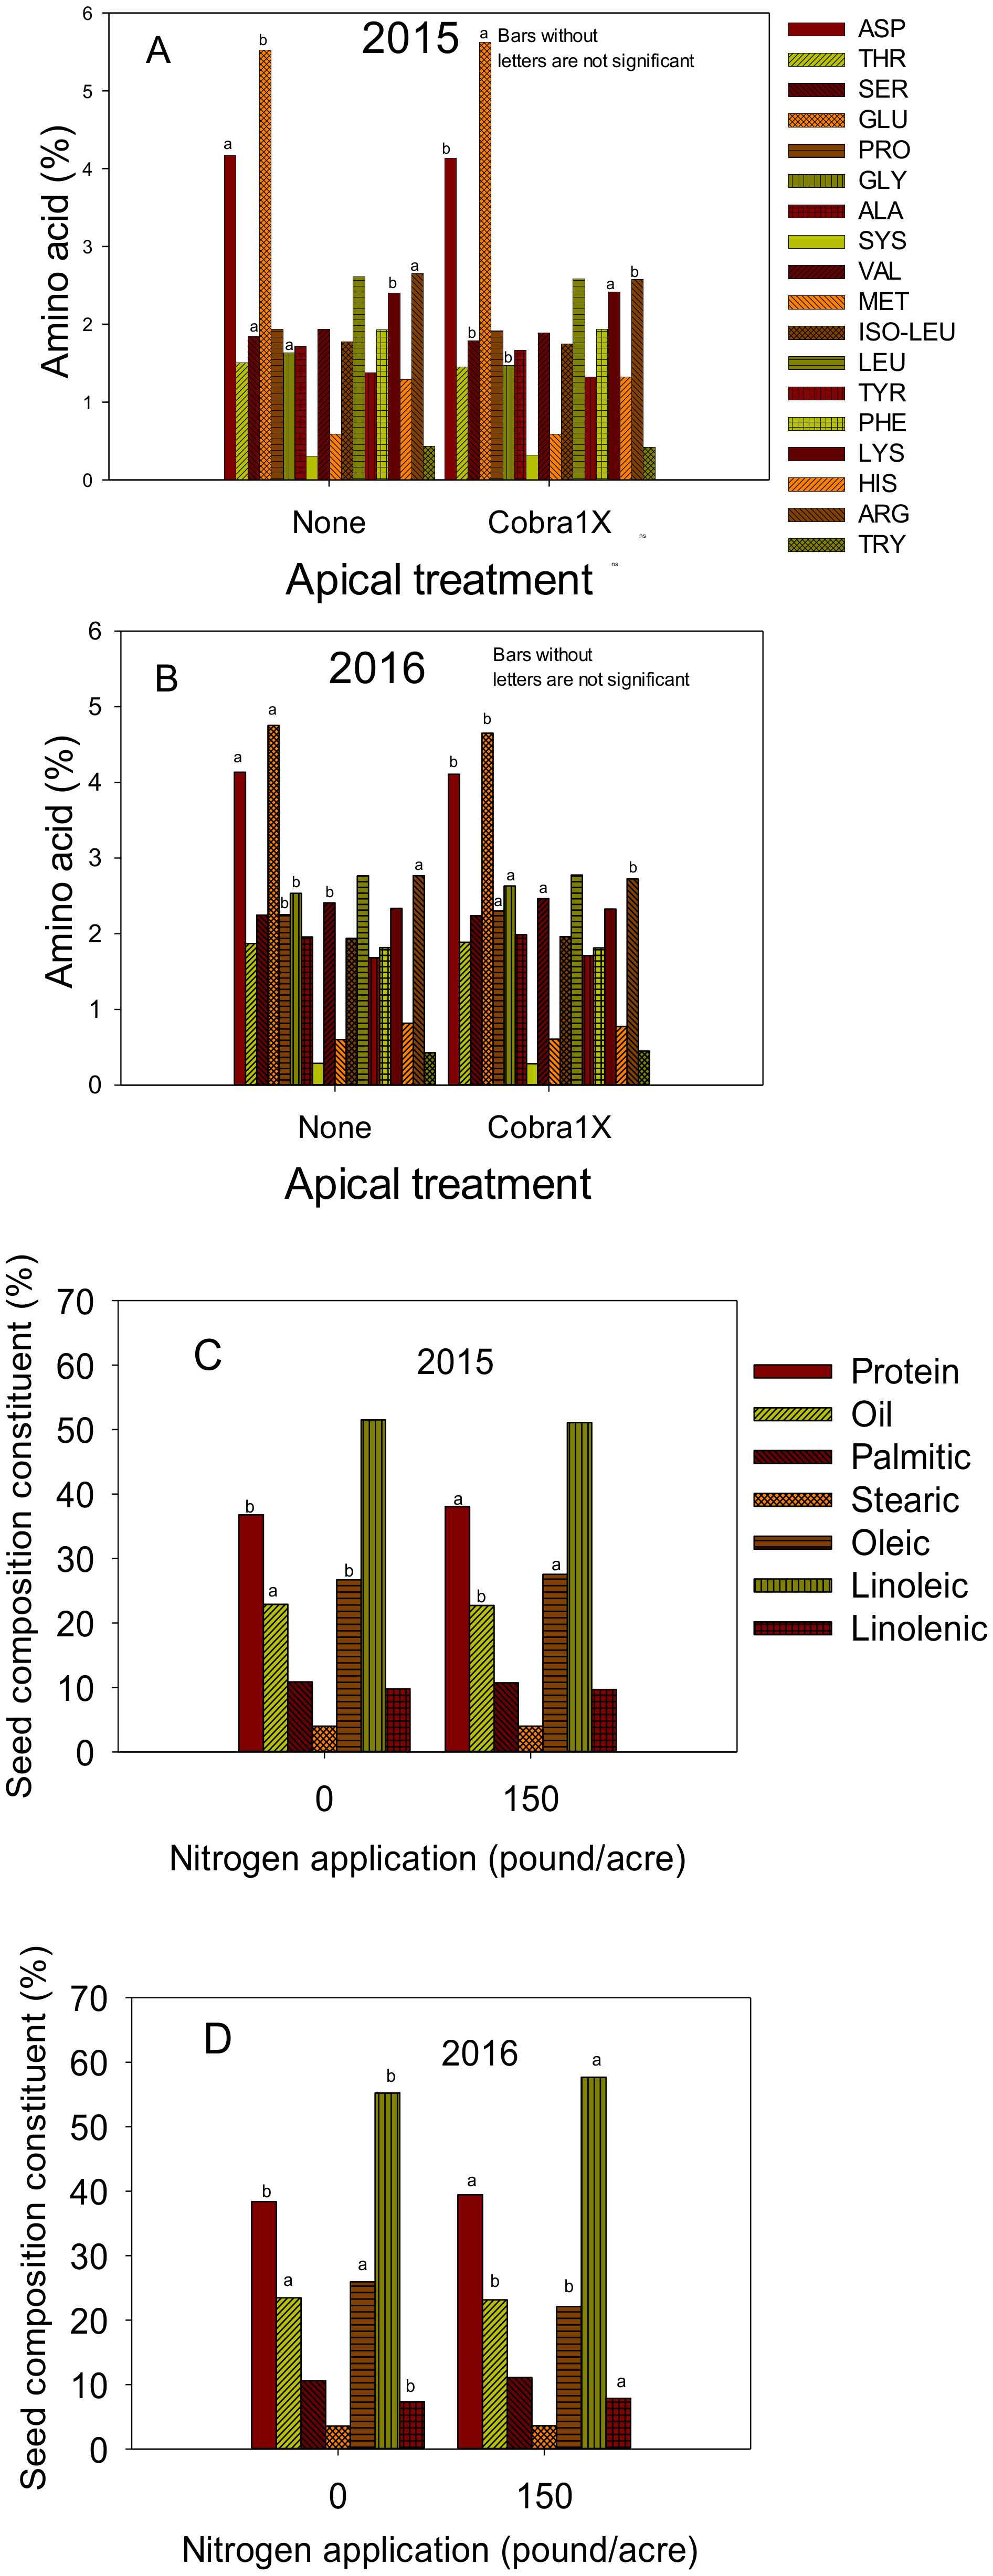
Figure 2.
Effect of apical treatment of Cobra1X (rate of 12 oz/ac = 0.88 L ha−1) on seed amino acids (%) in 2015 (A) and 2016 (B); Effect of nitrogen (N) application at rate of 0 or 150 lbs N ac−1 (0 or 168 kg ha−1) on seed protein, oil, and fatty acids palmitic, stearic, oleic, linoleic, and linolenic (%) in 2015 (C) and 2016 (D). Bars with the same colors and patterns with different letters are significantly different at P ≤ 0.05. Bars without letters are not significant.
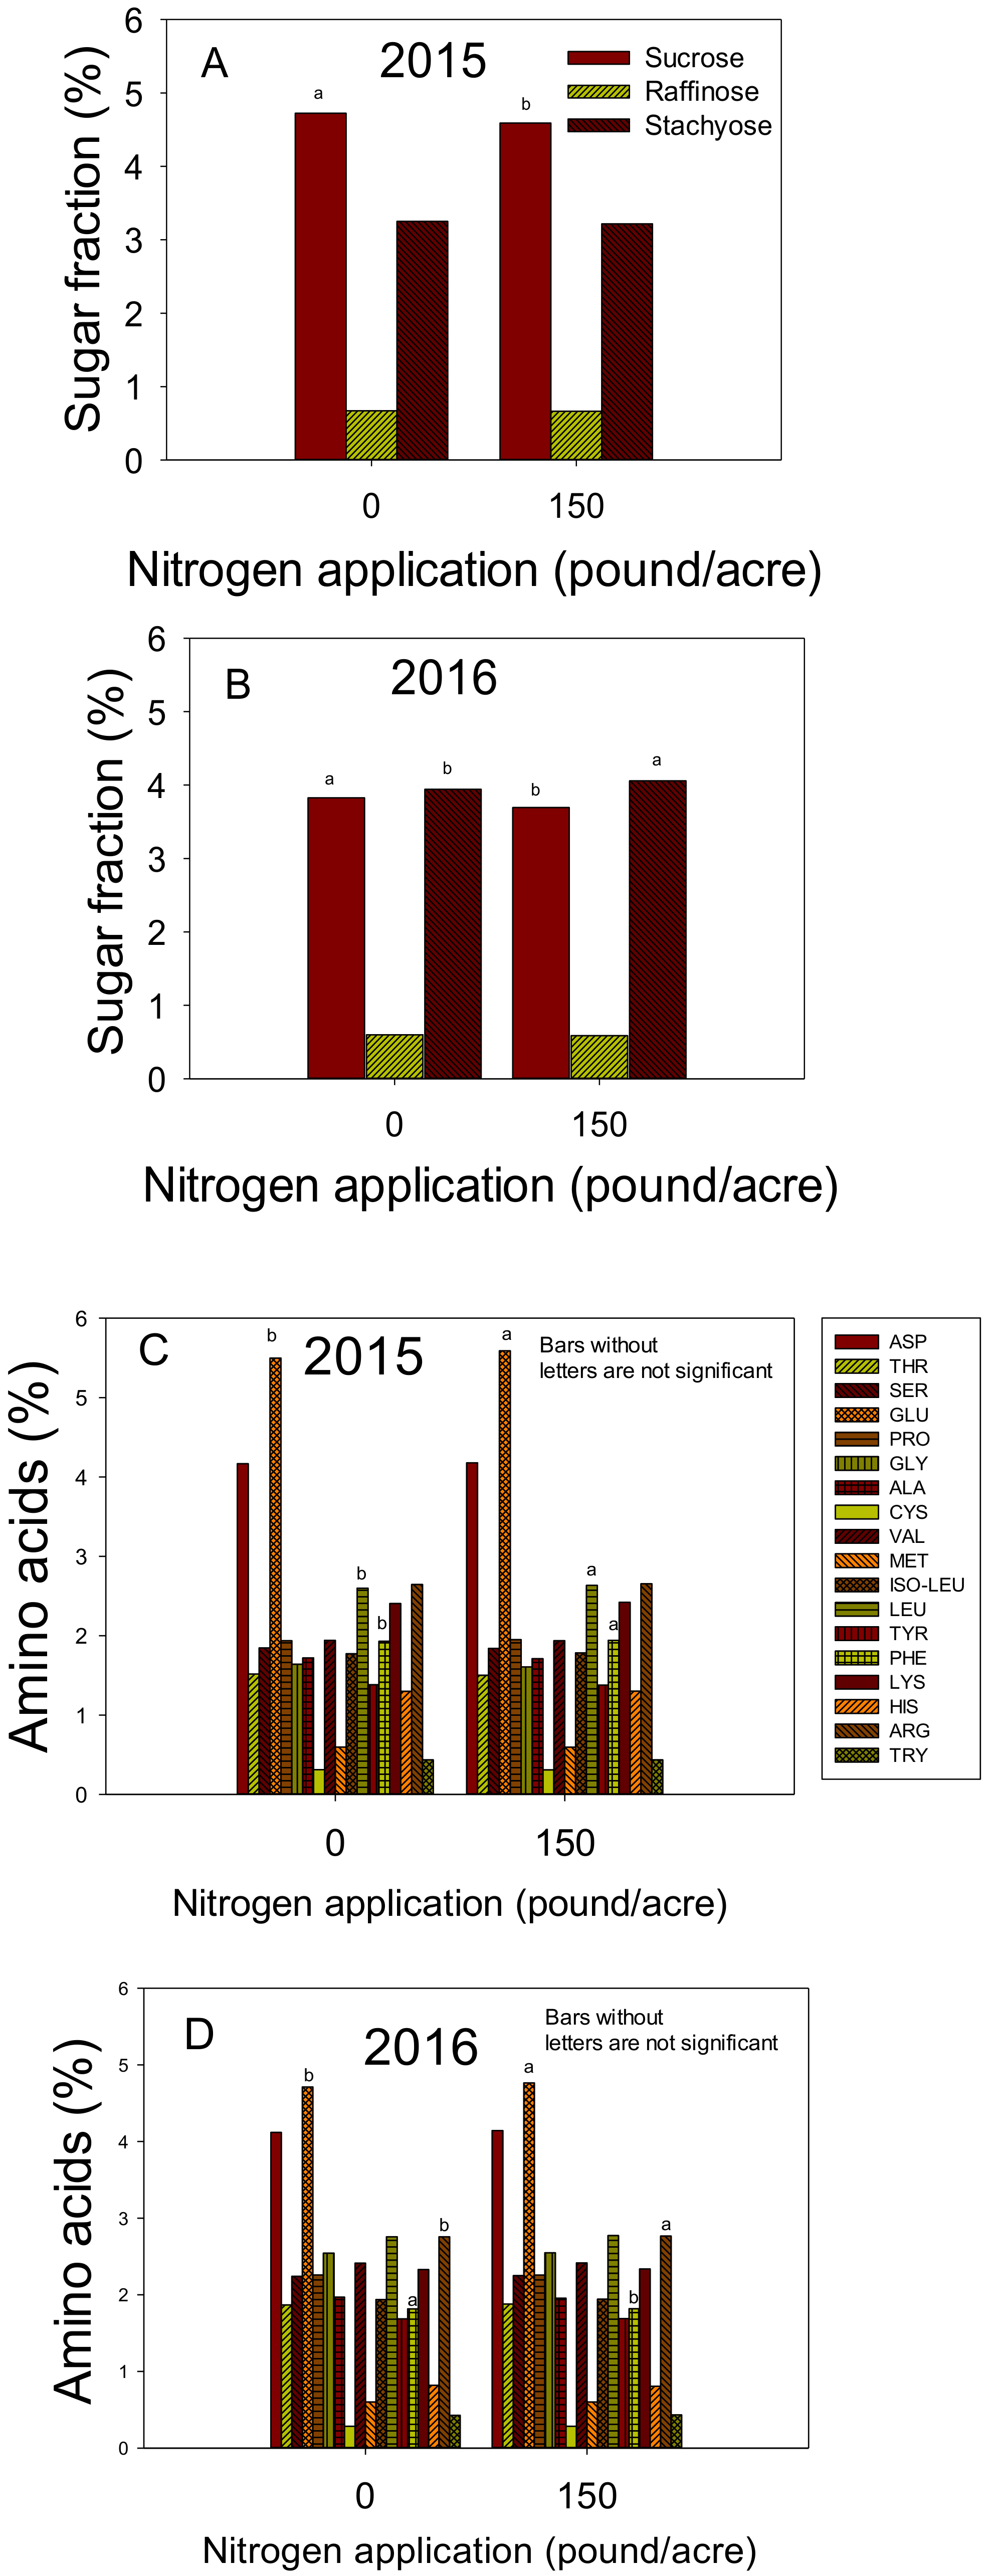
Figure 3.
Effect of nitrogen (N) application at a rate of 0 or 150 lbs N ac−1 (0 or 168 kg ha−1) on seed sugars (sucrose, raffinose, and stachyose) (%) in 2015 (A) and 2016 (B); Effect of nitrogen (N) application at a rate of 0 or 150 lbs N ac−1 (0 or 168 kg ha−1) on seed amino acids (%) in 2015 (C) and 2016 (D). Bars with the same colors and patterns with different letters are significantly different at P ≤ 0.05. Bars without letters are not significant.
Table 1.
Analysis of variance (P values) for the effect of main effects of year (Y), cultivar (Cv), row spacing (RS), seeding rate (S), nitrogen rate (N), apical application (T), and their interactions on seed composition (protein, oil, palmitic (C16:0), stearic (C18:0), oleic (C18:1), linoleic (C18:2), and linolenic (C18:3 acids) (%). The experiments were conducted in 2015 and 2016.
| | Protein | Oil | C16:0 | C18:0 | C18:1 | C18:2 | C18:3 |
|---|
| Effect | Pe | P | P | P | P | P | P |
|---|
| Year (Y) | *** | * | ns | *** | *** | *** | *** |
| Cultivar (Cv) | *** | *** | * | ns | *** | ns | ns |
| Row spacing (RS) | * | * | ns | ns | *** | *** | ns |
| Seeding rate (S) | nsf | ns | ns | ns | * | ns | ns |
| N rate (N) | *** | ns | ns | ns | *** | *** | ns |
| Apical application (T) | ns | ns | ns | ns | ns | ns | ns |
| Y*Cv | ns | ** | ns | ns | ns | * | ns |
| Y* RS | ns | ns | ns | ns | *** | ns | ns |
| Y*S | ns | ns | ns | ns | ns | *** | ns |
| Y*N | ns | ns | ns | ns | *** | *** | ns |
| Y*T | * | ns | ns | ns | ns | *** | ns |
| Cv * RS | * | ns | ns | ns | *** | ns | ns |
| Cv * S | ns | ns | ns | ns | ns | ns | ns |
| Cv * N | *** | *** | ns | ns | ns | ns | ns |
| RS * S | ns | ns | ns | ns | * | ns | ns |
| RS * N | ** | ns | ns | ns | ns | *** | ns |
| S * N | * | ns | ns | ns | ns | ns | ns |
| S * T | * | ns | ns | ns | *** | ns | ns |
| N * T | * | ns | * | ns | *** | * | * |
| Y*Cv*RS*N*T | * | ns | ns | ns | *** | ** | ns |
| Residual | 0.90 | 0.83 | 1.9 | 0.10 | 5.27 | 3.86 | 2.70 |
Table 2.
Analysis of variance (P values) for the effect of main effects of year (Y), cultivar (Cv), row spacing (RS), seeding rate (S), nitrogen rate (N), apical application (T), and their interactions on seed sugars (sucrose, raffinose, stachyose (%), and amino acids aspartic acid (ASP), threonine (THR), serine (SER), and glutamic (GLU) (%). The experiments were conducted in 2015 and 2016.
| | Sucrose | Raffinose | Stachyose | ASP | THR | SER | GLU |
|---|
| Effect | P e | P | P | P | P | P | P |
|---|
| Year (Y) | *** | *** | *** | 0.03 | *** | *** | *** |
| Cultivar (Cv) | *** | *** | ns | *** | ns | ns | ns |
| Row spacing (RS) | nsf | ns | ns | *** | ns | ns | * |
| Seeding rate (S) | ns | ns | ns | ns | ns | ns | ns |
| N rate (N) | ns | ns | ns | ns | ns | ns | ns |
| Apical application (T) | ns | ns | ns | ns | ns | ns | ns |
| Y*Cv | *** | ns | ns | ns | ns | ns | * |
| Y* RS | ns | * | ns | ns | ns | ns | ns |
| Y*S | ns | ns | ns | ns | * | ns | * |
| Y*N | ns | ns | ns | ns | ns | ns | ns |
| Y*T | ns | ns | ** | ns | ** | ns | ns |
| Cv * RS | ns | ns | ns | ns | *** | *** | * |
| Cv * S | ns | ns | ns | ns | ns | ns | ns |
| Cv * N | ns | ns | ns | * | ns | ns | ns |
| RS * S | ns | ns | ns | ns | ns | ns | ns |
| RS * N | ns | ns | ns | ns | ns | ns | ns |
| S * N | ns | ns | ns | ns | ns | ns | ns |
| S * T | ns | ns | ns | ns | ns | ns | ns |
| N * T | ns | ns | ns | ns | ns | ns | ns |
| Y*Cv*RS*N*T | ns | ** | ns | ns | ** | ns | ns |
| Residual | 0.1142 | 0.0017 | 0.07 | 0.0061 | 0.004 | 0.0130 | 0.0994 |
Table 3.
Analysis of variance (P values) for the effect of main effects of year (Y), cultivar (Cv), row spacing (RS), seeding rate (S), nitrogen rate (N), apical application (T), and their interactions on seed amino acids proline (PRO), glycine (GLY), alanine (ALA), cystine (CYS), valine (VAL), methionine (MET), and iso-leucine (ISO) (%). The experiments were conducted in 2015 and 2016.
| | PRO | GLY | ALA | CYS | VAL | MET | ISO |
|---|
| Effect | P e | P | P | P | P | P | P |
|---|
| Year (Y) | *** | *** | *** | * | *** | * | *** |
| Cultivar (Cv) | * | ns | ns | ns | ns | ns | ns |
| Row spacing (RS) | nsf | ns | ns | ns | ns | ns | * |
| Seeding rate (S) | ns | ns | ns | ns | ns | ns | ns |
| N rate (N) | ns | ns | ns | ns | ns | ns | ns |
| Apical application (T) | ns | ns | ns | ns | ns | ns | ns |
| Y*Cv | ns | ns | ns | ns | ns | ns | *** |
| Y* RS | ns | ns | ns | ns | ns | ns | * |
| Y*S | ns | ns | ns | ns | ns | ns | ns |
| Y*N | ns | ns | ns | ns | ns | ns | ns |
| Y*T | * | *** | *** | ns | * | ns | ns |
| Cv * RS | *** | *** | * | ns | *** | ns | *** |
| Cv * S | ns | ns | ns | ns | ns | ns | ns |
| Cv * N | ns | ns | ns | ns | ns | ns | ns |
| RS * S | ns | ns | ns | ns | ns | ns | ns |
| RS * N | ns | ns | ns | ns | ns | ns | ns |
| S * N | ns | * | ns | ns | * | ns | ns |
| S * T | ns | ns | ns | ns | ns | ns | ns |
| N * T | ns | ns | ns | ns | ns | ns | ns |
| Y*Cv*RS*N*T | ns | * | * | ns | * | ns | ns |
| Residual | 0.00 | 0.03 | 0.00 | 0.00 | 0.01 | 0.00 | 0.00 |
Table 4.
Analysis of variance (P values) for the effect of main effects of year (Y), cultivar (Cv), row spacing (RS), seeding rate (S), nitrogen rate (N), apical application (T), and their interactions on seed amino acids leucine (LEU), tyrosine (TYR), phenylalanine (PHE), lysine (LYC), histidine (HIS), arginine (ARG), and tryptophan (TRY) (%). The experiments were conducted in 2015 and 2016.
| | LEU | TYR | PHE | LYS | HIS | ARG | TRY |
|---|
| Effect | P e | P | P | P | P | P | P |
|---|
| Year (Y) | *** | *** | *** | *** | *** | *** | ns |
| Cultivar (Cv) | nsf | ns | ns | *** | ns | *** | ns |
| Row spacing (RS) | * | ns | ns | * | * | *** | ns |
| Seeding rate (S) | ns | ns | ns | ns | ns | ns | ns |
| N rate (N) | ns | ns | ns | ns | ns | ns | ns |
| Apical application (T) | ns | ns | ns | ns | ns | * | ns |
| Y*Cv | * | ns | ns | ns | * | *** | ns |
| Y* RS | ns | ns | ns | ns | ns | ns | ns |
| Y*S | * | ns | ns | ns | ns | * | ns |
| Y*N | ns | ns | ns | ns | ns | ns | ns |
| Y*T | ns | * | ns | ns | ns | ns | ns |
| Cv * RS | *** | ns | ns | * | * | ns | ns |
| Cv * S | ns | ns | ns | ns | ns | ns | ns |
| Cv * N | ns | ns | ns | ns | ns | * | ns |
| RS * S | ns | ns | ns | ns | ns | ns | ns |
| RS * N | ns | ns | ns | ns | ns | ns | ns |
| S * N | ns | ns | ns | ns | ns | ns | ns |
| S * T | ns | ns | ns | ns | ns | ns | ns |
| N * T | ns | ns | ns | ns | ns | ns | * |
| Y*Cv*RS*N*T | ns | ns | ns | ns | ns | ns | ns |
| Residual | 0.02 | 0.00 | 0.00 | 0.01 | 0.02 | 0.00 | 0.00 |
Table 5.
The effect of seeding ratea, row spacing (15 inches twin row, 15 row spacing, and 30 row spacing (40 cm and 76 cm, respectively) on seed composition (protein; oil, palmitic (C16:0), stearic (C18:0), oleic (C18:1), linoleic (C18:2), linolenic (C18:3); sugars (sucrose, raffinose, stachyose) (%); and amino acids aspartic acid (ASP), threonine (THR), serine (SER), and glutamic acid (GLU), proline (PRO), glycine (GLY), alanine (ALA), cystine (CYS), valine (VAL), methionine (MET), iso-leucine (ISO), leucine (LEU), tyrosine (TYR), phenylalanine (PHE), lysine (LYC), histidine (HIS), arginine (ARG), and tryptophan (TRY) (%) in cultivar AG 4632 in 2015.
| | | | | Twin row 40 cm | | | | | | |
| | Protein | Oil | C16:0 | C18:0 | C18:1 | C18:2 | C18:3 | Sucrose | Raffinose | Stachyose |
| 40K | 38.8a | 22.05a | 10.09a | 3.9b | 27.8b | 51.1a | 9.4b | 4.88a | 0.69a | 3.11a |
| 56K | 37.95b | 22.28a | 11.1a | 4.1a | 29.2a | 50.1b | 10.0a | 4.69b | 0.68a | 3.06a |
| | ASP | THR | SER | GLU | PRO | GLY | ALA | CYST | VAL | |
| 40K | 4.23b | 1.54a | 1.86b | 5.63a | 1.99a | 1.66b | 1.74a | 0.33a | 1.96a | |
| 56K | 4.28a | 1.54a | 1.90a | 5.71a | 1.99a | 1.73a | 1.74a | 0.33a | 1.96a | |
| | MET | ISO | LEC | TYR | PHE | LYS | HIST | ARG | TRY | |
| 40K | 0.6a | 1.76a | 2.63a | 1.38b | 1.96a | 2.43b | 1.39a | 2.70b | 0.45a | |
| 56K | 0.6a | 1.76a | 2.65a | 1.40a | 1.97a | | 1.39a | 2.73a | 0.44a | |
| | | | | Row spacing 40 cm | | | | | | |
| | Protein | Oil | C16:0 | C18:0 | C18:1 | C18:2 | C18:3 | Sucrose | Raffinose | Stachyose |
| 40K | 37.3b | 22.9a | 10.3b | 4.06 | 23.3a | 54.8a | 8.1b | 4.79a | 0.686a | 3.2a |
| 56K | 38.2a | 21.9b | 11.2a | 4.09 | 24.0b | 52.6b | 9.6a | 4.86a | 0.675a | 3.2a |
| | ASP | THR | SER | GLU | PRO | GLY | ALA | CYS | VAL | |
| 40K | 4.26a | 1.51b | 1.84b | 5.71a | 1.97a | 1.61b | 1.71b | 0.34a | 1.96b | |
| 56K | 4.19b | 1.56a | 1.93a | 5.43b | 1.99a | 1.83a | 1.77a | 0.30b | 2.01a | |
| | MET | ISO | LEC | TYR | PHE | LYS | HIS | ARG | TRY | |
| 40K | 0.59b | 1.79a | 2.69a | 1.39a | 1.96a | 2.49a | 1.29a | 2.74a | 0.443a | |
| 56K | 0.60a | 1.80a | 2.60b | 1.41a | 1.93a | 2.38b | 1.30a | 2.73a | 0.425b | |
| | | | | Row spacing 76 cm | | | | | | |
| | Protein | Oil | C16:0 | C18:0 | C18:1 | C18:2 | C18:3 | Sucrose | Raffinose | Stachyose |
| 40K | 38.3b | 22.84a | 11.0a | 4.05a | 28.74a | 51.15a | 9.21b | 4.68a | 0.68a | 3.13b |
| 56K | 39.0a | 21.99b | 11.2a | 3.91b | 28.60a | 49.71b | 10.51a | 4.71a | 0.68a | 3.20a |
| | AS | THR | SER | GLU | PRO | GLY | ALA | CYS | VAL | |
| 40K | 4.24a | 1.49b | 1.79b | 5.78a | 1.94a | 1.56b | 1.69b | 0.31a | 1.89b | |
| 56K | 4.25a | 1.54a | 1.90a | 5.55b | 1.95a | 1.80a | 1.76a | 0.30a | 1.98a | |
| | MET | ISO | LEC | TYR | PHE | LYS | HIS | ARG | TRY | |
| 40K | 0.60a | 1.80b | 2.71a | 1.36b | 1.95a | 2.49a | 1.25a | 2.73a | 0.45a | |
| 56K | 0.60a | 1.83a | 2.69a | 1.44a | 1.94a | 2.44b | 1.23a | 2.76a | 0.46a | |
Table 6.
The effect of seeding rate and row spacing (15 inches twin row, 15 row spacing, and 30 row spacing (40 cm and 76 cm, respectively) on seed composition (protein; oil, palmitic (C16:0); stearic (C18:0); oleic (C18:1); linoleic (C18:2); linolenic (C18:3); sugars (sucrose, raffinose, stachyose) (%); and amino acids aspartic acid (ASP), threonine (THR), serine (SER), glutamic acid (GLU), proline (PRO), glycine (GLY), alanine (ALA), cystine (CYS), valine (VAL), methionine (MET), iso-leucine (ISO), leucine (LEU), tyrosine (TYR), phenylalanine (PHE), lysine (LYC), histidine (HIS), arginine (ARG), and tryptophan (TRY) (%) in cultivar AG 4632, in 2016.
| | | | Twin row 40 cm | | | | | | | |
| | Protein | Oil | C16:0 | C18:0 | C18:1 | C18:2 | C18:3 | Sucrose | Raffinose | Stachyose |
| 40K | 39.3a | 22.9b | 10.5a | 3.46a | 24.5a | 55.6b | 7.14a | 4.09a | 0.6a | 4.04a |
| 56K | 39.6a | 23.3a | 10.7a | 3.39a | 25.3a | 57.1a | 6.26b | 4.11a | 0.6a | 3.78b |
| | ASP | THR | SER | GLU | PRO | GLY | ALA | CYS | VAL | |
| 40K | 4.15a | 1.91a | 2.31a | 4.79a | 2.28a | 2.63a | 1.99a | 0.31a | 2.45a | |
| 56K | 4.18a | 1.91a | 2.29a | 4.71a | 2.28a | 2.64a | 1.99a | 0.29b | 2.46a | |
| | MET | ISO | LEC | TYR | PHE | LYS | HIS | ARG | TRY | |
| 40K | 0.60a | 1.93b | 2.71b | 1.68b | 1.83a | 2.33a | 0.85a | 2.83a | 0.43a | |
| 56K | 0.80a | 1.95a | 2.79a | 1.74a | 1.83a | 2.34a | 0.83a | 2.85a | 0.40b | |
| | | | Row spacing 40 cm | 2016 | | | | | | |
| | Protein | Oil | C16:0 | C18:0 | C18:1 | C18:2 | C18:3 | Sucrose | Raffinose | Stachyose |
| 40K | 39.6a | 21.9b | 11.9a | 3.70a | 21.5b | 56.9a | 7.91a | 4.34a | 0.64a | 4.11b |
| 56K | 39.4a | 22.9a | 10.7b | 3.55b | 24.1a | 57.4a | 7.24b | 4.23a | 0.61b | 3.93a |
| | AS | THR | SER | GLU | PRO | GLY | ALA | CYST | VAL | |
| 40K | 4.14a | 1.94a | 2.35a | 4.53a | 2.30a | 2.64a | 1.99a | 0.263a | 2.45a | |
| 56K | 4.09b | 1.88b | 2.30b | 4.54a | 2.28a | 2.59a | 1.99a | 0.288b | 2.41b | |
| | MET | ISO | LEC | TYR | PHE | LYS | HIS | ARG | TRY | |
| 40K | 0.60a | 1.86a | 2.64a | 1.69a | 1.81a | 2.31a | 0.98a | 2.78a | 0.415a | |
| 56K | 0.60a | 1.88a | 2.66a | 1.69a | 1.81a | 2.29a | 0.91b | 2.75b | 0.412a | |
| | | | Row spacing 76 cm | 2016 | | | | | | |
| | Protein | Oil | C16:0 | C18:0 | C18:1 | C18:2 | C18:3 | Sucrose | Raffinose | Stachyose |
| 40K | 39.9a | 22.4a | 10.95b | 3.59b | 25.5a | 55.2b | 7.36b | 4.15a | 0.613a | 3.81b |
| 56K | 40.1a | 21.5b | 12.29a | 3.76a | 21.1b | 57.6a | 8.59a | 4.09a | 0.90a | 3.94a |
| | ASP | THR | SER | GLU | PRO | GLY | ALA | CYS | VAL | |
| 40K | 4.13b | 1.83a | 2.19a | 4.53a | 2.21b | 2.45a | 1.94a | 0.26b | 2.38a | |
| 56K | 4.19a | 1.83a | 2.19a | 4.54a | 2.24a | 2.43a | 1.94a | 0.30a | 2.36a | |
| | MET | ISO | LEU | TYR | PHE | LYS | HIS | ARG | TRY | |
| 40K | 0.6a | 1.96a | 2.83a | 1.68a | 1.80b | 2.38b | 0.76a | 2.80b | 0.41a | |
| 56K | 0.6a | 1.96a | 2.86a | 1.65a | 1.86a | 2.45a | 0.80a | 2.85a | 0.41a | |
Table 7.
The effect of seeding rate and row spacing (15 inches twin row, 15 row spacing, and 30 row spacing (40 cm and 76 cm, respectively) on seed composition (protein; oil, palmitic (C16:0), stearic (C18:0), oleic (C18:1), linoleic (C18:2), linolenic (C18:3); sugars (sucrose, raffinose, stachyose) (%); and amino acids aspartic acid (ASP), threonine (THR), serine (SER), glutamic acid (GLU), proline (PRO), glycine (GLY), alanine (ALA), cystine (CYS), valine (VAL), methionine (MET), iso-leucine (ISO), leucine (LEU), tyrosine (TYR), phenylalanine (PHE), lysine (LYC), histidine (HIS), arginine (ARG), and tryptophan (TRY) (%) in cultivar P 47T36R, in 2015.
| | | | | Twin row 40 cm | | | | | | |
| | Protein | Oil | C16:0 | C18:0 | C18:1 | C18:2 | C18:3 | Sucrose | Raffinose | Stachyose |
| 40K | 36.5a | 23.3a | 10.6a | 4.0a | 27.6a | 51.5a | 9.5a | 4.73a | 0.65a | 3.45a |
| 56K | 36.4a | 23.2a | 11.0a | 4.0a | 27.0a | 52.0a | 9.4a | 4.58b | 0.65a | 3.3b |
| | ASP | THR | SER | GLU | PRO | GLY | ALA | CYS | VAL | |
| 40K | 4.1a | 1.49a | 1.8a | 5.3b | 1.9a | 1.6a | 1.70a | 0.30b | 1.93a | |
| 56K | 4.1a | 1.48a | 1.8a | 5.5a | 1.9a | 1.5b | 1.68b | 0.33a | 1.89b | |
| | MET | ISO | LEC | TYR | PHE | LYS | HIS | ARG | TRY | |
| 40K | 0.6a | 1.75b | 2.55b | 1.36a | 1.91b | 2.36b | 1.30a | 2.56b | 0.44a | |
| 56K | 0.6a | 1.79a | 2.64a | 1.38a | 1.94a | 2.43a | 1.26a | 2.61a | 0.41b | |
| | | | | Row spacing 40 cm | | | | | | |
| | Protein | Oil | C16:0 | C18:0 | C18:1 | C18:2 | C18:3 | Sucrose | Raffinose | Stachyose |
| 40K | 36.73b | 23.75a | 10.83a | 3.94a | 27.68a | 51.4b | 9.94a | 4.58a | 0.63b | 3.29a |
| 56K | 37.24a | 23.21b | 11.01a | 3.96a | 26.41b | 51.9a | 10.30a | 4.44b | 0.66a | 3.16b |
| | ASP | THR | SER | GLU | PRO | GLY | ALA | CYST | VAL | |
| 40K | 4.14a | 1.49a | 1.83a | 5.41a | 1.93a | 1.59a | 1.73a | 0.31b | 1.95a | |
| 56K | 4.08b | 1.51a | 1.80a | 5.45a | 1.91a | 1.56a | 1.73a | 0.34a | 1.91a | |
| | MET | ISO | LEU | TYR | PHE | LYS | HIS | ARG | TRY | |
| 40K | 0.60a | 1.79a | 2.63a | 1.39a | 1.91a | 2.36a | 1.26a | 2.6a | 0.425b | |
| 56K | 0.59a | 1.79a | 2.59a | 1.39a | 1.93a | 2.39a | 1.26a | 2.6a | 0.450a | |
| | | | | Row spacing 76 cm | | | | | | |
| | Protein | Oil | C16:0 | C18:0 | C18:1 | C18:2 | C18:3 | Sucrose | Raffinose | Stachyose |
| 40K | 37.16a | 22.87a | 10.83a | 4.06a | 26.73b | 51.40a | 10.11a | 4.6a | 0.68a | 3.24a |
| 56K | 36.95a | 22.98a | 10.37b | 3.99b | 27.7a | 50.28b | 9.80b | 4.6a | 0.67b | 3.3b |
| | ASP | THR | SER | GLU | PRO | GLY | CYS | ALA | VAL | |
| 40K | 4.17a | 1.49b | 1.83a | 5.60a | 1.95a | 1.57a | 0.308a | 1.70a | 1.94a | |
| 56K | 4.14b | 1.51a | 1.84a | 5.47b | 1.93b | 1.60a | 0.317a | 1.71a | 1.93a | |
| | MET | ISO | LEC | TYRO | PHE | LYS | HIS | ARG | TRY | |
| 40K | 0.595b | 1.771a | 2.596a | 1.37a | 1.94a | 2.390a | 1.33a | 2.621a | 0.438a | |
| 56K | 0..600a | 1.763a | 2.579a | 1.36a | 1.93a | 2.395a | 1.30a | 2.595b | 0.425b | |
Table 8.
The effect of seeding rate and row spacing (15 inches twin row, 15 row spacing, and 30 row spacing (40 cm and 76 cm, respectively) on seed composition (protein; oil, palmitic (C16:0), stearic (C18:0), oleic (C18:1), linoleic (C18:2), linolenic (C18:3); sugars (sucrose, raffinose, stachyose) (%); and amino acids aspartic acid (ASP), threonine (THR), serine (SER), and glutamic acid (GLU), proline (PRO), glycine (GLY), alanine (ALA), cystine (CYS), valine (VAL), methionine (MET), iso-leucine (ISO), leucine (LEU), tyrosine (TYR), phenylalanine (PHE), lysine (LYC), histidine (HIS), arginine (ARG), and tryptophan (TRY) (%) in cultivar P 47T36R, in 2016.
| | | | | Twin row 40 cm | | | | | | |
| | Protein | Oil | C16:0 | C18:0 | C18:1 | C18:2 | C18:3 | Sucrose | Raffinose | Stachyose |
| 40K | 38.2b | 24.14a | 11.10a | 3.61a | 24.2a | 55.73a | 7.6a | 3.65a | 0.588a | 4.06b |
| 56K | 39.0a | 22.68b | 11.13a | 3.69a | 24.1a | 55.56a | 7.9a | 3.41b | 0.575a | 4.15a |
| | ASP | THR | SER | GLU | PRO | GLY | ALA | CYS | VAL | |
| 40K | 4.13a | 1.85a | 2.24a | 4.86a | 2.21a | 2.48a | 1.95a | 0.30a | 2.36a | |
| 56K | 4.14a | 1.84a | 2.20b | 4.83a | 2.18b | 2.41b | 1.91b | 0.30a | 2.36a | |
| | MET | ISO | LEC | TYR | PHE | LYS | HIS | ARG | TRY | |
| 40K | 0.6a | 1.91b | 2.76a | 1.65a | 1.84a | 2.33a | 2.73a | 2.80b | 0.44a | |
| 56K | 0.6a | 1.96a | 2.79a | 1.66a | 1.83a | 2.34a | 2.73a | 2.85a | 0.44a | |
| | | | | Row spacing 40 cm | | | | | | |
| | Protein | Oil | C16:0 | C18:0 | C18:1 | C18:2 | C18:3 | Sucrose | Raffinose | Stachyose |
| 40K | 38.3b | 23.9a | 10.99a | 3.51a | 23.9a | 57.88b | 7.79a | 3.64a | 0.6a | 3.90a |
| 56K | 38.9a | 24.1a | 10.25b | 3.50a | 24.6a | 59.9a | 7.71a | 3.38b | 0.6a | 4.08b |
| | ASP | THR | SER | GLU | PRO | GLY | ALA | CYS | VAL | |
| 40K | 4.09b | 1.80b | 2.16b | 4.85a | 2.19b | 2.39b | 1.91b | 0.275a | 2.33b | |
| 56K | 4.11a | 1.85a | 2.20a | 4.73b | 2.23a | 2.50a | 1.94a | 0.275a | 2.40a | |
| | MET | ISO | LEC | TYR | PHE | LYS | HIST | ARG | TRY | |
| 40K | 0.60a | 1.93b | 2.76b | 1.65b | 1.81a | 2.34a | 0.81a | 2.70b | 0.43a | |
| 56K | 0.60a | 1.98a | 2.81a | 1.68a | 1.80b | 2.31a | 0.75b | 2.74a | 0.40b | |
| | | | | Row spacing 76 cm | | | | | | |
| | Protein | Oil | C16:0 | C18:0 | C18:1 | C18:2 | C18:3 | Sucrose | Raffinose | Stachyose |
| 40K | 38.1b | 23.88a | 10.64a | 3.62a | 23.95a | 56.12a | 7.62a | 3.51a | 0.58a | 4.03a |
| 56K | 38.7a | 23.74a | 10.35a | 3.63a | 24.54a | 55.5a | 7.86a | 3.52a | 0.57a | 4.04a |
| | ASP | THR | SER | GLU | PRO | GLY | ALA | CYS | VAL | |
| 40K | 4.11b | 1.895a | 2.25a | 4.63b | 2.283b | 2.604a | 1.975a | 0.275b | 2.445a | |
| 56K | 4.14a | 1.888a | 2.25a | 4.795a | 2.296a | 2.595a | 1.975a | 0.296a | 2.441a | |
| | MET | ISO | LEC | TYR | PHE | LYS | HIS | ARG | TRY | |
| 40K | 0.604a | 1.94b | 2.74b | 1.695b | 1.795b | 2.31a | 0.779a | 2.71b | 0.44b | |
| 56K | 0.60b | 1.97a | 2.81a | 1.721a | 1.821a | 2.31a | 0.767a | 2.77a | 0.46a | |


