The Histone Marks Signature in Exonic and Intronic Regions Is Relevant in Early Response of Tomato Genes to Botrytis cinerea and in miRNA Regulation

 ,
,  , ,
, ,
Abstract
: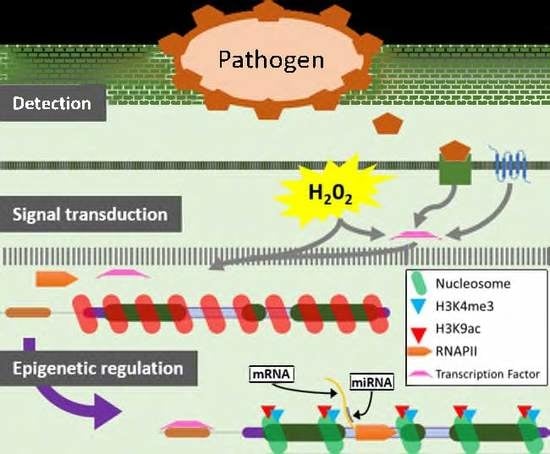
1. Introduction
2. Results
2.1. Histone Mark H3K9ac on SlyDES, SlyDOX1, SlyLoxD, and SlyWRKY75 Genes in Tomato Plants’ Early Response to B. cinerea
2.2. Histone Marks H3K9ac and H3K4me3 on SlyDES, SlyDOX1, SlyLoxD, and SlyWRKY75 Genes in Tomato Plants Infected by P. syringae
2.3. Presence of RNAPII in SlyDES, SlyDOX1, SlyLoxD, and SlyWRKY75 in Response to B. cinerea and P. syringae
2.4. Epigenetic Marks H3K9ac and H3K4me3 and the Presence of RNAPII at the SlyWRKY75 Intron in Response to B. cinerea or P. syringae
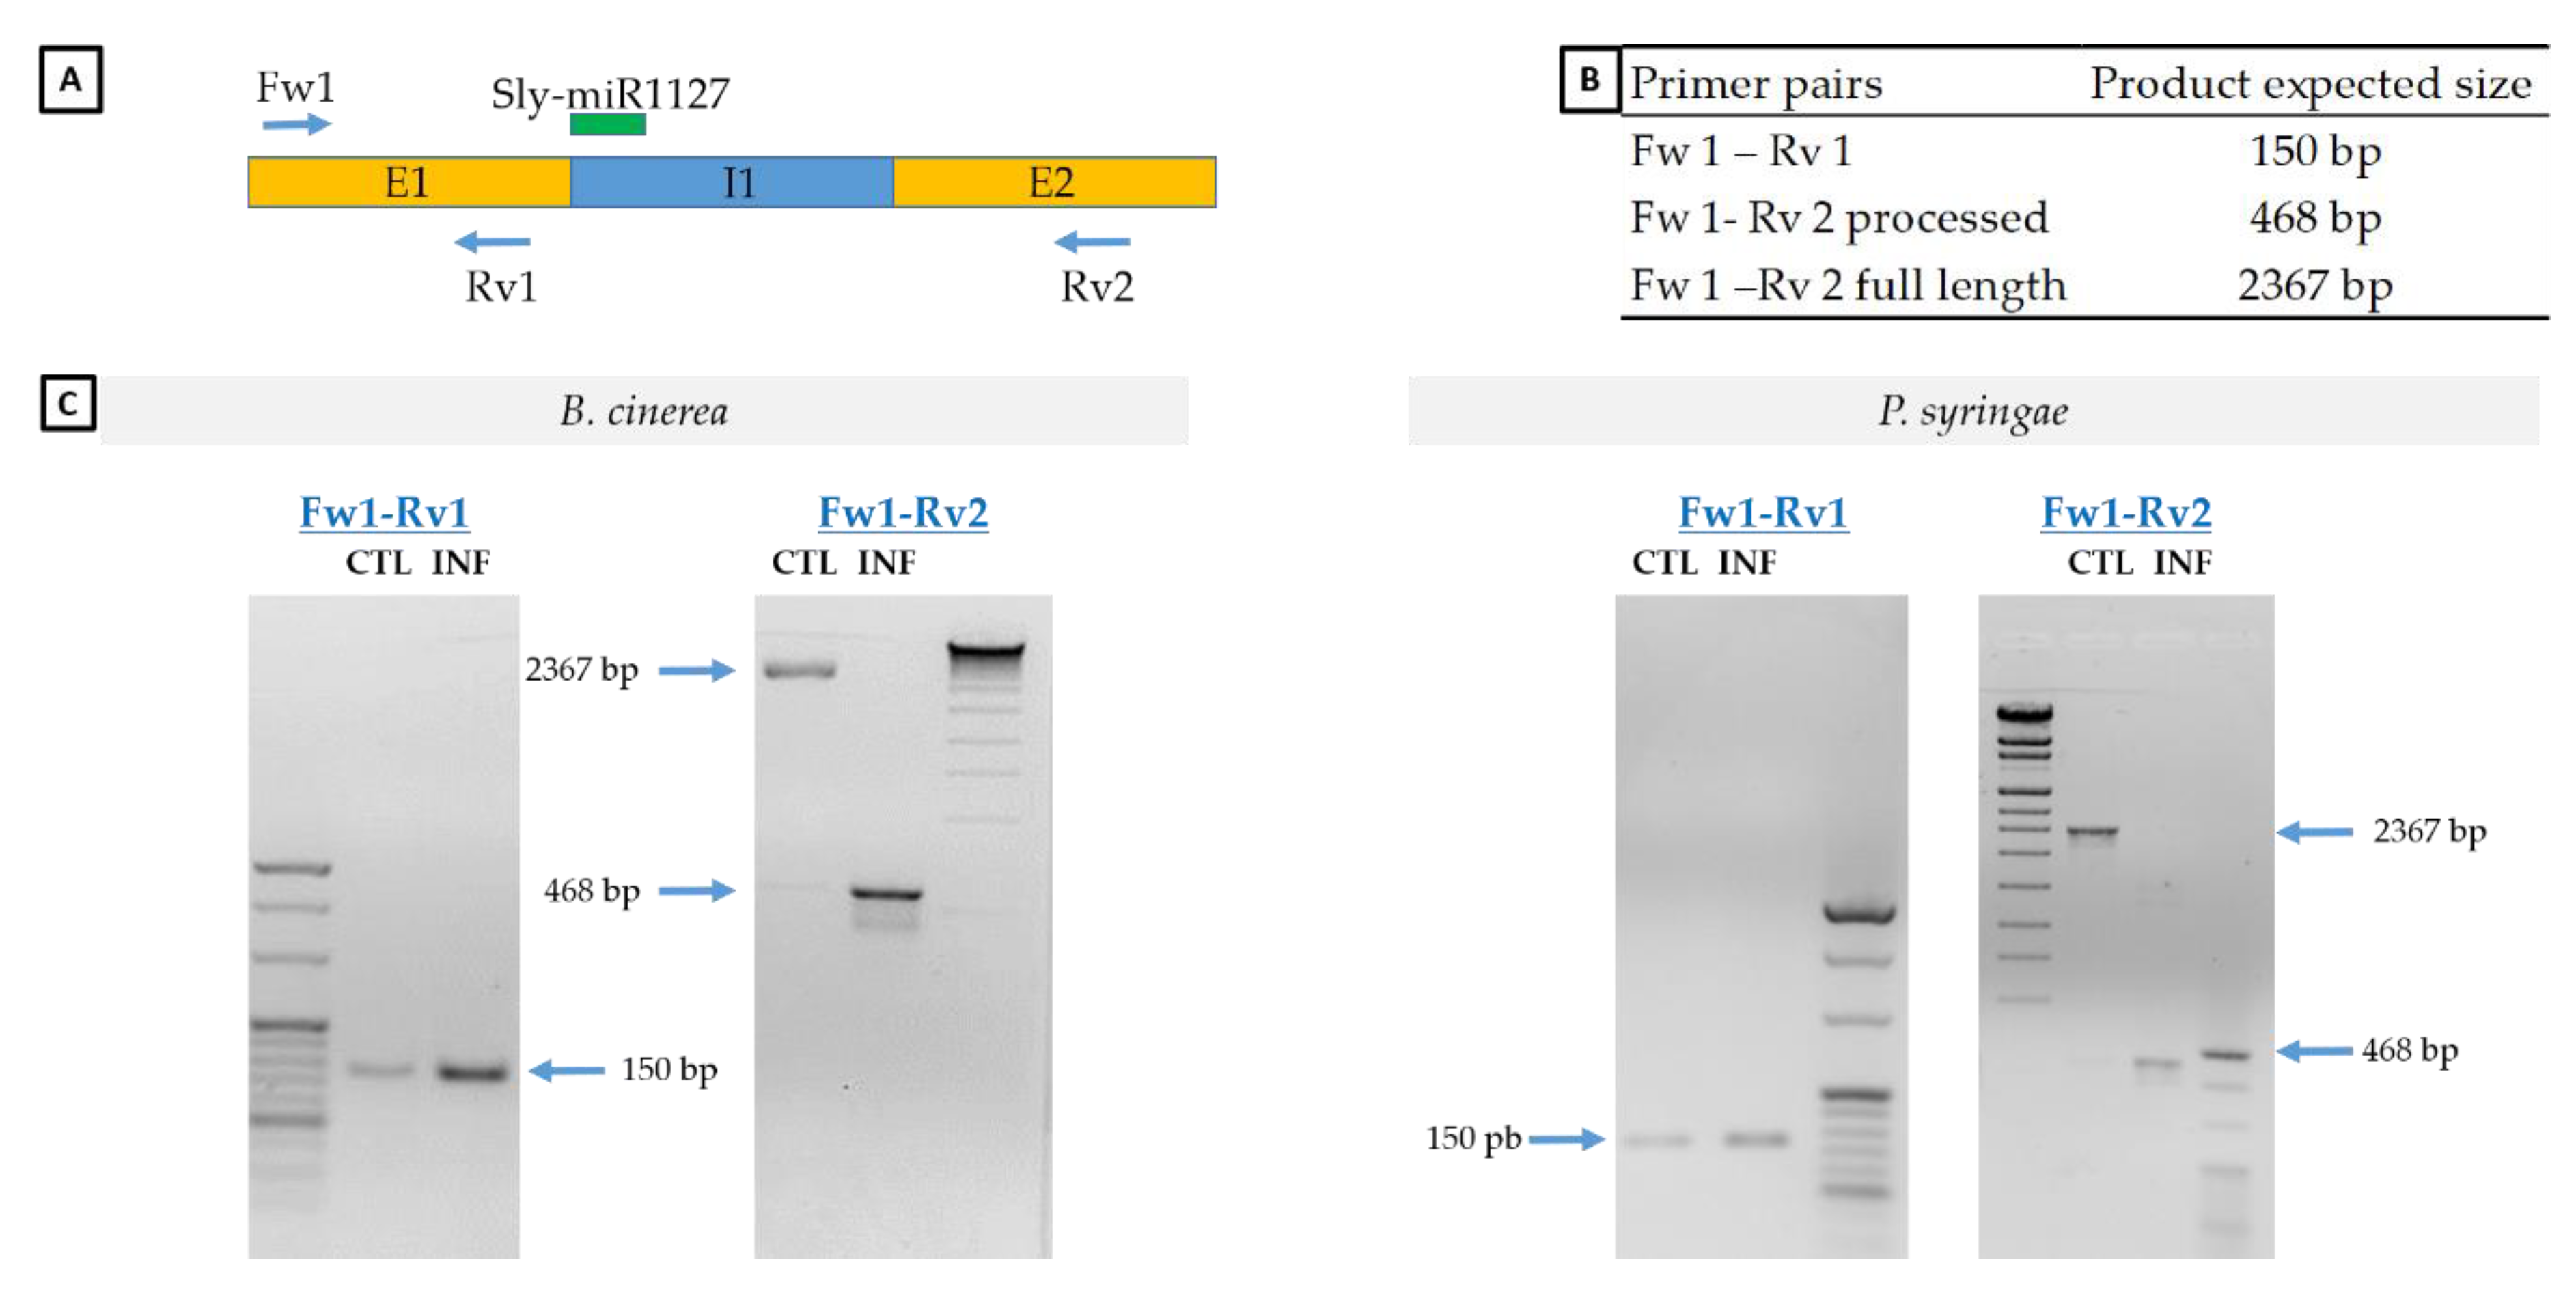
2.5. Analysis of SlyWRKY75 Transcript Processing in Response to B. cinerea or P. syringae
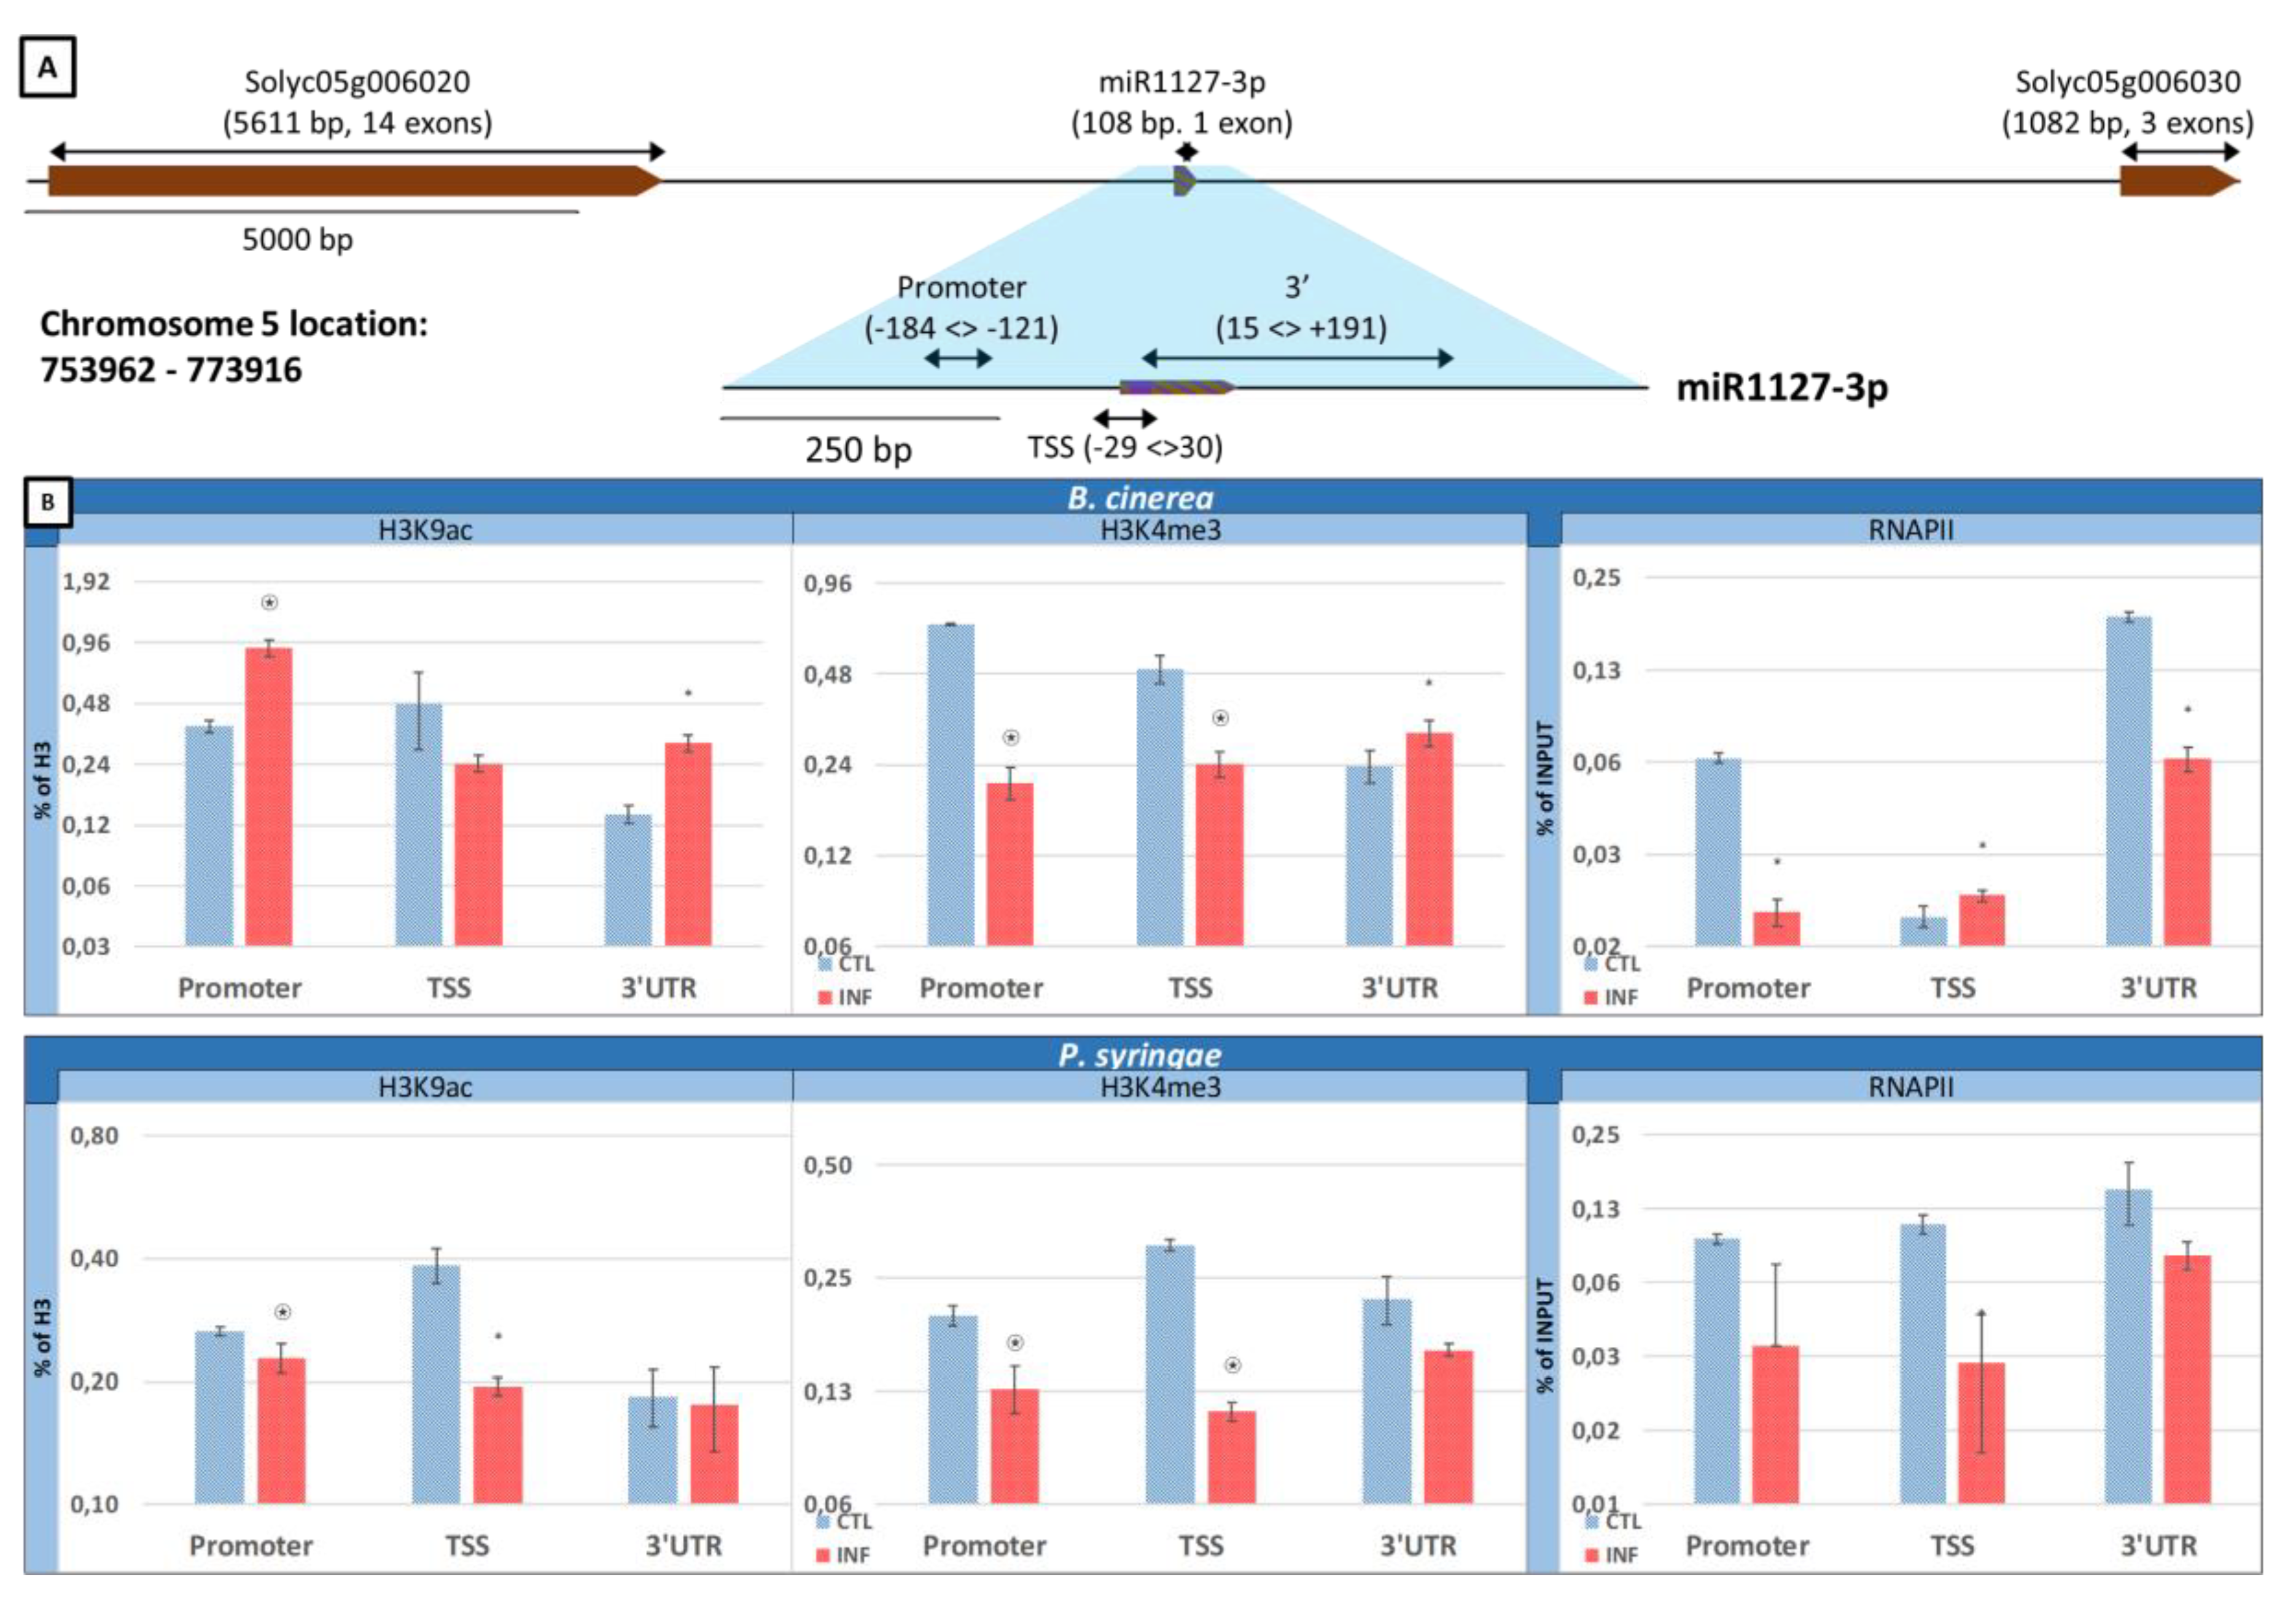
2.6. Epigenetic Marks H3K9ac and H3K4me3 and Presence of RNAPII in the Sly-miR1127-3p Structural Gene in Response to B. cinerea and P. syringae
3. Discussion
4. Materials and Methods
4.1. S. lycopersicum Growth Conditions
4.2. B. cinerea Bioassay
4.3. P. syringae Bioassay
4.4. Gene Expression Quantification by RT-qPCR
4.5. miRNA Assay
4.6. Chromatin Isolation and Immunoprecipitation Protocol
4.7. Data Interpretation and Statistical Analysis
Supplementary Materials
Author Contributions
Funding
Acknowledgments
Conflicts of Interest
References
- Jones, J.D.; Dangl, J.L. The plant immune system. Nature 2006, 444, 323–329. [Google Scholar] [CrossRef] [PubMed] [Green Version]
- Ding, B.; Wang, G.L. Chromatin versus pathogens: The function of epigenetics in plant immunity. Front. Plant Sci. 2015, 6, 675. [Google Scholar] [CrossRef] [PubMed] [Green Version]
- Espinas, N.A.; Saze, H.; Saijo, Y. Epigenetic Control of Defense Signaling and Priming in Plants. Front. Plant Sci. 2016, 7, 1201. [Google Scholar] [CrossRef] [PubMed]
- Avramova, Z. Transcriptional “memory” of a stress: Transient chromatin and memory (epigenetic) marks at stress-response genes. Plant J. 2015, 83, 149–159. [Google Scholar] [CrossRef]
- Alvarez, M.E.; Nota, F.; Cambiagno, D.A. Epigenetic control of plant immunity. Mol. Plant Pathol. 2010, 11, 563–576. [Google Scholar] [CrossRef]
- Jaskiewicz, M.; Conrath, U.; Peterhansel, C. Chromatin modification acts as a memory for systemic acquired resistance in the plant stress response. EMBO Rep. 2011, 12, 50–55. [Google Scholar] [CrossRef] [Green Version]
- Luna, E.; Ton, J. The epigenetic machinery controlling transgenerational systemic acquired resistance. Plant Signal. Behav. 2012, 7, 615–618. [Google Scholar] [CrossRef] [Green Version]
- Conrath, U.; Beckers, G.J.; Langenbach, C.J.; Jaskiewicz, M.R. Priming for enhanced defense. Annu. Rev. Phytopathol. 2015, 53, 97–119. [Google Scholar] [CrossRef]
- Liu, N.; Avramova, Z. Molecular mechanism of the priming by jasmonic acid of specific dehydration stress response genes in Arabidopsis. Epigenetics Chromatin 2016, 9, 8. [Google Scholar] [CrossRef] [Green Version]
- Mbengue, M.; Navaud, O.; Peyraud, R.; Barascud, M.; Badet, T.; Vincent, R.; Barbacci, A.; Raffaele, S. Emerging Trends in Molecular Interactions between Plants and the Broad Host Range Fungal Pathogens Botrytis cinerea and Sclerotinia sclerotiorum. Front. Plant Sci. 2016, 7, 422. [Google Scholar] [CrossRef] [Green Version]
- Zhou, C.; Zhang, L.; Duan, J.; Miki, B.; Wu, K. HISTONE DEACETYLASE19 is involved in jasmonic acid and ethylene signaling of pathogen response in Arabidopsis. Plant Cell 2005, 17, 1196–1204. [Google Scholar] [CrossRef] [PubMed] [Green Version]
- Berr, A.; McCallum, E.J.; Alioua, A.; Heintz, D.; Heitz, T.; Shen, W.H. Arabidopsis histone methyltransferase SET DOMAIN GROUP8 mediates induction of the jasmonate/ethylene pathway genes in plant defense response to necrotrophic fungi. Plant Physiol. 2010, 154, 1403–1414. [Google Scholar] [CrossRef] [Green Version]
- Zhang, Y.; Li, D.; Zhang, H.; Hong, Y.; Huang, L.; Liu, S.; Li, X.; Ouyang, Z.; Song, F. Tomato histone H2B monoubiquitination enzymes SlHUB1 and SlHUB2 contribute to disease resistance against Botrytis cinerea through modulating the balance between SA- and JA/ ET-mediated signaling pathways. BMC Plant Biol 2015, 15, 252. [Google Scholar] [CrossRef] [Green Version]
- Borges, F.; Martienssen, R.A. The expanding world of small RNAs in plants. Nat. Rev. Mol. Cell Biol. 2015, 16, 727–741. [Google Scholar] [CrossRef] [PubMed] [Green Version]
- Yu, Y.; Jia, T.; Chen, X. The ‘how’ and ‘where’ of plant microRNAs. New Phytol. 2017, 216, 1002–1017. [Google Scholar] [CrossRef] [PubMed] [Green Version]
- Sunkar, R.; Zhu, J.K. Novel and stress regulated microRNAs and other small RNAs from Arabidopsis w inside box sign. Plant Cell 2004, 16, 2001–2019. [Google Scholar] [CrossRef] [PubMed] [Green Version]
- Shivaprasad, P.V.; Chen, H.M.; Patel, K.; Bond, D.M.; Santos, B.A.C.M.; Baulcombe, D.C. A microRNA superfamily regulates nucleotide binding site-leucine-rich repeats and other mRNAs. Plant Cell 2012, 24, 859–874. [Google Scholar] [CrossRef] [Green Version]
- Ouyang, S.; Park, G.; Atamian, H.S.; Han, C.S.; Stajich, J.E.; Kaloshian, I.; Borkovich, K.A. MicroRNAs Suppress NB Domain Genes in Tomato That Confer Resistance to Fusarium oxysporum. PLoS Pathog. 2014, 10. [Google Scholar] [CrossRef]
- Jin, W.; Wu, F. Characterization of miRNAs associated with Botrytis cinerea infection of tomato leaves. BMC Plant Biol. 2015, 1. [Google Scholar] [CrossRef]
- Barski, A.; Jothi, R.; Cuddapah, S.; Cui, K.; Roh, T.Y.; Schones, D.E.; Zhao, K. Chromatin poises miRNA- and protein-coding genes for expression. Genome Res. 2009, 19, 1742–1751. [Google Scholar] [CrossRef] [Green Version]
- Aranega-Bou, P.; Leyva, M.D.L.O.; Finiti, I.; Garcia-Agustin, P.; Gonzalez-Bosch, C. Priming of plant resistance by natural compounds. Hexanoic acid as a model. Front. Plant Sci. 2014, 5, 488. [Google Scholar] [CrossRef] [PubMed] [Green Version]
- Camañes, G.; Scalschi, L.; Vicedo, B.; Gonzalez-Bosch, C.; Garcia-Agustin, P. An untargeted global metabolomic analysis reveals the biochemical changes underlying basal resistance and priming in Solanum lycopersicum and identifies 1-methyltryptophan as a metabolite involved in plant responses to Botrytis cinerea and Pseudomonas sy. Plant J. 2015, 84, 125–139. [Google Scholar] [CrossRef] [PubMed]
- Finiti, I.; Leyva, M.D.L.O.; Vicedo, B.; Gomez-Pastor, R.; Lopez-Cruz, J.; Garcia-Agustin, P.; Real, M.D.; Gonzalez-Bosch, C. Hexanoic acid protects tomato plants against Botrytis cinerea by priming defence responses and reducing oxidative stress. Mol. Plant Pathol. 2014, 15, 550–562. [Google Scholar] [CrossRef] [PubMed]
- Chen, X.; Liu, X.; Zhao, Y.; Zhou, D.X. Histone H3K4me3 and H3K27me3 regulatory genes control stable transmission of an epimutation in rice. Sci. Rep. 2015, 5, 13251. [Google Scholar] [CrossRef] [Green Version]
- Li, Y.; Zhang, L.; Lu, W.; Wang, X.; Wu, C.A.; Guo, X. Overexpression of cotton GhMKK4 enhances disease susceptibility and affects abscisic acid, gibberellin and hydrogen peroxide signalling in transgenic Nicotiana benthamiana. Mol. Plant Pathol. 2014, 15, 94–108. [Google Scholar] [CrossRef]
- Martinez-Aguilar, K.; Ramirez-Carrasco, G.; Hernandez-Chavez, J.L.; Barraza, A.; Alvarez-Venegas, R. Use of BABA and INA As Activators of a Primed State in the Common Bean (Phaseolus vulgaris L.). Front. Plant Sci. 2016, 7, 653. [Google Scholar] [CrossRef] [Green Version]
- Lee, S.Y.; Fu, F.; Xu, S.; Lee, S.Y.; Yun, D.J.; Mengiste, T. Global Regulation of Plant Immunity by Histone Lysine Methyl Transferases. Plant Cell 2016, 28, 1640–1661. [Google Scholar] [CrossRef] [Green Version]
- Crespo-Salvador, Ó.; Escamilla-Aguilar, M.; López-Cruz, J.; López-Rodas, G.; González-Bosch, C. Determination of histone epigenetic marks in Arabidopsis and tomato genes in the early response to Botrytis cinerea. Plant Cell Rep. 2018, 37, 153–166. [Google Scholar] [CrossRef]
- López-Galiano, M.J.; Sentandreu, V.; Martínez-Ramírez, A.C.; Rausell, C.; Real, M.D.; Camañes, G.; Ruiz-Rivero, O.; Crespo-Salvador, O.; García-Robles, I. Identification of Stress Associated microRNAs in Solanum lycopersicum by High-Throughput Sequencing. Genes 2019, 10, 475. [Google Scholar] [CrossRef] [Green Version]
- Blée, E. Impact of phyto-oxylipins in plant defense. Trends Plant Sci. 2002, 7, 315–322. [Google Scholar] [CrossRef]
- Farmer, E.E.; Alméras, E.; Krishnamurthy, V. Jasmonates and related oxylipins in plant responses to pathogenesis and herbivory. Curr. Opin. Plant Biol. 2003, 6, 372–378. [Google Scholar] [CrossRef]
- Vicente, J.; Cascón, T.; Vicedo, B.; García-Agustín, P.; Hamberg, M.; Castresana, C. Role of 9-Lipoxygenase and α-Dioxygenase Oxylipin Pathways as Modulators of Local and Systemic Defense. Mol. Plant 2012, 5, 914–928. [Google Scholar] [CrossRef] [PubMed] [Green Version]
- Angulo, C.; Leyva, M.D.L.O.; Finiti, I.; López-Cruz, J.; Fernández-Crespo, E.; García-Agustín, P.; González-Bosch, C. Role of dioxygenase alpha-DOX2 and SA in basal response and in hexanoic acid-induced resistance of tomato (Solanum lycopersicum) plants against Botrytis cinerea. J. Plant Physiol. 2015, 175, 163–173. [Google Scholar] [CrossRef] [PubMed]
- Stumpe, M.; Kandzia, R.; Göbel, C.; Rosahl, S.; Feussner, I. A pathogen-inducible divinyl ether synthase (CYP74D) from elicitor-treated potato suspension cells. FEBS Lett. 2001, 507, 371–376. [Google Scholar] [CrossRef] [Green Version]
- Fammartino, A.; Cardinale, F.; Göbel, C.; Mène-Saffrané, L.; Fournier, J.; Feussner, I.; Esquerré-Tugayé, M.T. Characterization of a divinyl ether biosynthetic pathway specifically associated with pathogenesis in tobacco. Plant Physiol. 2007, 143, 378–388. [Google Scholar] [CrossRef] [Green Version]
- Göbel, C.; Feussner, I.; Schmidt, A.; Scheel, D.; Sanchez-Serrano, J.; Hamberg, M.; Rosahl, S. Oxylipin profiling reveals the preferential stimulation of the 9-lipoxygenase pathway in elicitor-treated potato cells. J. Biol. Chem. 2001, 276, 6267–6273. [Google Scholar] [CrossRef] [Green Version]
- Veronesi, C.; Rickauer, M.; Fournier, J.; Pouenat, M.L.; Esquerre-Tugaye, M.T.; Feussner, I.; Esquerré-Tugayé, M.-T. Lipoxygenase Gene Expression in the Tobacco-Phytophthora parasitica nicotianae Interaction. Plant Physiol. 1996, 112, 997–1004. [Google Scholar] [CrossRef] [Green Version]
- Fammartino, A.; Verdaguer, B.; Fournier, J.; Tamietti, G.; Carbonne, F.; Esquerré-Tugayé, M.-T.; Cardinale, F. Coordinated transcriptional regulation of the divinyl ether biosynthetic genes in tobacco by signal molecules related to defense. Plant Physiol. Biochem. 2010, 48, 225–231. [Google Scholar] [CrossRef]
- López-Galiano, M.J.; González-Hernández, A.I.; Crespo-Salvador, O.; Rausell, C.; Real, M.D.; Escamilla, M.; Camañes, G.; García-Agustín, P.; González-Bosch, C.; García-Robles, I. Epigenetic regulation of the expression of WRKY75 transcription factor in response to biotic and abiotic stresses in Solanaceae plants. Plant Cell Rep. 2018, 37, 167–176. [Google Scholar] [CrossRef]
- Chen, X.; Liu, J.; Lin, G.; Wang, A.; Wang, Z.; Lu, G. Overexpression of AtWRKY28 and AtWRKY75 in Arabidopsis enhances resistance to oxalic acid and Sclerotinia sclerotiorum. Plant Cell Rep. 2013, 32, 1589–1599. [Google Scholar] [CrossRef]
- Kim, H.S.; Park, Y.H.; Nam, H.; Lee, Y.M.; Song, K.; Choi, C.; Ahn, I.; Park, S.R.; Lee, Y.H.; Hwang, D.-J. Overexpression of the Brassica rapa transcription factor WRKY12 results in reduced soft rot symptoms caused by Pectobacterium carotovorum in Arabidopsis and Chinese cabbage. Plant Biol. 2014, 16, 973–981. [Google Scholar] [CrossRef] [PubMed]
- Encinas-Villarejo, S.; Maldonado, A.M.; Amil-Ruiz, F.; de los Santos, B.; Romero, F.; Pliego-Alfaro, F.; Munoz-Blanco, J.; Caballero, J.L. Evidence for a positive regulatory role of strawberry (Fragaria x ananassa) Fa WRKY1 and Arabidopsis At WRKY75 proteins in resistance. J. Exp. Bot. 2009, 60, 3043–3065. [Google Scholar] [CrossRef] [PubMed] [Green Version]
- Guo, P.; Li, Z.; Huang, P.; Li, B.; Fang, S.; Chu, J.; Guo, H. A Tripartite Amplification Loop Involving the Transcription Factor WRKY75, Salicylic Acid, and Reactive Oxygen Species Accelerates Leaf Senescence. Plant Cell 2017, 29, 2854–2870. [Google Scholar] [CrossRef] [PubMed]
- Meng, Y.; Shao, C.; Ma, X.; Wang, H. Introns targeted by plant microRNAs: A possible novel mechanism of gene regulation. Rice 2013, 6, 8. [Google Scholar] [CrossRef] [PubMed] [Green Version]
- Kurita, K.; Sakamoto, T.; Yagi, N.; Sakamoto, Y.; Ito, A.; Nishino, N.; Sako, K.; Yoshida, M.; Kimura, H.; Seki, M.; et al. Live imaging of H3K9 acetylation in plant cells. Sci. Rep. 2017, 7, 45894. [Google Scholar] [CrossRef] [PubMed] [Green Version]
- Sandoval, J.; Rodriguez, J.L.; Tur, G.; Serviddio, G.; Pereda, J.; Boukaba, A.; Sastre, J.; Torres, L.; Franco, L.; Lopez-Rodas, G. RNAPol-ChIP: A novel application of chromatin immunoprecipitation to the analysis of real-time gene transcription. Nucleic Acids Res. 2004, 32, e88. [Google Scholar] [CrossRef] [Green Version]
- Zhang, B.; Pan, X.; Cobb, G.P.; Anderson, T.A. Plant microRNA: A small regulatory molecule with big impact. Dev. Biol. 2006, 289, 3–16. [Google Scholar] [CrossRef]
- AbuQamar, S.; Moustafa, K.; Tran, L.S. Mechanisms and strategies of plant defense against Botrytis cinerea. Crit. Rev. Biotechnol. 2017, 37, 262–274. [Google Scholar] [CrossRef]
- Xiao, J.; Lee, U.S.; Wagner, D. Tug of war: Adding and removing histone lysine methylation in Arabidopsis. Curr. Opin. Plant Biol. 2016, 34, 41–53. [Google Scholar] [CrossRef] [Green Version]
- Gates, L.A.; Shi, J.; Rohira, A.D.; Feng, Q.; Zhu, B.; Bedford, M.T.; Sagum, C.A.; Jung, S.Y.; Qin, J.; Tsai, M.-J.; et al. Acetylation on histone H3 lysine 9 mediates a switch from transcription initiation to elongation. J. Biol. Chem. 2017, 292, 14456–14472. [Google Scholar] [CrossRef] [Green Version]
- Choi, K.; Kim, J.; Müller, S.Y.; Oh, M.; Underwood, C.; Henderson, I.; Lee, I. Regulation of microRNA-mediated developmental changes by the SWR1 chromatin remodeling complex. Plant Physiol. 2016, 171, 1128–1143. [Google Scholar] [PubMed] [Green Version]
- Laxa, M. Intron-mediated enhancement: A tool for heterologous gene expression in plants? Front. Plant Sci. 2017, 7, 4255. [Google Scholar] [CrossRef] [PubMed] [Green Version]
- Gallegos, J.E.; Rose, A.B. The enduring mystery of intron-mediated enhancement. Plant Sci. 2015, 237, 8–15. [Google Scholar] [CrossRef] [PubMed]
- Jo, S.S.; Choi, S.S.; Hurst, L. Analysis of the Functional Relevance of Epigenetic Chromatin Marks in the First Intron Associated with Specific Gene Expression Patterns. Genome Biol. Evol. 2019, 11, 786–797. [Google Scholar] [CrossRef] [PubMed]
- Alonso, C.; Ramos-Cruz, D.; Becker, C. The role of plant epigenetics in biotic interactions. New Phytol. 2019, 221, 731–737. [Google Scholar] [CrossRef]
- Brouwer, M.; Lievens, B.; Van Hemelrijck, W.; Van Den Ackerveken, G.; Cammue, B.P.A.; Thomma, B.P.H.J. Quantification of disease progression of several microbial pathogens on Arabidopsis thaliana using real-time fluorescence PCR. FEMS Microbiol. Lett. 2003, 228, 241–248. [Google Scholar] [CrossRef] [Green Version]
- Pfaffl, M.W. A new mathematical model for relative quantification in real-time RT-PCR. Nucleic Acids Res. 2001, 29, e45. [Google Scholar] [CrossRef]
- Saleh, A.; Alvarez-Venegas, R.; Avramova, Z. An efficient chromatin immunoprecipitation (ChIP) protocol for studying histone modifications in Arabidopsis plants. Nat. Protoc. 2008, 3, 1018–1025. [Google Scholar] [CrossRef]
- Haring, M.; Offermann, S.; Danker, T.; Horst, I.; Peterhansel, C.; Stam, M. Chromatin immunoprecipitation: Optimization, quantitative analysis and data normalization. Plant Methods 2007, 3, 11. [Google Scholar] [CrossRef] [Green Version]


| Gene | Region | B. cinerea | P. syringae | |||||||
|---|---|---|---|---|---|---|---|---|---|---|
| Expression 1 | H3K9ac | H3K4me3 1 | RNAPII | Expression | H3K9ac | H3K4me3 | RNAPII | |||
| SlyDES | Promoter | +++ | ↑↑↑ | ↑ | ↑↑↑ | ++ | ||||
| TSS | ↑↑↑ | ↑↑ | ↑↑ | ↑ | ↑ | |||||
| Exon 2 (end of CDS) | ↑↑↑ | ↑↑ | ↑↑↑ | |||||||
| SlyDOX1 | Promoter | +++ | ↑↑ | ↑ | ↑ | ++ | ↑ | |||
| TSS | ↑↑ | ↑↑ | ↑ | ↑ | ↑ | |||||
| Exon 1 (start of CDS) | ↑ | ↑↑ | ↑ | ↑ | ||||||
| Exon 10 (end of CDS) | ↑↑ | ↑↑ | ↑ | ↑ | ||||||
| SlyLoxD | Promoter | ++ | ↑ | ↑↑ | + | ↑ | ||||
| TSS | ↑↑ | ↑ | ||||||||
| Exon 1 | ↑↑ | ↑↑ | ↑ | ↑ | ||||||
| Exon 8 (3’-UTR) | ↑ | ↑ | ↑ | ↑↑ | ||||||
| SlyWRKY75 2 | TSS | ++ | ↑↑ | ↑ | ↑↑ | ++ | ↑↑ | ↑↑ | ↑↑ | |
| Exon 1 | ↑ | ↑↑ | ↑ | ↑↑ | ↑↑↑ | |||||
| Intron | miRNA binding region | ↑↑ | ↑↑ | ↑↑ | ↑ | ↑↑↑ | ||||
| Region 1 | ↑↑ | ↑↑ | ↑↑ | ↑↑ | ↑↑↑ | |||||
| Region 2 | ↑↑ | ↑↑ | ↑↑ | ↑↑↑ | ↑↑ | ↑↑↑ | ||||
| Region 3 | ↑↑ | ↑↑ | ↑↑ | ↑↑↑ | ↑↑ | ↑↑↑ | ||||
| Exon 2 (3’-UTR) | ↑ | ↑↑ | ↑ | ↑↑↑ | ||||||
| miR1127-3p 2 | Promoter | − | ↑ | ↓ | ||||||
| TSS | ↓ | |||||||||
| 3’ gene and intergenic region | ||||||||||
© 2020 by the authors. Licensee MDPI, Basel, Switzerland. This article is an open access article distributed under the terms and conditions of the Creative Commons Attribution (CC BY) license (http://creativecommons.org/licenses/by/4.0/).
Share and Cite
Crespo-Salvador, Ó.; Sánchez-Giménez, L.; López-Galiano, M.J.; Fernández-Crespo, E.; Scalschi, L.; García-Robles, I.; Rausell, C.; Real, M.D.; González-Bosch, C. The Histone Marks Signature in Exonic and Intronic Regions Is Relevant in Early Response of Tomato Genes to Botrytis cinerea and in miRNA Regulation. Plants 2020, 9, 300. https://doi.org/10.3390/plants9030300
Crespo-Salvador Ó, Sánchez-Giménez L, López-Galiano MJ, Fernández-Crespo E, Scalschi L, García-Robles I, Rausell C, Real MD, González-Bosch C. The Histone Marks Signature in Exonic and Intronic Regions Is Relevant in Early Response of Tomato Genes to Botrytis cinerea and in miRNA Regulation. Plants. 2020; 9(3):300. https://doi.org/10.3390/plants9030300
Chicago/Turabian StyleCrespo-Salvador, Óscar, Lorena Sánchez-Giménez, Mª José López-Galiano, Emma Fernández-Crespo, Loredana Scalschi, Inmaculada García-Robles, Carolina Rausell, M Dolores Real, and Carmen González-Bosch. 2020. "The Histone Marks Signature in Exonic and Intronic Regions Is Relevant in Early Response of Tomato Genes to Botrytis cinerea and in miRNA Regulation" Plants 9, no. 3: 300. https://doi.org/10.3390/plants9030300