Floristic Changes in the Understory Vegetation of Mixed Temperate New England Freshwater Island Forests over a Period of 33 Years

Abstract
:1. Introduction
2. Materials and Methods
3. Results
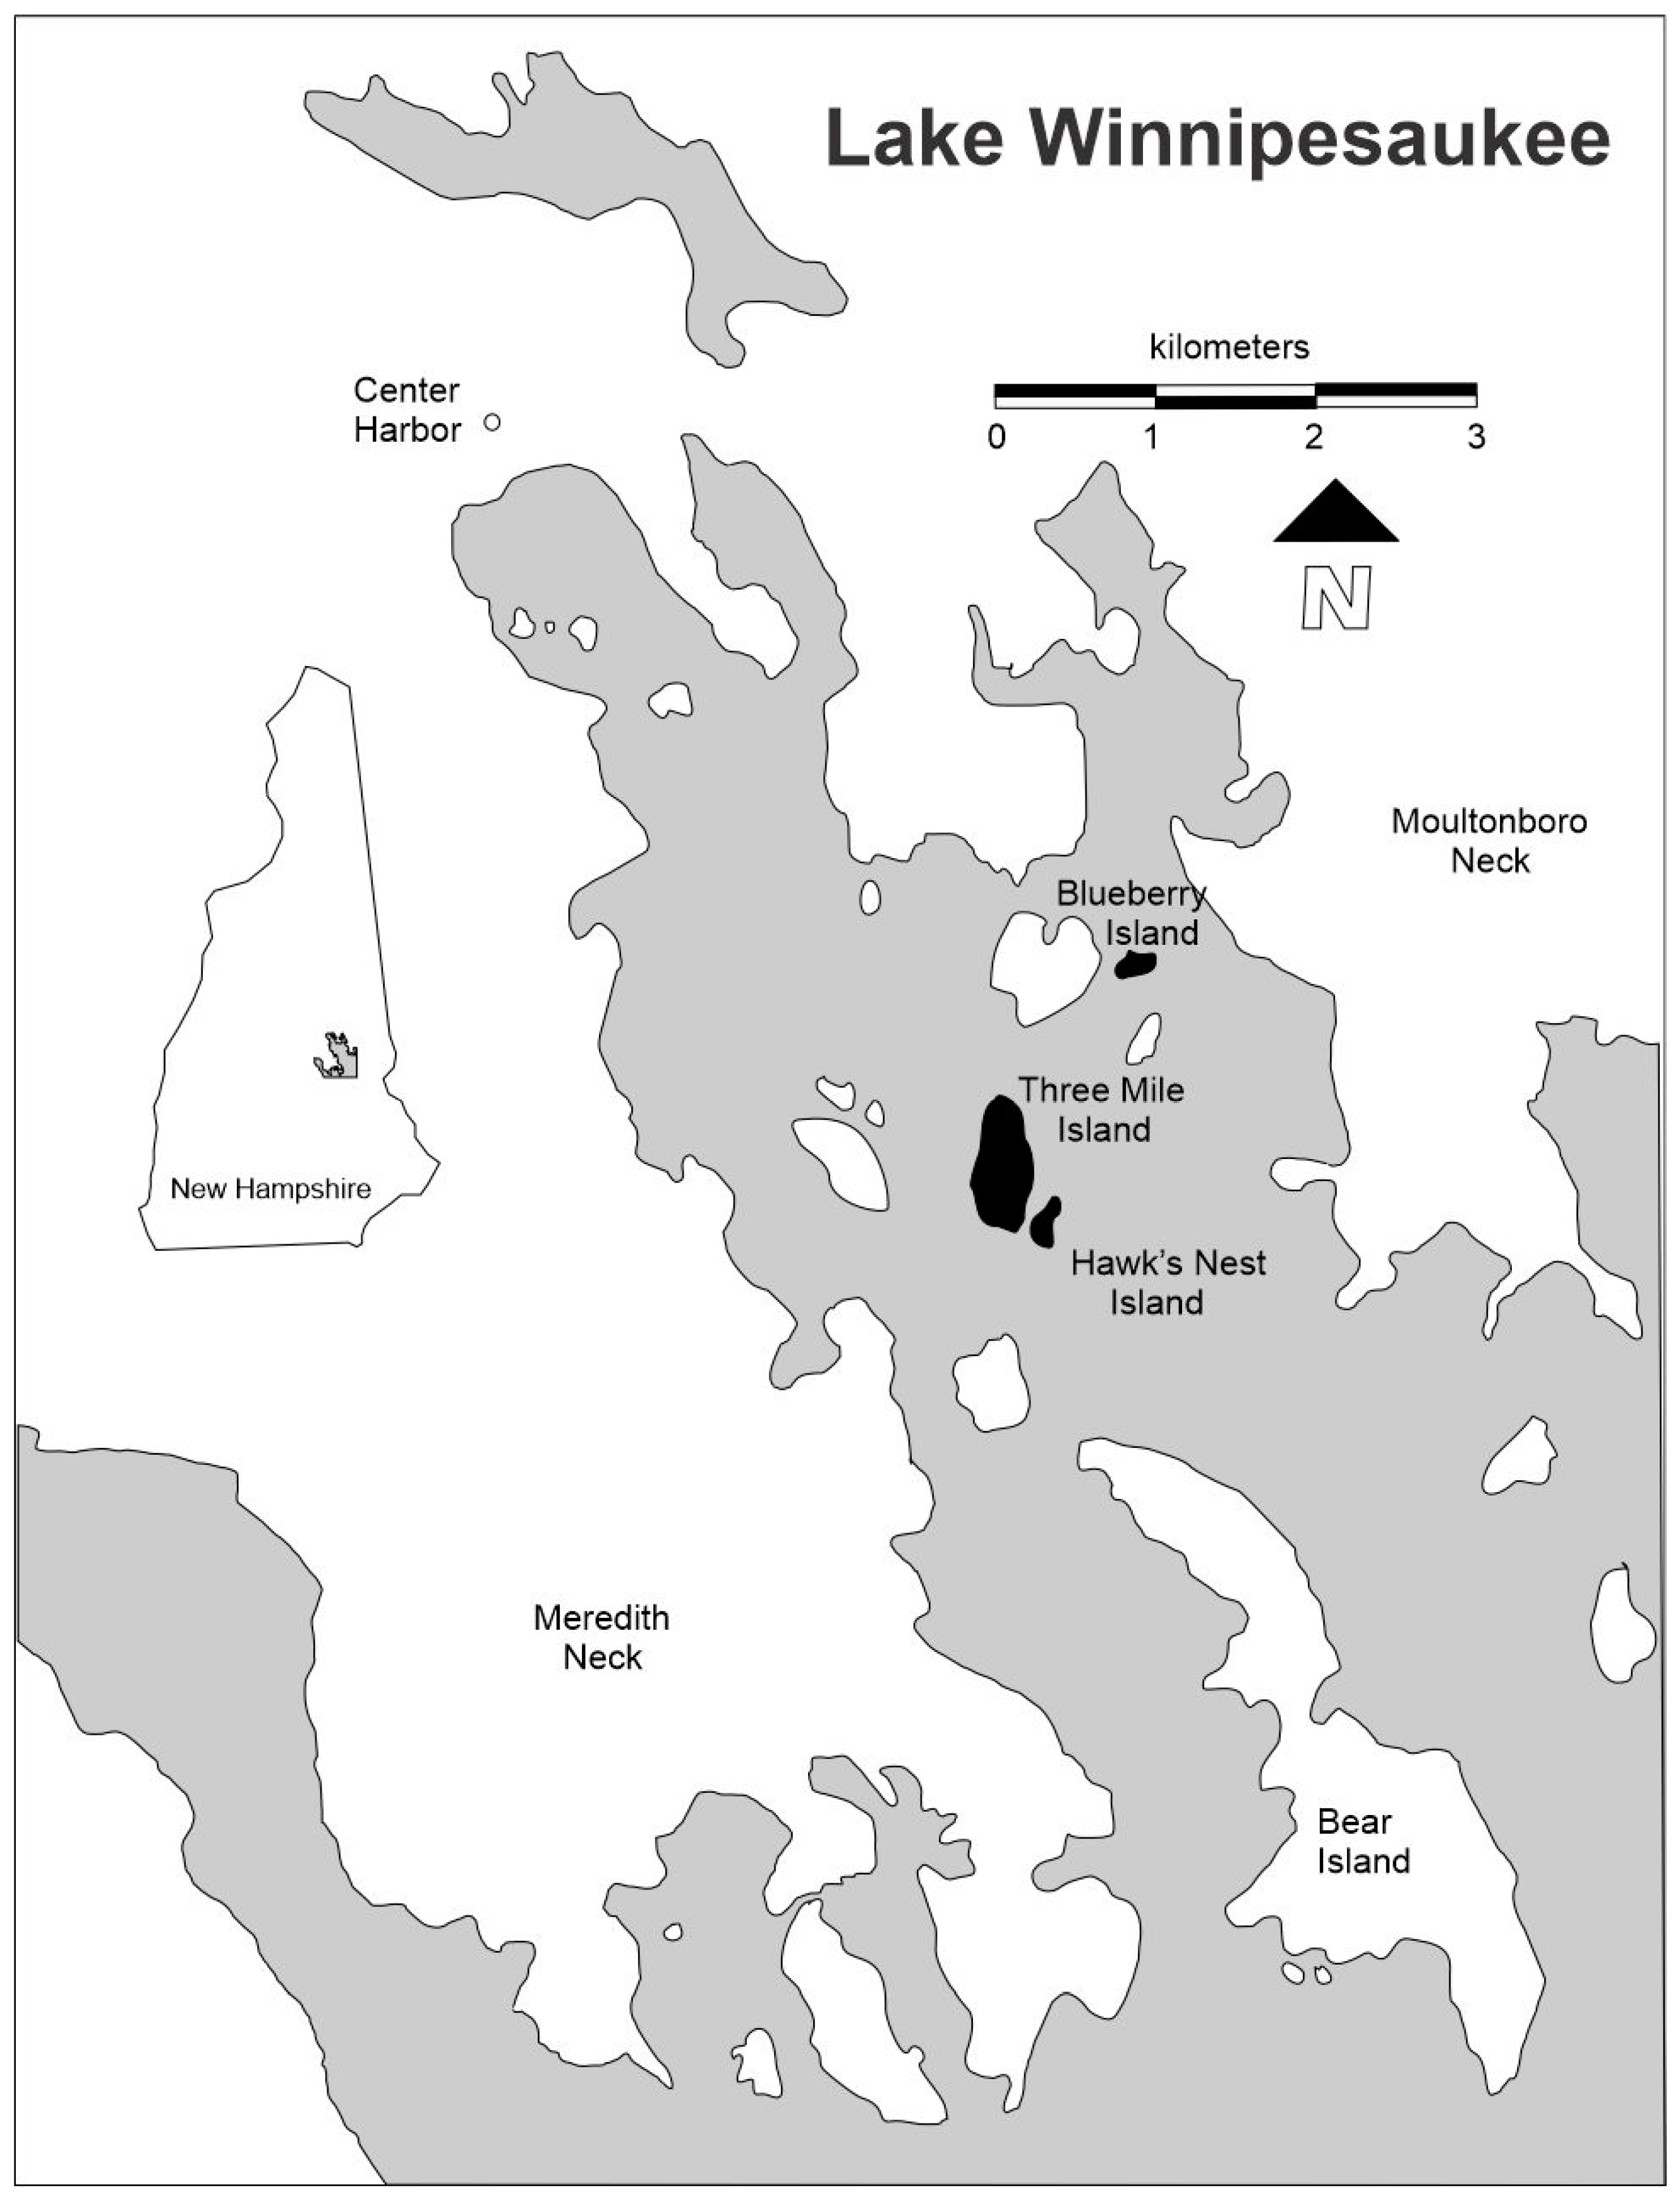
3.1. Three Mile Island
3.2. Hawk’s Nest Island
3.3. Blueberry Island
3.4. Richness, Evenness, and Diversity
4. Discussion
4.1. Succession
4.2. Role of Large Grazing Herbivores
4.3. Land Use and Forest Management
4.4. Biodiversity and Sustainability
5. Conclusions
Author Contributions
Funding
Acknowledgments
Conflicts of Interest
Appendix A
| Acanthaceae. |
| Justicia americana (L.) Vahl |
| Aceraceae |
| Acer pensylvanicum L. |
| Acer rubrum L. |
| Acer saccharum Marsh. |
| Anacardiaceae |
| Rhus typhina L. |
| Toxicodendron radicans (L.) Kuntze |
| Apocynaceae |
| Apocynum androsaemifolium L. |
| Aquifoliaceae |
| Ilex glabra (L.) A. Gray |
| Ilex mucronata (L.) Powell, Savolainen & Andrews |
| Ilex verticillata (L.) A. Gray |
| Araliaceae |
| Aralia nudicaulis L. |
| Asteraceae |
| Achillea millefolium L. |
| Antennaria howellii Greene ssp. canadensis (Greene) Bayer |
| Erigeron strigosus Muhl. ex Willd. |
| Eurybia divaricata (L.) G. L. Nesom |
| Eurybia macrophylla (L.) Cass. |
| Euthamia graminifolia (L.) Nutt. |
| Hieracium caespitosum Dumort. |
| Hieracium pilosella L. |
| Oclemena acuminata (Michx.) Greene |
| Prenanthes trifoliolata (Cass.) Fernald |
| Rudbeckia hirta L. var. pulcherrima Farw. |
| Solidago altissima L. |
| Solidago arguta Aiton |
| Solidago bicolor L. |
| Solidago caesia L. |
| Solidago juncea Aiton |
| Solidago nemoralis Aiton |
| Symphyotrichum lanceolatum (Willd.) G.L. Nesom |
| Symphyotrichum novi-belgii (L.) G.L. Nesom |
| Symphyotrichum puniceum (L.) A. Love & D. Love var. puniceum |
| Symphyotrichum undulatum (L.) G.L. Nesom |
| Taraxacum officinale F.H. Wigg. |
| Betulaceae |
| Alnus incana (L.) Moench ssp. rugosa (Du Roi) R.T. Clausen |
| Betula alleghaniensis Britton var. alleghaniensis |
| Betula lenta L. |
| Betula papyrifera Marsh. var. papyrifera |
| Betula populifolia Marsh. |
| Ostrya virginiana (Mill.) K. Koch |
| Caprifoliaceae |
| Diervilla lonicera Mill. |
| Lonicera canadensis W. Bartram ex Marsh. |
| Sambucus nigra L. ssp. canadensis (L.) R. Bolli |
| Viburnum acerifolium L. |
| Viburnum lentago L. |
| Viburnum nudum L. var cassinoides (L.) Torr. & A. Gray |
| Viburnum recognitum Fernald |
| Clusiaceae |
| Hypericum perforatum L. |
| Commelinaceae |
| Commelina communis L. |
| Cornaceae |
| Cornus rugosa Lam. |
| Nyssa sylvatica Marsh. |
| Cupressaceae |
| Juniperus communis L. var. depressa Pursh |
| Cyperaceae |
| Carex argyrantha Tuck. |
| Carex communis L.H. Bailey var. communis |
| Dennstaedtiaceae |
| Dryopteris clintoniana (D.C. Eaton) Dowell |
| Dryopteris intermedia (Muhl. ex Willd.) A. Gray |
| Dryopteris marginalis (L.) A. Gray |
| Polystichum acrostichoides (Michx.) Schott. var. acrostichoides |
| Ericaceae |
| Arctostaphylos uva-ursi (L.) Spreng. |
| Gaultheria procumbens L. |
| Gaylussacia baccata (Wangenh.) K. Koch |
| Kalmia angustifolia L. |
| Lyonia ligustrina (L.) DC. |
| Rhododendron canadense (L.) Torr |
| Rhododendron maximum L. |
| Vaccinium angustifolium Aiton |
| Vaccinium corymbosum L. |
| Vaccinium fuscatum Aiton |
| Fabaceae |
| Robinia hispida L. |
| Trifolium aureum Pollich |
| Fagaceae |
| Fagus grandifolia Ehrh. |
| Quercus alba L. |
| Quercus rubra L. |
| Hamamelidaceae |
| Hamamelis virginiana L. |
| Juncaceae |
| Luzula multiflora (Ehrh.) Lej. |
| Lamiaceae |
| Mentha arvensis L. |
| Liliaceae |
| Lilium philadelphicum L. |
| Maianthemum canadense Desf. |
| Maianthemum racemosum (L.) Link ssp. racemosum |
| Medeola virginiana L. |
| Polygonatum biflorum (Walter) Elliott var. biflorum |
| Polygonatum pubescens (Willd.) Pursh |
| Streptopus amplexifolius (L.) DC. |
| Lycopodiaceae |
| Dendrolycopodium obscurum (L.) A. Haines |
| Lycopodium complanatum L. |
| Monotropaceae |
| Monotropa uniflora L. |
| Myricaceae |
| Comptonia peregrina (L.) J.M. Coult. |
| Myrica gale L. |
| Oleaceae |
| Fraxinus americana L. |
| Fraxinus nigra Marsh. |
| Orchidaceae |
| Cypripedium acaule Aiton |
| Goodyera pubescens (Willd.) R. Br. |
| Orobanchaceae |
| Epifagus virginiana (L.) W.P.C. Barton |
| Osmundaceae |
| Osmunda cinnamomea L. |
| Osmunda regalis L. |
| Oxalidaceae |
| Oxalis stricta L. |
| Pinaceae |
| Picea rubens Sarg. |
| Pinus resinosa Aiton |
| Pinus strobus L. |
| Tsuga canadensis (L.) Carriere |
| Plantaginaceae |
| Plantago major L. |
| Poaceae |
| Dactylis glomerata L. |
| Dichanthelium boreale (Nash) Freckmann |
| Poa pratensis L.ssp. pratensis |
| Schedonorus pratensis (Huds.) P. Beauv. |
| Polypodiaceae |
| Polypodium virginianum L. |
| Primulaceae |
| Lysimachia quadrifolia L. |
| Trientalis borealis Raf. |
| Pyrolaceae |
| Chimaphila maculata (L.) Pursh |
| Ranunculaceae |
| Coptis trifolia (L.) Salisb. |
| Rosaceae |
| Amelanchier laevis Wiegand |
| Aronia melanocarpa (Michx.) Elliott |
| Fragaria vesca ssp. americana (Porter) Staudt |
| Prunus pensylvanica L. f. var. pensylvanica |
| Prunus serotina Ehrh. |
| Rosa palustris Marsh. |
| Rubus allegheniensis Porter |
| Rubus hispidus L. |
| Spiraea alba Du Roi var. latifolia (Aiton) Dippel |
| Rubiaceae |
| Cephalanthus occidentalis L. |
| Galium tinctorium (L.) Scop. |
| Mitchella repens L. |
| Salicaceae |
| Populus grandidentata Michx. |
| Populus tremuloides Michx. |
| Scrophulariaceae |
| Lindernia dubia (L.) Pennell |
| Melampyrum lineare Desr. |
| Styraceae |
| Halesia carolina L. |
| Tiliaceae |
| Tilia americana L. |
| Violaceae |
| Viola blanda Willd. var. palustriformis A. Gray |
| Viola renifolia A. Gray |
| Vitaceae |
| Parthenocissus quinquefolia (L.) Planch. |
References
- Lubchenco, J.; Olson, A.M.; Brubaker, L.B.; Carpenter, S.R.; Holland, M.M.; Hubbell, S.P.; Levin, S.A.; MacMahon, J.A.; Matson, P.A.; Melillo, J.M.; et al. The sustainable biosphere initiative: An ecological research agenda. Ecology 1991, 72, 371–412. [Google Scholar] [CrossRef]
- Huntley, B.J.; Ezcurra, E.; Fuentes, E.R.; Fujii, K.; Grubb, P.J.; Haber, W.; Harger, J.R.E.; Holland, M.M.; Levin, S.A.; Lubchenco, J.; et al. A sustainable biosphere: The global imperative. Ecol. Int. 1991, 20, 1–15. [Google Scholar]
- Holland, M.M.; Sorrie, B.A. Floristic dynamics of a small island complex in Lake Winnipesaukee, New Hampshire. Rhodora 1989, 91, 315–338. [Google Scholar]
- Holland, M.M.; Clapham, W.M. Vegetation changes in temperate forested island communities in Lake Winnipesaukee, New Hampshire, USA. Rhodora 2012, 114, 383–405. [Google Scholar] [CrossRef]
- Holland, M.M.; Winkler, M. Vegetation changes in tree and shrub species in forested island communities in Lake Winnipesaukee, New Hampshire, USA. Int. J. Biodivers Endanger. Species 2018, IJBES-104. [Google Scholar] [CrossRef]
- O’Sullivan, D. Chemical and Physical Analysis of Soil from Three Mile Island in Lake Winnipesaukee; N.H. Senior Seminar Paper; Biology Department, College of New Rochelle: New Rochelle, NY, USA, 1981. [Google Scholar]
- Kelsey, H.P. Reports of the Councilors for the autumn of 1901: Natural History. Appalachia 1902, 10, 75–79. [Google Scholar]
- Maciejowski, J.D.; Clapham, W.M.; Holland, M.M. Environmental assessment begins at Three Mile Island Camp. Appalachia 1981, 43, 137–142. [Google Scholar]
- Clapham, W.M.; Holland, M.M.; Maciejowski, J.D. Botanical surveys reveal effects of land-use plans at Three Mile Island Camp. Appalachia 2010, 62, 138–140. [Google Scholar]
- Odum, E.P. Strategy of ecosystem development. Science 1969, 164, 262–270. [Google Scholar] [CrossRef] [Green Version]
- Pease, A.S. List of plants on Three Mile Island: Pteridophyta and Spermatophyta. Appalachia 1911, 12, 266–276. [Google Scholar]
- Hartmann, E. The flora of Three Mile Island. Appalachia 1941, 23, 560–563. [Google Scholar]
- Berry, W.H. A Floristic Study of Rattlesnake Island, Lake Winnipesaukee, New Hampshire. Master’s Thesis, University of New Hampshire, Durham, NH, USA, 1966. [Google Scholar]
- Jackson, N.J. A Floristic Study of Bear Island, Lake Winnipesaukee, New Hampshire. Master’s Thesis, University of New Hampshire, Durham, NH, USA, 1969. [Google Scholar]
- Bradley, A.F. The Flora and Vegetation of Timber Island, Lake Winnipesaukee, New Hampshire. Master’s Thesis, University of New Hampshire, Durham, NH, USA, 2005. [Google Scholar]
- Bradley, A.F.; Crow, G. The Flora and Vegetation of Timber Island, Lake Winnipesaukee, New Hampshire, USA. Rhodora 2010, 112, 156–190. [Google Scholar] [CrossRef]
- MacArthur, R.; Wilson, E.O. The Importance of Islands. In The Theory of Island Biogeography; Princeton University Press: Princeton, NJ, USA, 1967. [Google Scholar]
- D’Antonio, C.M.; Dudley, T.L. Biological Invasions as Agents of Change on Islands Versus Mainlands. In Islands: Ecological Studies (Analysis and Synthesis); Vitousek, P.M., Loope, L.L., Adserson, H., Eds.; Springer: Berlin/Heidelberg, Germany, 1995; Volume 115, pp. 103–121. [Google Scholar]
- Holland, M.M.; Clapham, W.M.; Maciejowski, J.D. Volunteer success in natural resource management at an Appalachian Mountain Club Camp in New Hampshire. In Proceedings of the Volunteers in the Backcountry Conference, 2–4 October 1981; Merrill, A.A., Ed.; U.S. Forest Service: Durham, NH, USA, 1982; pp. 162–170. [Google Scholar]
- Briggs, F.; Davis, T.; Holland, M.M. Assessment of Vegetation Changes at Lake Winnipesaukee in New Hampshire. In Proceedings of the Sigma Xi Annual Poster Conference on 16 April 2008, Univ. Mississippi, University, MS. Sigma Xi; The Scientific Research Society: Research Triangle Park, NC, USA, 2008. [Google Scholar]
- Orwig, D.A.; Foster, D.R. Stand, landscape, and ecosystem analyses of Hemlock Woolly Adelgid outbreaks in southern New England: An overview. J. Biogeogr. 2002, 10, 1475–1487. [Google Scholar] [CrossRef] [Green Version]
- USDA Forest Service. An Exotic Pest Threat to Eastern Hemlock: An Initiative for Management of Hemlock Wooly Adelgid. USDA Forest Service, Northeastern Area, Newtown Square, PA. 2005. Available online: http://www.na.fs.fed.us/hwa/pubs/other_info/hwa_mgt_plan.pdf (accessed on 1 October 2012).
- USDA Forest Service. Pest Alert: Hemlock Wooly Adelgid. USDA Forest Service, Northeastern Area, Newtown Square, PA. 2005. Available online: www.na.fs.fed.us/spfo/Pubs/pest_al/hemlock/hwa05.htm (accessed on 5 November 2011).
- Gilman, E.F.; Watson, D.G. Fagus grandifolia. Food and Agricultural Sciences. Fact Sheet ST 1993, 243, 1–4. [Google Scholar]
- Houston, D.R. Major new tree epidemics: Beech bark disease. Annu. Rev. Phytopathol. 1994, 32, 75–87. [Google Scholar] [CrossRef]
- Haines, A. Flora Novae Angliae; Yale University Press: New Haven, CT, USA, 2011. [Google Scholar]
- USDA NRCS. 2011–2020; The Plants Database; National Plant Data Center: Baton Rouge, LA, USA. Available online: http://plants.usda.gov (accessed on 31 August 2020).
- Holland, M.M.; Burk, C.J.; McLain, D. Long-term vegetation dynamics of the lower strata of a western Massachusetts oxbow swamp forest. Rhodora 2000, 102, 154–174. [Google Scholar]
- Colwell, R.K. EstimateS: Statistical Estimation of Species Richness and Shared Species from Samples. Version 8.2. User’s Guide and Application. 2009. Available online: http://purl.oclc.org/estimates (accessed on 3 September 2011).
- Efron, B.; Tibshirani, R.J. An Introduction to the Bootstrap; CRC Press: New York, NY, USA, 1993. [Google Scholar]
- Efron, B.; Tibshirani, R.J. An Introduction to the Bootstrap. Monographs on Statistics and Applied Probability 57; CRC Press: Boca Raton, FL, USA, 1998. [Google Scholar]
- Clapham, W.M.; Holland, M.M.; Fedders, J. Relationship of biodiversity and land use in forested plots in New Hampshire, USA. Poster #52–121, session: Temperate Forest Habitats. In Proceedings of the ESA Annual Meeting, Albuquerque, NM, USA, 3–5 August 2009; Ecological Society of America: Washington, DC, USA, 2009. [Google Scholar]
- Holland, M.M.; Clapham, W.M.; Winkler, M. Maturation of forested island vegetation in Lake Winnipesaukee, NH. Poster #52–121, session: Temperate Forest Habitats. In Proceedings of the ESA Annual Meeting, Minneapolis, MN, USA, 4–6 August 2013; Ecological Society of America: Washington, DC, USA, 2013. [Google Scholar]
- Winkler, M.G. Survey of the Native and Nonnative Vascular Plant Species of Three Islands in Lake Winnipesaukee, New Hampshire. Master’s Thesis, University of Mississippi, Oxford, MS, USA, 2012. [Google Scholar]
- Cogbill, C.V.; Burk, J.S.; Motzkin, G. The forests of presettlement New England, USA: Spatial and compositional patterns based on town proprietor surveys. J. Biogeogr. 2002, 29, 1279–1304. [Google Scholar] [CrossRef] [Green Version]
- Rogovin, L.S. A History of Three Mile Island Camp; Three Mile Island Camp: Meredith, NH, USA, 1983. [Google Scholar]
- Klynge, D.; Scenning, J.C.; Skov, F. Floristic changes in the understory vegetation of a managed forest in Denmark over a period of 23 years—Possible drivers of change and implications for nature and biodiversity conservation. For. Ecol. Manag. 2020, 466, 118128. [Google Scholar] [CrossRef]
- Gamborg, C.; Larsen, J.B. ‘Back to nature’—A sustainable future for forestry? For. Ecol. Manag. 2003, 179, 559–571. [Google Scholar] [CrossRef]
- Sorte, C.J.B.; Davidson, V.E.; Franklin, M.C.; Benes, K.M.; Doellman, M.M.; Etter, R.J.; Hannigan, R.E.; Lubchenco, J.; Menge, B.A. Long-term declines in an intertidal foundation species parallel shifts in community composition. Glob. Change Biol. 2016. [Google Scholar] [CrossRef] [Green Version]
- Newbold, T.; Hudson, L.N.; Arnell, A.P.; Contu, S.; DePalma, A.; Ferrier, S.; Hill, S.L.L.; Hoskins, A.J.; Lysenko, I.; Phillips, H.R.P.; et al. Has land use pushed terrestrial biodiversity beyond the planetary boundary? A global assessment. Science 2016, 353, 288–291. [Google Scholar] [CrossRef] [PubMed]
- Tittensor, D.P.; Walpole, M.; Hill, S.L.L.; Boyce, D.G.; Britten, G.L.; Burgess, N.D.; Butchart, S.H.M.; Leadley, P.W.; Regan, E.C.; Alkemade, R.; et al. A mid-term analysis of progress toward international biodiversity targets. Science 2014, 345, 241–244. [Google Scholar] [CrossRef] [PubMed]
- Lubchenco, J.; Cerny-Chipman, E.B.; Reimer, J.N.; Levin, S.A. The right incentives enable ocean sustainability successes and provide hope for the future. Proc. Natl. Acad. Sci. USA 2016, 113, 14507–14514. [Google Scholar] [CrossRef] [PubMed] [Green Version]


| Importance | Values | ||
|---|---|---|---|
| Species | TMI | HNI | BI |
| Acer pensylvanicum | 11.400 | 3.150 | 0.000 |
| Acer rubrum | 9.060 | 9.284 | 9.845 |
| Acer saccharum | 1.091 | 0.0 | 0.0 |
| Achillea millefolium | 0.334 | 0.0 | 0.0 |
| Alnus incana ssp. rugosa | 0.00 | 0.0 | 6.543 |
| Amelanchier laevis | 1.027 | 7.180 | 0.0 |
| Apocynum androsaemifolium | 0.00 | 0.0 | 3.061 |
| Aralia nudicaulis | 22.560 | 3.611 | 0.0 |
| Aronia melanocarpa | 0.923 | 6.050 | 0.0 |
| Betula alleghaniensis var. alleghaniensis | 1.552 | 0.0 | 0.0 |
| Betula papyrifera | 2.022 | 10.498 | 0.0 |
| Betula populifolia | 1.035 | 0.0 | 0.0 |
| Comptonia peregrina | 0.748 | 0.0 | 0.0 |
| Coptis trifolia | 0.390 | 0.0 | 0.0 |
| Cornus rugosa | 0.478 | 0.0 | 0.0 |
| Cypripedium acaule | 1.123 | 0.0 | 0.0 |
| Dactylis glomerata | 0.669 | 0.0 | 0.0 |
| Dryopteris clintoniana | 0.430 | 0.0 | 0.0 |
| Erigeron strigosus | 0.653 | 0.0 | 0.0 |
| Eurybia divaricata | 0.334 | 0.0 | 0.0 |
| Eurybia macrophylla | 1.218 | 0.0 | 0.0 |
| Euthamia graminifolia | 0.326 | 0.0 | 0.0 |
| Fagus grandifolia | 12.992 | 0.0 | 0.0 |
| Fragaria vesca ssp. americana | 0.581 | 0.0 | 0.0 |
| Gaultheria procumbens | 3.073 | 49.677 | 16.042 |
| Gaylussacia baccata | 11.917 | 29.061 | 39.356 |
| Goodyera pubescens | 0.334 | 3.025 | 0.0 |
| Hamamelis virginiana | 10.269 | 0.0 | 0.0 |
| Hieracium caespitosum | 1.035 | 0.0 | 0.0 |
| Ilex glabra | 0.00 | 0.0 | 3.061 |
| Ilex verticillata | 0.740 | 0.0 | 0.0 |
| Justicia americana | 0.326 | 7.713 | 0.0 |
| Kalmia angustifolia | 0.366 | 0.0 | 9.912 |
| Lindernia dubia | 0.00 | 0.0 | 3.001 |
| Lonicera canadensis | 1.624 | 0.0 | 0.0 |
| Lycopodium obscurum | 0.326 | 0.0 | 0.0 |
| Lyonia ligustrina | 0.00 | 0.0 | 3.482 |
| Lysimachia quadrifolia | 0.342 | 7.222 | 3.001 |
| Maianthemum canadense | 14.106 | 3.025 | 3.001 |
| Maianthemum racemosum ssp. racemosum | 1.417 | 0.0 | 0.0 |
| Medeola virginiana | 2.890 | 3.067 | 0.0 |
| Melampyrum lineare | 1.330 | 0.0 | 8.346 |
| Mentha arvensis | 0.326 | 0.0 | 0.0 |
| Mitchella repens | 3.638 | 3.946 | 0.0 |
| Nyssa sylvatica | 0.446 | 0.0 | 3.302 |
| Osmunda cinnamomea | 1.114 | 0.0 | 0.0 |
| Osmunda regalis | 0.334 | 0.0 | 0.0 |
| Ostrya virginiana | 4.323 | 0.0 | 0.0 |
| Oxalis stricta | 0.326 | 0.0 | 0.0 |
| Parthenocissus quinquefolia | 0.486 | 0.0 | 0.0 |
| Pinus strobus | 6.998 | 3.109 | 3.001 |
| Plantago major | 0.00 | 0.0 | 4.143 |
| Polygonatum biflorum | 0.430 | 0.0 | 0.0 |
| Polygonatum pubescens | 0.470 | 0.0 | 0.0 |
| Populus grandidentata | 0.350 | 0.0 | 0.0 |
| Prenanthes trifoliolata | 1.783 | 0.0 | 0.0 |
| Prunus serotina | 0.326 | 0.0 | 0.0 |
| Pteridium aquilinum | 9.983 | 5.034 | 0.0 |
| Quercus alba | 0.00 | 6.008 | 0.0 |
| Quercus rubra | 4.642 | 0.0 | 0.0 |
| Robinia hispida | 0.414 | 0.0 | 0.0 |
| Rosa palustris | 0.00 | 0.0 | 4.143 |
| Rubus hispidus | 0.828 | 0.0 | 0.0 |
| Schedonorus pratensis | 1.330 | 0.0 | 0.0 |
| Solidago altissima | 0.334 | 0.0 | 0.0 |
| Solidago caesia | 0.334 | 0.0 | 3.121 |
| Solidago juncea | 0.326 | 0.0 | 0.0 |
| Solidago nemoralis | 0.828 | 0.0 | 10.273 |
| Streptopus amplexifolius | 1.895 | 0.0 | 3.182 |
| Symphyotrichum puniceum var. puniceum | 0.350 | 0.0 | 0.0 |
| Symphyotrichum undulatum | 0.326 | 0.0 | 0.0 |
| Taraxacum officinale | 0.00 | 0.0 | 5.345 |
| Tilia Americana | 0.724 | 0.0 | 0.0 |
| Toxicodendron radicans | 0.462 | 3.192 | 0.0 |
| Trientalis borealis | 6.894 | 3.192 | 3.001 |
| Trifolium aureum | 0.326 | 3.276 | 0.0 |
| Tsuga Canadensis | 12.036 | 18.524 | 11.107 |
| Vaccinium angustifolium | 6.735 | 6.122 | 16.396 |
| Vaccinium corymbosum | 0.541 | 0.0 | 3.001 |
| Vaccinium fuscatum | 0.00 | 5.034 | 21.331 |
| Viburnum acerifolium | 7.619 | 0.0 | 0.0 |
| Viola blanda var. palustriformis | 0.342 | 0.0 | 0.0 |
| Total | 200.00 | 200.00 | 200.00 |
| 2011 | 2001 | 1991 | 1978 | |
| TMI | Aralia nudicaulis [22.6] | Aralia nudicaulis | Aralia nudicaulis | Acer pensylvanicum |
| Maianthemum canadense [14.1] | Fagus grandifolia | Gaylussacia baccata | Aralia nudicaulis | |
| Fagus grandifolia [12.9] | Gaylussacia baccata | Maianthemum canadense | Gaylussacia baccata | |
| Tsuga canadensis [12.0] Gaylussacia baccata [11.9] | Hamamelis virginiana | Pteridium aquilinum | Pteridium aquilinum | |
| Pteridium aquilinum | Vaccinium angustifolium | Vaccinium angustifolium | ||
| Hawk’s | Gaultheria procumbens [50] | Gaylussacia baccata | Gaylussacia baccata | Aralia nudicaulis |
| Nest | Gaylussacia baccata [29.0] | Pinus strobus | Kalmia angustifolia | Gaylussacia baccata |
| Tsuga Canadensis [19] | Vaccinium angustifolium | Vaccinium angustifolium | Vaccinium corymbosum | |
| Blueberry | Gaylussacia baccata [39.4] | Gaylussacia baccata | Gaylussacia baccata | Cephalanthus occidentalus |
| Vaccinium fuscatum [21.3] | Ilex verticillata | Myrica gale | Vaccinium angustifolium | |
| Vaccinium angustifolium [16.4] | Myrica gale | Vaccinium angustifolium | Vaccinium corymbosum | |
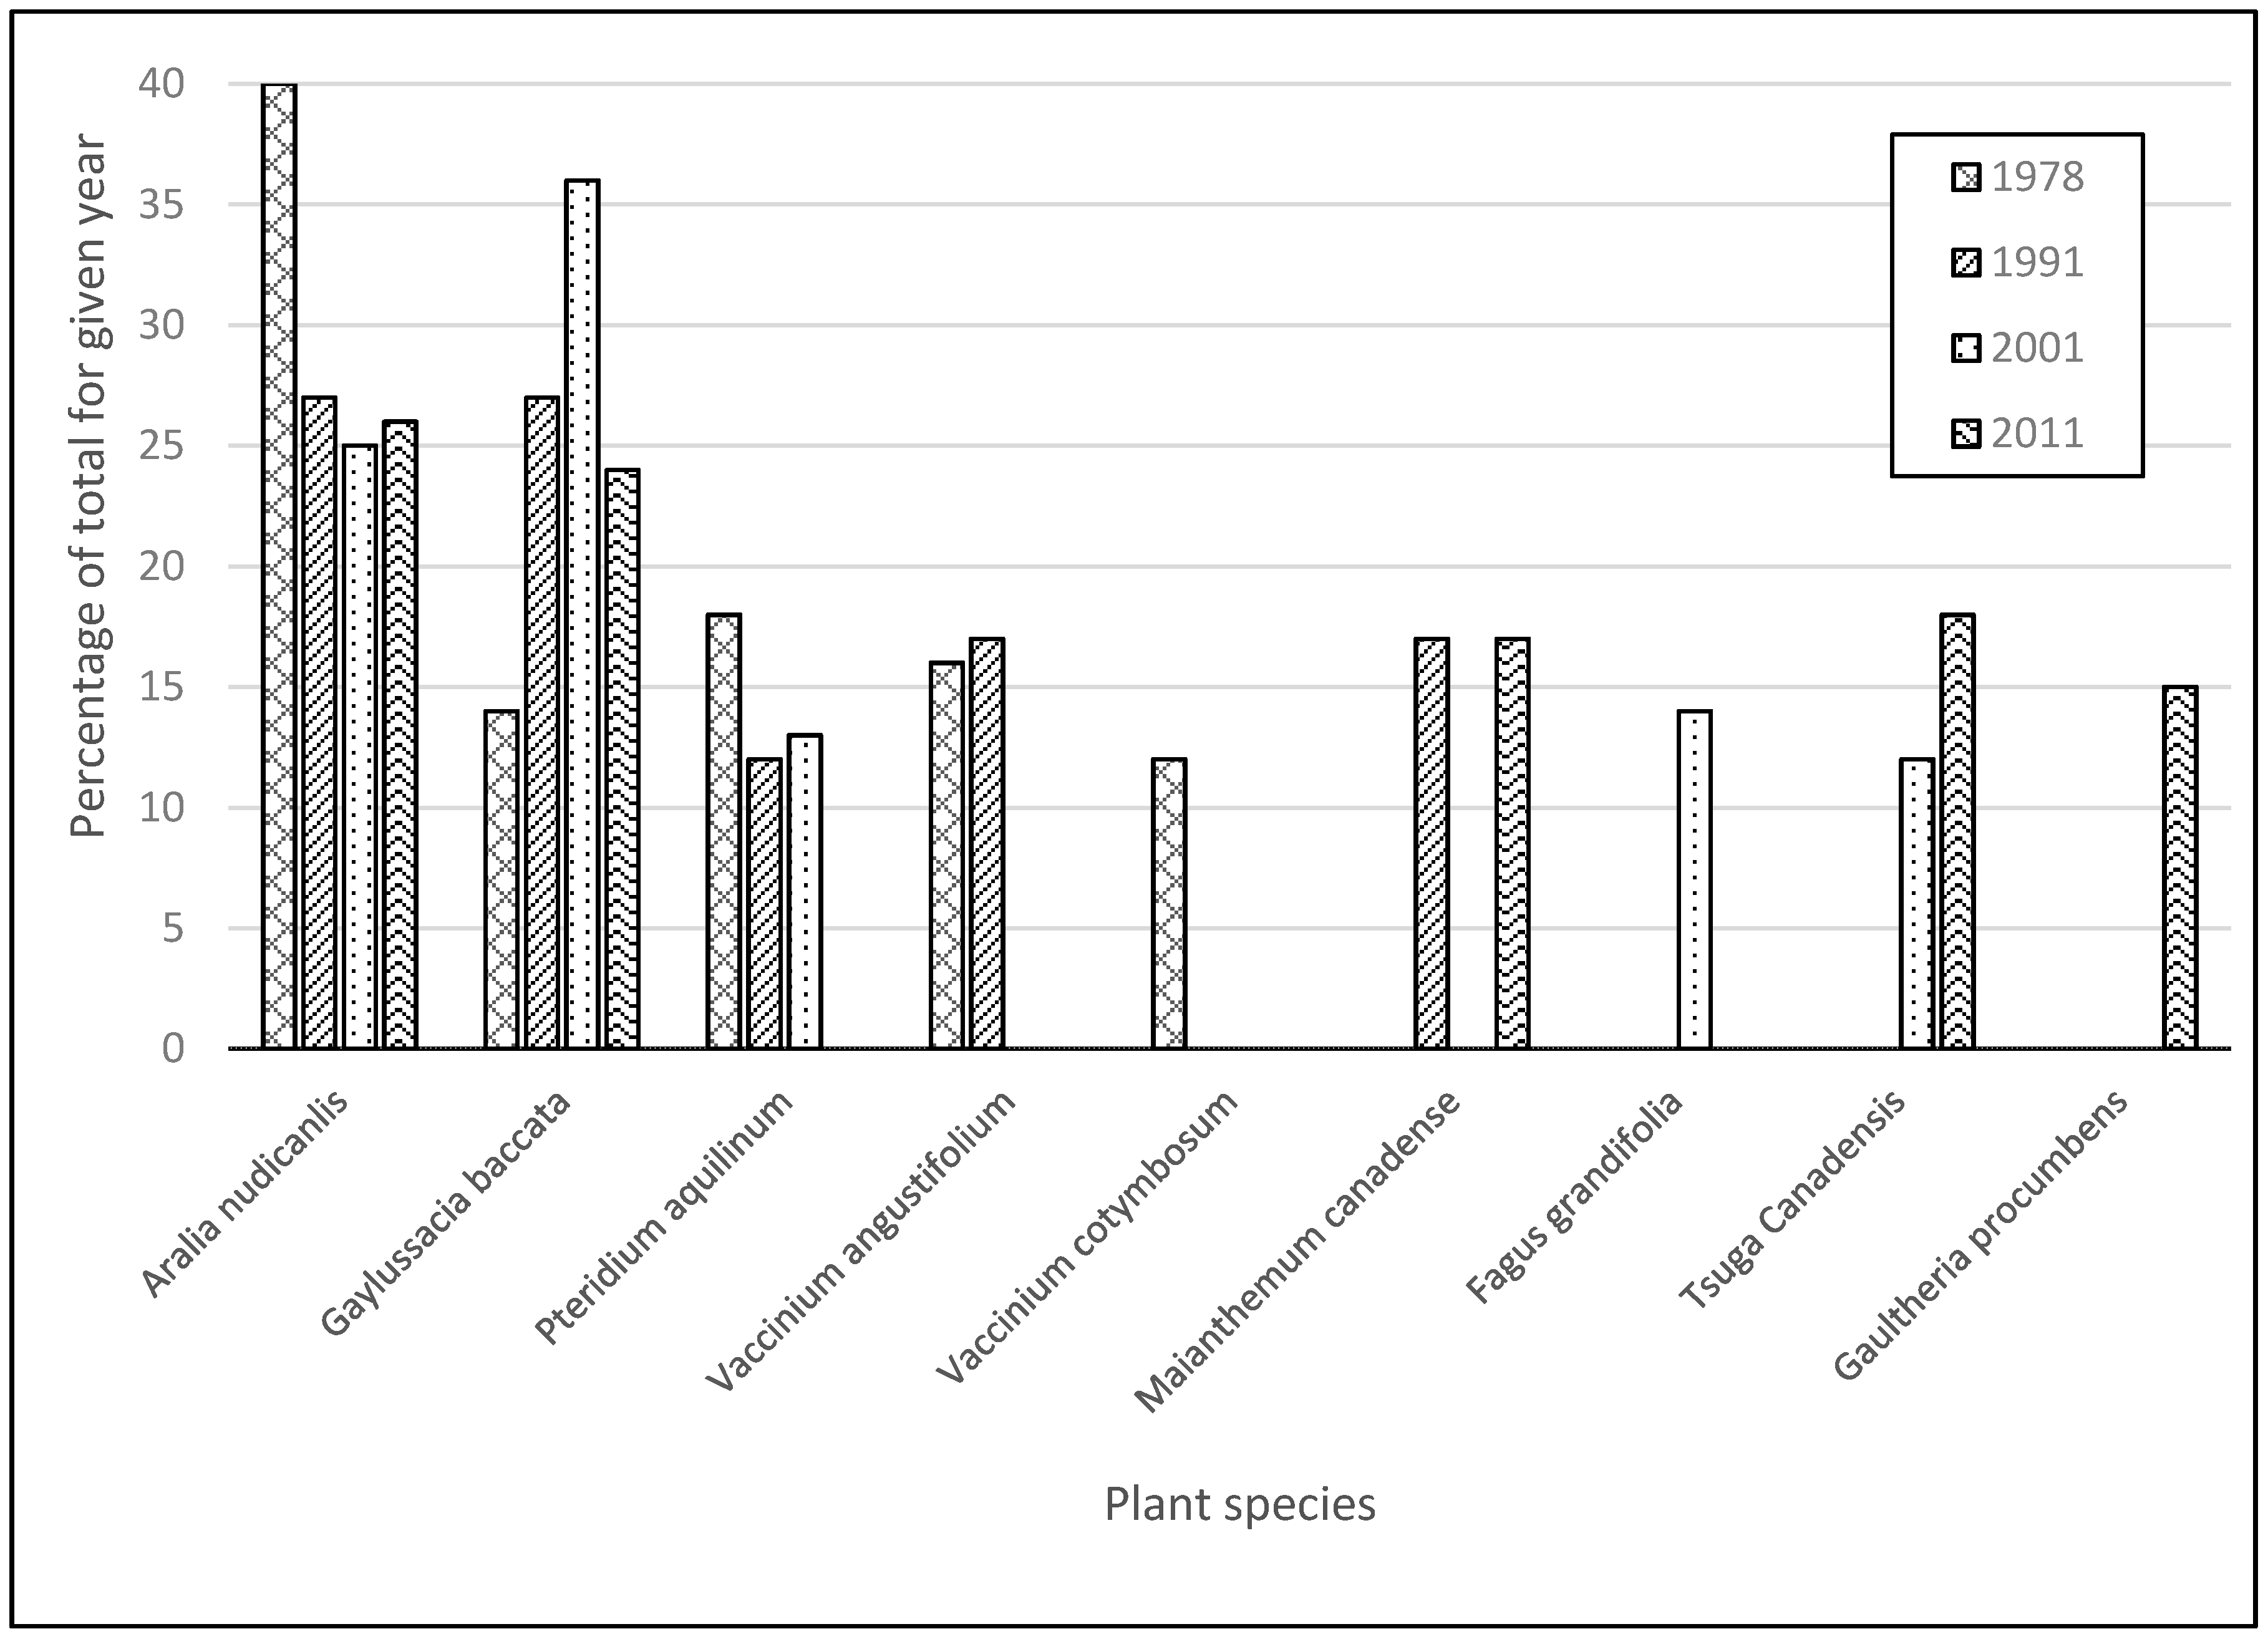
| All Islands | Aralia nudicaulis [26] | Gaylussacia baccata [36] | Aralia nudicaulis [27] | Aralia nudicaulis [40] |
| Gaylussacia baccata [24] | Aralia nudicaulis [25] | Gaylussacia baccata [27] | Pteridium aquilinum [18] | |
| Tsuga canadensis [18] | Fagus grandifolia [14] | Maianthemum canadense [17] | Vaccinium angustifolium [16] | |
| Maianthemum canadense [17] | Pteridium aquilinum [13] | Vaccinium angustifolium | Gaylussacia baccata | |
| Gaultheria procumbens [15] | [17] | [14] | ||
| Tsuga canadensis [12] | Pteridium aquilinum [12] | Vaccinium corymbosum | ||
| [12] |
| Island | Year | Species | Evenness | Shannon |
|---|---|---|---|---|
| All | 1978 | 41 | 0.74 | 2.76 |
| All | 1991 | 81 | 0.74 | 3.27 |
| All | 2001 | 75 | 0.76 | 3.29 |
| All | 2011 | 83 | 0.76 | 3.37 |
| Three Mile | 1978 | 35 | 0.72 | 2.56 |
| Three Mile | 1991 | 69 | 0.74 | 3.15 |
| Three Mile | 2001 | 64 | 0.78 | 3.23 |
| Three Mile | 2011 | 73 | 0.76 | 3.27 |
| Hawk’s Nest | 1978 | 15 | 0.66 | 1.78 |
| Hawk’s Nest | 1991 | 20 | 0.67 | 2.00 |
| Hawk’s Nest | 2001 | 28 | 0.72 | 2.41 |
| Hawk’s Nest | 2011 | 23 | 0.70 | 2.19 |
| Blueberry | 1978 | 8 | 0.79 | 1.64 |
| Blueberry | 1991 | 27 | 0.80 | 2.64 |
| Blueberry | 2001 | 23 | 0.70 | 2.19 |
| Blueberry | 2011 | 25 | 0.78 | 2.52 |
Publisher’s Note: MDPI stays neutral with regard to jurisdictional claims in published maps and institutional affiliations. |
© 2020 by the authors. Licensee MDPI, Basel, Switzerland. This article is an open access article distributed under the terms and conditions of the Creative Commons Attribution (CC BY) license (http://creativecommons.org/licenses/by/4.0/).
Share and Cite
Holland, M.M.; Winkler, M. Floristic Changes in the Understory Vegetation of Mixed Temperate New England Freshwater Island Forests over a Period of 33 Years. Plants 2020, 9, 1600. https://doi.org/10.3390/plants9111600
Holland MM, Winkler M. Floristic Changes in the Understory Vegetation of Mixed Temperate New England Freshwater Island Forests over a Period of 33 Years. Plants. 2020; 9(11):1600. https://doi.org/10.3390/plants9111600
Chicago/Turabian StyleHolland, Marjorie M., and Mark Winkler. 2020. "Floristic Changes in the Understory Vegetation of Mixed Temperate New England Freshwater Island Forests over a Period of 33 Years" Plants 9, no. 11: 1600. https://doi.org/10.3390/plants9111600