Potassium Application Boosts Photosynthesis and Sorbitol Biosynthesis and Accelerates Cold Acclimation of Common Plantain (Plantago major L.)

 , , , and
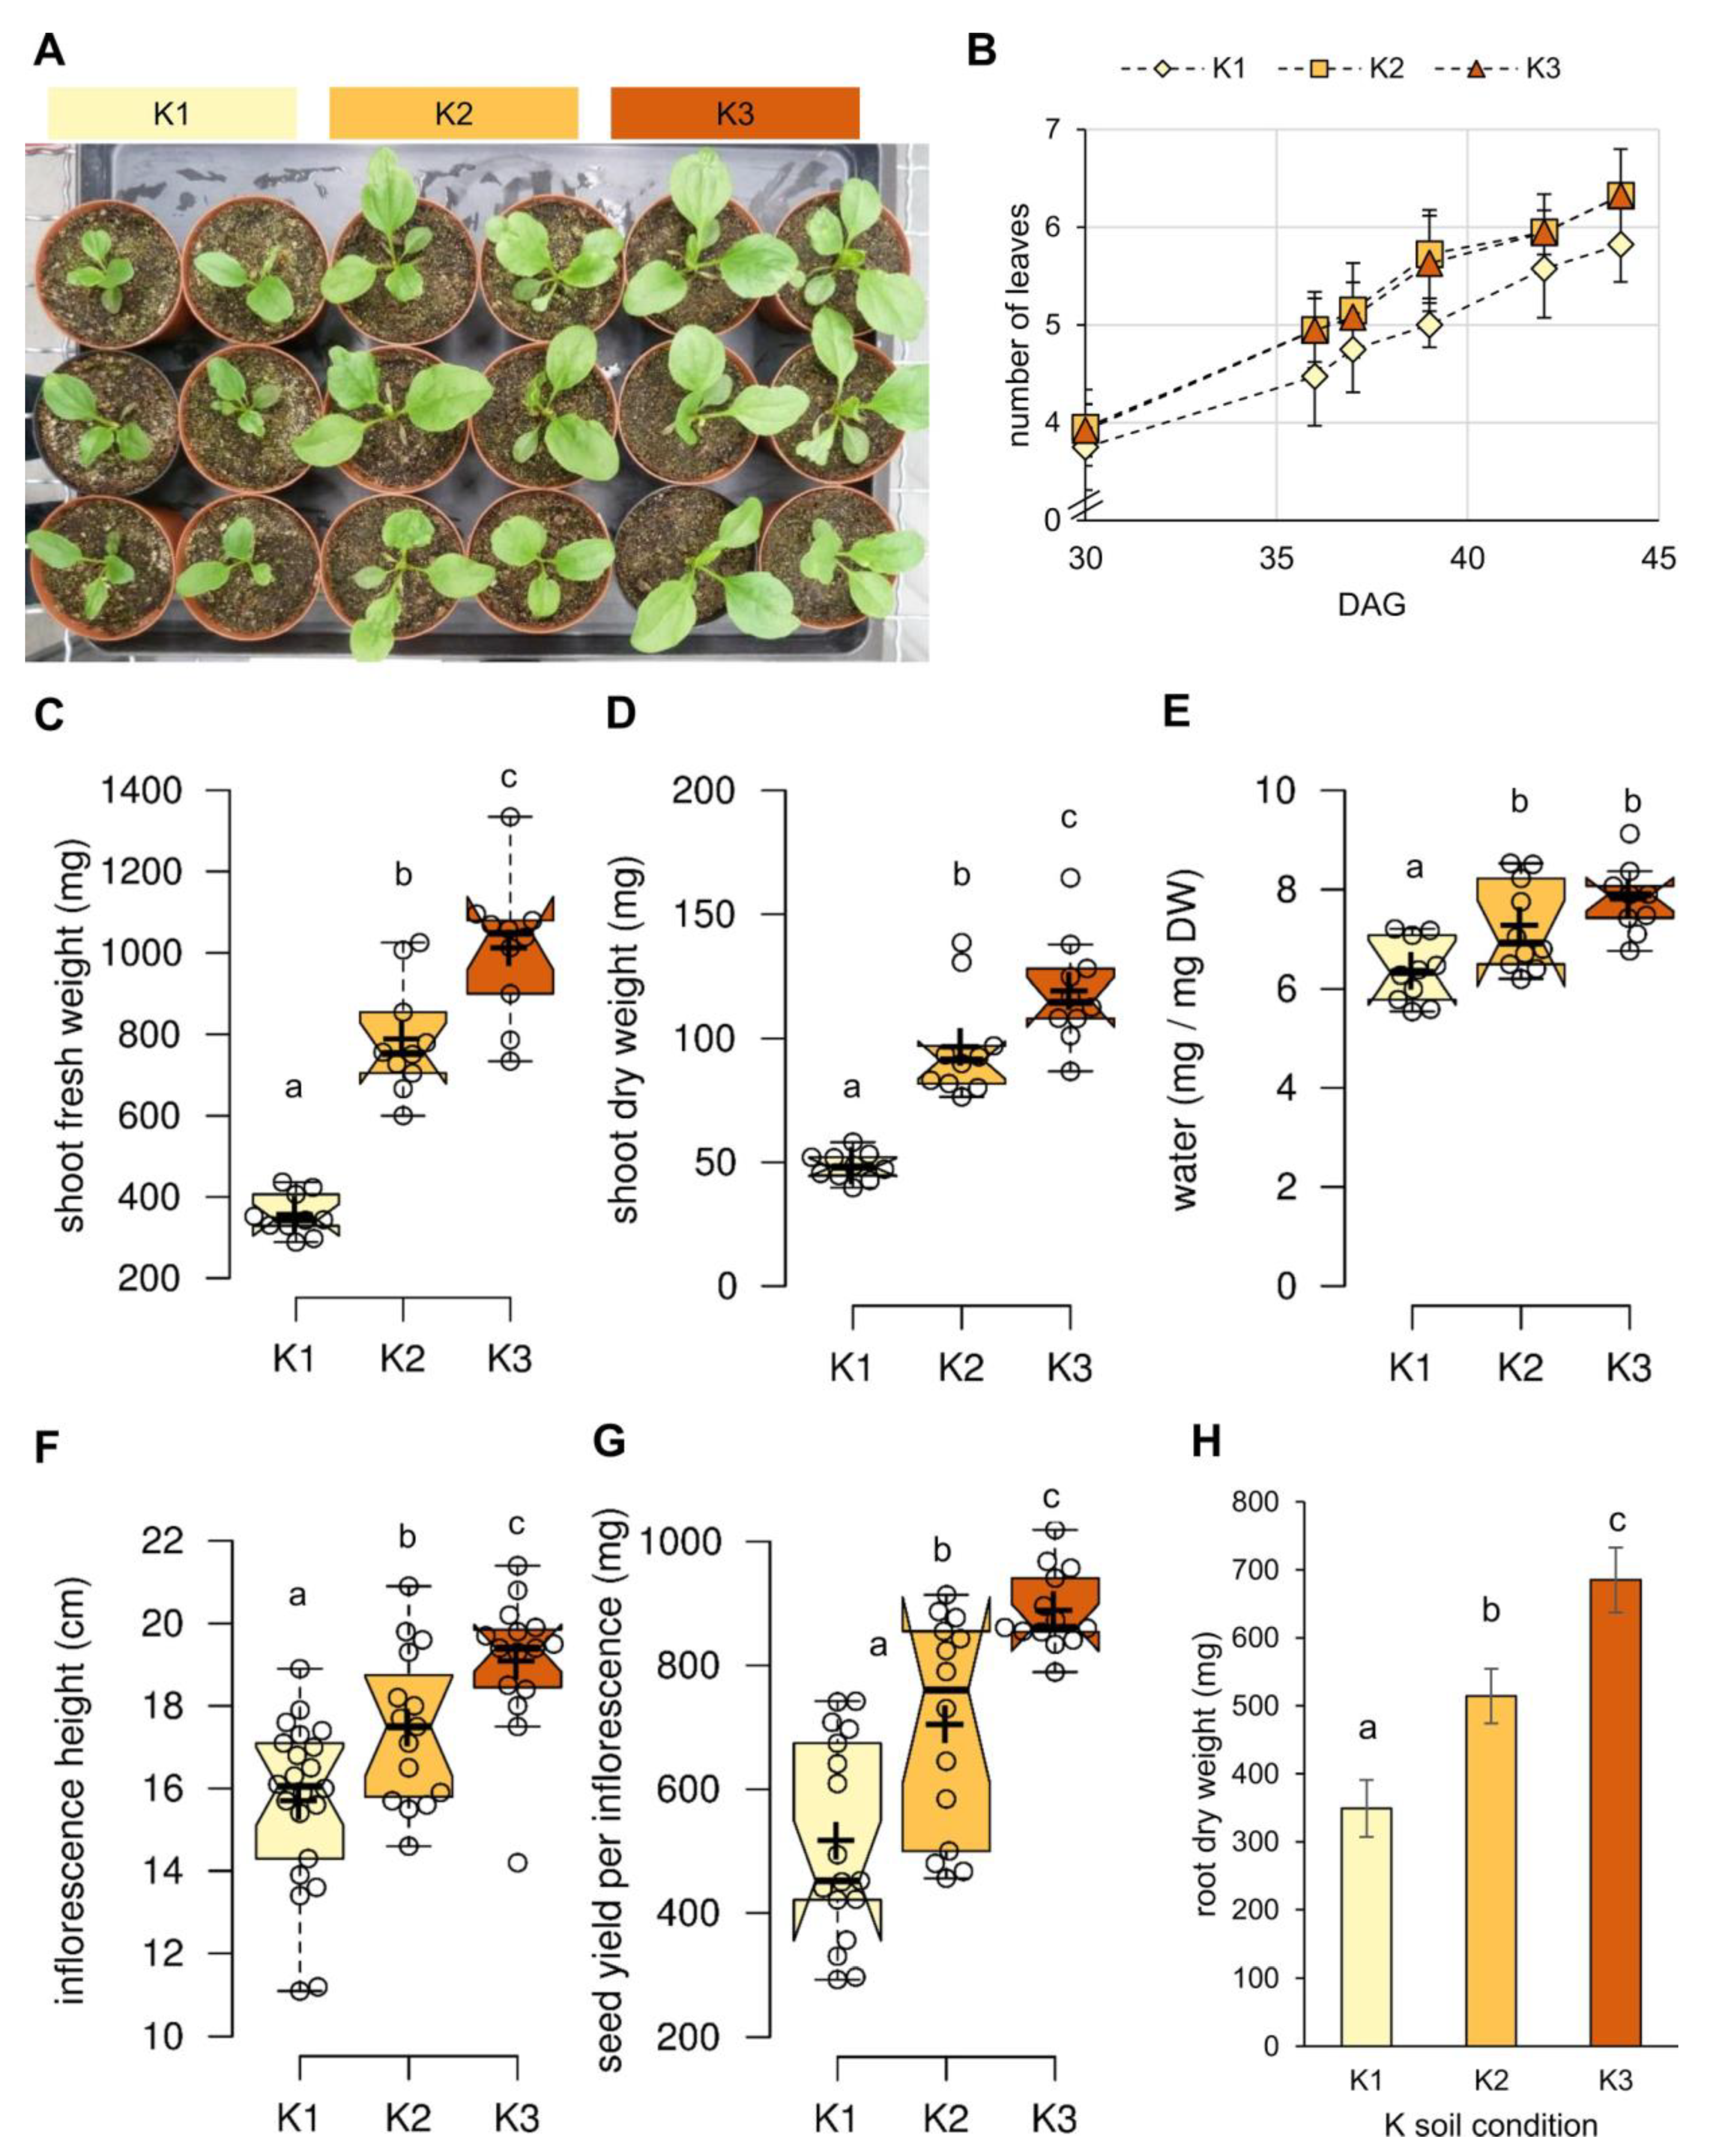
Abstract
:1. Introduction
2. Results
2.1. K Promotes Biomass Formation in Both Source and Sink Organs
2.2. K Alters the Inorganic Ion Levels of Leaves
2.3. High K Levels Boost Photosynthesis and Reduce Non Photochemical Quenching
2.4. K Effects on Leaf Carbon Dioxide and Water Exchange
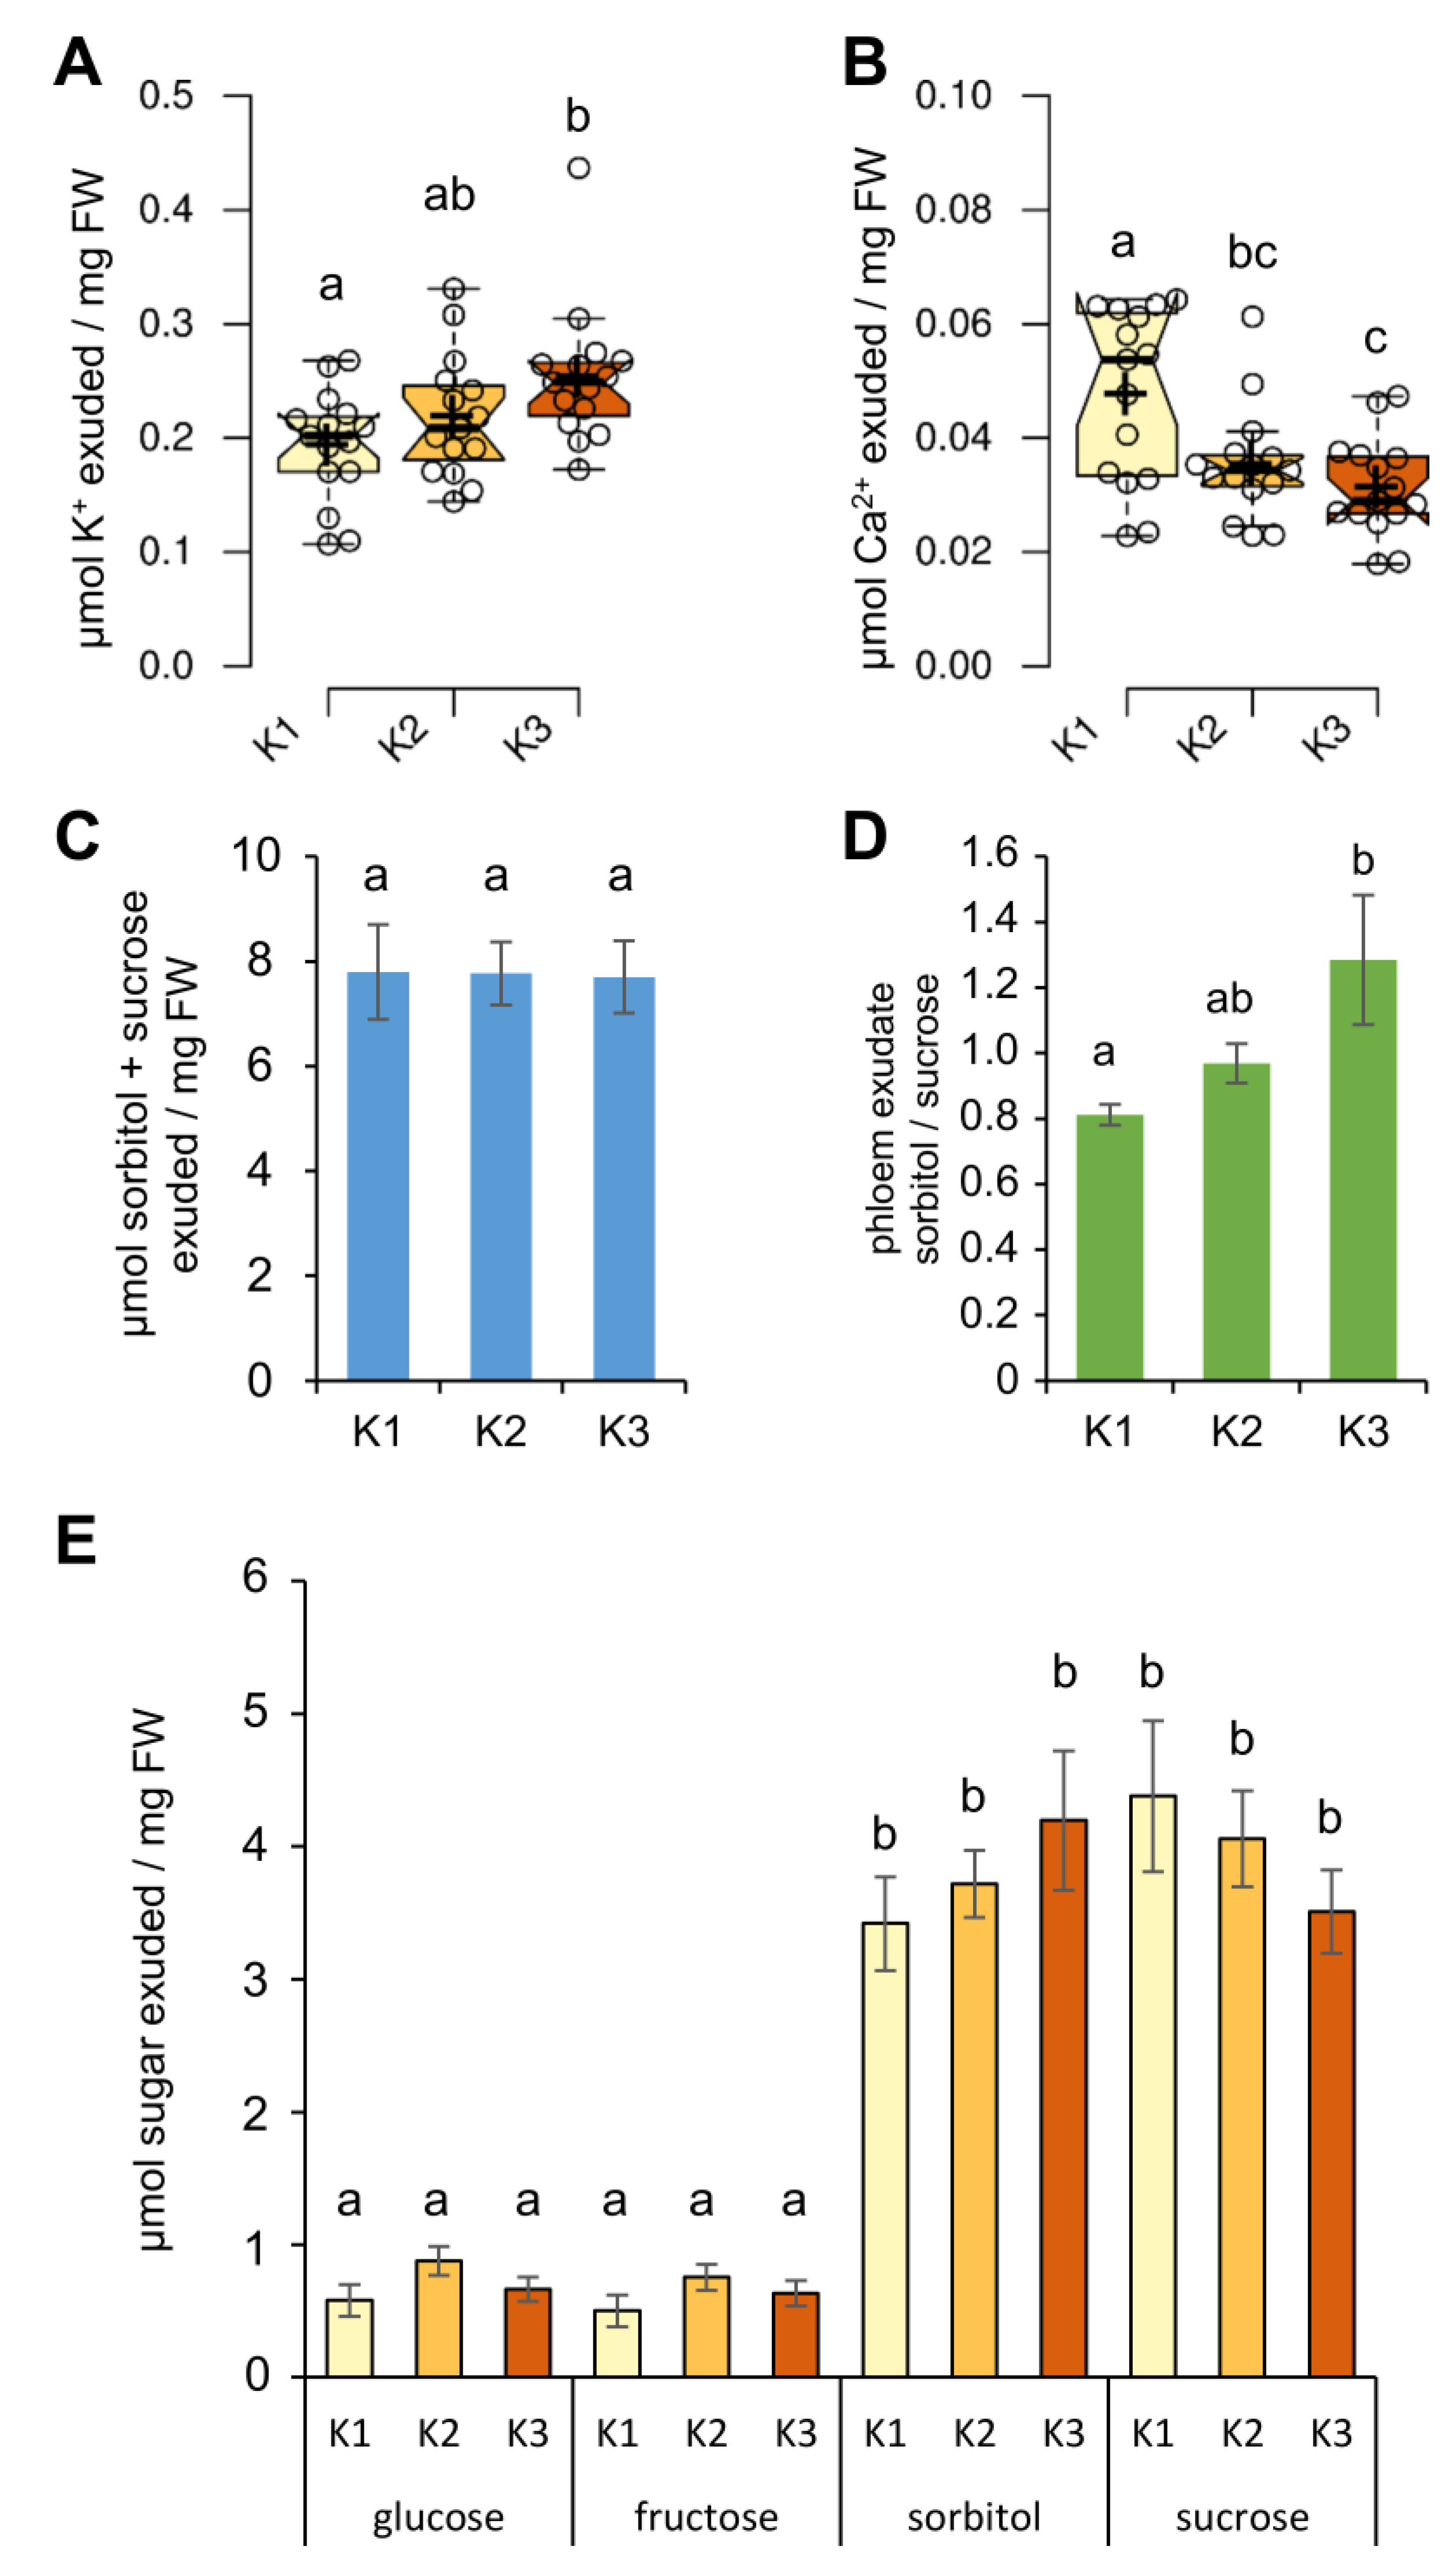
2.5. Phloem Exudate Composition Under Different K Supply
2.6. Cold Acclimation Kinetics under Different Soil K Levels
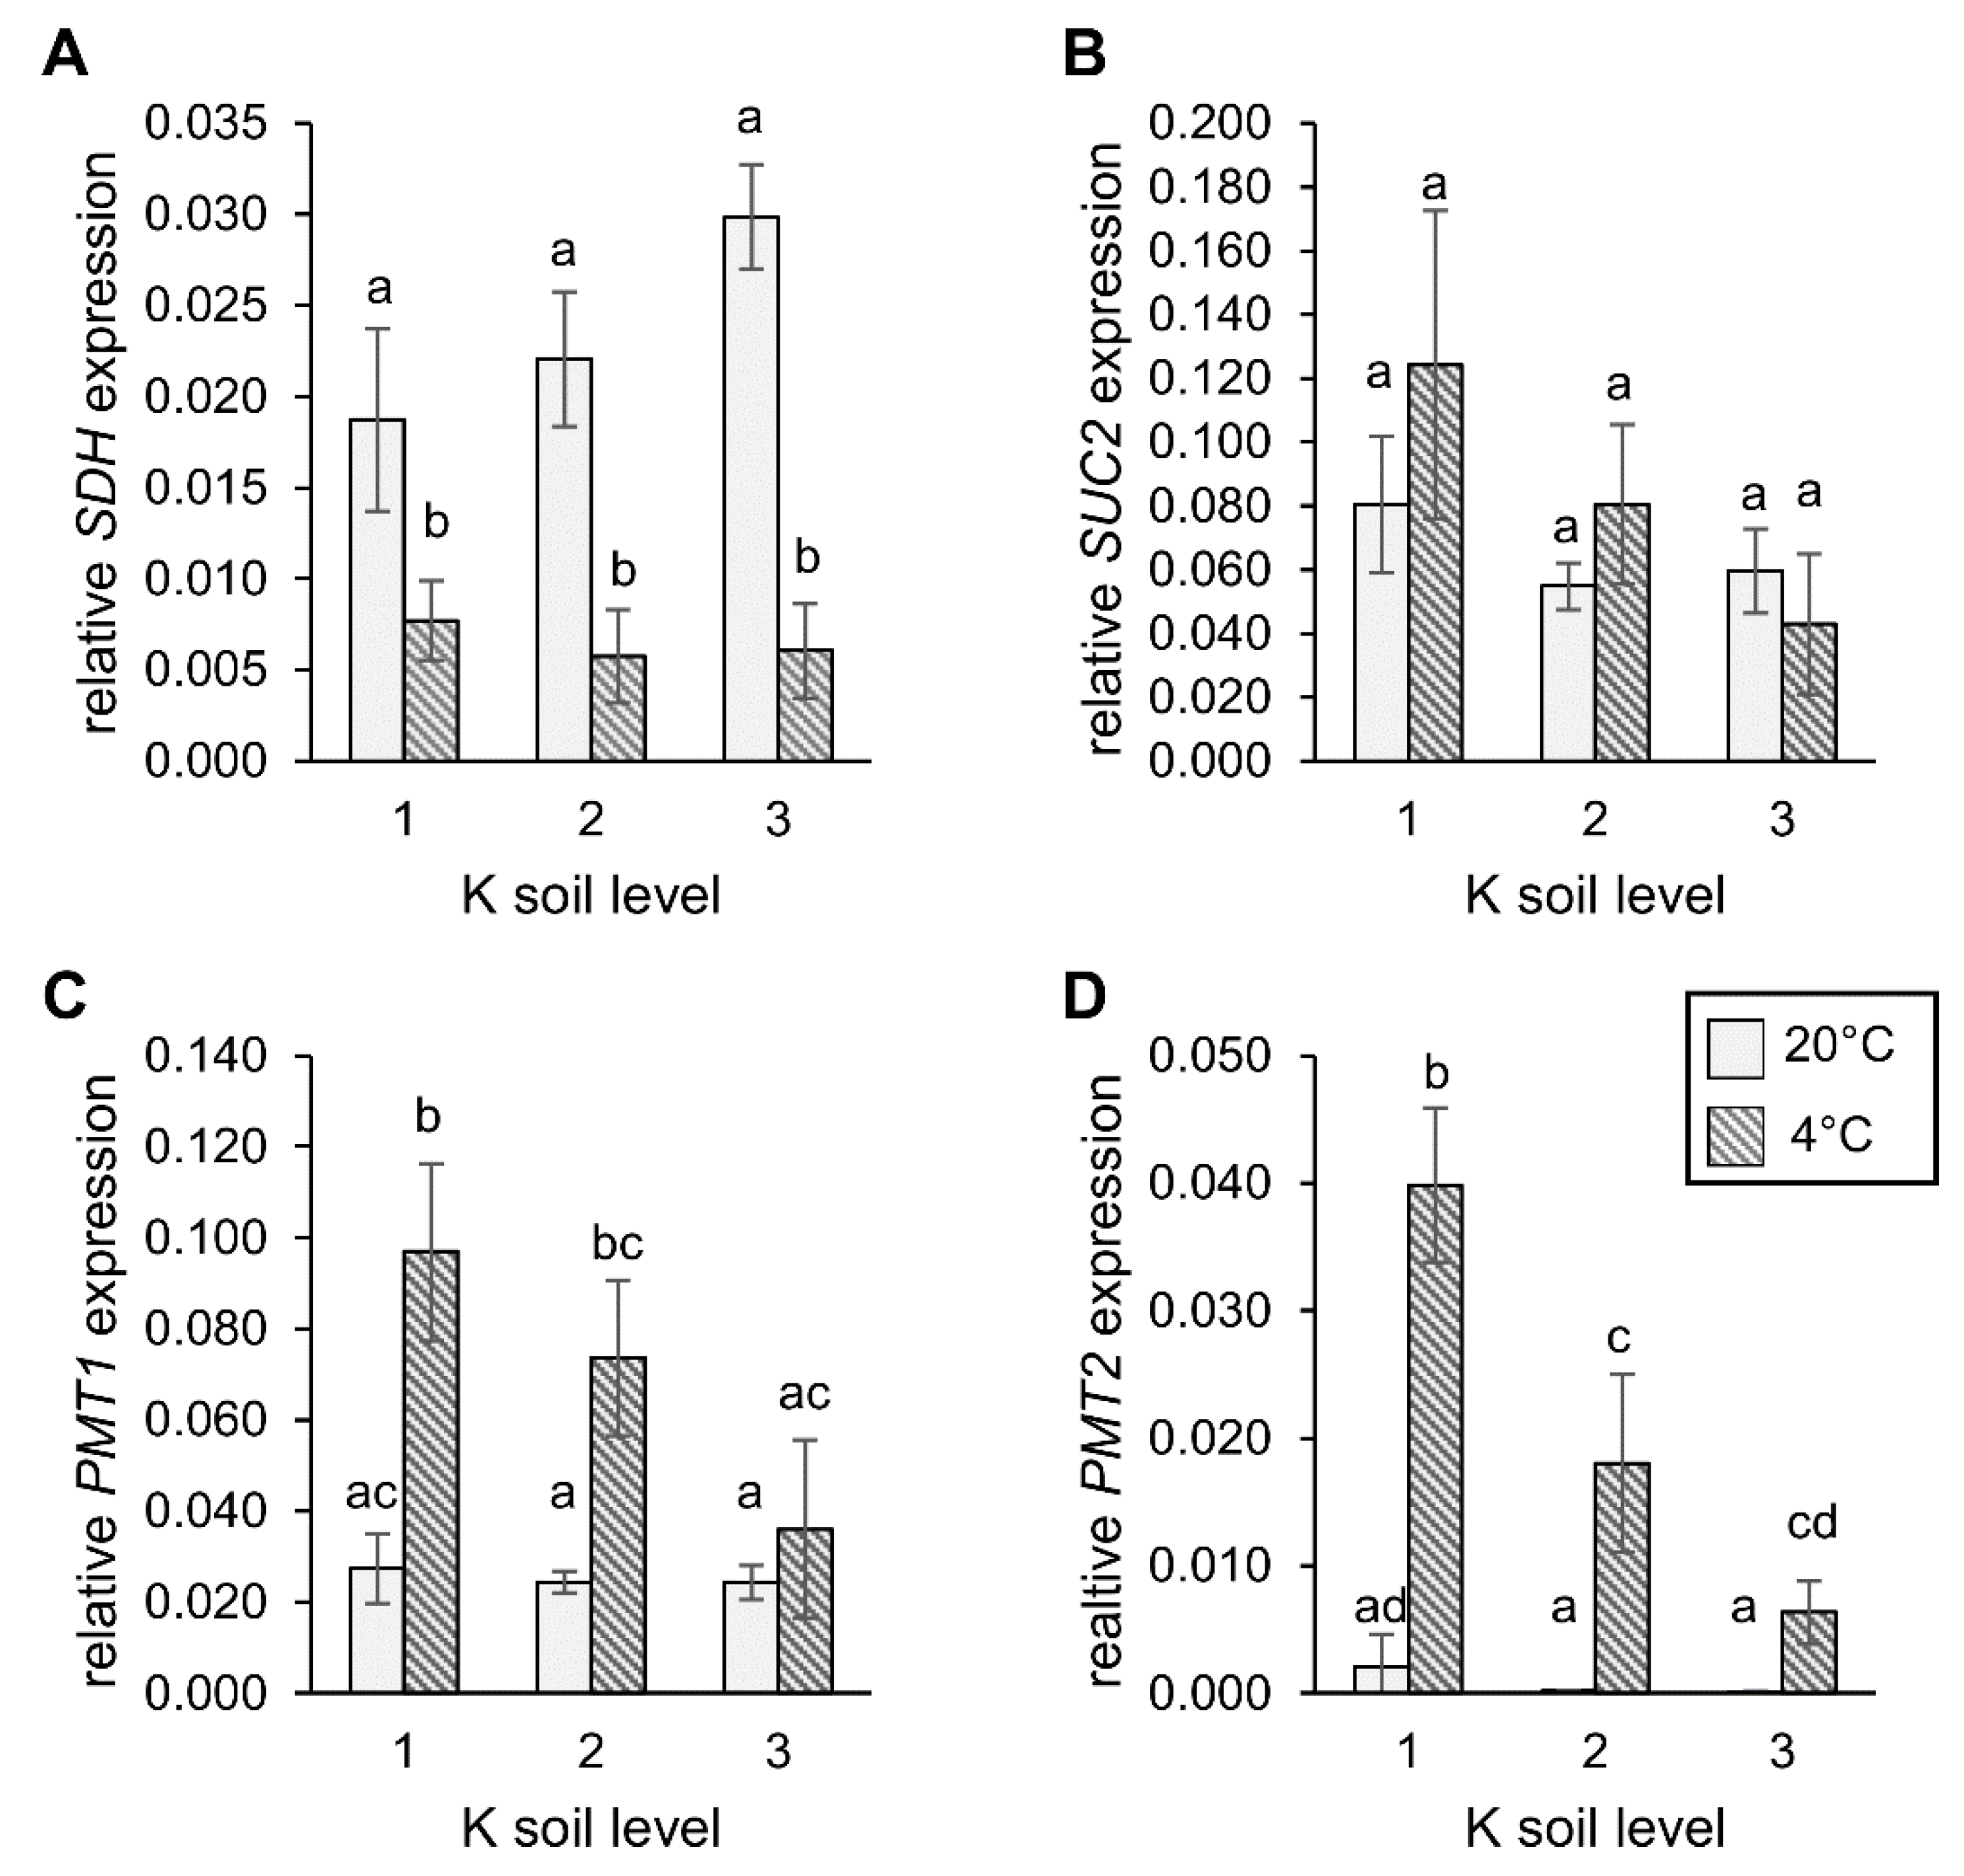
2.7. Expression of Sorbitol and Sucrose Transporter Genes under Different Levels of Soil K
3. Discussion
4. Materials and Methods
4.1. Plant Material and Plant Growth
4.2. Soil Substrate Preparation
4.3. Cold Acclimation Treatment
4.4. PAM Measurements
4.5. Gas Exchange Measurements
4.6. Phloem Exudates
4.7. Soluble Sugar Extraction and Quantification
4.8. Chlorophyll and Pigment Analysis
4.9. Statistical Analysis
5. Conclusions
Author Contributions
Funding
Acknowledgments
Conflicts of Interest
References
- Hawkesford, M.; Horst, W.; Kichey, T.; Lambers, H.; Schjoerring, J.; Møller, I.S.; White, P. Chapter 6—Functions of Macronutrients. In Marschner’s Mineral Nutrition of Higher Plants, 3rd ed.; Marschner, P., Ed.; Academic Press: San Diego, CA, USA, 2012; pp. 135–189. ISBN 978-0-12-384905-2. [Google Scholar]
- Rehm, G.; Schmitt, M. Potassium for Crop Production: Nutrient Management; University of Minnesota Extension: Minneapolis, MN, USA, 2002. [Google Scholar]
- Ragel, P.; Raddatz, N.; Leidi, E.O.; Quintero, F.J.; Pardo, J.M. Regulation of K+ Nutrition in Plants. Front. Plant Sci. 2019, 10, 281. [Google Scholar] [CrossRef] [PubMed] [Green Version]
- Roelfsema, M.R.G.; Hedrich, R. In the light of stomatal opening: New insights into ‘the Watergate’. New Phytol. 2005, 167, 665–691. [Google Scholar] [CrossRef] [PubMed]
- Cochrane, T.T.; Cochrane, T.A. The vital role of potassium in the osmotic mechanism of stomata aperture modulation and its link with potassium deficiency. Plant Signal. Behav. 2009, 4, 240–243. [Google Scholar] [CrossRef] [PubMed] [Green Version]
- Kanai, S.; Moghaieb, R.E.; El-Shemy, H.A.; Panigrahi, R.; Mohapatra, P.K.; Ito, J.; Nguyen, N.T.; Saneoka, H.; Fujita, K. Potassium deficiency affects water status and photosynthetic rate of the vegetative sink in green house tomato prior to its effects on source activity. Plant Sci. 2011, 180, 368–374. [Google Scholar] [CrossRef]
- Hosseini, S.A.; Hajirezaei, M.R.; Seiler, C.; Sreenivasulu, N.; von Wirén, N. A potential role of flag leaf potassium in conferring tolerance to drought-induced leaf senescence in barley. Front. Plant Sci. 2016, 7, 206. [Google Scholar] [CrossRef] [Green Version]
- Drechsler, N.; Zheng, Y.; Bohner, A.; Nobmann, B.; von Wirén, N.; Kunze, R.; Rausch, C. Nitrate-dependent control of shoot K homeostasis by the nitrate transporter1/peptide transporter family member NPF7. 3/NRT1. 5 and the stelar K+ outward rectifier SKOR in Arabidopsis. Plant Physiol. 2015, 169, 2832–2847. [Google Scholar]
- Etienne, P.; Diquelou, S.; Prudent, M.; Salon, C.; Maillard, A.; Ourry, A. Macro and micronutrient storage in plants and their remobilization when facing scarcity: The case of drought. Agriculture 2018, 8, 14. [Google Scholar] [CrossRef] [Green Version]
- White, P.J. Chapter 3—Long-distance Transport in the Xylem and Phloem. In Marschner’s Mineral Nutrition of Higher Plants, 3rd ed.; Marschner, P., Ed.; Academic Press: San Diego, CA, USA, 2012; pp. 49–70. ISBN 978-0-12-384905-2. [Google Scholar]
- Pommerrenig, B.; Eggert, K.; Bienert, G.P. Boron Deficiency Effects on Sugar, Ionome, and Phytohormone Profiles of Vascular and Non-Vascular Leaf Tissues of Common Plantain (Plantago major L.). Int. J. Mol. Sci. 2019, 20, 3882. [Google Scholar] [CrossRef] [Green Version]
- Ruiz-Medrano, R.; Xoconostle-Cázares, B.; Lucas, W.J. The phloem as a conduit for inter-organ communication. Curr. Opin. Plant Biol. 2001, 4, 202–209. [Google Scholar] [CrossRef]
- Wippel, K.; Sauer, N. Arabidopsis SUC1 loads the phloem in suc2 mutants when expressed from the SUC2 promoter. J. Exp. Bot. 2011, 63, 669–679. [Google Scholar] [CrossRef] [Green Version]
- Cakmak, I.; Hengeler, C.; Marschner, H. Changes in phloem export of sucrose in leaves in response to phosphorus, potassium and magnesium deficiency in bean plants. J. Exp. Bot. 1994, 45, 1251–1257. [Google Scholar] [CrossRef]
- Koch, M.; Busse, M.; Naumann, M.; Jákli, B.; Smit, I.; Cakmak, I.; Hermans, C.; Pawelzik, E. Differential effects of varied potassium and magnesium nutrition on production and partitioning of photoassimilates in potato plants. Physiol. Plant 2019, 166, 921–935. [Google Scholar] [CrossRef] [PubMed] [Green Version]
- Gajdanowicz, P.; Michard, E.; Sandmann, M.; Rocha, M.; Corrêa, L.G.G.; Ramírez-Aguilar, S.J.; Gomez-Porras, J.L.; González, W.; Thibaud, J.-B.; Van Dongen, J.T. Potassium (K+) gradients serve as a mobile energy source in plant vascular tissues. Proc. Natl. Acad. Sci. USA 2011, 108, 864–869. [Google Scholar] [CrossRef] [PubMed] [Green Version]
- Dreyer, I.; Gomez-Porras, J.L.; Riedelsberger, J. The potassium battery: A mobile energy source for transport processes in plant vascular tissues. New Phytol. 2017, 216, 1049–1053. [Google Scholar] [CrossRef] [Green Version]
- Seki, M.; Umezawa, T.; Urano, K.; Shinozaki, K. Regulatory metabolic networks in drought stress responses. Curr. Opin. Plant Biol. 2007, 10, 296–302. [Google Scholar] [CrossRef]
- Pommerrenig, B.; Cvetkovic, J.; Trentmann, O.; Klemens, P.A.W.; Neuhaus, H.E.; Ludewig, F. In Concert: Orchestrated Changes in Carbohydrate Homeostasis Are Critical for Plant Abiotic Stress Tolerance. Plant Cell Physiol. 2018, 59, 1290–1299. [Google Scholar] [CrossRef]
- Yadav, S.K. Cold stress tolerance mechanisms in plants. A review. Agron. Sustain. Dev. 2010, 30, 515–527. [Google Scholar] [CrossRef] [Green Version]
- Strand, Å.; Hurry, V.; Gustafsson, P.; Gardeström, P. Development of Arabidopsis thaliana leaves at low temperatures releases the suppression of photosynthesis and photosynthetic gene expression despite the accumulation of soluble carbohydrates. Plant J. 1997, 12, 605–614. [Google Scholar] [CrossRef]
- Zuther, E.; Büchel, K.; Hundertmark, M.; Stitt, M.; Hincha, D.K.; Heyer, A.G. The role of raffinose in the cold acclimation response of Arabidopsis thaliana. FEBS Lett. 2004, 576, 169–173. [Google Scholar] [CrossRef] [Green Version]
- Peshev, D.; Vergauwen, R.; Moglia, A.; Hideg, É.; Van den Ende, W. Towards understanding vacuolar antioxidant mechanisms: A role for fructans? J. Exp. Bot. 2013, 64, 1025–1038. [Google Scholar] [CrossRef]
- Bhattacharya, S.; Kundu, A. Sugars and Sugar Polyols in Overcoming Environmental Stresses. In Protective Chemical Agents in the Amelioration of Plant Abiotic Stress: Biochemical and Molecular Perspectives; Roychoudhury, A., Tripathi, D.K., Eds.; John Wiley & Sons: Hoboken, NJ, USA, 2020; p. 71. [Google Scholar]
- Stoop, J.M.; Williamson, J.D.; Pharr, D.M. Mannitol metabolism in plants: A method for coping with stress. Trends Plant Sci. 1996, 1, 139–144. [Google Scholar] [CrossRef]
- Pommerrenig, B.; Papini-Terzi, F.S.; Sauer, N. Differential Regulation of Sorbitol and Sucrose Loading into the Phloem of Plantago major in Response to Salt Stress. Plant Physiol. 2007, 144, 1029. [Google Scholar] [CrossRef] [PubMed] [Green Version]
- Nadwodnik, J.; Lohaus, G. Subcellular concentrations of sugar alcohols and sugars in relation to phloem translocation in Plantago major, Plantago maritima, Prunus persica, and Apium graveolens. Planta 2008, 227, 1079–1089. [Google Scholar] [CrossRef] [PubMed] [Green Version]
- Ramsperger-Gleixner, M.; Geiger, D.; Hedrich, R.; Sauer, N. Differential expression of sucrose transporter and polyol transporter genes during maturation of common plantain companion cells. Plant Physiol. 2004, 134, 147–160. [Google Scholar] [CrossRef] [Green Version]
- Wang, M.; Zheng, Q.; Shen, Q.; Guo, S. The critical role of potassium in plant stress response. Int. J. Mol. Sci. 2013, 14, 7370–7390. [Google Scholar] [CrossRef] [Green Version]
- Römheld, V.; Kirkby, E.A. Research on potassium in agriculture: Needs and prospects. Plant Soil 2010, 335, 155–180. [Google Scholar] [CrossRef]
- Hosseini, S.A.; Maillard, A.; Hajirezaei, M.R.; Ali, N.; Schwarzenberg, A.; Jamois, F.; Yvin, J.-C. Induction of Barley Silicon Transporter HvLsi1 and HvLsi2, increased silicon concentration in the shoot and regulated Starch and ABA Homeostasis under Osmotic stress and Concomitant Potassium Deficiency. Front. Plant Sci. 2017, 8, 1359. [Google Scholar] [CrossRef] [Green Version]
- Devi, B.S.R.; Kim, Y.J.; Selvi, S.K.; Gayathri, S.; Altanzul, K.; Parvin, S.; Yang, D.-U.; Lee, O.R.; Lee, S.; Yang, D.-C. Influence of potassium nitrate on antioxidant level and secondary metabolite genes under cold stress in Panax ginseng. Russ. J. Plant Physiol. 2012, 59, 318–325. [Google Scholar] [CrossRef]
- Pommerrenig, B.; Junker, A.; Abreu, I.; Bieber, A.; Fuge, J.; Willner, E.; Bienert, M.D.; Altmann, T.; Bienert, G.P. Identification of Rapeseed (Brassica napus) Cultivars with a High Tolerance to Boron-Deficient Conditions. Front. Plant Sci. 2018, 9, 1142. [Google Scholar] [CrossRef] [Green Version]
- Jakobsen, S.T. Interaction between plant nutrients: III. Antagonism between potassium, magnesium and calcium. Acta Agric. Scand. B-Plant Soil Sci. 1993, 43, 1–5. [Google Scholar] [CrossRef]
- Diem, B.; Godbold, D. Potassium, calcium and magnesium antagonism in clones of Populus trichocarpa. Plant Soil 1993, 155, 411–414. [Google Scholar] [CrossRef]
- Tuma, J.; Skalicky, M.; Tumova, L.; Bláhová, P.; Rosulkova, M. Potassium, magnesium and calcium content in individual parts of Phaseolus vulgaris L. plant as related to potassium and magnesium nutrition. Plant Soil Environ. 2004, 50, 18–26. [Google Scholar] [CrossRef] [Green Version]
- Mengel, K.; Kirkby, E. Principles of Plant Nutrition; International Potash Institute: Bern, Switzerland, 1982. [Google Scholar]
- Dibb, D.; Thompson, W., Jr. Interaction of potassium with other nutrients. Potassium Agric. 1985, 1, 515–533. [Google Scholar]
- Yang, J.; Zhang, J.; Li, C.; Zhang, Z.; Ma, F.; Li, M. Response of sugar metabolism in apple leaves subjected to short-term drought stress. Plant Physiol. Biochem. 2019, 141, 164–171. [Google Scholar] [CrossRef]
- Vu, D.P.; Martins Rodrigues, C.; Jung, B.; Meissner, G.; Klemens, P.A.; Holtgräwe, D.; Fürtauer, L.; Nägele, T.; Nieberl, P.; Pommerrenig, B. Vacuolar sucrose homeostasis is critical for plant development, seed properties, and night-time survival in Arabidopsis. J. Exp. Bot. 2020, 71, 4930–4943. [Google Scholar] [CrossRef]
- Rodrigues, C.M.; Müdsam, C.; Keller, I.; Zierer, W.; Czarnecki, O.; Corral, J.M.; Reinhardt, F.; Nieberl, P.; Fiedler-Wiechers, K.; Sommer, F.K. Vernalization Alters Sink and Source Identities and Reverses Phloem Translocation from Taproots to Shoots in Sugar Beet (Beta vulgaris). Plant Cell 2020. [Google Scholar] [CrossRef]
- Hermans, C.; Hammond, J.P.; White, P.J.; Verbruggen, N. How do plants respond to nutrient shortage by biomass allocation? Trends Plant Sci. 2006, 11, 610–617. [Google Scholar] [CrossRef]
- Deeken, R.; Geiger, D.; Fromm, J.; Koroleva, O.; Ache, P.; Langenfeld-Heyser, R.; Sauer, N.; May, S.T.; Hedrich, R. Loss of the AKT2/3 potassium channel affects sugar loading into the phloem of Arabidopsis. Planta 2002, 216, 334–344. [Google Scholar] [CrossRef]
- Conti, T.R.; Geiger, D.R. Potassium nutrition and translocation in sugar beet. Plant Physiol. 1982, 70, 168–172. [Google Scholar] [CrossRef]
- Fürtauer, L.; Weiszmann, J.; Weckwerth, W.; Nägele, T. Dynamics of Plant Metabolism during Cold Acclimation. Int. J. Mol. Sci. 2019, 20, 5411. [Google Scholar] [CrossRef] [Green Version]
- Cao, W.; Tibbitts, T.W. Potassium concentration effect on growth, gas exchange and mineral accumulation in potatoes. J. Plant Nutr. 1991, 14, 525–537. [Google Scholar] [CrossRef]
- George, M.S.; Lu, G.; Zhou, W. Genotypic variation for potassium uptake and utilization efficiency in sweet potato (Ipomoea batatas L.). Field Crops Res. 2002, 77, 7–15. [Google Scholar] [CrossRef]
- Farber, A.; Young, A.J.; Ruban, A.V.; Horton, P.; Jahns, P. Dynamics of xanthophyll-cycle activity in different antenna subcomplexes in the photosynthetic membranes of higher plants (the relationship between zeaxanthin conversion and nonphotochemical fluorescence quenching). Plant Physiol. 1997, 115, 1609–1618. [Google Scholar] [CrossRef] [Green Version]
- Kress, E.; Jahns, P. The dynamics of energy dissipation and xanthophyll conversion in Arabidopsis indicate an indirect photoprotective role of zeaxanthin in slowly inducible and relaxing components of non-photochemical quenching of excitation energy. Front. Plant Sci. 2017, 8, 2094. [Google Scholar] [CrossRef]
- Asada, K. The water-water cycle in chloroplasts: Scavenging of active oxygens and dissipation of excess photons. Annu. Rev. Plant Biol. 1999, 50, 601–639. [Google Scholar] [CrossRef]
- Shen, C.; Li, Y.; Wang, J.; Al Shoffe, Y.; Dong, C.; Shen, Q.; Xu, Y. Potassium Influences Expression of Key Genes Involved in Sorbitol Metabolism and its Assimilation in Pear Leaf and Fruit. J. Plant Growth Regul. 2018, 37, 883–895. [Google Scholar] [CrossRef]
- Mengel, K.; Haeder, H.-E. Effect of potassium supply on the rate of phloem sap exudation and the composition of phloem sap of Ricinus communis. Plant Physiol. 1977, 59, 282–284. [Google Scholar] [CrossRef] [Green Version]
- Benlloch-González, M.; Romera, J.; Cristescu, S.; Harren, F.; Fournier, J.M.; Benlloch, M. K+ starvation inhibits water-stress-induced stomatal closure via ethylene synthesis in sunflower plants. J. Exp. Bot. 2010, 61, 1139–1145. [Google Scholar] [CrossRef]
- Pervez, H.; Ashraf, M.; Makhdum, M.I. Influence of potassium nutrition on gas exchange characteristics and water relations in cotton (Gossypium hirsutum L.). Photosynthetica 2004, 42, 251–255. [Google Scholar] [CrossRef]
- Trentmann, O.; Mühlhaus, T.; Zimmer, D.; Sommer, F.K.; Schroda, M.; Haferkamp, I.; Keller, I.; Pommerrenig, B.; Neuhaus, H.E. Identification of chloroplast envelope proteins with critical importance for cold acclimation. Plant Physiol. 2020, 182, 1239–1255. [Google Scholar] [CrossRef] [Green Version]
- Niittylä, T.; Messerli, G.; Trevisan, M.; Chen, J.; Smith, A.M.; Zeeman, S.C. A previously unknown maltose transporter essential for starch degradation in leaves. Science 2004, 303, 87–89. [Google Scholar] [CrossRef] [PubMed]
- Klemens, P.A.W.; Patzke, K.; Trentmann, O.; Poschet, G.; Büttner, M.; Schulz, A.; Marten, I.; Hedrich, R.; Neuhaus, H.E. Overexpression of a proton-coupled vacuolar glucose exporter impairs freezing tolerance and seed germination. New Phytol. 2014, 202, 188–197. [Google Scholar] [CrossRef] [PubMed]
- Huang, J.; Huang, Z.; Zhou, X.; Xia, C.; Imran, M.; Wang, S.; Xu, C.; Zha, M.; Liu, Y.; Zhang, C. Tissue-specific transcriptomic profiling of Plantago major provides insights for the involvement of vasculature in phosphate deficiency responses. Mol. Genet. Genom. 2019, 294, 159–175. [Google Scholar] [CrossRef] [PubMed]
- Gahrtz, M.; Stolz, J.; Sauer, N. A phloem-specific sucrose-H+ symporter from Plantago major L. supports the model of apoplastic phloem loading. Plant J. 1994, 6, 697–706. [Google Scholar] [CrossRef]
- Spitzer, M.; Wildenhain, J.; Rappsilber, J.; Tyers, M. BoxPlotR: A web tool for generation of box plots. Nat. Methods 2014, 11, 121. [Google Scholar] [CrossRef]


© 2020 by the authors. Licensee MDPI, Basel, Switzerland. This article is an open access article distributed under the terms and conditions of the Creative Commons Attribution (CC BY) license (http://creativecommons.org/licenses/by/4.0/).
Share and Cite
Ho, L.-H.; Rode, R.; Siegel, M.; Reinhardt, F.; Neuhaus, H.E.; Yvin, J.-C.; Pluchon, S.; Hosseini, S.A.; Pommerrenig, B. Potassium Application Boosts Photosynthesis and Sorbitol Biosynthesis and Accelerates Cold Acclimation of Common Plantain (Plantago major L.). Plants 2020, 9, 1259. https://doi.org/10.3390/plants9101259
Ho L-H, Rode R, Siegel M, Reinhardt F, Neuhaus HE, Yvin J-C, Pluchon S, Hosseini SA, Pommerrenig B. Potassium Application Boosts Photosynthesis and Sorbitol Biosynthesis and Accelerates Cold Acclimation of Common Plantain (Plantago major L.). Plants. 2020; 9(10):1259. https://doi.org/10.3390/plants9101259
Chicago/Turabian StyleHo, Li-Hsuan, Regina Rode, Maike Siegel, Frank Reinhardt, H. Ekkehard Neuhaus, Jean-Claude Yvin, Sylvain Pluchon, Seyed Abdollah Hosseini, and Benjamin Pommerrenig. 2020. "Potassium Application Boosts Photosynthesis and Sorbitol Biosynthesis and Accelerates Cold Acclimation of Common Plantain (Plantago major L.)" Plants 9, no. 10: 1259. https://doi.org/10.3390/plants9101259