Article

Identification of Single-Nucleotide Polymorphisms (SNPs) Associated with Heat Tolerance at the Reproductive Stage in Synthetic Hexaploid Wheats Using GWAS

1
Institute of Molecular Biology and Biotechnology, Bahauddin Zakariya University, Multan 60800, Pakistan
2
College of Life Sciences, South China Agricultural University, Guangzhou 510642, China
3
International Maize and Wheat Improvement Center (CIMMYT) Pakistan Office, National Agriculture Research Center (NARC), Park Road, Islamabad 44000, Pakistan
4
Department of Plant Sciences, Quaid-i-Azam University, Islamabad 45320, Pakistan
5
Institute of Crop Sciences, National Agriculture Research Center (NARC), Park Road, Islamabad 44000, Pakistan
6
Department of Biosciences, Comsats University, Islamabad 45550, Pakistan
7
College of Horticulture and Landscape Architecture, Zhongkai University of Agriculture and Engineering, Guangzhou 510408, China
*
Authors to whom correspondence should be addressed.
Plants 2023, 12(8), 1610; https://doi.org/10.3390/plants12081610
Submission received: 17 February 2023 / Revised: 5 April 2023 / Accepted: 6 April 2023 / Published: 10 April 2023
(This article belongs to the Special Issue Tools and Resources for Wheat Molecular Breeding)

Abstract

:
The projected rise in global ambient temperature by 3–5 °C by the end of this century, along with unpredicted heat waves during critical crop growth stages, can drastically reduce grain yield and will pose a great food security challenge. It is therefore important to identify wheat genetic resources able to withstand high temperatures, discover genes underpinning resilience to higher temperatures, and deploy such genetic resources in wheat breeding to develop heat-tolerant cultivars. In this study, 180 accessions of synthetic hexaploid wheats (SHWs) were evaluated under normal and late wheat growing seasons (to expose them to higher temperatures) at three locations (Islamabad, Bahawalpur, and Tando Jam), and data were collected on 11 morphological and yield-related traits. The diversity panel was genotyped with a 50 K SNP array to conduct genome-wide association studies (GWASs) for heat tolerance in SHW. A known heat-tolerance locus, TaHST1, was profiled to identify different haplotypes of this locus in SHWs and their association with grain yield and related traits in SHWs. There was a 36% decrease in grain yield (GY), a 23% decrease in thousand-grain weight (TKW), and an 18% decrease in grains per spike (GpS) across three locations in the population due to the heat stress conditions. GWASs identified 143 quantitative trait nucleotides (QTNs) distributed over all 21 chromosomes in the SHWs. Out of these, 52 QTNs were associated with morphological and yield-related traits under heat stress, while 15 of them were pleiotropically associated with multiple traits. The heat shock protein (HSP) framework of the wheat genome was then aligned with the QTNs identified in this study. Seventeen QTNs were in proximity to HSPs on chr2B, chr3D, chr5A, chr5B, chr6D, and chr7D. It is likely that QTNs on the D genome and those in proximity to HSPs may carry novel alleles for heat-tolerance genes. The analysis of TaHST1 indicated that 15 haplotypes were present in the SHWs for this locus, while hap1 showed the highest frequency of 25% (33 SHWs). These haplotypes were significantly associated with yield-related traits in the SHWs. New alleles associated with yield-related traits in SHWs could be an excellent reservoir for breeding deployment.

1. Introduction

Wheat is a major staple food for almost 40% of the global population, cultivated on almost 220 million hectares of the land, with 750 million tons of production and a trade value of almost USD 50 billion per year [1]. Wheat yields are highly restricted by high temperatures and are prone to becoming more variable with the changes in the environment. Wheat is highly susceptible to high-temperature stress during anthesis and is less prone to recuperate if stressed at this critical stage. In wheat, for anthesis, the optimal temperature ranges between 5 °C and 28 °C. Temperatures that exceed this optimal range reduce the grain yield and quality by reducing the seed set and grain filling [2]. It is anticipated that every 1 °C rise in temperature causes a 6% decrease in the global wheat yield [3]. Important physiological and biochemical processes of the plant are interrupted by heat stress. The knowledge of heat stress’s effects and tolerance at the physiological, morphological, and biochemical levels is very important for making new crop varieties that can cope with the upcoming climatic changes [4].
Genetic diversity in major food crops, including wheat, has been successfully manipulated via conventional breeding approaches, resulting in a 0.8–1.2% annual genetic yield gain over the last 100years. However, the abovementioned gain will not be enough to meet the increasing global demand of food by 2050 [5]. Therefore, a gradual increase in genetic gain is necessary to cope with the demands of the 2% annual rise in the global population. The narrow genetic diversity in bread wheat—especially within the D-genome—needs to be extended to introduce new alleles for productivity improvement. To address this issue, synthetic hexaploid wheat (SHW) has been artificially synthesized [6]. SHW is produced artificially by creating a fertile hybrid between diploid wild goat grass (Aegilops tauschii, D’D’) and tetraploid durum wheat (Triticum turgidum, AABB). For more than three decades, the CIMMYT (the International Maize and Wheat Improvement Center) has made and used SHW to overpass gene shifts from durum wheat and Ae.tauschii to bread wheat (hexaploid). This is an exclusive example of success in exploiting wild relatives in conventional breeding at a huge, global scale [7]. SHWs are valuable for the enhancement of wheat in areas where stress due to high temperatures occurs more often [8].
Genome-wide association studies (GWASs) have been shown to be an effective method for discovering genes that underpin complex phenotypes. The genetic basis of heat tolerance in wheat has also been studied using GWASs. Heat stress tolerance (HST) is a very complex process and is controlled by many genes. Bread wheat contains a large and complex genome ( ~ 17 Gb) with more than 85% repetitive sequences [9]. Due to the complex nature of heat stress, very few genes for the response to heat stress in wheat have been cloned [10,11]. Advances in molecular marker development and quantitative genetics have made it possible to discover quantitative trait loci (QTLs) that regulate HST in wheat. Using specific features as indicators, many QTLs with significant effects on HST have been discovered [11,12]. Bennet et al. [13] identified two major QTLs on chr3B by using a set of 255 double-haploid (DH) lines; these QTLs show significant effects on canopy temperature and grain yield. Using a recombinant inbred line (RIL) (Halberd × Cutter), Mason et al. identified a significant QTL on chr3B related to the heat susceptibility index and yield components [14]. Maulana et al. [15] identified different significant QTLs in bread wheat at the seedling stage. QTLs for spike length were identified on chr2A, chr3B, and chr7D. For leaf chlorophyll content, multiple QTLs were identified on chr2B, chr2D, chr4B, and chr5B. QTLs were identified for seedling recovery on chr2A, chr2B, chr2D, chr3A, chr7B, and chr7D. Several other GWAS experiments have been conducted to dissect heat tolerance in wheats from the US [15], Pakistan [16], the CIMMYT [17], China [18], and emmer-derived hexaploid wheat [19].
The TaHST1 locus is present on chr4AL in bread wheat [20]. This region of 0.949Mb has proven to be essential for heat stress tolerance at the seedling and reproductive stages. Nineteen genes were identified in this region as playing a significant role in HST. Partial or complete deletion of this region was detected in most of the bread wheat cultivars. The presence of this region significantly enhanced the HST in wheat. Deletion of this region affected the grain number, grain weight, grain length, and thousand-grain weight [20].
This study was designed to (i) characterize a diversity panel consisting of SHWs against HS at the reproductive stage, (ii) identify quantitative trait nucleotides (QTNs) associated with HST at the reproductive stage in synthetic hexaploid wheat accessions, and (iii) characterize the TaHST1 locus and identify haplotype variation associated with heat stress at the reproductive stage.

2. Results

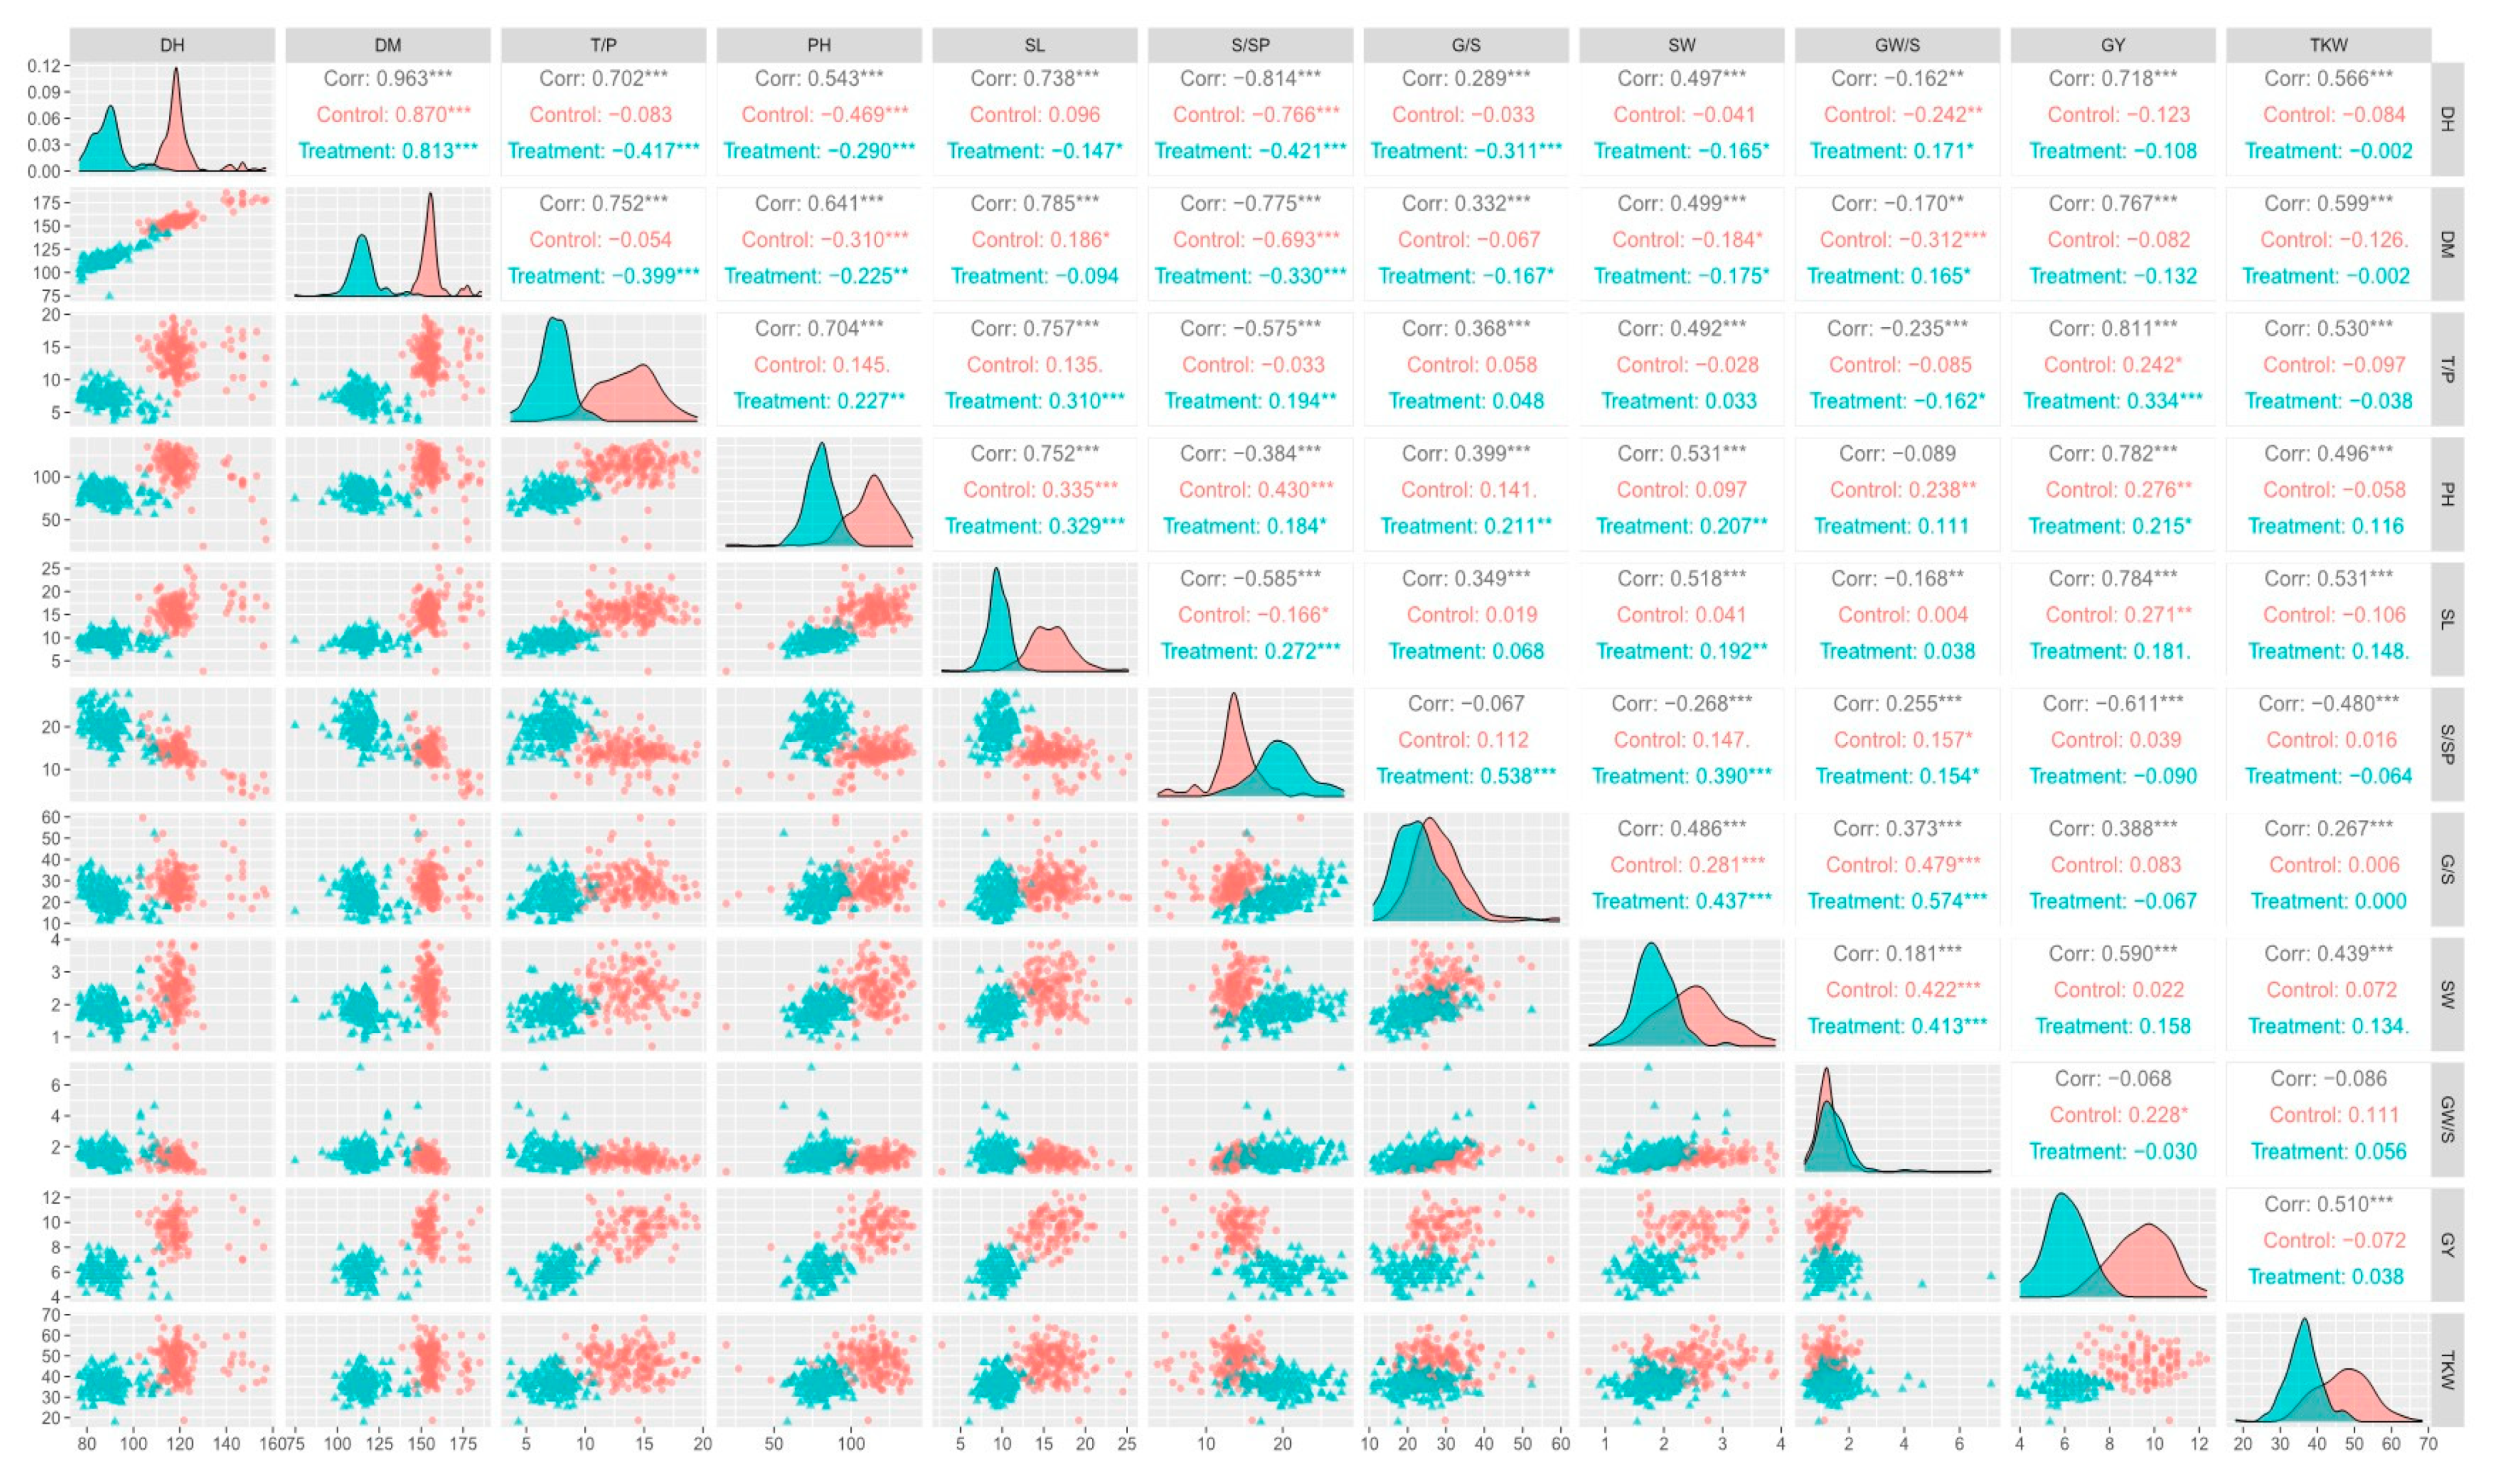
2.1. Phenotypic Data Analysis

Phenotypic data showed significant variation among all traits in both conditions (control and HS). The analysis of variance (ANOVA) for all of the morphological traits is presented in Table S2. All of the traits showed significant variations for genotypes, genotype × location, genotype × year, genotype × treatment, and other possible combinations, with the exception of genotype × year interaction for some traits (e.g., PH and TKW).
The ambient environmental variables—such as daily maximum temperature (Tmax), daily minimum temperature (Tmin), daily average temperature (Tavg) in °C, and relative humidity (%) during the field trials—are described in Table S3. For example, among all locations, Sindh received the hottest days (>30 °C) compared to Bahawalpur and Islamabad. The descriptive data presented in Table 1 show the variations in SHWs under control and HS conditions. In control conditions, the mean DH was 119 days, with a range from 102 days (AUS33402) to 157 days (AUS34259), while in HS conditions the mean DH was 89 days, with a range from 77 days (AUS33403, AUS33415, AUS33421, AUS34453, and AUS34458) to 115 days (AUS34257).
In control conditions, the mean value for GY was 9.4 t/ha, with a range from 7 t/ha to 12 t/ha, while in HS conditions the mean value for GY was 6 t/ha, with a range from 4 t/ha (AUS30672, AUS33386, AUS33397, AUS33404, AUS34235, and AUS34257) to 8 t/ha (AUS30627, AUS30642, AUS30648, AUS33414, and AUS34231). For TKW in control conditions, the mean value was 47 g, with a range from 19 g (AUS30660) to 68 g (AUS33417), while in HS conditions the mean value was 36 g, with a range from 18 g (AUS34257) to 49 g (AUS30296). Phenotypic data are presented in Supplementary Table S2.
Pearson’s correlation coefficients are given in Figure 1 for all traits in control and HS conditions, along with their distribution graphs. Positive correlation was observed between yield-related traits such as DH and TKW (r = 0.566 ***), GY and DH (r = 0.718 ***), SW and SL (r = 0.518 ***), PH and TKW (r = 0.496 ***), SW and GY (r = 0.590 ***), GY and TKW (r = 0.510 ***), GY and SL (r = 0.784 ***), and SL (r = 0.752) and DM and SL (r = 0.785 ***).
Similarly, most of the other traits showed significant positive correlation with one another. Some of the traits showed negative correlation with one another, i.e., SpSP showed highly negative correlation with DH (r = −0.814 ***), DM (r = −0.775 ***), TpP (r = −0.575 ***), PH(r = −0.384 ***), SL (r = −0.585 ***), GpS (r = −0.067), SW (r = −0.268 ***), GY(r = −0.611 ***), and TKW (r = −0.480 ***).

2.2. Marker Statistics

In total, 66,836 markers were genotyped using the 50 K SNP chip. Thirty-eight markers were removed after quality control due to missing data. A further 27,485 markers were removed due to having MAF < 0.05. Subsequently, 39,313 markers were used for the GWASs. These SNPs were distributed on all chromosomes, with the maximum number of SNPs on chr6A (n = 2484) and the minimum number of SNPs on chr4D (n = 794). The B-genome contained the greatest number of SNPs (n = 15,190), followed by the A-genome (n = 14,269) and the D-genome (n = 9926).

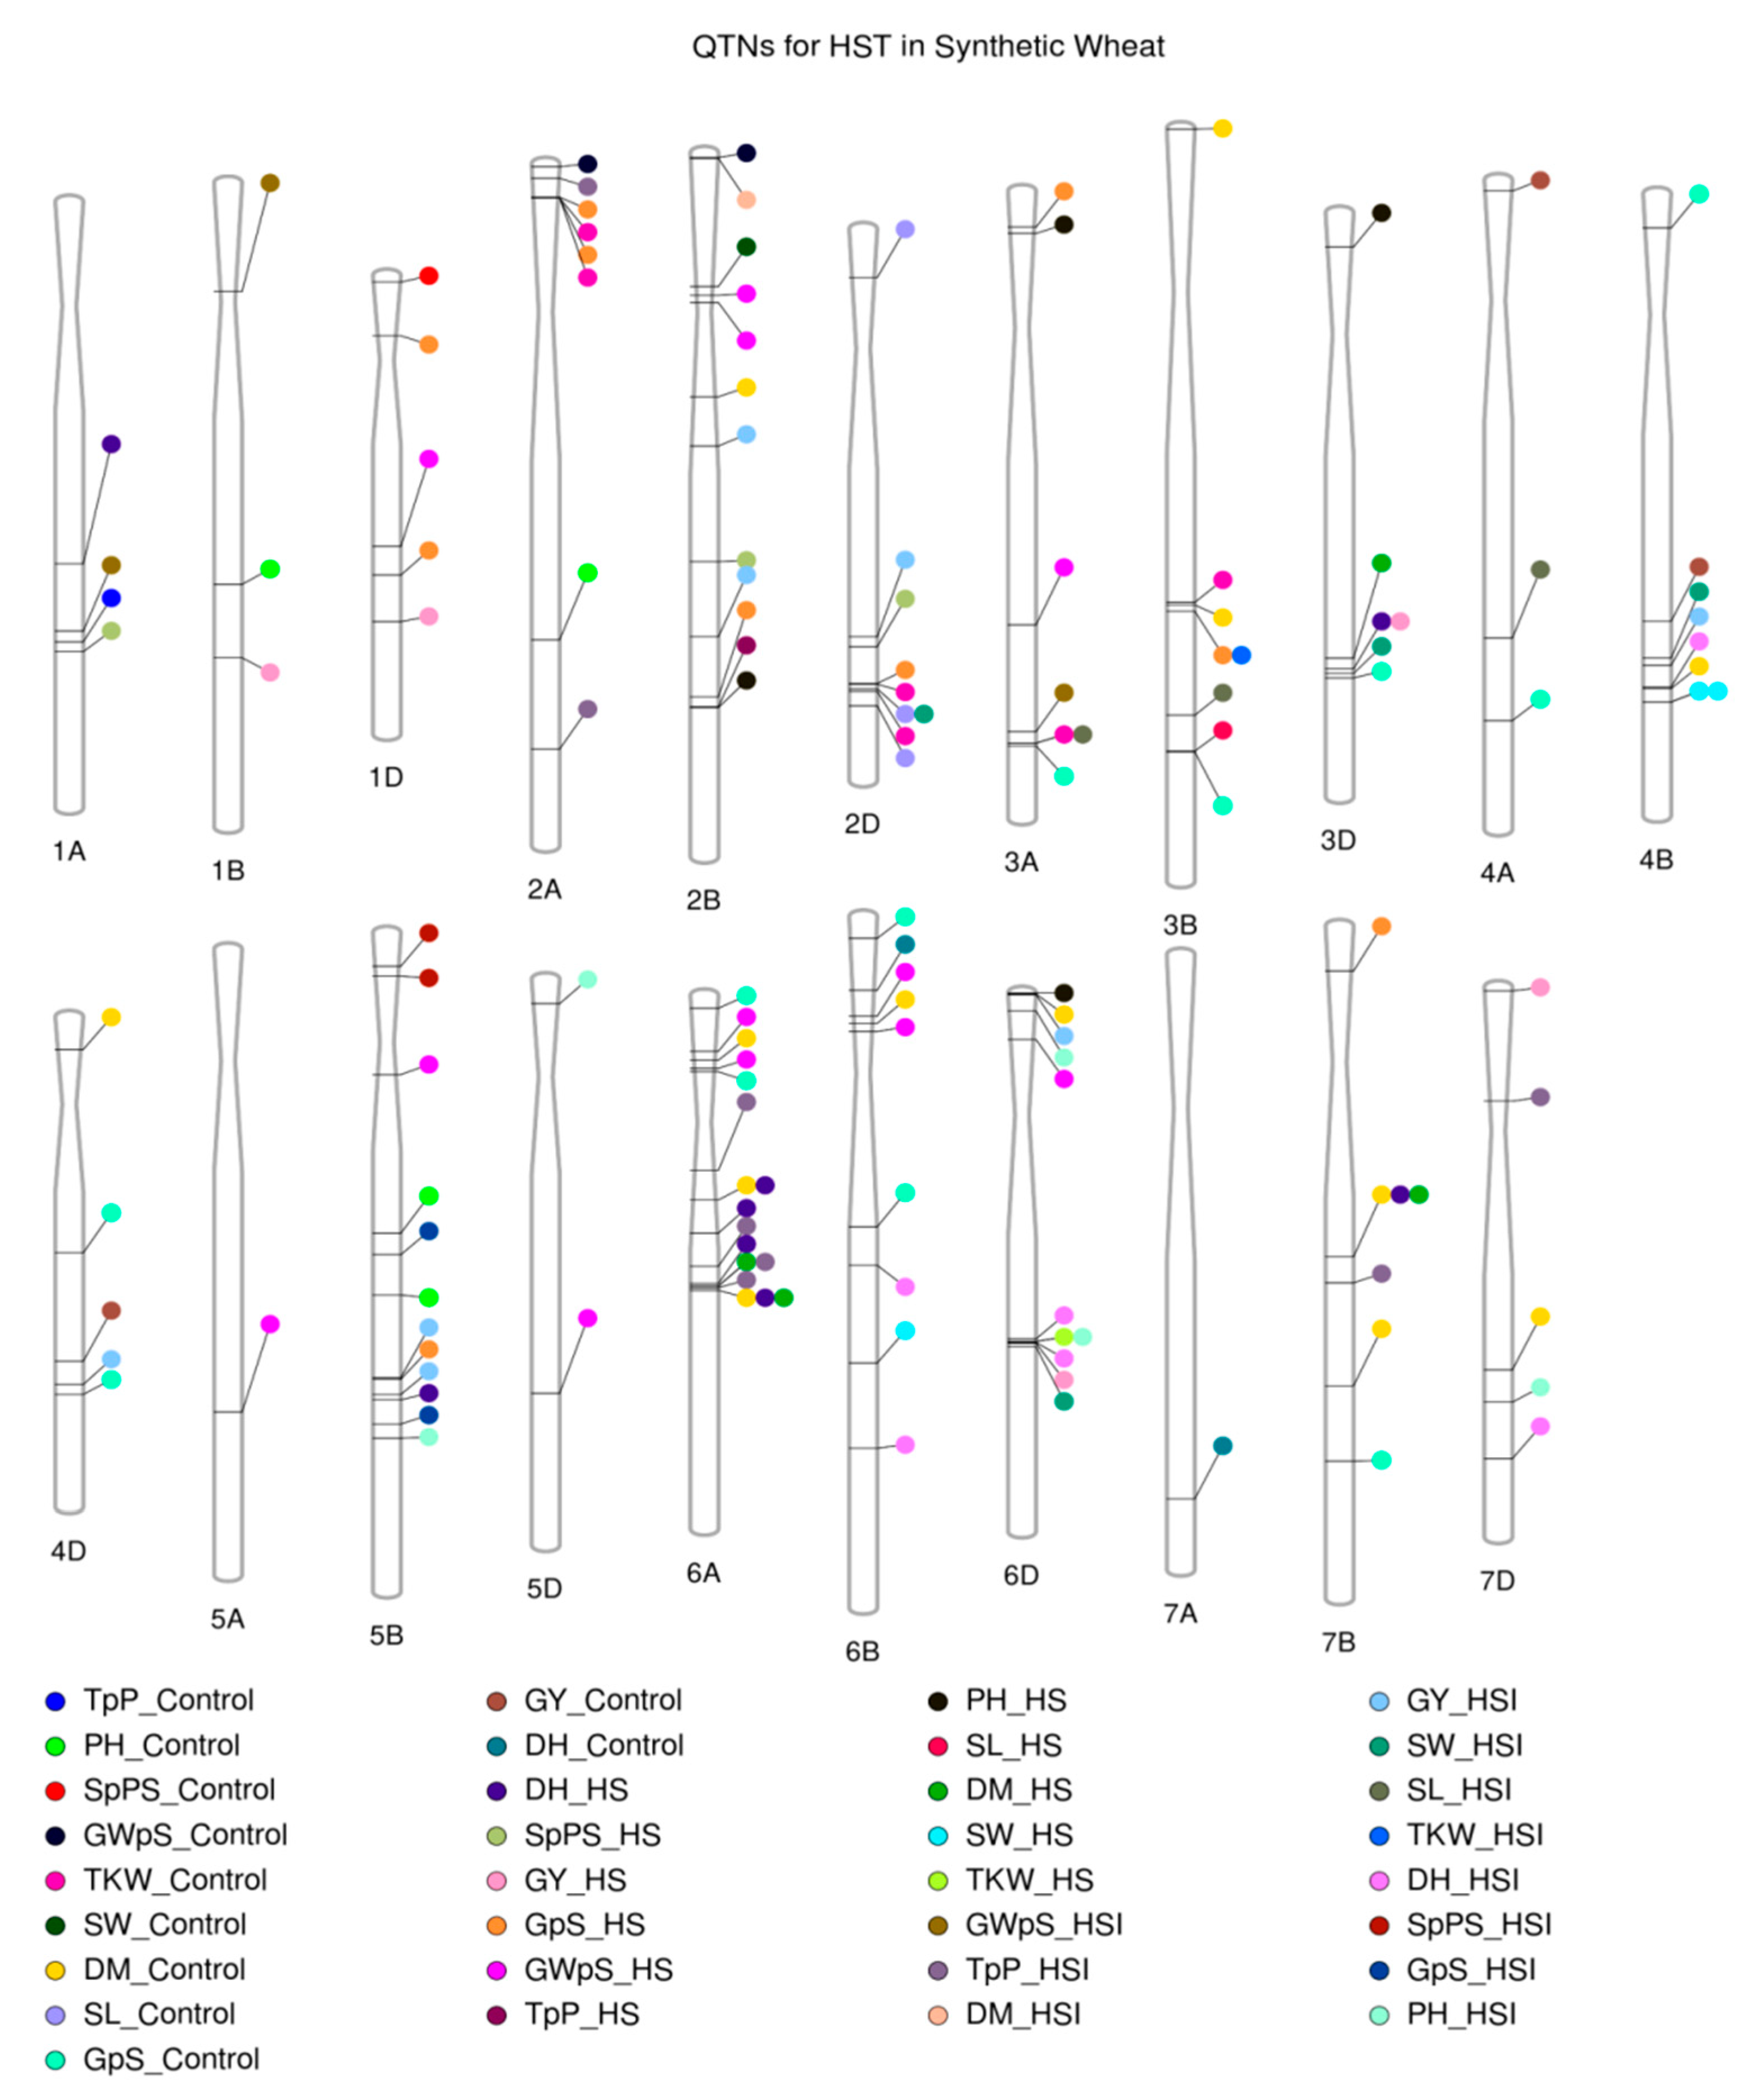
2.3. QTNs Associated with Yield Traits under Heat Stress

In total, 143 QTNs were identified, out of which 48 QTNs were identified in control conditions, 52 QTNs were identified in HS, and 43 QTNs were identified for HSI. The greatest number of QTNs was identified for GpS (n = 24), while the fewest QTNs were identified for SpSP (n = 6). On chr2B and 5B, the highest number of QTNs (n = 12) was identified, while the lowest number of QTNs (n = 1) was found on chr5A and chr7A. In total, two QTNs were consistently identified in control and HS conditions. A QTN on chr7B at ~437 Mb was consistently associated with DM in control and HS conditions. Another QTN on chr6A at 390 Mb was consistently associated with DM both in control and HS conditions.
In total, 15 QTNs were pleiotropically associated with multiple traits. A QTN on chr1A at ~560 Mb was associated with multiple yield-related traits, including GWpS, TpP, and SpSP, in both control and HS conditions. A QTN on chr2A at ~ 44 Mbs was associated with GpS and TKW in both HS and control conditions. On chr2B, a QTN found at ~6 Mb was associated with GWpS and DM in both HSI and control conditions. Another QTN on the same chromosome at ~731 Mb was associated with TpP and PH under HS conditions. A QTN on chr2D at ~598 Mb was associated with GpS and TKW in both HS and control conditions; another QTN on the same chromosome at ~ 606 Mb was found to be associated with SL and SW in control and HSI conditions. A QTN was found on chr3A at ~ 727 Mb, associated with SL and TKW in both HSI and control conditions. On chr3B, three QTNs were found to be associated with multiple yield traits: one at ~625 Mb, associated with TKW and DM in control conditions; another at ~637 Mb was associated with GpS and TKW in both HS and HSI conditions; and a QTN at ~822 Mb was associated with SL and GpS in both HS and control conditions. A QTN was found on chr3D at ~602 MB, linked with DH and GY in HS conditions. On chr5B, a QTN was found at ~588 Mb, associated with GY and GpS in both HS and HSI conditions. On chr6A, two QTNs were found: one at ~270 Mb, associated with DH and DM in both HS and HSI conditions; and the other at ~380 Mb, associated with DH, TpP, and DM in both HS and HSI conditions. A QTN on chr6D at ~458 Mb was linked with DH, PH, TKW, and GY in both HS and HSI conditions. On chr7B, a QTN at ~437 Mb was found to be associated with DH and DM in both HS and control conditions. All of the QTNs associated with multiple traits in HS conditions are presented in Figure 2 and Table 2.
Likewise, the QTNs associated with multiple traits were designated as pleiotropic QTNs (Table 3). In total, 14 pleiotropic QTNs were identified, out of which 3 QTNs on chr2D, chr3D, and chr6D were contributed by the D-sub genome and may carry novel alleles from Ae. tauschii. A QTN on chr2A at ~44 Mb was associated with GpS and TKW under both HS and control conditions. Another QTN on chr3D was associated with DH and GY and could be an important locus because plants tend to flower early to escape heat stress, and simultaneous control of such traits is an important finding.

2.4. Co-Localization of QTNs and Heat Shock Proteins

In total, eight QTNs were found in proximity to HSPs under HS conditions (Table 4). Two QTNs on chr2B were found in proximity to HSPs, but the QTN (AX-94760904) associated with TpP was the closest to TaHSP70.24, at ~731 Mb. A QTN (AX-95237322) on chr3D at ~45 Mb associated with PH was found in proximity to HSP TaHSP40.95. A QTN (AX-109911103) on chr5A at ~611 Mb and a QTN (AX-94886530) on chr5B at ~186 Mb, associated with GWpS, were found in proximity to HSPs TaHSP40.150 and TaHSP40.155, respectively.
Based on the SNP effect, favorable and unfavorable alleles were identified, and their frequencies were determined. For DH, seven favorable and unfavorable alleles were identified in HS conditions. The scatterplot in Figure 3 shows the effects of the favorable and unfavorable alleles on DH; with the increase in the number of favorable alleles, the number of days to heading decreased significantly, while an increase in the number of unfavorable alleles reduced the DH. A similar pattern was observed in GY: with the increase in the number of favorable alleles, GY increased, while with the increase in the number of unfavorable alleles, GY decreased. The coefficients of determination (R2) indicated that effect of favorable alleles ranged from R2 = 0.77 (DH) to R2 = 0.66 (GY) (Figure 3), while for unfavorable alleles the range of effect was from R2 = 0.75 (DH) to R2 = 0.67 (GY) (Figure 3).

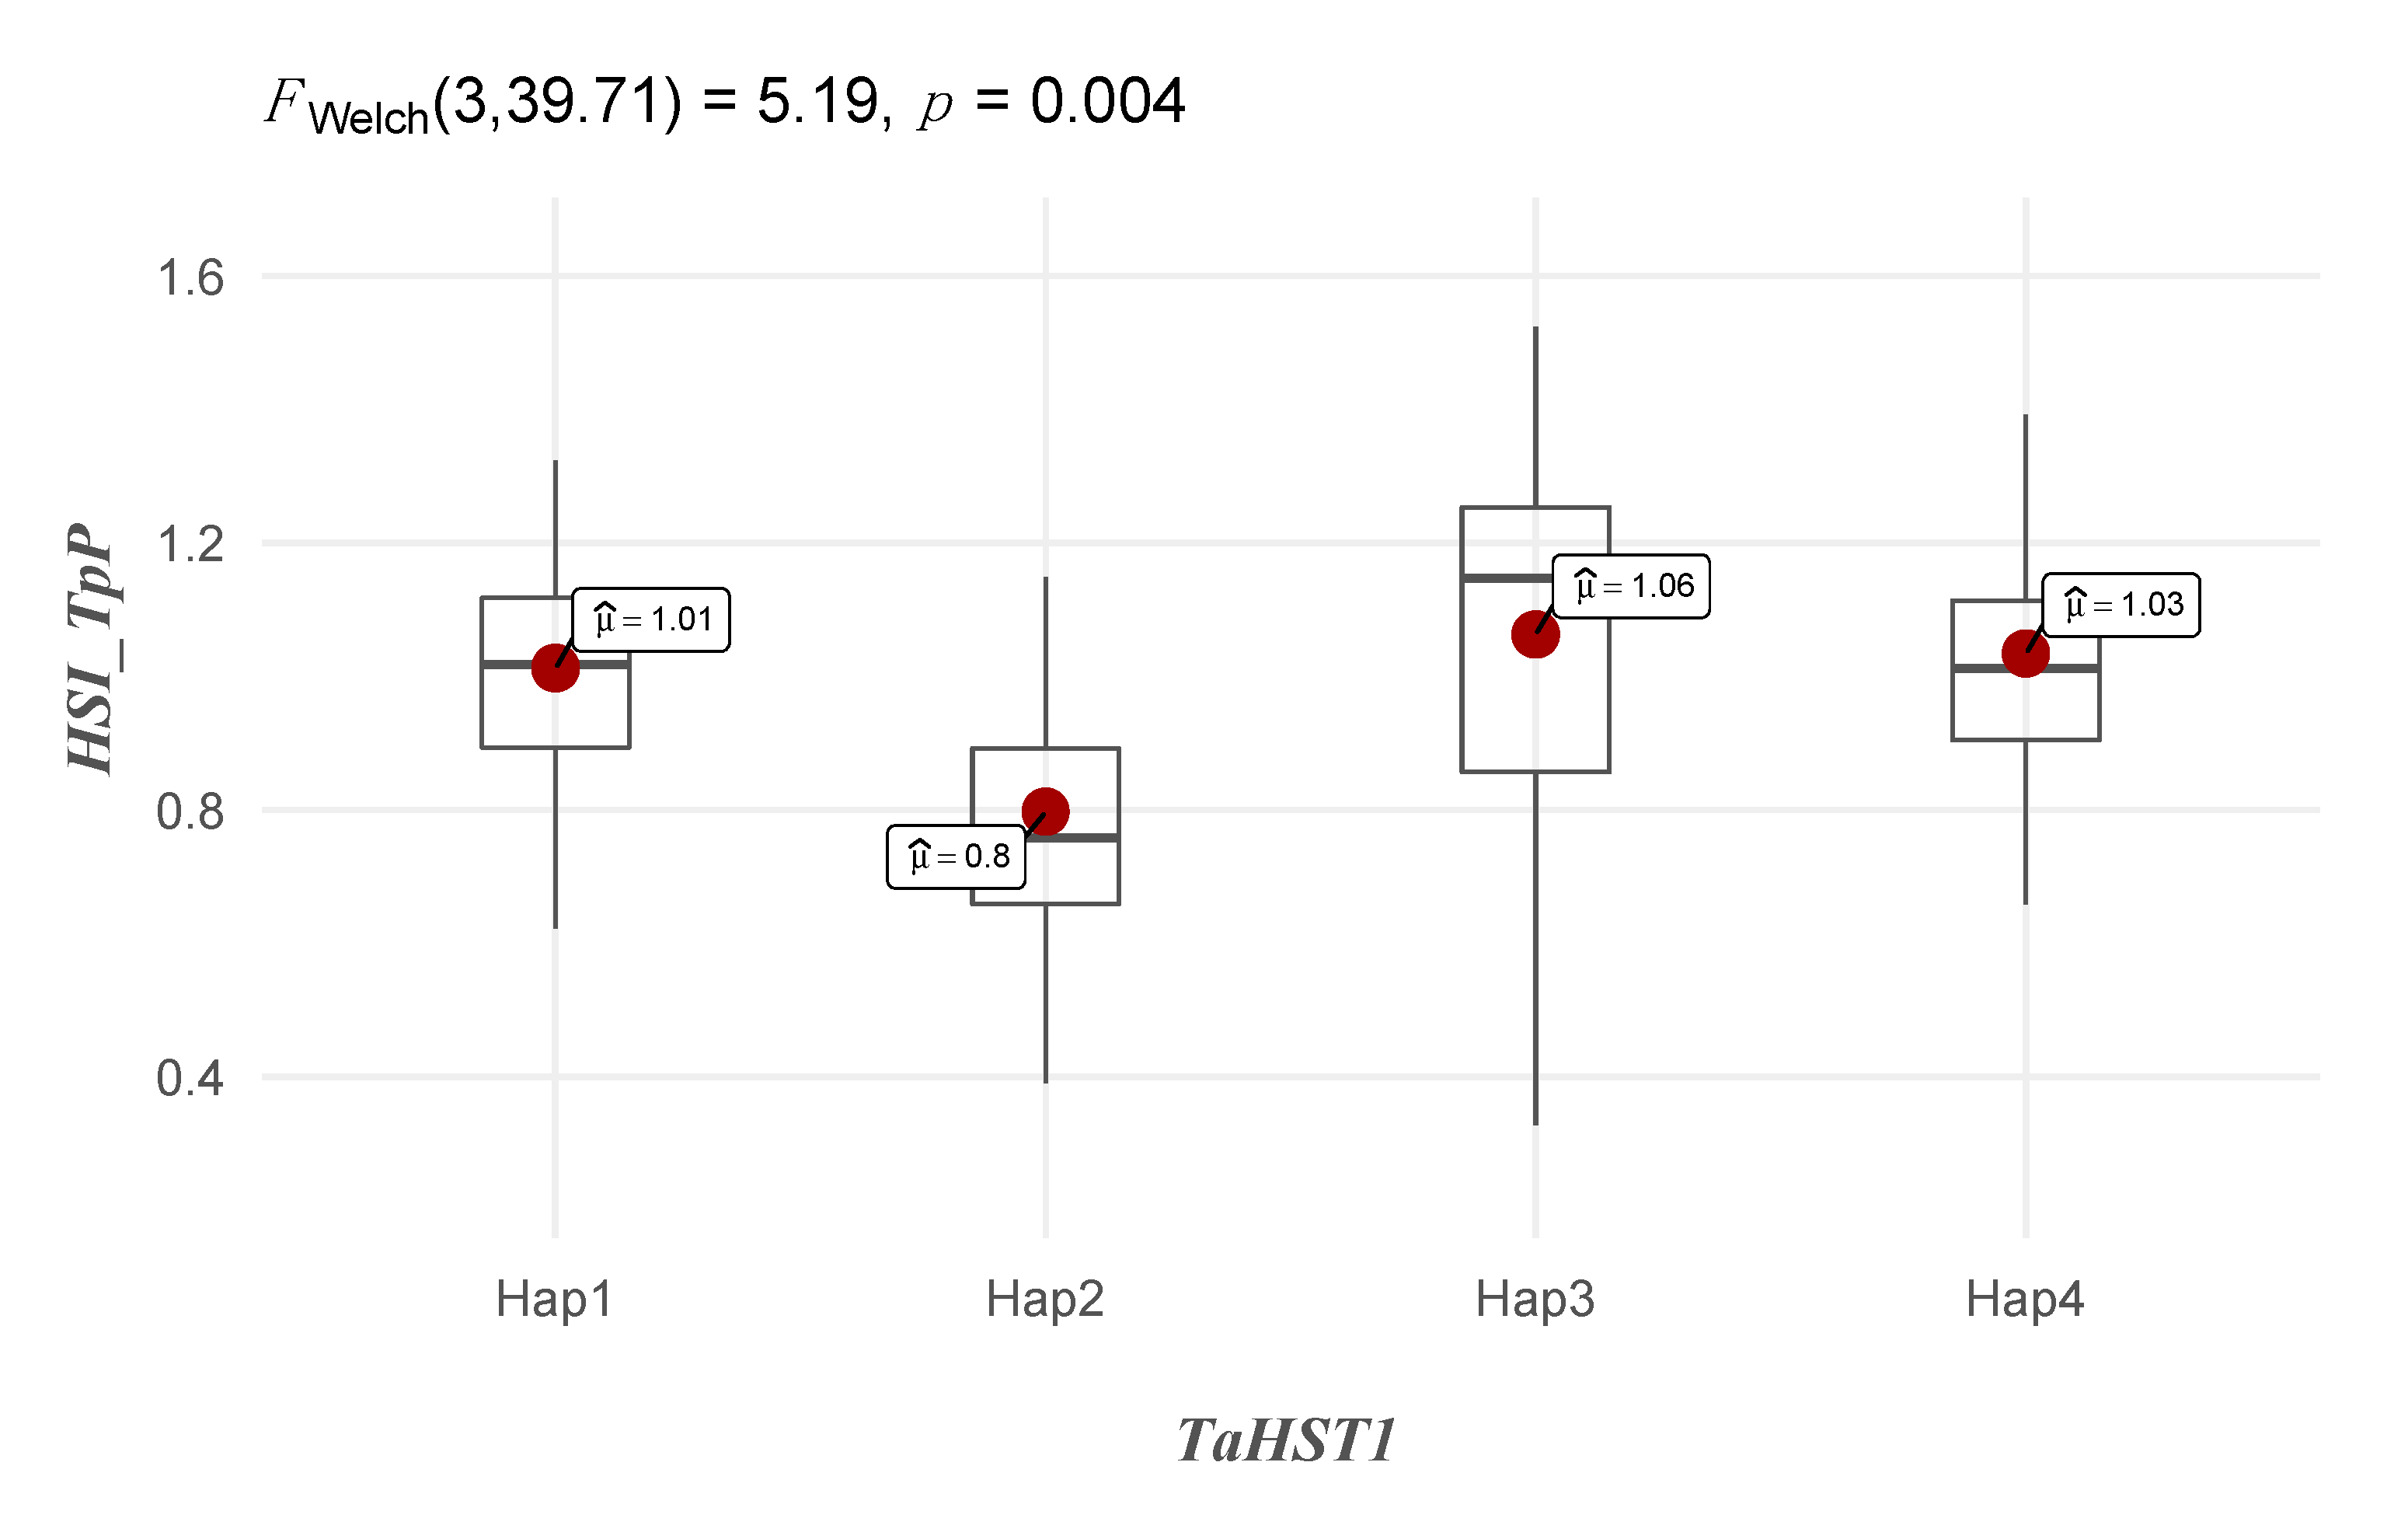
2.5. Characterization of the TaHST1 Locus in the Diversity Panel

Characterization of the TaHST1 locus in synthetic wheat accessions was performed using PCR-based primers. Based on the results of these primers, 15 haplotypes were identified. Hap-1 showed the highest frequency, at 25%, and all markers showed positive amplification. Hap-2 was present in 16% of accessions, and only two markers showed positive amplification, while Hap-3 and Hap-4 were present in 15% and 10% of accessions, with one and two deleted sites, respectively. The effect of top Hap1 to Hap4 was significant on HSI for TpP (Figure 4). All of the haplotypes, along with their frequency and phenotypic data under HS, are presented in Table 5.

3. Discussion

3.1. Phenotypic Variation for Agronomic Traits in SHWs under Heat Stress

In the past, a small number of SHWs and their derivatives were characterized to explain why they are superior to the conventional bread wheat genotypes, and they were evaluated for high-temperature tolerance [22,23,24,25]. Here, we describe the performance of a larger collection of 180 SHWs, which were sown at the normal time and late to characterize their variation in many agronomic traits and their relationships under heat stress conditions. ANOVA illustrated significant variation of accessions under normal and heat stress conditions, and the outcomes were consistent with those previously documented for bread wheat when identifying the genotype by environmental interactions and considerable variance in agronomic traits [26,27]. A greater variation was shown by SHWs for all of those traits that could be exploited in breeding for heat tolerance [25]. Overall, the highest broad-sense heritability was observed for DH, indicating that this trait has a high response to selection, and under HS conditions the large variations observed in SHWs could be very useful in heat tolerance breeding programs for wheat germplasm to fight high-temperature stress. Early heading and prematurity are preferable for high yield gains under heat-stressed conditions, due to the stress avoidance mechanism.
As expected, the GY of SHWs was reduced significantly under HS conditions. Conversely, late heading and late maturity resulted in low GY, demonstrating that the enhanced production is a result of their adaptation and capability to avoid late heat stress. To avoid the late high-temperature stress by the end of the season, early heading and maturity enable the SHWs to fill their grains casually. PH showed high-to-moderate heritability estimates and could also be a useful trait in HS tolerance breeding. To bring improvement in wheat, GY has always been the most important criterion for direct breeding, and the further improvement of GY through direct selection may not be easy, due to the low heritability estimates suggested by the findings of the present study. The low heritability estimates obtained for GY suggest that direct selection of the GY for further betterment may be difficult in wheat. Therefore, indirect selection for increased GY at elevated temperatures using yield-related traits is an appropriate criterion for screening for tolerance to abiotic stresses, including heat and drought.

3.2. Effects of Heat Stress in Synthetic Hexaploid Wheat

It was observed that under HS conditions, all of the traits showed a decreasing trend, except for SpSP. This is likely due to the fact that spikes emerge at the onset of the reproductive stage when temperature conditions are optimal. Some SHW accessions (e.g., AUS30284, AUS30286, AUS30297, AUS30637, AUS30645, and AUS30660) showed higher resilience to HS conditions for yield-related traits.
GY is highly affected by the environment, as described by Sharma et al. [28]. During heat stress conditions, a noticeable decrease in yield and other developmental traits was observed, and many other reports of the heat stress responses of wheat also drew the same conclusion [28]. High-temperature stress has shown significant decreases in PH [29], maturity time [30], flowering time [31], number of grains per spike and weight of grains per spike [32], TKW [33,34], and GY [35]. The reduction in GY was observed more during the year 2015 as compared to 2014 (39% and 36%, respectively), because of higher temperatures. During this experiment, we observed that the 2 °C rise in temperature in the year 2015 reduced the GY by 5% compared to 2014. A previous study observed a 3 to 4% decrease in wheat production under controlled conditions for every 1 °C increase above 15 °C, and the number of kernels declined by 12.5% for every 1 °C increase from 25/20 °C to 35/20 °C [33]. Similarly, it has been indicated by global simulations that the production of wheat will decrease by 6% on average for every 1 °C rise in temperature, equating to a yield decline of almost 42 million tons [36].

3.3. GWASs for the Identification of Loci Associated with Heat Stress Tolerance

Identification of QTNs associated with HST is crucial for breeders. Therefore, a number of gene mapping studies were conducted at the flowering and reproductive stages [13,37]. Recently, Tanin et al. [21] compiled all of the abiotic-stress-related QTLs in wheat as meta-QTLs and provided a detailed framework for comparative studies. In total, 11 meta-QTLs were aligned with those found in our work, including 3QTLs for GY on chr1B, chr1D, and chr2B. Two QTLs were identified by Sangwan et al. [38] on chr2A and 2D for DH. In our study, no QTNs were identified on chr2A or2D. However, eight QTNs were identified on chr1A, chr3D, chr5B, chr6A, and chr7B in HS. Similarly, two QTLs were identified on chr2D for DM [38]. In contrast, four QTNs were identified in our study on chr3D, chr6A, and chr7B. For PH, four QTNs were identified on chr2B, chr3A, chr3D, and chr6D. Meanwhile, in previous studies, two QTLs were identified on chr2A and chr4A for PH [38]. For SL, three QTLs were identified by Maulana et al. [15] on chr3B and chr7D.
In our studies, a QTN was identified on chr3B for SL in HS. Three QTNs were identified for SpSP on chr1A, chr2B, and chr2D. No QTL had been identified previously for SpSP on these chromosomes. In contrast, eight QTLs were identified on chr1D, chr3A, chr4B, chr4D, chr5A, chr6A, and chr6B [39]. Three QTLs were identified on chr2B, chr3A, and chr5B for GpS [40]. In our study, three QTNs were identified on same chromosomes for GpS in HS. For GY, two QTLs were identified on chr2B and chr2D [41]. In our studies, five QTNs were identified on chr1B, chr1D, chr3D, chr6D, and chr7D for GY in HS. For TKW, in our study, only one QTN was identified on chr6D in HS, while five QTLs were identified by Li et al. [40]—on chr1D, chr4D, chr5A, chr5D, and chr6B. As discussed by Ogbonnaya et al. [42], favorable alleles in a single environment show little improvement in multiple-stress environments. We also observed a similar phenomenon in the present study, where environment-specific MTAs and MTAs for the average environments did not significantly overlap. Differences in loci controlling stability and environment-specificity suggest that there may be separate evolutionary trajectories for them.

3.4. Co-Localization of QTNs and HeatShock Proteins

All of the HS-specific QTNs in proximity to HSPs could be ideal candidates for genes underpinning heat tolerance, and due to the use of SHWs they are likely to carry new alleles of HSPs. Several HSPs (e.g., TaHSP100, TaHSP70, and TaHSP90) are induced underheat stress conditions [26]. In this context, the QTN for SW on chr4B is likely to be a good candidate for further studies, because its closet HSP is TaHSP70.52, which was reported to be induced during heat stress. There is a need for detailed analysis of the HSPs reported in this study for further validation.

3.5. Characterization of the TaHST1 Locus in the Diversity Panel

The TaSHT1 locus plays a significant role in HST at both the seedling and reproductive stages. Five markers were used to detect the presence of theTaSHT1 locus in SHW [17]. Recently, Khan et al. (2022) [43] identified 24 haplotypes of TaHST1 in Pakistani wheat cultivars. Fifteen haplotypes were determined based on the results of these markers. The results indicated that the presence of this QTL has significant effects on wheat under heat stress conditions. Two markers for this locus (Xhau-2 and -3) have shown significant associations with phenotypic traits under heat stress conditions. It is likely that haplotype distribution in SHW is different from that in cultivated wheats, and that new alleles are available due to the use of durum wheat in developing SHWs. The combination of 127 bp alleles at Xhau-4 and the presence of alleles at Xhau-5 have a positive impact on yield-related traits and could be used as a positive marker for selecting heat-tolerant accessions.
Conclusively, the data generated here on a collection of SHWs represent a promising source for selecting heat-tolerant candidates for use in breeding, and the loci identified here can enhance our knowledge of the distribution of heat-tolerant alleles in wheat.

4. Materials and Methods

4.1. Plant Material

A collection of 180 SHWs was used for this experiment (Table S1). These SHWs were derived from the combinations of 44 durum wheat cultivars and 100 Ae. Tauschii accessions as a subset of the panels previously characterized for grain morphology [44], biotic stress resistances [45,46], and grain quality [47].

4.2. Field Evaluation

To allow exposure of the genotypes to different heat treatments for the duration of flowering and ripening, six field tests were carried outat three different sites for 2 years (2014 and 2015), with two sowing time treatments (normal planting, termed as control; and late sowing, termed as heat stress (HS)). The three locations were the Regional Agricultural Research Institute at Bahawalpur in Punjab Province (BWP), the National Agricultural Research Centre (NARC) at Islamabad (ISB), and the Nuclear Institute of Agriculture at Tando Jam in Sindh (SND). The dates of normal sowing and late sowing were 15 November and 20 December, respectively. The sowing of genotypes was performed in two-row plots that were 2 m long and spaced 30 cm apart, with 15cm between rows, and in a randomized complete block design with three replications. The weight of seeds sown per plot was adjusted to obtain a constant seeding rate of 30 viable seeds per row by considering measurements of TKW and germination level. A small-plot grain drill was used for sowing purposes. Before plantation, triple superphosphate (4.3 g m−2 of P2O5) was applied by furrow placement, and urea was applied earlier than the second irrigation (8.6 g m−2 of N). During the crop season, irrigation was carried out four times at the following growth stages: (1) from germination to the appearance of seedlings, (2) from emergence to the double-ridge stage, (3) from double-ridge to anthesis, and (4) from anthesis to maturity [48]. The following traits were studied: plant height (PH, cm), measured as the distance from the soil level to the top of the spike, excluding awns; days to heading (DH); days to maturity (DM), considered as the number of days from sowinguntil the plant reached 50% maturity; grain number per square meter (GN), counted from 20 spikes randomly from every plot; tillers per plant (TpP), which were randomly selected from each genotype; spike length (SL) from the origin of the spike to the tip of the spike, without awns; spikelets per spike (SpSP), which were collected from each accession by picking three spikes and then counting the spikelets; weight of spikes per spike (SW), which was determined by weighing 3 spikes from each line; grain weight per spike (GWpS), which was calculated by measuring the weight of three randomly selected spikes from each row; thousand-kernel weight (TKW, g), which was measured after harvest by weighing double samples of 500 kernels from each plot; and grain yield (GY, kg m−2), which was calculated as the weight of grains produced per unit area.
The heat susceptibility index (HSI) was calculated using the following formula: for example, for grain yield, HSIGY = (1 − Y/Yp)/D, where Y represents the yield of a genotype during the late planting, Yp shows the mean yield of genotypes at the time of normal planting, and stress intensity D = 1 − X/Xp, where X indicates the mean Y of all genotypes and Xp is the mean Yp of all genotypes.

4.3. Genotyping for the TaHST1Locus

The TaHST1 locus was identified by using five primers: xhau1, xhau2, xhau3, xhau4, and xhau5. The primers’ details are listed in Table 6. The PCR reaction mixture (10 µL) contained PCR H2O (3 µL), master mix (5 µL), forward and reverse primers (0.5 µLeach), and DNA (1 µL). The conditions for PCR were as follows: initial denaturation at 95 °C for 5 min (1 cycle) or 94 °C for 1 min; annealing at 56 °C, 58 °C, 60 °C, and 65 °C for 1 min; and extension at 72 °C for 1 min (35 cycles); 2% agarose gel was used to check the PCR products.

4.4. DNA Extraction and Genotyping

Extraction of DNA was carried out using an amended CTAB method [49]. Synthetic wheat accessions were genotyped by using a 50 K SNP chip containing 66,798 SNPs. After filtering with a minor allele frequency of <5% and missing data of <20%, a total of 39,383 SNPs were then used for GWASs.

4.5. Statistical Analysis

4.5.1. Analysis of Phenotypic Data

The phenotypic data were collected and arranged in Microsoft Excel. To test the statistical significance among different sources of variation, analysis of variance (ANOVA) was applied for all 11 traits. Phenotypic effects in the ANOVA model were divided into overall mean, genotypic effect, effect of random error, effect on replicate (i.e., block) in the environment (including both year and location), effect of environment, genotype with effect of treatment, genotype with environmental effect, and effect of treatment. Let ylijk be the observed value of the trait of interest, where i is the accession and kis the replicate under the jth environmental condition along with the years and locations in this study, while l is the treatment. The linear model applied in ANOVA is as follows:
y l i j k = μ + D l + R k / j + G i + E j + G E i j + G D i l + ε l i j k
where l = 1, 2, …, L (L = 2 for normal and heat stress treatments), i = 1, 2, …, n (n = 203), j = 1, 2, …, e (e = 6 with 3 locations and 2 years), k = 1, 2, …, r (r = 2) is the total mean value of the entire population, Rk/j is the kth effect on the replicate by the jth environment, Gi is the effect of the genotype on the ith accession, Ej is the effect of the environment on the jth environment, GEij is the effect of the interaction between the ith accession and the jth environment, GDil is the effect of the interaction between the ith accession and the lth treatment, εlijk is the random error effect (which is supposed to be distributed normally, with a mean value of zero), and the variance is σ ε 2 . The ANOVA illustrated above was utilized in SAS software (SAS Institute, Cary, NC, USA, 2007) together with the GLM methods.
The genotypic values from the best linear unbiased prediction (BLUP) under normal and heat stress treatments for all of the accessions were considered as the subsequent phenotypes for comparison. The BLUP values were deliberated as follows: the trait experimental value was defined as yijk, where i is the accession, k is the replicate, and j is the environment, with the locations and years used in this study. The BLUP values for the mixed model were determined as follows:
y i j k = μ + R k / j + G i + E j + G E i j + ε i j k ,   and   ε i j k ~ N ( 0 , σ ε 2 )
where i = 1, 2, …, n (n = 203), j = 1, 2, …, e (e = 6 by three locations and two years), k = 1, 2, …, and r (r = 2), Ej,GEij,Gi, μ , and Rk/j, are as described above. Otherwise, normal distribution was followed, and all of the effects were observed as random effects R k / j ~ N ( 0 , σ R 2 ) , G i ~ N ( 0 , σ G 2 ) , E j ~ N ( 0 , σ E 2 ) , and G E i j ~ N ( 0 , σ G E 2 ) , where σ R 2 , σ G 2 , σ E 2 , and σ G E 2 are the variances representing the replicate, genotype, environment, and genotype–environment interaction, respectively. The values of BLUP were measured with the help of the MIXED procedure in the SAS software (SAS Institute, Cary, NC, USA, 2007). Pearson’s correlation was computed using the R program.

4.5.2. Genotypic Data Analysis and GWASs

GWASs for 11 phenotypic traits were conducted using a recently developed model selection algorithm—the Fixed and Random Model Circulating Probability Unification (FarmCPU; Liu et al., 2016) [50]. FarmCPU takes into account the confounding problem between covariates and test markers using a fixed-effects model (FEM) and a random-effects model (REM). The first five principal components calculated using TASSEL was used as covariates. The default p-value threshold that FarmCPU used was a Bonferroni-corrected threshold of 0.01. This Bonferroni-corrected threshold was overly restrictive when the LD among genotypic markers was large, so the threshold was calculated using the formula “p = 0.05/number of markers”, with 1000 permutations. In this function, the phenotypes were permuted to break the relationship with the genotypes. A vector of minimum p-values of each experiment was outputted, and the 95% quantile value of the vector was recommended for the p threshold in the FarmCPU model. The quantile–quantile (Q–Q) plot was used for assessing the fitness of the model to the population structure.
All of the SNPs associated with phenotypes under heat stress conditions were compared with the heat shock protein (HSP) framework of wheat [51], and those SNPs found within a ~5 Mb region of HSPs were reported to be candidate regions associated with TaHSPs.
Favorable and unfavorable alleles were identified for all marker–trait associations (MTAs). For each MTA, the allele with an increasing effect was deemed to be a favorable allele, while the alternate allele was deemed to be an unfavorable allele (i.e., allele with decreasing effect). For some traits, such as DH and PH, the allele with decreasing effect was deemed to be a favorable allele and the alternate allele was deemed to be an unfavorable allele (i.e., allele with increasing effect). In each accession, the frequency of favorable and unfavorable alleles was counted based on the number of trait-associated SNPs. The coefficient of determination (R2) was determined between the number of favorable/unfavorable alleles and the relevant phenotype as a measure of the combined allelic effects of all trait-associated SNPs on the phenotype.

Supplementary Materials

The following supporting information can be downloaded at https://www.mdpi.com/article/10.3390/plants12081610/s1: Supplementary Table S1: Names and pedigree of the 180 genotypes used in this study; Supplementary Table S2: Phenotypic data on synthetic hexaploid wheats in control and heat stress treatments; Table S3a: Meteorological information of Bahawalpur (BWP) for normal planting and late planting during the two cropping seasons (2013/14 and 2014/15); Table S3b: Meteorological information of Sindh (SND) for normal planting and late planting during the two cropping seasons (2013/14 and 2014/15); Table S3c: Meteorological information of Islamabad (ISD) for normal planting and late planting during the two cropping seasons (2013/14 and 2014/15); Supplementary Table S4: Phenotypic data on synthetic hexaploid wheats in control and heat stress treatments; Supplementary Table S5: Genotypic data as a HapMap file of all synthetic hexaploid wheats used in this study; Figure S1: Manhattan and quantile–quantile (Q-Q) plots of various phenotypic traits, including DH (A), TKW (B), TpP (C), PH (D), SL (E), SpSP (F), GpS (G), SW (H), GWpS (I), and GY (H); Manhattan plots using BLUP values.

Author Contributions

A.M., A.A. and M.B. conducted the experiment and prepared the manuscript. B.B. and H.Q. assisted in data collection. Z.M., M.S. and M.B. performed the GWAS analyses. F.W., M.B. and X.P. designed the experiment and approved the manuscript. All authors have read and agreed to the published version of the manuscript.

Funding

This research received no external funding.

Data Availability Statement

All of the phenotypic and genotypic data used in this study are shared in the Supplementary Materials.

Acknowledgments

We greatly acknowledge Awais Rasheed (CIMMYT-China and QAU, Pakistan) for his valuable assistance during this study.

Conflicts of Interest

The authors declare no conflict of interest.

References

  1. Faostat, F. 2017. Available online: https://www.fao.org/faostat/en/#data (accessed on 18 January 2018).
  2. Thistlthwaite, R.J.; Tan, D.K.Y.; Bokshi, A.I.; Ullah, S.; Trethowan, R.M. A phenotyping strategy for evaluating the high temperature tolerance of wheat. Field Crops Res. 2020, 255, 107905. [Google Scholar] [CrossRef]
  3. Asseng, S.; Foster, I.; Turner, N.C. The impact of temperature variability on wheat yields. Glob. Chang. Biol. 2011, 17, 997–1012. [Google Scholar] [CrossRef]
  4. Cossani, C.M.; Reynolds, M.P. Physiological Traits for Improving Heat Tolerance in Wheat. Plant Physiol. 2012, 160, 1710–1718. [Google Scholar] [CrossRef] [PubMed] [Green Version]
  5. Li, H.; Rasheed, A.; Hickey, L.; He, Z. Fast-Forwarding Genetic Gain. Trends Plant Sci. 2018, 23, 184–186. [Google Scholar] [CrossRef] [PubMed] [Green Version]
  6. Truong, H.A.; Lee, W.J.; Kishii, M.; Hong, S.-W.; Kang, C.-S.; Lee, B.C.; Lee, H. Assessment of synthetic hexaploid wheats in response to heat stress and leaf rust infection for the improvement of wheat production. Crop Pasture Sci. 2019, 70, 837–848. [Google Scholar] [CrossRef]
  7. Dreisigack, S.; Crossa, J.; Pérez-Rodríguez, P.; Montesinos-López, O.A.; Rosyara, U.; Juliana, P.; Mondal, S.; Crespo-Herrera, L.; Govindan, V.; Singh, R.P.; et al. Implementation of genomic selection in the CIMMYT global wheat program, findings from the past 10 years. Crop Breed. Genet. Genom. 2021, 3, e210005. [Google Scholar]
  8. Trethowan, R.M.; VanGinkel, M. Synthetic Wheat—An Emerging Genetic Resource; WheatSci. Trade. Ed.B. Carver; Wiley-Blackwell: Ames, IA, USA, 2009; pp. 369–386. [Google Scholar]
  9. International Wheat Genome Sequencing Consortium (IWGSC); Appels, R.; Eversole, K.; Stein, N.; Feuillet, C.; Keller, B.; Rogers, J.; Pozniak, C.J.; Choulet, F.; Distelfeld, A.; et al. Shifting the limits in wheat research and breeding using a fully annotated reference genome. Science 2018, 361, eaar7191. [Google Scholar]
  10. Zhang, R.; Liu, G.; Xu, H.; Lou, H.; Zhai, S.; Chen, A.; Hao, S.; Xing, J.; Liu, J.; You, M.; et al. Heat Stress Tolerance 2 confers basal heat stress tolerance in allohexaploid wheat (Triticum aestivum L.). J. Exp. Bot. 2022, 73, 6600–6614. [Google Scholar] [CrossRef]
  11. Su, P.; Jiang, C.; Qin, H.; Hu, R.; Feng, J.; Chang, J.; Yang, G.; He, G. Identification of potential genes responsiblefor thermo-tolerance in wheat under high temperature stress. Genes 2019, 10, 174. [Google Scholar] [CrossRef] [Green Version]
  12. Talukder, S.K.; Babar, A.; Vijayalakshmi, K.; Poland, J.; Prasad, P.V.V.; Bowden, R.; Fritz, A. Mapping QTL for the traits associated with heat tolerance in wheat (Triticum aestivum L.). BMC Genet. 2014, 15, 97. [Google Scholar] [CrossRef] [Green Version]
  13. Bennett, D.; Reynolds, M.; Mullan, D.; Izanloo, A.; Kuchel, H.; Langridge, P.; Schnurbusch, T. Detection of two major grain yield QTL in bread wheat (Triticum aestivum L.) unde rheat, drought and high yield potential environments. Theor. Appl. Genet. 2012, 125, 1473–1485. [Google Scholar] [CrossRef] [PubMed]
  14. Mason, R.E.; Hays, D.B.; Mondal, S.; Ibrahim, A.M.H.; Basnet, B.R. QTL for yield, yield components and canopy temperature depression in wheat under late sown field conditions. Euphytica 2013, 194, 243–259. [Google Scholar] [CrossRef]
  15. Maulana, F.; Ayalew, H.; Anderson, J.D.; Kumssa, T.T.; Huang, W.; Ma, X.-F. Genome-Wide Association Mapping of Seedling Heat Tolerance in Winter Wheat. Front. Plant Sci. 2018, 9, 1272. [Google Scholar] [CrossRef] [PubMed] [Green Version]
  16. Ahmed, H.G.M.D.; Naeem, M.; Zeng, Y.; Rashid, M.A.R.; Ullah, A.; Saeed, A.; Qadeer, A. Genome-wide association mapping for high temperature tolerance in wheat through 90k SNP array using physiological and yield traits. PLoS ONE 2022, 17, e0262569. [Google Scholar] [CrossRef]
  17. Lopes, M.S.; Dreisigacker, S.; Peña, R.J.; Sukumaran, S.; Reynolds, M.P. Genetic characterization of the wheat association mapping initiative (WAMI) panel for dissection of complex traits in spring wheat. Theor. Appl. Genet. 2015, 128, 453–464. [Google Scholar] [CrossRef]
  18. Wang, X.; Zhang, J.; Mao, W.; Guan, P.; Wang, Y.; Chen, Y.; Liu, W.; Guo, W.; Yao, Y.; Hu, Z.; et al. Association mapping identifies loci and candidate genes for grain-related traits in spring wheat in response to heat stress. Plant Sci. 2023, 331, 111676. [Google Scholar] [CrossRef]
  19. Ullah, S.; Randhawa, I.A.S.; Trethowan, R. Genome-wide association study of multiple traits linked to heat tolerance in emmer-derived hexaploid wheat genotypes. Mol. Breed. 2022, 41, 29. [Google Scholar] [CrossRef]
  20. Zhai, H.; Jiang, C.; Zhao, Y.; Yang, S.; Li, Y.; Yan, K.; Wu, S.; Luo, B.; Du, Y.; Jin, H.; et al. Wheat heat tolerance is impaired by heightened deletions in the distal end of 4AL chromosomal arm. Plant Biotechnol. J. 2021, 19, 1038–1051. [Google Scholar] [CrossRef]
  21. Tanin, M.J.; Saini, D.K.; Sandhu, K.S.; Pal, N.; Gudi, S.; Chaudhary, J.; Sharma, A. Consensus genomic regions associated with multiple abiotic stress tolerance in wheat and implications for wheat breeding. Sci. Rep. 2022, 12, 13680. [Google Scholar] [CrossRef]
  22. Aziz, A.; Mahmood, T.; Mahmood, Z.; Shazadi, K.; Mujeeb-Kazi, A.; Rasheed, A. Genotypic variation and Genotype × Environment Interaction for Yield-Related Traits in Synthetic Hexaploid Wheats under a Range of Optimal and Heat-Stressed Environments. Crop Sci. 2018, 58, 295–303. [Google Scholar] [CrossRef]
  23. Sharma, P.; Sareen, S.; Saini, M.; Verma, A.; Tyagi, B.S.; Sharma, I. Assessing genetic variation for heat tolerance in synthetic wheat lines using phenotypic data and molecular markers. Aust. J. Crop Sci. 2014, 8, 515–522. [Google Scholar]
  24. Sehgal, S.K.; Kaur, S.; Gupta, S.; Sharma, A.; Kaur, R.; Bains, N.S. A direct hybridization approach to gene transfer from Aegilops tauschii Coss. To Triticum aestivum L. Plant Breed. 2011, 130, 98–100. [Google Scholar] [CrossRef]
  25. Cossani, C.M.; Reynolds, M.P. Heat Stress Adaptation in Elite Lines Derived from Synthetic Hexaploid Wheat. Crops Sci. 2015, 55, 2719–2735. [Google Scholar] [CrossRef]
  26. Mohammadi, R.; Armion, M.; Sadeghzadeh, D.; Amri, A.; Nachit, M. Analysis of Genotype-by-Environment Interaction for Agronomic Traits of Durum Wheat in Iran. Plant Prod. Sci. 2011, 14, 15–21. [Google Scholar] [CrossRef]
  27. Degewione, A.; Alamerew, S. Genetic Diversity in Bread Wheat (Triticum aestivum L.) Genotypes. Pak. J. Biol. Sci. 2013, 16, 1330–1335. [Google Scholar] [CrossRef]
  28. Sharma, P.; Jha, A.B.; Dubey, R.S.; Pessarakli, M. Reactive oxygen species, oxidative damage, and anti oxidative defense mechanism in plants under stressful conditions. J. Bot. 2012, 26, 217037. [Google Scholar] [CrossRef] [Green Version]
  29. Singh, J.P.; Shambhoo, P.; Singh, K.N.; Randhir, S. Screening of heat tolerant wheat varieties by membrane thermo stability index in relation to yield and yield attributing traits. Int. J. Plant Sci. Muzz. 2007, 2, 159–165. [Google Scholar]
  30. Rahman, M.A.; Chikushi, J.; Yoshida, S.; Karim, A. Growth and yield components of wheat genotypes exposed to high temperature stress under control environment. Bangladesh J. Agric. Res. 2009, 34, 360–372. [Google Scholar] [CrossRef] [Green Version]
  31. Kazan, K.; Lyons, R. The link between flowering time and stress tolerance. J. Exp. Bot. 2015, 67, 47–60. [Google Scholar] [CrossRef] [Green Version]
  32. Cao, X.; Mondal, S.; Cheng, D.; Wang, C.; Liu, A.; Song, J.; Li, H.; Zhao, Z.; Liu, J. Evaluation of agronomic and physiological traits associated with high temperature stress tolerance in the winter wheat cultivars. Acta Physiol. Plant. 2015, 37, 90. [Google Scholar] [CrossRef]
  33. Wardlaw, I.; Wrigley, C. Heat Tolerance in Temperate Cereals: An Overview. Funct. Plant Biol. 1994, 21, 695–703. [Google Scholar] [CrossRef]
  34. Reynolds, M.; Balota, M.; Delgado, M.; Amani, I.; Fischer, R. Physiological and Morphological Traits Associated with Spring Wheat Yield Under Hot, Irrigated Conditions. Funct. Plant Biol. 1994, 21, 717–730. [Google Scholar] [CrossRef]
  35. Tewolde, H.; Fernandez, C.J.; Erickson, C.A. Wheat Cultivars Adapted to Post-Heading High Temperature Stress. J. Agron. Crop. Sci. 2006, 192, 111–120. [Google Scholar] [CrossRef]
  36. Asseng, S.; Ewert, F.; Martre, P.; Rotter, R.P.; Lobell, D.B.; Cammarano, D.; Kimball, B.A.; Ottman, M.J.; Wall, G.W.; White, J.W.; et al. Rising temperatures reduce global wheat production. Nat. Clim. Chang. 2015, 5, 143–147. [Google Scholar] [CrossRef]
  37. Vijayalakshmi, K.; Fritz, A.K.; Paulsen, G.M.; Bai, G.; Pandravada, S.; Gill, B.S. Modeling and mapping QTL for senescence related traits in winter wheat under high temperature. Mol. Breed. 2010, 26, 163–175. [Google Scholar] [CrossRef]
  38. Sangwan, S.; Munjal, R.; Ram, K.; Kumar, N. QTL mapping for morphological and physiological traits in RILs of spring wheat population of WH1021 X WH711. J. Environ. Biol. 2019, 40, 674–682. [Google Scholar] [CrossRef]
  39. Telfer, P.; Edwards, J.; Norman, A.; Bennett, D.; Smith, A.; Able, J.A.; Kuchel, H. Genetic analysis of wheat (Triticum aestivum) adaptation to heat stress. Theor. Appl. Genet. 2021, 134, 1387–1407. [Google Scholar] [CrossRef]
  40. Li, L.; Mao, X.; Wang, J.; Chang, X.; Reynolds, M.P.; Jing, R. Genetic dissection of drought and heat responsive agronomic traits in wheat. Plant Cell Environ. 2019, 42, 2540–2553. [Google Scholar] [CrossRef] [Green Version]
  41. Hassan, F.S.C.; Solouki, M.; Fakheri, B.A.; Nezhad, N.M.; Masoudi, B. Mapping QTLs for physiological and biochemical traits related to grain yield under control and terminal heat stress conditions in bread wheat (Triticum aestivum L.). Physiol. Mol. Biol. Plants 2018, 24, 1231–1243. [Google Scholar] [CrossRef]
  42. Ogbonnaya, F.C.; Rasheed, A.; Okechukwu, E.C.; Jighly, A.; Makdis, F.; Wuletaw, T.; Hagras, A.; Uguru, M.I.; Agbo, C.U. Genome-wide association study for agronomic and physiological traits in spring wheat evaluated in a range of heat prone environments. Theor. Appl. Genet. 2017, 130, 1819–1835. [Google Scholar] [CrossRef]
  43. Khan, M.I.; Kainat, Z.; Maqbool, S.; Mehwish, A.; Ahmad, S.; Suleman, H.M.; Mahmood, Z.; Ali, M.; Aziz, A.; Rasheed, A.; et al. Genome-wide association for heat tolerance at seedling stage in historical spring wheat cultivars. Front. Plant Sci. 2022, 13. [Google Scholar] [CrossRef] [PubMed]
  44. Rasheed, A.; Xia, X.; Ogbonnaya, F.; Mahmood, T.; Zhang, Z.; Mujeeb-Kazi, A.; He, Z. Genome-wide association for grain morphology in synthetic hexaploid wheats using digital imaging analysis. BMC Plant Biol. 2014, 14, 128. [Google Scholar] [CrossRef] [PubMed] [Green Version]
  45. Jighly, A.; Alagu, M.; Makdis, F.; Singh, M.; Singh, S.; Emebiri, L.C.; Ogbonnaya, F.C. Genomic regions conferring resistance to multiple fungal pathogens in synthetic hexaploid wheat. Mol. Breed. 2016, 36, 127. [Google Scholar] [CrossRef]
  46. Zegeye, H.; Rasheed, A.; Makdis, F.; Badebo, A.; Ogbonnaya, F.C. Genome-Wide Association Mapping for Seedling and Adult Plant Resistance to Stripe Rust in Synthetic Hexaploid Wheat. PLoS ONE 2014, 9, e105593. [Google Scholar] [CrossRef] [PubMed] [Green Version]
  47. Emebiri, L.C.; Oliver, J.R.; Mrva, K.; Mares, D. Association mapping of late maturity α-amylase (LMA) activity in a collection of synthetic hexaploid wheat. Mol. Breed. 2010, 26, 39–49. [Google Scholar] [CrossRef]
  48. Acevedo, E.; Silva, P.; Silva, H. Wheat growth and physiology. Bread Wheat Improv. Prod. 2002, 30, 39–70. [Google Scholar]
  49. Dreisigacker, S.; Tiwari, R.; Sheoran, S. Laboratory Manual: ICAR-CIMMYT Molecular Breeding Course in Wheat; ICAR/BMZ/CIMMYT: Haryana, India, 2013; p. 36. [Google Scholar]
  50. Liu, X.; Huang, M.; Fan, B.; Buckler, E.S.; Zhang, Z. Iterative usage of fixed and random effect models for powerful and efficient genome-wide association studies. PLoS Genet. 2016, 12, e1005767. [Google Scholar] [CrossRef]
  51. Nyquist, W.E.; Baker, R. Estimation of heritability and prediction of selection response in plant populations. Crit. Rev. Plant Sci. 1991, 10, 235–322. [Google Scholar] [CrossRef]
Figure 1. Pearson’s correlation coefficients (r) among multiple traits in control and HS conditions. *, **, *** represent significant p-values at p < 0.05, 0.01 and 0.001 respectively.
Plants 12 01610 g001
Figure 2. Location of QTNs identified on the chromosome. Abbreviations: DH: days to heading; DM: days to maturity; TpP: tillers per plant; PH: plant height; SL: spike length; SpSP: spikelets per spike; GpS: grains per spike; SW: spike weight; GWpS: grain weight per spike; GY: grain yield; TKW: thousand-kernel weight; HS: heat stress.
Plants 12 01610 g002
Figure 3. Scatterplot showing the effects of favorable and unfavorable alleles on the yield traits DH (days to heading) and GY (grain yield). In (A) the effect of number of favorable alleles and unfavorable alleles on DH in HS condition is shown and in (B) the effect of number of favorable and unfavorable alleles on the grain yield is shown.
Plants 12 01610 g003
Figure 4. Phenotypic effects of the top four TaHST1 haplotypes on the heat susceptibility index for tillers per plant in synthetic hexaploid wheats.
Plants 12 01610 g004
Table 1. Descriptive statistics of synthetic hexaploid wheat under control and HS conditions.
TraitControlHS aHIS b
MeanRangeSDMeanRangeSDMeanRangeSD
DH119.09102–15712.789.377–1157.4210.31–1.40.1
DM156.5139–1867.7115.575–1489.1110.55–1.970.1
TpP13.677.3–202.47.284–111.40.97−1.810.3
PH (cm)111.819–14016.979.956–1038.90.89−8–1.80.9
SL (cm)15.83–252.89.66–141.20.93−5.7–1.80.6
SpSP13.74–233.119.711–283.61.15−2.2–9.21.1
GpS28.314–607.422.811–526.40.87−8–51.3
SW (g)2.10.7–3.90.961.80.9–30.31.69−11–4.82.0
GWpS (g)1.20.4–2.40.41.40.4–70.70.83−2–102.2
GY (t/ha)9.47–121.26.034–80.90.590.4–0.80.09
TKW (g)46.919–688.236.318–494.70.94−2.9–3.20.7
a DH: days to heading; DM: days to maturity; TpP: tillers per plant; PH: plant height; SL: spike length; SpSP: spikelets per spike; GpS: grains per spike; SW: spike weight; GWpS: grain weight per spike; GY: grain yield; TKW: thousand-kernel weight. b HS: heat stress; HSI: heat susceptibility index.
Table 2. QTNs associated with phenotypic traits in control and heat stress (HS) conditions, with chromosome number, position, p-value, and minor allele frequency (MAF).
TraitsConditionSNPCHRPOSPos(Mb)MAFEffectp-ValuePrevious QTL/QTN
DHHSAX-1098427661A4.78 × 108477.740.203.167.23 × 10−5
HSAX-1115997263D6.02 × 108602.270.193.672.36 × 10−5
HSIAX-1795591724B6.50 × 108649.60.170.098.18 × 10−5
HSAX-945036235B6.19 × 108619.140.243.465.61 × 10−5
HSAX-861800886A2.71 × 108270.610.163.507.96 × 10−5
HSAX-956605356A3.15 × 108315.410.173.604.87 × 10−5
HSAX-947441606A3.81 × 108381.030.163.507.96 × 10−5
HSAX-1099502876A3.90 × 108390.080.163.703.85 × 10−5
ControlAX-944442926B9.78 × 10797.820.05−11.186.24 × 10−5
HSIAX-893399306B4.62 × 108462.150.200.081.50 × 10−5
HSIAX-951695686B7.04 × 108703.940.240.082.91 × 10−5
HSIAX-861739906D4.58 × 108458.360.190.085.48 × 10−5
HSIAX-1103896236D4.63 × 108462.70.250.089.35 × 10−5
ControlAX-956596817A7.21 × 108721.220.397.798.04 × 10−5
HSAX-949805637B4.38 × 108437.930.134.081.97 × 10−5
HSIAX-947500977D6.24 × 108623.540.230.107.49 × 10−5
DMHSIAX-947546832B6.71 × 1066.710.050.139.39 × 10−5
ControlAX-945849322B3.22 × 108321.960.312.554.77 × 10−4
ControlAX-956606883B1.59 × 1061.590.372.378.98 × 10−4
ControlAX-1094301323B6.29 × 108628.80.143.168.93 × 10−4
HSAX-947868983D5.88 × 108588.330.07−6.775.83 × 10−5
ControlAX-944577574B6.53 × 108652.980.105.595.61 × 10−4
ControlAX-1104588634D4.28 × 10742.810.113.636.95 × 10−4
ControlAX-946057656A8.50 × 10784.980.312.672.94 × 10−4
ControlAX-861800886A2.71 × 108270.610.162.966.43 × 10−4
HSAX-1109843456A3.85 × 108384.730.154.756.89 × 10−5
ControlAX-1099502876A3.90 × 108390.080.163.114.03 × 10−4
HSAX-1099502876A3.90 × 108390.080.164.598.56 × 10−5
ControlAX-1098861006B1.41 × 108140.620.322.485.44 × 10−4
ControlAX-1093974016D8.03 × 1050.80.055.046.60 × 10−4
ControlAX-949805637B4.38 × 108437.930.133.274.85 × 10−4
HSAX-949805637B4.38 × 108437.930.135.252.36 × 10−5
ControlAX-956587717B6.09 × 108608.720.273.484.71 × 10−4
ControlAX-944791397D5.07 × 108507.250.155.263.18 × 10−4
GpSHSAX-951501281D7.91 × 10779.140.11−3.197.32 × 10−4
HSAX-1103351771D3.95 × 108394.730.093.496.74 × 10−4
HSAX-1109113502A4.42 × 10744.180.122.857.46 × 10−4
HSAX-1100466752A4.47 × 10744.750.132.857.46 × 10−4
HSAX-1105337692B7.17 × 108717.220.212.506.62 × 10−4
HSAX-1795625682D5.99 × 108598.710.102.979.43 × 10−4
HSAX-949421773A4.75 × 10747.550.432.772.66 × 10−4
ControlAX-952446213A7.32 × 108732.240.412.456.90 × 10−4
HSAX-1092707323B6.37 × 108637.080.094.101.04 × 10−4
ControlAX-894771573B8.23 × 108822.970.332.835.42 × 10−4
ControlAX-947108873D6.14 × 108613.740.342.835.42 × 10−4
ControlAX-1092905474A7.13 × 108712.920.133.237.51 × 10−4
ControlAX-1103968074B4.49 × 10744.940.47−2.404.71 × 10−4
ControlAX-950948064D3.12 × 108311.960.302.886.76 × 10−4
ControlAX-952538604D5.00 × 108499.620.382.259.17 × 10−4
HSIAX-949488505B4.26 × 108426.090.05−1.447.86 × 10−5
HSAX-1105594925B5.91 × 108591.140.462.076.79 × 10−4MQTL5B.2
HSIAX-1101365885B6.50 × 108650.080.110.659.19 × 10−5
ControlAX-1111601566A1.66 × 10716.570.222.725.36 × 10−4
ControlAX-1795587496A1.01 × 108101.30.10−3.696.05 × 10−4
ControlAX-947295916B2.82 × 10728.160.242.619.31 × 10−4
ControlAX-1122899076B4.11 × 108411.10.382.724.17 × 10−4
HSAX-956536577B5.96 × 10759.610.18−3.007.08 × 10−4
ControlAX-946248997B7.09 × 108709.380.37−2.534.15 × 10−4
GWpSHSIAX-1109327921A5.66 × 108566.010.121.401.81 × 10−5
HSIAX-956544681B1.43 × 108142.520.062.701.43 × 10−5
HSAX-956338591D3.57 × 108357.460.070.518.39 × 10−5
ControlAX-947250492A3.45 × 1063.450.08−0.273.26 × 10−5
ControlAX-1093881592B6.18 × 1066.180.16−0.208.21 × 10−5
HSAX-946484802B1.88 × 108188.020.100.487.50 × 10−5
HSAX-949976952B1.98 × 108198.070.100.487.50 × 10−5
HSAX-952028753A5.72 × 108571.790.060.663.93 × 10−5
HSIAX-1088047253A7.13 × 108713.210.091.499.30 × 10−5
HSAX-1099111035A6.12 × 108611.650.080.516.49 × 10−5
HSAX-948865305B1.87 × 108186.840.050.616.92 × 10−5
HSAX-1114412285D5.49 × 108548.640.080.488.07 × 10−5
HSAX-948462966A7.40 × 10774.030.050.588.93 × 10−5
HSAX-947467746A9.64 × 10796.440.050.588.93 × 10−5
HSAX-1100870416B1.32 × 108132.120.050.588.93 × 10−5
HSAX-956851246B1.52 × 108152.090.050.588.93 × 10−5
HSAX-1794767046D6.21 × 10762.110.080.516.93 × 10−5
GYHSAX-945807581B6.27 × 108626.60.500.343.32 × 10−4MQTL1B.4
HSAX-1112142341D4.56 × 108455.80.29−0.392.25 × 10−4MQTL1D.5
HSIAX-948699692B3.87 × 108387.130.210.066.36 × 10−5
HSIAX-952301312B6.38 × 108638.260.190.058.41 × 10−5MQTL2B.3, MQTL2B.6, MQTL2B.7
HSIAX-944118682D5.38 × 108537.510.230.054.16 × 10−5
HSAX-1115997263D6.02 × 108602.270.19−0.453.26 × 10−4
ControlAX-947521134A1.38 × 10713.760.380.609.72 × 10−5
ControlAX-945256824B5.64 × 108564.220.390.598.24 × 10−5
HSIAX-1088401304B6.22 × 108621.710.150.053.17 × 10−5
ControlAX-949882324D4.56 × 108455.750.400.598.24 × 10−5
HSIAX-948828744D4.87 × 108487.050.170.054.94 × 10−5
HSIAX-944238265B5.89 × 108588.830.10−0.062.89 × 10−5
HSIAX-1110526605B6.11 × 108610.880.300.046.44 × 10−5
HSIAX-956519576D2.41 × 1062.410.500.045.17 × 10−5MQTL6D.1
HSAX-1115582806D4.64 × 108463.790.450.354.26 × 10−4
HSAX-1116038707D4.64 × 1064.640.39−0.336.79 × 10−4
PHControlAX-1117806881B5.30 × 108529.990.17−8.147.10 × 10−5MQTL1B.5
ControlAX-952356262A6.28 × 108627.510.11−10.213.84 × 10−5
HSAX-895568732B7.32 × 108732.050.11−5.497.58 × 10−5MQTL2B.2
HSAX-945122743A5.61 × 10756.090.204.363.45 × 10−5
HSAX-952373223D4.50 × 10745.020.174.671.88 × 10−5
ControlAX-950946585B3.98 × 108398.080.08−11.723.16 × 10−5
ControlAX-893816845B4.79 × 108478.760.09−11.581.35 × 10−5MQTL5B.2
HSIAX-861796575B6.70 × 108670.080.13−0.614.43 × 10−5
HSIAX-1088444315D3.24 × 10732.440.10−0.595.70 × 10−5
HSAX-1107260386D5.73 × 1050.570.086.118.46 × 10−5
HSIAX-1094315816D2.34 × 10823.440.13−0.556.46 × 10−5
HSIAX-861777296D4.62 × 108461.710.13−0.573.57 × 10−5
HSIAX-1109112407D5.50 × 108549.750.12−0.544.38 × 10−5
SLControlAX-1795597392D6.36 × 10763.570.501.127.83 × 10−5MQTL2D.1
ControlAX-1098097812D6.06 × 108606.120.101.794.89 × 10−5
ControlAX-945221342D6.29 × 1086290.261.391.34 × 10−5
HSIAX-949599653A7.28 × 108727.990.19−0.471.72 × 10−5
HSIAX-1110167363B7.74 × 108773.760.08−0.518.92 × 10−5
HSAX-1795578383B8.22 × 108822.190.440.476.78 × 10−5
HSIAX-947529434A6.04 × 108603.680.06−0.497.20 × 10−5
SpPSHSAX-1793886611A5.94 × 108593.550.33−1.397.02 × 10−4
ControlAX-861748041D7.87 × 1067.870.111.359.64 × 10−4
HSAX-1095450572B5.39 × 108539.330.19−2.198.81 × 10−4
HSAX-944158732D5.51 × 108550.650.24−1.305.48 × 10−4
HSIAX-946695525B4.42 × 10744.230.120.716.21 × 10−5
HSIAX-956291415B5.66 × 10756.560.090.796.39 × 10−5
SWControlAX-1793880532B1.76 × 108176.290.45−0.426.52 × 10−5
HSIAX-1098097812D6.06 × 108606.120.10−1.482.30 × 10−5
HSIAX-1093124083D6.08 × 108608.250.09−1.417.84 × 10−5
HSIAX-947009524B6.12 × 108611.510.14−1.234.88 × 10−5
HSAX-1105169004B6.70 × 108669.710.07−0.241.32 × 10−5
HSAX-1094827754B6.70 × 108670.430.07−0.241.32 × 10−5
HSAX-1087781796B5.91 × 108591.210.14−0.174.79 × 10−5
HSIAX-1119074826D4.69 × 108469.10.05−2.122.75 × 10−5
TKWControlAX-1104025082A4.47 × 10744.730.11−4.289.55 × 10−4
ControlAX-1088957872A4.51 × 10745.070.12−4.375.74 × 10−4
ControlAX-1089446532D6.00 × 108599.890.21−3.366.55 × 10−4
ControlAX-1099489962D6.10 × 108609.640.18−4.423.01 × 10−4
ControlAX-1095519203A7.28 × 108727.990.08−9.311.60 × 10−4
ControlAX-1105895703B6.25 × 108625.420.15−4.742.41 × 10−4
HSIAX-1092707323B6.37 × 108637.080.09−0.478.26 × 10−5
HSAX-944606486D4.62 × 108462.360.49−1.846.99 × 10−5
TpPControlAX-956543221A5.80 × 108580.50.102.248.94 × 10−5
HSIAX-1090166852A1.91 × 10719.110.200.134.13 × 10−4
HSIAX-950932432A7.72 × 108771.510.080.149.39 × 10−4
HSAX-947609042B7.31 × 108731.350.33−0.603.21 × 10−5
HSIAX-1794772216A2.31 × 108230.70.320.113.02 × 10−4
HSIAX-1794757996A3.59 × 108359.080.080.236.18 × 10−4
HSIAX-950166436A3.85 × 108384.680.060.248.94 × 10−4
HSIAX-951198106A3.87 × 108387.070.160.116.18 × 10−4
HSIAX-949498007B4.72 × 108472.330.080.175.75 × 10−4
HSIAX-946654917D1.51 × 108151.320.330.122.70 × 10−4
Abbreviations: DH: days to heading; DM: days to maturity; TpP: tillers per plant; PH: plant height; SL: spike length; SpSP: spikelets per spike; GpS: grains per spike; SW: spike weight; GWpS: grain weight per spike; GY: grain yield; TKW: thousand-kernel weight. All previous QTLs are based on the work of Tanin et al. [21].
Table 3. Pleiotropic QTNs associated with various yield traits under control, heat susceptibility index (HSI) and heat stress (HS) conditions, with chromosome number, position (Mb), effect, and p-value.
ConditionTraitsSNPCHRPos (Mb)Effectp-Value
HSGpSAX-1109113502A44.182.857.46 × 10−4
ControlTKWAX-1104025082A44.73−4.289.55 × 10−4
HSGpSAX-1100466752A44.752.857.46 × 10−4
ControlTKWAX-1088957872A45.07−4.375.74 × 10−4
ControlGWpSAX-1093881592B6.18−0.208.21 × 10−5
HSIDMAX-947546832B6.710.139.39 × 10−5
HSTpPAX-947609042B731.35−0.603.21 × 10−5
HSPHAX-895568732B732.05−5.497.58 × 10−5
HSGpSAX-1795625682D598.712.979.43 × 10−4
ControlTKWAX-1089446532D599.89−3.366.55 × 10−4
HSISLAX-949599653A727.99−0.471.72 × 10−5
ControlTKWAX-1095519203A727.99−9.311.60 × 10−4
ControlTKWAX-1105895703B625.42−4.742.41 × 10−4
ControlDMAX-1094301323B628.803.168.93 × 10−4
HSGpSAX-1092707323B637.084.101.04 × 10−4
HSITKWAX-1092707323B637.08−0.478.26 × 10−5
HSSLAX-1795578383B822.190.476.78 × 10−5
ControlGpSAX-894771573B822.972.835.42 × 10−4
HSDHAX-1115997263D602.273.672.36 × 10−5
HSGYAX-1115997263D602.27−0.453.26 × 10−4
HISGYAX-944238265B588.83−0.062.89 × 10−5
HSGpSAX-1105594925B591.142.076.79 × 10−4
HSDHAX-861800886A270.613.507.96 × 10−5
ControlDMAX-861800886A270.612.966.43 × 10−4
HSDHAX-947441606A381.033.507.96 × 10−5
HSITpPAX-950166436A384.680.248.94 × 10−4
HSDMAX-1109843456A384.734.756.89 × 10−5
HSDHAX-1099502876A390.083.703.85 × 10−5
ControlDMAX-1099502876A390.083.114.03 × 10−4
HSIDHAX-861739906D458.360.085.48137 × 10−5
HSIPHAX-861777296D461.71−0.573.57 × 10−5
HSTKWAX-944606486D462.36−1.846.99 × 10−5
HSIDHAX-1103896236D462.700.089.35026 × 10−5
HSGYAX-1115582806D463.790.354.26 × 10−4
HSDHAX-949805637B437.934.081.97 × 10−5
ControlDMAX-949805637B437.933.274.85 × 10−4
Abbreviations: DH: days to heading; DM: days to maturity; TpP: tillers per plant; PH: plant height; SL: spike length; SpSP: spikelets per spike; GpS: grains per spike; SW: spike weight; GWpS: grain weight per spike; GY: grain yield; TKW: thousand-kernel weight.
Table 4. QTNs associated with heat stress conditions and in proximity to heat shock proteins, with chromosome number, position (Mb), and position of closest HSP.
TraitsSNPCHRPos(Mb)HspGene IDPOS(Mb)2
GpSAX-1105337692B717.22TaHSP40.54TraesCS2B01G526300720.58
TpPAX-947609042B731.35TaHSP70.24TraesCS2B01G535000731.25
PHAX-945122743A56.09TaHSP40.63TraesCS3A01G08370053.83
PHAX-952373223D45.02TaHSP40.95TraesCS3D01G08370042.49
SWAX-1094827754B670.43TaHSP70.52TraesCS4B01G397600671.74
GWpSAX-1099111035A611.65TaHSP40.150TraesCS5A01G426100611.34
GWpSAX-948865305B186.84TaHSP40.155TraesCS5B01G114500185.72
TKWAX-944606486D462.36TaHSP60.69TraesCS6D01G383500462.46
CHR: chromosome; Pos (Mb): position of SNP; Hsp: heat shock protein ID; GeneID: Gene ID of heat shock protein according to IWGSC; POS(MB)2: position of heat shock protein encoding the gene.
Table 5. Description of haplotypes for the TaHST1 locus, including frequency (%) in the diversity panel of synthetic hexaploid wheats.
HaplotypeXhau1Xhau2Xhau3Xhau4Xhau5Deleted SitesNo. of LinesFrequency %
Hap1+++127+03325
Hap2 --127+32116
Hap3-++127+12015
Hap4-++127-21310
Hap5---127-41310
Hap6+++127-1108
Hap7--+127+265
Hap8---195-454
Hap9-+-127+232
Hap10++-127+122
Hap11---195+322
Hap12-----511
Hap13++-127-211
Hap14+-+127+111
Hap15--+195+211
Total 132100
Note: the + and - signs show positive and negative amplification. Amplification of 127 bp and 195 bp was performed using Xhau-4, due to its co-dominant nature.
Table 6. Primers used in the study for the identification of allelic variations at TaHST1 associated with HST in synthetic wheat.
PrimerSequenceTm °CProduct Size (bp)
Xhau1-FGGGAGTGTTTGTGTGAGGATTTG65825
Xhau1-RGCACTACTACCAAACCACGTGTA
Xhau2-FGGGAGCCAATTCGTGTGACT56426
Xhau2-RCAAGCGCTATACAACTGTGCT
Xhau3-FGCCCGTGAATCATACTTGAGCG58788
Xhau3-RTGAGGAGATAATTGTACGCCGA
Xhau4-FTCGGTTGGTTTGTTTATACTTGC65127/195
Xhau4-RCCACGCTTGCACAATCTATTCT
Xhau5-FTGCCTACCAAAGTGAGACCTG60259
Xhau5-RACCTACCTCTACCTCAACCCA
Disclaimer/Publisher’s Note: The statements, opinions and data contained in all publications are solely those of the individual author(s) and contributor(s) and not of MDPI and/or the editor(s). MDPI and/or the editor(s) disclaim responsibility for any injury to people or property resulting from any ideas, methods, instructions or products referred to in the content.

