
Effect of Reproductive Stage-Waterlogging on the Growth and Yield of Upland Cotton (Gossypium hirsutum)

 , ,
, ,  , ,
, ,  , ,
, ,  ,
,  , and
, and 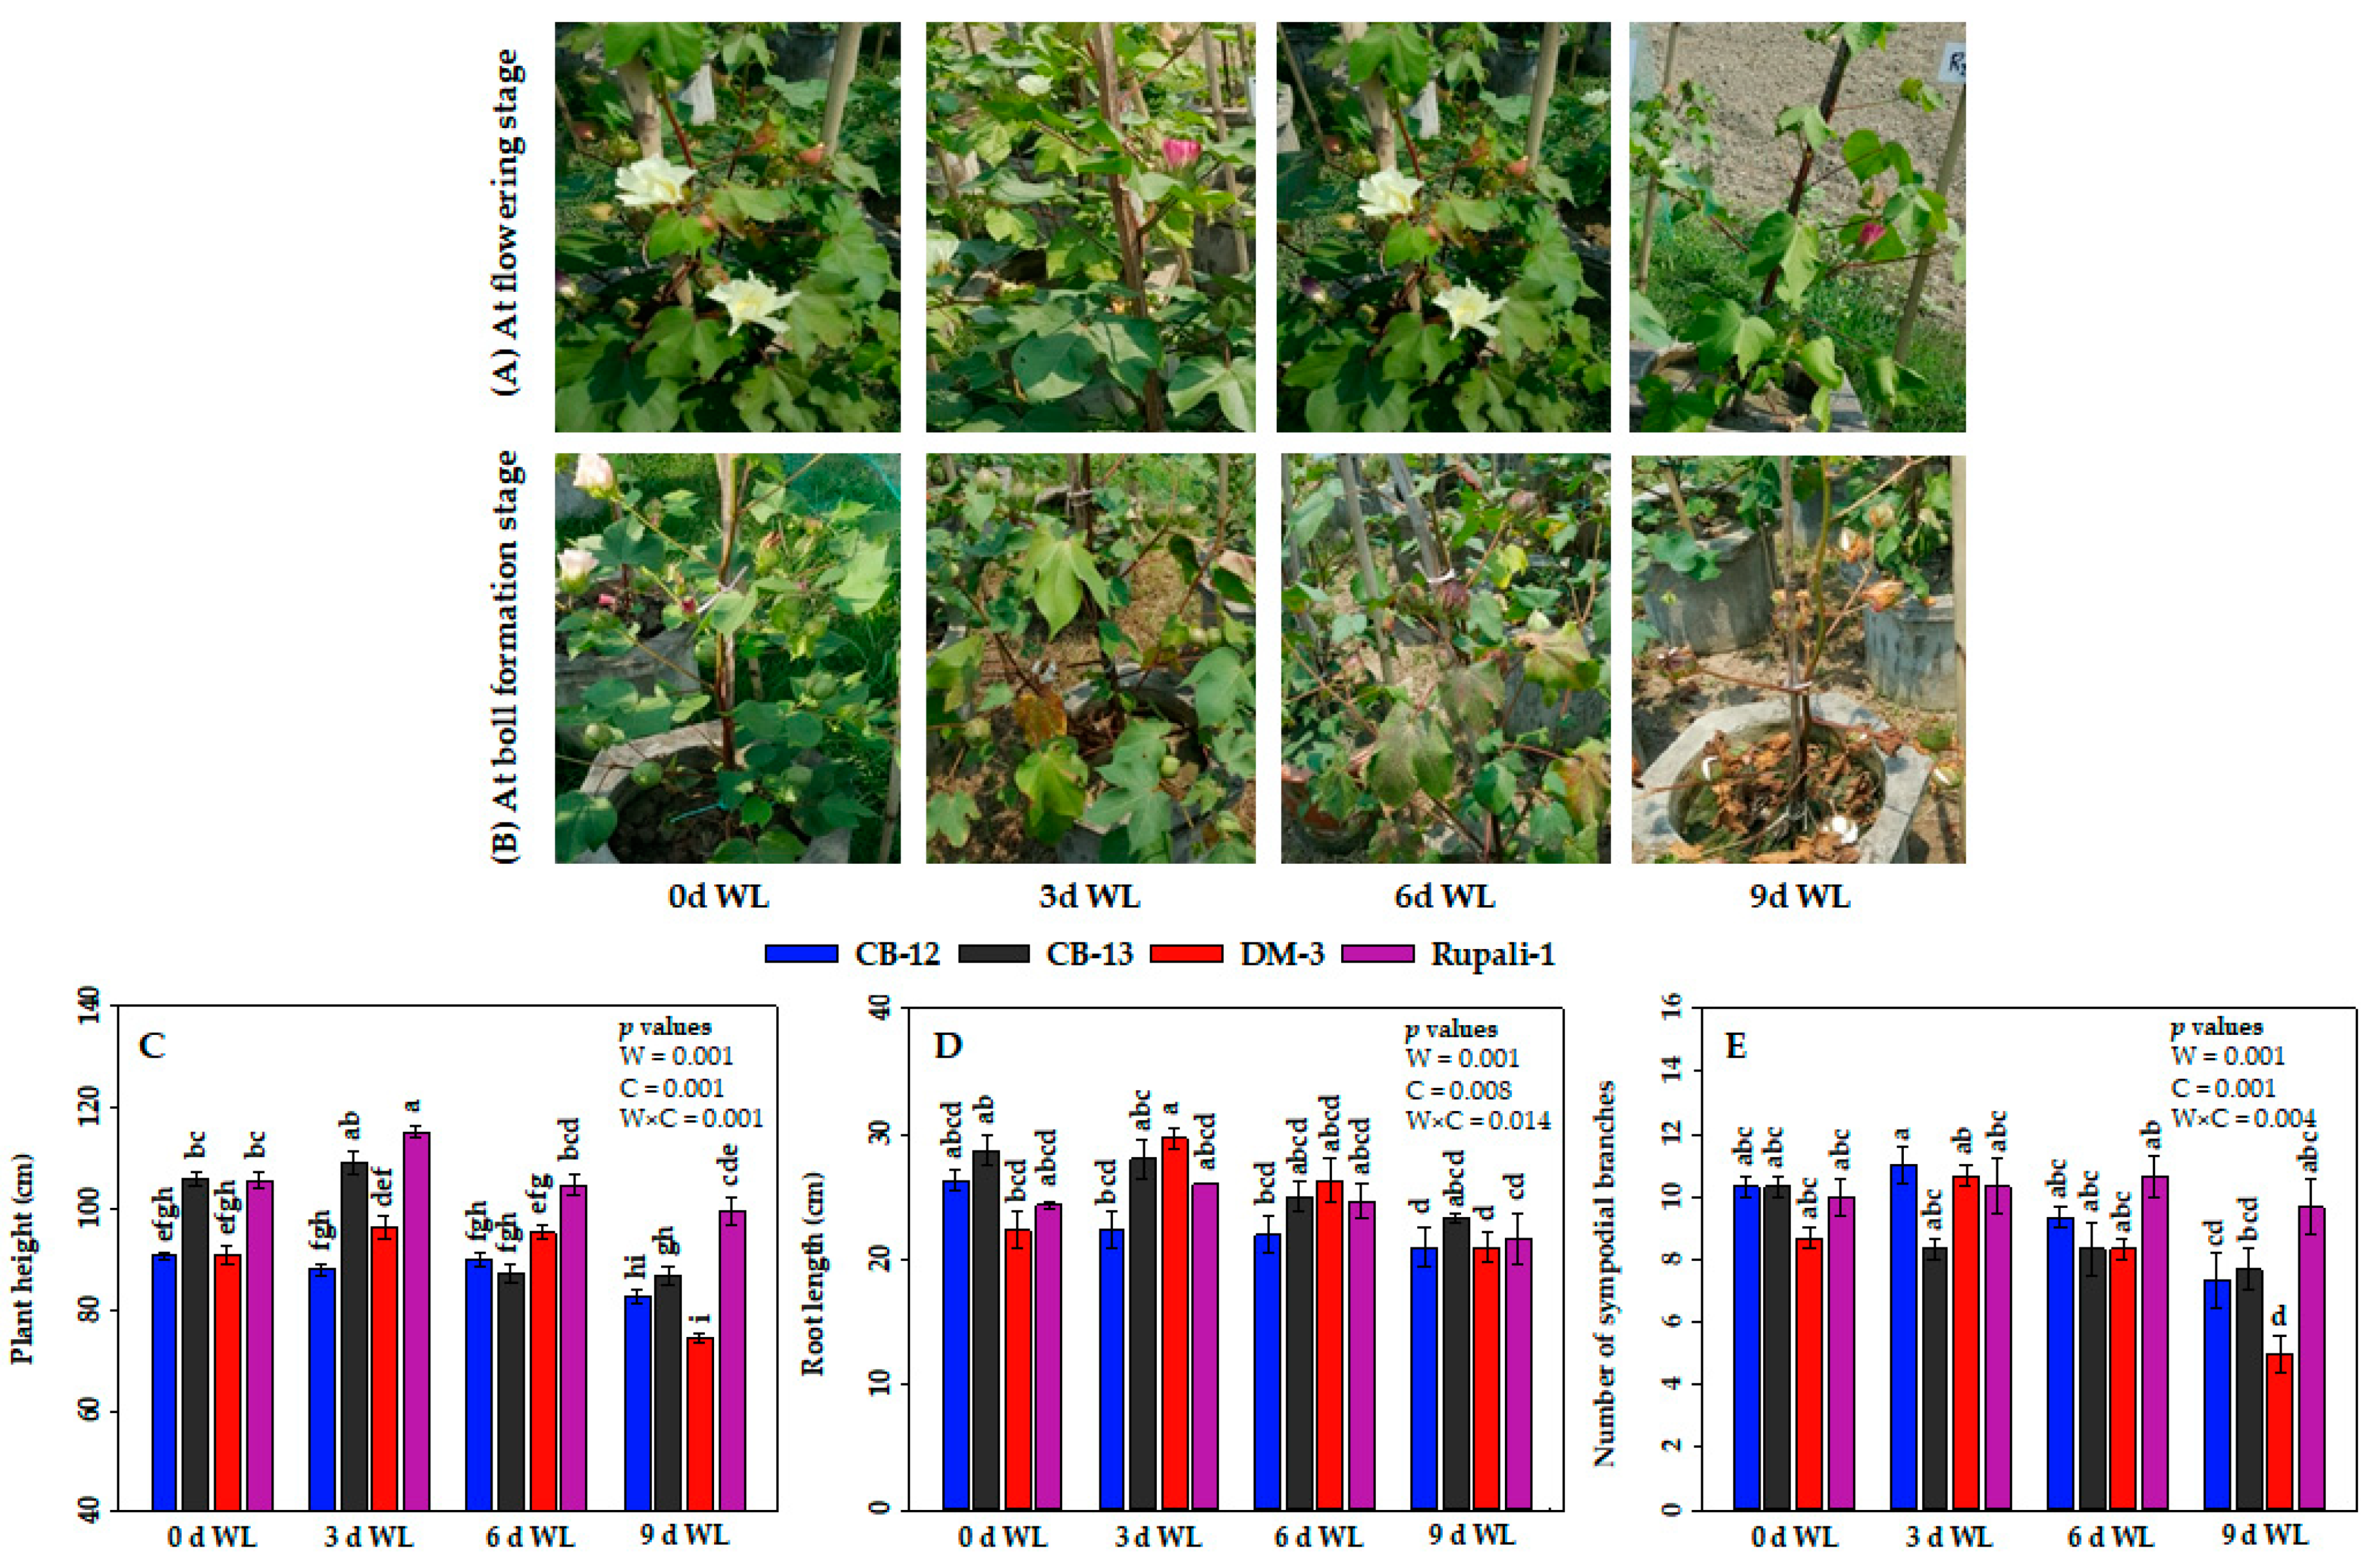
Abstract
:1. Introduction
2. Results
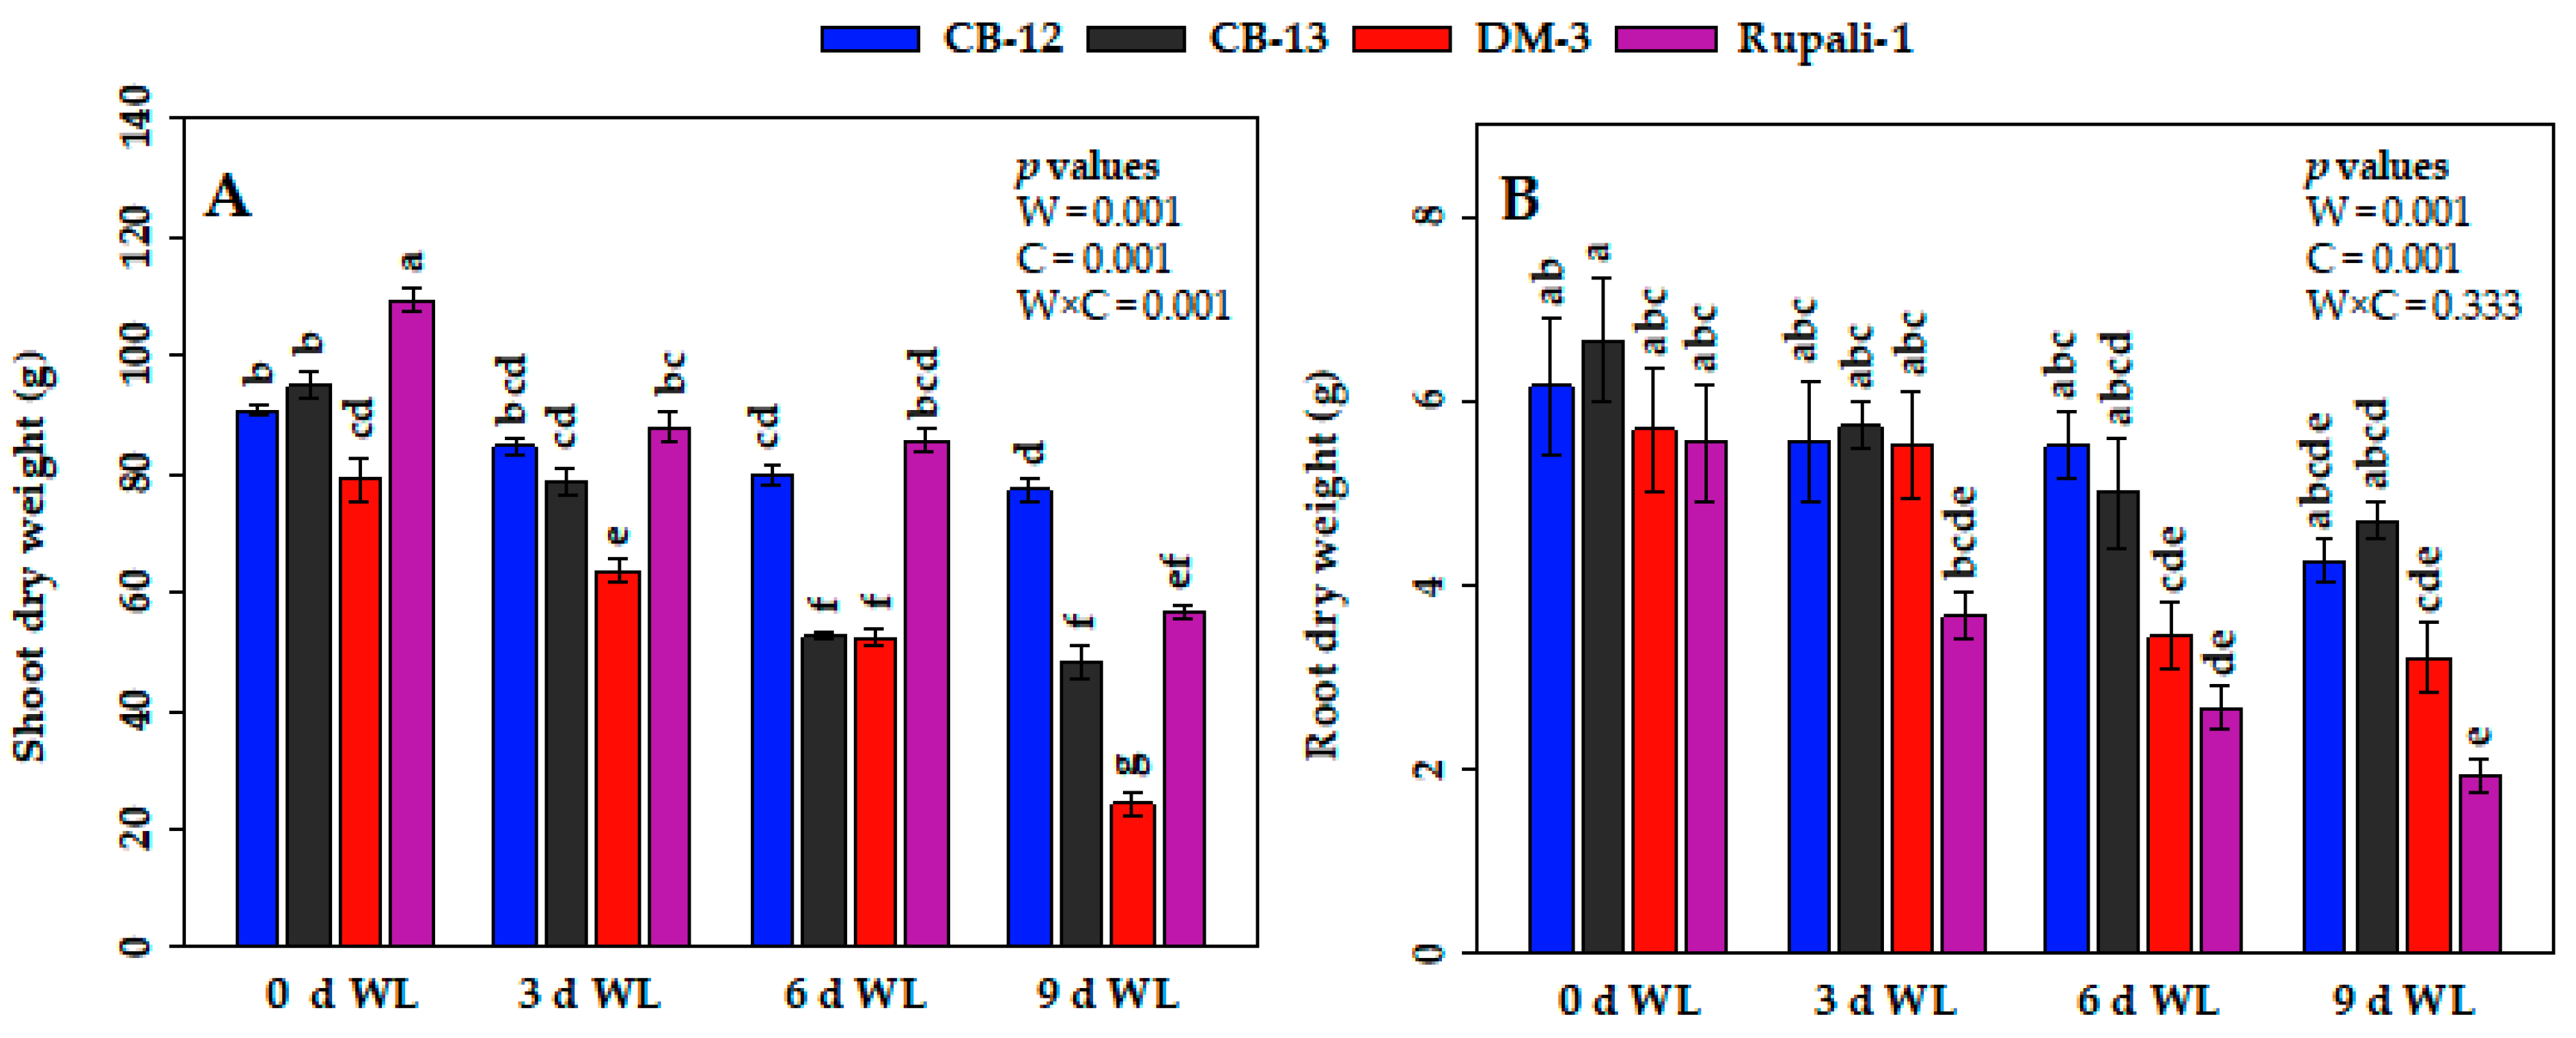
2.1. Effect of WL on the Phenotypes and Growth Attributes of Cotton
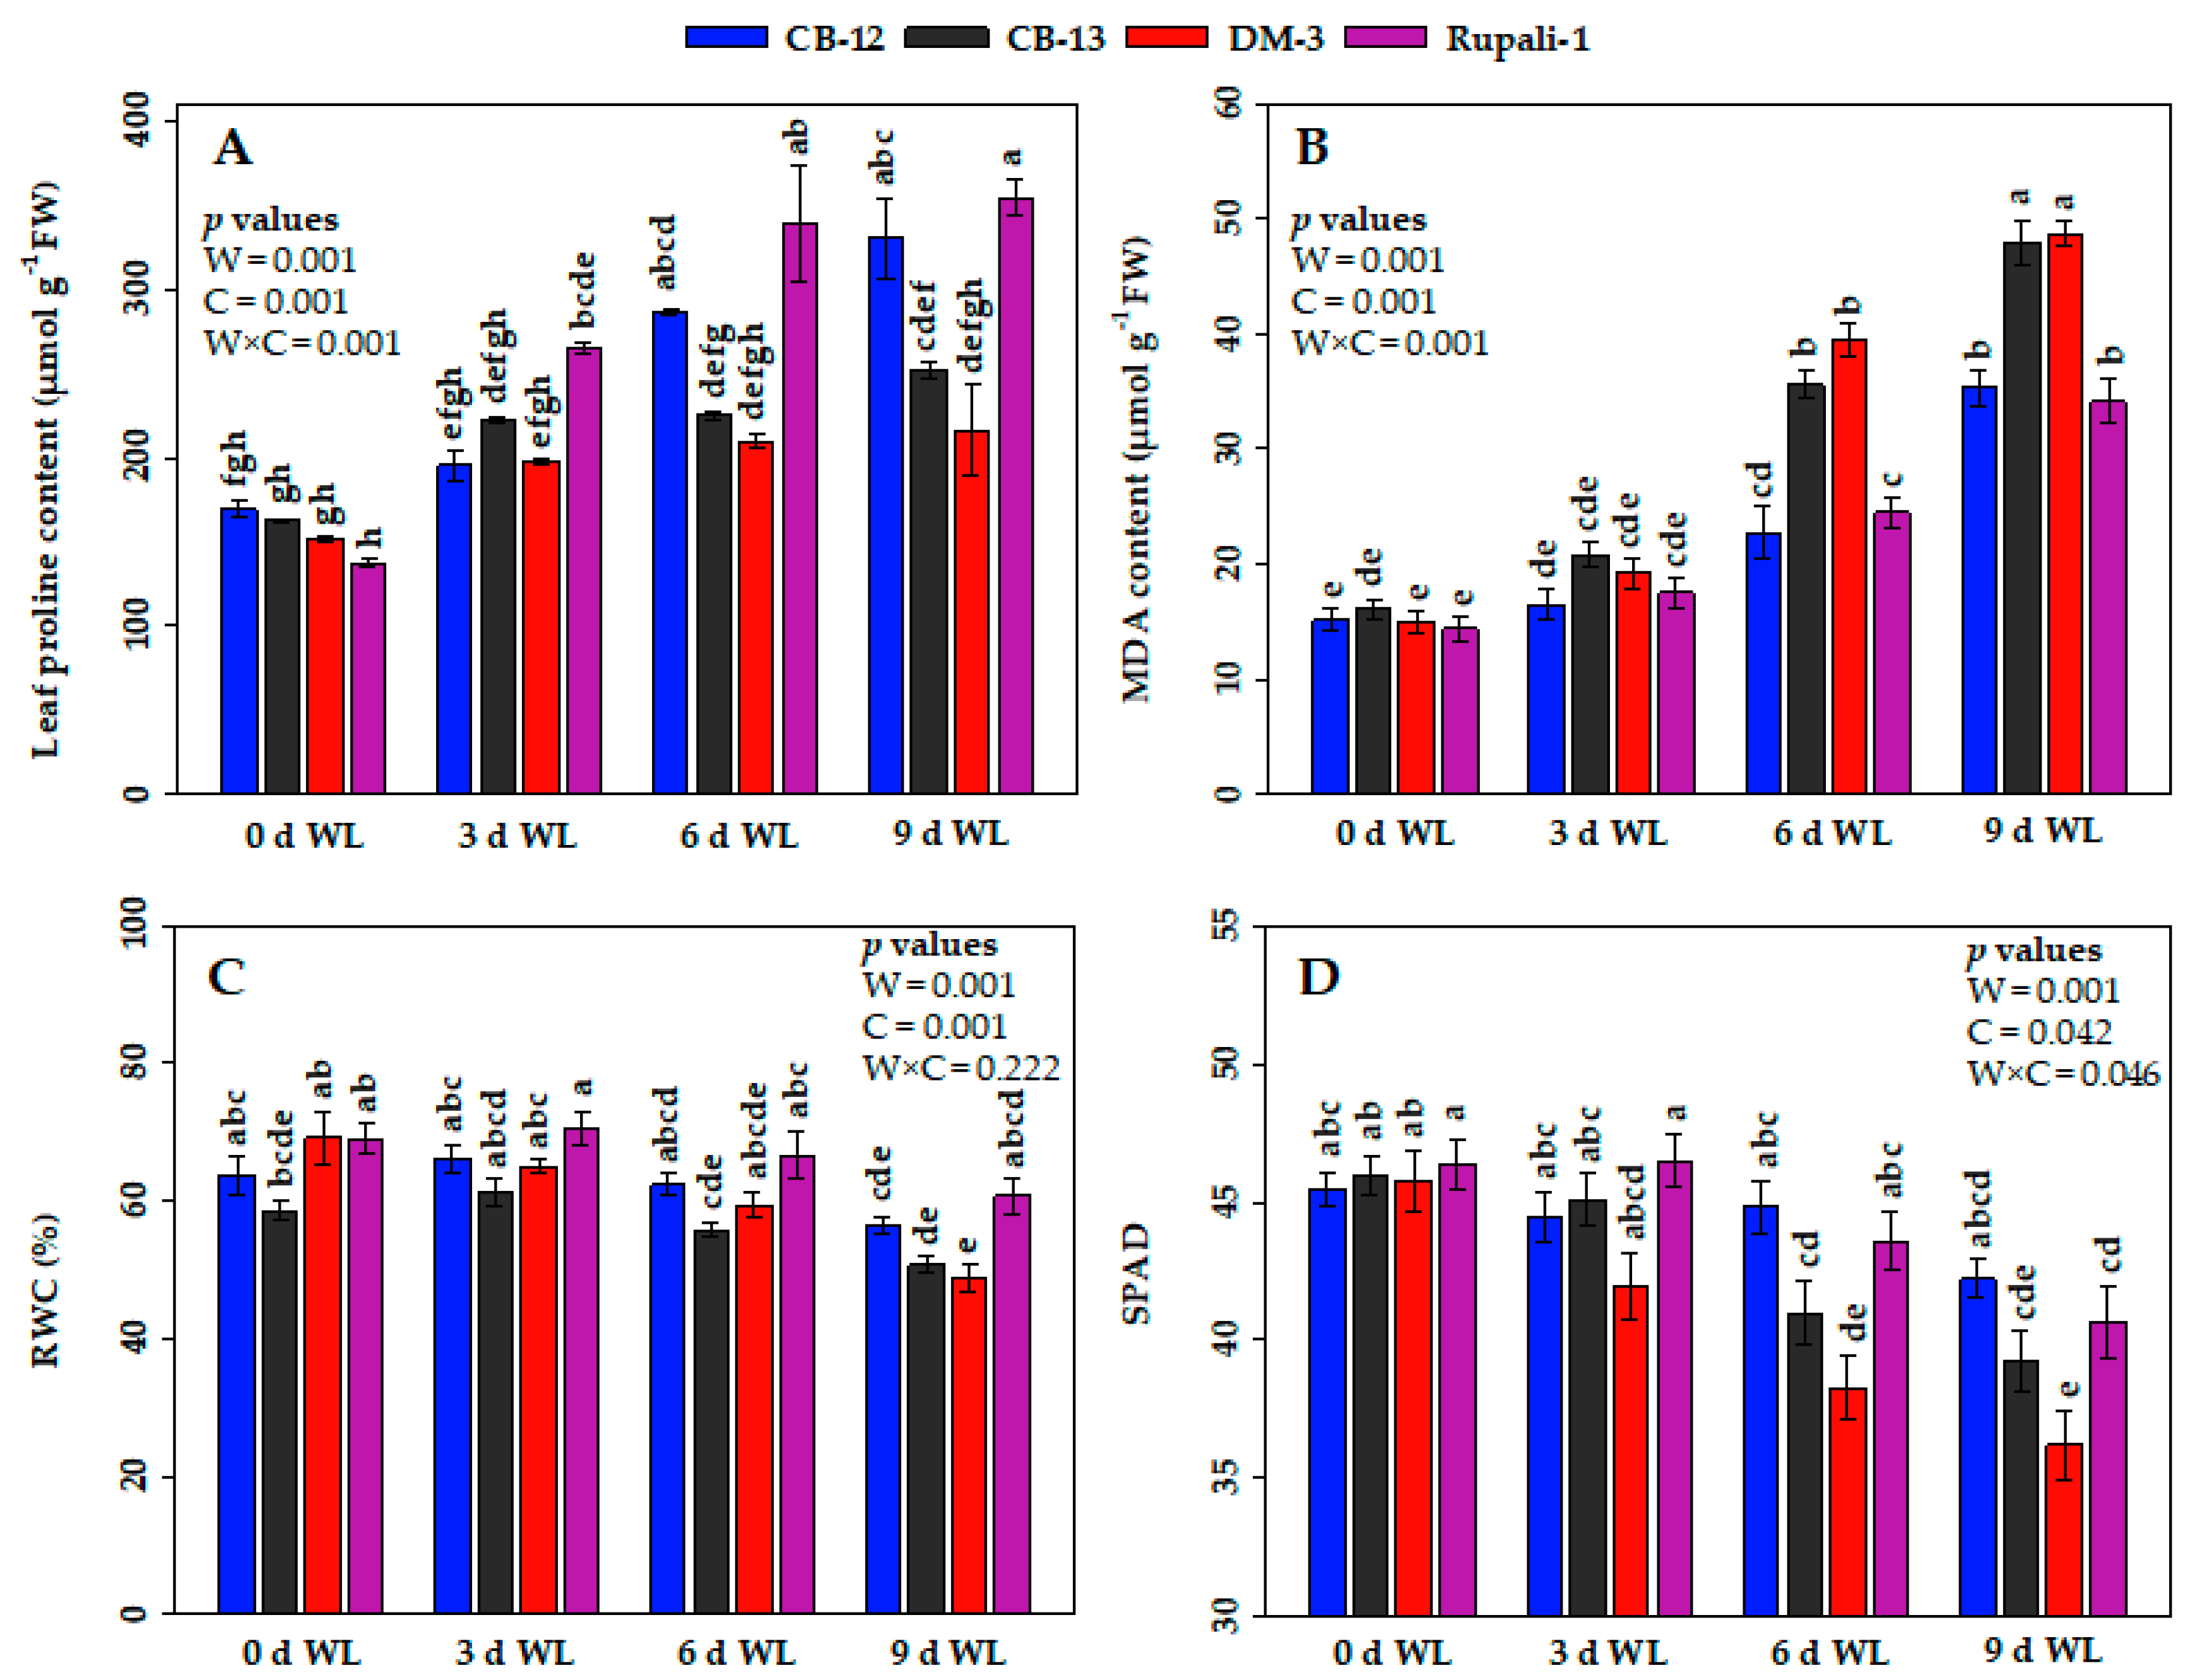
2.2. Effect of WL on the Physiological and Biochemical Parameters of Cotton Cultivars
2.2.1. Proline Contents
2.2.2. Malondialdehyde (MDA) Contents
2.2.3. Relative Water Contents (RWCs)
2.2.4. SPAD Reading Values
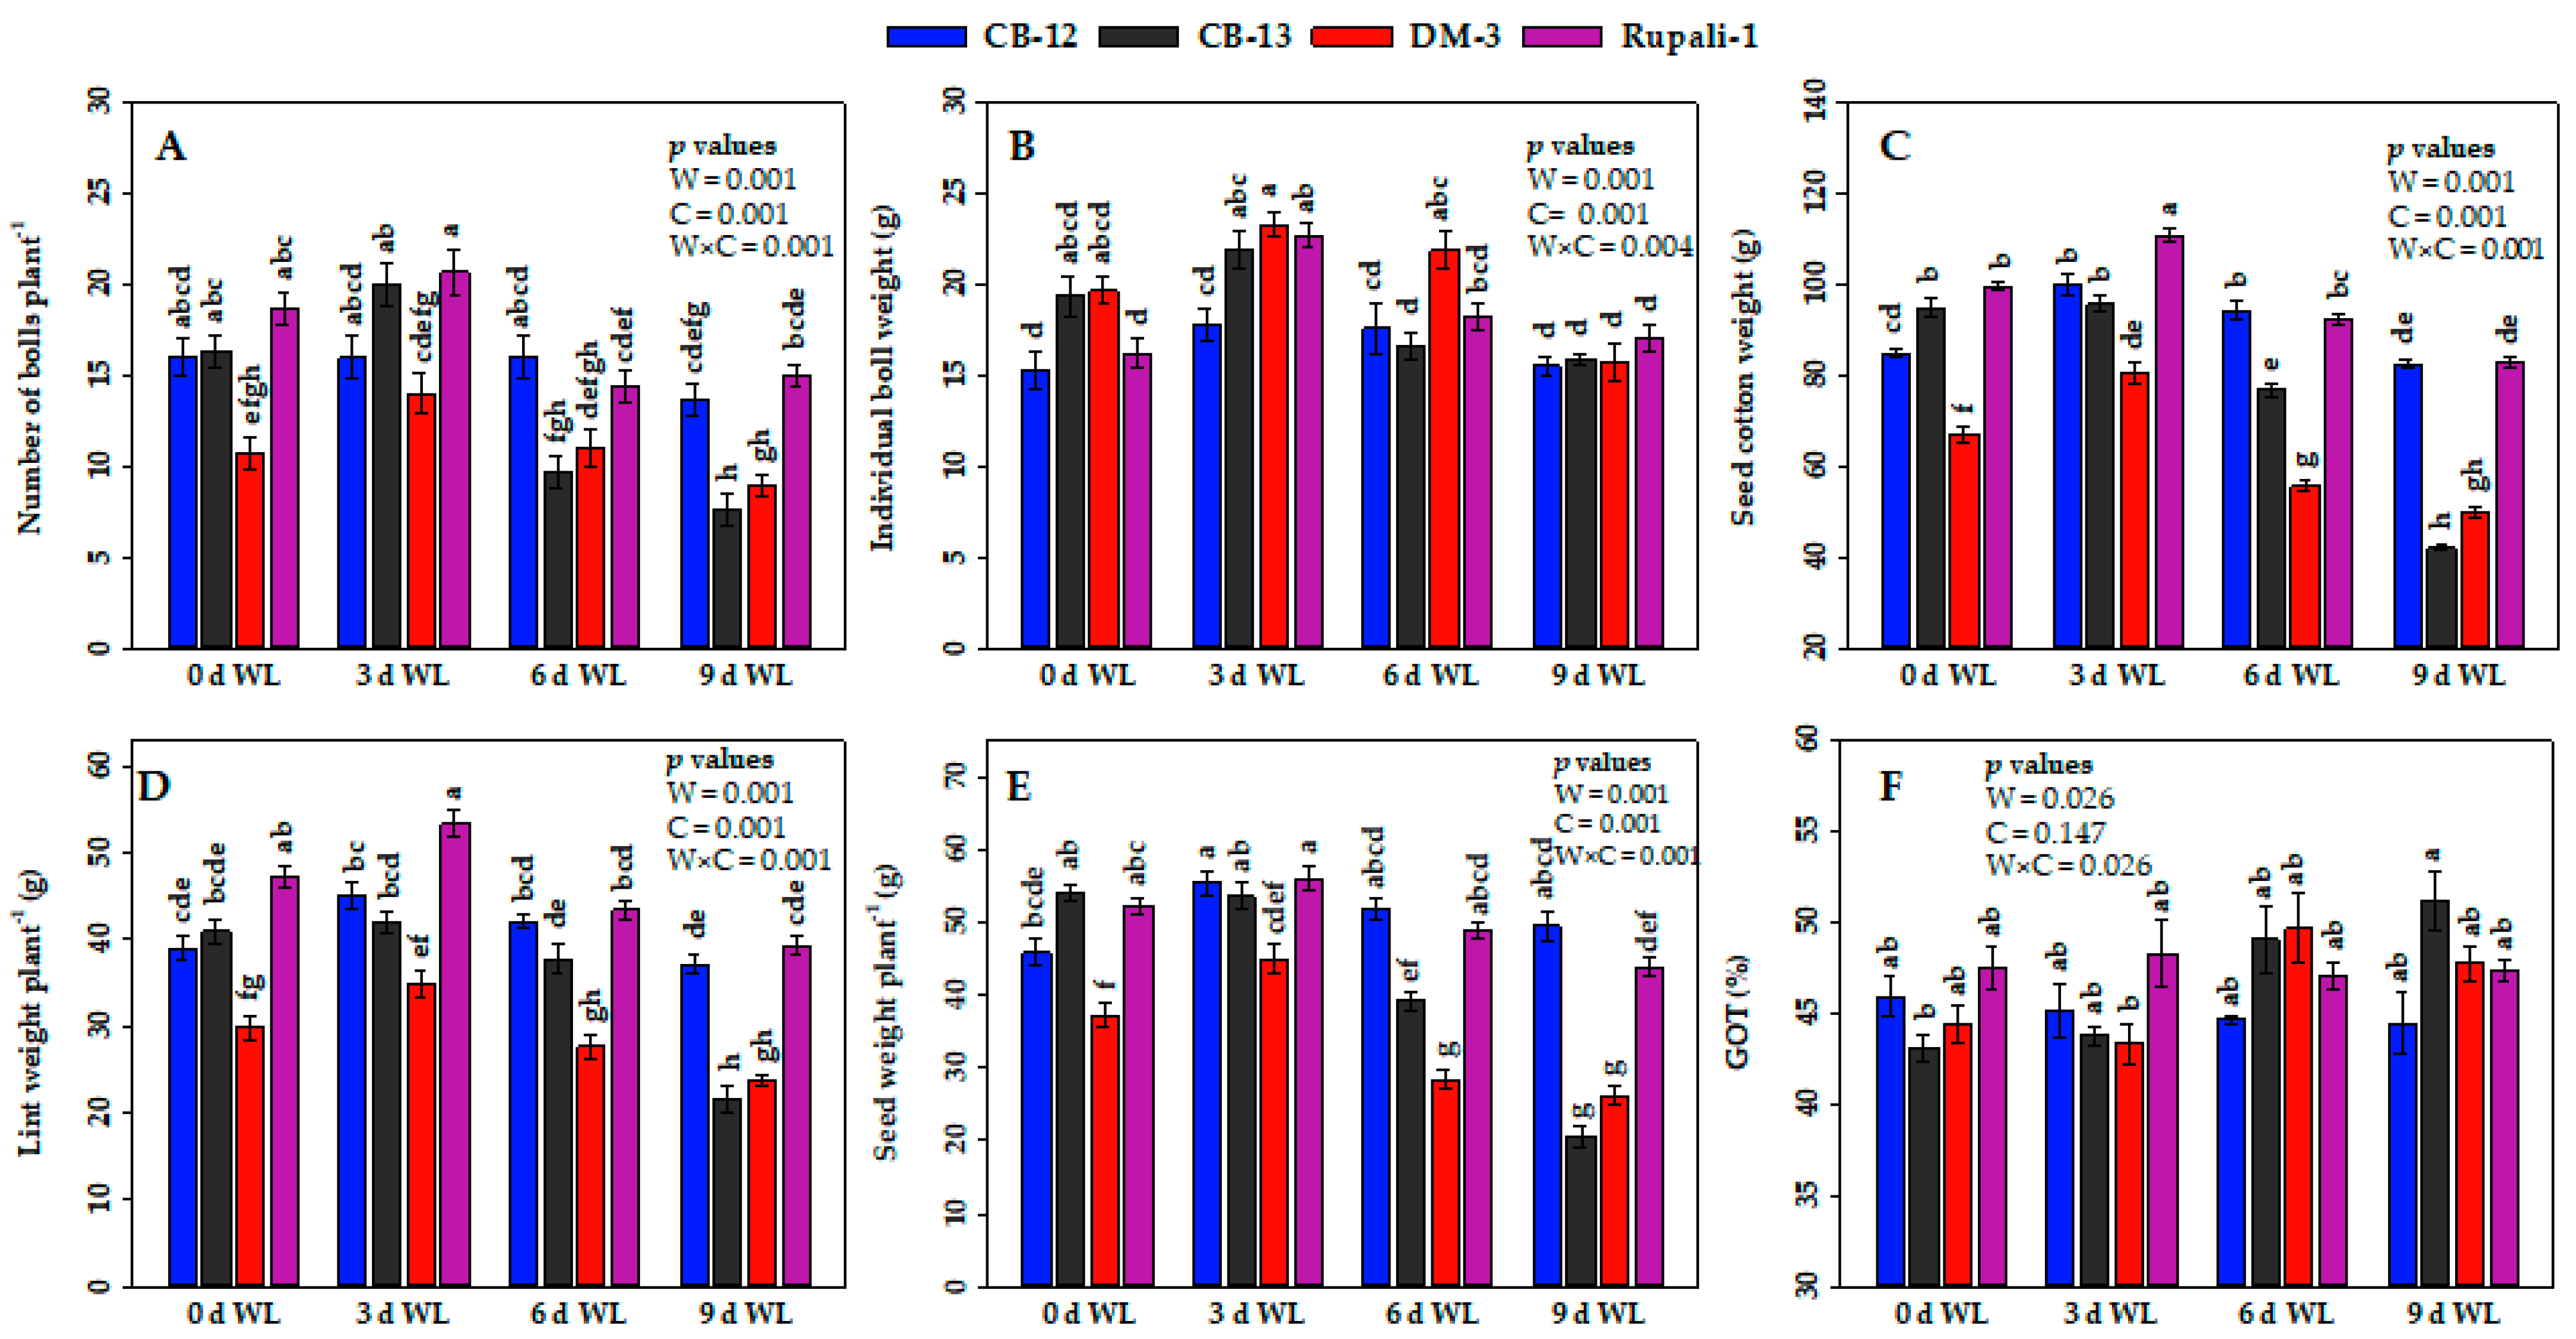
2.3. Effect of WL on the Yield Attributes of Cotton Cultivars
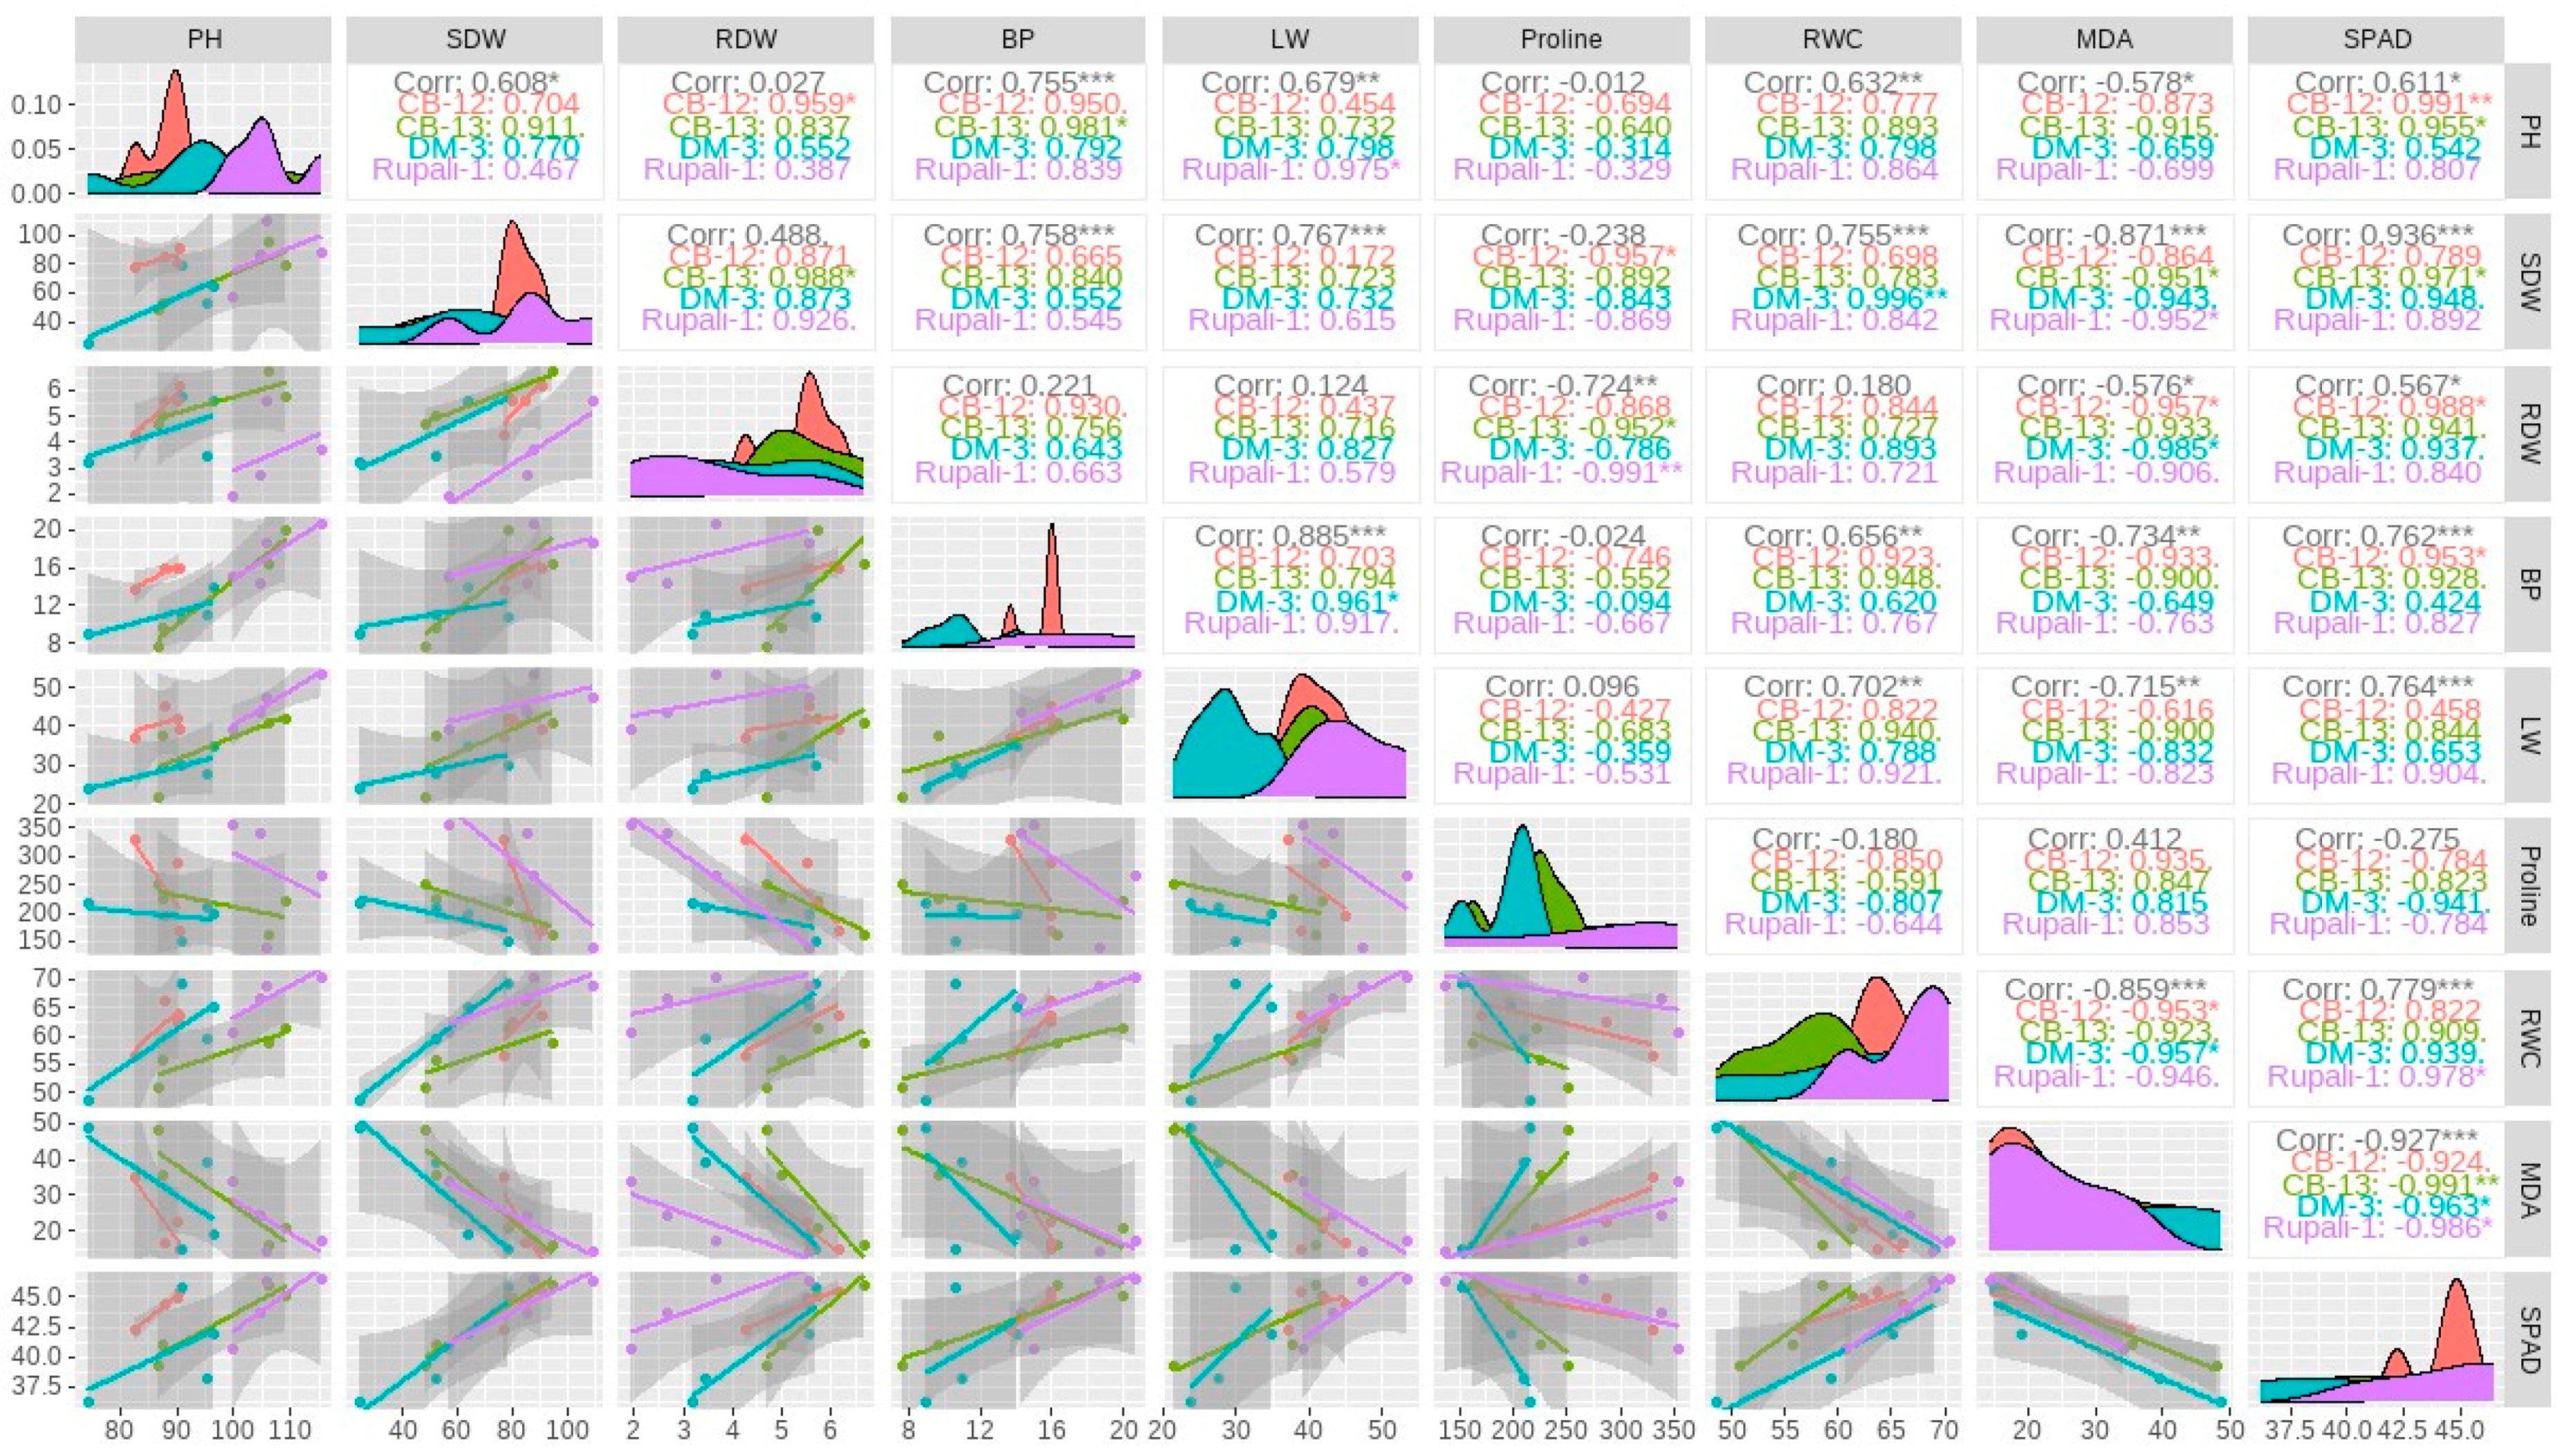
2.4. Correlation Analysis among the Growth and Yield Traits of Four Cotton Cultivars
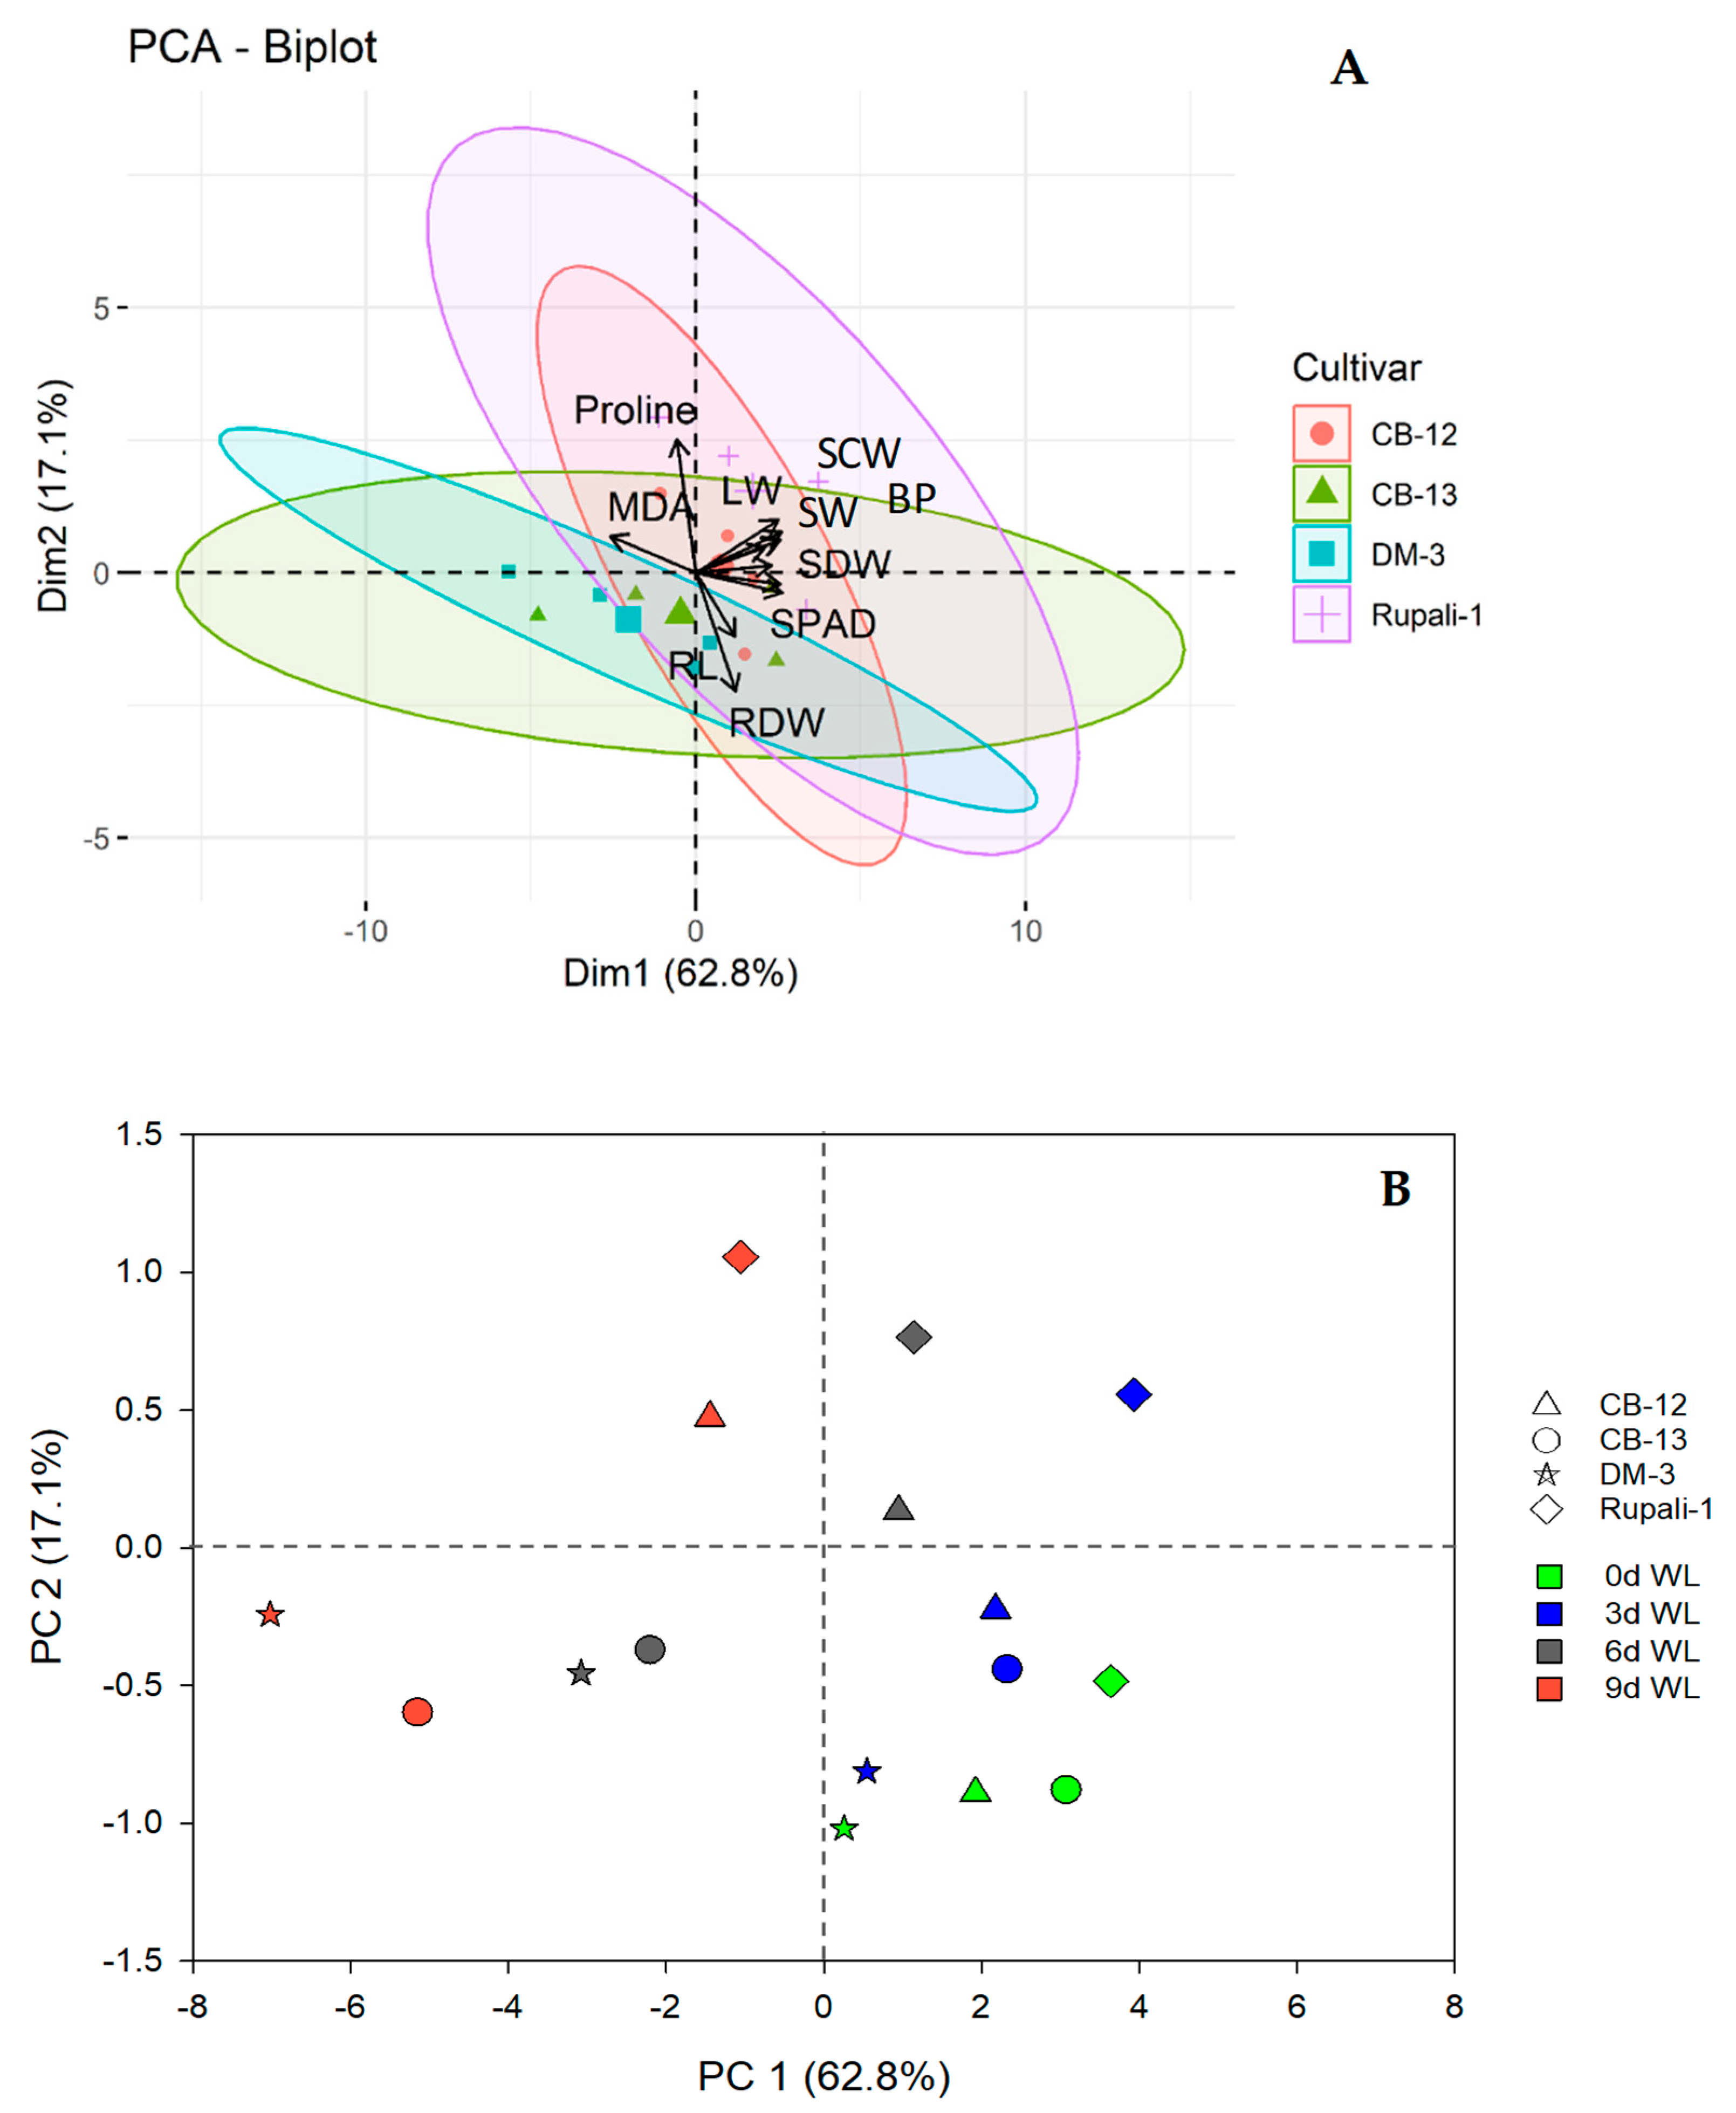
2.5. Principal Component (PC) Analysis (PCA) among the Variables of Four Cotton Cultivars under Different WL Durations
3. Discussion
4. Materials and Methods
4.1. Treatments, Plant Materials, and Culture Conditions
4.2. SPAD Readings
4.3. Leaf RWC
4.4. Leaf Proline Content
4.5. MDA Quantification
4.6. GOT
4.7. Growth and Yield Attributes
4.8. Statistical Analysis and Interpretation of Data
5. Conclusions
Author Contributions
Funding
Data Availability Statement
Acknowledgments
Conflicts of Interest
References
- Zhang, Y.; Liu, G.; Dong, H.; Li, C. Waterlogging Stress in Cotton: Damage, Adaptability, Alleviation Strategies, and Mechanisms. Crop J. 2021, 9, 257–270. [Google Scholar] [CrossRef]
- Tamang, B.G.; Fukao, T. Plant Adaptation to Multiple Stresses during Submergence and Following Desubmergence. Int. J. Mol. Sci. 2015, 16, 30164–30180. [Google Scholar] [CrossRef] [PubMed] [Green Version]
- Voesenek, L.A.C.J.; Bailey-Serres, J. Flood Adaptive Traits and Processes: An Overview. New Phytol. 2015, 206, 57–73. [Google Scholar] [CrossRef]
- Bingru, H.; Johnson, J.W.; NeSmith, D.S.; Bridges, D.C. Root and Shoot Growth of Wheat Genotypes in Response to Hypoxia and Subsequent Resumption of Aeration. Crop Sci. 1994, 34, 1538–1544. [Google Scholar] [CrossRef]
- Armstrong, W.; Justin, S.H.F.W.; Beckett, P.M.; Lythe, S. Root Adaptation to Soil Waterlogging. Aquat. Bot. 1991, 39, 57–73. [Google Scholar] [CrossRef]
- Christianson, J.A.; Llewellyn, D.J.; Dennis, E.S.; Wilson, I.W. Global Gene Expression Responses to Waterlogging in Roots and Leaves of Cotton (Gossypium hirsutum L.). Plant Cell Physiol. 2010, 51, 21–37. [Google Scholar] [CrossRef] [PubMed] [Green Version]
- Felle, H.H. PH Regulation in Anoxic Plants. Ann. Bot. 2005, 96, 519–532. [Google Scholar] [CrossRef] [PubMed] [Green Version]
- Zeng, F.; Shabala, L.; Zhou, M.; Zhang, G.; Shabala, S. Barley Responses to Combined Waterlogging and Salinity Stress: Separating Effects of Oxygen Deprivation and Elemental Toxicity. Front. Plant Sci. 2013, 4, 313. [Google Scholar] [CrossRef] [Green Version]
- Setter, T.L.; Waters, I.; Sharma, S.K.; Singh, K.N.; Kulshreshtha, N.; Yaduvanshi, N.P.S.; Ram, P.C.; Singh, B.N.; Rane, J.; McDonald, G.; et al. Review of Wheat Improvement for Waterlogging Tolerance in Australia and India: The Importance of Anaerobiosis and Element Toxicities Associated with Different Soils. Ann. Bot. 2009, 103, 221–235. [Google Scholar] [CrossRef] [Green Version]
- Drew, M.C.; Sisworo, E.J. The Development of Waterlogging Damage in Young Barley Plants in Relation To Plant Nutrient Status and Changes in Soil Properties. New Phytol. 1979, 82, 301–314. [Google Scholar] [CrossRef]
- Liao, C.T.; Lin, C.H. Physiological Adaptation of Crop Plants to Flooding Stress. Proc. Natl. Sci. Counc. Repub. China B 2001, 25, 148–157. [Google Scholar]
- Bange, M.P.; Milroy, S.P.; Thongbai, P. Growth and Yield of Cotton in Response to Waterlogging. Field Crop. Res. 2004, 88, 129–142. [Google Scholar] [CrossRef]
- Aslam, S.; Khan, S.H.; Ahmed, A.; Dandekar, A.M. The Tale of Cotton Plant: From Wild Type to Domestication, Leading to Its Improvement by Genetic Transformation. Am. J. Mol. Biol. 2020, 10, 91–127. [Google Scholar] [CrossRef] [Green Version]
- Chen, Z.J.; Sreedasyam, A.; Ando, A.; Song, Q.; De Santiago, L.M.; Hulse-Kemp, A.M.; Ding, M.; Ye, W.; Kirkbride, R.C.; Jenkins, J.; et al. Genomic Diversifications of Five Gossypium Allopolyploid Species and Their Impact on Cotton Improvement. Nat. Genet. 2020, 52, 525–533. [Google Scholar] [CrossRef] [PubMed] [Green Version]
- Zhang, J.; Abdelraheem, A.; Wedegaertner, T. Genetic Variation of Waterlogging Tolerance in Pima (Gossypium barbadense) Cotton and Glanded and Glandless Upland Cotton (Gossypium hirsutum) under Field Conditions. Ind. Crops Prod. 2019, 129, 169–174. [Google Scholar] [CrossRef]
- Uddin, D.M.F.; Mortuza, D.M.G.G. Cotton Production in Bangladesh: Current Scenario and Prospect; Bangladesh Rural Advancement Committee: Dhaka, Bangladesh, 2015; Available online: https://www.researchgate.net/publication/275524220 (accessed on 9 September 2022).
- USDA. Bangladesh Cotton and Products Annual; USDA Foreign Agricultural Service: Washington, DC, USA, 2016; Volume 20, pp. 1–10.
- Nadiruzzaman, M.; Rahman, M.; Pal, U.; Croxton, S.; Rashid, M.B.; Bahadur, A.; Huq, S. Impact of Climate Change on Cotton Production in Bangladesh. Sustainability 2021, 13, 574. [Google Scholar] [CrossRef]
- CDB. Write Up of Cotton Development Board for Preparing the Seventh Five Year Plan, 2016–2020 (SFYP); CDB: Dhaka, Bangladesh, 2014.
- Bailey-Serres, J.; Voesenek, L.A.C.J. Life in the Balance: A Signaling Network Controlling Survival of Flooding. Curr. Opin. Plant Biol. 2010, 13, 489–494. [Google Scholar] [CrossRef]
- Najeeb, U.; Bange, M.P.; Tan, D.K.Y.; Atwell, B.J. Consequences of Waterlogging in Cotton and Opportunities for Mitigation of Yield Losses. AoB Plants 2015, 7, plv080. [Google Scholar] [CrossRef]
- Hodgson, A.S.; Chan, K.Y. The Effect of Short-Term Waterlogging during Furrow Irrigation of Cotton in a Cracking Grey Clay. Aust. J. Agric. Res. 1982, 33, 109–116. [Google Scholar] [CrossRef]
- Wang, X.; Deng, Z.; Zhang, W.; Meng, Z.; Chang, X.; Lv, M. Effect of Waterlogging Duration at Different Growth Stages on the Growth, Yield and Quality of Cotton. PLoS ONE 2017, 12, e0169029. [Google Scholar] [CrossRef] [Green Version]
- Leonard, O.A.; Pinckard, J.A. Effect of Various Oxygen and Carbon Dioxide Concentrations on Cotton Root Development. Plant Physiol. 1946, 21, 18–36. [Google Scholar] [CrossRef] [PubMed] [Green Version]
- Milroy, S.P.; Bange, M.P.; Thongbai, P. Cotton Leaf Nutrient Concentrations in Response to Waterlogging under Field Conditions. Field Crop. Res. 2009, 113, 246–255. [Google Scholar] [CrossRef]
- Liu, R.; Yang, C.; Zhang, G.; Zhang, L.; Yang, F.; Guo, W. Root Recovery Development and Activity of Cotton Plants after Waterlogging. Agron. J. 2015, 107, 2038–2046. [Google Scholar] [CrossRef]
- Hocking, P.J.; Reicosky, D.C.; Meyer, W.S. Effects of Intermittent Waterlogging on the Mineral Nutrition of Cotton. Plant Soil 1987, 101, 211–221. [Google Scholar] [CrossRef]
- Conaty, W.C.; Tan, D.K.Y.; Constable, G.A.; Sutton, B.G.; Field, D.J.; Mamum, E.A. Agronomy & Soils: Genetic Variation for Waterlogging Tolerance in Cotton. J. Cotton Sci. 2008, 12, 53–61. [Google Scholar]
- Kuai, J.; Liu, Z.; Wang, Y.; Meng, Y.; Chen, B.; Zhao, W.; Zhou, Z.; Oosterhuis, D.M. Waterlogging during Flowering and Boll Forming Stages Affects Sucrose Metabolism in the Leaves Subtending the Cotton Boll and Its Relationship with Boll Weight. Plant Sci. 2014, 223, 79–98. [Google Scholar] [CrossRef]
- Zhang, Y.; Chen, Y.; Lu, H.; Kong, X.; Dai, J.; Li, Z.; Dong, H. Growth, Lint Yield and Changes in Physiological Attributes of Cotton under Temporal Waterlogging. Field Crop. Res. 2016, 194, 83–93. [Google Scholar] [CrossRef]
- Hocking, P.J.; Reicosky, D.C.; Meyer, W.S. Nitrogen Status of cotton Subjected to two Short Term Periods of Waterlogging of Varying Severity Using a Sloping Plot Water-Table Facility. Plant and Soil 1985, 87, 375–391. [Google Scholar] [CrossRef]
- Reicosky, D.C.; Meyer, W.S.; Schaefer, N.L.; Sides, R.D. Cotton Response to Short-Term Waterlogging Imposed with a Water-Table Gradient Facility. Agric. Water Manag. 1985, 10, 127–143. [Google Scholar] [CrossRef]
- Sojka, R.E.; Stolzy, L.H. Soil-Oxygen Effects on Stomatal Response. Soil Sci. 1980, 130, 350–358. [Google Scholar] [CrossRef]
- Meyer, W.S.; Reicosky, D.C.; Barrs, H.D.; Smith, R.C.G. Physiological Responses of Cotton to a Single Waterlogging at High and Low N-Levels. Plant Soil 1987, 102, 161–170. [Google Scholar] [CrossRef]
- Thongbai, P.; Milroy, S.; Bange, M.; Rapp, G.; Smith, T. Agronomic Responses of Cotton to Low Soil Oxygen during Waterlogging. In Proceedings of the 10th Australian Agronomy Conference, Hobart, Tasmania, 29 January–1 February 2001; pp. 1600–1730. [Google Scholar]
- Milroy, S.P.; Bange, M.P. Reduction in Radiation Use Efficiency of Cotton (Gossypium hirsutum L.) under Repeated Transient Waterlogging in the Field. Field Crop. Res. 2013, 140, 51–58. [Google Scholar] [CrossRef]
- Zhang, Y.; Song, X.; Yang, G.; Li, Z.; Lu, H.; Kong, X.; Eneji, A.E.; Dong, H. Physiological and Molecular Adjustment of Cotton to Waterlogging at Peak-Flowering in Relation to Growth and Yield. Field Crop. Res. 2015, 179, 164–172. [Google Scholar] [CrossRef]
- Wang, H.; Chen, Y.; Hu, W.; Wang, S.; Snider, J.L.; Zhou, Z. Carbohydrate Metabolism in the Subtending Leaf Cross-Acclimates to Waterlogging and Elevated Temperature Stress and Influences Boll Biomass in Cotton (Gossypium hirsutum). Physiol. Plant. 2017, 161, 339–354. [Google Scholar] [CrossRef] [PubMed]
- Kuai, J.; Chen, Y.; Wang, Y.; Meng, Y.; Chen, B.; Zhao, W.; Zhou, Z. Effect of Waterlogging on Carbohydrate Metabolism and the Quality of Fiber in Cotton (Gossypium hirsutum L.). Front. Plant Sci. 2016, 7, 877. [Google Scholar] [CrossRef] [PubMed] [Green Version]
- van Veen, H.; Mustroph, A.; Barding, G.A.; Vergeer-van Eijk, M.; Welschen-Evertman, R.A.M.; Pedersen, O.; Visser, E.J.W.; Larive, C.K.; Pierik, R.; Bailey-Serres, J.; et al. Two Rumex Species from Contrasting Hydrological Niches Regulate Flooding Tolerance through Distinct Mechanisms. Plant Cell 2013, 25, 4691–4707. [Google Scholar] [CrossRef] [PubMed] [Green Version]
- Pang, J.; Zhou, M.; Mendham, N.; Shabala, S. Growth and Physiological Responses of Six Barley Genotypes to Waterlogging and Subsequent Recovery. Aust. J. Agric. Res. 2004, 55, 895–906. [Google Scholar] [CrossRef]
- Cao, G.; Wang, X.; Liu, Y.; Luo, W. Effect of Water Logging Stress on Cotton Leaf Area Index and Yield. Procedia Eng. 2012, 28, 202–209. [Google Scholar] [CrossRef] [Green Version]
- Chen, Y.; Wang, H.; Hu, W.; Wang, S.; Wang, Y.; Snider, J.L.; Zhou, Z. Combined Elevated Temperature and Soil Waterlogging Stresses Inhibit Cell Elongation by Altering Osmolyte Composition of the Developing Cotton (Gossypium hirsutum L.) Fiber. Plant Sci. 2017, 256, 196–207. [Google Scholar] [CrossRef]
- Najeeb, U.; Tan, D.K.Y.; Bange, M.P. Cotton Growth and Yield Dynamics across Canopy Layers in Response to Soil Waterlogging. Aust. J. Crop Sci. 2016, 10, 1170–1181. [Google Scholar] [CrossRef]
- Kuai, J.; Zhou, Z.; Wang, Y.; Meng, Y.; Chen, B.; Zhao, W. The Effects of Short-Term Waterlogging on the Lint Yield and Yield Components of Cotton with Respect to Boll Position. Eur. J. Agron. 2015, 67, 61–74. [Google Scholar] [CrossRef]
- Wang, H.; Chen, Y.; Hu, W.; Snider, J.L.; Zhou, Z. Short-Term Soil-Waterlogging Contributes to Cotton Cross Tolerance to Chronic Elevated Temperature by Regulating ROS Metabolism in the Subtending Leaf. Plant Physiol. Biochem. 2019, 139, 333–341. [Google Scholar] [CrossRef]
- Wu, Q.X.; Zhu, J.Q.; Liu, K.W.; Chen, L.G. Effects of Fertilization on Growth and Yield of Cotton after Surface Waterlogging Elimination. Adv. J. Food Sci. Technol. 2012, 4, 398–403. [Google Scholar]
- Jiang, Z.H.; Zhu, J.Q.; Yang, W.; Li, M.F.; Yu, Y. Effects of Remedial Measures Implemented after Waterlogging on Cotton. In Proceedings of the 2013 Third International Conference on Intelligent System Design and Engineering Applications, Hong Kong, China, 16–18 January 2013; pp. 692–695. [Google Scholar] [CrossRef]
- Huang, Y.; Bie, Z.; Liu, Z.; Zhen, A.; Wang, W. Protective Role of Proline against Salt Stress Is Partially Related to the Improvement of Water Status and Peroxidase Enzyme Activity in Cucumber. Soil Sci. Plant Nutr. 2009, 55, 698–704. [Google Scholar] [CrossRef] [Green Version]
- Hayat, S.; Hayat, Q.; Alyemeni, M.N.; Wani, A.S.; Pichtel, J.; Ahmad, A. Role of Proline under Changing Environments. Plant Signal. Behav. 2012, 7, 1456–1466. [Google Scholar] [CrossRef] [Green Version]
- Desingh, R.; Kanagaraj, G.; Nagar, A. Influence of Salinity Stress on Photosynthesis and Antioxidative Systems in Two Cotton Varieties. Gen. Appl. Plant Physiol. 2007, 33, 221–234. [Google Scholar]
- Koca, H.; Bor, M.; Özdemir, F.; Türkan, I. The Effect of Salt Stress on Lipid Peroxidation, Antioxidative Enzymes and Proline Content of Sesame Cultivars. Environ. Exp. Bot. 2007, 60, 344–351. [Google Scholar] [CrossRef]
- Veeranagamallaiah, G.; Chandraobulreddy, P.; Jyothsnakumari, G.; Sudhakar, C. Glutamine Synthetase Expression and Pyrroline-5-Carboxylate Reductase Activity Influence Proline Accumulation in Two Cultivars of Foxtail Millet (Setaria italica L.) with Differential Salt Sensitivity. Environ. Exp. Bot. 2007, 60, 239–244. [Google Scholar] [CrossRef]
- Kishor, P.B.K.; Hima Kumari, P.; Sunita, M.S.L.; Sreenivasulu, N. Role of Proline in Cell Wall Synthesis and Plant Development and Its Implications in Plant Ontogeny. Front. Plant Sci. 2015, 6, 544. [Google Scholar] [CrossRef] [Green Version]
- Hussain, A.; Farooq, J.; Ahmad, S.; Mahmood, A.; Sadiq, M.A.; Zafar, U.Z.; Athar, H.U.R. Hypoxia Tolerance Studies for Yield, Fiber and Physiological Traits in Cotton (Gossypium hirsutum L.). J. Cott. Res. 2018, 1, 1–8. [Google Scholar] [CrossRef] [Green Version]
- Tatar, Ö.; Gevrek, M.N. Influence of Water Stress on Proline Accumulation, Lipid Peroxidation and Water Content of Wheat. Asian J. Plant Sci. 2008, 7, 409–412. [Google Scholar] [CrossRef] [Green Version]
- Kameli, A.; Lösel, D.M. Growth and Sugar Accumulation in Durum Wheat Plants under Water Stress. New Phytol. 1996, 132, 57–62. [Google Scholar] [CrossRef] [PubMed]
- Vendruscolo, E.C.G.; Schuster, I.; Pileggi, M.; Scapim, C.A.; Molinari, H.B.C.; Marur, C.J.; Vieira, L.G.E. Stress-Induced Synthesis of Proline Confers Tolerance to Water Deficit in Transgenic Wheat. J. Plant Physiol. 2007, 164, 1367–1376. [Google Scholar] [CrossRef] [PubMed]
- Tian, X.R.; Lei, Y.B. Physiological Responses of Wheat Seedlings to Drought and UV-B Radiation. Effect of Exogenous Sodium Nitroprusside Application. Russ. J. Plant Physiol. 2007, 54, 676–682. [Google Scholar] [CrossRef]
- Barrs, H.; Weatherley, P. A Re-Examination of the Relative Turgidity Technique for Estimating Water Deficits in Leaves. Aust. J. Biol. Sci. 1962, 15, 413. [Google Scholar] [CrossRef] [Green Version]
- Bates, L.S.; Waldren, R.P.; Teare, I.D. Rapid Determination of Free Proline for Water-Stress Studies. Plant Soil 1973, 39, 205–207. [Google Scholar] [CrossRef]
- Heath, R.L.; Packer, L. Photoperoxidation in Isolated Chloroplasts. I. Kinetics and Stoichiometry of Fatty Acid Peroxidation. Arch. Biochem. Biophys. 1968, 125, 189–198. [Google Scholar] [CrossRef]
- Ali, M.B.; Hahn, E.J.; Paek, K.Y. Effects of Light Intensities on Antioxidant Enzymes and Malondialdehyde Content during Short-Term Acclimatization on Micropropagated Phalaenopsis Plantlet. Environ. Exp. Bot. 2005, 54, 109–120. [Google Scholar] [CrossRef]


Disclaimer/Publisher’s Note: The statements, opinions and data contained in all publications are solely those of the individual author(s) and contributor(s) and not of MDPI and/or the editor(s). MDPI and/or the editor(s) disclaim responsibility for any injury to people or property resulting from any ideas, methods, instructions or products referred to in the content. |
© 2023 by the authors. Licensee MDPI, Basel, Switzerland. This article is an open access article distributed under the terms and conditions of the Creative Commons Attribution (CC BY) license (https://creativecommons.org/licenses/by/4.0/).
Share and Cite
Somaddar, U.; Mia, S.; Khalil, M.I.; Sarker, U.K.; Uddin, M.R.; Kaysar, M.S.; Chaki, A.K.; Robin, A.H.K.; Hashem, A.; Abd_Allah, E.F.; et al. Effect of Reproductive Stage-Waterlogging on the Growth and Yield of Upland Cotton (Gossypium hirsutum). Plants 2023, 12, 1548. https://doi.org/10.3390/plants12071548
Somaddar U, Mia S, Khalil MI, Sarker UK, Uddin MR, Kaysar MS, Chaki AK, Robin AHK, Hashem A, Abd_Allah EF, et al. Effect of Reproductive Stage-Waterlogging on the Growth and Yield of Upland Cotton (Gossypium hirsutum). Plants. 2023; 12(7):1548. https://doi.org/10.3390/plants12071548
Chicago/Turabian StyleSomaddar, Uzzal, Shamim Mia, Md. Ibrahim Khalil, Uttam Kumer Sarker, Md. Romij Uddin, Md. Salahuddin Kaysar, Apurbo Kumar Chaki, Arif Hasan Khan Robin, Abeer Hashem, Elsayed Fathi Abd_Allah, and et al. 2023. "Effect of Reproductive Stage-Waterlogging on the Growth and Yield of Upland Cotton (Gossypium hirsutum)" Plants 12, no. 7: 1548. https://doi.org/10.3390/plants12071548